4.1. Lignite Drying Behavior in Superheated Steam
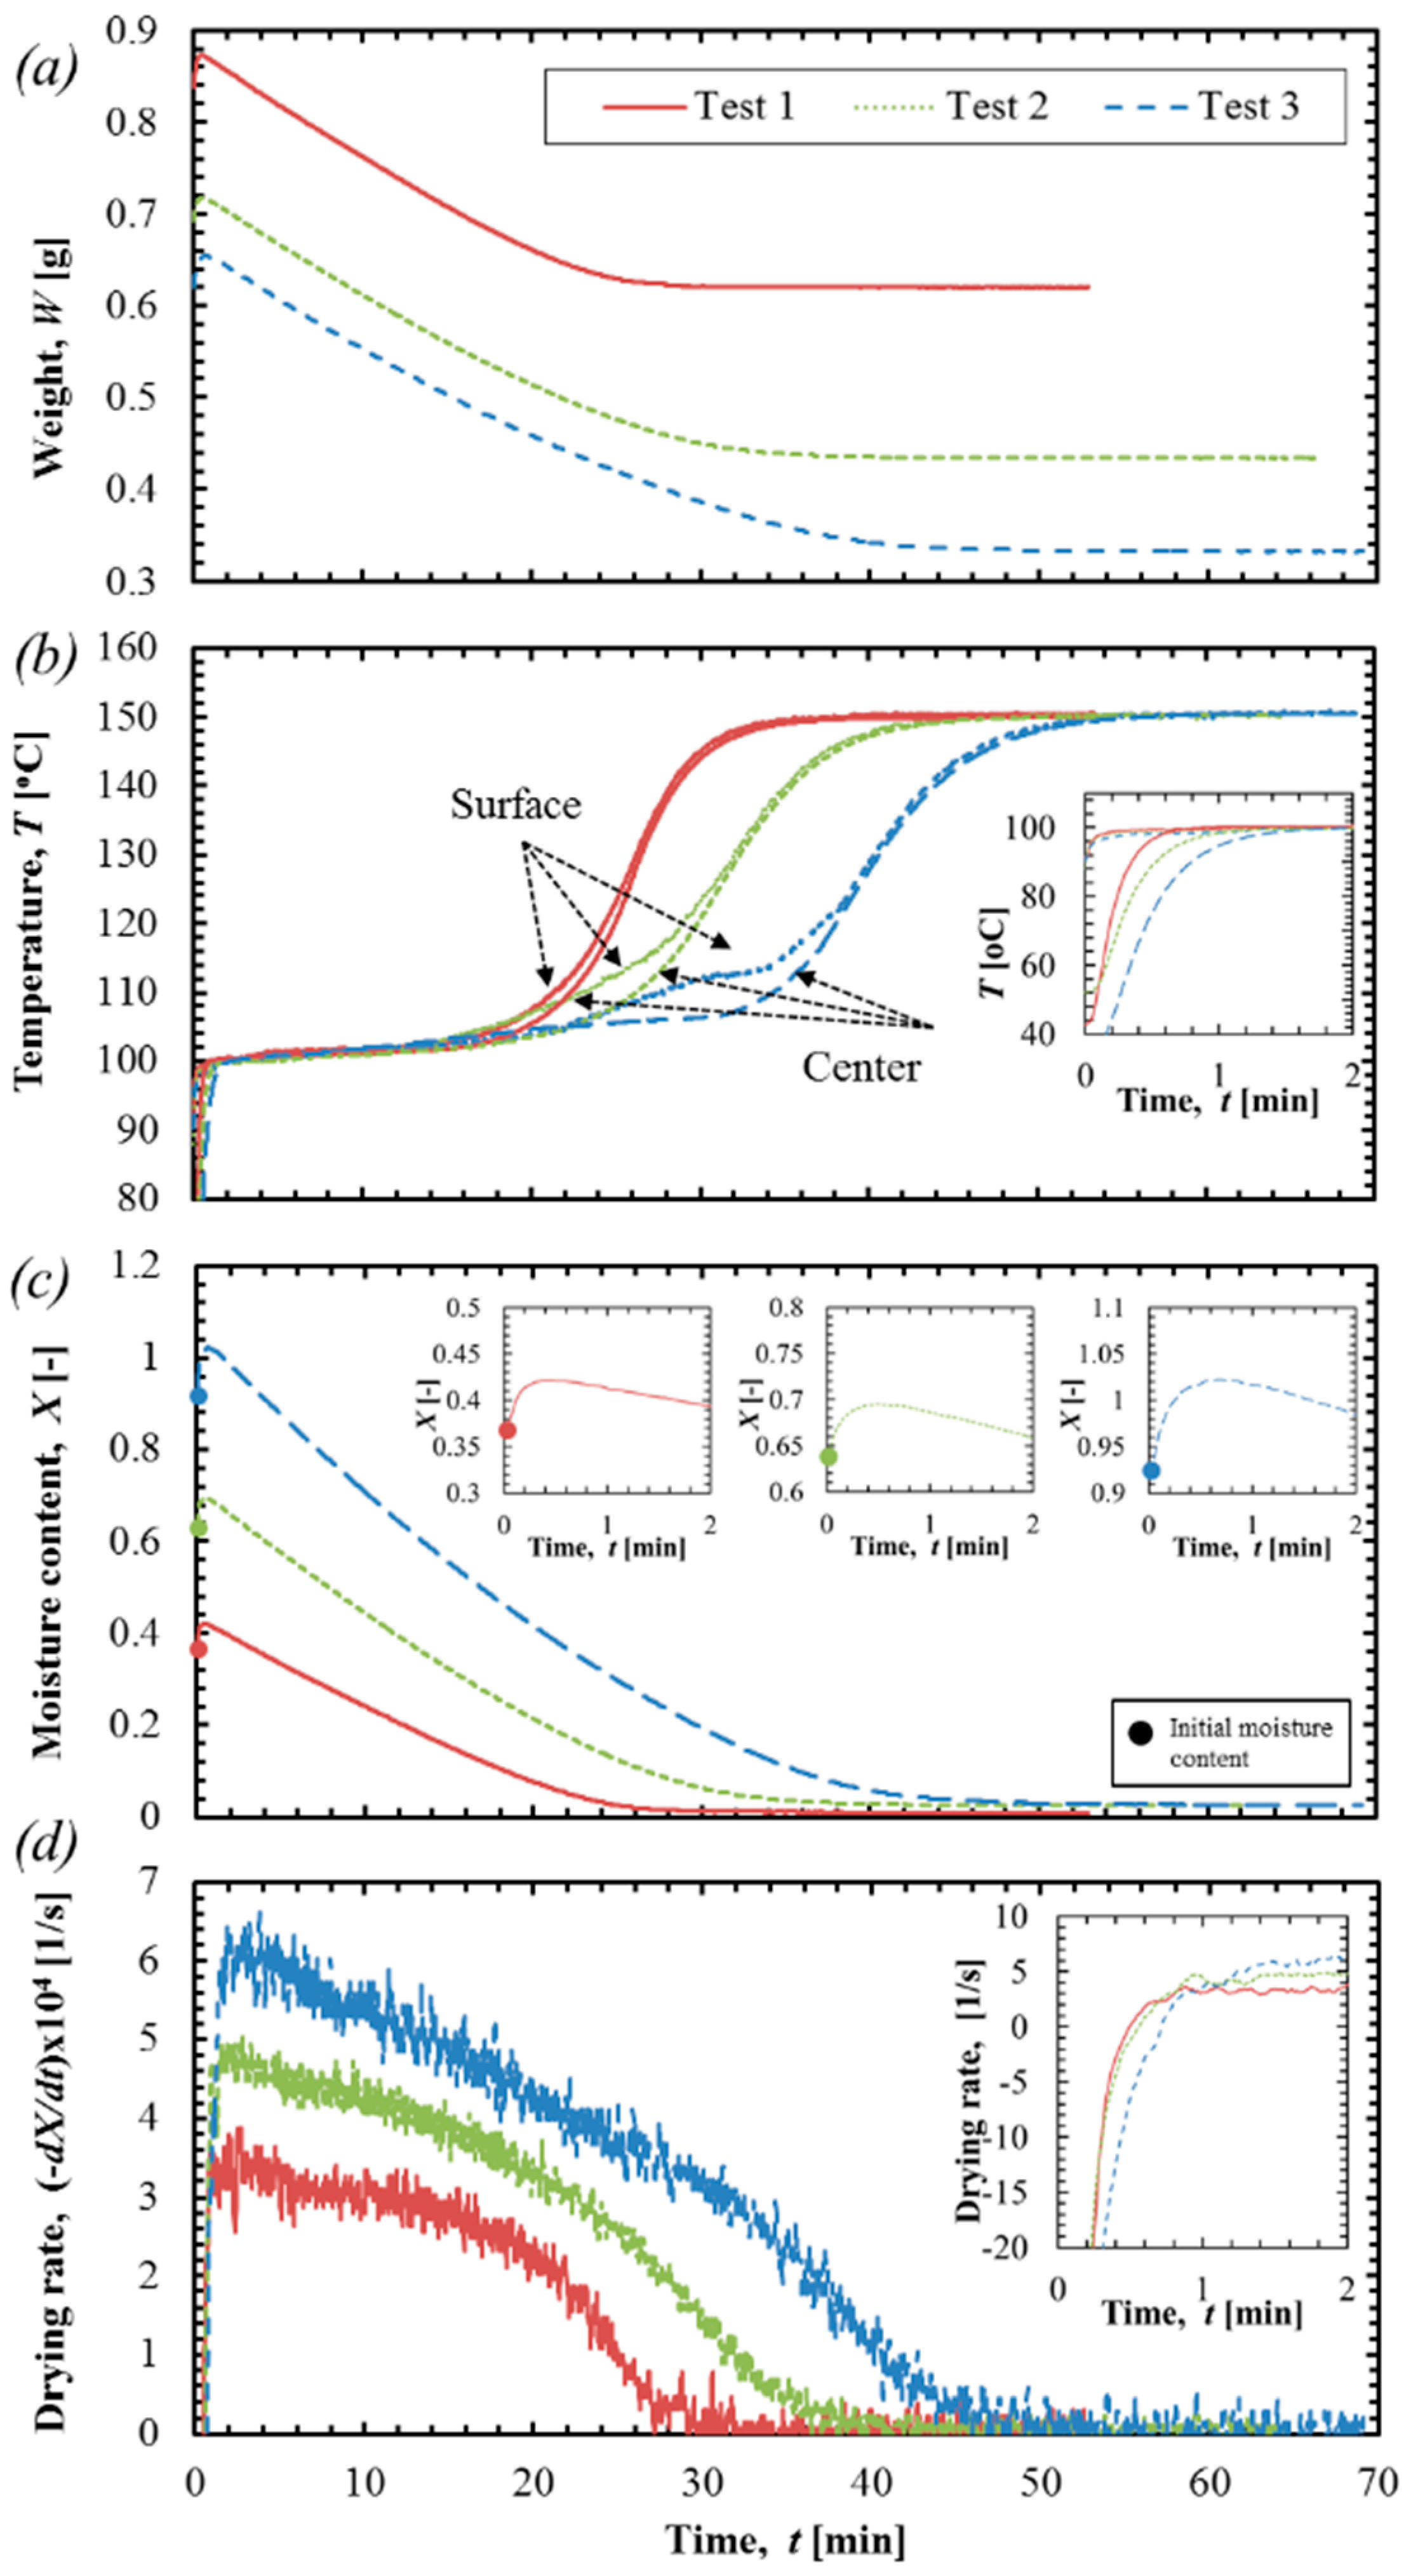
Figure 5 shows the exemplary drying behavior of Sample T1 in the superheated steam. The indicated case was the examination of drying with 10 mm samples in the test temperature 150 °C. The test was repeated for several spherical samples, which were made of randomly chosen blocks of lignite T1 and three exemplary tests are shown here. To describe drying behavior, the change in the sample’s weight (
Figure 5a), temperature profile (
Figure 5b), moisture content (
Figure 5c) and the drying rate (
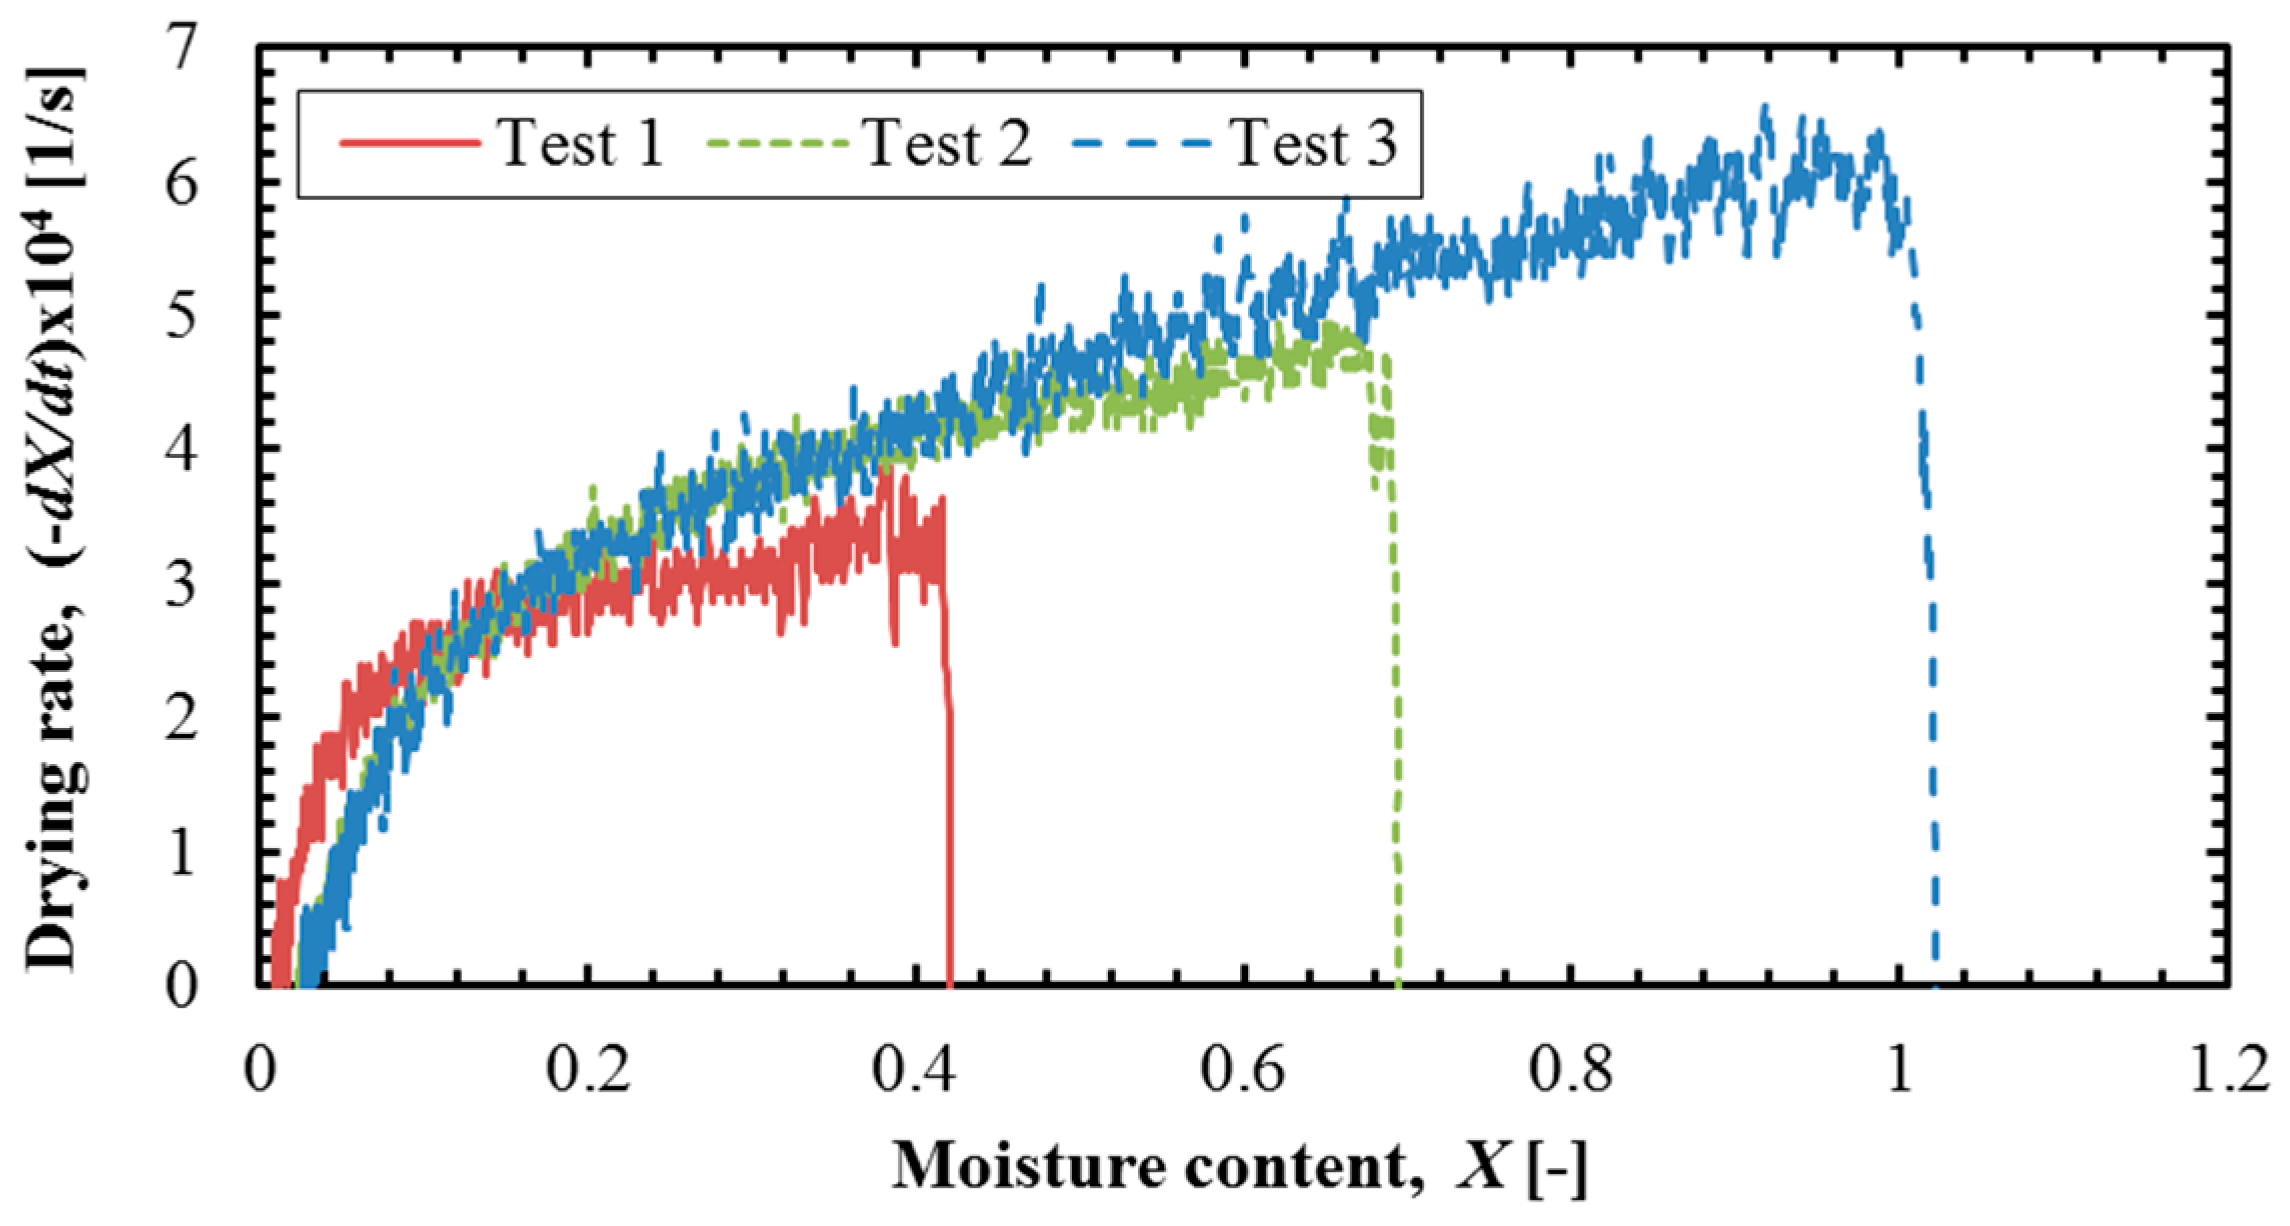
Figure 5d) are presented. The drying rate curve plots are drawn in
Figure 6.
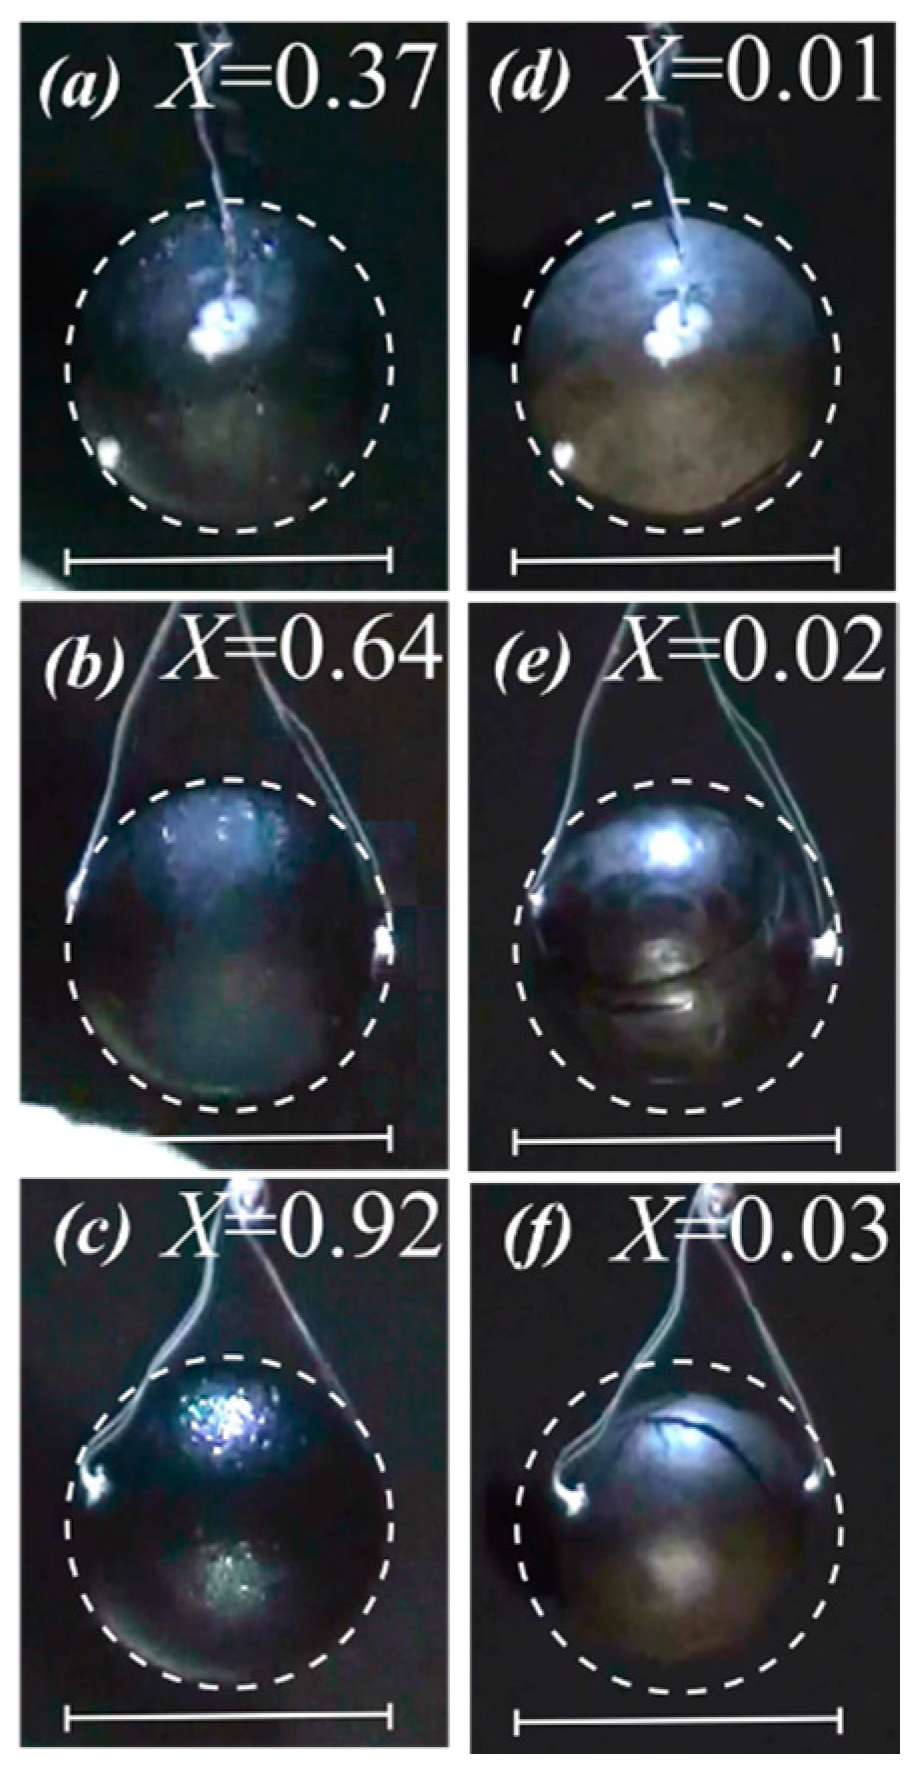
Figure 7 shows the surface observation (both initial and final states) of a sample at each test.
Table 3 lists other importance: the initial water percentage (
WPini), the residual
WP, the steam drying time and the initial drying rate found at each test. In general, drying behavior of lignite, which is a material with hydrophilic porous structure, can be categorized into three periods: pre-heating period (
T < 100 °C) when stem is condensate on the sample surface, constant drying rate period (CDRP) (
T = 100 °C) and decreasing drying rate period (DDRP) (
T > 100 °C). Note that the drying behavior of Turow lignite follows this manner. However, the CDRP is generally very short, though this depends on initial moisture content of the sample. As can be seen in the obtained results, the variations of the initial water are wide as resulted in 26.8%–47.9%. Therefore, the drying behavior differs to each other among the three represented tests. With lower moisture content sample (Test 1), which has a heavier weight, the pre-heating period and CDRP finishes faster than others, and then the increase of the sample’s temperature (both the surface and the center) starts earlier than others and the raise is more rapid.
Thus, the drying process is completed sooner than other tests (
Table 3). With Tests 2 and 3, the increase of the center temperature is gradual to that of the surface temperature in the transition from the saturation temperature to the test temperature. In Test 1, the rise of temperature at the sample center is rapid due to lower moisture content, and small temperature gradient is observed over any other instance on the transition from the saturation temperature to the test temperature. The sample with low moisture content has a heavier weight, so that the change in the weight caused by the water evaporation is quantitatively small to the weight of the dried sample. Thus, moisture content becomes smaller in the sample and it leads to the lower drying rate. This also influences the appearance of the sample, as it was shown in
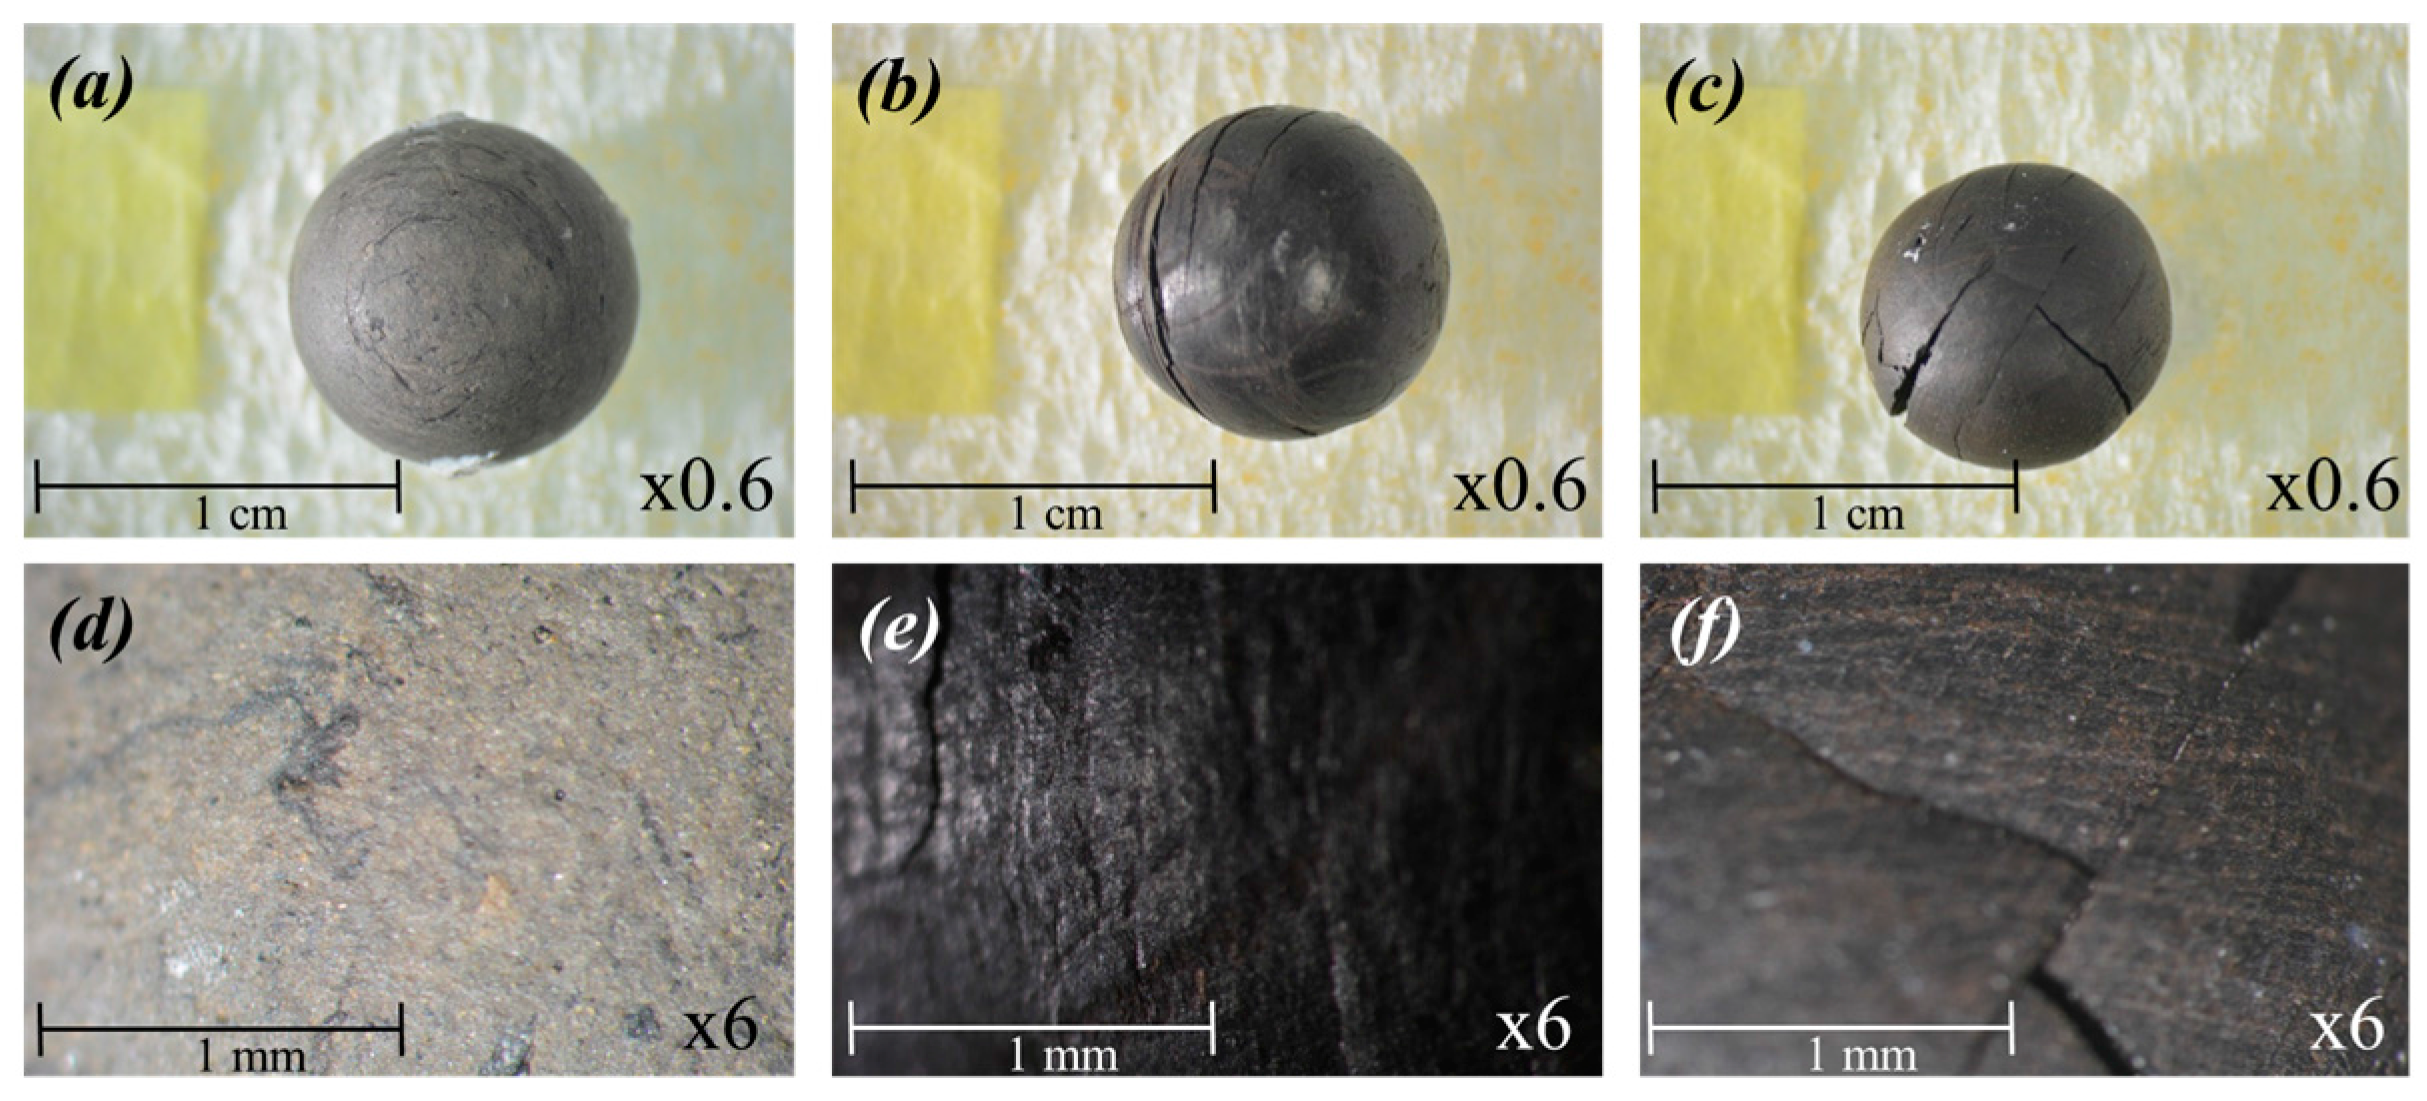
Figure 7. The initial and final states of all the samples in the superheated steam drying process are indicated. The white dot circle in the pictures is the outline of the initial shape of the samples. The values of moisture content at initial and final states are also indicated. When comparing the physical appearance at the final state to that of the initial state, the size of the sample becomes smaller. This can be seen in all the represented cases. Pores, in which water is kept in the sample, become vacant after the water removal and they are crushed due to thermal stress mostly in the DDRP at which the sample’s surface and core temperatures start increasing from the saturation temperature to the test temperature. This behavior was previously shown [
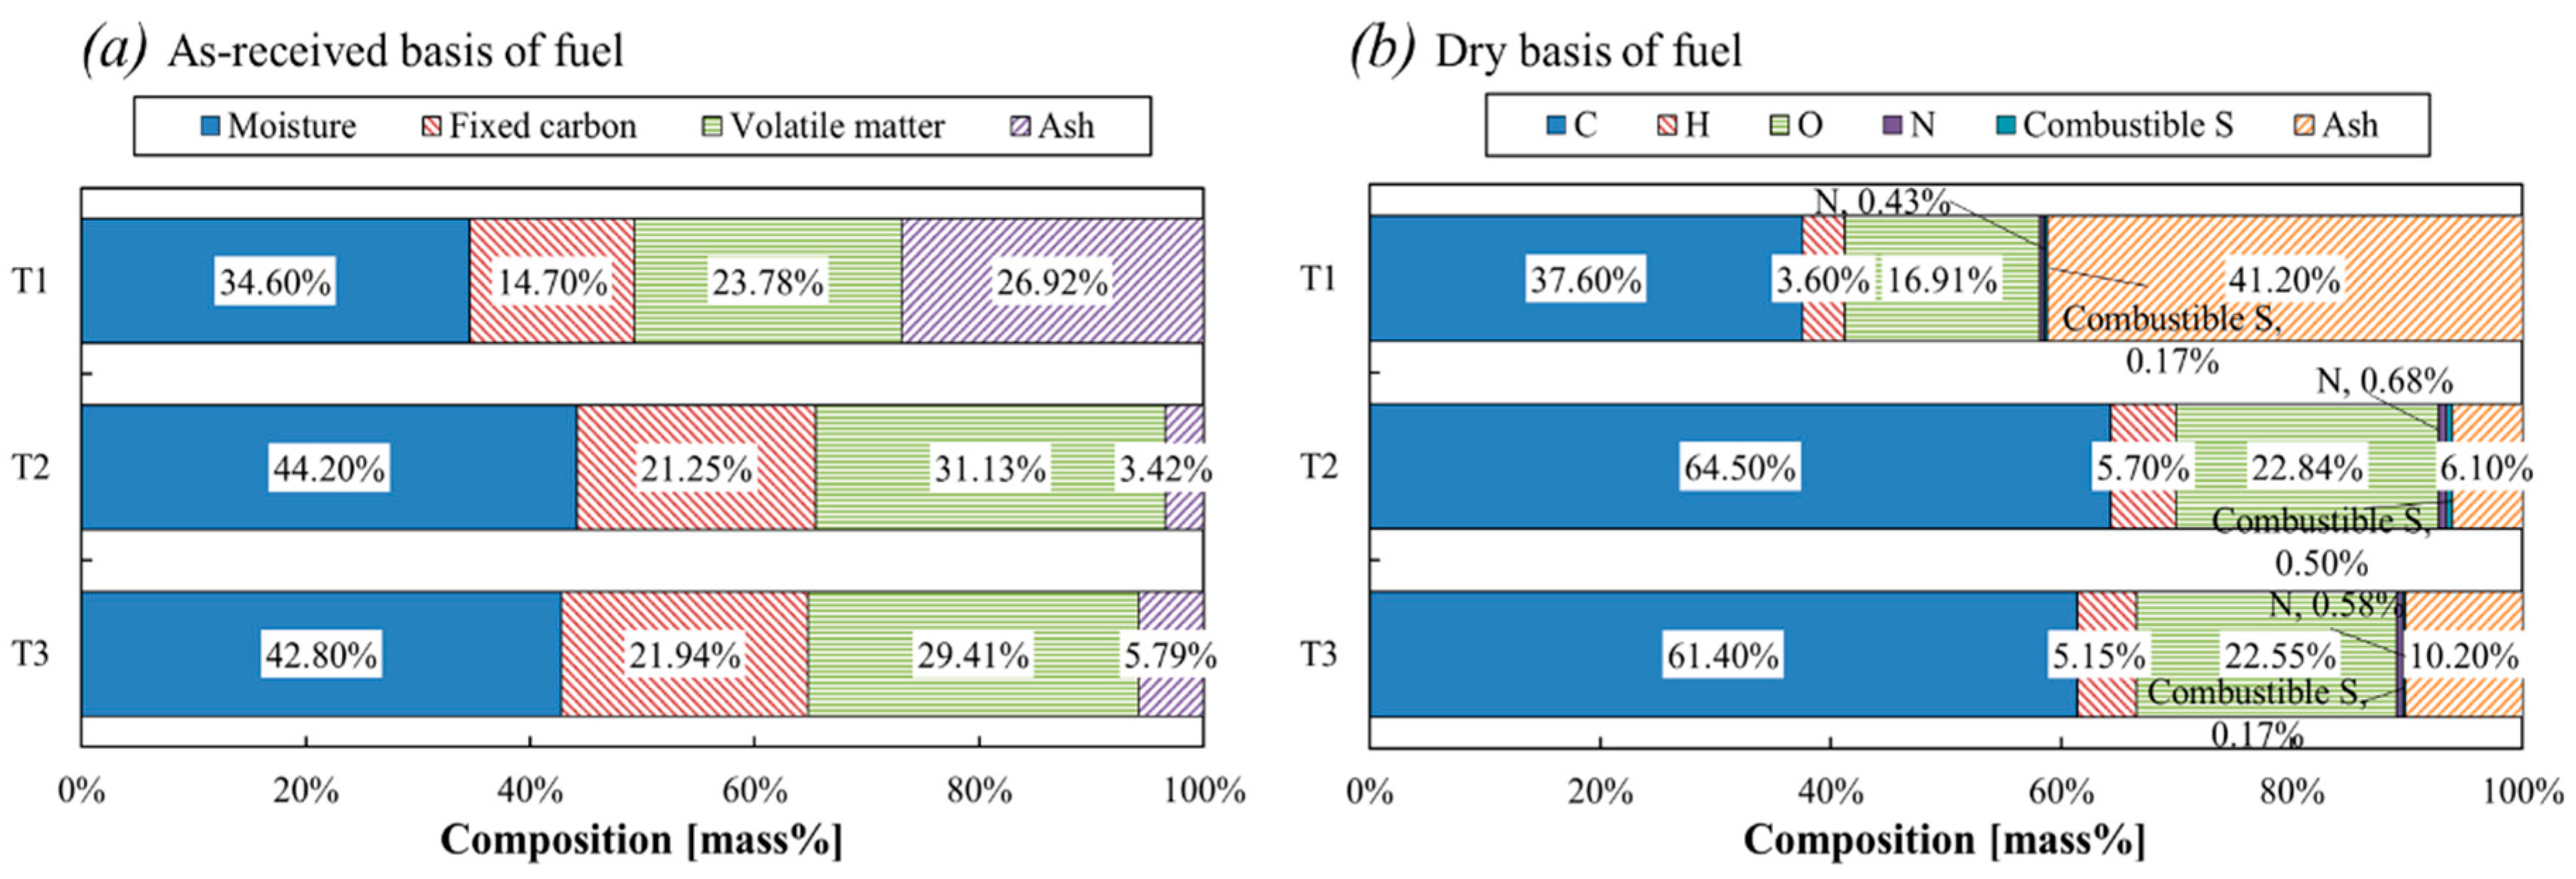
18]. The water transported from the inside sample to the shell at the CDRP might occur not as vapor, but in the form of liquid. This allows for keeping homogenous temperature distribution inside the sample. Crushing of pores is not dominant phenomena in the CDRP. As a consequence of the water removal, the sample shrinks in all the cases. The volume shrinkage at the final state was estimated; 7.7% in Test 1, 18.3% in Test 2 and 40.7% in Test 3. The degree of shrinkage on Test 3, which has highest initial water of 47.9%, is visibly more remarkable than that of Test 1, which has lowest initial water of 26.8%. High moisture content sample possesses large numbers of pores to keep that amount of water inside. Thus, the dried sample becomes significantly smaller, comparing to the initial size. In the case of the lower moisture content sample (Test 1), the shrinkage of the sample is not alike the rest of tests (Tests 2 and 3), this may be connected with ash content in the sample. The surface color of the Test 1 sample is very bright and rather grey color compared to the others (
Figure 8a,d). Considering the proximate analysis, the color is resulted from the large ash content, in which silica and alumina oxides dominate over 85% of the composition. The specific gravity of ash is larger than lignite (
Table 2) and this results in the heavier weight of the sample. Looking at the
Figure 8b,c, cracking on the sample surface is observed in both Tests 2 and 3. This cracking occurred primarily along the one certain direction of the sample in Test 2 (
Figure 8e). In the meantime, the appearance of cracks in Test 3 is more frequent than in Test 2 and is on many directions (
Figure 8f). A heavier weight sample in Test 1 does have less amount of water within itself, so significant cracking on its surface was not observed.
Ticleanu
et al. [
26] discussed the correlation between the lithotypes of Oltenia coals and their main quality characteristic. Specifically, they presented correlations for xylitic coal, weak xylitic coal (transition between xylitic and detritic), detritic coal and clayey coal. According to [
26], ash content can be used as a lithotype indicator. Generally, it was concluded that xylite and xylitic coal contains the smallest amount of ash, then higher amount of ash are correlated respectively with weak xylitic coal, detritic coal and clayed coal. This correlation is coherent with the presented observations on the samples weight, drying time, and observed structure and characterization of lithotype of each sample.
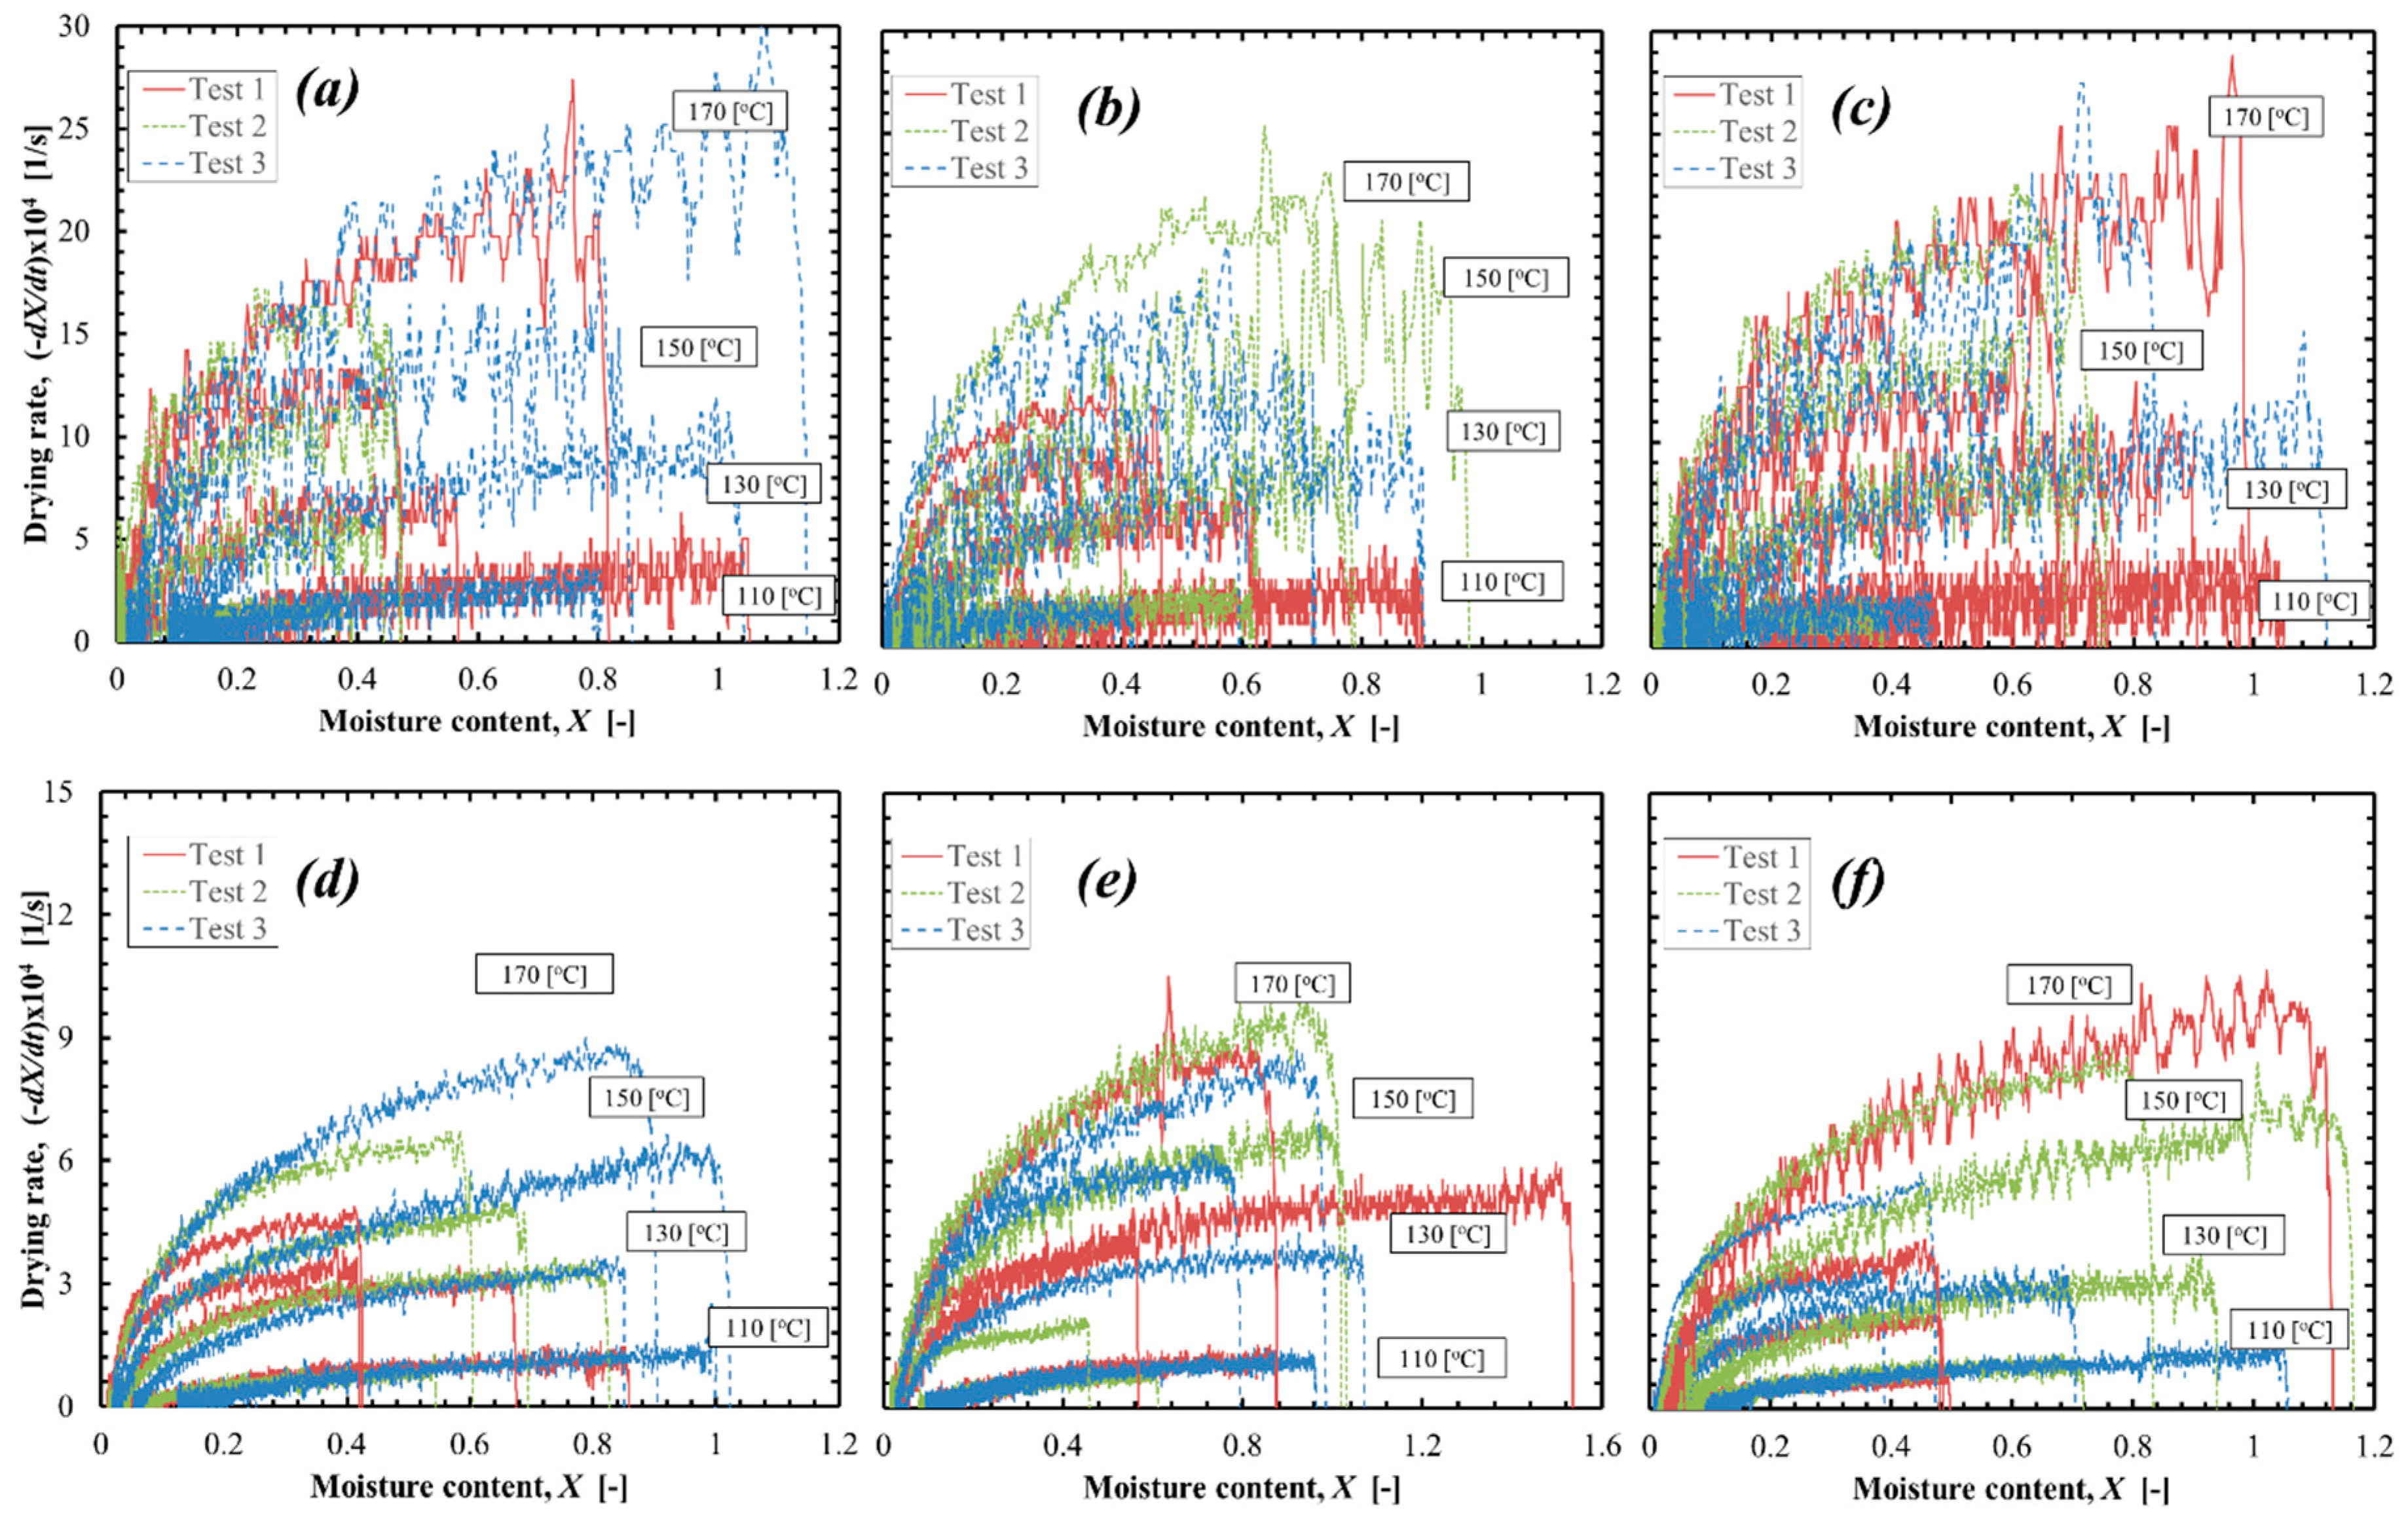
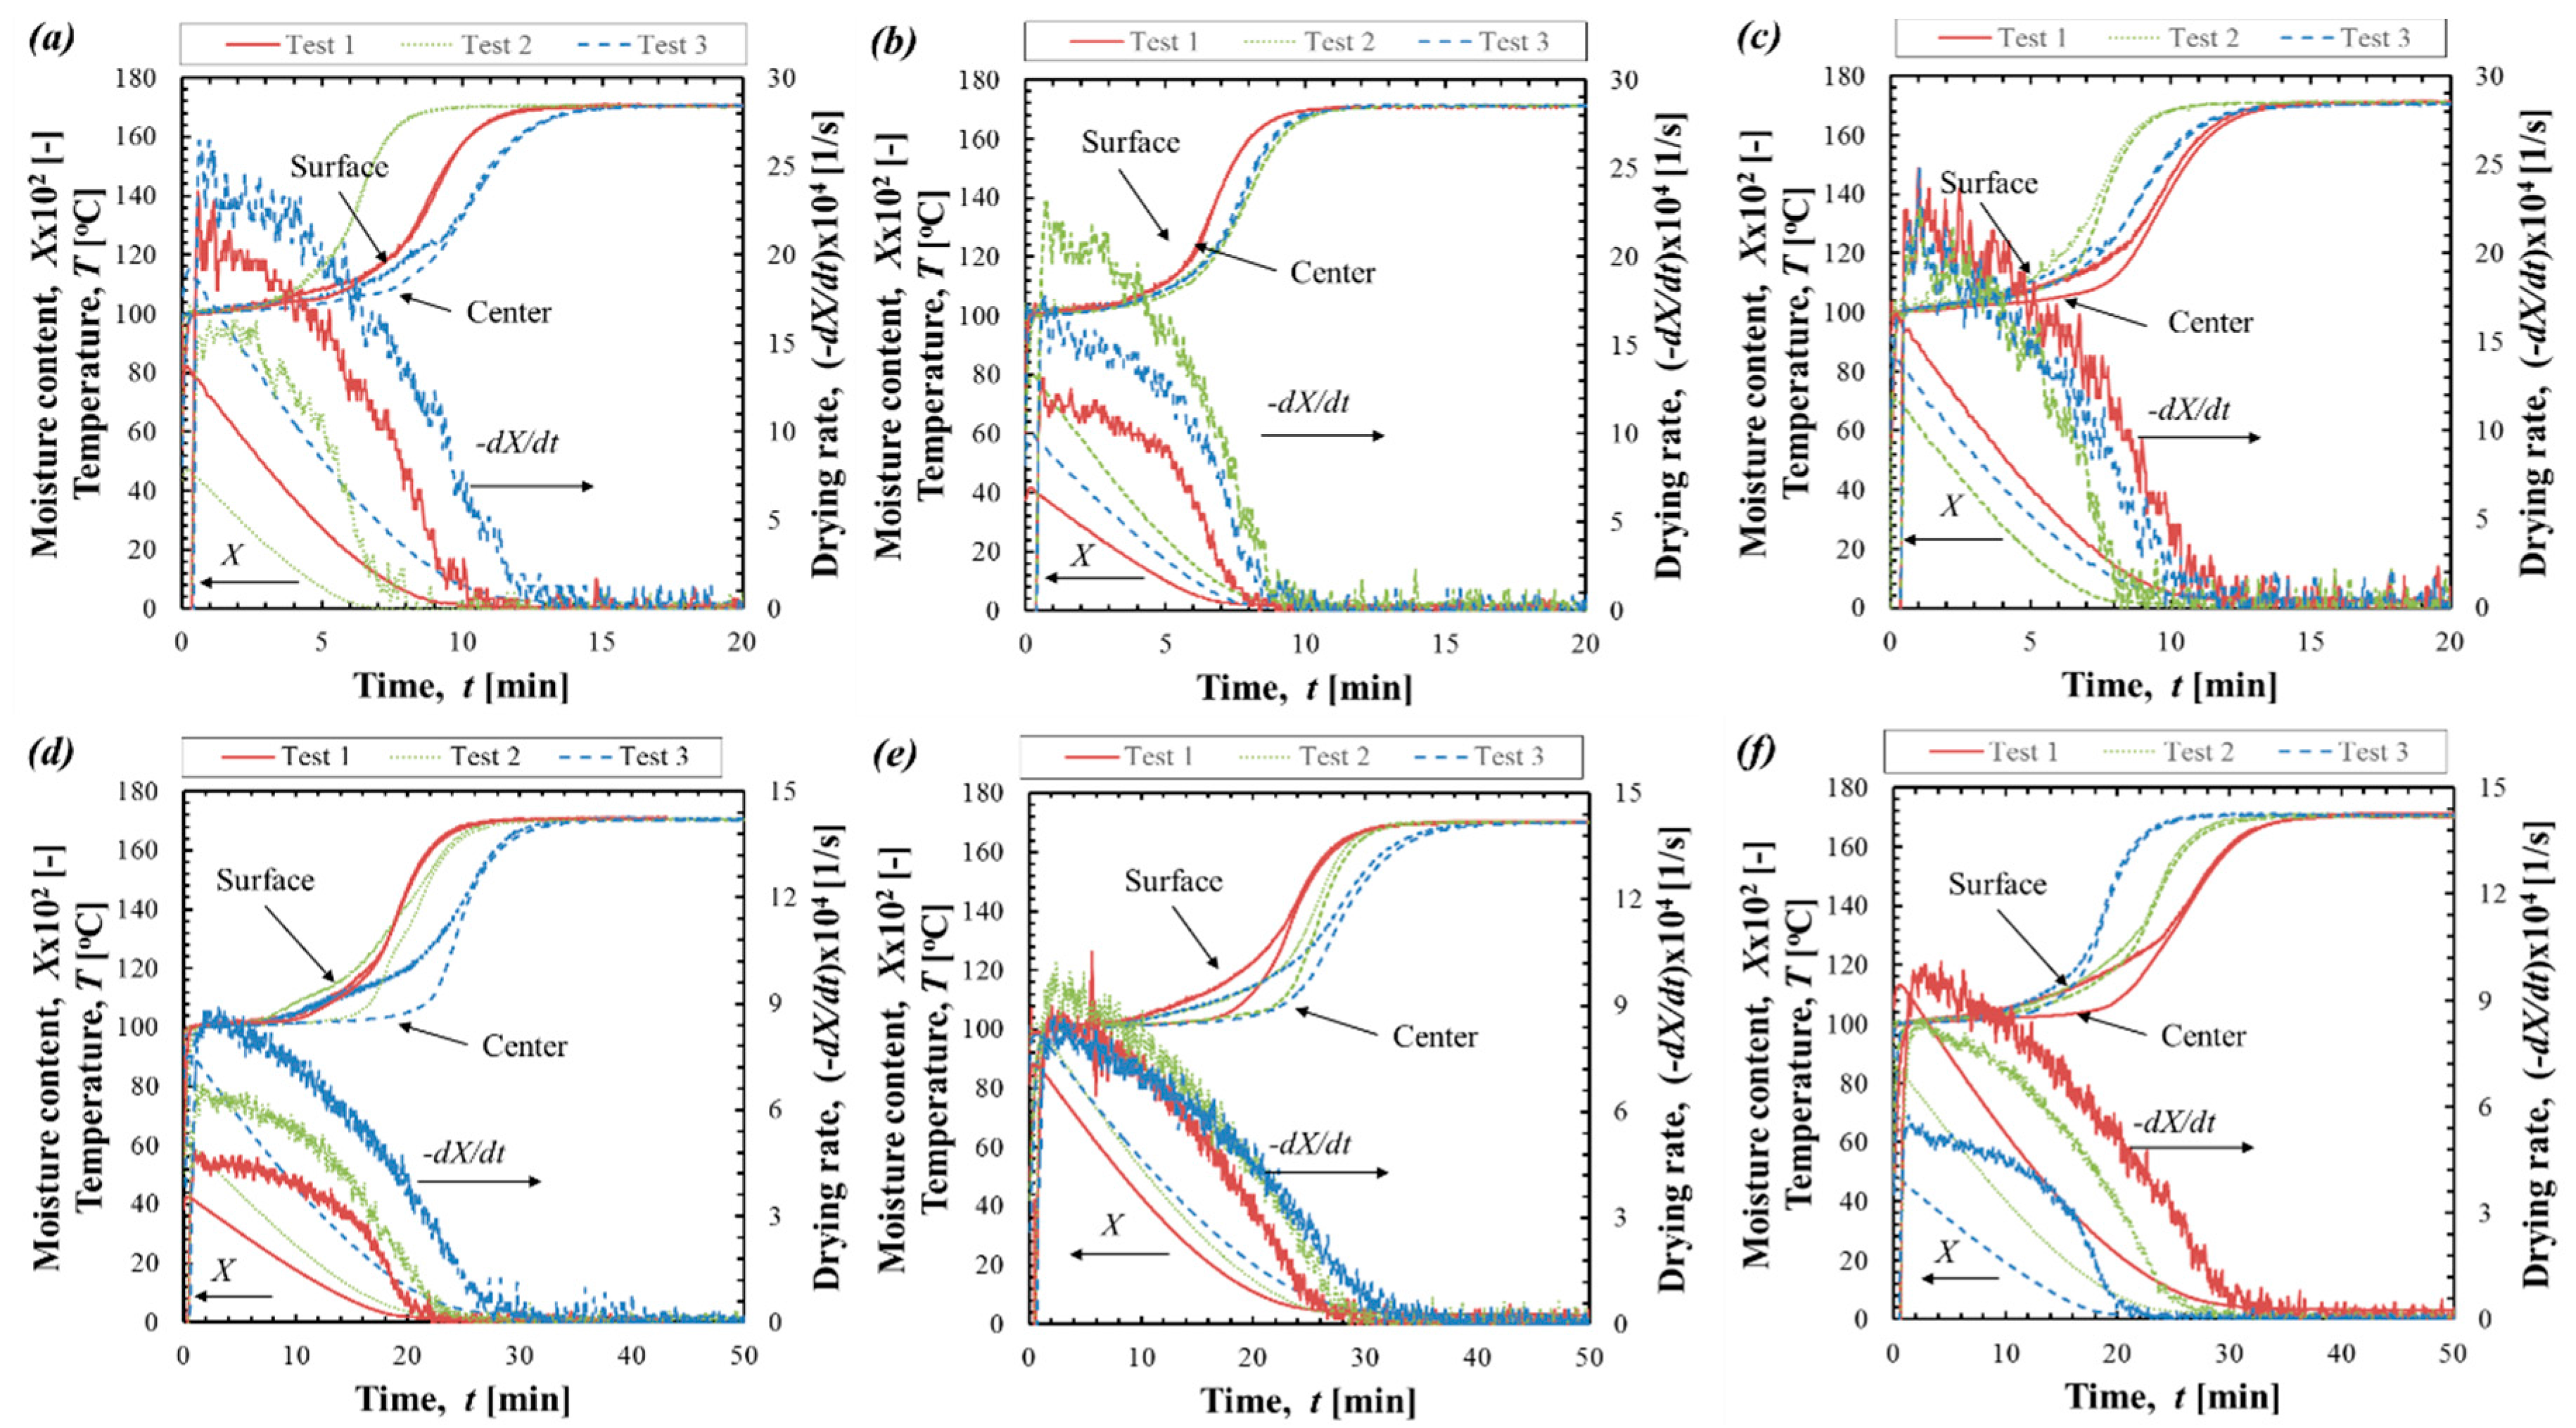
Figure 9 shows the summary of exemplary drying characteristics of Samples T1, T2 and T3 in the temperature of 170 °C of superheated steam for both 5 nm and 10 mm sample. Drying behavior of Samples T2 and T3 is very similar to what has been observed in that of Sample T1. The variation of drying behavior is wide and they differ each other. The drying rate curve plot, at each test temperature of 110, 130, 150 and 170 °C, is also summarized in
Figure 10. The clearly visible influence of the particle size and superheated steam temperature was explained in previous work [
18], but the additional variety from individual properties of coal is observed. Because of the diversification of the petrographic lithotype texture, it is very difficult to determine the representative characteristics of drying behavior for each case. Therefore, to understand the influence of individual lithotype, it is necessary to study the behavior of individual samples (
Figure 5,
Figure 6 and
Figure 7) rather than general overview of lignite T1, T2 and T3.
4.2. Thermodynamic Evaluation of the Drying Rate at Constant Drying Rate Period
As it is well known that the heat input to the sample is consumed for the evaporation of water in the CDRP since the change in the temperature profile does not occur, the initial drying rate of the test can be thermodynamically derived. As the thermodynamic evaluation has been previously carried out and verified for lignite from the Belchatow deposit, the initial drying rate (the drying rate at the CDRP) (s
−1) can be derived from the following equation [
18]:
where
h stands for the heat transfer coefficient (kW·m
−2·K
−1),
enthalpy change of water evaporation (latent heat of the free water at 100 °C, 101.325 kPa,
MJ·kg
−1),
Ttest is the temperature of the drying medium (K),
Ts is the sample surface temperature (K),
is the density of raw sample at initial state (kg·m
−3),
is the mass fraction of dry lignite in a sample (–) and
d is the diameter of the sample (m). The detailed derivation and a method estimating the heat transfer coefficient are presented in [
18]. This coefficient described by the flow velocity, the size of particle and test temperature.
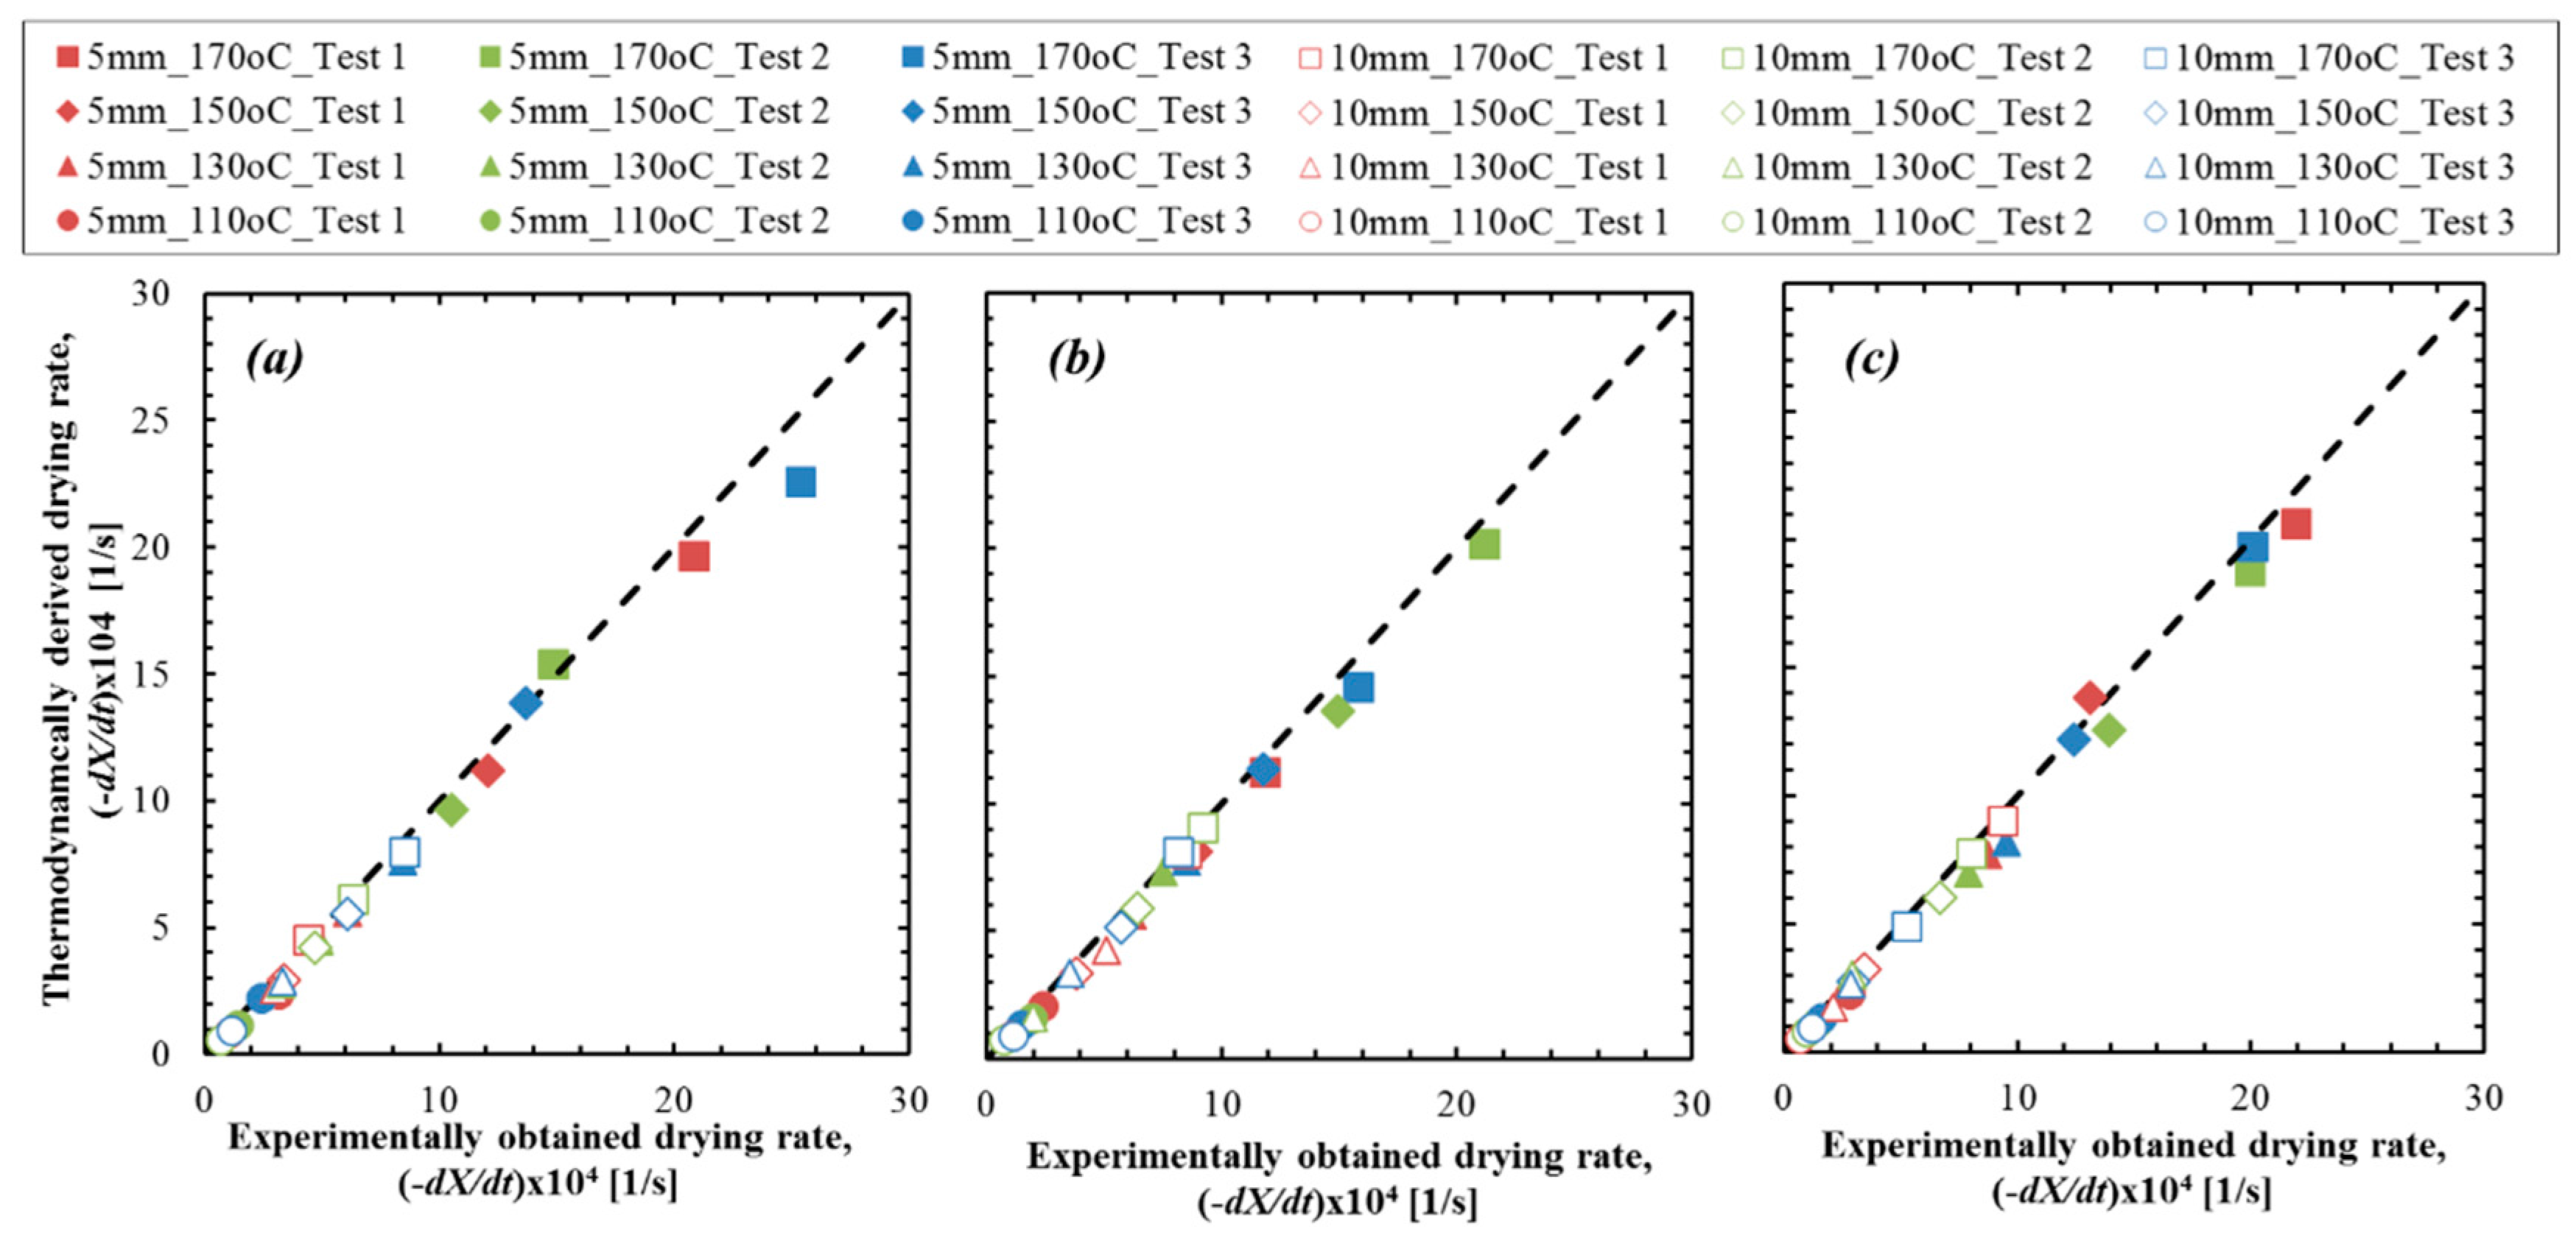
Figure 11 shows the consistency of the thermodynamically calculated drying rate to the experimentally obtained drying rate (at CDRP). General formula can incorporate though significant variation of properties appears; it was proven that the proposed formula is effective in prediction of the initial drying rate in the CDRP and describes well the variations observed in
Figure 10. This also means that the drying rate at the CDRP is governed by the degree of superheated steam, the size of lignite as well as the initial condition of the sample, mainly
WPini what was decided by the physical characteristics of the dried lignite object. The results presented in
Figure 11 clearly show that Equation (3) can be applied to many types of samples lying on the broad range of
WPini and the initial density.
The dry bulk density
is defined as the mass of the dry lignite
(kg) divided by the total volume of the raw sample
(m
3):
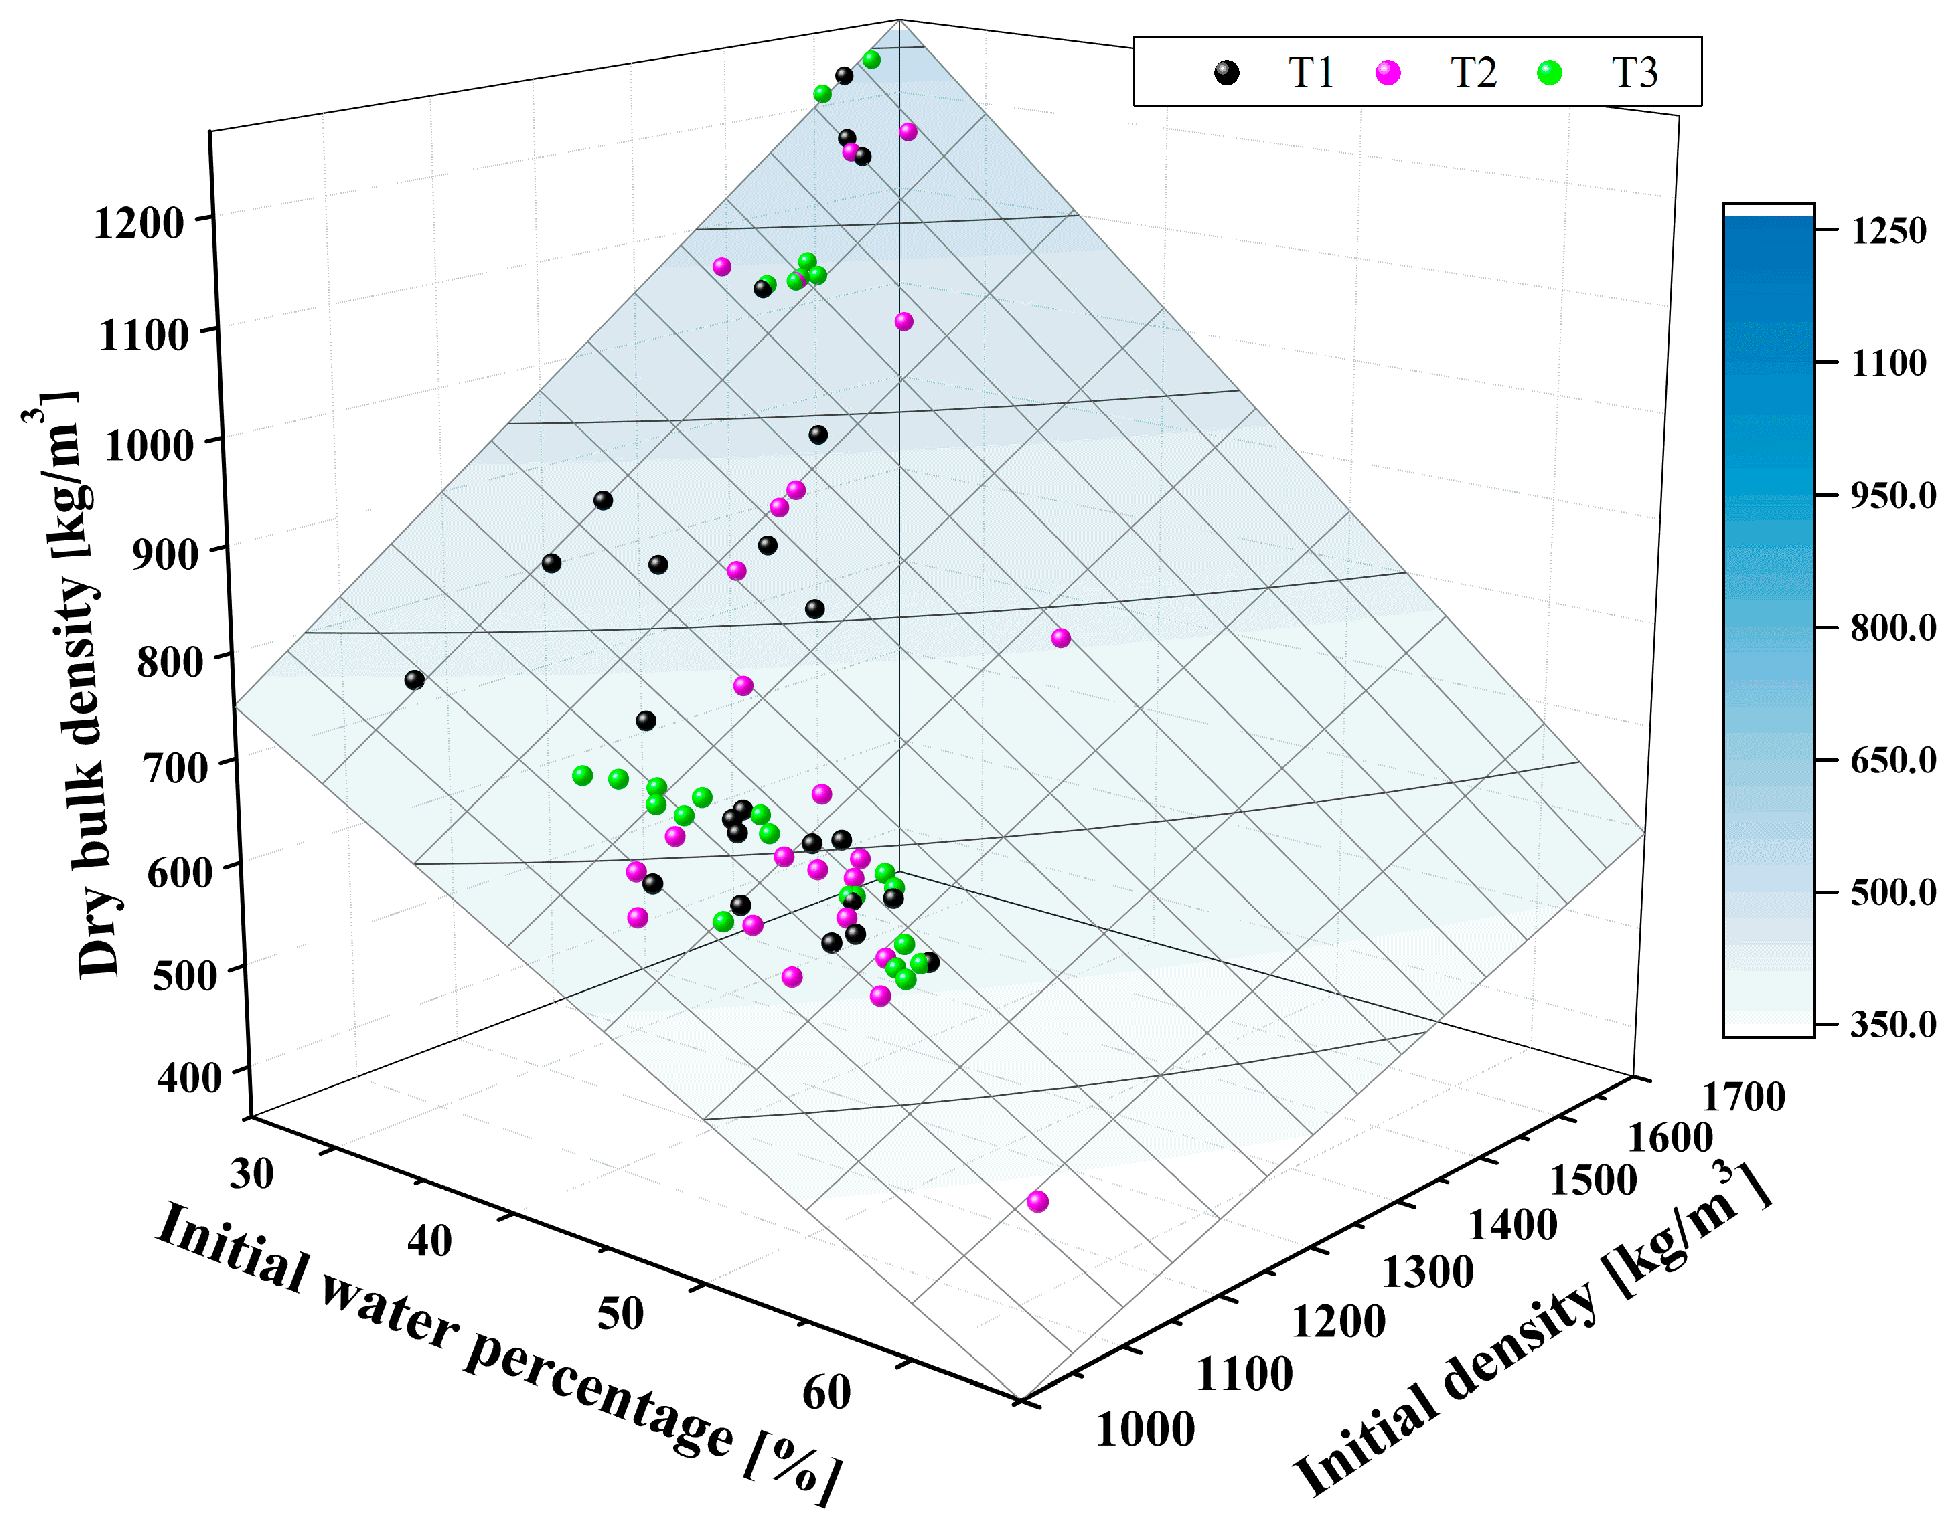
Figure 12 shows the impact of
WPini and initial density on the dry bulk density
based on the fixed volume of samples. A plane surface in
Figure 12 is the theoretical space of possible values of dry bulk density from various initial water and density of samples. Each plot in
Figure 12 is calculated from the examined lignite particles from the different grades of samples investigated. The dry bulk densities of Turow lignite are in the range of 400 kg·m
−3 and 1300 kg·m
−3. This corresponds to the
WPini of 25% and 60%. The results of tests were found in the widespread range. This indicates that the divergent physical properties of Turow lignite, which strongly influence the drying behavior. The widely divergent dry bulk density of the Turow lignite is related to the inhomogeneous seam structure due to the sedimentary contamination of inorganic matters resulting in local high ash concentrations.
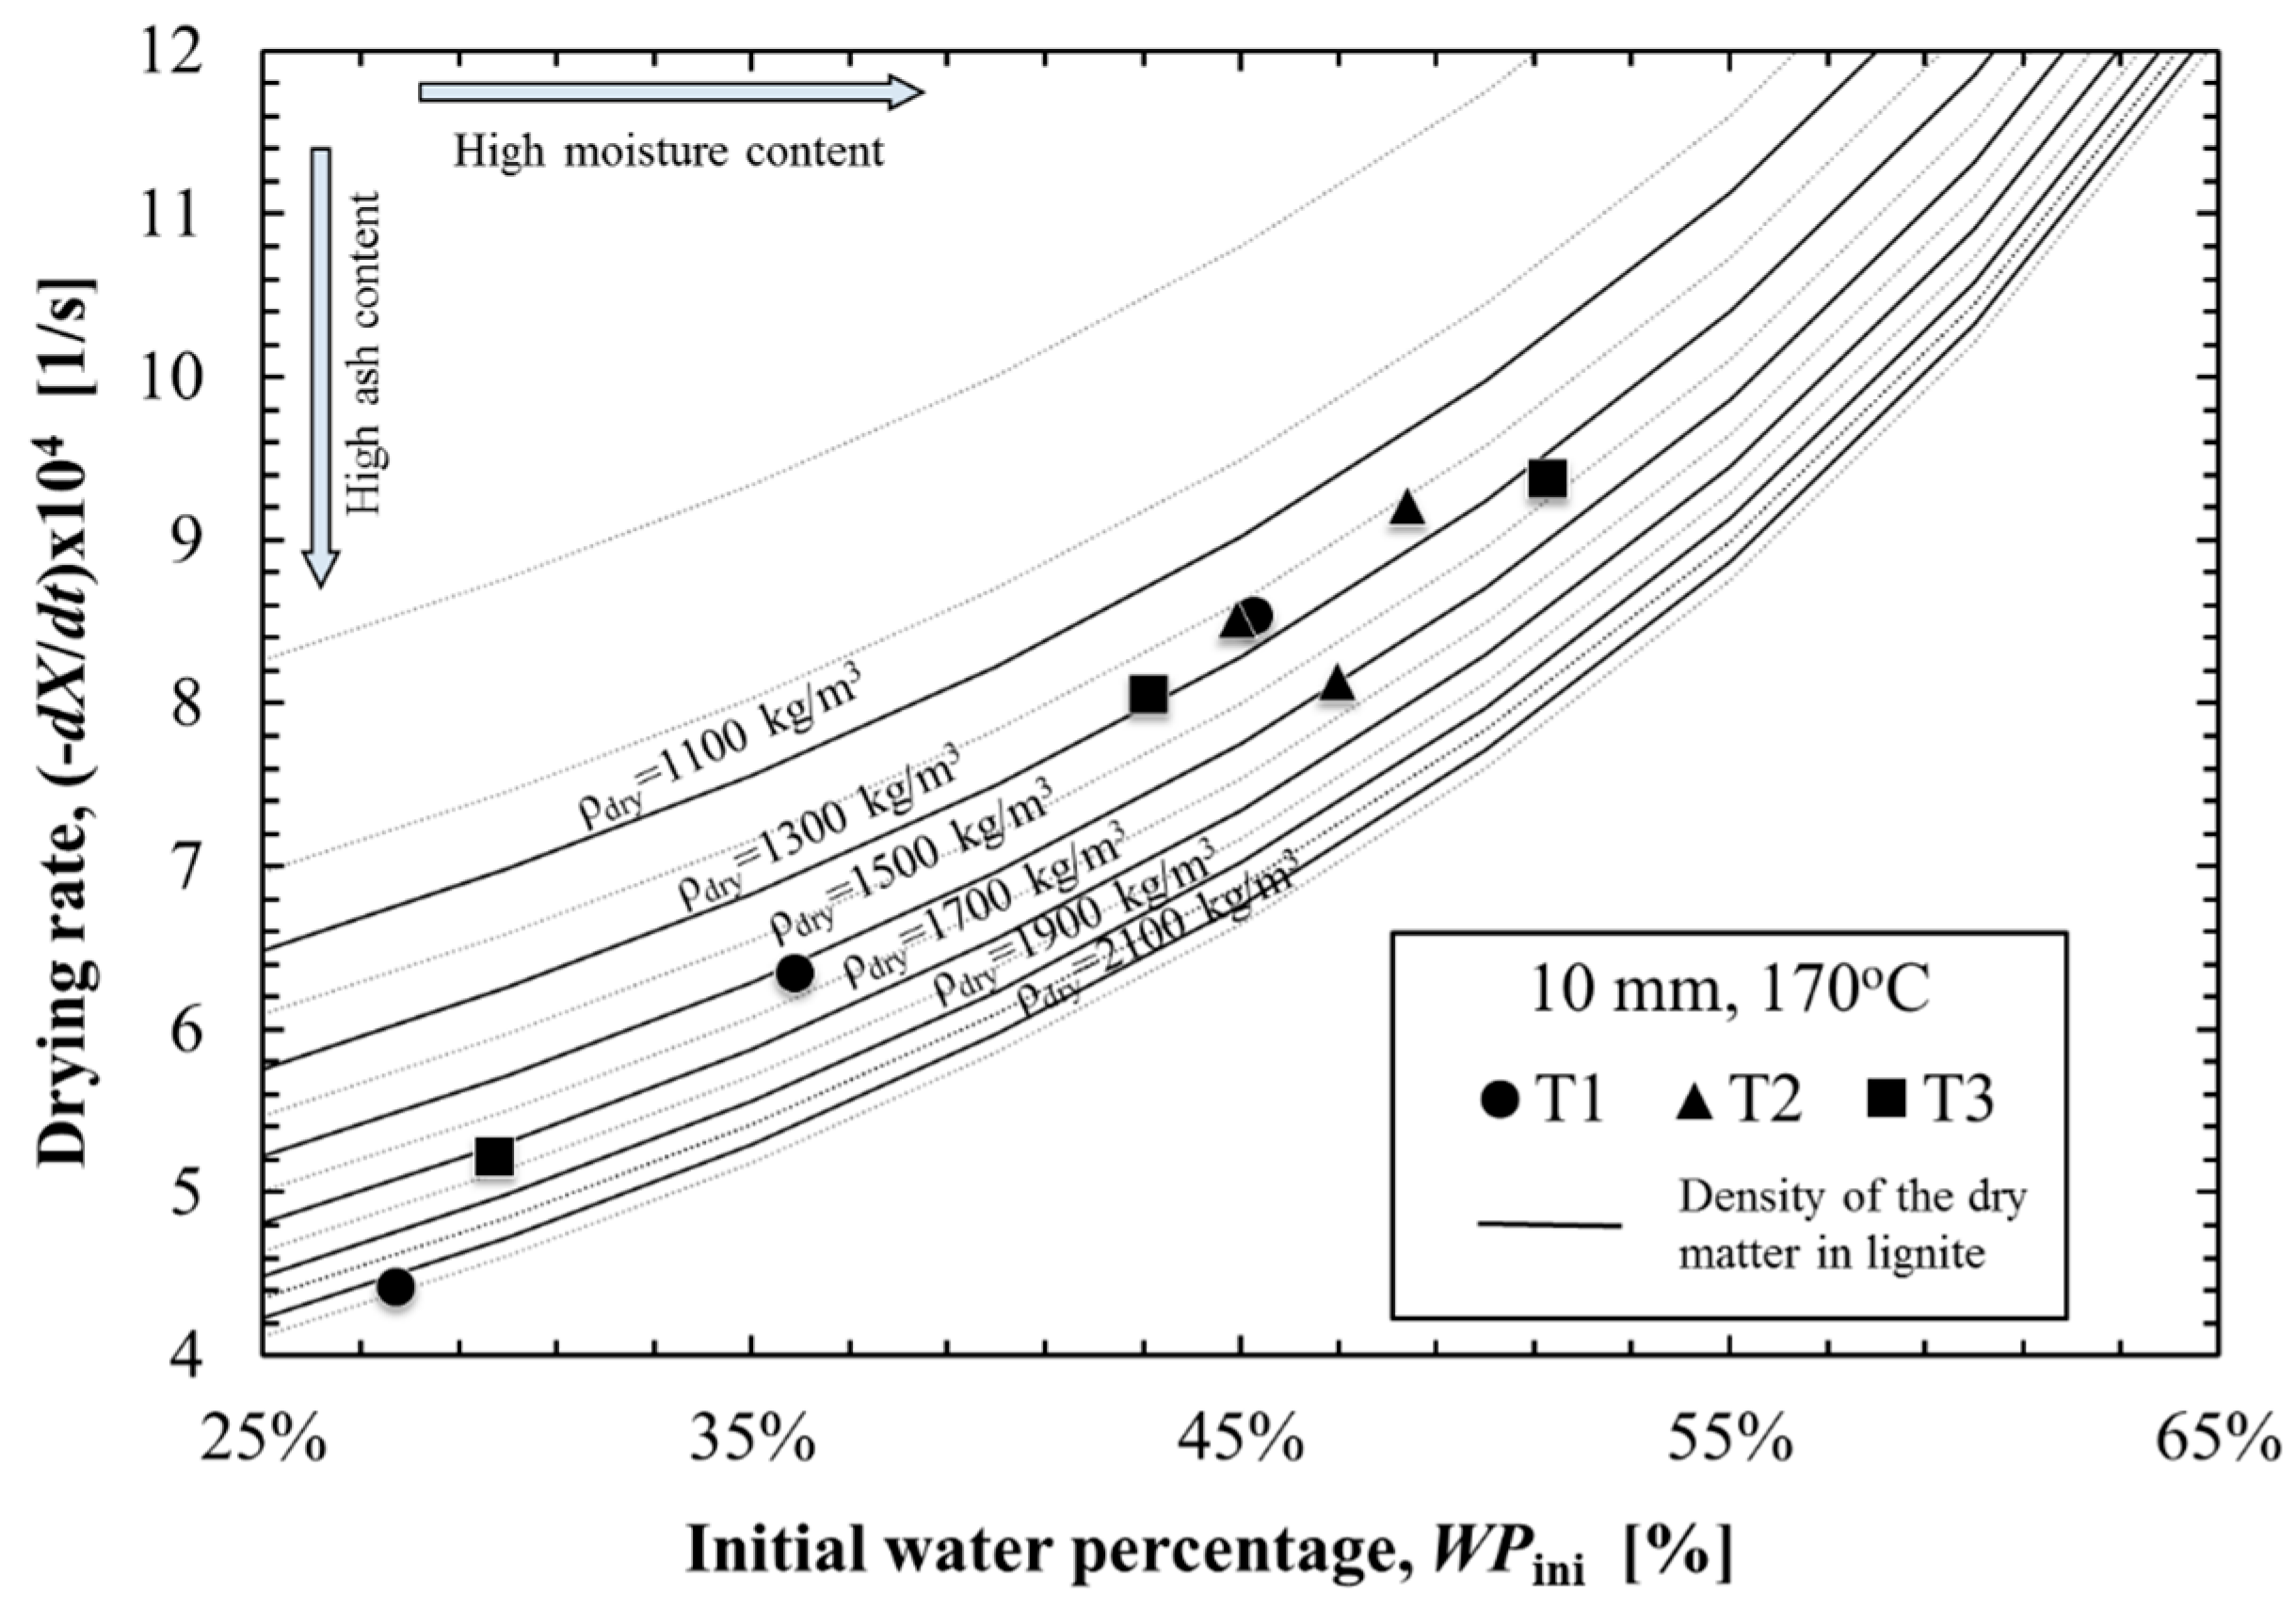
Figure 13 shows the correlation of the drying rate at the CDRP and
WPini of the examined samples. The drying rate was also predicted with the given density of the dry matter in the lignite, using Equation (3). Plots on
Figure 13 is the drying rate obtained from the drying test of 10 mm samples dried in 170 °C. The lowest drying rate is obtained with the sample that contains lowest
WP and the highest density. This may be attributed to the higher composition of the ash in the sample. As a matter of the fact, the drying rate of highly contaminated T1 sample can be found in this profile. A higher density of dry matter, together with the decrease of
WPini, lowers the drying rate at the CDRP. With the consideration that has been shown in
Table 2 and the deliberation from
Figure 12, high concentration of ash may be the most influential factor deciding the tendency of lowered drying rate. In this lignite sample, the loam and quartz sands sedimentations or inorganic matters originated in the detirius coal structure seems to be the cause.
4.3. Evaluation of Initial and Residual Moisture Contents and Drying Time
Figure 14 shows the correlation between the initial water and the density of raw sample before drying for T1, T2 and T3 samples. Histogram chart of
WPini was presented together with the correlation for each sample. The
WPini spreads very widely for whole range in the figure (from 25% to 55%) and this can be seen in all the presented samples T1, T2 and T3. Samples T1 and T3 are essentially from the same seam, so they have similarity with moisture among the group of relatively large amount of initial water (37.5%–51.5%) and of lower density of raw material (1.14–1.30 g·cm
−3). Trend in Sample T3 distinguishes this group more clearly. The trend in Sample T1 is on the other hand rather blur and difficult to distinguish. It may be connected with the implication of contamination in the sample. Sample T3 also implies the footwall of the Seam I, this group may be seen in the other one of
Figure 14c (plots gathering with small amount of
WPini and high density tested samples).
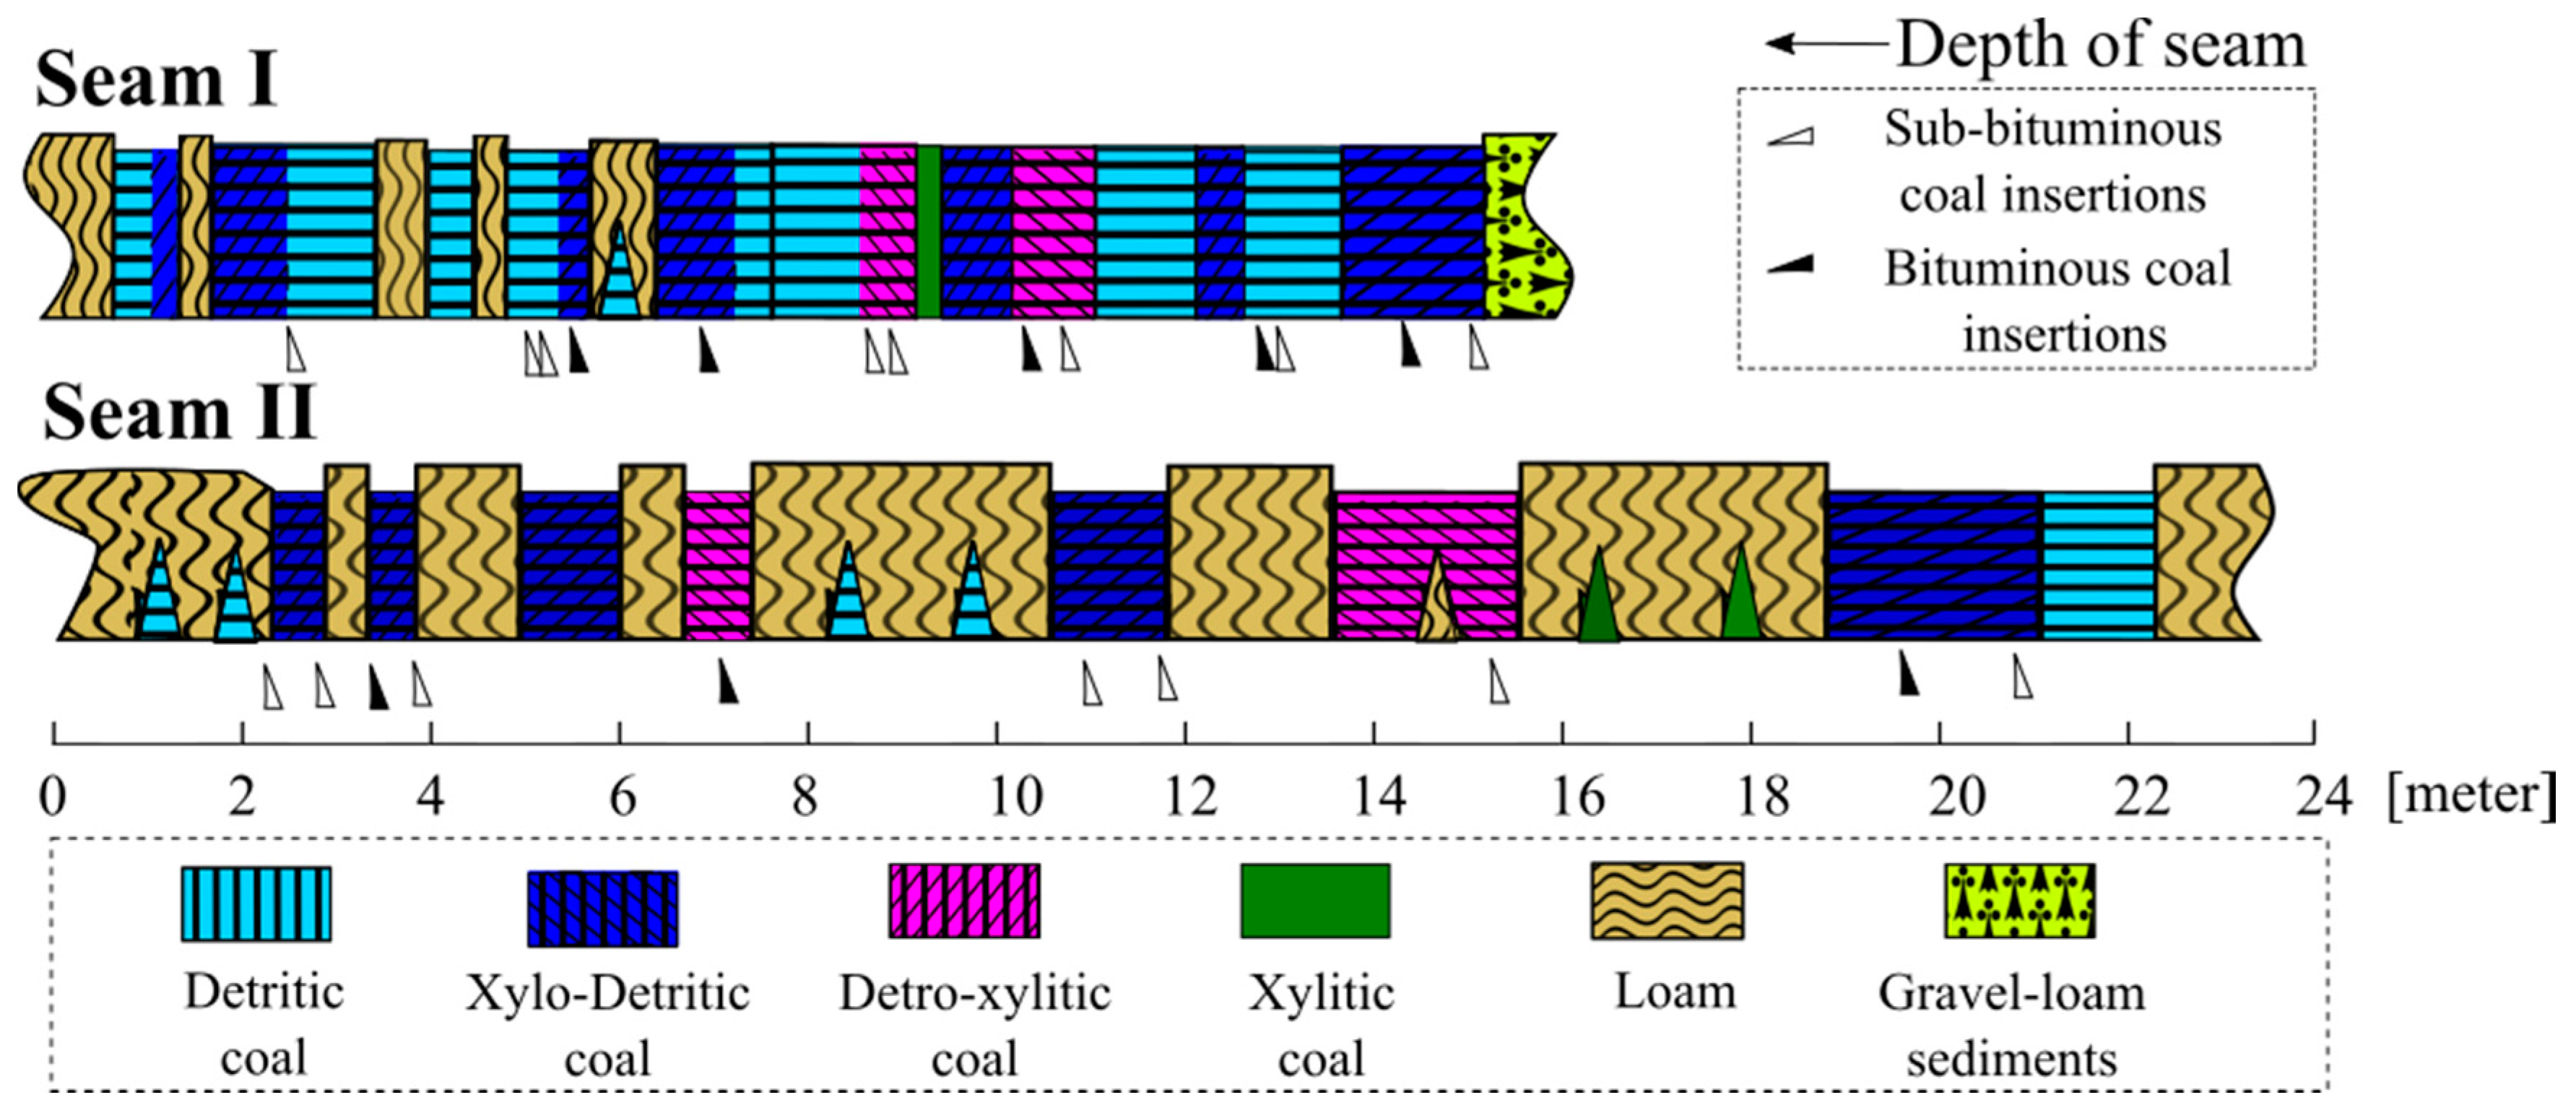
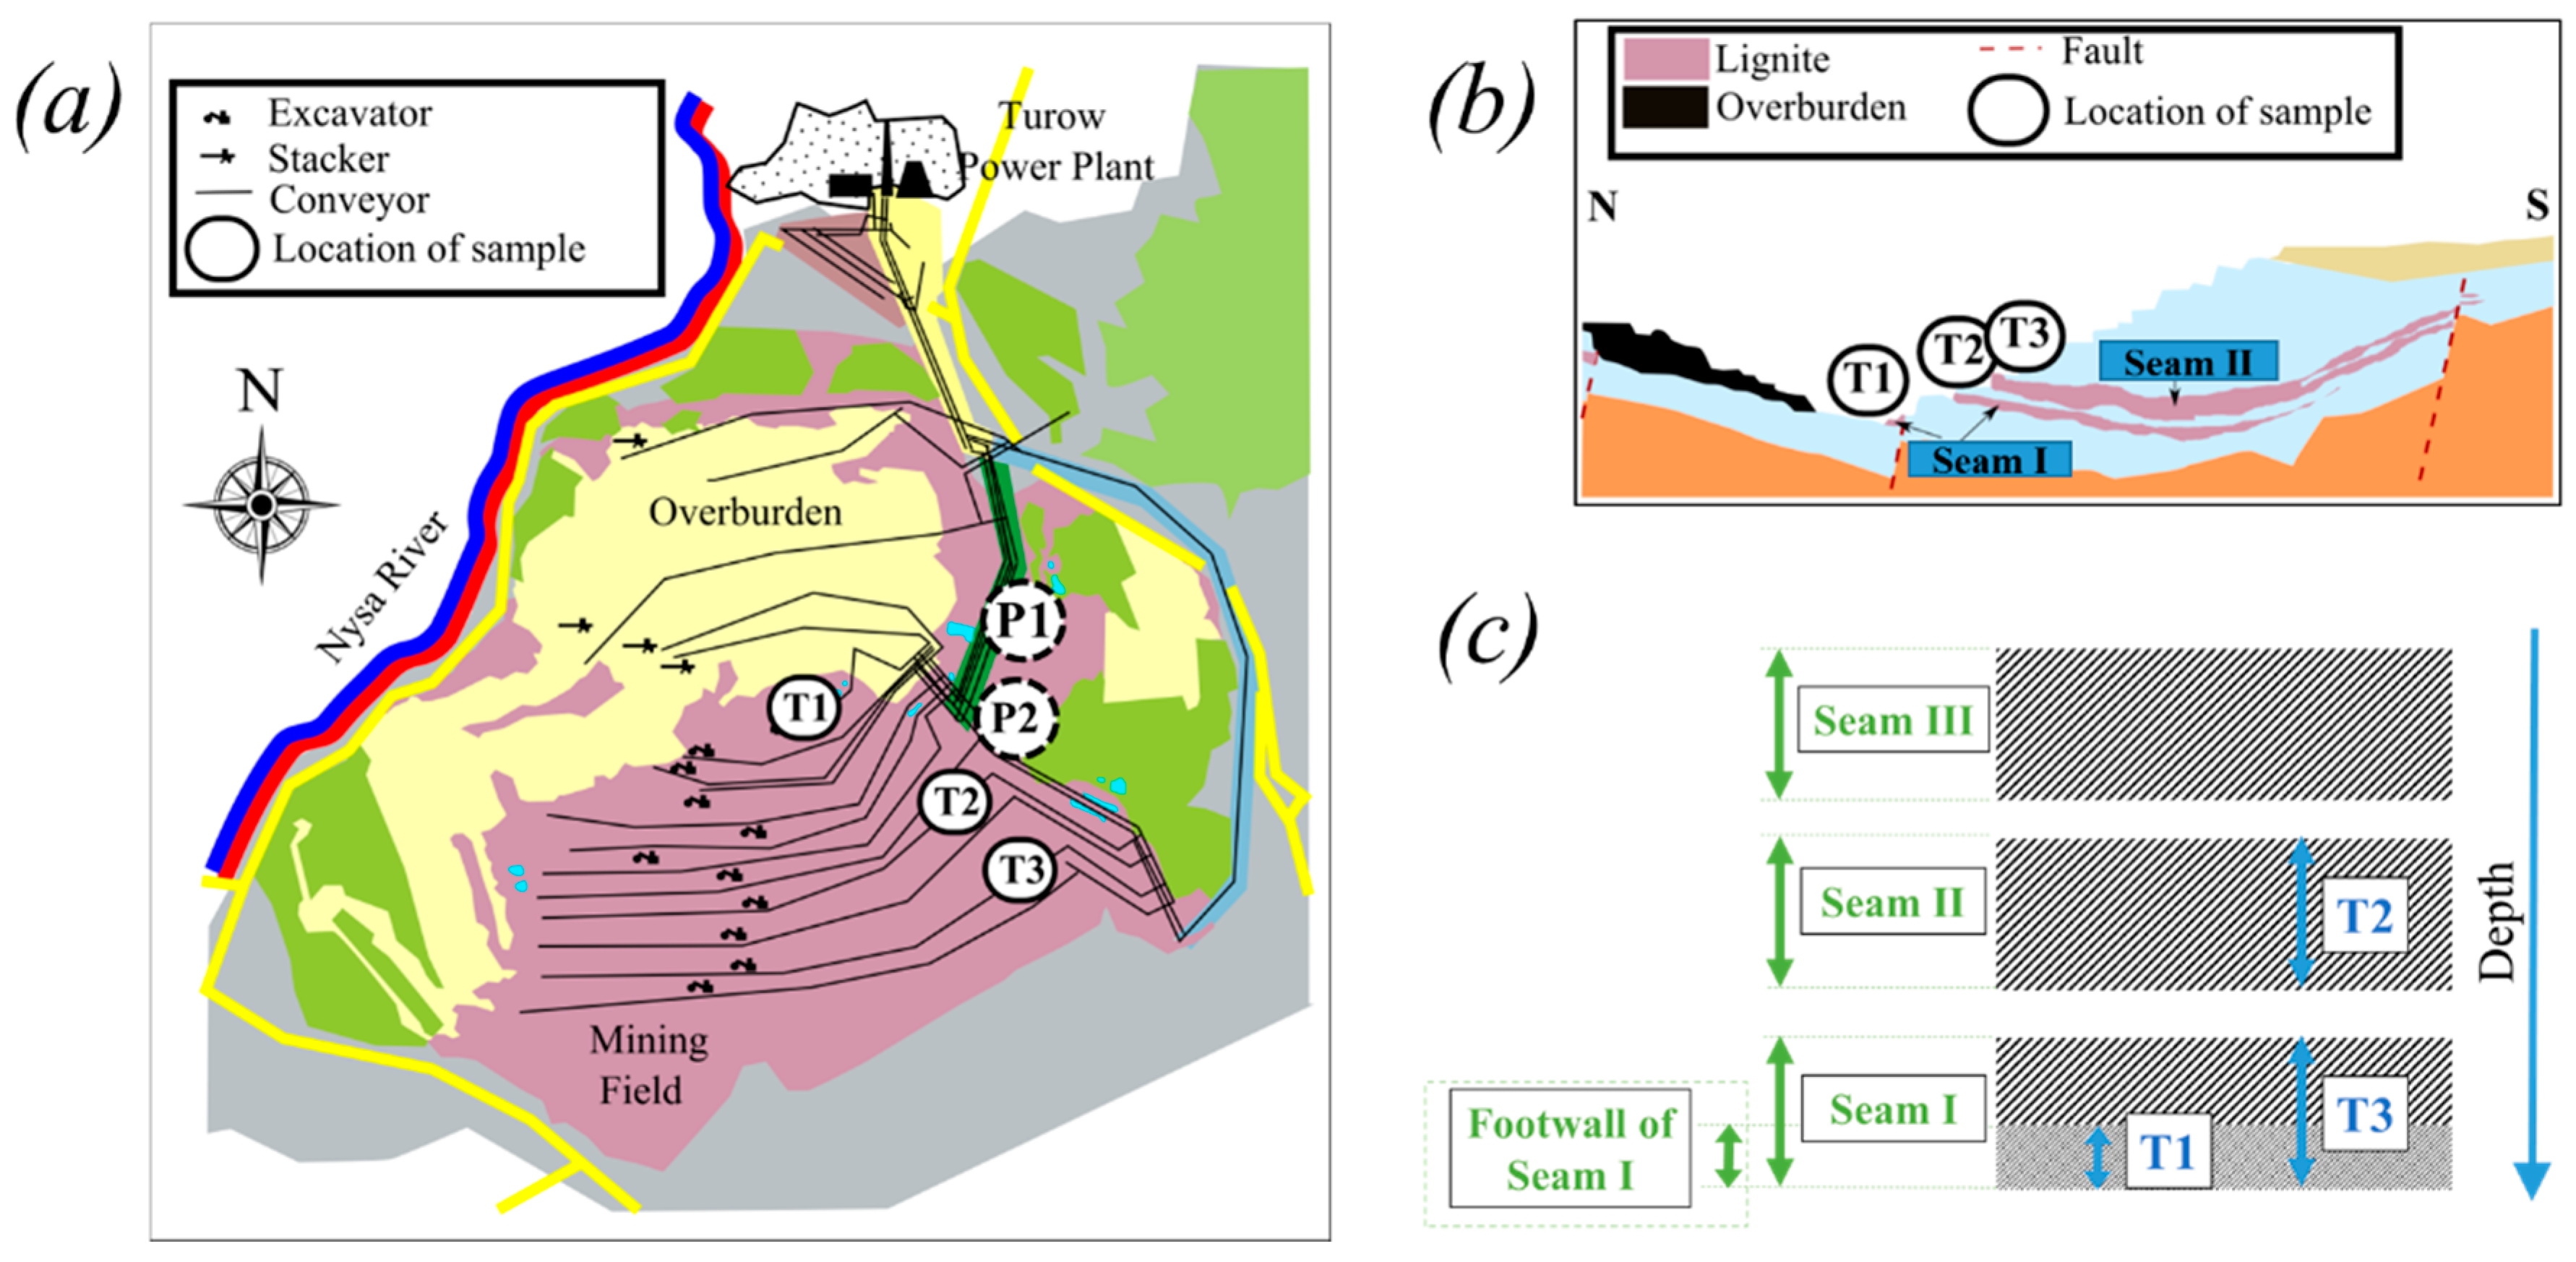
Generally, Seam I of the Turoszow deposit is uniform, highly carbonized layer of the detritic coal with thin loam insertions in the footwall part. The depth is very divergent following the morphology of the bottom layer of rocks and intensive tectonics. The thickness is in the range from 0 m at the edges to 35 m in the central part of south region; average thickness is 15 m. Between Seams I and II, loams, sands and gravels are located. Seam II, on the other hand, has the largest distribution and greatest thickness. The lignite is mostly detritic coal with thin inserts of xylitic coal; in footwall part many loam insertions and sedimentations can be found. Depth is less varied. Thickness is up to 42 m in the central part of the southern region and getting smaller toward the edges of the basin. The average thickness is 20 m [
21]. This explains the correlation observed in
Figure 12 for the variety of
WPini and compositions expressed by the wide range of density. Sample T1, as footwall of Seam I, has many particles with high density (high ash contamination) and low moisture content. Sample T3 (Seam I) has mostly detritic lignite and several contaminated particles from footwall, but other lithotype are also observed. Seam II (Sample T2) has very diversified structure and all of the types of lignite can be observed.
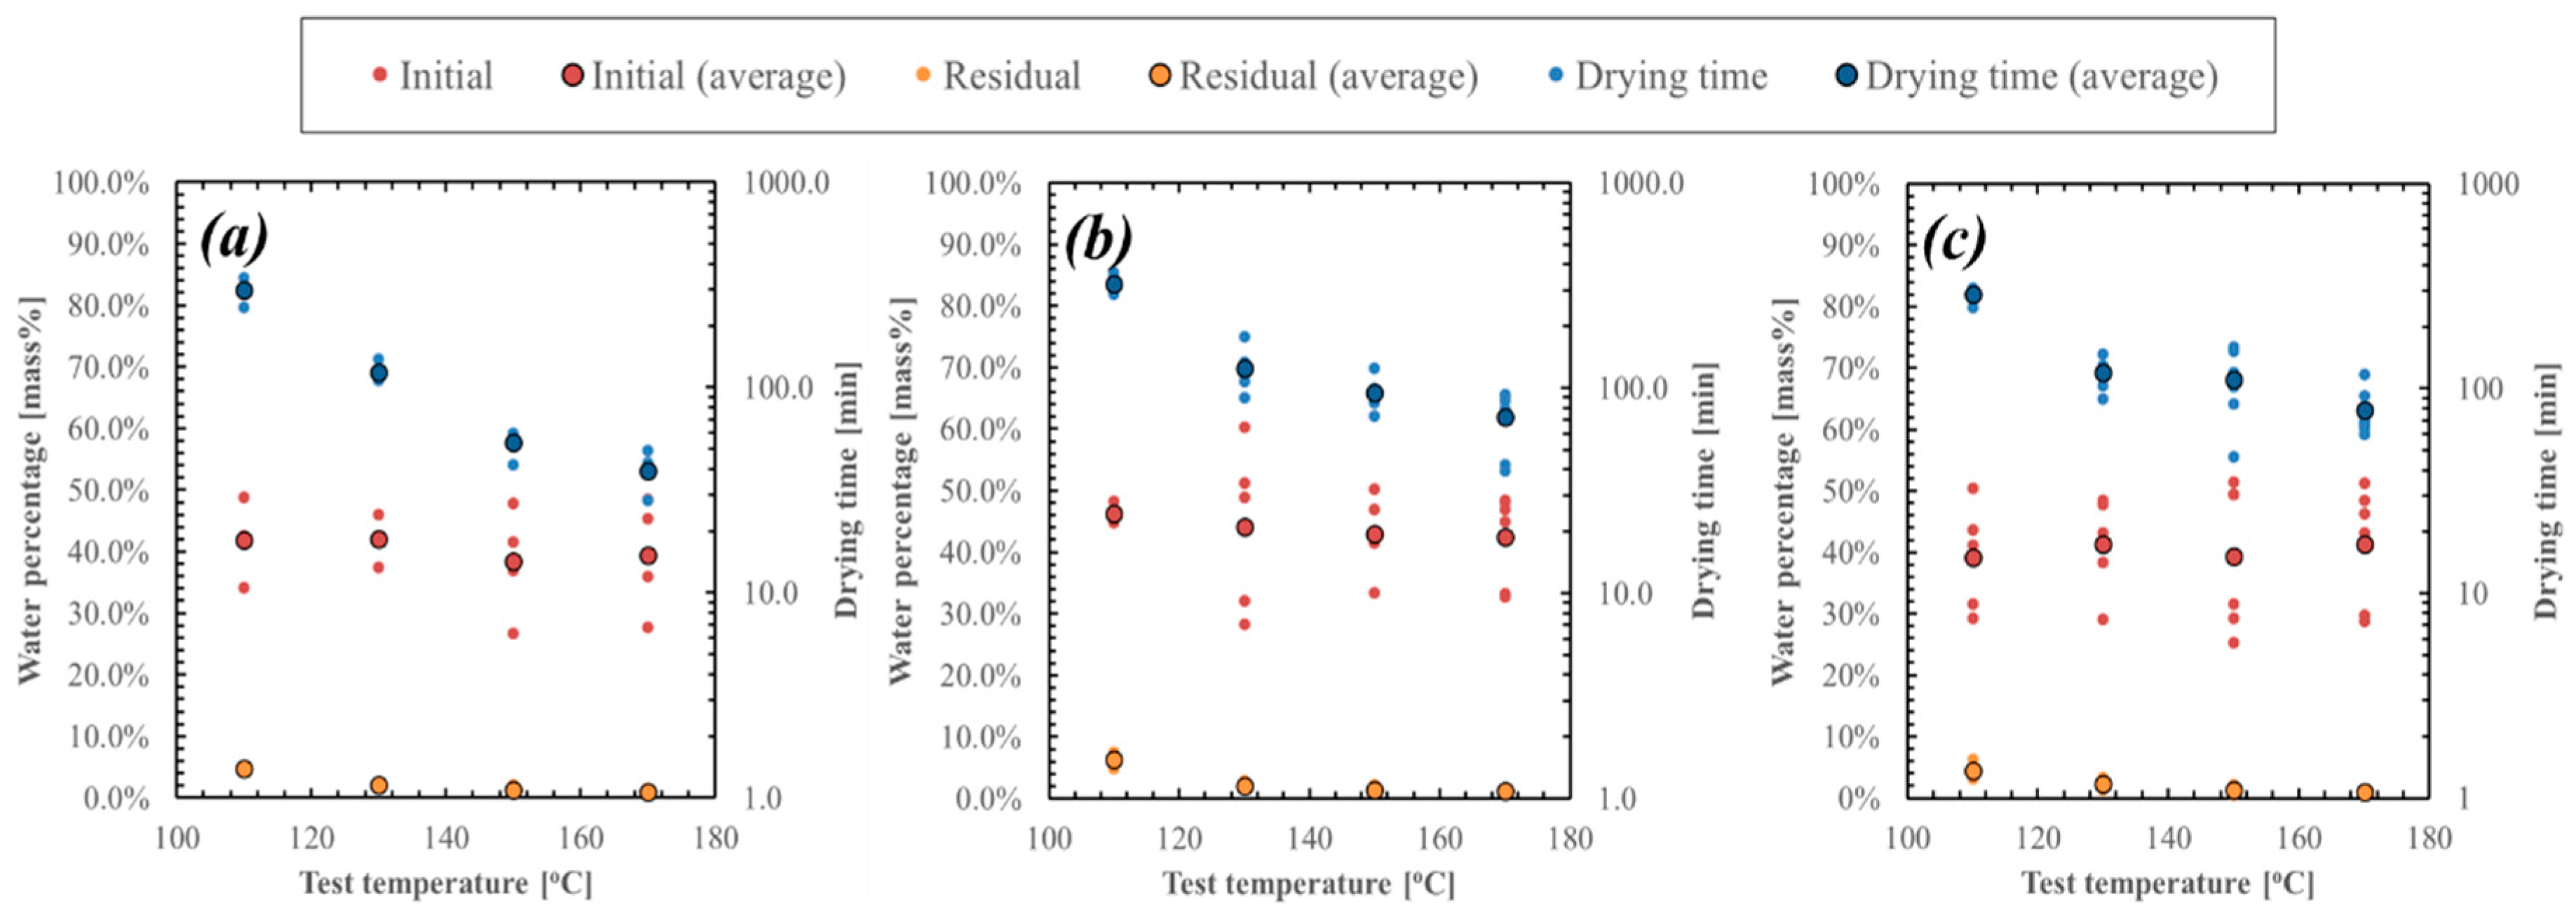
Figure 15 shows the summary of the measurements: Initial and residual
WP (
WPini and
WPres) and drying time of 10 mm lignite particle along the tested temperature at 110, 130, 150 and 170 °C for Samples T1, T2 and T3. Individual tests were characterized by the widespread
WPini, but the averaged one is more uniform among the tested samples (39%, 41% and 41% for Samples T1, T2 and T3). The averaged drying time is also similar to each other, so that their trend is exponential with the change in the tested temperature. However, their individual characteristics spread on the broad ranges. Quantification and precise evaluation must be carefully carried out for each lithotype texture of lignite. This is especially important for lignite deposit with diversified seam structure, as can be observed in the Turoszow deposit.
4.4. Evaluation of the Residual Moisture Content
The residual moisture content is defined by the equilibrium moisture content curve (isobar sorption relationship) of a product in a drying medium. This is one of the important parameters describing drying process necessary for the analysis, modeling and optimization of drying system. As the
WPini varies among various types of lignite, the residual moisture content observed in various drying condition is also different depending on the structure of lignite and steam temperature. As lignite from different sampling points, such as Samples T1, T2 and T3, exhibits analogical properties (
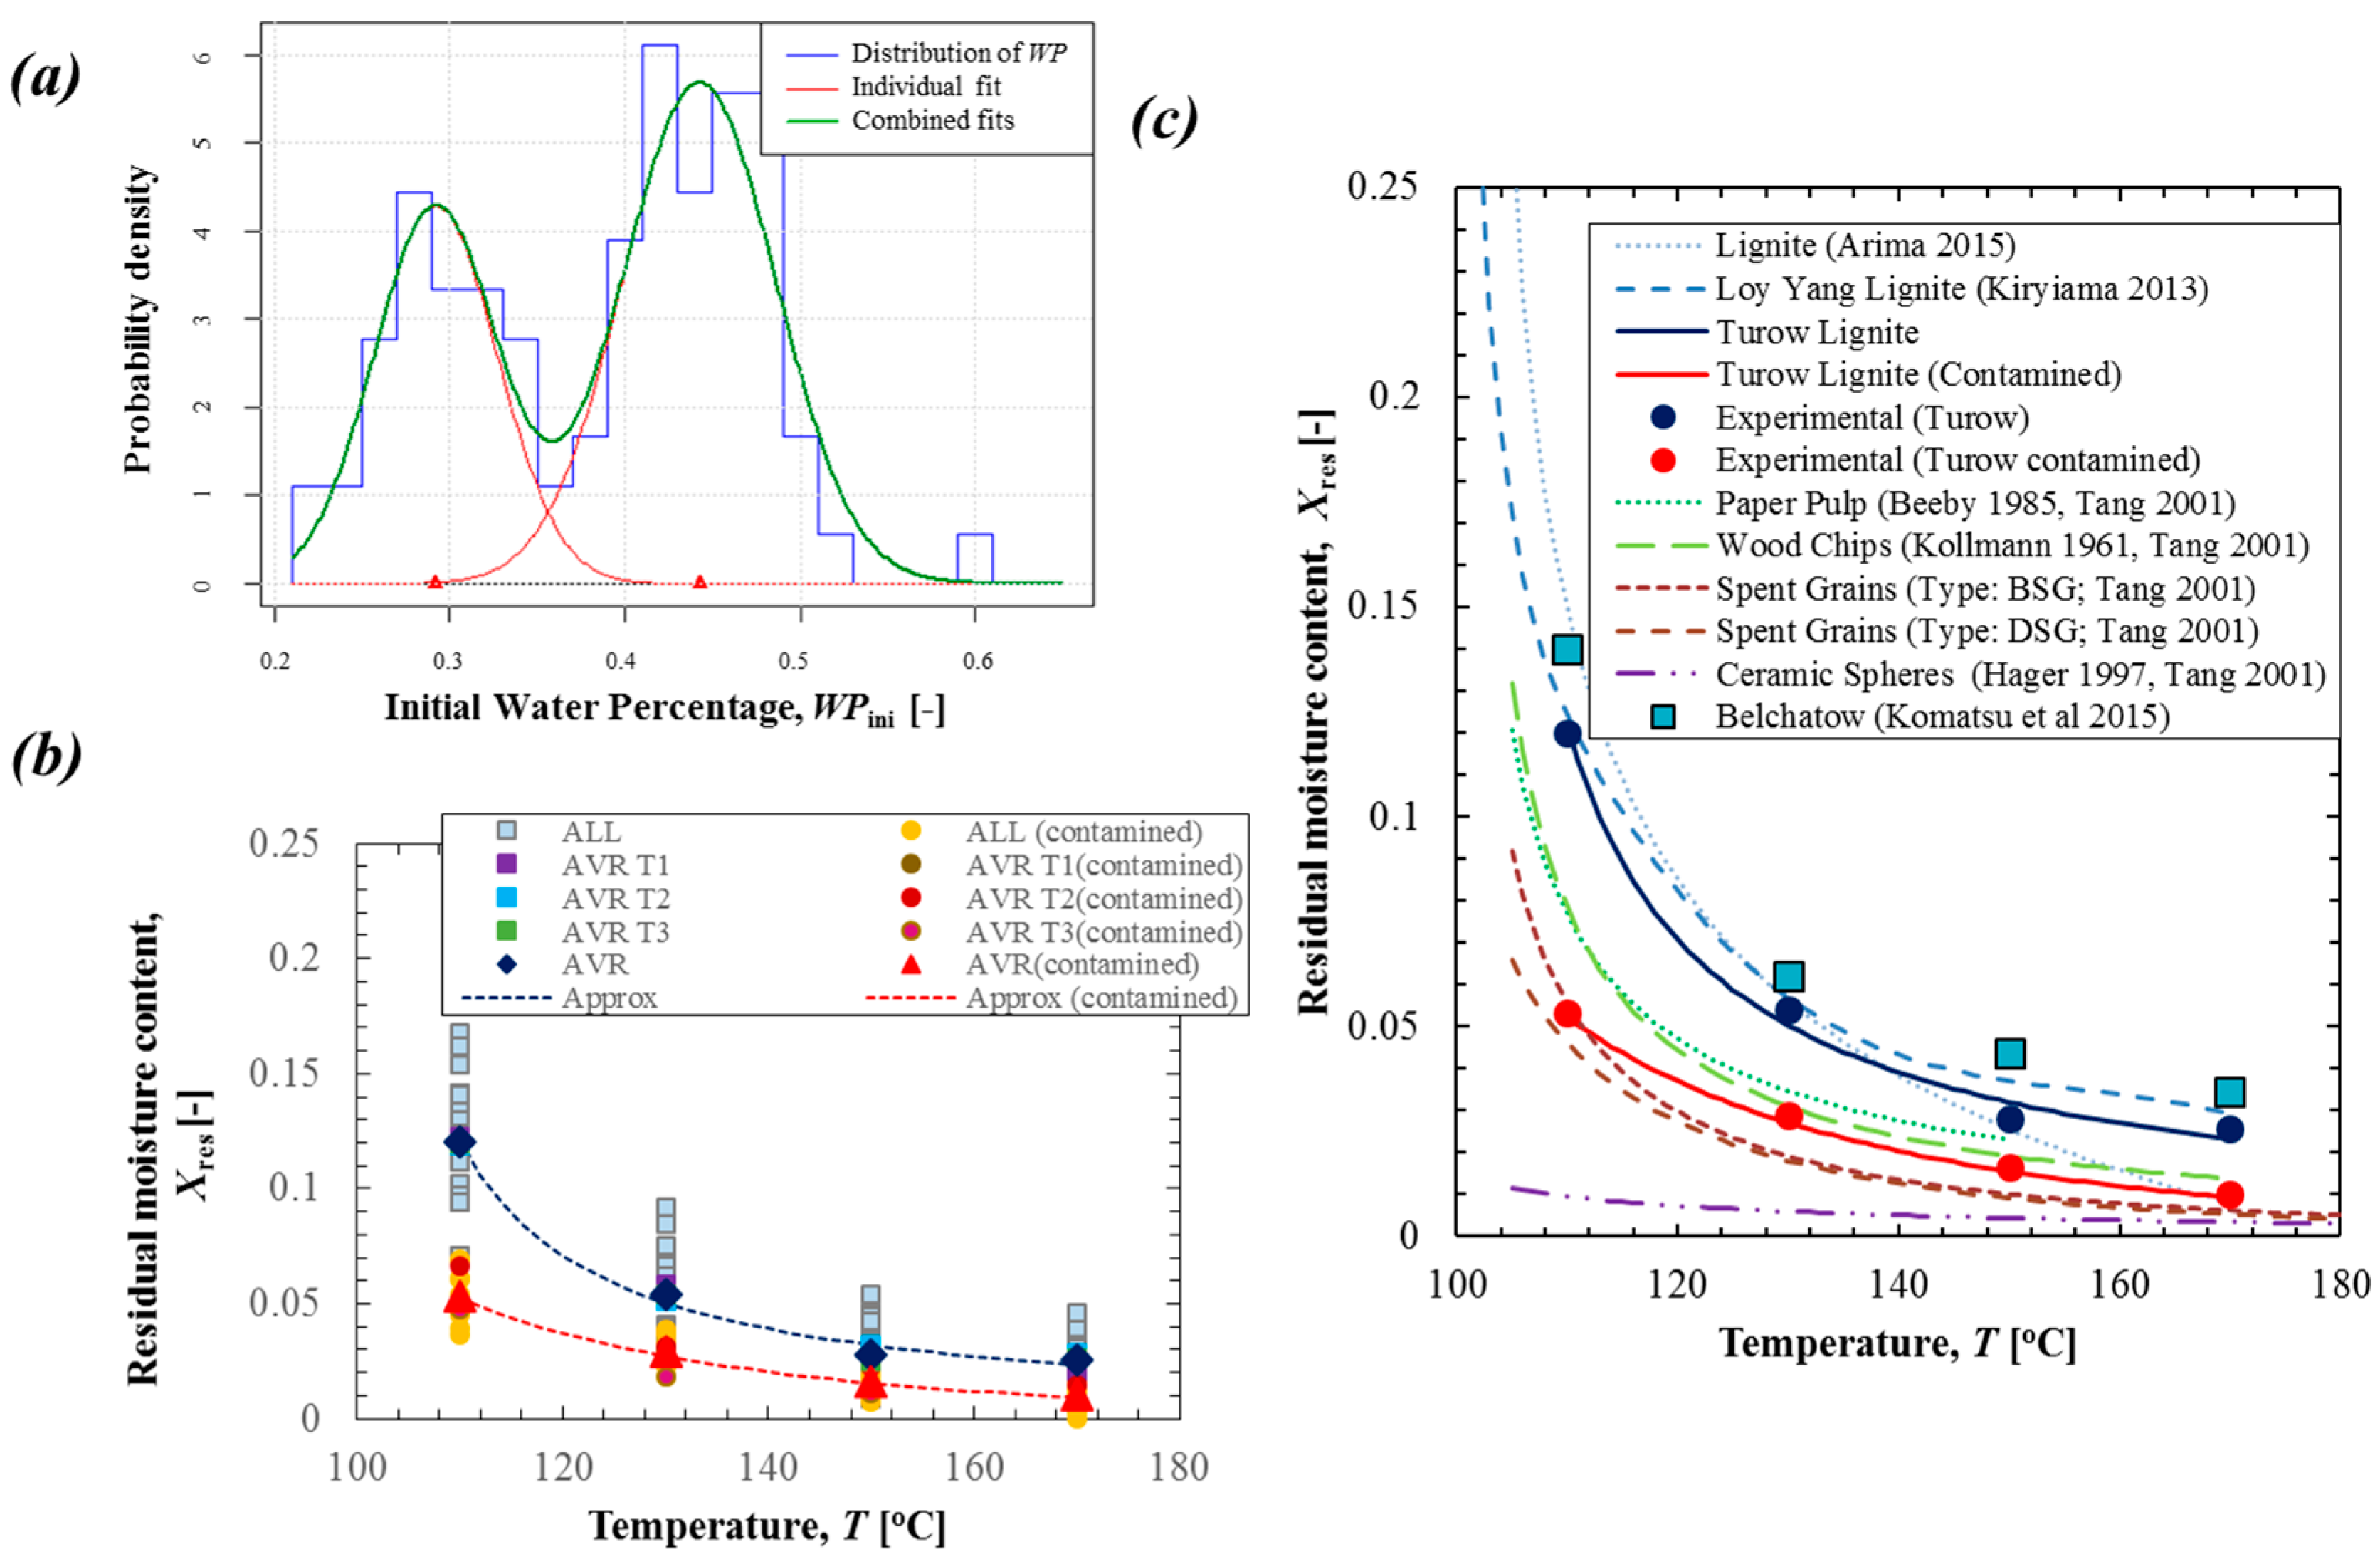
Figure 14) in the terms of distribution of initial moisture content and density, it was analyzed together and the probability density of the
WPini among all measured samples was checked. The observed distribution plotted in
Figure 16a can be described as combination of two normal distributions, with the cross section point at
WPini equals to 36%. They are identified as relatively high moisture content lignite samples (
WPini higher than 36%) and lignite samples with a high ash contamination (
WPini lower than 36%) (
Figure 14). The residual moisture content was analyzed separately for those two groups: high ash-contaminated and relatively high moisture content lignite samples. Lignite from both groups exhibits different sorption isobars as presented in
Figure 16b. The clear difference between the residual moisture content for detritic and xylitic coals pointed in
Figure 14 was not observed.
The experimental deliberation on equilibrium moisture content in various materials were presented by Tang and Cenkowski [
27]. It was suggested that description of the temperature dependence of the equilibrium moisture content
Xres can be approximated by the following class of functions:
where parameters
k,
n and
m are estimated on the basis of experimental investigation. Tang and Cenkowski [
27] compared the experimentally obtained equation for equilibrium moisture content of brewers’ spent grains with the equations for different materials derived from various experimental results [
27]. They stated that Equation (5) cannot be applied for describing the equilibrium moisture content of brown coal, as lignite has the enhanced moisture absorption capacity below 140 °C [
27]. However, in this paper, it is postulated that this type of equation describes well the observed experimental results in the steam temperature above 110 °C. Due to the moisture absorption capacity, the sorption isobar in the temperature below 110 °C has to be defined by the additional dependence as it was presented in the works of Kiriyama
et al. [
16] and Arima
et al. [
9].
The final empirical formulation estimated in this study has the following form for the lignite from the Turow deposit:
and in the case of the lignite from the Turow deposit with a high ash contamination:
The comparison of the experimental results and the approximation by Equations (6) and (7) is presented in
Figure 16b. It is visible that the residual moisture of the highly contaminated lignite (with
WPini below 36%) is around twice smaller than the low ash-contaminated lignite in all conditions and it exhibits slower increase with the decrease of steam temperature.
Another formulation to describe the equilibrium moisture content in lignite is the one proposed by Kiryiama
et al. [
16], who investigated Australian Loy Yang lignite in which the
WPini was 62%:
and by Arima
et al. [
9], who investigated brown coals with
WPini in the range of 61.3%–62.8%:
Figure 16c presents the comparison of the experimental results and approximation delivered in this study with the equilibrium moisture content of lignite proposed by the studies of Kiryiama
et al. [
16] and Arima
et al. [
9]. The empirical equation proposed by this study is superior to the other experimental correlation presented in [
9,
16,
17] in the temperature range above 110 °C and it includes and addresses the phenomenon observed in the case of lignite with high ash contamination.
Figure 16c compares additionally the equilibrium moisture content derived by Tang and Cenkowski [
27] for various materials on the basis of experimental research on ceramic spheres [
28], spent grains [
27], wood chips [
29], and paper pulp [
30]. It is noticeable that the sorption isobars of lignite are higher than for other materials, except the results for the ash-contaminated Turow lignite. The lowest equilibrium moisture content is exhibited in the case of ceramic spheres. It is correlated with non-capillary porous structure of this material. This consideration may be applied to the contaminated Turow lignite and also decrease the
Xres, where the high ash content decreases the sorption abilities. The other group of Turow lignite, which was distinguished by threshold
WPini over 36%, lies on the broad range of
WPini from 36% to 60%. The type of lithotype may differ this parameter and accordingly the residual moisture content. However, it is difficult clarify the correlation between lignite lithotype and their
WPini due to the specific physical property of this lignite. Values of the residual moisture content are divergent among the sample tested at a single condition. It is noteworthy to mention that that the averaged residual moisture content of Turow lignite is very similar to that of Loy Yang lignite, which has around 62% of
WPini. Moreover, The Belchatow lignite, which was excavated from Central Poland and has about 50%
WPini, indicated a similar value. The residual moisture content of the types of lignite resulted from the lithotypes may be influenced by structure of lignite. Particularly, porosity of sample and pore size and its distribution can be concerned, which determine the surface area of the lignite. This must be further studied since the drying process involves the destruction of pores in dewatering as the shrinkage of the samples was observed. These factors can decide the total moisture content and as a result the drying rate.


 and
and 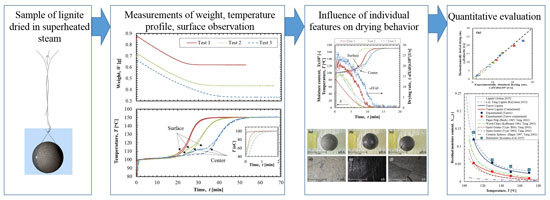


