Article

Distributed Measuring System for Predictive Diagnosis of Uninterruptible Power Supplies in Safety-Critical Applications

Dipartimento Ingegneria della Informazione-Università di Pisa, via G. Caruso 16, Pisa 56122, Italy
Energies 2016, 9(5), 327; https://doi.org/10.3390/en9050327
Submission received: 7 January 2016 / Revised: 2 April 2016 / Accepted: 21 April 2016 / Published: 28 April 2016

Abstract

:
This work proposes a scalable architecture of an Uninterruptible Power Supply (UPS) system, with predictive diagnosis capabilities, for safety critical applications. A Failure Mode and Effect Analysis (FMEA) has identified the faults occurring in the energy storage unit, based on Valve Regulated Lead-Acid batteries, and in the 3-phase high power transformers, used in switching converters and for power isolation, as the main bottlenecks for power system reliability. To address these issues, a distributed network of measuring nodes is proposed, where vibration-based mechanical stress diagnosis is implemented together with electrical (voltage, current, impedance) and thermal degradation analysis. Power system degradation is tracked through multi-channel measuring nodes with integrated digital signal processing in the transformed frequency domain, from 0.1 Hz to 1 kHz. Experimental measurements on real power systems for safety-critical applications validate the diagnostic unit.

1. Introduction

To avoid any denial of service, power supplies for safety critical applications (e.g., industrial automation, oil & gas, transport, defense) [1,2,3,4,5,6,7,8,9], need continuous monitoring to predict possible faults. Power supply systems, particularly for power levels of hundreds of kVA or above, are made of a complex interconnection of several cabinets. Each cabinet contains multi-phase switching power converters (AC/DC, DC/DC, DC/AC, AC/AC), or power isolation transformers, or energy storage modules based on back-up battery units for UPS service. Safety regulations, and the high economical cost of a denial of service, require that the power supply system should be continuously working. Maintenance operations should be limited to the “ordinary maintenance”, synchronized and timely scheduled with the maintenance of the whole system.
A failure mode and effect analysis (FMEA) [10,11] study, carried out on real-world power supply systems for oil & gas and transport, provided by an industrial partner, CEG Elettronica (Bibbiena, Arezzo, Italy), proved that the key blocks to be monitored for fault diagnosis are:
-
Multi-phase power transformers, used in UPS for power conversion and for isolation [12,13].
-
Battery modules, used for energy back-up in the UPS system [14,15,16].
At the state-of-the-art, high reliability designs are often based on redundant system architectures and on components with a high mean time before failure (MTBF). However, components with high MTBF are expensive devices, and high redundant architectures lead to systems with increased size, weight and cost.
This work presents first a scalable architecture for UPS systems and then, to achieve predictive diagnosis capability, a distributed network of measuring and processing nodes. For each cabinet forming the UPS system, they acquire a multi-dimensional “image” of the vibrations, and of the electrical (voltage, current and impedance) characteristics of the module under analysis: power transformers or batteries. Local signal processing is carried out in the frequency-transformed domain to track the life-cycle degradation of such “images” that are correlated to the structural degradation of the power system components. Temperature conditions are also measured to check thermal faults. A controller area network (CAN) interconnects all the acquisition and signal processing nodes with a central unit acting as supervisor. Wireless networking is also available thus increasing the scalability and flexibility of the proposed diagnostic equipment. Thousands of experimental tests have been carried out on real power supply systems to validate the performance of the new diagnostic instrumentation.
In the rest of the paper, Section 2 presents a critical analysis of the state-of-the-art for UPS predictive diagnosis and highlights the main contribution of the proposed work. Section 3 proposes a new architecture for an UPS system in safety-critical applications, with a description of its key building blocks, and of the distributed network of measuring nodes for diagnosis of the energy storage unit and of the power transformers. With reference to the energy storage unit, Section 4 discusses the measuring approach for the diagnosis of battery modules degradation. Section 5 discusses the theory of vibration measurement to check the degradation of power transformers and highlights the specifications for the design of the relevant predictive diagnostic unit. Section 6 presents a hardware-software realization of the new instrument. Section 7 shows experimental measurements carried out on components (power transformers and battery modules) of real-world UPS systems. Section 8 draws some conclusions.

2. Critical Analysis of the State-of-the-Art for UPS Predictive Diagnosis

Most state-of-the-art works in the predictive diagnosis field just address a single type of component of an UPS system, e.g., only power transformers in [7,8,17,18,19,20,21,22,23,24,25,26,27,28,29,30,31,32,33,34,35,36,37,38,39,40,41] or only battery modules for energy storage in [14,15,16,42,43,44,45,46,47]. A comprehensive system solution for UPS predictive diagnosis is still missing.
Moreover, known works often address only some types of faults: e.g., [32,33,34,35,36,37,38,39,40,41] address only electrical and thermal faults, whereas [23,28,31] address only mechanical faults through visual inspection or acoustic analysis. For diagnosis of power transformers just the measurement of some electrical parameters is foreseen in state-of-the-art such as in [34,35,39], which measure the primary or secondary currents or their ratio, or in [36], which measures the insulation dielectric losses, or in [40,41], which measure no-load power losses, or in [33], which measures the stray reactance variations. Some techniques, such as those proposed in [31,40,41], cannot be implemented when the device under test (DUT) is working, but they require to switch-off the power system and to analyze the DUT in special test conditions. However, this will increase the denial of service statistics of the power system.
In [23,28,31] acoustic measurements of vibrations are proposed for the diagnosis of mechanical degradation of components, but they are done in a controlled laboratory environment and not in the real operating one. As demonstrated in Section 5 by our test campaign with acoustic acquisition systems, the noise level of the real operating environment (industrial, railway) is high. Therefore, an acoustic diagnostic system directly operating in the real working environment typically leads to a too high rate of missed detections and/or false alarms.
Recent works [17,18,19,20,21,22,23,24,25] exploit vibration measurements for mechanical fault diagnosis of power transformers, but they use a large set of sensors, e.g., at least 10 in [17,18,19], 15 in [22], or 40 in [21] for each transformer. Recent works on power transformer analysis [17,18,19,20,21,22,23,24,25], and battery analysis [45,46,47], adopt computation intensive probabilistic algorithms, not implementable in low-cost embedded computing systems. Moreover, the above works usually follow a centralised approach instead of a distributed networking approach as in this paper. Using lots of sensors, with complex processing algorithms needing dedicated workstations, and exploiting a centralized solution, leads to:
-
An increase of the cost and the size of the diagnostic system.
-
Poor system scalability with an increase of the effort for its installation and maintenance.
As a result, the above systems are often limited to stand-alone and off-line use. As an example, in [22] data from the sensors are acquired and then processed off-line, for each device under test, on a dedicated workstation.
To overcome the above issues, as it will be detailed in Section 3, Section 4, Section 5, Section 6 and Section 7, this work proposes a distributed network of acquisition nodes with integrated signal-processing capability. These nodes allow monitoring complex power systems by revealing the mechanical (vibration), electrical and thermal degradations of both power transformers and energy storage unit. For the mechanical degradation three accelerometers are used in this work for each measuring node, thus reducing cost and complexity vs. known works as [21] using a number of sensors ten times higher.
Main features of the proposed solution are its scalability and easy adaptability to the power supply size and physical placement of sensors. As it will be demonstrated by experimental measurements in the next sections, the system capability to detect degradations is not affected by changes of the operating conditions of the components under test or of the sensors placement. It is simple to install and its cost is negligible if compared to the cost of the DUT, since few sensors are used. By operating in real-time, while the power system is working, denial of service is avoided.
This work extends the author’s previous contributions in [7,8], which are limited to vibration analysis of transformers only. Instead, in this work the whole power system is considered by monitoring and analyzing both the power transformers and the energy storage unit (Section 4, Section 6 and Section 7.2) against faults due to mechanical, electrical or thermal degradations. Moreover, the new scalable architecture of UPS systems with predictive diagnostic capability, described in this work in Section 3, is new vs. [7,8]. The hardware-software embedded realization of the innovative diagnostic node addressing thermal, electrical and mechanical measurements for any type of faults in power transformer or energy storage units, proposed in Section 6, is new vs. [7,8]. In previous works, the diagnostic node architecture is limited to acceleration measurements for power transformer mechanical degradation only. Furthermore, the analysis of power transformers in [7,8] is limited to a preliminary study, whereas in Section 7 of this work it is enriched with more experimental measurements in different conditions.

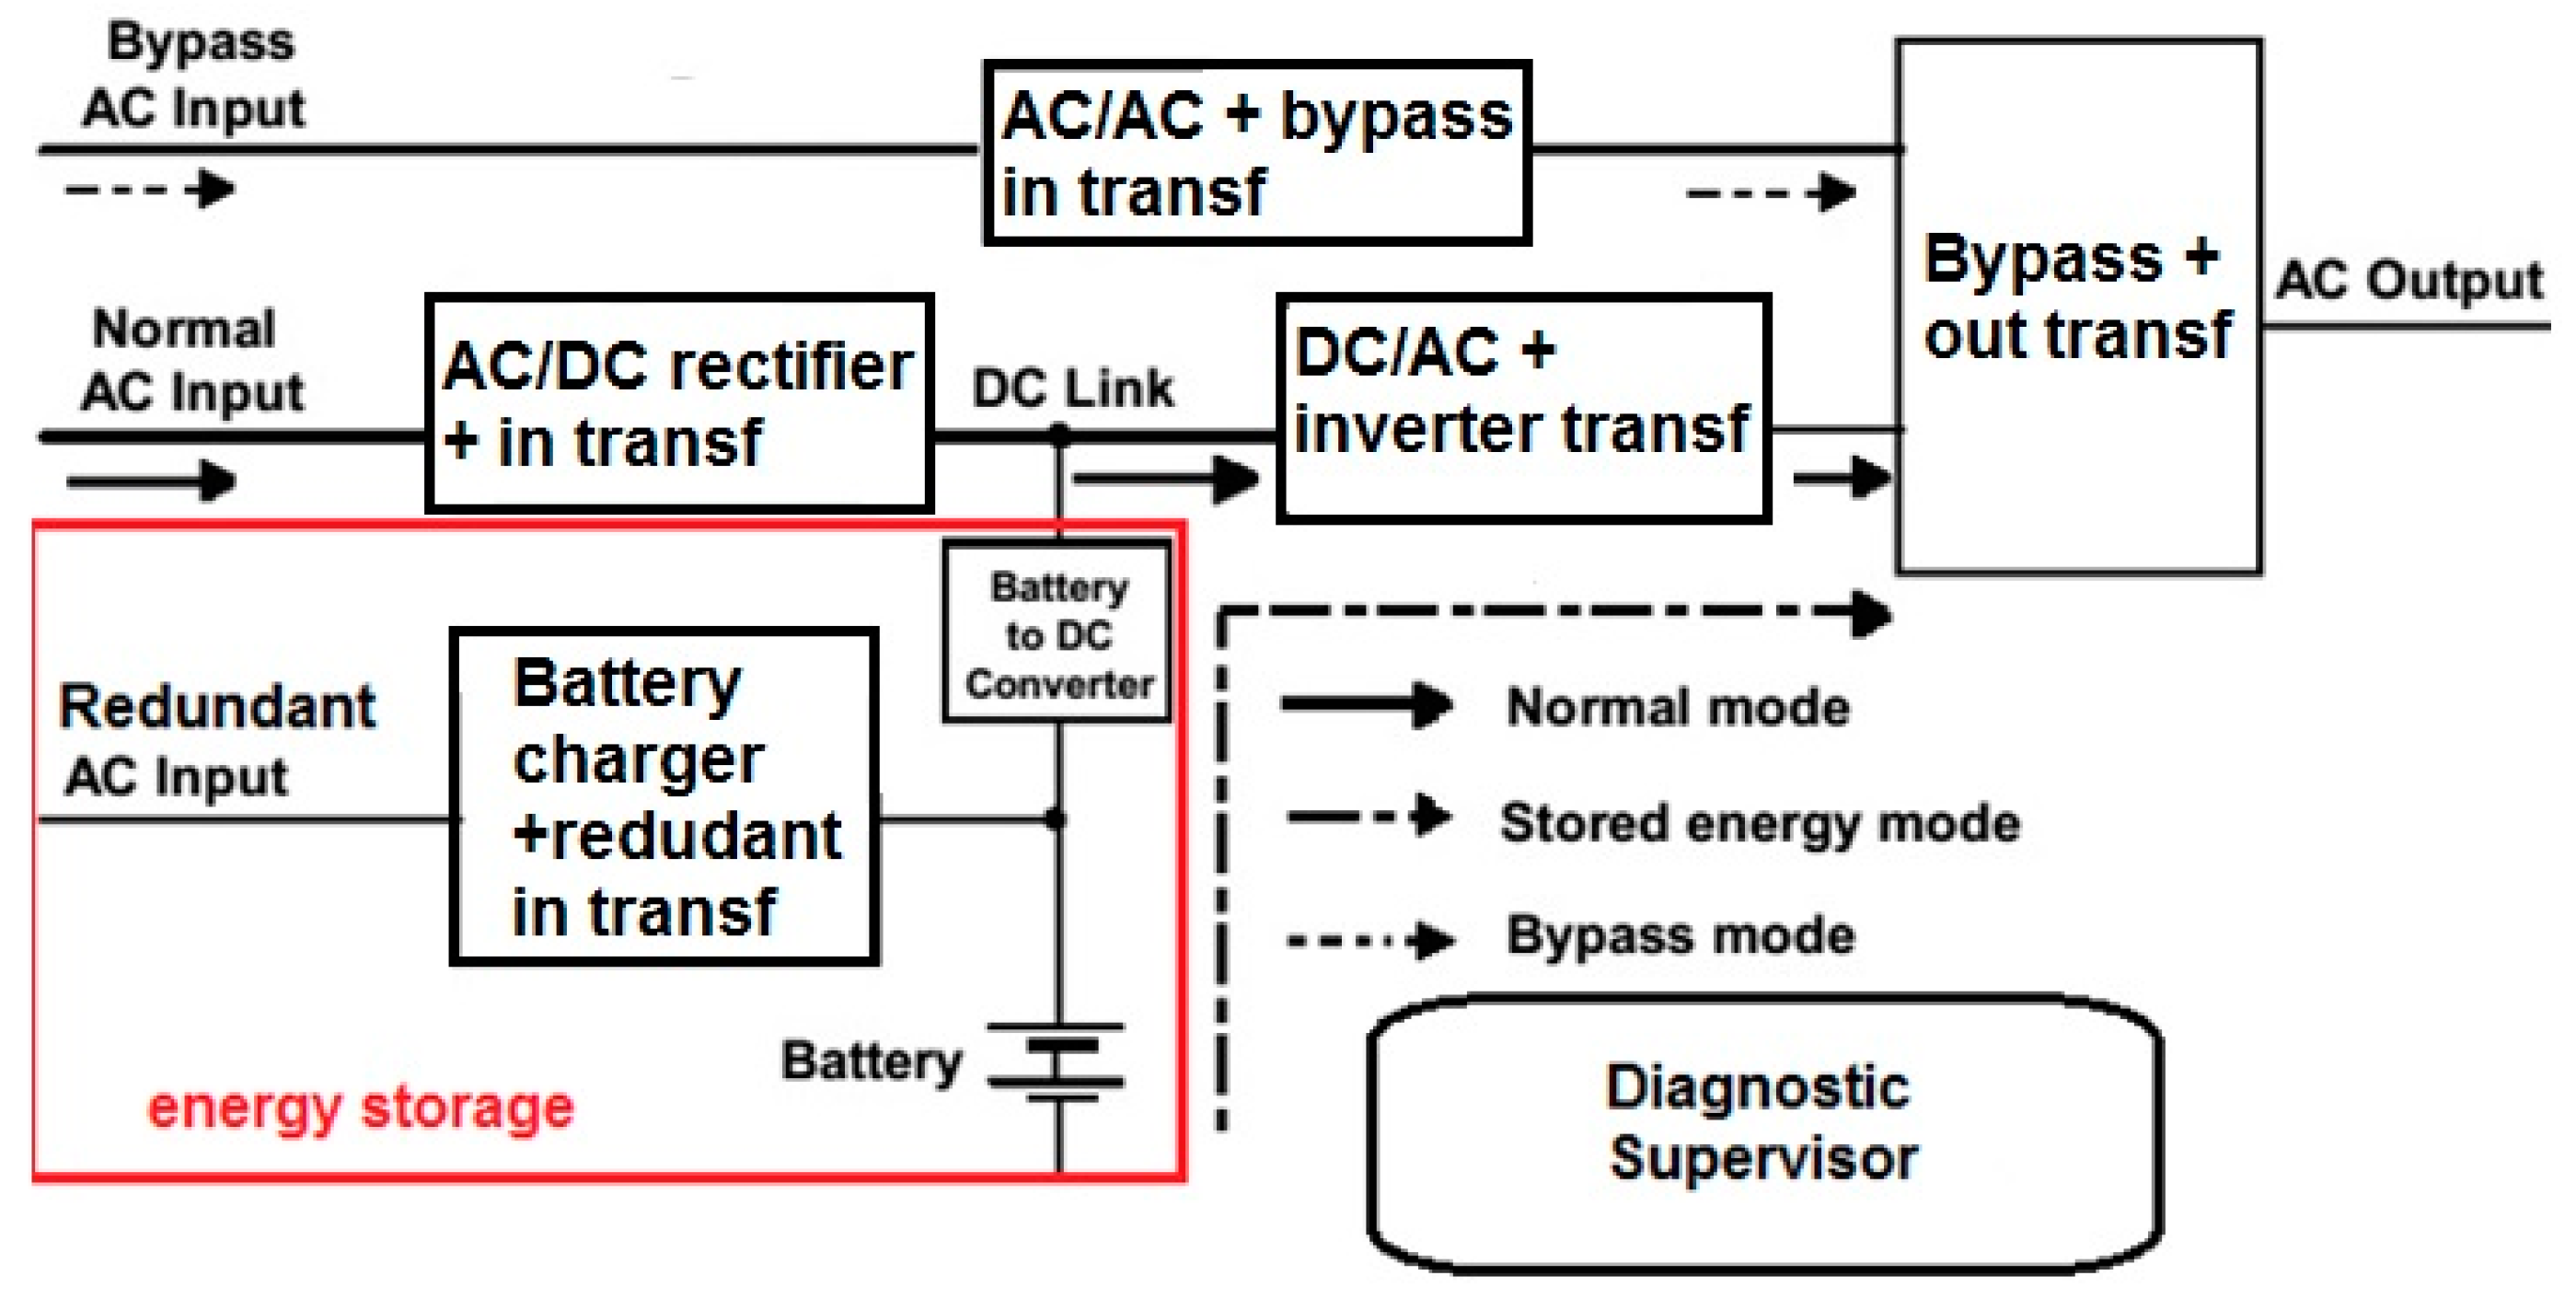
3. Innovative Power Supply System for Safety-Critical Applications

The UPS architecture in Figure 1 is scalable in terms of sustained currents and voltages, ranging from 10 kVA up to 150 kVA. These values cover small and large size installations in transport, industrial automation, oil & gas applications [12,13]. Table 1 summarizes the main parameters of the scalable UPS and of some of its key blocks, the AC/DC rectifier and the DC/AC inverter blocks.
For the functional blocks in Figure 1, the possible positioning of power transformers in the UPS scheme is also highlighted: input power transformers (in transf in Figure 1), inverter transformer, and output transformer (out transf in Figure 1). A detailed study concerning the optimal positions and combinations of power transformers in UPS systems is beyond the scope of this paper, and has already been discussed in [48]. The effective combination of power transformers, to be used for a specific UPS installation, depends on several parameters: the performance to be achieved, the target level of redundancy, the budget in terms of size, weight and cost. The main advantages obtained by using power transformers in UPS systems are the isolation provided between output and source, the voltage change obtained by proper sizing the transformer ratio, the impedance they provide that limits fault currents or acts as noise filter, their blocking effect against the 3rd, 9th, 15th, and other multiples-of-three harmonic currents.
The proposed UPS can be powered through a DC/AC converter, in case the power supply line is fed from a DC high voltage power line. If the power supply line is fed from an AC high voltage national power line, then a separation transformer is present. The output of one of these AC sources is the “normal AC input” in the core of the UPS in Figure 1. An emergency generator (EG), converting the thermal and mechanical energy produced by an internal combustion engine to electrical AC energy can also supply the UPS. It represents the “bypass AC input” in Figure 1 with a by-pass switch and an AC/AC regulation. The EG source and the static UPS are functionally independent. Therefore, the two installations can be also separated geographically. In Figure 1 an inverter is connected in series between the normal AC input and the load at the output. The power for the load flows continuously through the inverter.
In Figure 1 the UPS operating modes are 3: “normal”, “stored energy” and “bypass”. In normal mode, the load is supplied by a rectifier-inverter combination, which carries out the double conversion: first AC/DC and then DC/AC. The UPS goes into stored energy mode when the AC input fails or goes out of the specified tolerance range. In this case the load receives power, and hence energy, from the battery modules through the inverter. When the stored energy is exhausted or the AC input returns to the specified tolerance level the UPS stops the stored energy mode. This type of UPS is equipped with a static bypass switch, allowing instantaneous transfer of the load to the bypass AC input. This switch is used in the event of UPS internal malfunction, load current transients (in-rush, or fault clearing), prolonged overloads, or at the end of battery back-up (autonomy time). The presence of a bypass implies that the input and output frequencies and phase must be identical, and the voltage coordinated. The UPS is synchronized with the source of AC bypass supply to allow a transfer to bypass without any interruption.
To increase the safety integrity level, a redundant AC input to a battery recharger is foreseen. In case of failure of the normal AC input, and of the bypass AC input, is the battery unit that provides the required power levels to the load. However, with a failure of the normal AC input and without the redundant AC input to the battery recharger, the battery system would be not recharged. As consequence, the battery system will be exhausted (and the UPS will lost its function) in a period depending on the amount of battery cells. With reference to Figure 1 and Figure 2, the key building blocks of the proposed UPS are:
-
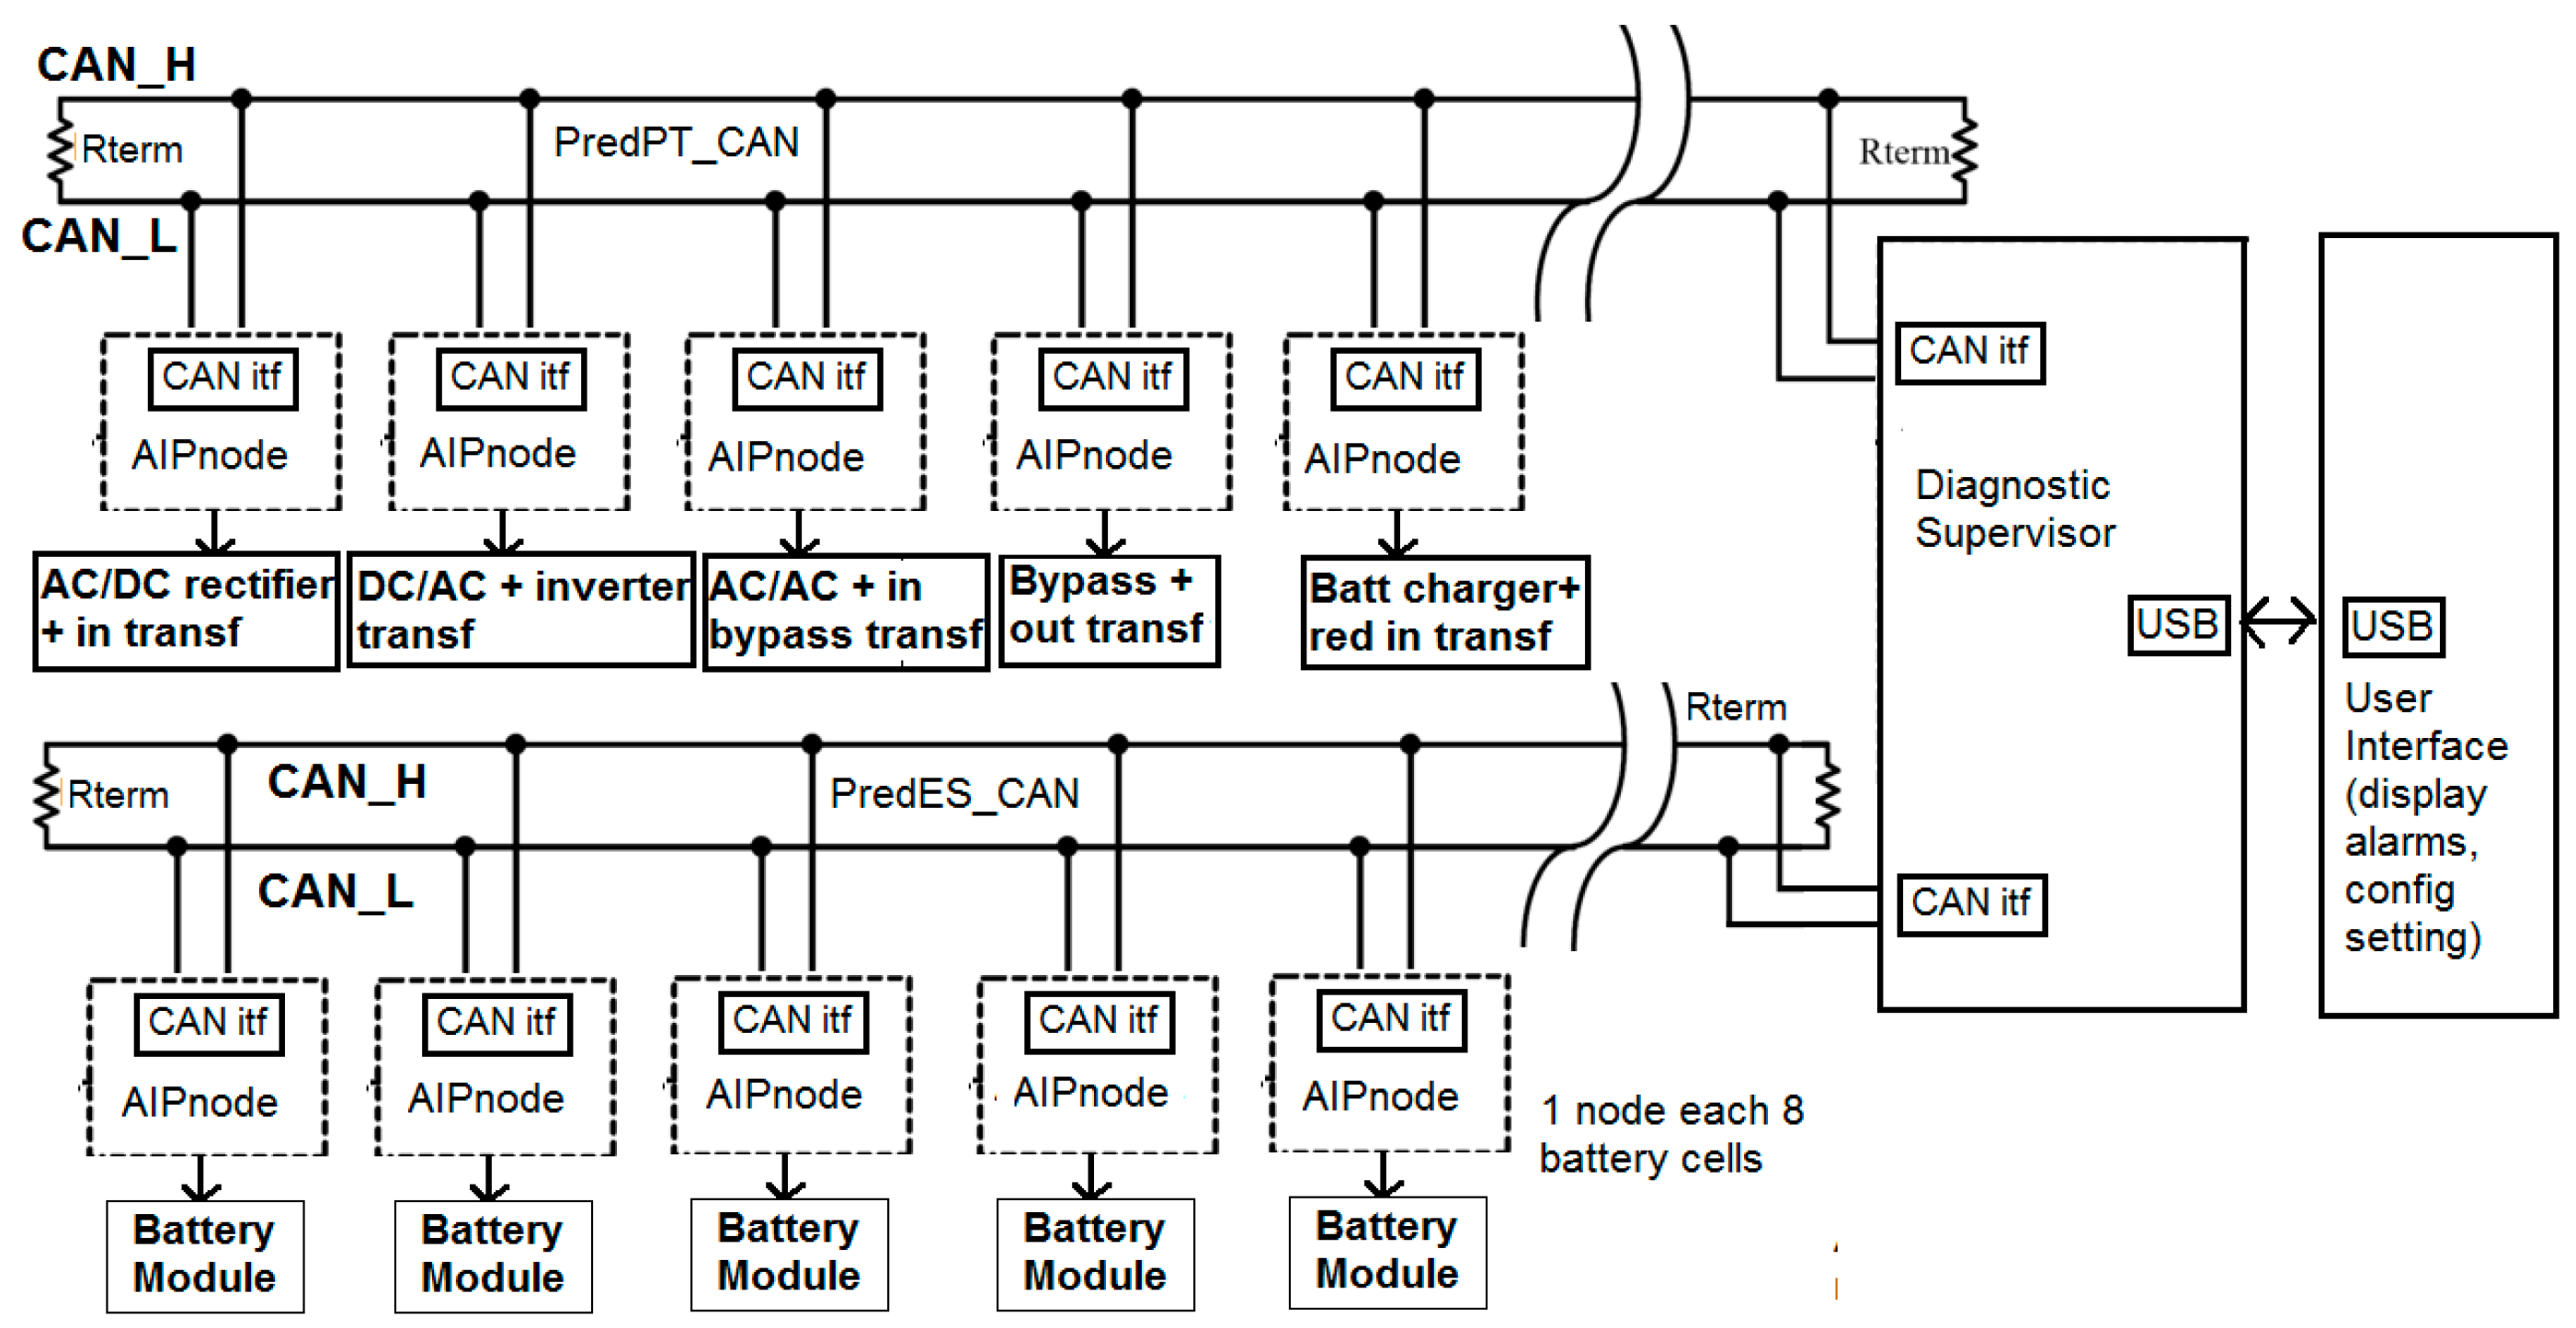
AC/DC rectifier stage plus input transformer. This unit converts the AC voltage of the line to a DC voltage used to charge the batteries and to feed the following DC/AC inverter. The rectifier is realized through a 6-branch 3-phase silicon controlled rectifier (SCR) bridge and is sized to supply simultaneously the inverter, in conditions of maximum load, and the battery at the maximum charging current. To reduce the distortion produced by the network rectifier and the ripple to the battery, an isolation and voltage adaptation transformer is used, together with inductors placed at the exit of the bridge conversion.
-
Energy storage. The energy storage unit is organized as a complex array of valve regulated lead acid (VRLA) rechargeable cells. This technology is used due to its low purchase cost and low maintenance cost/effort vs. other battery technologies. Thanks to the autonomy of the energy storage subsystem, a static UPS reduces the carbon emissions related to operating an EG. The latter converts in electric energy the mechanical energy produced with an internal combustion engine. During a brief power outage, the VRLA cells provide current to the load, eliminating the need to start the EG. Battery modules with high capacity lead to a reduced number of EG starts per year. This way the fuel consumption, the CO2/NOx emissions and the warm-up and cooldown phases of the EG, are reduced.
-
DC/AC stage with inverter transformer. The inverter converts the DC voltage Vdc supplied by the AC/DC rectifier or from the battery into AC voltage, stabilized in terms of frequency and in terms of amplitude. The inverter output voltage is generated through a switching strategy with pulse width modulation (PWM) driving insulated gate bipolar transistor (IGBT) power devices. The use of a high carrier frequency for the PWM, and of a dedicated filter circuit constituted by the AC transformer and capacitors, ensures minimal distortion of the output voltage. A THD lower than 2% can be achieved (1.5% with a linear load in Table 1). As discussed in [48], if input and output transformers are both present, then the inverter transformer is redundant.
-
Bypass stage with AC/AC regulation and Bypass Switch. In normal operating mode, the inverter guarantees the power distribution. In case of malfunction or overload in the inverter, the bypass line supplies the load, through the main static switch. The possibility of a manual bypass is also foreseen. A 3-phase voltage stabilizer maintains the nominal value of the output voltage within a 2% compared to a variation of the input voltage range between ± 10% of the nominal value of the line.
-
Diagnostic supervisor. This block in Figure 1 and Figure 2, is in charge of managing for the UPS the testing and periodic checks, ensuring the operation of the equipment and generating alarms in case of anomalies. This block implements a predictive diagnostic strategy that exploits the network (see Figure 2) of monitoring units for faults in the battery modules and faults in the power transformers.
Indeed, the diagnostic system is organized as a distributed network of acquisition nodes with integrated signal processing capability (AIP nodes in Figure 2), monitoring thermal, electrical (voltage, current, impedance) and mechanical (vibrations) degradations in the power transformers and in the battery modules, which an FMEA study has determined as the main bottlenecks for reliability of the UPS in Figure 1.
The distributed monitoring system is partitioned in two CAN sub-networks: PredES_CAN, dedicated to the monitoring of degradation in the Energy Storage system, and particularly of the Battery modules, according to the specifications discussed in Section 4, and PredPT_CAN, dedicated to the monitoring of power transformers degradation according to the specifications discussed in Section 5. Details of the implementation of the AIP nodes and of the network are discussed in Section 6. The CAN technology is used for interconnections, since it is the de facto standard for networking in harsh environment applications, such as industrial or railway. It can ensure communication rates of 1 Mbps at tens of meters and 500 kbps for connection distances of 100 m [49]. The two CAN networks in Figure 2 have multi-drop topology with differential (CAN_H, CAN_L) signal transmission and proper impedance termination (Rterm component in Figure 2).
As it will be discussed in Section 6, one AIP node is used for each eight battery cells. For the target applications of this work, a string of battery cells may contain more than 190 units to provide the nominal 380 Vdc with 2 V cells (minimum 307 V is accepted in Table 1, when the cells are degraded at 1.6 V due to temperature or ageing). Therefore, more than 24 AIP nodes are needed for each string. The number of strings working in parallel in the energy storage unit depends on the desired autonomy. Typically, at least two or three strings have to be used and hence the number of nodes in the PredES_CAN network can be higher than 50. Instead, the complexity of the PredPT_CAN network is limited to less than 10 nodes. The information acquired by the two networks PredPT_CAN and PredES_CAN are managed by the diagnostic supervisor, which is connected to a user interface terminal (e.g., through a CAN or a standard USB connection) to display the generated alarms, and to receive configuration settings from the UPS user. Further details of the networked diagnostic systems are discussed in Section 4 and Section 5, which present the main degradation causes of batteries and power transformers and the specifications for their monitoring, and in Section 6, which discusses hardware-software implementation details. Experimental validation of a prototype of the proposed diagnostic system, for real-world UPS systems, is discussed in Section 7.

4. Battery Degradation and Specifications for the Monitoring System

The core of the UPS is the energy storage unit based on VRLA rechargeable cells, which are connected in series to form strings. The number of cells in a string depends on the voltage level to achieve. Multiple strings can be connected in parallel to increase the overall current capacity. As example, considering the MARATHON L 2V 425 Ah basic cell, up to 155 cells in series are required to sustain the minimum 307 V DC input of the DC/AC IGBT-based inverter (see Table 1). Considering a worst case where the minimum inverter input voltage has to be guaranteed also with cells discharged at 1.6 V, then 190 VRLA cells per string have to be used. Connecting in parallel 3 strings ensure a 1275 Ah capacity. In such case a 50 A load can be supplied for more than 1 day even in case of faults of both “nominal AC input” and “bypass AC input” in Figure 1.
VRLA is a consolidated battery technology and is preferred to emerging lithium-based technology due its higher maturity, reduced cost, reduced maintenance and enhanced robustness for temperatures higher than 60 °C [14]. Lithium battery (lithium-polimery, lithium-gel, LiFeSO4, etc.) cells allow for higher (roughly by a factor of 3) energy-density (Wh/kg) and power-density (W/kg). This may be mandatory for applications where the weight is a key issue, such as portable devices (laptops, tablets, smartphones) or electric vehicles, but it is less critical when a static UPS is supplying an industrial plant, turbomachinery for oil & gas or railway infrastructure. In such cases, dominant factors are the reliability of the technology when operating in harsh environments and the low purchasing and maintenance costs for a huge number of cells and a high value of stored energy. Degradation and faults of VRLA cells can be detected by monitoring how the impedance of the cells, at various frequencies, changes during the battery lifecycle. This degradation is influenced by aging or by harsh environment working conditions. As example, it has been demonstrated in [15,16] that each increase of the working temperature of 8.3 °C (15 °F) above 25 °C, reduces the lifecycle by a factor of 2. The RC circuit in Figure 3 effectively models a VRLA cell used in the frequency range from 10−1 Hz to 103 Hz where: Rs models all conductive effects of the battery; Rct is the plate charge transfer resistance; Cdl is the electro-chemical double layer capacitance; Zw is the Warburg mass transport impedance. The term Zw is negligible at frequencies higher than 1 Hz, whereas it determines the behavior of the impedance at very low frequencies when Cdl is an open circuit. At frequencies higher than 103 Hz, a VRLA cell exhibits an inductive behavior. Figure 2 also shows the Nyquist representation of the impedance where the frequency fc and the total impedance Z (f) can be written as in Equations (1) and (2). The Warburg term is often negligible above 1 Hz where the simplified Equation (3) can be used:
f c = 1 2 π   R c t   C d l
Z ( f ) = R s + R c t +   Z w ( j ω ) 1 + j 2 π f C d l [ R c t + Z w ( j ω ) ]
Z ( f ) R s + R c t 1 + j 2 π f / f c
The degradation of the cells in the strings with aging, and/or operations in harsh environments, typically leads to an increase of the resistance values Rs and Rct and to a decrease of the capacity value Cdl. To measure the impedance behavior vs. frequency of the cells, for each of the parallel strings, a current stimulus is applied with a sinusoidal waveform having a continuous frequency modulation from 0.1 Hz to 1 kHz. By measuring the voltage drops across each cell in the string, and, thanks to a shunt resistor for each string, by measuring also the applied current, then an array with the “image” of the cell impedance values at different frequencies is obtained. Current and voltage acquisition is done in the analog domain, but the impedance calculation for each frequency, involving module division and phase differences, is done in the digital domain in each AIP node of Figure 2. This operation is scheduled periodically, so thanks to the distributed measuring and processing network in Figure 2, we can track the evolution of the “image” of the impedance for each cell. When the difference between the actual impedance “image” and the original one, measured at the beginning of the UPS operation and stored in a non-volatile (NV) memory, is above a certain threshold, then a predictive diagnostic warning is generated. The threshold is user programmable. In this work, the warning is generated when the actual impedance “image” differs from the original value of more than 30%. Since high power supply systems typically use cells with impedance values of hundreds of µΩ, then the peak level of the current stimulus should be at least of 1 A to measure voltage levels at least of hundreds of µV. The power dissipated during each test will be in the order of hundreds of µW, that is to say several tens of mW for an energy storage sub-system composed by hundreds of cells. This level of power dissipation is still acceptable and does not create self-heating phenomena.

5. Degradation in Power Transformers and Specifications for the Monitoring System

As discussed in Section 3, multiple 3-phase power transformers are used in the UPS system. The weight of these power transformers can be up to a thousand of Kg, whereas their voltage and current levels are up to several hundreds of kVA [8,17,18,19,20,21,22,23,24,25,26,27,28,29,30]. The causes of degradation for high power transformers can be of an electrical nature, such as over-current and over-voltage conditions, or of a thermal nature, over-temperature condition, and of a mechanical nature. Mechanic degradation is due to magneto-striction forces: alternating currents, flowing in the transformer windings, cause a continuously extension and contraction of the transformer mechanical structure, which leads to a degradation of the transformer itself finally resulting in a fault of the system. As proved in the literature, the magneto-striction forces are proportional to the current intensity through a square low. Vibrations due to mechanical degradations have a frequency doubled vs. the AC working frequency of the power supply system: 220/240 Hz and multiple harmonics for a power system working at 110/120 Hz; 100/120 Hz and multiple harmonics for a power system working at 50/60 Hz. Measuring current, voltage and temperature of the power transformers to avoid over-values is often adopted at the state-of-the-art [34,37,39]. Such techniques have been also implemented in our system by the diagnostic supervisor of Figure 1. Being not new in the state-of-the-art, the use of electrical and thermal measurements for power transformers is not detailed in this paper, which instead is focused on the innovative part of the system: measurement and detection of power transformer mechanical degradation. At the state-of-the-art, this mechanical degradation is checked through visual inspection or through acoustic analysis since vibrations are in a frequency range of hundreds of Hz. Unfortunately, the use of visible inspection and/or acoustic analysis has several drawbacks:
-
They allow a diagnosis of the fault when is too late and the transformer is already damaged.
-
As proved by experimental measurements carried out on real power systems, in the operating environment where such systems are used the background acoustic noise level is at least in the range of 60 dB/70 dB, with frequencies from few Hz to kHz. The acoustic effects of vibration degradation of the power components are detectable only after a big damage has occurred.
-
An accurate visual inspection often requires a stop of the DUT, thus causing a denial of service.
Instead, for predictive diagnostic a periodical monitoring is needed to detect the early signs of mechanical damage, but without stopping the power system. In case of power transformers, the frequencies of interest for a vibration-based analysis are from 100 Hz to 1 kHz, with required sensitivity level for vibration measurements as low as 0.5 mg. The required measuring dynamic range covers several orders of magnitude from 0.5 mg to 2 g being 1 g = 9.8 m/s2. Each of the three phases of the transformer have to be monitored with vibrations that can be in each of the 3 (x, y, z) spatial directions. Therefore a vector of at least nine measuring points for each transformer has to be acquired by the AIP nodes in Figure 2. For the digital signal processing chain, once an image of the vibrations of the power transformer is obtained, then an analysis in frequency domain is carried out. The required frequency resolution for an accurate analysis amounts to a few Hz. Using a 2 kHz sampling frequency and processing a 1024-point Fast Fourier Transform (FFT) a frequency resolution of 2 Hz is obtained for a frequency analysis up to 1 kHz. After FFT processing, still in each AIP node, a peak detection and thresholding operation is applied to detect if the acquired sequence is potentially related to a degradation of the DUT or not. In the first case, to avoid high false alarm rates, before sending a warning alarm, the sequence of data that is potentially related to a fault is compared in the frequency domain to the reference sequence acquired at the beginning of the device life cycle and stored in a NV memory. If the mean square of the difference with the reference sequence (in frequency domain) is above a given threshold, then a diagnostic alarm is raised. The above thresholds are user programmable. Thanks to this double check technique, the false alarms are limited to a few %.

6. Predictive Diagnostic System Implementation

As highlighted in Figure 2, a network of AIP acquisition nodes with integrated signal processing capabilities is implemented to monitor thermal, electrical and mechanical faults in the building blocks of a complex power supply installation. The network also includes one central supervision unit that implements the diagnosis supervisor block of Figure 1. An industrial-grade CAN networking technology is used for the interconnection. For the design of each acquisition and processing node of the network a dedicated electronic design, at single-board level, has been implemented to meet size and weight constraints, and to avoid high overheads in terms of power consumption and cost. The architecture of each node, see Figure 4, includes:
-
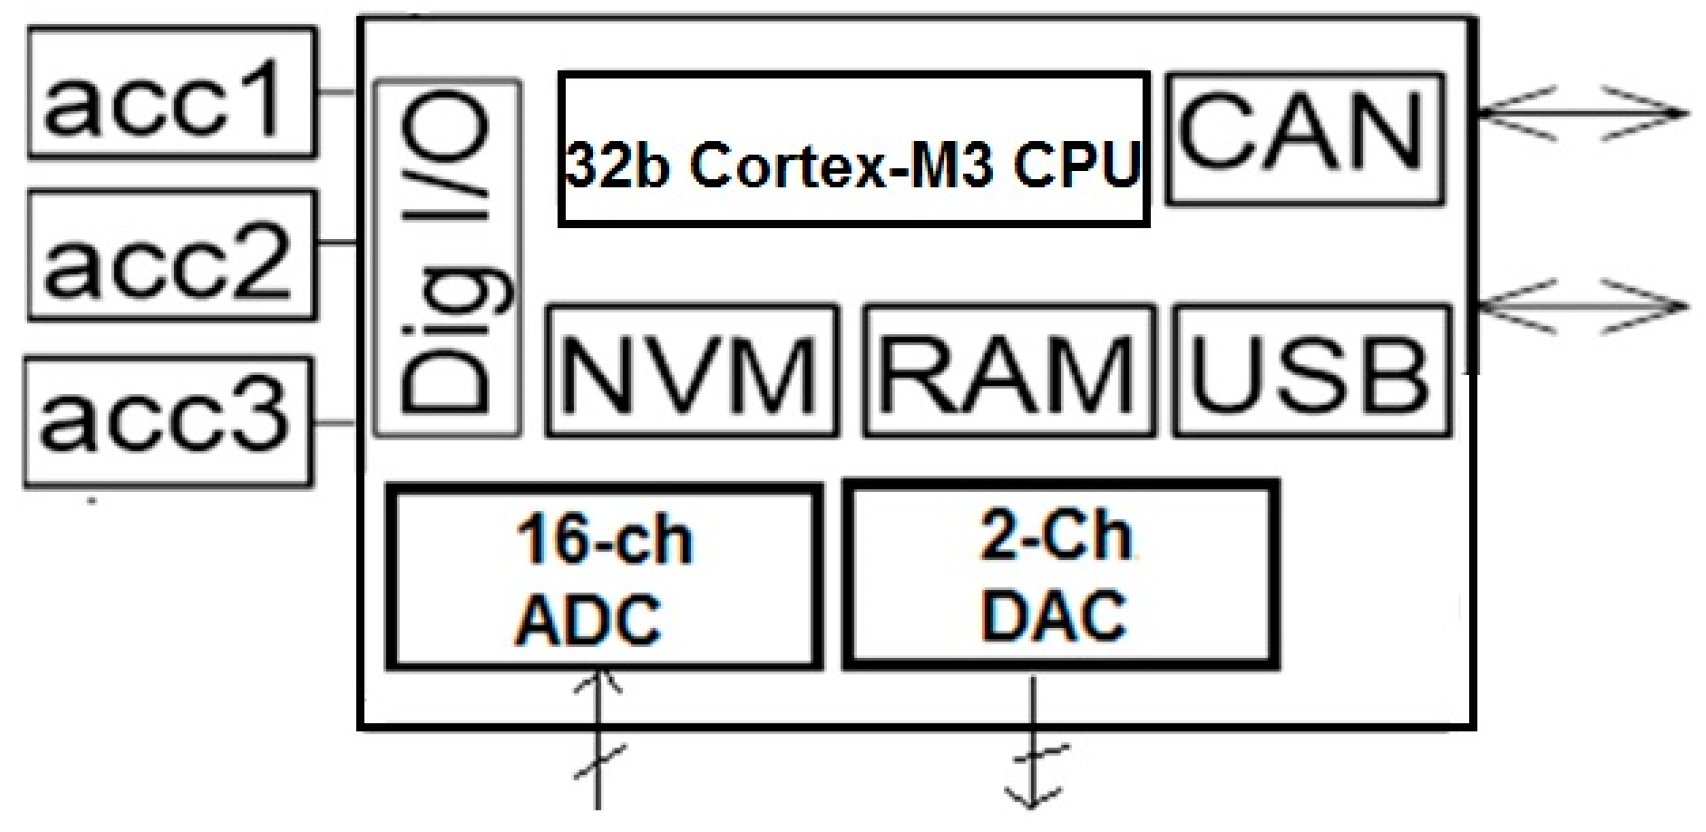
Three capacitive accelerometers, capable of 3-axis measurements with a bandwidth up to 1 kHz, a sensitivity of 0.5 mg, and a dynamic range configured to ±2 g. The LIS3DH sensors from STMicroelectronics, realized using micro-electro-mechanical-systems (MEMS) integrated technology, have been adopted. To easy their mechanical connection with the DUT, each accelerometer is encapsulated within a dedicated case.
-
Each MEMS accelerometer sensor has an on-chip dedicated analog to digital converter (ADC) with relevant memory buffers, managed through a first-in first-out (FIFO) policy. The digital outputs of the MEMS accelerometers have a 16-bit data size and are acquired by the Cortex M3 processing core in Figure 4 through its digital I/O interface.
-
On-chip Digital to Analog Converter (DAC) with two channels, each with 12-bit resolution. A trans-conductance amplifier is mounted on the printed circuit board (PCB) to generate current waveforms at the output with peak levels up to 10 A, needed for battery impedance measures.
-
On-chip 48 kSa/s ADC with 16 multiplexed inputs at 14 bits.
-
Mixed-signal processing chip integrating a 32-bit ARM CortexM3 processor at 100 MHz with 256 kByte of non-volatile flash memory and 96 kByte of RAM memory plus a rich interface set: 3 SPIs, 1 CAN, 1 USB. A 32-bit 100 MHz unit is used instead of 8-bit or 16-bit microcontrollers [50,51,52] operating at few tens of MHz since local signal processing has to be implemented.
-
On-board power supply regulators that provide the needed low voltage supply levels starting from an external voltage level up to 36 V.
When monitoring the power transformer, the three capacitive MEMS accelerometers are connected each to a different phase of the transformer (placed on top of the tank, or glued directly on the windings of each transformer) generating a 9-point vector of measured accelerations. This vector is acquired at 16 bits per point through the internal ADC in each sensor, and then is transferred through SPI to the processing core. Each digital accelerometer is connected to one of the SPI digital I/O interfaces of the processing platform. The system also acquires through three of the 16 ADC input channels the temperature of each transformer phase windings. Voltages and current levels in the 3-phase transformer are acquired through dedicated front-ends that, due to the high levels, attenuate the signals that are finally acquired though the multi-channel ADC.
When monitoring the battery cells, a sinusoidal current waveform with frequency modulation from 0.1 Hz to 1 kHz is synthesized by the Cortex M3 processor and is converted in the analog domain through the DAC and the off-chip trans-conductance amplifier. The following 40 discrete frequency values are generated each time the impedance of the battery cells has to be measured:
-
10 values from 0.1 to 1 Hz with 0.1 Hz frequency resolution,
-
10 values from 1 to 10 Hz with 1 Hz frequency resolution,
-
10 values from 10 to 100 Hz with 10 Hz frequency resolution,
-
10 values from 100 Hz to 1 kHz with a 100 Hz frequency resolution.
For each current stimuli applied to a string of cells, the voltage outputs of eight cells are acquired by the 16 channels of the on-chip ADC. The other eight ADC channels acquire the temperature of each cell. An energy storage unit with three battery strings each of 190 cells requires 24 AIP nodes per string, or 72 nodes in total. Each of the 16 ADC channels has a sampling frequency of 2 kSa/s, which allows working at Nyquist rate also in the worst case of 1 kHz analog frequency. For impedance acquisition, each of the 40 stimuli is applied for at least 100 cycles. The final measure for each frequency is obtained has an average of the 100 acquisitions. This means that each cycle will last more than 333 s (roughly 6 min) dominated by the time spent for acquisition in the range 0.1 Hz to 1 Hz. As proved in Section 6, the key measurements for the aging detection are in the range 1 Hz to 1 kHz, thus reducing both the number of points to be acquired (30) and the acquisition time, 33 s.
Once acquired and digitized the sensor signals for diagnosis of power transformer vibrations or of battery impedance, an analysis in the frequency domain is done in each AIP node using as workhorse a 1024-point, 16 bits per sample FFT [53,54]. The length of the FFT is selected as the power of two value (thus simplifying FFT design) that allows a frequency resolution of about 2 Hz in the range of interest from DC to 1 kHz.
As already discussed in Section 5, after FFT processing, for power transformers a peak detection and thresholding unit allows the detection of the acquisition sequences potentially related to a mechanical degradation. Each of these pre-selected sequences is compared to the reference vibration image acquired at the beginning of the transformer life cycle and stored in a NV memory. If the mean square of the difference with the reference sequence is above a given threshold, then a diagnostic alarm is raised. Instead, in case of the impedance analysis of the cell batteries Equation (4) is implemented where V[t] and I[t] are the voltage and current discrete vectors, and H[t] is the Hanning window applied to reduce the error due to finite observation time. Once calculated, the vector Z(f) is compared to the reference impedance vector acquired at the beginning of each battery life cycle and stored in a NV memory. If the mean square of the difference with the reference sequence is above a given threshold, then a diagnostic alarm is raised. This is repeated for each cell:
Z ( f ) = F F T ( H [ t ] V [ t ] ) F F T ( H [ t ] I [ t ] )
The diagnostic system does not need strict real-time operations: as example a periodical check on a time scale of 1 h is enough for both the power transformer (20 min for the signal processing of each of the three 3-axis accelerometers, working in time multiplexed mode) and for the battery cell impedance monitoring (roughly 8 min for the signal processing of each of the eight cells, working in time multiplexed mode). These values allow implementing FFT, peak-detection, thresholding and comparison operations via software on the 32-bit Cortex M3 core.
Different types of possible network connection are available sustaining a data rate up to 1 Mbps: wired connection through a CAN transceiver or wireless through a radio frequency (RF) module. The RF part can work at 2.4 GHz using the Bluetooth protocol. At such frequencies the antenna can be printed directly on the PCB [55]. The covered connection distance is from few meters up to several hundred meters. CAN networking is the preferred solution in industrial environments, although the availability of the RF links can be useful as redundant connection channels or for the deployment of such system in outdoor scenarios. CAN or Bluetooth provide enough bandwidth since the nodes have local signal processing capability and hence they have to send only alarm signals. The full set of acquired data may be required by the supervising unit only when a fault occurs and only from the faulty device. Otherwise, without local processing capability the bandwidth to be transferred would be too high for the capability of a serial link operating in industrial environment such as CAN. Indeed, each analysis of vibration requires a set of 9-axis acquisitions each at 16 bits with a Nyquist-rate of at least 2 kSa/s, that is to say roughly 300 kbit/s. In case of battery cell monitoring, each block of data for each cell is a 40-point vector with imaginary and real parts acquired at 14 bits with a Nyquist rate of 2 kSa/s, i.e., roughly 1.12 Mbits/s. In case of a 30-point Z (f) vector the data rate is reduced to 80 kbits/s.
Each acquisition and processing node can be also used stand-alone as a new instrument to check production quality of the power transformer or of a group of battery cells before the power supply system is sold to the customer. The node is connected to an external host computer through the USB port of Figure 4. In such case, for each new power transformer, or group of battery cells, the vibration or the impedance images are acquired and compared to a golden acceptance reference. If the check is passed, then the transformer or the battery cells are mounted on the system and the images are used as a quality stamp and are provided with the rest of the technical documentation to the customer. As example, Figure 5a,b shows a snapshot of one implemented AIP node, whose size in Figure 5a is about 10 cm per side, during a stand-alone testing of a power transformer. Figure 5a shows the three accelerometers and particularly it shows for one, the integrated circuit (IC), and for the other two, the package where they are encapsulated to increase the mechanical stability when they are placed on the power transformer under test. Figure 5a also shows the PCB hosting the CPU, memories, ADC and DAC converters, and the CAN to USB gateway used to connect the CAN interface of the node to a USB port of a host PC emulating the user interface. Instead, Figure 5b shows the power transformer under test, when it is instrumented with accelerometers (in Figure 5b, two out of three packaged accelerometers are shown, placed on top of the transformer) and the connections for electrical measurements of the transformer.

7. Experimental Measurements

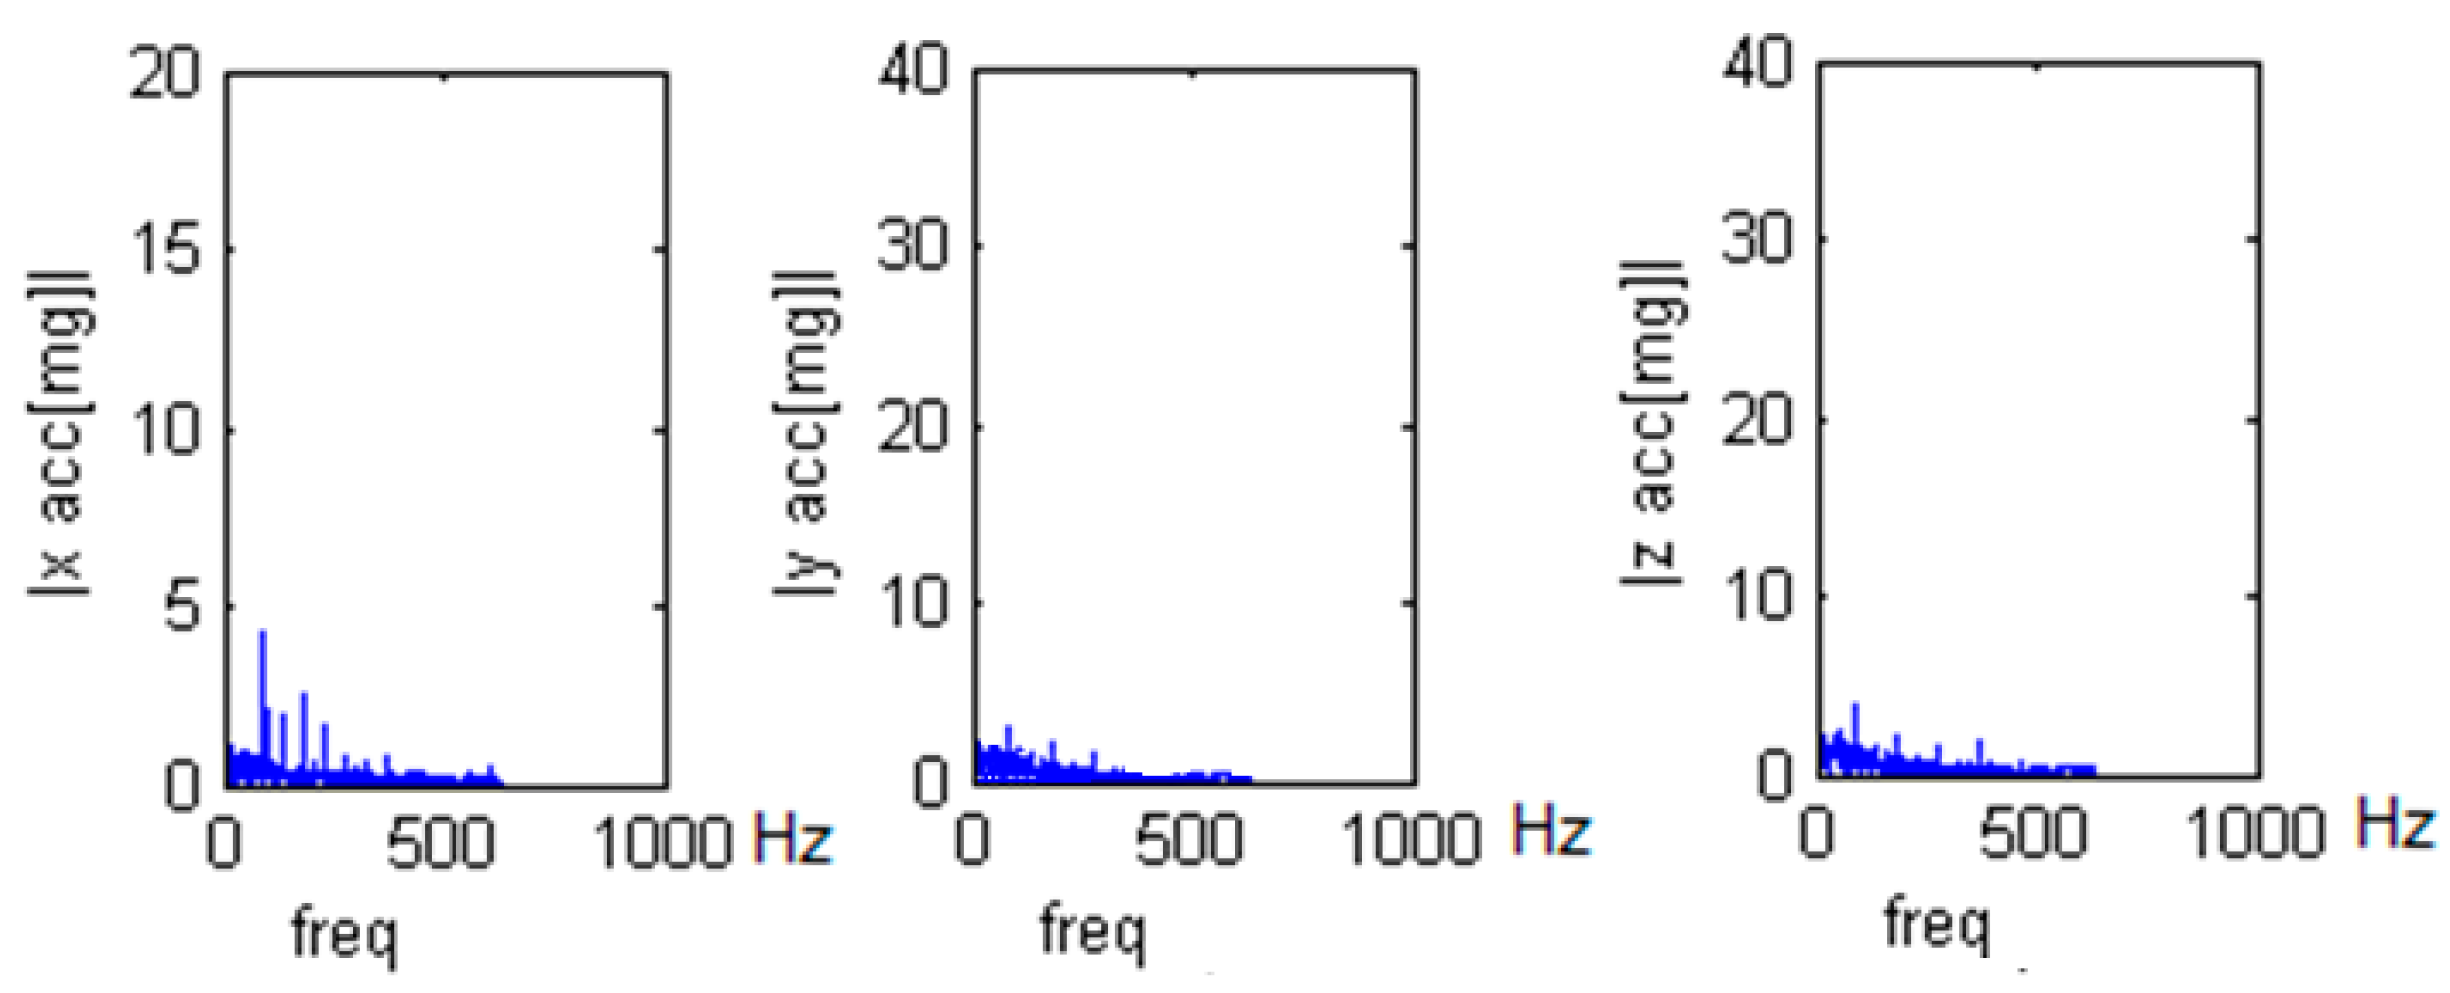
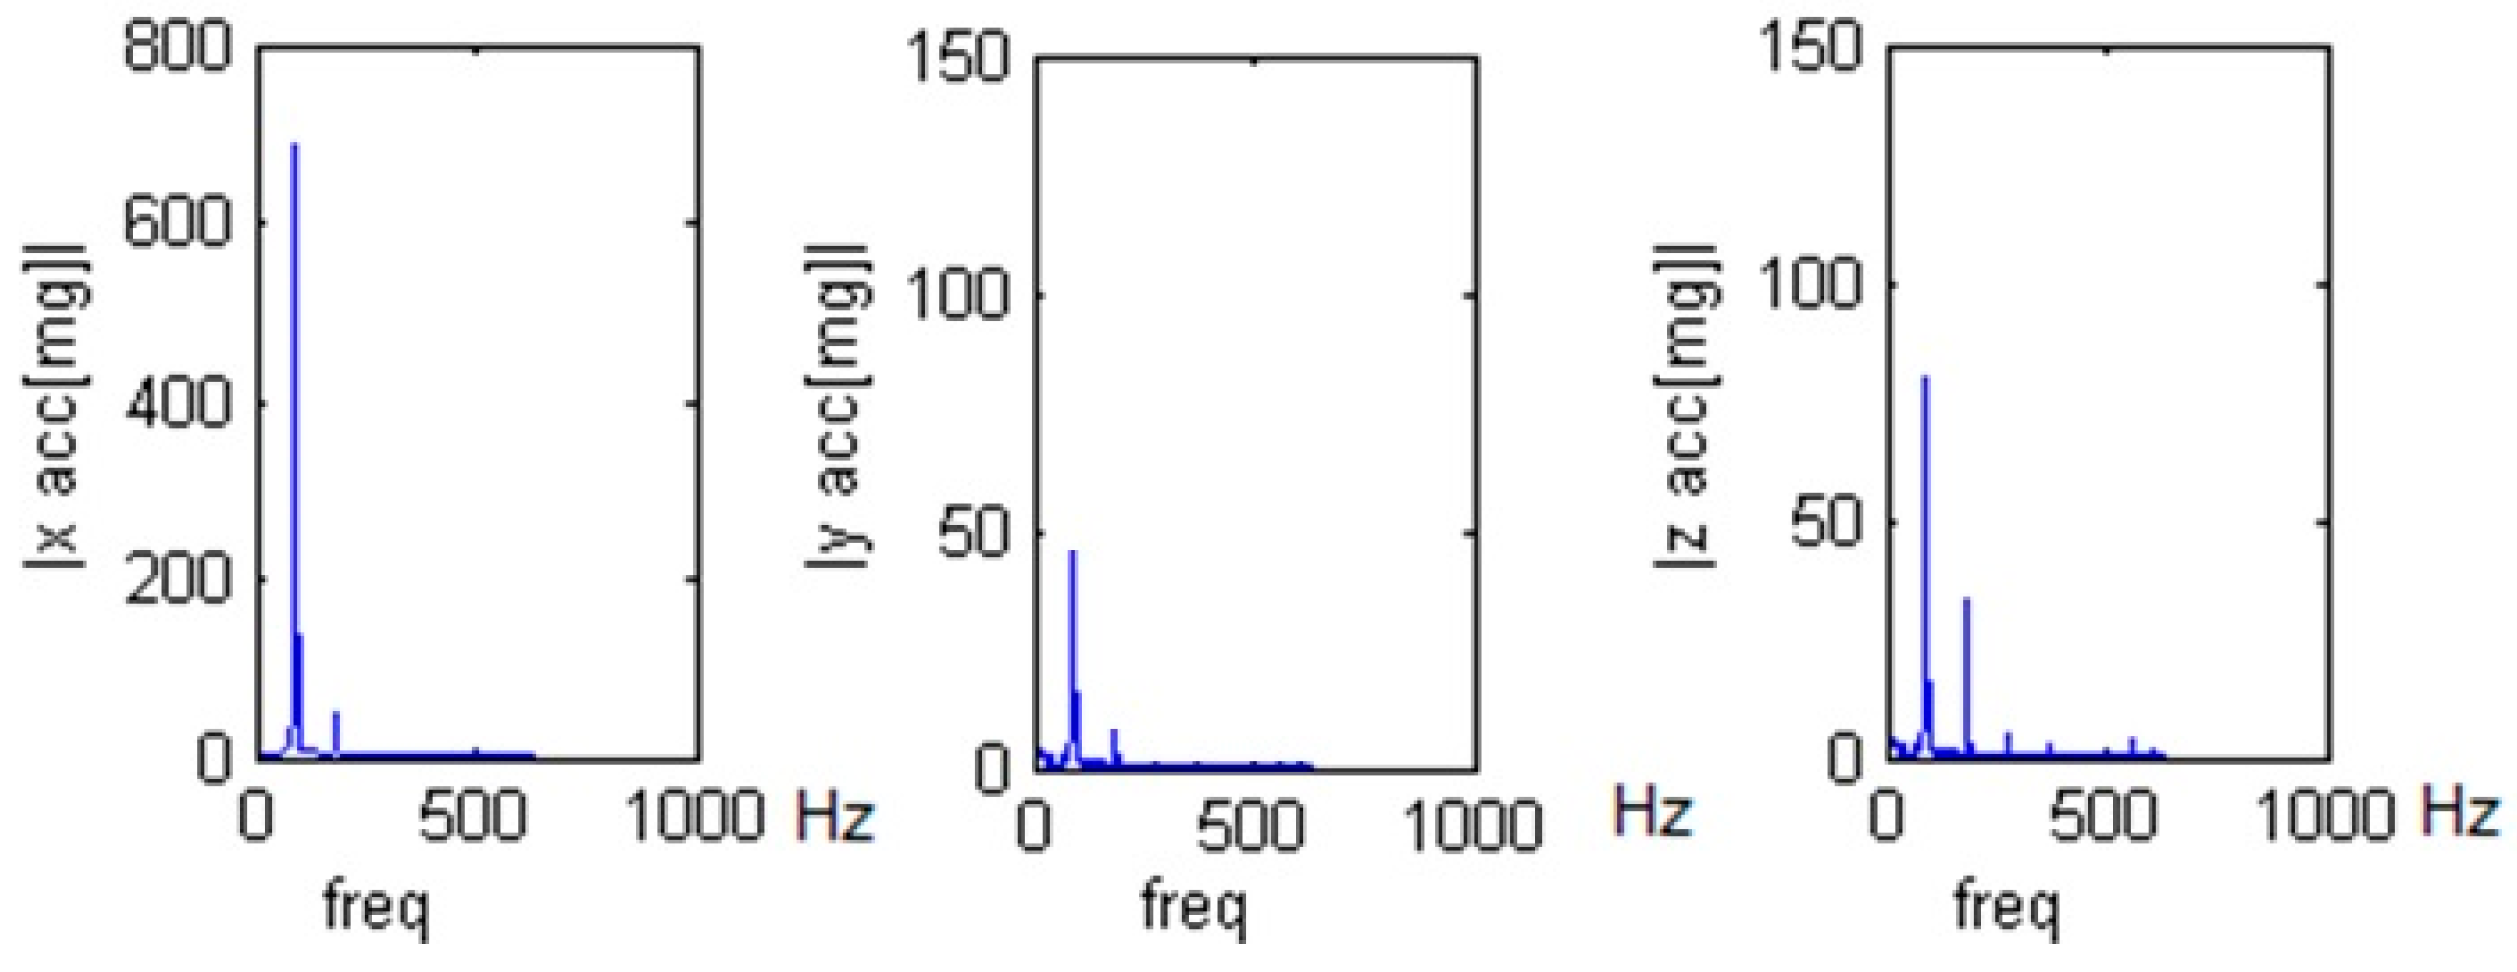
7.1. Power Transformer Degradation

To validate the performance of the distributed measuring system, several measurements have been carried out at the CEG Elettronica premises on real UPS power systems (for oil & gas and railway safety-critical applications) with different levels of degradation. According to the FMEA analysis, power transformers and energy storage components have been monitored. The tests on the power transformer have been done with the secondary open or connected to an active load, which allowed testing the device under different electrical operating conditions. Comparing the results of these tests for the same power transformer allowed us to check if and how the measuring system performance depends on the operating condition of the device under test. The accelerometers of each acquisition and processing unit have been placed in different positions of each power transformer under test. This way we checked if and how the diagnostic system performance depends on the sensors placement. For the energy storage systems VRLA batteries with capacity of hundreds of Ah have been considered. Overall, thousands of tests have been carried out. For a sake of space, just some of them, we judge significantly to show how the diagnostic system behaves, are reported.
Figure 6 shows the frequency-domain response acquired when monitoring a power transformer without faults, operating at a current of 100 A on the secondary. It is a 148.2 kVA transformer with a weight of 630 Kg, 400 V ac on the primary, 250 V ac on the secondary and 172 A max current in the secondary. In Figure 6 vibration intensity is limited to few mg. Repeating the same analysis with sensors placed on top of the power transformer tank, or directly connected to the transformers windings, as in Figure 6, with secondary currents increased up to 170 A similar results are obtained. Therefore, changing the operating conditions and the sensor positioning the amplitude of the vibrations around the static value imposed by the position of the sensor is always limited to few mg for a healthy transformer. Similar values are obtained for the three 3-axis sensors; this work reports the value of the sensor measuring the highest vibration levels. Repeating the same analysis on a power transformer with mechanical degradation, with sensors directly connected to the transformer windings and with 170 A operating current on the secondary, the results of Figure 7 are obtained.
In Figure 7 the degradation can be clearly detected. Vibrations along the three axes are up to 0.7 g. In Figure 8 the measurements on the power transformer with mechanical degradation have been repeated placing the sensors on top of the transformer tank and working at 100 A in the secondary. For the healthy and degraded transformers, measurements of temperature, current and voltage were aligned. By comparing the achieved results shown in Figure 6, Figure 7 and Figure 8, it can be noticed that the transformer degradation is clearly detectable since vibrations are up to 0.7 g and 0.5 g in Figure 7 and Figure 8, whereas the healthy transformer vibrations are orders of magnitude lower, see Figure 6. Moreover, the system sensitivity to changes of the sensor position or of the working current is low. The measurements of audio emissions were also aligned between the healthy and the degraded transformers. This is due to the high noise level of the background industrial environment, where the power transformers were positioned, more than 70 dB. From a visual analysis, no particular differences are noted between the devices. Hence, a visual analysis is also not suitable for a predictive diagnosis unless the transformer becomes completely degraded and by then is too late to prevent faults at the system level. Vibration measurement is the only way to detect the degradation, performing the measurements while the transformer is active, without any loss of service. The only alternative would be detecting the degradation through an invasive inspection, partially destructive, forcing a shut-down of the transformer and hence of the system.

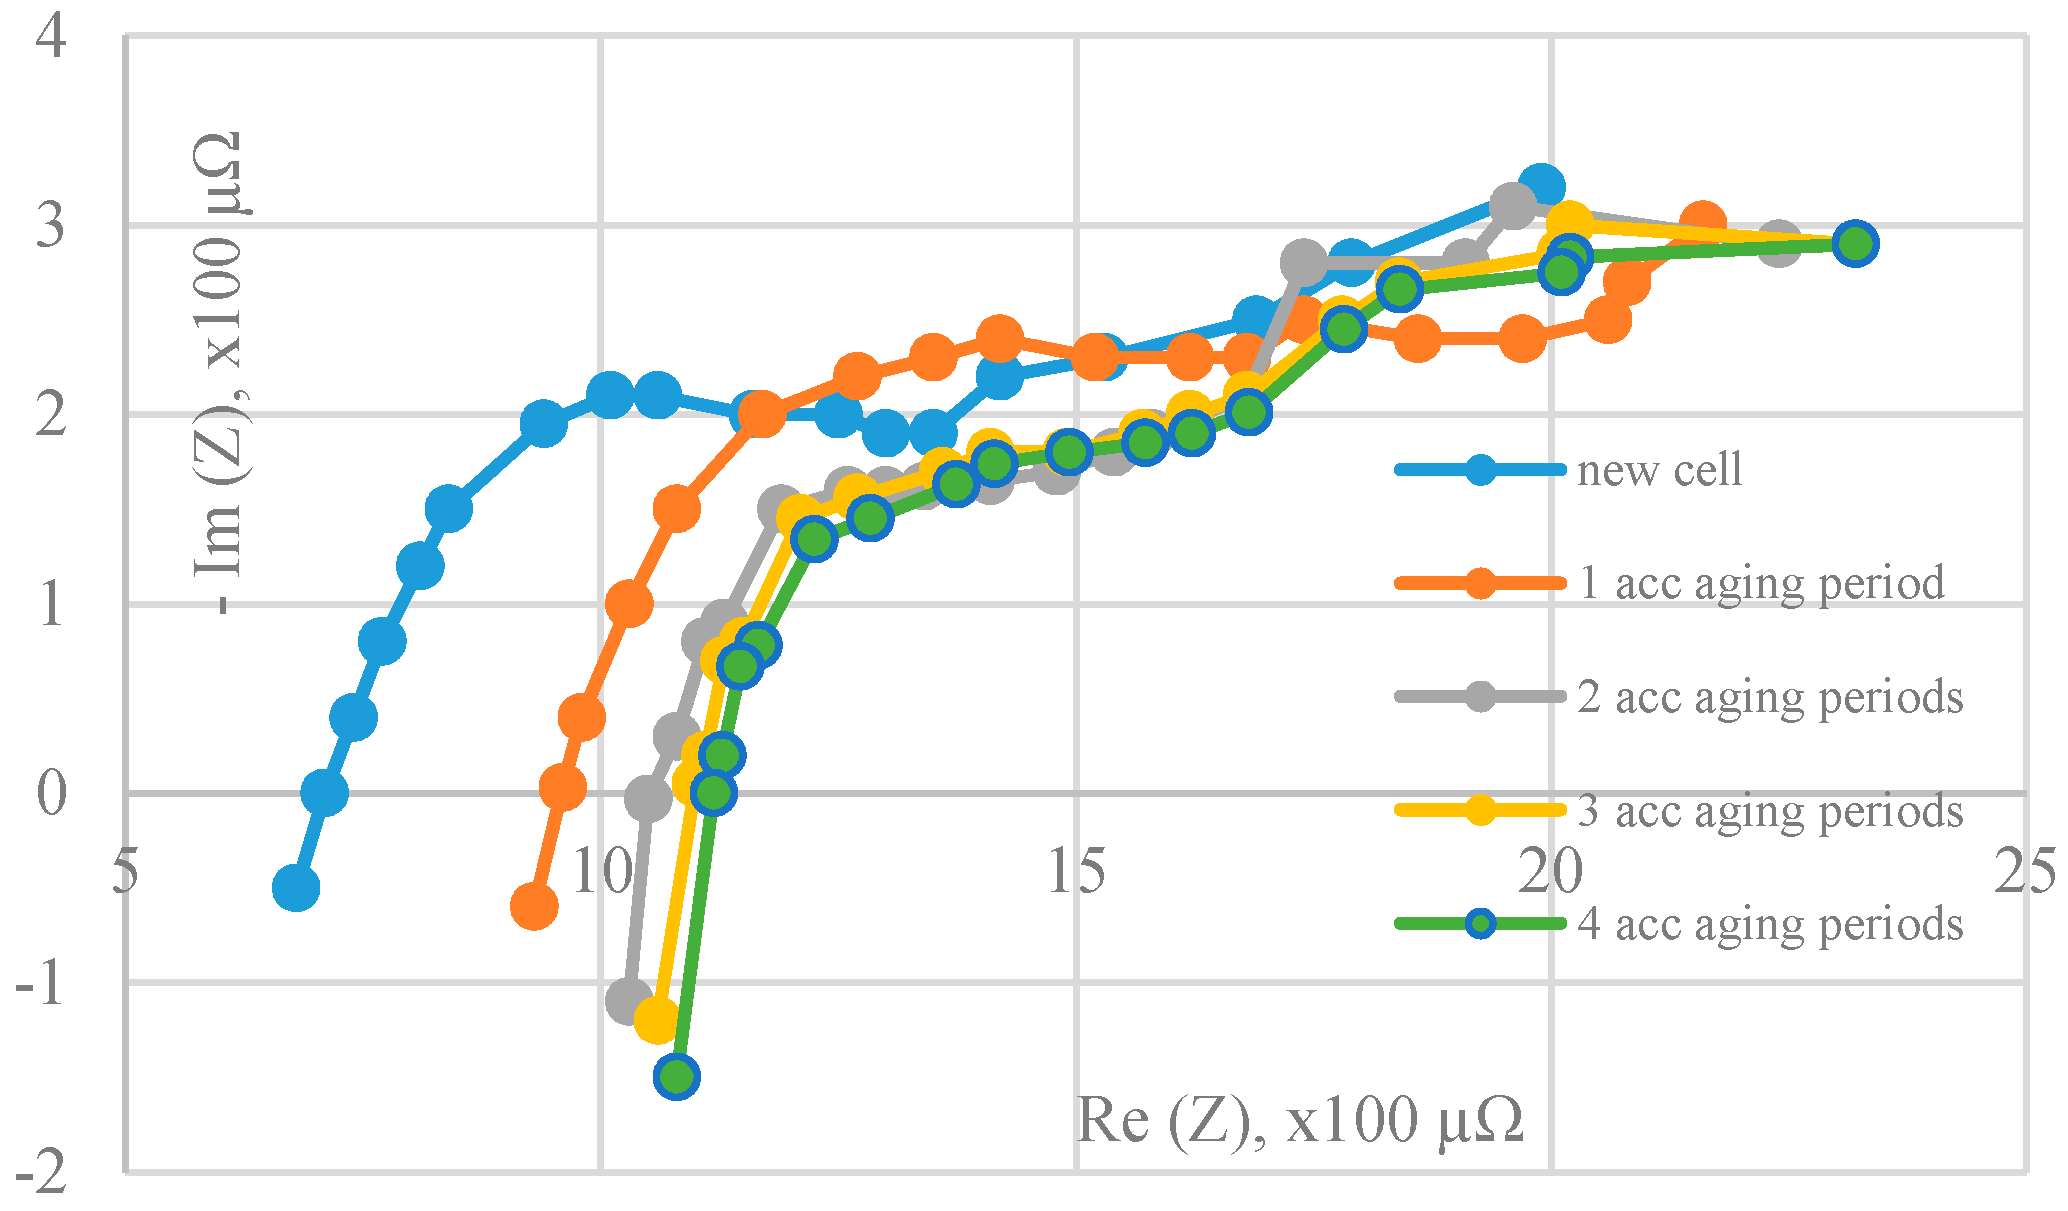
7.2. Battery Degradation

Figure 9 shows for a new VRLA Marathon 2 V 425 Ah cell:
-
In Figure 9a, an example acquisition of the excitation current (10 A peak) and voltage response (15.5 mV peak) at 1 kHz; the module of the impedance is 762.4 µΩ and the phase shift is 30 degrees.
-
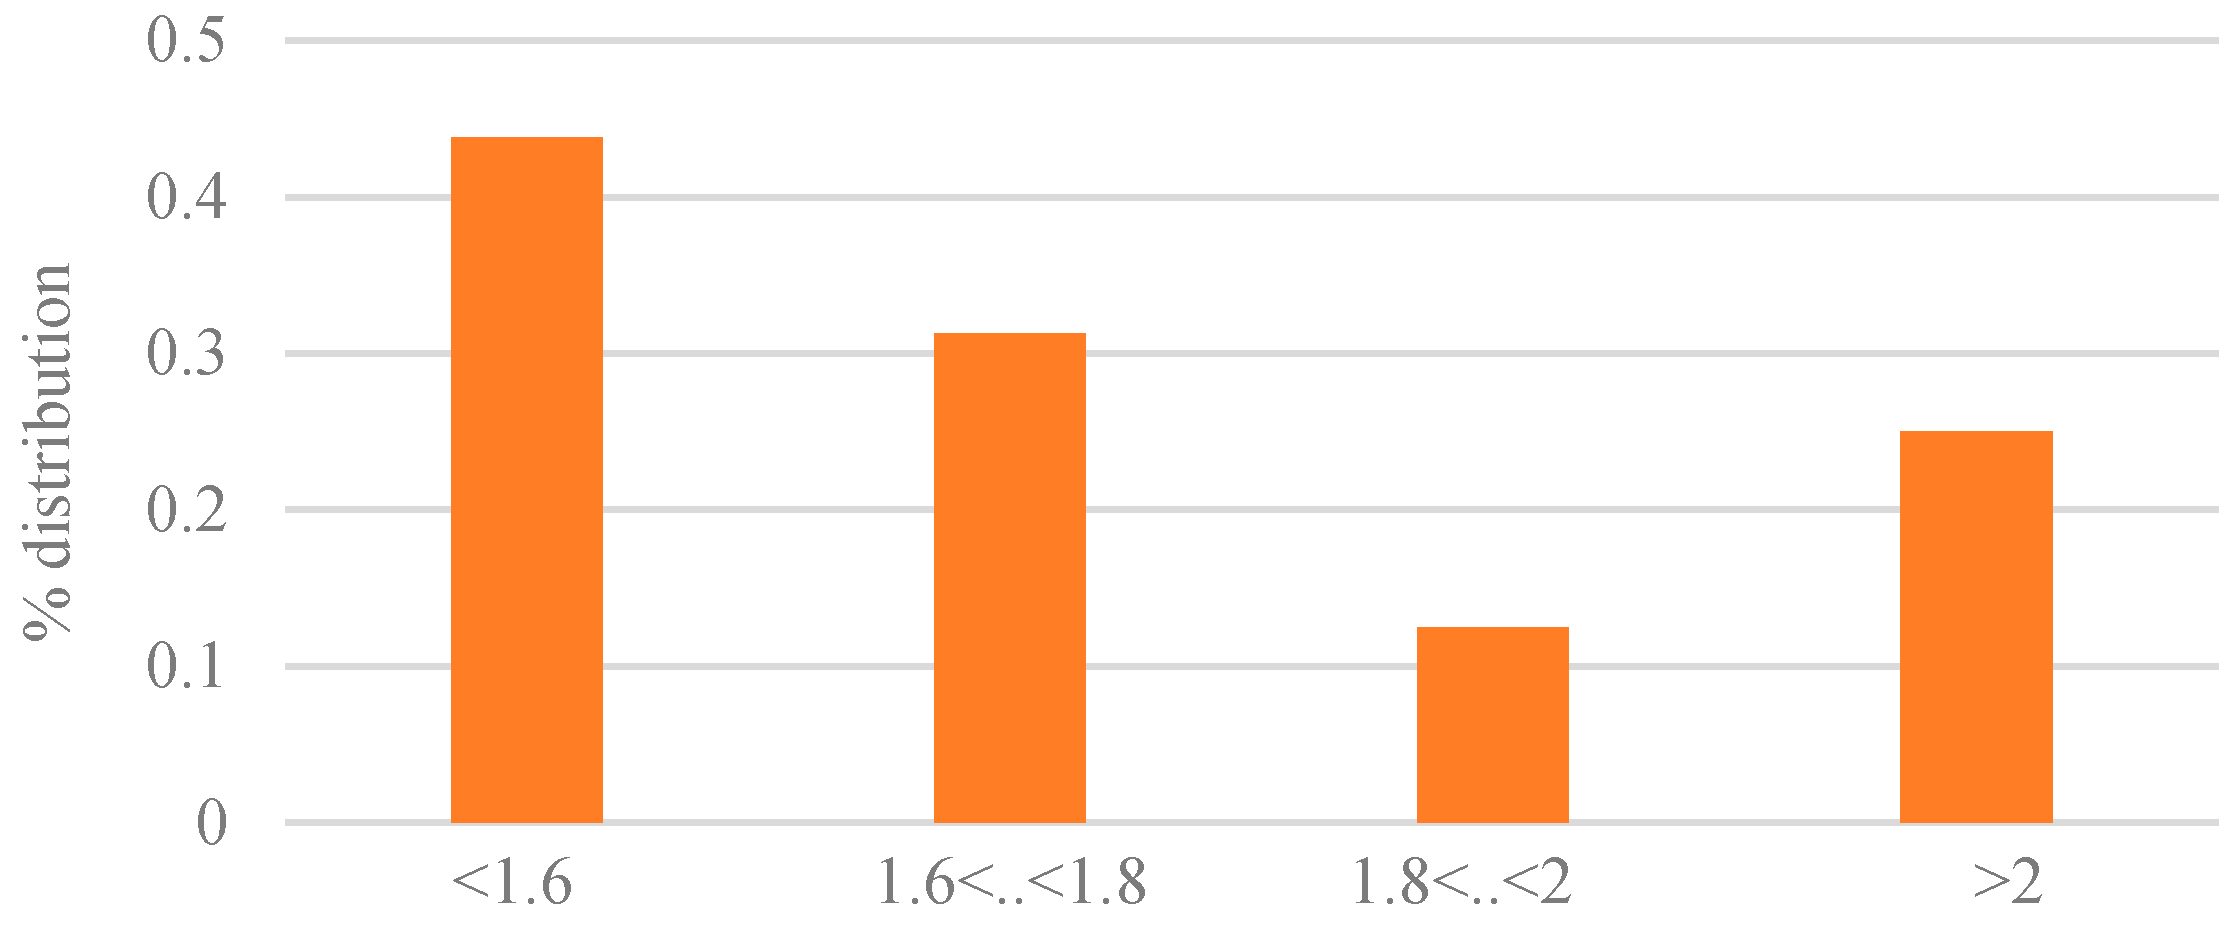
In Figure 9b, the current needed to discharge in 10 h a 425 Ah cell (x axis), at 20 °C and its operating voltage (y axis). Below 1.8 V there is a rapid change in the cell behavior.
This cell has a working range from 2 V down to 1.6 V. For a degradation higher than 20%, i.e., voltage below 1.6 V the cells can be considered faulty. Figure 10 shows different measurements in a Nyquist plot of the impedance of the same cell after different accelerated aging periods. Frequencies are ranging from 0.1 Hz to 1 kHz. Each aging period is a complete series of 200 charge and discharge cycles of the cell plus 1 month of storage at 66 °C to simulate harsh environment working condition. Working at 66 °C corresponds, according to literature, to an accelerating aging factor of 32 times vs. a cell working at an ambient temperature of 25 °C. Therefore, 4 months of accelerated tests corresponds to roughly 10 years of work under nominal conditions. The light blue curve is the initial golden reference curve while the other curves are obtained after several ageing cycles at 1, 2, 3 and 4 months of accelerated aging, respectively. From Figure 10 is clear that for VRLA cells degradation detection with aging, the Warburg mass transport impedance contribution is un-useful. The relevant tests in the frequency range 0.1 Hz to 1 Hz can be avoided thus reducing the acquisition time and the complexity (bandwidth, memory) to store the impedance values. VRLA cell degradation is rapidly checked just by comparing the evolution in time of two values:
-
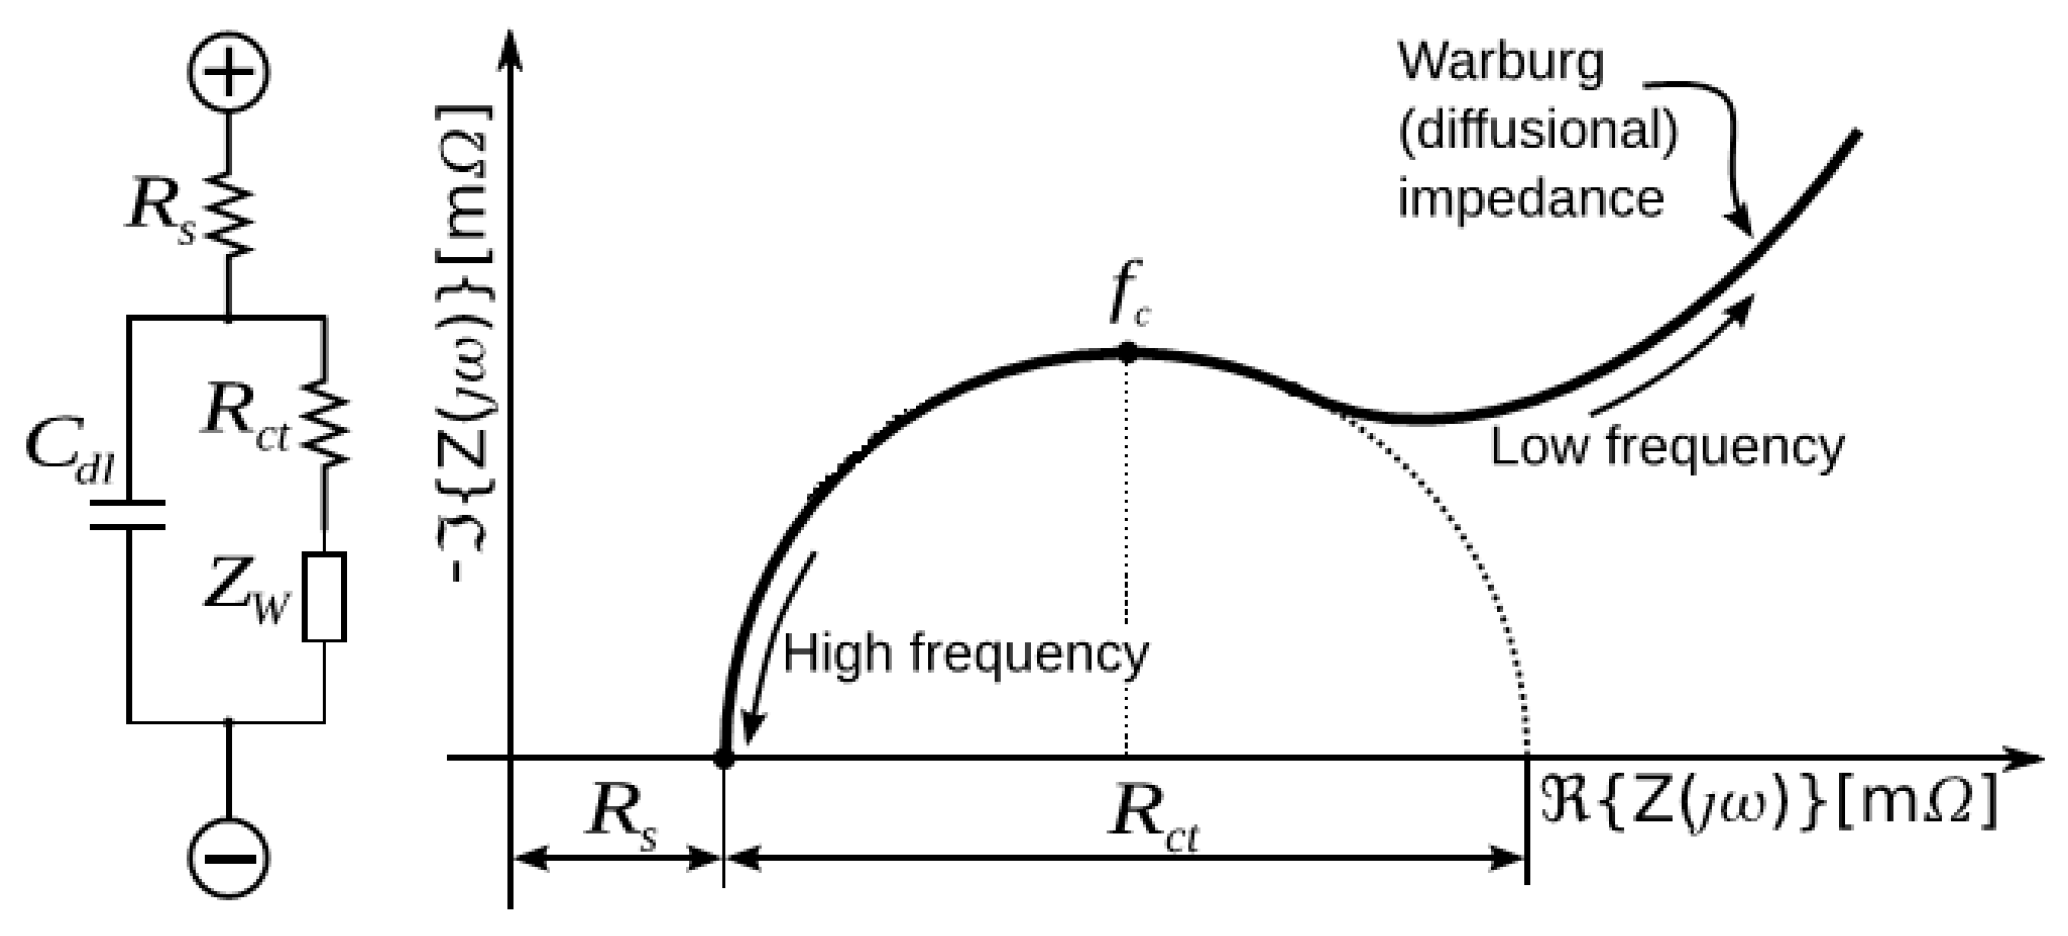
the impedance with null imaginary part, Rs from Equation (3), usually between 500 Hz and 1 kHz;
-
the impedance with a peak of imaginary part, fc from Equation (1), usually above 1 Hz.
In Figure 10 moving from the original cell to the last curve an increase ×1.6 is detected in terms of Rs and ×1.5 in terms of fc. Figure 11 shows for all the cells in a string the distribution of operating voltage after the 4 months of accelerated aging tests. To be noted that more than 40% of the cells can be considered faulty since their voltage is below 1.6 V and hence the input to the inverter in Figure 1 is below the minimum required.

8. Conclusions

The paper has proposed a scalable UPS system architecture for safety critical applications with predictive diagnosis capabilities. The aim is to overcome the limitations of the state-of-the-art where fault diagnosis is usually implemented for a single type of components of an UPS system, e.g., only power transformers in [7,8,17,18,19,20,21,22,23,24,25,26,27,28,29,30,31,32,33,34,35,36,37,38,39,40,41] or only battery modules for energy storage in [14,15,16,42,43,44,45,46,47]. In the state-of the-art often only some types of faults are addressed, e.g., [32,33,34,35,36,37,38,39,40,41] address only electrical and thermal faults, whereas [23,28,31] address only mechanical faults through visual inspection or acoustic analysis. Instead, our work aims at a comprehensive system solution for UPS predictive diagnosis. This objective is achieved through a distributed network of measuring nodes with integrated signal processing capability in the frequency domain with FFT, peak detection, sequence comparison, and thresholding operators. The nodes analyze mechanical (vibrations), electrical and thermal degradations of 3-phase power transformers and of energy storage components and are implemented through a compact and low cost multi-channel and mixed-signal architecture. Experimental measurements on real power systems validate the proposed solution. The difference between a good working device (power transformer or battery module) and one with degradations is high, and hence the tuning of the programmable thresholds use in this work is not an issue. Moreover, the target of this work is not an automatic switch-off of the power system when a severe damage occurs. The target of this work is giving to the system owner an early diagnostic warning when some key components of the power systems (power transformer or battery module) have reached a certain degradation level, but the power system is still working. This way, the owner of the power system can program the maintenance operation of some components (together with other scheduled maintenance operations of the system) without having unforeseen denial of service. To achieve this goal in our experiments the user programmable thresholds have been set to avoid missed detection, whereas the false alarm rate is below 5%. Since in case of alarms the system is not stopped (we are implementing an early warning system), this will not cause any denial of service.

Acknowledgments

Work partially funded by FESR project (EU commission, Tuscany Region) IPPS with CEG Elettronica, Bibbiena, Arezzo, Italy, as industrial partner. Discussions with A. Falciani from CEG Elettronica, F. Bernardo and colleagues of Pisa University (Professors Saletti, Roncella, Baronti, Fanucci) are acknowledged.

Conflicts of Interest

The author declares no conflict of interest.

References

  1. Consilvio, A.; Di Febbraro, A.; Sacco, N. A Modular Model to Schedule Predictive Railway Maintenance Operations. In Proceedings of the 2015 International Conference on Models and Technologies for Intelligent Transportation Systems (MT-ITS), Budapest, Hungary, 3–5 June 2015; pp. 426–433.
  2. Ramirez-Niño, J.; Pascacio, A.; Carrillo, J.; de la Torre, O. Monitoring network for online diagnosis of power generators. Measurement 2009, 42, 1203–1213. [Google Scholar] [CrossRef]
  3. Costantino, N.; Serventi, R.; Tinfena, F.; D’Abramo, P.; Chassard, P.; Tisserand, P.; Saponara, S.; Fanucci, L. Design and test of an HV-CMOS intelligent power switch with integrated protections and self-diagnostic for harsh automotive applications. IEEE Trans. Ind. Electr. 2011, 58, 2715–2727. [Google Scholar] [CrossRef]
  4. Sunder, R.; Kolbasseff, A.; Kieninger, K.; Rohm, A.; Walter, J. Operational Experiences with Onboard Diagnosis System for High Speed Trains. In Proceedings of the World Conference on Railway Research (WCRR), Koln, Germany, 2001; pp. 1–9.
  5. Umiliacchi, P.; Lane, D.; Romano, F. Predictive maintenance of railway subsystems using an Ontology based modelling approach. In Proceedings of the World Conference on Railway Research (WCRR), Lille, France, 2011; p. 110.
  6. Antony, J.J.V.; Nasira, G.M. Towards predictive maintenance and management in rail sector: A clustering approach. In Proceedings of the IEEE International Conference on Recent Trends in Information Technology (ICRTIT), Chennai, India, 25–27 July 2013; pp. 502–507.
  7. Saponara, S.; Fanucci, L.; Bernardo, F.; Falciani, A. A network of vibration measuring nodes with integrated signal processing for predictive maintenance of high power transformers. In Proceedings of the IEEE WISP 2015, Siena, NY, USA, 15–17 May 2015; pp. 1–4.
  8. Saponara, S.; Fanucci, L.; Falciani, A. Uninterruptible Power Supply Systems for Railway with Predictive Diagnostic against Power Transformer Failure. In Proceedings of the IEEE 15th EEEIC, Rome, Italy, 10–13 June 2015; pp. 2119–2123.
  9. Galar, D.; Thaduri, A.; Catelani, M.; Ciani, L. Context awareness for maintenance decision making: A diagnosis and prognosis approach. Measurement 2015, 67, 137–150. [Google Scholar] [CrossRef]
  10. Gumilang, H.; Ansori, E.; Siregar, R.; Subrata, I.; Henny Ika, S.; Aenul, R.; Yuliastuti, E.; Setiawan, A. Condition assessment method for power transformer as a part of condition based maintenance program in PLN P3B Jawa Bali. In Proceedings of the 2012 International Conference on Condition Monitoring and Diagnosis (CMD), Bali, Indonesia, 23–27 September 2012; pp. 269–272.
  11. Wardani, N.U.; Purnomoadi, A.P.; Septiani, H.I.; Arifianto, I.; Cahyono, B. Condition assessment of 500/150 kV power transformer based on condition based maintenance. In Proceedings of the 2011 International Conference on Electrical Engineering and Informatics (ICEEI), Bandung, Indonesia, 17–19 July 2011.
  12. Furlong, E.R. UPS topologies for large critical power systems (>500 KVA). In Proceedings of the 13th Annual Power Quality Exhibition & Conference, Atlanta, GA, USA, 30 October 2002.
  13. Rasmussen, N. The Different Types of UPS Systems; White paper n.1, rev.7; Schneider Electric DCSC (Data Center Science Center): Rueil Malmaison, France, 2011; pp. 1–10. [Google Scholar]
  14. Baronti, F.; Fantechi, G.; Fanucci, L.; Leonardi, E.; Roncella, R.; Saletti, R.; Saponara, S. State-of-charge estimation enhancing of lithium batteries through a temperature-dependent cell model. In Proceedings of the 2011 International Conference on Applied Electronics, Pilsen, Czech Republic, 7–8 September 2011; pp. 29–34.
  15. VRLA Batteries Introduction; Professional Battery Quality (PBQ): Haarlem, The Netherlands, 2010; pp. 1–9.
  16. Kramm, F. Float Life Expectancy of VRLA-Batteries Based on High Temperature Float Tests Impact of Discharge Rate, Design and Test Parameter. In Proceedings of the INTELEC 06—Twenty-Eighth International Telecommunications Energy Conference, Providence, RI, USA, 10–14 September 2006; pp. 1–5.
  17. Ma, H.Z.; Jiang, N.; Wang, C.N.; Geng, Z.H. Improved power transformer winding deformation fault diagnosis method. In Proceedings of the 22nd International Conference on Electricity Distribution, Stockholm, Sweden, 10–13 June 2013.
  18. Shao, Y.; Rao, Z. Online state diagnosis of transformer windings based on time-frequency analysis. WSEAS Trans. Circ. Syst. 2009, 8, 227–236. [Google Scholar]
  19. Hu, C.; Wang, P.; Youn, B.D.; Lee, W.R.; Yoon, J.T. Statistical health grade system against mechanical failures of power transformers. In Proceedings of the Conference of Prognostic and Health Management Society, Minneapolis, MN, USA, 2012.
  20. Ibargüengoytia, P.H.; Pascacio, A.; Betancourt, E.; Liñan, R. Probabilistic Vibration Models in the Diagnosis of Power Transformers; Chapter 6; in Recent Advances in Vibration Analysis; Baddour, N., Ed.; InTech Europe: Rijeka, Croatia, 2011; pp. 103–122. [Google Scholar]
  21. Yoon, J.T.; Park, K.M.; Youn, B.D.; Lee, W.R. Diagnostics of mechanical faults in power transformers, vibration sensor network design under vibration uncertainty. IEEE Eur. Conf. Progn. Health Manag. Soc. 2014, 5, 1–7. [Google Scholar]
  22. Nafar, M.; Bahmanifirouzi, B.; Jabbari, M. Transformer Monitoring by using Vibration Analysis. Aust. J. Basic Appl. Sci. 2011, 5, 984–990. [Google Scholar]
  23. Beltle, M.; Tenbohlen, S. Usability of vibration measurement for power transformer diagnosis and monitoring. In Proceedings of the 2012 International Conference on Condition Monitoring and Diagnosis (CMD), Bali, Indonesia, 23–27 September 2012; pp. 281–284.
  24. Wui, S.; Huang, W.; Kong, F.; Wu, Q.; Zhong, F.; Zhang, R.; Wang, Z. Extracting Power Transformer Vibration Features by a Time-Scale-Frequency Analysis Method. Electromagn. Anal. Appl. 2010, 2, 31–38. [Google Scholar] [CrossRef]
  25. Jin, M.; Pan, J.; Huang, H.; Zhou, J. Transmission of vibration of a power transformer from the internal structures to the tank. In Proceedings of the Acoustics 2012—Fremantle, Fremantle, Australia, 21–23 November 2012; pp. 1–7.
  26. Garcia, B.; Burgos, J.C.; Alonso, Á.M. Transformer Tank Vibration Modeling as a Method of Detecting Winding Deformations—Part II: Experimental Verification. IEEE Trans. Power Deliv. 2006, 21, 164–169. [Google Scholar] [CrossRef]
  27. Garcia, B.; Burgos, J.C.; Alonso, Á.M. Transformer Tank Vibration Modeling as a Method of Detecting Winding Deformations—Part I: Theoretical Foundation. IEEE Trans. Power Deliv. 2006, 21, 157–163. [Google Scholar] [CrossRef]
  28. Ming, D.Y. Research on Fault Diagnosis System for Power Transformer Based on Audio Signal. Master’s Thesis, Huazhong University of Science and Technology, Wuhan, China, 2013. [Google Scholar]
  29. Kim, J.-W.; Park, B.; Jeong, S.C.; Kim, S.W.; Park, P. Fault Diagnosis of a Power Transformer Using an Improved Frequency-Response Analysis. IEEE Trans. Power Deliv. 2005, 20, 169–178. [Google Scholar] [CrossRef]
  30. Li, H.; Zhang, B.; Chen, J.; Chao, C.; Wang, Y. Simulation and Test on Vibration Characteristics of Power Transformer Windings. In Proceedings of the International Symposium on Computers & Informatics (ISCI 2015), Beijing, China, 17–18 January 2015; pp. 1259–1267.
  31. Van der Veen, M.; de Leon, F.; Gladstone, B.; Tatu, V. Measuring Acoustic Noise Emitted by Power Transformers; AES 109th convention: Los Angeles, CA, USA, 2000; pp. 1–19. [Google Scholar]
  32. Arseneau, R.; Filipski, P.S.; Zelle, J.J. An improved three-phase digital recorder system for calibrating power instrumentation. IEEE Trans. Instr. Meas. 1997, 46, 399–402. [Google Scholar] [CrossRef]
  33. Arri, E.; Carta, A.; Mocci, F.; Tosi, M. Diagnosis of the State of Power Transformer Windings by On-Line Measurement of Stray Reactance. IEEE Trans. Instr. Meas. 1993, 42, 372–378. [Google Scholar] [CrossRef]
  34. Rietveld, G.; van der Beek, J.H.; Houtzager, E. Accurate DC current ratio measurements for primary currents up to 600 A. IEEE Trans. Instr. Meas. 2015, 64, 3055–3061. [Google Scholar] [CrossRef]
  35. Cataliotti, A.; Cosentino, V.; Di Cara, D.; Nuccio, S.; Tinè, G. Rogowski coil current transducer compensation method for harmonic active power error. Measurement 2015, 63, 240–251. [Google Scholar] [CrossRef]
  36. Zhang, Z.; Li, H.B.; Li, Z.H. A novelty digital algorithm for online measurement of dielectric loss factor of electronic transformers. Measurement 2013, 46, 1200–1207. [Google Scholar] [CrossRef]
  37. Koufakis, E.I.; Karagiannopoulos, C.G.; Bourkas, P.D. Thermal coefficient measurements of the insulation in distribution transformers of a 20 kV network. Measurement 2008, 41, 10–19. [Google Scholar] [CrossRef]
  38. Sarkar, B.; Koley, C.; Roy, N.K.; Kumbhakar, P. Condition monitoring of high voltage transformers using Fiber Bragg Grating Sensor. Measurement 2015, 74, 255–267. [Google Scholar] [CrossRef]
  39. Jung, J.K.; Kang, J.H.; Lee, S.H.; Kim, M. In-situ measurement of the current transformer burden in a current transformer testing system using a shunt resistor. Measurement 2007, 40, 876–882. [Google Scholar] [CrossRef]
  40. So, E.; Arseneau, R.; Hanique, E. No-load loss measurements of power transformers under distorted supply voltage waveform conditions. IEEE Trans. Instr. Meas. 2003, 52, 429–432. [Google Scholar] [CrossRef]
  41. Arseneau, R.; So, E.; Banique, E. Measurements and Correction of No-Load Losses of Power Transformers. IEEE Trans. Instr. Meas. 2005, 54, 503–506. [Google Scholar] [CrossRef]
  42. Blanke, H.; Bohlen, O.; Buller, S.; De Doncker, R.W.; Fricke, B.; Hammouche, A.; Linzen, D.; Thele, M.; Sauer, D.U. Impedance measurements on lead–acid batteries for state-of-charge, state-of-health and cranking capability prognosis in electric and hybrid electric vehicles. J. Power Sources 2005, 144, 418–425. [Google Scholar] [CrossRef]
  43. Suozzo, C. Lead-Acid Battery Aging and State of Health Diagnosis. Master’s Thesis, Ohio State University, Columbus, OH, USA, 2008. [Google Scholar]
  44. Huet, F. A review of impedance measurements for determination of the state-of-charge or state-of-health of secondary batteries. J. Power Sources 1998, 70, 59–69. [Google Scholar] [CrossRef]
  45. Micea, M.V.; Ungurean, L.; Cârstoiu, G.N.; Groza, V. Online State-of-Health Assessment for Battery Management Systems. IEEE Trans. Instr. Meas. 2011, 60, 1997–2006. [Google Scholar] [CrossRef]
  46. Yu, J.B. State-of-health monitoring and prediction of lithium-ion battery using probabilistic indication and state-space model. IEEE Trans. Instr. Meas. 2015, 64, 2937–2949. [Google Scholar]
  47. Stevanatto, L.C.; Brusamarello, V.J.; Tairov, S. Parameter identification and analysis of uncertainties in measurements of lead–acid batteries. IEEE Trans. Instr. Meas. 2014, 63, 761–768. [Google Scholar] [CrossRef]
  48. Rasmussen, N. The Role of Isolation Transformers in Data Center UPS Systems; White Paper n. 9, rev. 0; Schneider Electric Data Center Science Center: Rueil Malmaison, France, 2011; pp. 1–26. [Google Scholar]
  49. Corrigan, S. Controller Area Network Physical Layer Requirements; TI Application Report, SLLA270; Texas Instruments: Dallas, TX, USA, 2008. [Google Scholar]
  50. Fanucci, L.; Saponara, S.; Morello, A. Power optimization of an 8051-compliant IP microcontroller. IEICE Trans. Electron. 2005, E88-C, 597–600. [Google Scholar] [CrossRef]
  51. Saponara, S.; Petri, E.; Fanucci, L.; Terreni, P. Sensor modeling, low-complexity fusion algorithms, and mixed-signal IC prototyping for gas measures in low-emission vehicles. IEEE Trans. Instr. Meas. 2011, 60, 372–384. [Google Scholar] [CrossRef]
  52. Marsi, S.; Saponara, S. Integrated video motion estimator with Retinex-like pre-processing for robust motion analysis in automotive scenarios: Algorithmic and real-time architecture design. J. Real-Time Image Process. 2010, 5, 275–289. [Google Scholar] [CrossRef]
  53. L’insalata, N.E.; Saponara, S.; Fanucci, L.; Terreni, P. Automatic synthesis of cost effective FFT/FFT cores for VLSI OFDM systems. IEICE Trans. Electron. 2008, E91-C, 487–496. [Google Scholar] [CrossRef]
  54. Fanucci, L.; Saletti, R.; Saponara, S. Parametrized and reusable VLSI macro cells for the low-power realization of 2-D discrete-cosine-transform. Microelectron. J. 2001, 32, 1035–1045. [Google Scholar] [CrossRef]
  55. Genovesi, S.; Saponara, S.; Monorchio, A. Parametric design of compact dual-frequency antennas for wireless sensor networks. IEEE Trans. Antennas Prop. 2011, 59, 2619–2627. [Google Scholar] [CrossRef]
Figure 1. Double conversion architecture of the proposed UPS; power transformers positioning is also shown.
Energies 09 00327 g001
Figure 2. Distributed network of measuring nodes for predictive diagnosis of power transformer degradation and battery modules degradation.
Energies 09 00327 g002
Figure 3. VRLA circuit model and its Nyquist impedance.
Energies 09 00327 g003
Figure 4. Architecture of an AIP node.
Energies 09 00327 g004
Figure 5. Snapshots of (a) An implemented node highlighting sensors for power transformer vibration analysis; (b) Electrical connections and accelerometers for measurements of power transformer characteristics.
Energies 09 00327 g005
Figure 6. Vibration analysis of a healthy transformer, 250 Vac/100 A secondary, sensors on the transformer windings.
Energies 09 00327 g006
Figure 7. Vibration analysis of a degraded transformer, 250 Vac/170 A secondary, sensors on the transformer windings.
Energies 09 00327 g007
Figure 8. Vibration analysis of a degraded transformer, 250 Vac/100 A secondary, sensors on top the transformer.
Energies 09 00327 g008
Figure 9. (a) Current/voltage waveforms on a VRLA cell at 1 kHz; (b) VRLA cell voltage and value of the 10 h discharge current.
Energies 09 00327 g009
Figure 10. Nyquist plot of the impedance vs. aging (0.1 Hz to 1 kHz).
Energies 09 00327 g010
Figure 11. Post-aging operating voltage distribution, all cells in a string.
Energies 09 00327 g011
Table 1. Main parameters of the proposed UPS.
UPS System
Size (kVA)Input Voltage (Vac)Input Freq. (Hz)Input Current Distortion, %Input Voltage (Vdc)Output Voltage (Vac)Output Freq. (Hz)Efficiency (%)
10 to 150400 V ± 20%50 Hz/60 Hz ± 10%5% with 12 pulses bridge + THD filter384 V ± 20% (e.g., from batteries)3 × 400 V ± 5% (see inverter output data)50 Hz/60 Hz ± 1%88 to 93
SCR-Based Rectifier (AC/DC)
Output Current Max. (A)Efficiency (%)
50 to 35093 to 97
IGBT-Based Inverter (DC/AC)
Input Voltage (Vdc)Efficiency (%)Output Voltage (Vac)Output Voltage Stability (static)Output Voltage Stability (dynamic)Total Harmonic Distortion (THD)
384 V ± 20% (min. 307 V)95 to 963 × 400 V1% static * 5% dynamic, reset to 1% in 40 ms *1.5% linear load **, <5% with no linear load **
* according to IEC 60146-1-1, IEC 60146-2; ** according to IEC62040-3.

