Article

Phenol-Formaldehyde Resin-Based Carbons for CO2 Separation at Sub-Atmospheric Pressures

by
Noelia Álvarez-Gutiérrez
,
María Victoria Gil
,
María Martínez
,
Fernando Rubiera
and
Covadonga Pevida
*,†
Instituto Nacional del Carbón, INCAR-CSIC, Apartado 73, 33080 Oviedo, Spain
*
Author to whom correspondence should be addressed.
These authors contributed equally to this work.
Energies 2016, 9(3), 189; https://doi.org/10.3390/en9030189
Submission received: 16 December 2015 / Revised: 9 February 2016 / Accepted: 6 March 2016 / Published: 11 March 2016

Abstract

:
The challenge of developing effective separation and purification technologies that leave much smaller energy footprints is greater for carbon dioxide (CO2) than for other gases. In addition to its involvement in climate change, CO2 is present as an impurity in biogas and bio-hydrogen (biological production by dark fermentation), in post-combustion processes (flue gas, CO2-N2) and many other gas streams. Selected phenol-formaldehyde resin-based activated carbons prepared in our laboratory have been evaluated under static conditions (adsorption isotherms) as potential adsorbents for CO2 separation at sub-atmospheric pressures, i.e., in post-combustion processes or from biogas and bio-hydrogen streams. CO2, H2, N2, and CH4 adsorption isotherms at 25 °C and up to 100 kPa were obtained using a volumetric equipment and were correlated by applying the Sips model. Adsorption equilibrium was then predicted for multicomponent gas mixtures by extending the multicomponent Sips model and the Ideal Adsorbed Solution Theory (IAST) in conjunction with the Sips model. The CO2 uptakes of the resin-derived carbons from CO2-CH4, CO2-H2, and CO2-N2 at atmospheric pressure were greater than those of the reference commercial carbon (Calgon BPL). The performance of the resin-derived carbons in terms of equilibrium of adsorption seems therefore relevant to CO2 separation in post-combustion (flue gas, CO2-N2) and in hydrogen fermentation (CO2-H2, CO2-CH4).

1. Introduction

The sustainable production of energy is currently a topic of extensive research with the aim of producing low carbon footprint processes and mitigating the CO2 impact [1]. As a sustainable and clean energy source with minimal or zero use of hydrocarbons, hydrogen is a promising alternative to fossil fuels [2]. Hydrogen can be generated by thermochemical, electrochemical or microbial fermentation processes. Biological methods are preferable to chemical methods because they offer the possibility of using sunlight, CO2 and organic wastes as substrates for environmentally benign conversions under moderate conditions [3]. The biological methods for generating H2 include light-dependent methods, such as direct and indirect biophotolysis and photo fermentation; and methods not dependent on light, such as the dark fermentation process and bioelectrochemical systems (BES). Hydrogen production through dark fermentation has advantages over the other processes because it does not require the input of external energy and it offers the possibility of rapid scalability owing to its similarity to the well-known anaerobic digestion process [4]. In addition, bio-hydrogen production from anaerobic fermentation is linked to bio-methane generation since the process develops in two main stages. In the first stage acidogenic bacteria break down substrates into primarily H2, acetic acid, and CO2, and in the second stage methanogenic bacteria convert acetic acid, H2, and CO2 to methane gas. The two reactions can be separated, at least partially, in distinct bioreactors placed in series. Both streams must be further purified to obtain bio-hydrogen and bio-methane with a high calorific value, appropriate for industrial applications [5]. Concentrations of H2 of up to 30–70 vol% on average and of up to 45–80 vol% in the case of CH4 on average can be achieved but the presence of CO2 in both streams (20–70 vol%) is a nuisance and needs to be removed for further utilization of H2 and CH4 [6].
On the other hand, conventional energy production from fossil fuels is one of the main sources of anthropogenic CO2. The separation of CO2 from flue gas (post-combustion CO2 capture), is very challenging given that it is at near atmospheric pressure and CO2 only represents between 4 to 15 vol%, depending on the fuel used, and if dry or wet basis conditions are considered. However, the conditions required for CO2 transport, storage or subsequent use as a chemical make a concentration step necessary to reach the set target of ca. 95 vol%.
Different technologies have been evaluated to separate CO2 under sub-atmospheric pressure and particular emphasis has been paid in recent years to post-combustion CO2 capture due to increasing concerns about global warming and climate change. Adsorption with low temperature solid sorbents has the potential to reduce the energy penalty associated with the separation of CO2 at sub-atmospheric pressures, not only under post-combustion capture conditions (CO2/N2 separation) but also for bio-hydrogen (CO2/H2 separation) and bio-methane production (CO2/CH4 separation) [7,8]. However, the success of these approaches depends on the development of adsorbents with a high selectivity, sufficient adsorption capacity and easy regeneration. Carbon adsorbents fulfil all these requirements: they have a significant adsorption capacity at atmospheric pressure and the necessary characteristics for the separation of CO2 at sub-atmospheric pressures including hydrophobicity, low cost and low intensity in terms of the amount of energy required for regeneration.
The distinction between activated or porous carbons and carbon molecular sieves has not been clearly defined. Whereas most of the pores in carbon molecular sieves are in the molecular size range, activated carbons may also have very small pores. The main difference is that activated carbons separate molecules through differences in their adsorption equilibrium whereas carbon molecular sieves provide molecular separations based on rate of adsorption, allowing the separation of molecules on the basis of their size, rather than on the differences in adsorption capacity [9,10].
The use of polymeric precursors to produce activated carbons allows the incorporation of custom tailored features (e.g., pore size, conformation, etc.) along with other material properties to meet the required specifications. Phenol-formaldehyde resin-derived microporous activated carbons have been previously studied in our laboratory [6,11,12]. They can be produced in a wide variety of physical forms, at a low cost and with a close control of porosity. More importantly, all these features are accompanied by a very low level of impurities and good physical strength, key parameter in the design of an adsorption process [13,14].
In this work, the performance of phenol-formaldehyde resin-based activated carbons prepared in our laboratory to separate CO2 at sub-atmospheric pressures has been evaluated in a fundamental study of the equilibrium of adsorption of CO2, N2, H2 and CH4. A preliminary CO2 uptake screening test has been carried out to discard the samples with less than 2 mol·kg−1 of CO2 adsorbed at atmospheric pressure. Adsorption models are very useful as they can predict the behaviour of the equilibrium of adsorption over a wide range of temperatures and pressures. In order to predict multicomponent adsorption from binary CO2-CH4, CO2-H2, and CO2-N2 mixtures, the extended multicomponent Sips equation and the Ideal Adsorbed Solution Theory (IAST) in conjunction with the Sips model have been used and the results have been compared. Both equations deliver different conclusions regarding the heterogeneity of the adsorbate-adsorbent system. Additionally, a commercial activated carbon (Calgon BPL) was evaluated under the same operating conditions as a reference carbon adsorbent.

2. Materials and Method

Porous carbons can be prepared from a wide range of carbon-containing materials including coal, lignin, wood, peat and synthetic and natural polymers. Carbonisation and activation of these materials under appropriate conditions yield carbons with a rather uniform pore structure consisting of micropores whose size is similar to that of the adsorbed molecules. For instance, low-density materials can be prepared by carbonisation of polymeric compounds pretreated by various procedures, including modification with inorganic additives [15]. In particular, carbon sorbents with exactly the prescribed structure have been prepared using NaCl [16] and silicon [17] additives.

2.1. Synthesis of Carbon Precursors

Phenol-formaldehyde (PF) resins were used in this work to produce carbon-based microporous materials. Synthesis was conducted following two different routes, acid (hydrochloric acid, 37 wt% HCl solution) and basic (sodium hydroxide, NaOH) catalysis for the Novolac and the Resol resins, respectively. Details on the synthesis of the PF resins can be found elsewhere [18]. Carbon precursors were prepared from the aforementioned resins, and potassium chloride (KCl) was incorporated as inorganic additive. One set of materials was impregnated with a saturated KCl solution at ambient temperature (set a) while another was boiled in a saturated KCl solution (set b). Another carbon precursor was prepared by mixing PF resin with an agricultural by-product, olive stones (OS), at a proportion of 20:80 wt% of PF to OS. A curing agent, hexamethylenetetramine (hexa) was added to PF at a hexa ratio of 7:2 wt%. Table 1 summarizes the materials and conditions for the production of the PF resin-derived carbon precursors.

2.2. Production of Microporous Carbons

The prepared carbon precursors were first carbonised and then activated with CO2 to develop their microporous structure, preferably in the narrow microporosity domain (pore sizes of less than 1 nm) since CO2 adsorption at sub-atmospheric pressures is known to focus on the narrow micropores [15,19,20].
Carbonisation was conducted in a tubular furnace under an inert atmosphere (50 mL·min−1 of N2). Two different temperature programs were selected for PF-KCl; the two precursors of set a were subjected to a one-step carbonisation procedure at 600 °C for 1.5 h while for set b, a three-step slow carbonisation treatment at 200 (1 h), 600 (0.5 h) and 1000 °C (0.5 h) was carried out. The PF-OS composite was carbonised at 1000 °C (0.2 h) by slowly heating from ambient temperature at 4 °C·min‒1.
Activation with carbon dioxide favours the development of microporosity [21]. The largest increase in porosity is produced in the early stages of the activation process. Burn off (i.e., degree of activation) increases the widening of existing micropores but external burning of the particle outweighs the creation of new porosity, resulting in a net destruction of porosity, especially above 40%–50% burn off [22]. Control of the activation parameters (temperature and burn off degree) is crucial for tailoring the micropore size distribution. Previous works carried out in our research group have demonstrated the relationship between the volume of narrow micropores of less than 0.7 nm and CO2 uptake at atmospheric pressure [20]. Response surface methodology was performed to obtain the optimum conditions of activation with CO2 that maximise CO2 adsorption at atmospheric pressure for each precursor (details can be found in [18]). Activation with CO2 was conducted in a tubular furnace with a CO2 flowrate of 10 mL·min−1. Table 2 summarises the conditions of the carbonisation and activation with CO2 steps. Yields of char production during carbonisation were around 40% for PF-KCl precursors independently of the carbonisation temperature selected or type of PF resin (acid, No, or basic, Re), and slightly lower for PF-OS due to the high volatile matter content of the biomass: olive stones. Higher activation temperatures were required for the No1KCl than for the ReKCl precursors and even higher ones for No2OS. The burn off degrees ranged between 10 and 50%, the two limits of the experimental region tested, for the ReKCl precursors while intermediate values were found to be optimal for the No1KCl and No2OS precursors. It should be noted that for precursors No1KClb and No2OS the burn off was not statistically significant, according to the response surface methodology. Consequently, the lowest burn off to yield the highest experimental CO2 uptake was selected. For the sense of clarity and simplicity the activated samples will be denoted hereafter as follows: RKa-A71 (ReKCla activated carbon), RKb-A75 (ReKClb activated carbon), NKa-A82 (No1KCla activated carbon), NKb-A82 (No1KClb activated carbon) and NOS-A94 (No2OS activated carbon).

3. Results and Discussion

3.1. Chemical and Textural Characterisation

The elemental composition (carbon, hydrogen and oxygen contents) of the PF resins, the PF-KCl and PF-OS precursors and the corresponding chars and activated materials were determined using a LECO CHN-2000 analyzer. The acid/basic character of the carbon surfaces was evaluated by means of the Point of Zero Charge (pHPZC), as determined by mass titration. The data are presented in Table 3.
The synthesised resins, Re, No1 and No2, do not contain nitrogen and so it has not been included in the table. As expected for a carbon precursor the C contents in the initial resins are high (>70 wt%) and are enhanced during the subsequent steps of carbonisation and activation. The resultant activated materials present C contents well above 90 wt% at the expense of a reduction in the volatile matter content, here represented by the O and H contents.
There is a basification effect on the carbon surfaces as a consequence of the activation with CO2. This effect is particularly significant in the case of the activated carbons produced from the acid catalyzed resins (No1 and No2). Basicity might be ascribed to basic oxygen functionalities incorporated from the activating gas (CO2) or to Lewis type basic sites associated to the carbon structure [11].
Textural characterisation of the samples mainly involved the evaluation of the microporosity (pore sizes < 2 nm), given the critical role of these pore sizes on the CO2 adsorption capacity of the samples. The N2 and CO2 adsorption isotherms at −196 and 0 °C, respectively (Figure 1a,b), were determined in a Micromeritics TriStar 3000 volumetric apparatus. Prior to any measurements, the samples were outgassed overnight at 100 °C under vacuum.
The five tested activated carbons exhibited distinctive textural features, as can be observed in Figure 1a. RKa-A71 is the least developed in terms of total porosity but shows a type I isotherm, according to the IUPAC classification, characteristic of strictly microporous materials. RKb-A75 presents a wider microporosity, characterised by a more open knee at low relative pressures, and it also shows a hysteresis loop at relative pressures above 0.4, which suggests the presence of some mesoporosity in the sample. On the other hand, NKa-A82 and NKb-A82 display similar type I isotherms but with different volumes of adsorbed N2 along the evaluated pressures. NOS-A94 is the sample that has the most extended textural development, particularly in the domain of microporosity. Regarding CO2 adsorption at 0 °C (Figure 1b), the uptake of the activated carbons follows the order: NKa > NKb ≈ NOS > RKa > RKb. RKa-A71 is the sample with the narrowest microporosity as reflected by the more pronounced curvature of the CO2 isotherm.
The micropore volumes (W0) and average micropore widths (L0) were determined by applying the Dubinin–Radushkevich (DR) relation [23] and the Stoeckli-Ballerini relation [24] to these isotherms, respectively. This allowed the total microporosity and the narrow microporosity (pore sizes <1 nm) to be assessed. The textural parameters estimated from the experimental N2 and CO2 isotherms are collected in Table 4.
As expected, in agreement with the shape of the corresponding isotherms, most of the porosity in NKa-A82, NKb-A82 and NOS-A94 lies in the microporosity domain. To be more precise, NKb-A82 concentrates its microporosity in the narrow microporosity range, whereas NKa-A82 and, particularly, NOS-A94 have a wider microporosity. Samples RKa-A71 and RKb-A75 show similar narrow micropore volumes (W0,CO2). The textural development of RKa-A71 is restricted to this narrow microporosity, whereas RKb-A75 also presents supermicropores (1–2 nm) and mesopores (2–50 nm) as can be inferred from the differences between Vp, W0,N2 and W0,CO2. Average micropore widths (L0,N2) of around 1 nm for the NK and NOS based ACs and ca. 2 nm for the RKb-A75 sample were assessed. The narrow microporosity (L0,CO2) fell within the 0.6–0.7 nm range. The route selected to synthesise the PF precursor compromised the textural development that could have been achieved for the activated carbon. In order to gain a better insight into the narrow microporosity, the pore size distributions in the range of 0.3–1 nm were estimated by means of the Density Functional Theory (DFT) for CO2 adsorption onto slit pore carbons using Micromeritics’ software (method: non-negative regularization, little smoothing). The plots are shown in Figure 2.
The narrow micropore size distributions of the studied materials can be described as bimodal as they present two main peaks with characteristic pore sizes in the range of 0.55–0.65 and 0.8–0.9 nm, respectively. The bimodal shape of the pore size distributions is a characteristic feature for many adsorbents possessing even a small amount of micropores. It is shown that this feature results from the similarity of the local adsorption isotherm in the range of the pore widths for which the gap between peaks (related to the primary and secondary micropore filling mechanism) exists [25].
Generally, the tested carbons show striking similarities in the pore size distributions. Sample RKa-A71 seems the exception as it shows a narrower micropore size distribution. The sizes of the narrow micropores in the materials are highly suitable for the separation of CO2 at sub-atmospheric pressures [15,20].

3.2. CO2 Uptake Screening

The CO2 adsorption capacity of the produced carbons was first evaluated at sub-atmospheric pressures and room temperature. CO2 adsorption isotherms at 25 °C and up to 101 kPa were determined in a Quantachrome Nova 4000 volumetric device. The samples were previously outgassed overnight at 100 °C under vacuum. A commercial activated carbon, Calgon BPL, was also tested for reference purposes [26]. This is a Calgon Carbon granular activated carbon specifically designed for use in gas phase applications. The measured isotherms are plotted in Figure 3.
The NK and NOS carbons showed substantial CO2 uptakes over the sub-atmospheric pressure range tested, with isotherms characterised by more pronounced slopes at pressures below 20 kPa. Maximum CO2 uptakes of 2.9, 2.4 and 2.3 mol·kg−1 were achieved at 101 kPa for samples NKa-A82, NKb-A82 and NOS-A94, respectively. The isotherms of the two NK samples nearly overlapped in the pressure range below 20 kPa, as might be expected from the similarities in the narrower microporosity of both samples. When the pressure approaches the atmospheric value, differences in the CO2 adsorption capacity appeared revealing the different microporosity features of the two NK activated carbons. The performance of carbon NOS shows striking similarities to that of NKb in agreement with the similarities in the narrow microporosity of both samples. The RK carbons showed similar performances to that of the commercial activated carbon over the tested pressure range with maximum CO2 uptakes of less than 2 mol·kg−1 at 101 kPa. Taking 2 mol·kg−1 as the screening value for selecting optimum CO2 adsorbents, RK carbons were discarded for further study.

3.3. Binary Adsorption from Mixtures of CO2-H2, CO2-CH4, and CO2-N2

3.3.1. Single-Component Adsorption Isotherms

H2, CH4, and N2 adsorption isotherms at 25 °C and sub-atmospheric pressures (up to 100.3 kPa) for the NK and NOS carbons were obtained using a Micromeritics TriStar 3000 volumetric equipment. BPL was also tested for comparison purposes. Detailed textural characteristics of this activated carbon can be found elsewhere [27]. Prior to analysis the samples were outgassed overnight at 100 °C under vacuum.
Experimental data of the single component CO2, H2, CH4, and N2 adsorption isotherms were fitted to the Sips equation, as follows:
Sips equation :   q = q s ( b P ) 1 / n 1 + ( b P ) 1 / n
where q represents the concentration of the adsorbed species, qs the saturation capacity and P the pressure of the adsorptive. The parameters b, n and qs are temperature dependent; b usually takes the form of the adsorption affinity. The parameter n shows the heterogeneity of the system and its value is usually greater than unity; therefore, the larger the value of n, the more heterogeneous the system is.
This empirical three-parameter equation has been widely used for fitting the isotherm data of different hydrocarbons on activated carbon. The Sips equation is believed to give a more accurate fit over a larger pressure regime than the standard Langmuir or Freundlich equations, and provides more accurate prediction of the quantity adsorbed at saturation than the Langmuir equation for heterogeneous adsorbents. However, it suffers from the same disadvantage as the Freundlich equation: it does not reduce to Henry’s Law at low surface coverage [28].
Fitting of the model to the experimental data was conducted by means of the Solver Excel tool (Microsoft Office Excel 2010) departing from values of qs and n of 1 and b of 0. The goodness of the fit was evaluated on the basis of the minimum squared relative error (SRE) as given by the following expression:
S R E ( % ) = i [ ( q exp , i q mod , i ) / q exp , i ] 2 N 1 × 100
where qexp,i and qmod,i are the experimental and Sips-predicted adsorbed amounts of component i, respectively, and N is the number of experimental data points. The optimal parameters and squared relative errors from fitting the Sips model to the single-component data of CO2, H2, CH4, and N2 at 25 °C are summarized in 
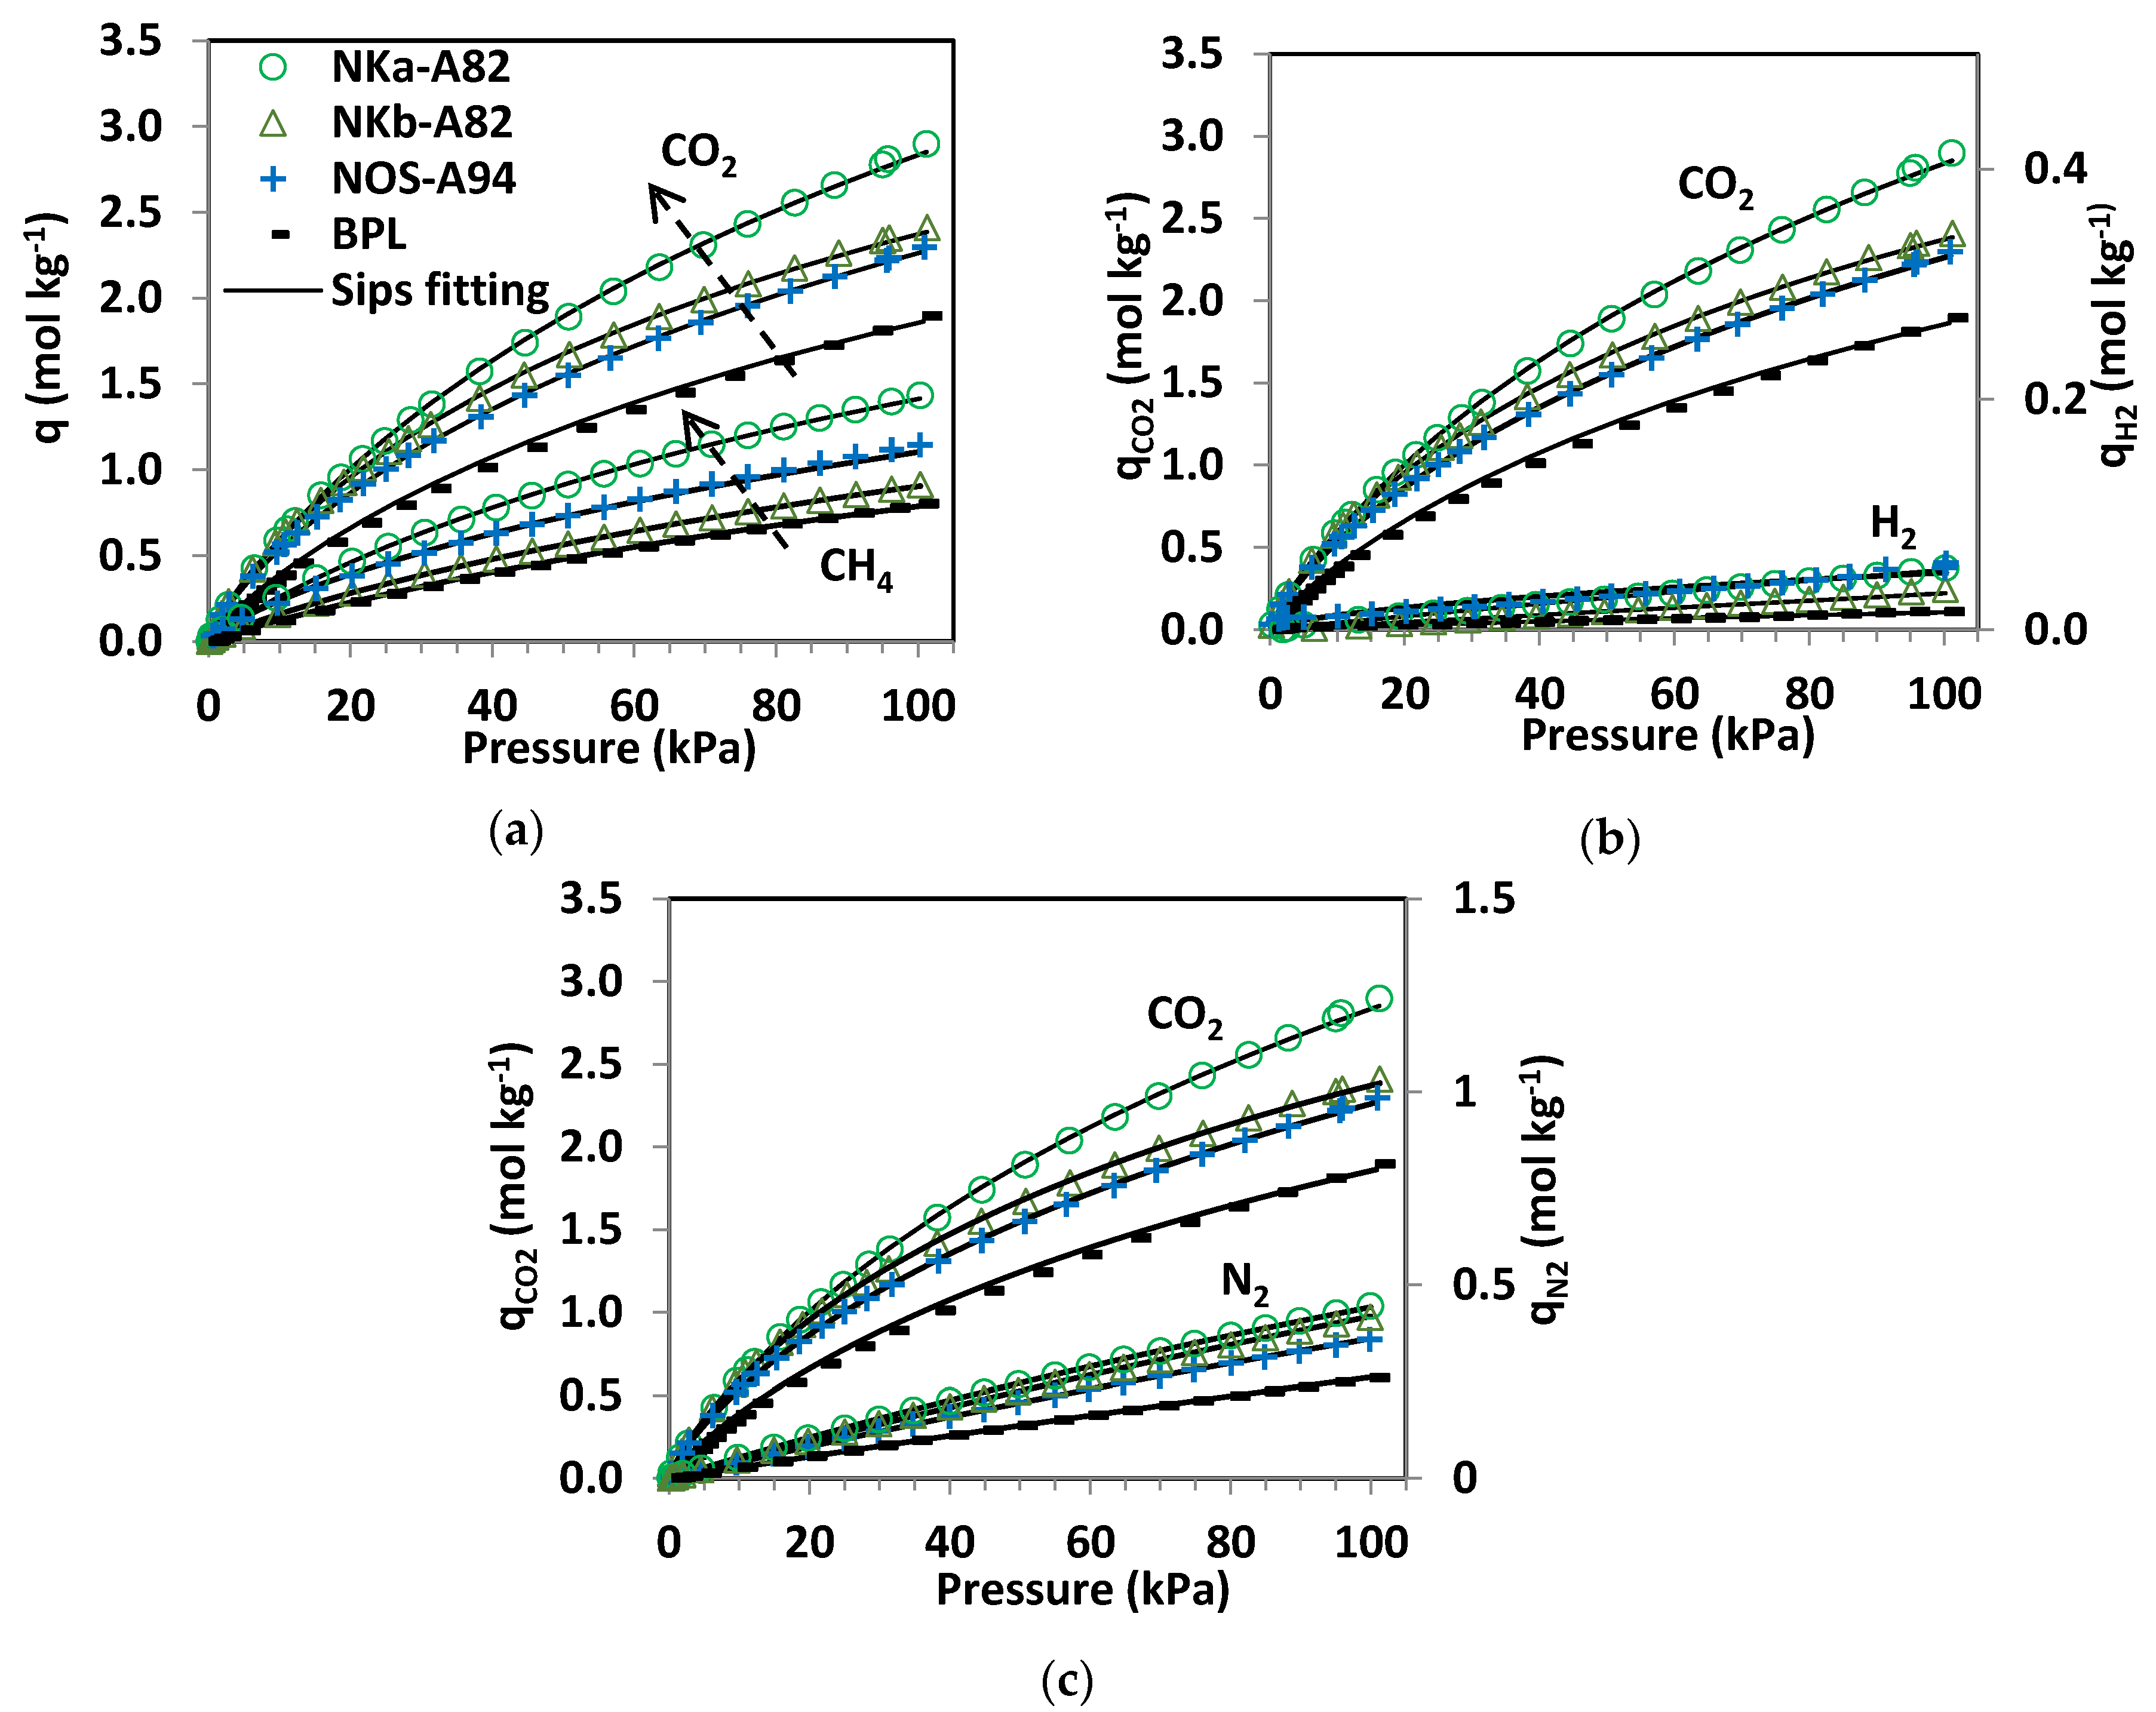
Table 5. Isotherm experimental data and fittings to the Sips model are shown in Figure 4.
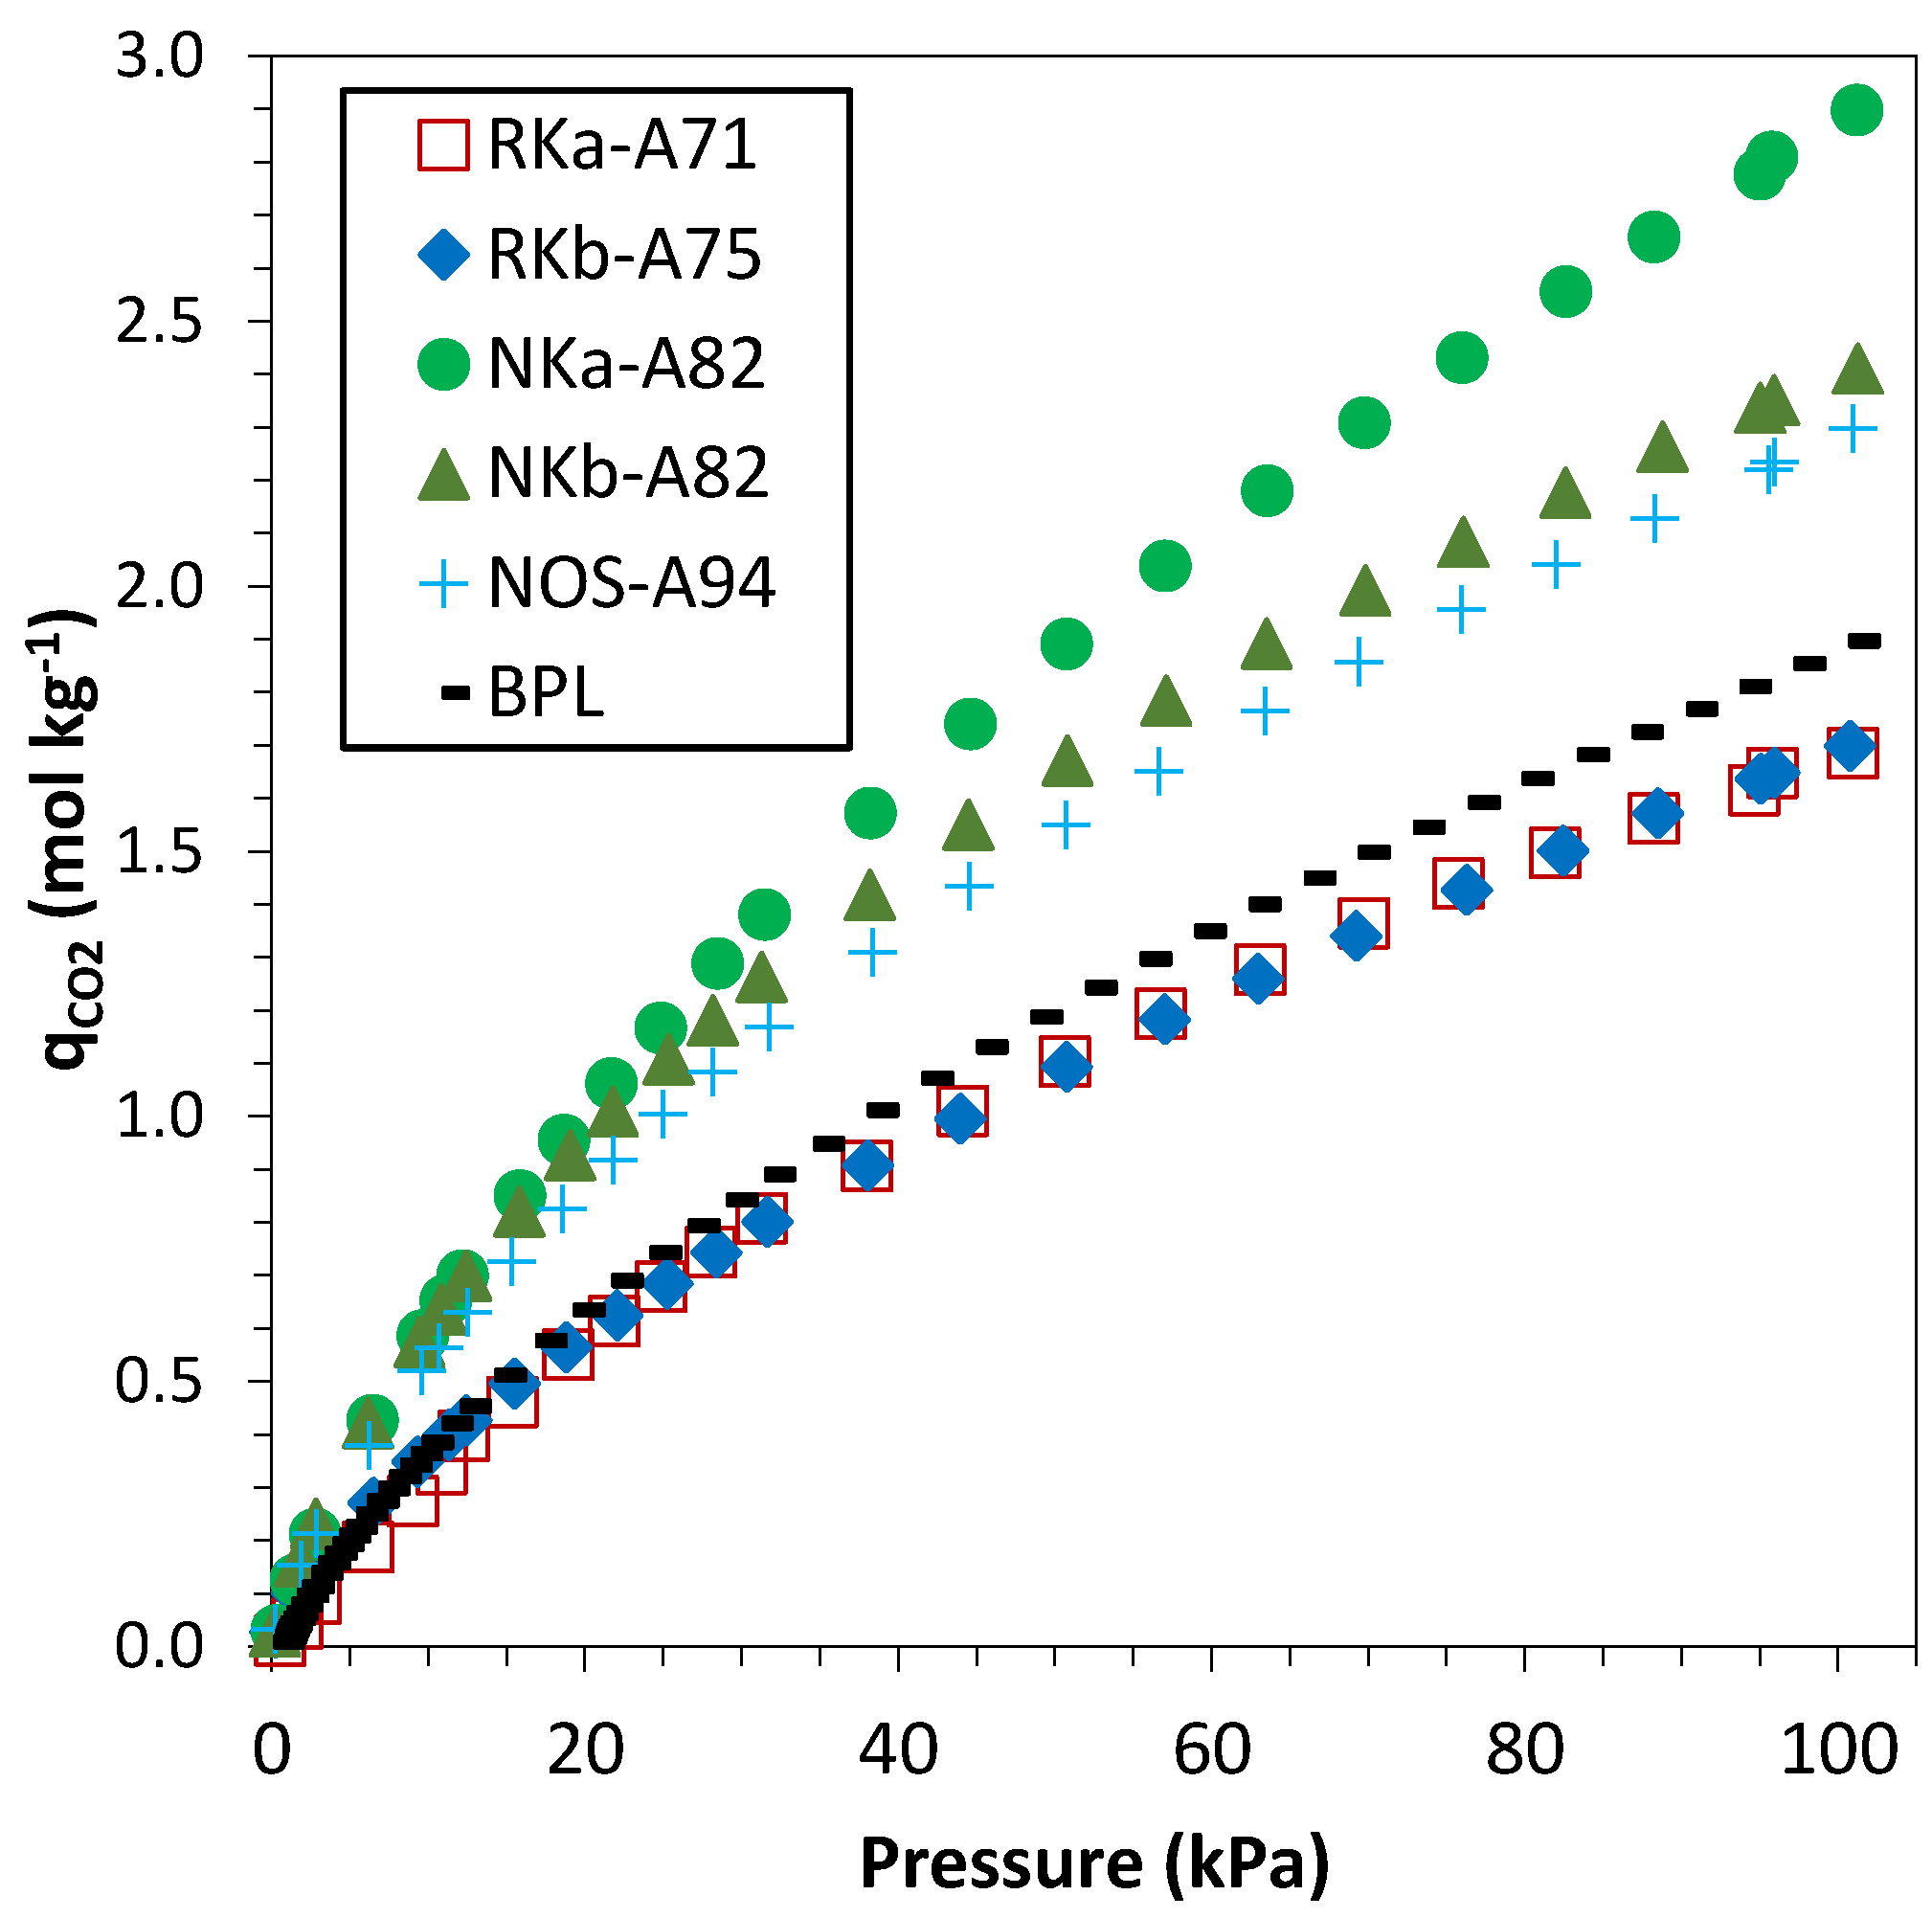
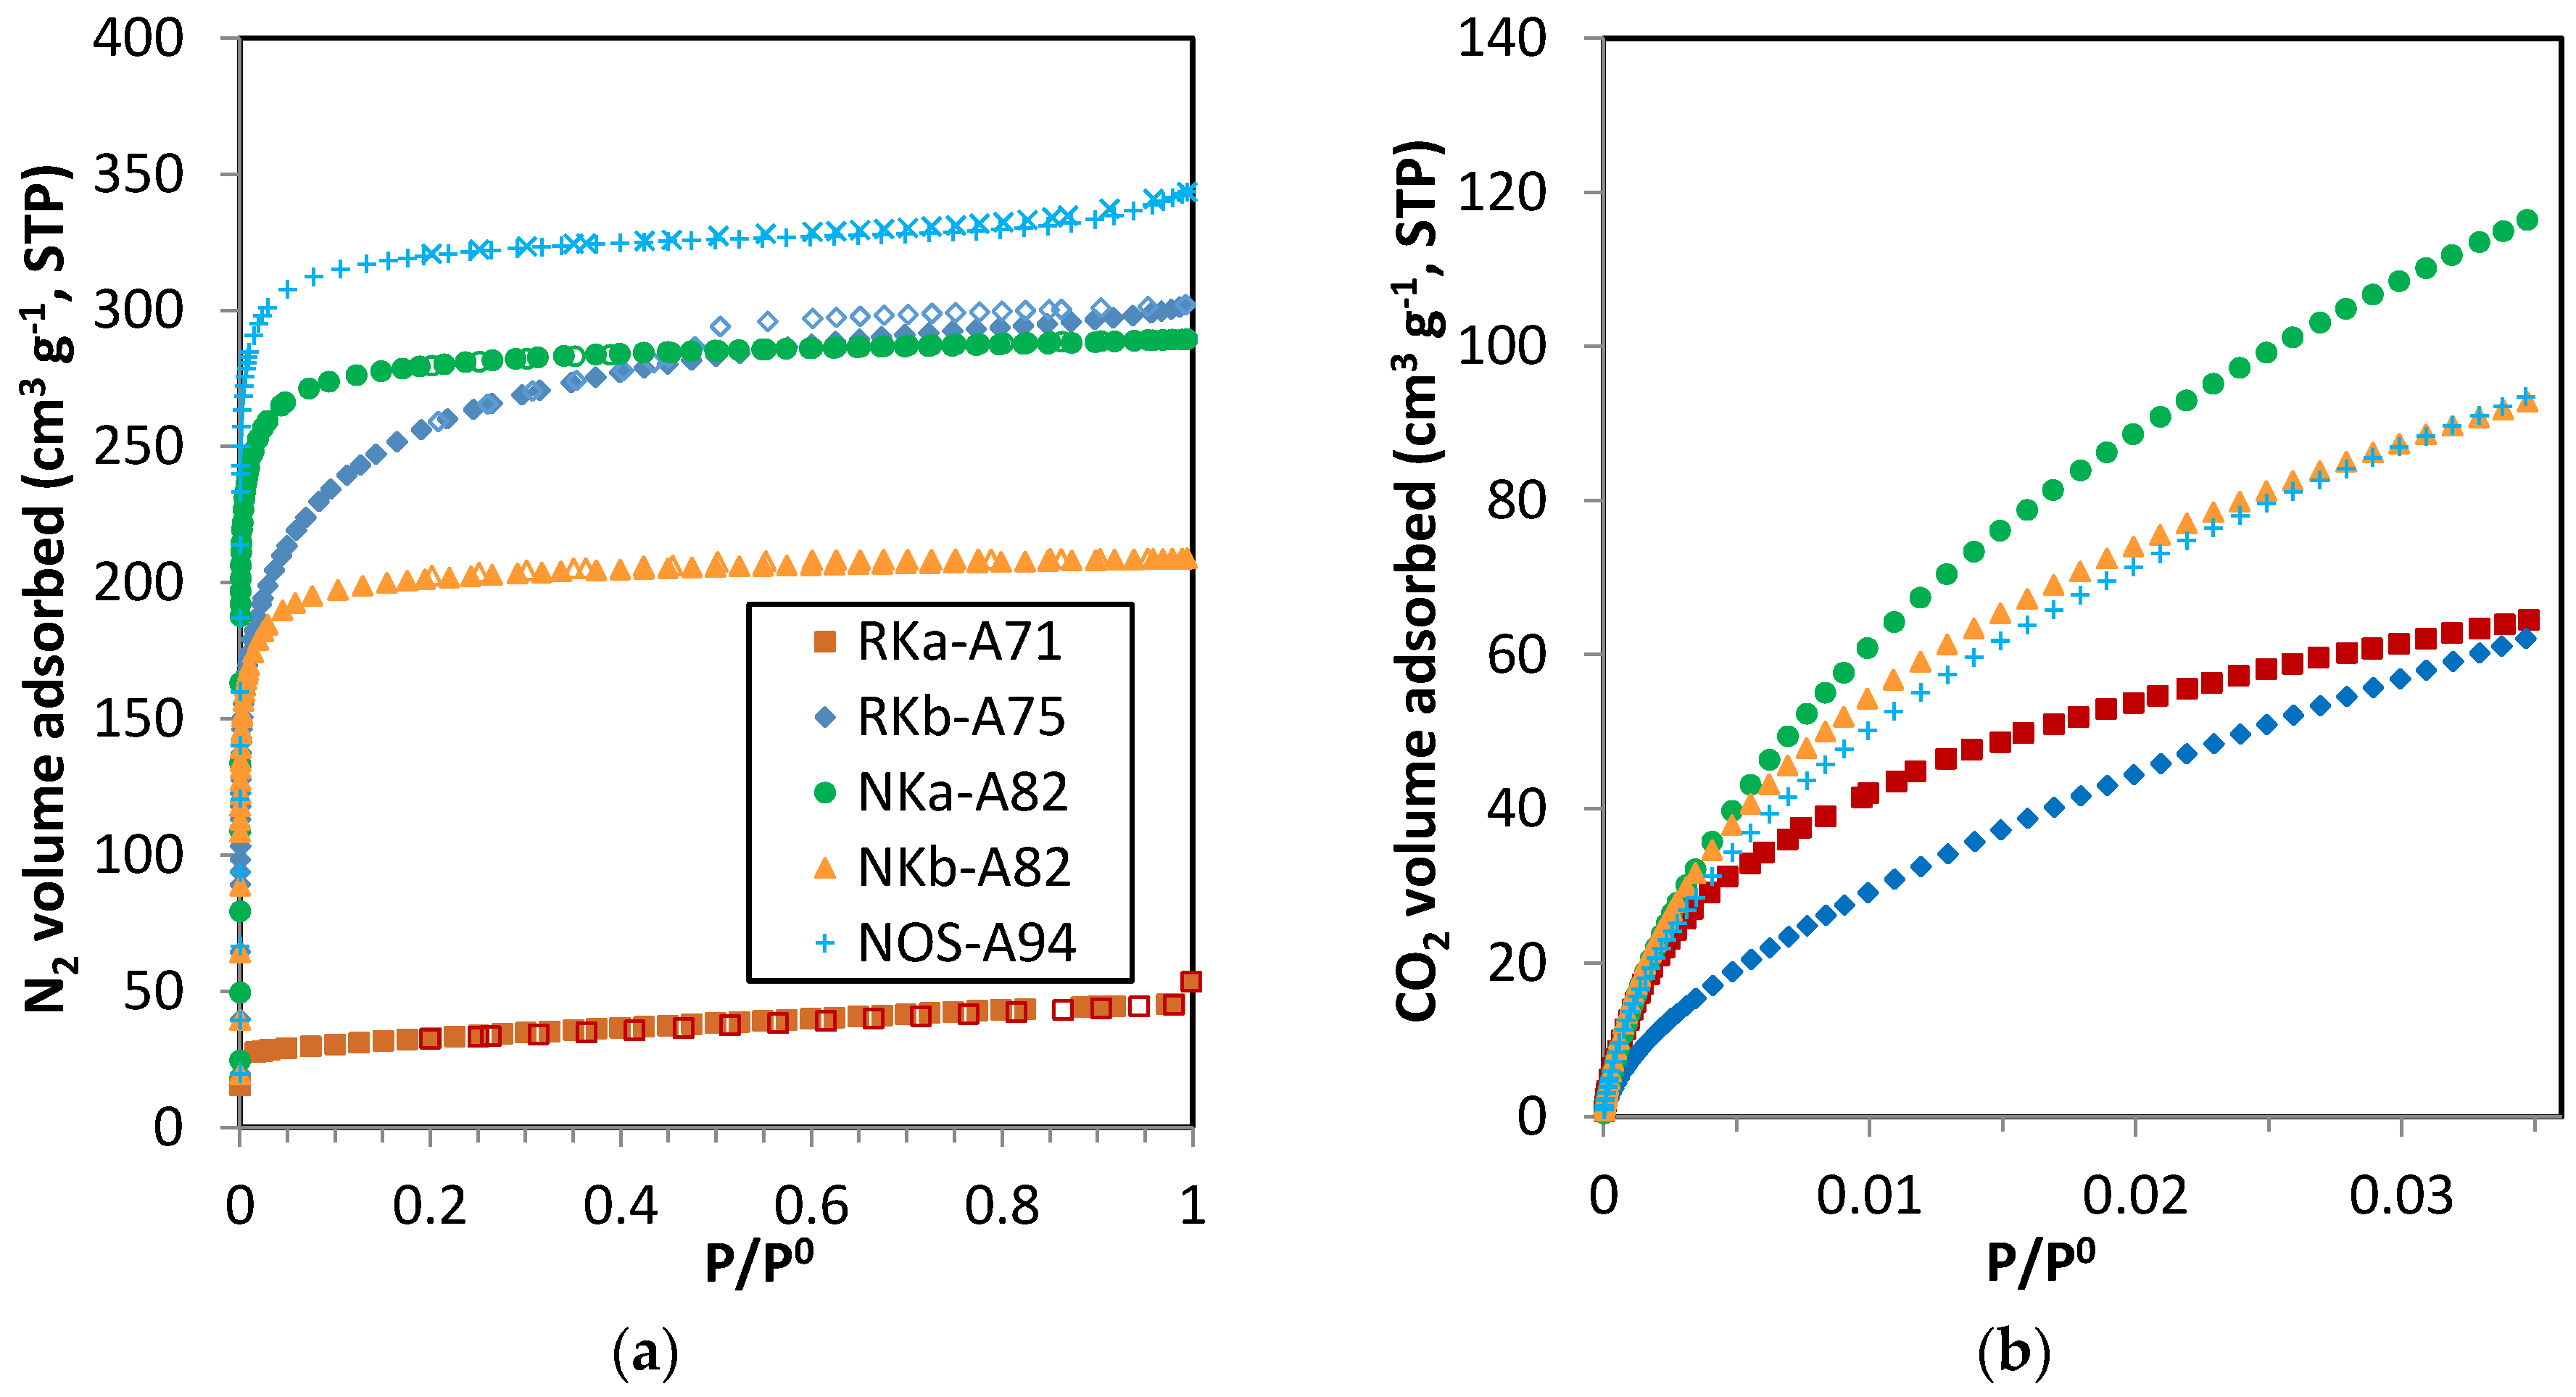
The experimental adsorption data show that much more CO2 is adsorbed than CH4 and more significantly than N2 and H2 on the tested carbons. The differences in CO2, CH4 and N2 uptake may be explained by the larger quadrupole moment of CO2 that produces a strong attraction towards the adsorbent surface resulting in a greater uptake. The high level of polarizability of CO2 and CH4 can create a momentary shift in its neutral electrostatic field but this attraction force is much weaker than the quadrupole moment [29]. In contrast, N2 molecules are nonpolar and smaller, compared with CH4 molecules. For this reason, the differences in CO2 and N2 uptake are greater than the differences in CO2 and CH4 uptake. Since the narrow micropores allow the strongest interaction between the carbonaceous solid and the hydrogen molecule, it is to be expected that this fraction of the porous volume will make a major contribution to the hydrogen adsorption capacity of the materials. Although hydrogen should only interact through induced polarization, surface chemistry may influence hydrogen adsorption on carbonaceous surfaces, particularly at sub-atmospheric pressures [30,31].
By comparing the quantities adsorbed by the phenol-formaldehyde carbons in Figure 4 it can be seen that NKa-A82 is the sample with the greatest CO2, CH4, N2 and H2 uptakes over the sub-atmospheric pressure range tested. Moreover, the adsorption capacities of the three PF carbons are greater than that of the reference carbon, BPL. In terms of CO2 adsorption, the performance at pressures below 20 kPa is quite similar for the NK and NOS carbons and it is only at higher pressures where NKa-A82 stands out. CH
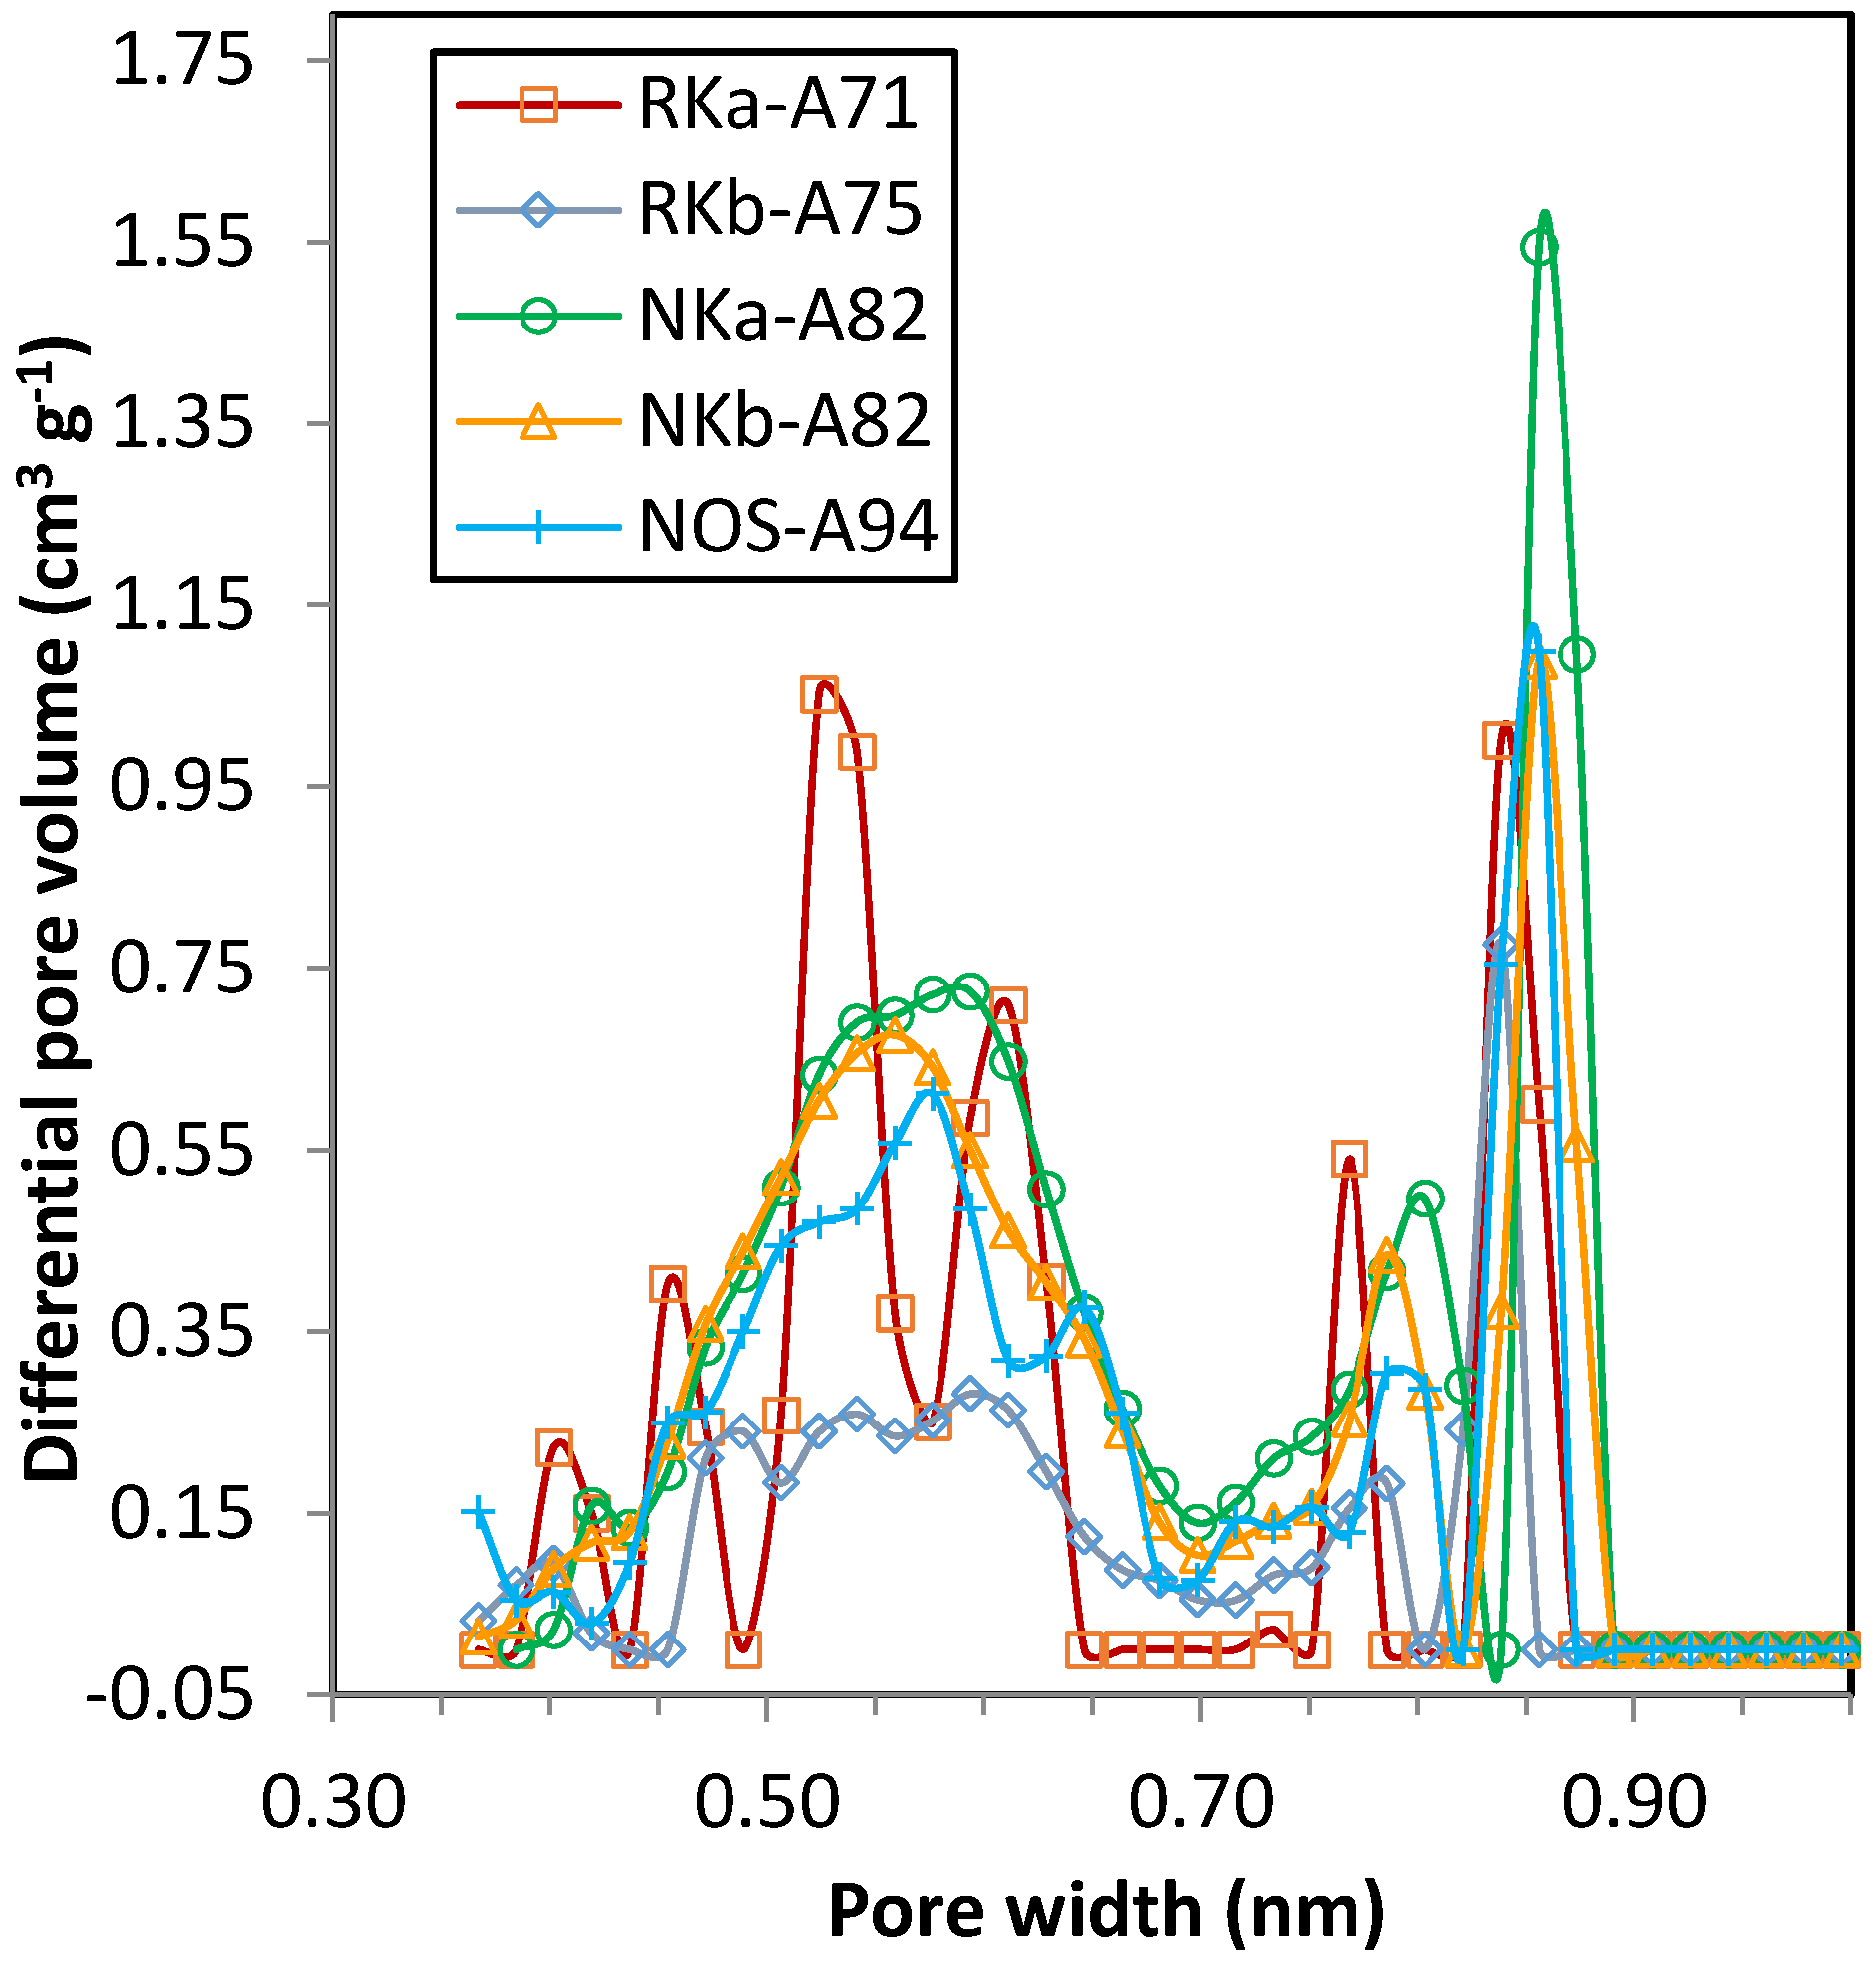
4 adsorption isotherms show differentiated uptakes for the three PF carbons that follow the order NKa > NOS > NKb. All three samples present relevant microporosity; in sample NKb narrow micropores (<1 nm) are mainly encountered, whereas for NKa and NOS microporosity >1 nm is also present, in agreement with the textural parameters estimated from the DR relation (see Table 4). In this scenario selectivity effects related to the kinetic diameters of the two gas molecules (3.30 Å for CO2 and 3.80 Å for CH4) [29] may play a role in the change in the CO2 and CH4 adsorption trends of the three PF carbons. N2 and H2 adsorption is characterised by linear isotherms that reveal the unspecific nature of the adsorbate-adsorbent interaction [32].
The pure component CO2, H2, CH4, and N2 adsorption isotherms fitted to the Sips model (Equation (1)) are represented by the continuous lines in Figure 4. The saturation capacities (qs) and the parameter n have been fitted to the adsorption data for the four gas species independently (Table 5).
The Sips model reproduces the adsorption of CO2, CH4, and N2 with good accuracy, with substantial deviations for the adsorption of H2. It should be noted that the experimental H2 adsorption data at sub-atmospheric pressures and ambient temperature are subject to greater uncertainty due to the significantly lower uptakes of H2 under these conditions. The values of qs and b follow the trend CO2 > CH4 > N2 >> H2, as might be expected from the experimental data where the capacity and, consequently, the affinity of the carbons to adsorb CO2 and CH4 is one and two orders of magnitude greater than that of N2 and H2, respectively. The parameter n takes values close to unity for CO2 and CH4 while for N2 takes values of unity, suggesting that heterogeneity plays a minor role in these systems. The uneven fitting of the H2 isotherms for the studied carbons can be mainly ascribed to uncertainty of the experimental data. Sample NOS is where greatest deviation from unity in the values of n is found for the adsorption of CO2, CH4 and H2.

3.3.2. Multicomponent Adsorption Prediction

In order to predict multicomponent adsorption from binary CO2-H2, CO2-CH4, and CO2-N2 mixtures, the fitting of the single component adsorption data to the Sips model represented by Equation (1) was rerun to account for the interaction between components in each binary mixture. Given that CO2 is the strongest adsorbate, the fitting was conducted keeping qs constant (the value of qs estimated from the fitting of single component CO2 adsorption isotherm for each sample) and adjusting the b and n values to minimize the relative error for the pairs CO2-H2, CO2-CH4, and CO2-N2, respectively. The values of the parameters estimated from these fittings are collected in Table 6.
The fitted parameters follow the same trend observed in the previous independent Sips fittings: the n values are close to unity and the b values follow the order CO2 > CH4 > N2 >> H2. When mixed the affinity, as represented by the parameter b, increases for the strong adsorbate (CO2) when compared to the pure component CO2 adsorption data independent fitting. Likewise, the weaker adsorbate shows a substantial decrease in affinity particularly in the CO2-H2 and CO2-N2 systems.
In this way, use of the parameters from the fitting of pure component data pairs guarantees the thermodynamic consistency of the resulting analytical expression of the multicomponent Sips model. Using the same analogy for extending the single-component Langmuir equation to that for multicomponent adsorption, the following equation is obtained for the multicomponent Sips model [33]:
q i = q s ( b i y i P ) 1 / n 1 + j = 1 N ( b j y j P ) 1 / n
where i and j stand for the components in the binary mixture, y is the mole fraction of the corresponding component in the gas phase, and N is the number of components in the gas mixture, i.e., 2. However, this equation only corresponds to a specific case of surface energetic heterogeneity. For normal activated carbons in which the energy sites are highly correlated, the Ideal Adsorbed Solution Theory (IAST) should be used. Application of the IAST with the concept of hypothetical pure-component pressure results in the following equation [34]:
q i = q s b i y i P ( j = 1 N b j y j P ) ( 1 / n ) 1 1 + ( j = 1 N b j y j P ) 1 / n
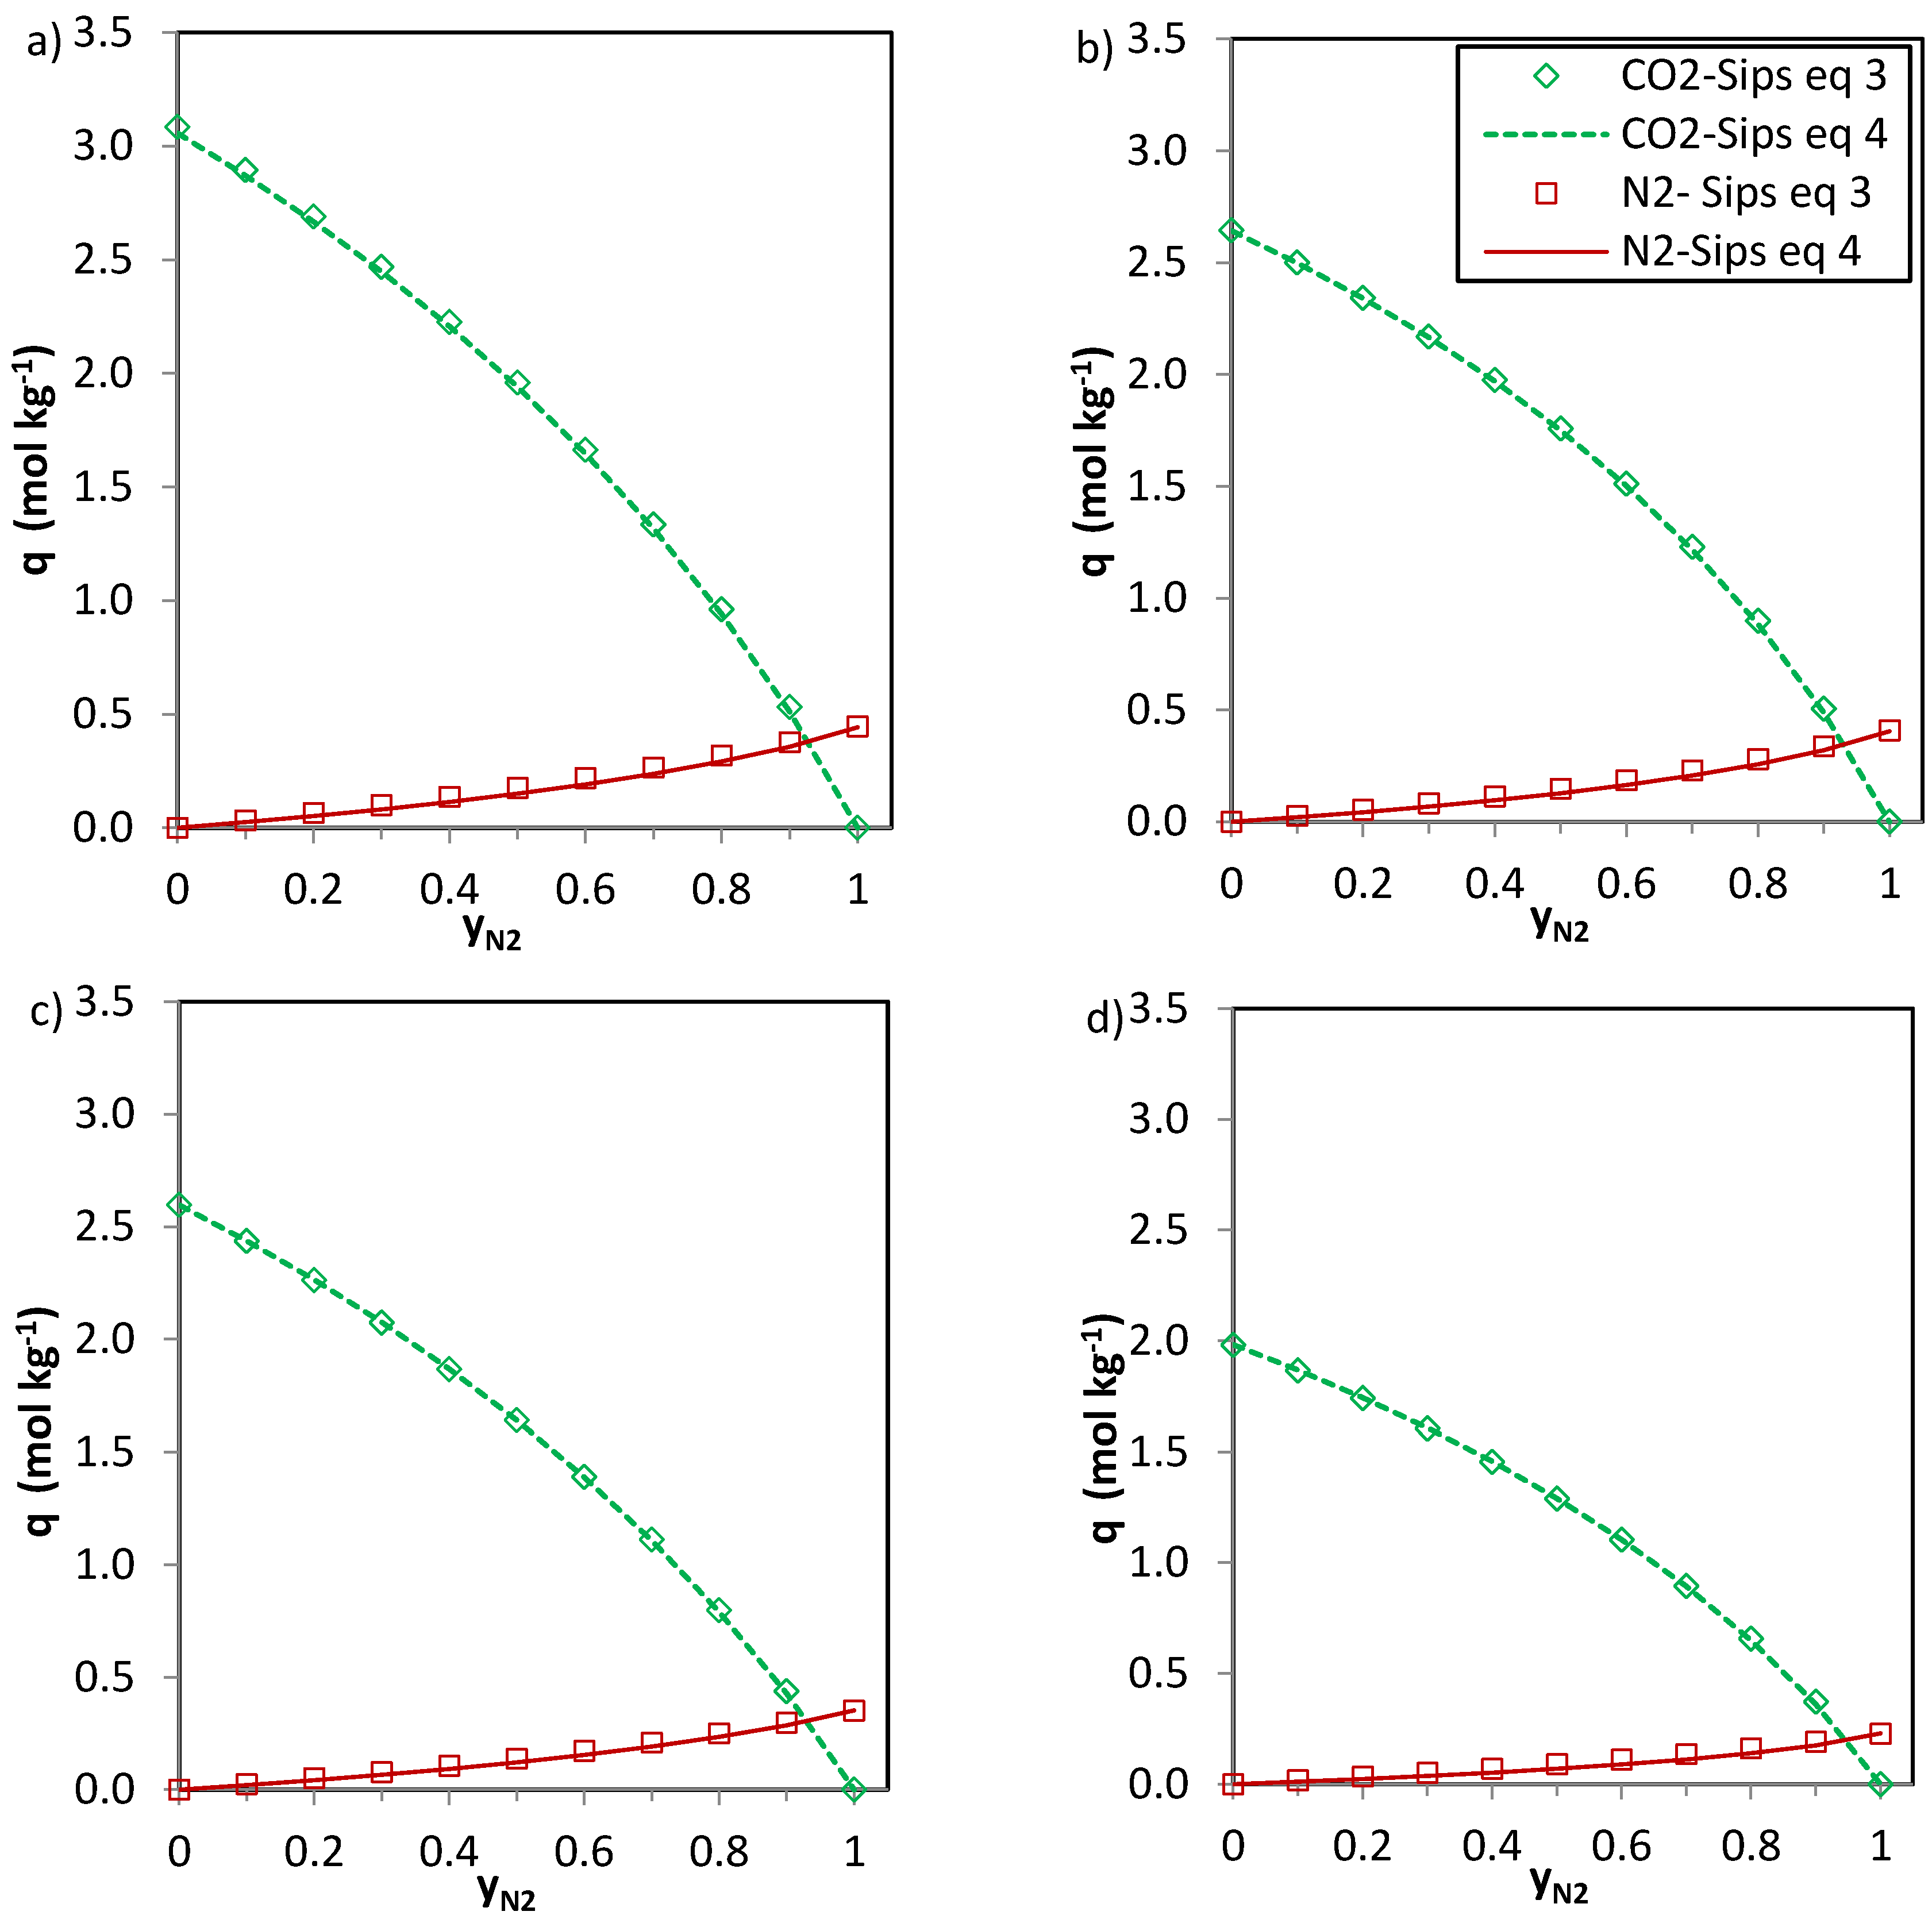
It can be seen that Equations (3) and (4) deliver different expressions to reproduce the multicomponent Sips model on the basis of different assumptions regarding the heterogeneity of the adsorbate-adsorbent system. Nevertheless, both equations were used in the present study to predict the binary adsorption equilibrium for CO2-H2, CO2-CH4, and CO2-N2 systems and the results are discussed and compared. The parameter values used for such multicomponent adsorption predictions were those previously obtained from the combined fitting of the pure component adsorption data of the pairs of gases in each mixture as shown in Table 6.
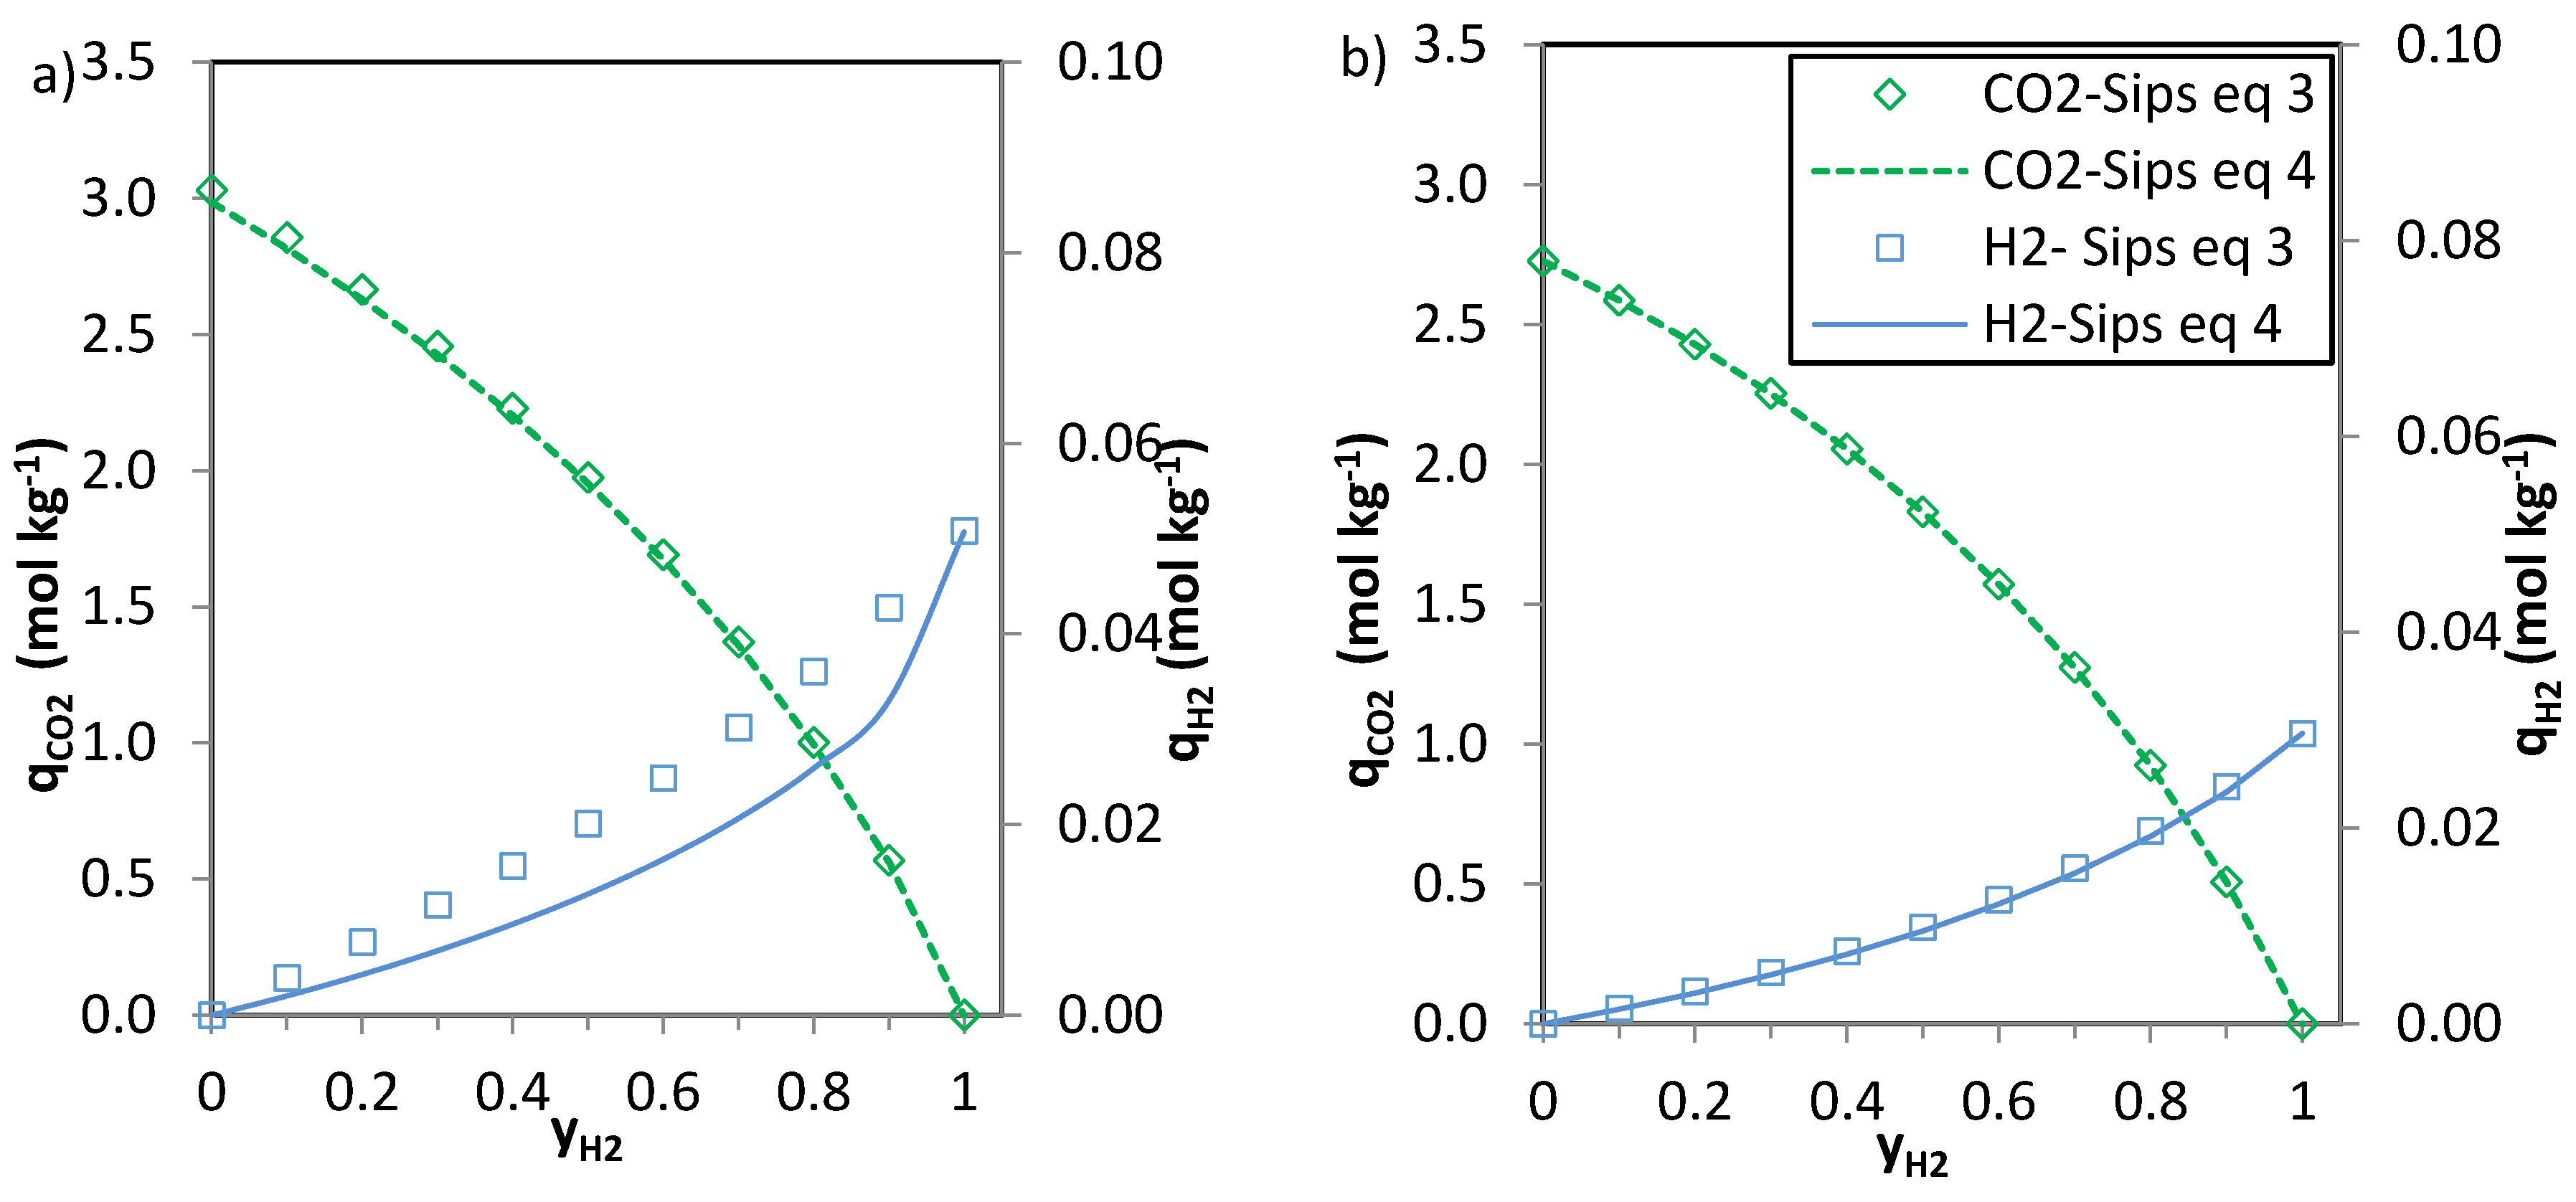
The predictions of the binary gas adsorption equilibria from the multicomponent Sips model represented by Equations (3) and (4) and from the parameters included in Table 6 are depicted in Figure 5, Figure 6 and Figure 7. Multicomponent predictions were assessed under the following temperature and pressure conditions: 25 °C and 100 kPa.
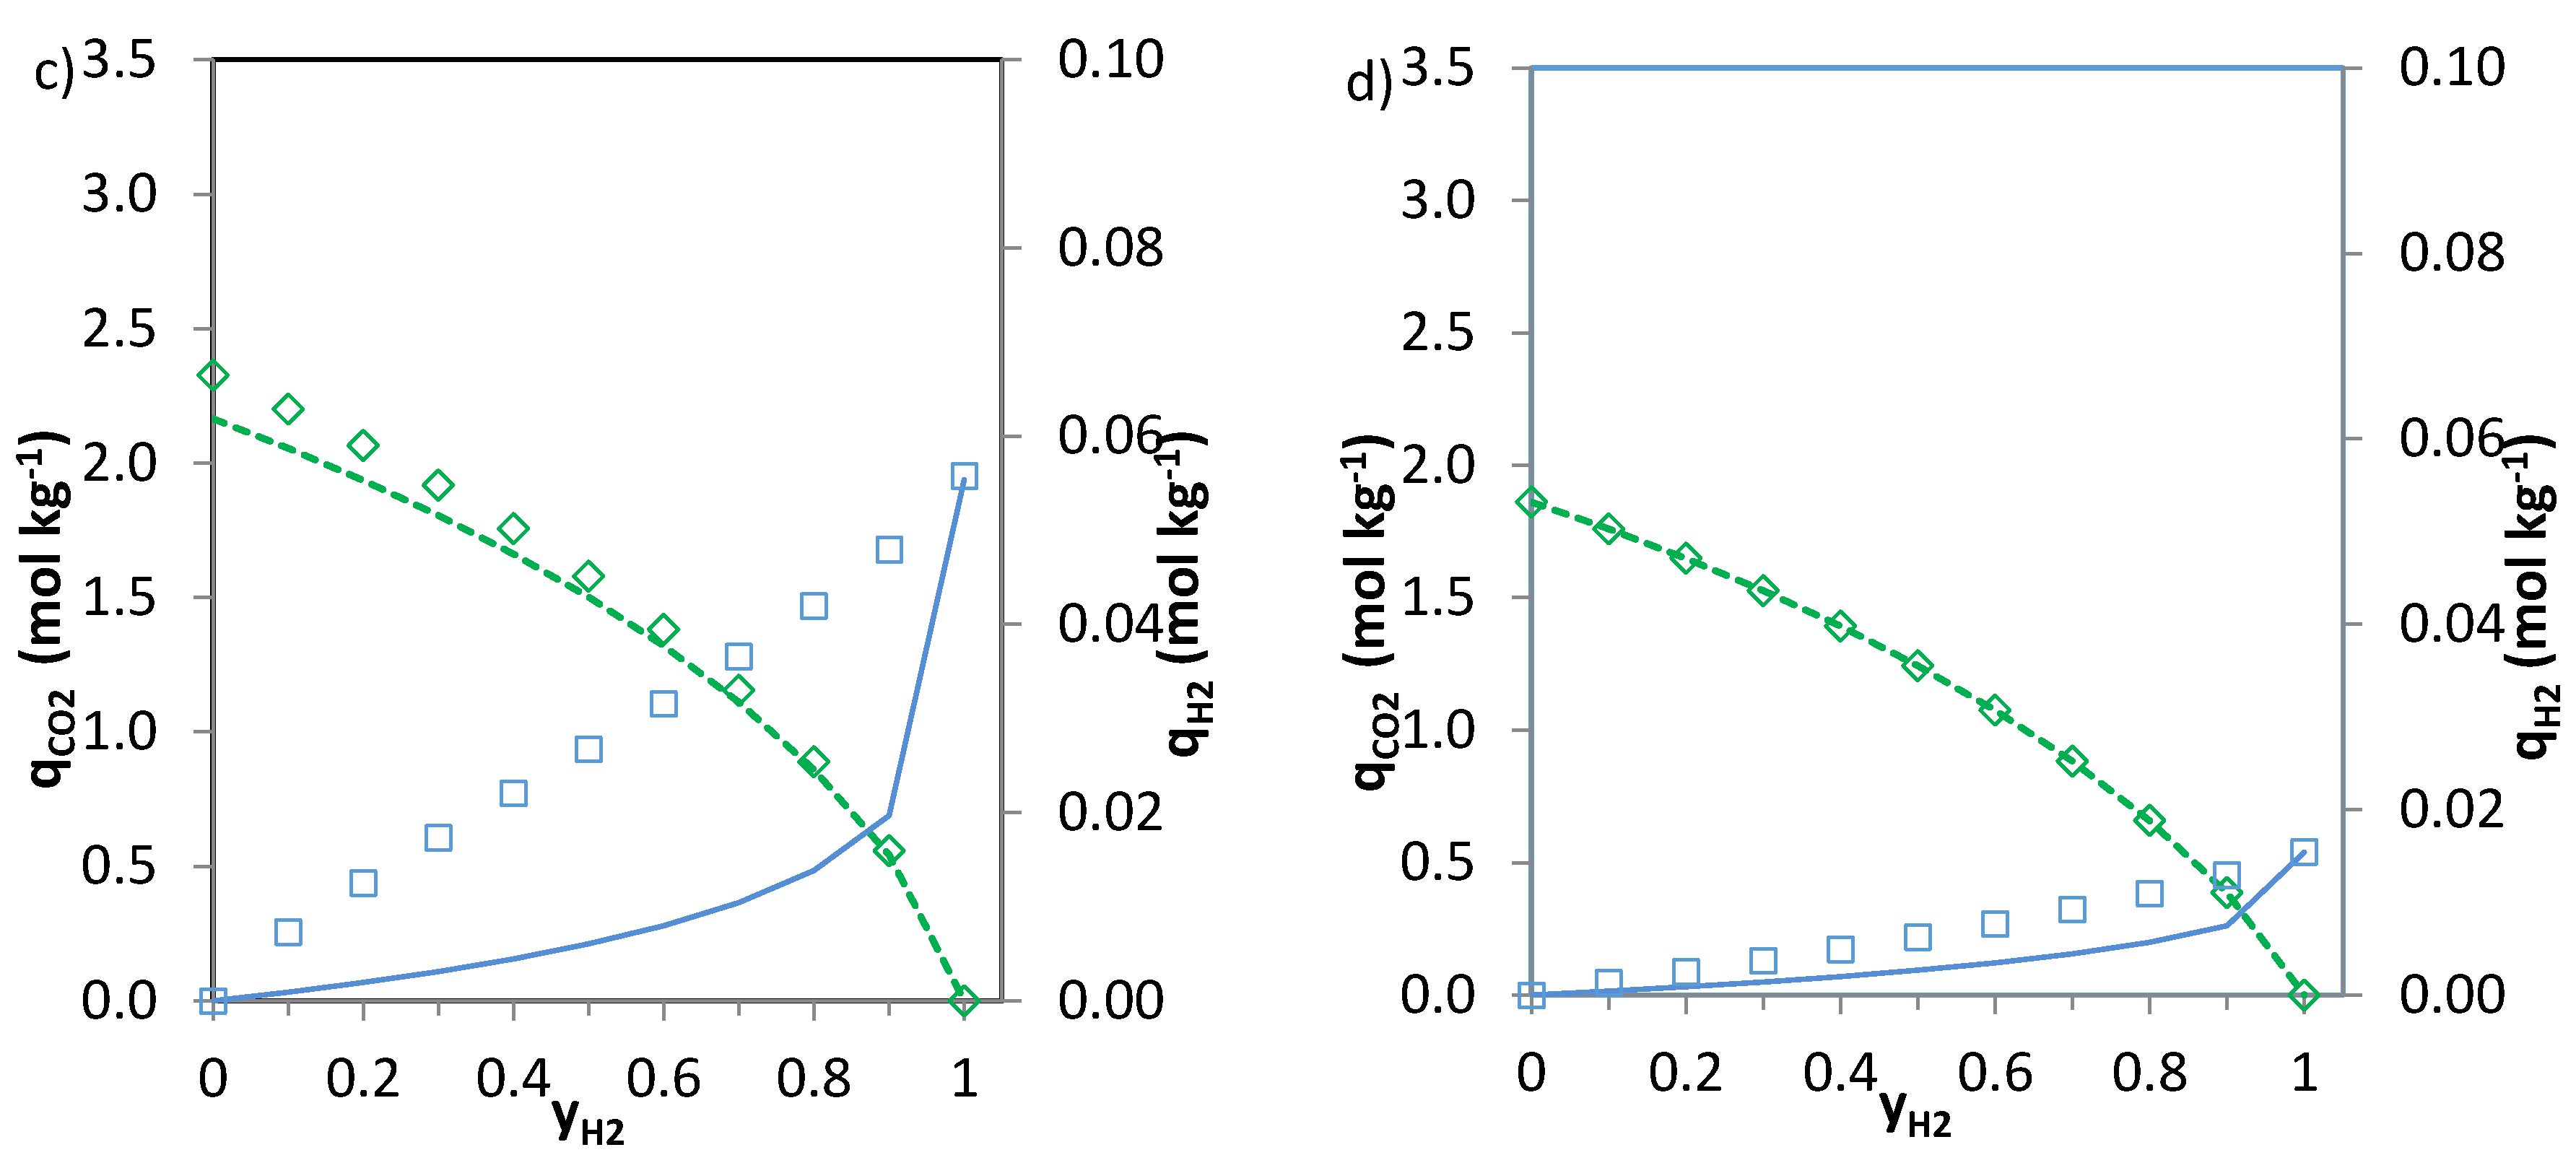
Globally, the predicted multicomponent adsorption isotherms show a reduction in the uptakes of the four components when mixed in binary CO2-H2, CO2-CH4 or CO2-N2 mixtures. However, while the CO2 uptake when mixed in a 1:1 molar ratio is reduced to 60%, 70% and 75% (average values for the four evaluated carbons in the CO2-CH4, CO2-N2 and CO2-H2 binary mixtures, respectively) of the pure gas CO2 adsorption at 25 °C and 100 kPa, the H2, N2 and CH4 uptakes drastically drop down to around 30–35% of those corresponding to pure gas adsorption. This suggests that the presence of another component in the mixture influences the adsorption of CO2 to a lesser extent.
It is apparent that when n (Table 6) approaches unity the values of the numerator and the denominator of Equations (3) and (4) tend to match each other and both Equations (3) and (4) give similar predictions. This suggests that there is little heterogeneity in the systems that could influence the adsorption of the binary mixtures onto the evaluated carbons. The CO2-H2 system is where greater deviations between the two predictions are observed, particularly for the H2 uptake. It should be noted that at sub-atmospheric pressures and room temperature experimental H2 adsorption is characterised by extremely low uptakes. In addition, the affinity of the carbons towards H2 adsorption is significantly lower than that to CO2. Consequently, binary adsorption prediction for the CO2-H2 system is subject to greater uncertainty. Moreover, predicted CO2 adsorption in the CO2-H2 binary mixtures nearly matches pure component CO2 adsorption at similar partial pressures suggesting that H2 adsorption in these mixtures can be considered as negligible. This is in agreement with previous results from the research team [6,35].
The CO2 uptake at yj = 0 (where j stands for H2, N2 and CH4, respectively) is slightly overestimated for the CO2-H2 and CO2-N2 systems compared to the pure component CO2 adsorption data. This may be attributed to the different affinity of the adsorbent towards CO2 and H2 or N2.
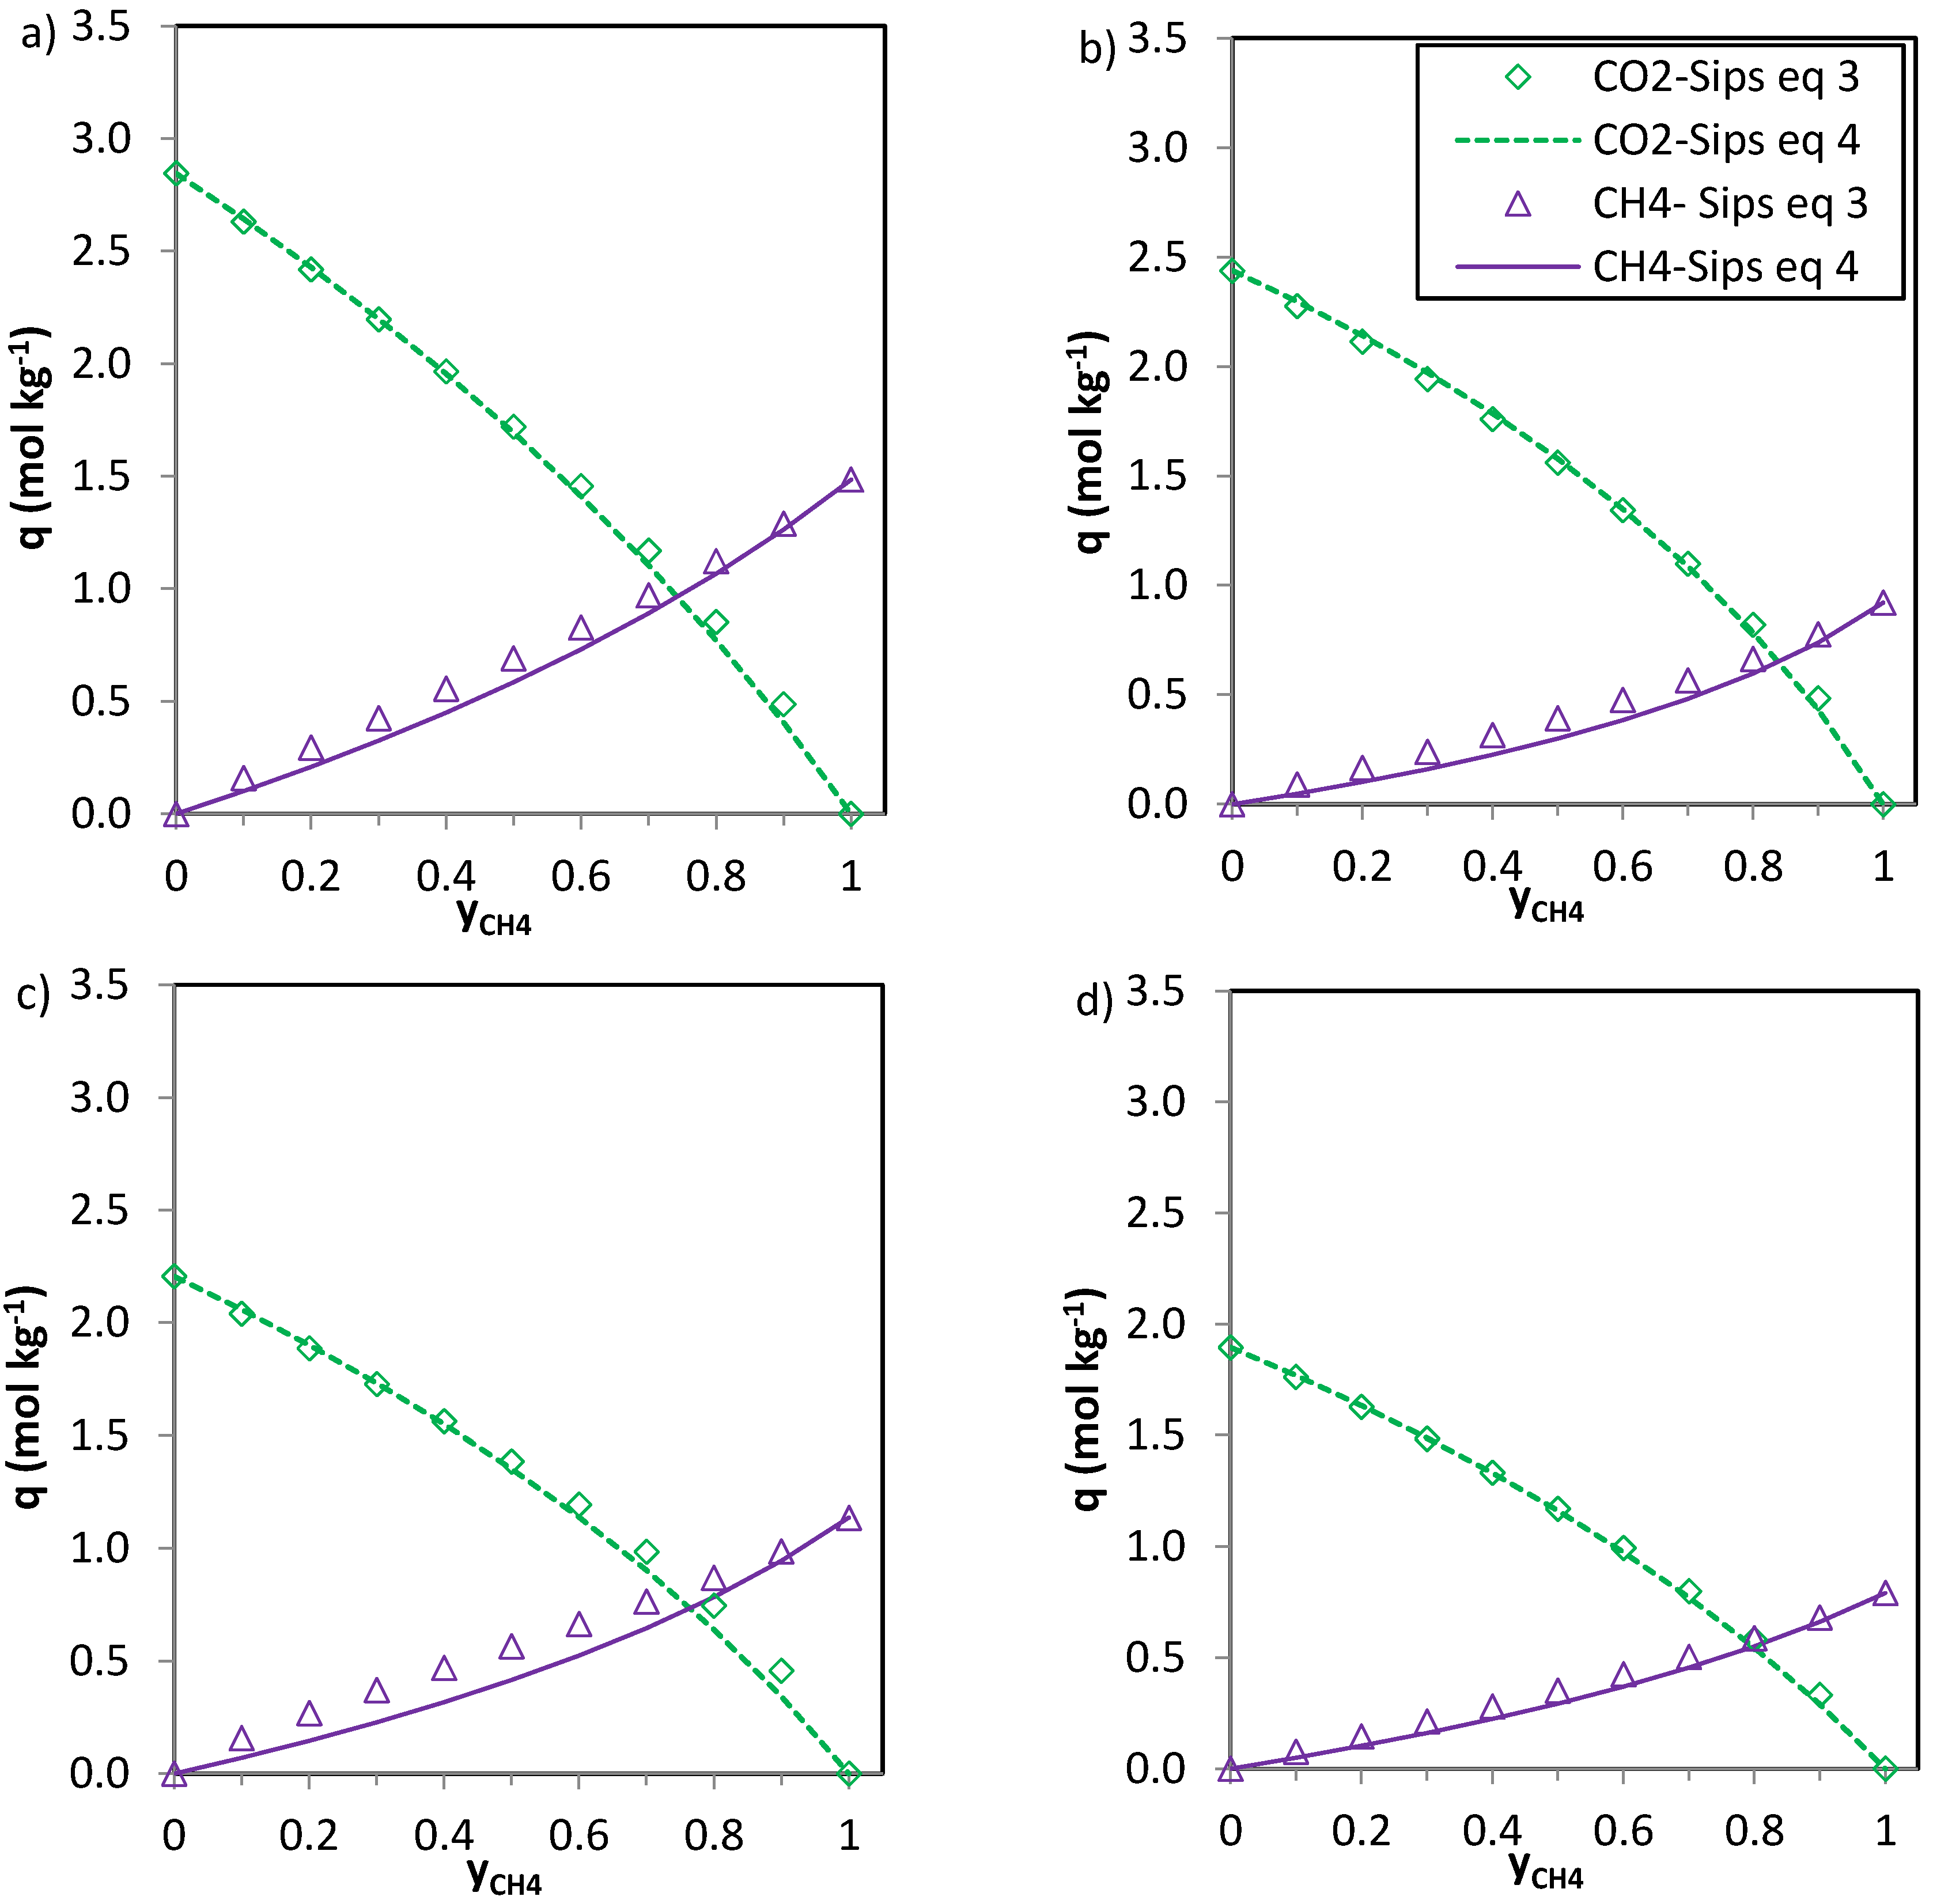
In the case of CO2-CH4 (Figure 6) and CO2-N2 (Figure 7) the predictions of the two Equations (3) and (4) seem consistent. The values of n (Table 6) are close to unity for the CO2-N2 system and thus Equations 3 and 4 deliver similar predictions. For the phenolic resin-biomass composite derived carbon, NOS-A94, Equation (3) predicts slightly greater CH4 uptakes (+0.15 mol·kg−1) than Equation (4) for molar fractions of methane (yCH4) in the binary mixture between 0.3 and 0.6. Both CO2 and CH4 show specific interaction with the carbon surface, as reflected by the shape of the isotherms (type I, according to the IUPAC classification). However, despite the preferential adsorption of CO2 over CH4, competition between both adsorbates exists. The significantly higher critical temperature of CO2 in comparison with CH4 makes carbon dioxide more likely to behave as a condensable steam than as a supercritical gas, making it less volatile and increasing its chances of adsorption. Moreover, CO2 presents a higher polarizability which may enhance attractive forces with the surface and a permanent quadrupole, leading to stronger interactions with any solid surface.
The simplified extended Sips model (Equation (3)) shows limitations bearing in mind the assumptions needed to extend the single component Sips equation to the multicomponent one. However, the observed deviations between the multicomponent predictions represented by Equations (3) and (4) are small and therefore, both could be applied to predict the adsorption of CO2, CH4, and N2 on the evaluated carbons in binary CO2-CH4, and CO2-N2 mixtures. The H2 uptakes predicted for the CO2-H2 systems should be handled with care given the uncertainty of the experimental H2 adsorption data under sub-atmospheric pressures and room temperature. H2 adsorption can be regarded as negligible in the CO2-H2 systems. Moreover, data on the performance of the phenolic resin-derived carbon for CO2-CH4 adsorption were also experimentally obtained in a lab scale fixed-bed adsorption unit. Details can be found elsewhere [6]. The CO2 and CH4 uptakes assessed at 120 kPa and 25 °C for a 1:1 CO2:CH4 binary mixture are in good agreement with the multicomponent predictions at 100 kPa and 25 °C presented herein; for instance, the predicted CO2 uptake on carbon NKa-A82 for a 1:1 CO2:CH4 mixture at 120 kPa is 1.90 mol·kg−1 in agreement with 2.03 mol·kg−1 estimated experimentally.

3.4. Selectivity to CO2 Separation

The selectivity of the prepared carbons to separate CO2 from CO2-H2, CO2-N2 and CO2-CH4 mixtures at ambient temperature and sub-atmospheric pressures was evaluated on the basis of the multicomponent adsorption predictions. The following expression was used:
S 1 2 =   q 1 / q 2 y 1 / y 2
where q1 stands for the CO2 uptake of the carbon from the binary mixture and q2 represents the H2, N2 and CH4 uptakes, respectively. y1 and y2 are the corresponding molar fractions of the gas component in the binary mixtures. From the IAST-Sips multicomponent adsorption model represented by Equation (4), the following equation can be inferred to account for the selectivity to separate CO2 from binary mixtures:
S 1 2 =   b 1 b 2
where b1 and b2 stand for the affinity constants of CO2 and H2, N2 and CH4, respectively. According to Equation (6) the selectivity to separate CO2 from binary mixtures is independent of the partial pressures of the components in the binary mixture. Table 7 summarizes the selectivities of the carbons as estimated from Equation (6) (b1:bCO2 and b2:bH2, bN2 or bCH4).
The selectivity values follow the order CO2-H2 >> CO2-N2 > CO2-CH4 indicating that the separation of CO2 from CO2-H2 mixtures at sub-atmospheric pressures and ambient temperature is favoured. BPL shows the greatest selectivity values to separate CO2 from CO2-H2 and CO2-N2 binary mixtures whereas the phenolic resin-derived carbon NKb-A82 presents the highest selectivity for CO2 to be separated from CO2-CH4 mixtures. Nevertheless, selectivity values for the four evaluated carbons are in the same order of magnitude for each mixture and the values are particularly close in the case of CO2-N2 and CO2-CH4 separation.
The selectivity value, as estimated from Equation (6), could serve as a rough sorbent selection parameter. However, for a more precise evaluation the working capacities (differences between the gas uptakes of both components under adsorption and regeneration conditions) and the heat required for the regeneration of the adsorbent would also need to be taken into account [36].

4. Conclusions

Phenolic resin-derived carbons were prepared and evaluated for CO2 adsorption at sub-atmospheric pressures. Single component adsorption isotherms of CO2, H2, N2 and CH4 were measured at 25 °C and up to 100 kPa and fitted to the Sips model. Binary adsorption from CO2-H2, CO2-N2 and CO2-CH4 mixtures was then predicted by applying the extended multicomponent Sips model and the Ideal Adsorbed Solution Theory (IAST) in conjunction with the Sips model. Both equations showed similar predictions for the adsorption of CO2, CH4 and N2 on the evaluated carbons in the binary mixtures. The adsorption of H2 at the conditions evaluated can be considered negligible. Both Sips multicomponent equations might predict binary adsorption in the studied systems. This is a significant advantage from the viewpoint of computational modelling requirements in adsorption process design.
In terms of CO2 uptake, the performance of the acid resin-derived carbons in separating CO2 from CO2-CH4, CO2-H2, and CO2-N2 at atmospheric pressure was superior to that of a reference commercial carbon (Calgon BPL) and an even higher selectivity towards CO2 was found in the separation of CO2-CH4.

Acknowledgments

This work was carried out with financial support from the Spanish MINECO (Project ENE2011-23467), and was co-financed by the European Regional Development Fund (ERDF) and the Gobierno del Principado de Asturias (PCTI-GRUPIN14-079). N.A-G. acknowledges a fellowship awarded by the Spanish MINECO (FPI program), and co-financed by the European Social Fund.

Author Contributions

N.A.-G. and M.M conducted experimental work. N.A.-G. and C.P. carried out data analysis and calculations. N.A.-G., M.V.G., F.R. and C.P. discussed the results and contributed to the writing of the manuscript.

Conflicts of Interest

Authors declare no conflicts of interest.

References

  1. Dovì, V.G.; Friedler, F.; Huisingh, D.; Klemeš, J.J. Cleaner energy for sustainable future. J. Clean. Prod. 2009, 17, 889–895. [Google Scholar] [CrossRef]
  2. Chen, W.-H.; Chen, S.-Y.; Kumar Khanal, S.; Sung, S. Kinetic study of biological hydrogen production by anaerobic fermentation. Int. J. Hydrog. Energy 2006, 31, 2170–2178. [Google Scholar] [CrossRef]
  3. Redwood, M.; Paterson-Beedle, M.; Macaskie, L. Integrating dark and light bio-hydrogen production strategies: Towards the hydrogen economy. Rev. Environ. Sci. Biotechnol. 2009, 8, 149–185. [Google Scholar] [CrossRef]
  4. Gómez, X.; Fernández, C.; Fierro, J.; Sánchez, M.E.; Escapa, A.; Morán, A. Hydrogen production: Two stage processes for waste degradation. Bioresour. Technol. 2011, 102, 8621–8627. [Google Scholar] [CrossRef] [PubMed]
  5. Lee, Y.-W.; Chung, J. Bioproduction of hydrogen from food waste by pilot-scale combined hydrogen/methane fermentation. Int. J. Hydrog. Energy 2010, 35, 11746–11755. [Google Scholar] [CrossRef]
  6. Gil, M.V.; Álvarez-Gutiérrez, N.; Martínez, M.; Rubiera, F.; Pevida, C.; Morán, A. Carbon adsorbents for CO2 capture from bio-hydrogen and biogas streams: Breakthrough adsorption study. Chem. Eng. J. 2015, 269, 148–158. [Google Scholar] [CrossRef]
  7. Redondas, V.; Gómez, X.; García, S.; Pevida, C.; Rubiera, F.; Morán, A.; Pis, J.J. Hydrogen production from food wastes and gas post-treatment by CO2 adsorption. Waste Manag. 2012, 32, 60–66. [Google Scholar] [CrossRef] [PubMed]
  8. González, A.S.; Plaza, M.G.; Rubiera, F.; Pevida, C. Sustainable biomass-based carbon adsorbents for post-combustion CO2 capture. Chem. Eng. J. 2013, 230, 456–465. [Google Scholar] [CrossRef]
  9. Marsh, H.; Rodríguez-Reinoso, F. Activated Carbon; Elsevier Science Ltd.: Oxford, UK, 2006; p. 529. [Google Scholar]
  10. Foley, H.C. Carbogenic molecular sieves: Synthesis, properties and applications. Microporous Mater. 1995, 4, 407–433. [Google Scholar] [CrossRef]
  11. Martin, C.F.; Plaza, M.G.; Garcia, S.; Pis, J.J.; Rubiera, F.; Pevida, C. Microporous phenol-formaldehyde resin-based adsorbents for pre-combustion CO2 capture. Fuel 2011, 90, 2064–2072. [Google Scholar] [CrossRef]
  12. Martín, C.F.; García, S.; Beneroso, D.; Pis, J.J.; Rubiera, F.; Pevida, C. Precombustion CO2 capture by means of phenol-formaldehyde resin-derived carbons: From equilibrium to dynamic conditions. Sep. Purif. Technol. 2012, 98, 531–538. [Google Scholar] [CrossRef]
  13. Foster, A.I.; Linney, H.J.; Tennison, S.R.; Cory, R.A.; Swan, D.P. The use of carbons produced from phenolic resins for flue gas desulphurization. Fuel 1993, 72, 337–342. [Google Scholar] [CrossRef]
  14. Tennison, S.R. Phenolic-resin-derived activated carbons. Appl. Catal. A Gen. 1998, 173, 289–311. [Google Scholar] [CrossRef]
  15. Presser, V.; McDonough, J.; Yeon, S.-H.; Gogotsi, Y. Effect of pore size on carbon dioxide sorption by carbide derived carbon. Energy Environ. Sci. 2011, 4, 3059–3066. [Google Scholar] [CrossRef]
  16. Hopper, R.W.; Pekala, R.W. Low density microcellular carbon or catalytically impregnated carbon forms and process for their preparation. Patent number US4806290, 1989. [Google Scholar]
  17. Ryoo, R.; Joo, S.H.; Jun, S. Synthesis of highly ordered carbon molecular sieves via template-mediated structural transformation. J. Phys. Chem. B 1999, 103, 7743–7746. [Google Scholar] [CrossRef]
  18. Gil, M.V.; Martínez, M.; García, S.; Rubiera, F.; Pis, J.J.; Pevida, C. Response surface methodology as an efficient tool for optimizing carbon adsorbents for CO2 capture. Fuel Process. Technol. 2013, 106, 55–61. [Google Scholar] [CrossRef]
  19. Vishnyakov, A.; Ravikovitch, P.I.; Neimark, A.V. Molecular level models for CO2 sorption in nanopores. Langmuir 1999, 15, 8736–8742. [Google Scholar] [CrossRef]
  20. Martín, C.F.; Plaza, M.G.; Pis, J.J.; Rubiera, F.; Pevida, C.; Centeno, T.A. On the limits of CO2 capture capacity of carbons. Sep. Purif. Technol. 2010, 74, 225–229. [Google Scholar] [CrossRef]
  21. Marsh, H.; Rodríguez-Reinoso, F. Chapter 5—Activation processes (thermal or physical). In Activated Carbon; Elsevier Science Ltd.: Oxford, UK, 2006; pp. 243–321. [Google Scholar]
  22. Molina-Sabio, M.; González, M.T.; Rodriguez-Reinoso, F.; Sepúlveda-Escribano, A. Effect of steam and carbon dioxide activation in the micropore size distribution of activated carbon. Carbon 1996, 34, 505–509. [Google Scholar] [CrossRef]
  23. Dubinin, M.M. Physical adsorption of gases and vapors in micropores. In Progress in Surface and Membrane Science; Academic Press: New York, NY, USA, 1975; Volume 9, pp. 1–69. [Google Scholar]
  24. Stoeckli, F.; Ballerini, L. Evolution of microporosity during activation of carbon. Fuel 1991, 70, 557–559. [Google Scholar] [CrossRef]
  25. Gauden, P.A.; Terzyk, A.P.; Jaroniec, M.; Kowalczyk, P. Bimodal pore size distributions for carbons: Experimental results and computational studies. J. Colloid Interface Sci. 2007, 310, 205–216. [Google Scholar] [CrossRef] [PubMed]
  26. Corporation, C.C. BPL 4x10 Product Bulletin. Available online: http://www.calgoncarbon.com/media/images/site_library/370_BPL4x10_webp.pdf (accessed on 1 October 2015).
  27. Frère, M.; De Weireld, G.; Jadot, R. Characterization of porous carbonaceous sorbents using high pressure CO2 adsorption data. J. Porous Mater. 1998, 5, 275–287. [Google Scholar] [CrossRef]
  28. Do, D.D. Adsorption Analysis: Equilibria and Kinetics; Imperial College London: London, UK, 1998. [Google Scholar]
  29. Bárcia, P.S.; Bastin, L.; Hurtado, E.J.; Silva, J.A.C.; Rodrigues, A.E.; Chen, B. Single and multicomponent sorption of CO2, CH4 and N2 in a microporous metal-organic framework. Sep. Sci. Technol. 2008, 43, 3494–3521. [Google Scholar] [CrossRef]
  30. Gadiou, R.; Saadallah, S.-E.; Piquero, T.; David, P.; Parmentier, J.; Vix-Guterl, C. The influence of textural properties on the adsorption of hydrogen on ordered nanostructured carbons. Microporous Mesoporous Mater. 2005, 79, 121–128. [Google Scholar] [CrossRef]
  31. Pevida, C.; Centeno, T.A. Influencia de las propiedades texturales en el almacenamiento de H2. In La Energía del Hidrógeno; Laborde, M.A., Rubiera, F., Eds.; Ediciones CYTED: Buenos Aires, Argentina, 2010; pp. 135–143. [Google Scholar]
  32. Ruthven, D.M. Principles of Adsorption and Adsorption Processes; John Wiley & Sons: New York, NY, USA, 1984. [Google Scholar]
  33. Ahmadpour, A.; Wang, K.; Do, D.D. Comparison of models on the prediction of binary equilibrium data of activated carbons. AIChE J. 1998, 44, 740–752. [Google Scholar] [CrossRef]
  34. Rudziński, W.; Nieszporek, K.; Moon, H.; Rhee, H.-K. On the theoretical origin and applicability of the potential theory approach to predict mixed-gas adsorption on solid surfaces from single-gas adsorption isotherms. Chem. Eng. Sci. 1995, 50, 2641–2660. [Google Scholar] [CrossRef]
  35. García, S.; Pis, J.J.; Rubiera, F.; Pevida, C. Predicting mixed-gas adsorption equilibria on activated carbon for precombustion CO2 capture. Langmuir 2013, 29, 6042–6052. [Google Scholar] [CrossRef] [PubMed]
  36. Álvarez-Gutiérrez, N.; Gil, M.V.; Rubiera, F.; Pevida, C. Adsorption performance indicators for the CO2/CH4 separation: Application to biomass-based activated carbons. Fuel Process. Technol. 2016, 142, 361–369. [Google Scholar] [CrossRef]
Figure 1. N2 adsorption isotherms at −196 °C (a) and CO2 adsorption isotherms at 0 °C (b) for the activated carbons tested (bold symbols represent adsorption and empty symbols desorption).
Energies 09 00189 g001
Figure 2. Micropore size distributions from the CO2 adsorption isotherms at 0 °C by means of the DFT slit pore carbon model.
Energies 09 00189 g002
Figure 3. CO2 adsorption isotherms at 25 °C and sub-atmospheric pressures for the studied carbons.
Energies 09 00189 g003
Figure 4. CO2, CH4 (a); H2 (b) and N2 (c) adsorption isotherms at 25 °C on samples NKa-A82, NKb-A82, NOS-A94 and BPL. Fitting of the single component adsorption data to the Sips model is represented by the solid lines.
Energies 09 00189 g004
Figure 5. Multicomponent prediction by means of the Sips model for CO2-H2 binary mixtures at 100 kPa and 25 °C: (a) NKa-A82; (b) NKb-A82; (c) NOS-A94 and (d) BPL.
Energies 09 00189 g005aEnergies 09 00189 g005b
Figure 6. Multicomponent prediction by means of the Sips model for CO2-CH4 binary mixtures at 100 kPa and 25 °C: (a) NKa-A82; (b) NKb-A82; (c) NOS-A94 and (d) BPL.
Energies 09 00189 g006
Figure 7. Multicomponent prediction by means of the Sips model for CO2-N2 binary mixtures at 100 kPa and 25 °C: (a) NKa-A82; (b) NKb-A82; (c) NOS-A94 and (d) BPL.
Energies 09 00189 g007
Table 1. Departing materials and conditions for the production of PF resin-derived carbon precursors.
PrecursorType of PF ResinF/P *Curing (Tmax, °C)Additive IncorporationK/R **
ReKClaBasic catalysis (Re)2.5:180Ambient KCl1.7
ReKClbBasic catalysis (Re)2.5:180Boiling KCl1.9
No1KClaAcid catalysis (No1)1:1.2100Ambient KCl2.1
No1KClbAcid catalysis (No1)1:1.2100Boiling KCl1.7
No2OSAcid catalysis (No2)1:1170OS (20:80) and hexa (7:2)
* F/P: formaldehyde to phenol molar ratio; ** K/R: potassium chloride to resin weight ratio.
Table 2. Conditions of carbonisation and activation with CO2 for each precursor.
Activated MaterialPrecursorCarbonisationActivation
Temp. (°C)Yield (%) *Temp. (°C)Burn off (%) **
RKa-A71ReKCla6004069410
RKb-A75ReKClb10003972250
NKa-A82No1KCla6003781022
NKb-A82No1KClb10004080020
NOS-A94No2OS10003294038
* Char yield has been estimated as yield (%) = (mc/mi) × 100, where mc is the mass of char produced and mi is the mass of raw precursor; ** Burn off or degree of activation is estimated as burn off (%) = (mcma) × 100/mc, where mc is the mass of char and ma is the mass of activated sample produced.
Table 3. Chemical characteristics of the materials.
SampleElemental Composition (wt%, daf)pHPZC
CHO *
Resol-based series
Re74.75.919.47.2
ReKCla char94.72.23.18.5
RKa-A7196.21.32.59.5
ReKClb char91.00.88.29.4
RKb-A7592.71.16.29.6
Novolac-based series
No182.66.011.45.2
No1KCla char96.50.53.04.6
NKa-A8299.00.40.68.7
No1KClb char97.00.42.67.6
NKb-A8299.00.60.48.5
No278.15.816.14.8
No2OS char96.30.82.97.4
NOS-A9498.00.41.68.4
daf: dry ash free basis; * calculated by difference.
Table 4. Textural parameters evaluated from the N2 and CO2 adsorption isotherms at −196 and 0 °C, respectively.
ParameterRKa-A71RKb-A75NKa-A82NKb-A82NOS-A94
Vp (cm3·g−1)0.080.460.450.320.53
W0,N2 (cm3·g−1)-0.350.440.320.50
L0,N2 (nm)-1.801.001.230.82
W0,CO2 (cm3·g−1)0.210.180.380.310.27
L0,CO2 (nm)0.580.700.710.640.64
Table 5. Optimal parameters of the single-component CO2, CH4, H2, and N2 adsorption data fitting to the Sips model.
SampleCO2SRE (%)CH4SRE (%)
qsbnqsbn
NKa-A827.375.77 × 10−31.171.13.765.69 × 10−31.101.5
NKb-A825.387.46 × 10−31.241.03.373.13 × 10−31.151.9
NOS-A946.294.77 × 10−31.280.64.202.62 × 10−31.303.3
BPL4.726.02 × 10−31.173.02.634.03 × 10−31.072.6
SampleH2SRE (%)N2SRE (%)
qsbnqsbn
NKa-A820.391.50 × 10−31.008.82.182.55 × 10−31.001.7
NKb-A822.461.29 × 10−41.008.22.871.17 × 10−31.002.1
NOS-A941.444.06 × 10−51.6511.02.361.81 × 10−31.002.1
BPL0.411.98 × 10−41.195.12.909.89 × 10−41.002.0
qs: mol·kg−1, b: kPa−1.
Table 6. Optimal parameters of the single-component CO2, H2, CH4, and N2 adsorption data fitting to the Sips model for multicomponent prediction.
SampleCO2-CH4
bCO2bCH4nSRE (%)
NKa-A825.83 × 1032.01 × 1031.163.0
NKb-A827.99 × 10−31.52 × 1031.192.7
NOS-A944.43 × 1031.36 × 1031.322.3
BPL6.33 × 1031.60 × 1031.143.7
SampleCO2-H2
bCO2bH2nSRE (%)
NKa-A826.55 × 10−34.27 × 10−51.107.9
NKb-A821.03 × 1025.33 × 1051.0115.4
NOS-A944.18 × 10−31.69 × 10−51.359.6
BPL6.08 × 10−31.31 × 1051.164.3
SampleCO2-N2
bCO2bN2nSRE (%)
NKa-A826.93 × 10−35.36 × 1041.066.6
NKb-A829.63 × 1036.98 × 10−41.069.6
NOS-A946.90 × 1035.12 × 10−41.0511.9
BPL7.00 × 10−33.75 × 1041.1010.7
b: kPa−1.
Table 7. Selectivities of the carbons to separate CO2 from CO2-H2, CO2-N2 and CO2-CH4 binary mixtures.
S1/2CO2-H2CO2-N2CO2-CH4
NKa-A8215312.92.9
NKb-A8219313.85.3
NOS-A9424713.53.3
BPL46418.73.9

