Article

Statistical Analysis of Partial Discharges in SF6 Gas via Optical Detection in Various Spectral Ranges

1
State Key Laboratory of Electrical Insulation for Power Equipment, Xi’an Jiaotong University, Xi’an 710049, China
2
Institute of Materials Science, University of Connecticut, Storrs, CT 06269, USA
*
Author to whom correspondence should be addressed.
Energies 2016, 9(3), 152; https://doi.org/10.3390/en9030152
Submission received: 22 January 2016 / Revised: 17 February 2016 / Accepted: 25 February 2016 / Published: 2 March 2016

Abstract

:
Partial discharge (PD) detection is essential to the operation of high-voltage systems. In this context, we investigate the basic characteristics of light emission during PDs in SF6 gas from the perspective of insulation diagnosis. A synchronous system is constructed using three optical photoelectric instruments with separate wavelength responses in the ultraviolet (UV, 189–352 nm), visible (VIS, 381–675 nm), and near-infrared (NIR, 737–920 nm) spectral ranges and a wide-band PD current pulse detector with a response of 1 pC. The results indicate that light emission depends upon the type of insulation defect and discharge energy. An increase in PD charge gives rise to more components in the spectral range from UV to VIS, and the presence of an insulator surface in discharges yields a more complex VIS-to-NIR spectrum. The phase-resolved partial discharge pattern (PRPD) of UV light pulses can reasonably reflect the electroluminescence process in the presence of the insulator surface and weak corona at negative voltage points. The PRPD of VIS light describes the features of the actual PD pattern in most cases. In comparison with the other two spectral ranges, light intensity in the VIS range is more sensitive to changes in gas-pressure-normalized voltage (Vrms/p). The linear fitting analysis of the relationships between the light intensity and PD charge shows that UV light detection has a greater sensitivity to the PD charge and that UV detection exhibits a greater degree of linearity. NIR detection is applicable only to severe PDs. We believe that our findings can significantly aid in application of optical PD diagnosis in SF6 gas insulated systems.

1. Introduction

Electrical discharges occurring in dielectrics are always accompanied by light emission, which allows us to determine the morphologies of the discharges and even examine the mechanisms underlying the various types of discharges [1,2,3]. Partial discharge (PD) is a common insulation problem caused by local enhanced electric fields in different insulation media (gaseous, liquid, solid, or compound media) [4]. With regard to enclosed-type high-voltage equipment, the reliability of the dielectric insulation inside is severely degraded in the presence of continuous PDs activity. At present, three types of PD measurement methods have been explored based on various physical phenomena: ultra-high frequency (UHF) method [5,6,7,8], acoustical wave method (AE method) [8,9,10], and circuit-coupled current pulse method (IEC 60270 method) [11]. Apart from EM radiation, mechanical waves and current flow, the radiation originating from a PD source is another nature that can be detected. With evolution in optical technologies, optical PD detection can be used as not only an ancillary means in laboratory studies but also renders its considerable potential in PD diagnosis of actual power equipment such as gas-insulated switchgear/transmission lines (GIS/GILs) and oil-insulated transformers while offering the advantages of EM-interference-free operation and adjustable gain. Micro-optical sensors and fluorescence fibers that can be installed inside equipment have shown great application potential in this regard [12,13]. For PDs occurring in SF6-gas-insulated systems, light is produced as a result of various ionization, excitation, and recombination processes occurring during corona in SF6 with its characteristic spectrum. Though corona discharge in pure SF6 occurs over a narrow spectral range due to the small excitation cross-section [14], it can be still detected over a wide EM spectrum from the ultraviolet (UV) to the near-infrared (NIR) ranges depending upon the discharge energy [15]. The presence of trace amounts of impurities, such as air and nitrogen, and the structural nature of the electrode can yield more complex spectra [16,17]. At present, the statistical characteristics of light emission pulses, relationship between light intensity and PD magnitude, and the discharge characteristics in different spectral ranges are not clear. Neither the influence of the response range of detection nor PD characterization based on optical detection have been investigated experimentally. Consequently, in this study, optical PD detection is performed for artificial defects in SF6 gas atmosphere by utilizing the phase-resolved partial discharge (PRPD) approach, which is a popular tool for conventional PD detection analysis. The results in the UV, visible (VIS), and NIR spectral ranges for different types of defects are separately obtained. This work can potentially provide references for the selection and optimization of sensors and a possible approach for PD diagnosis based on optical methods.

2. Experimental Details

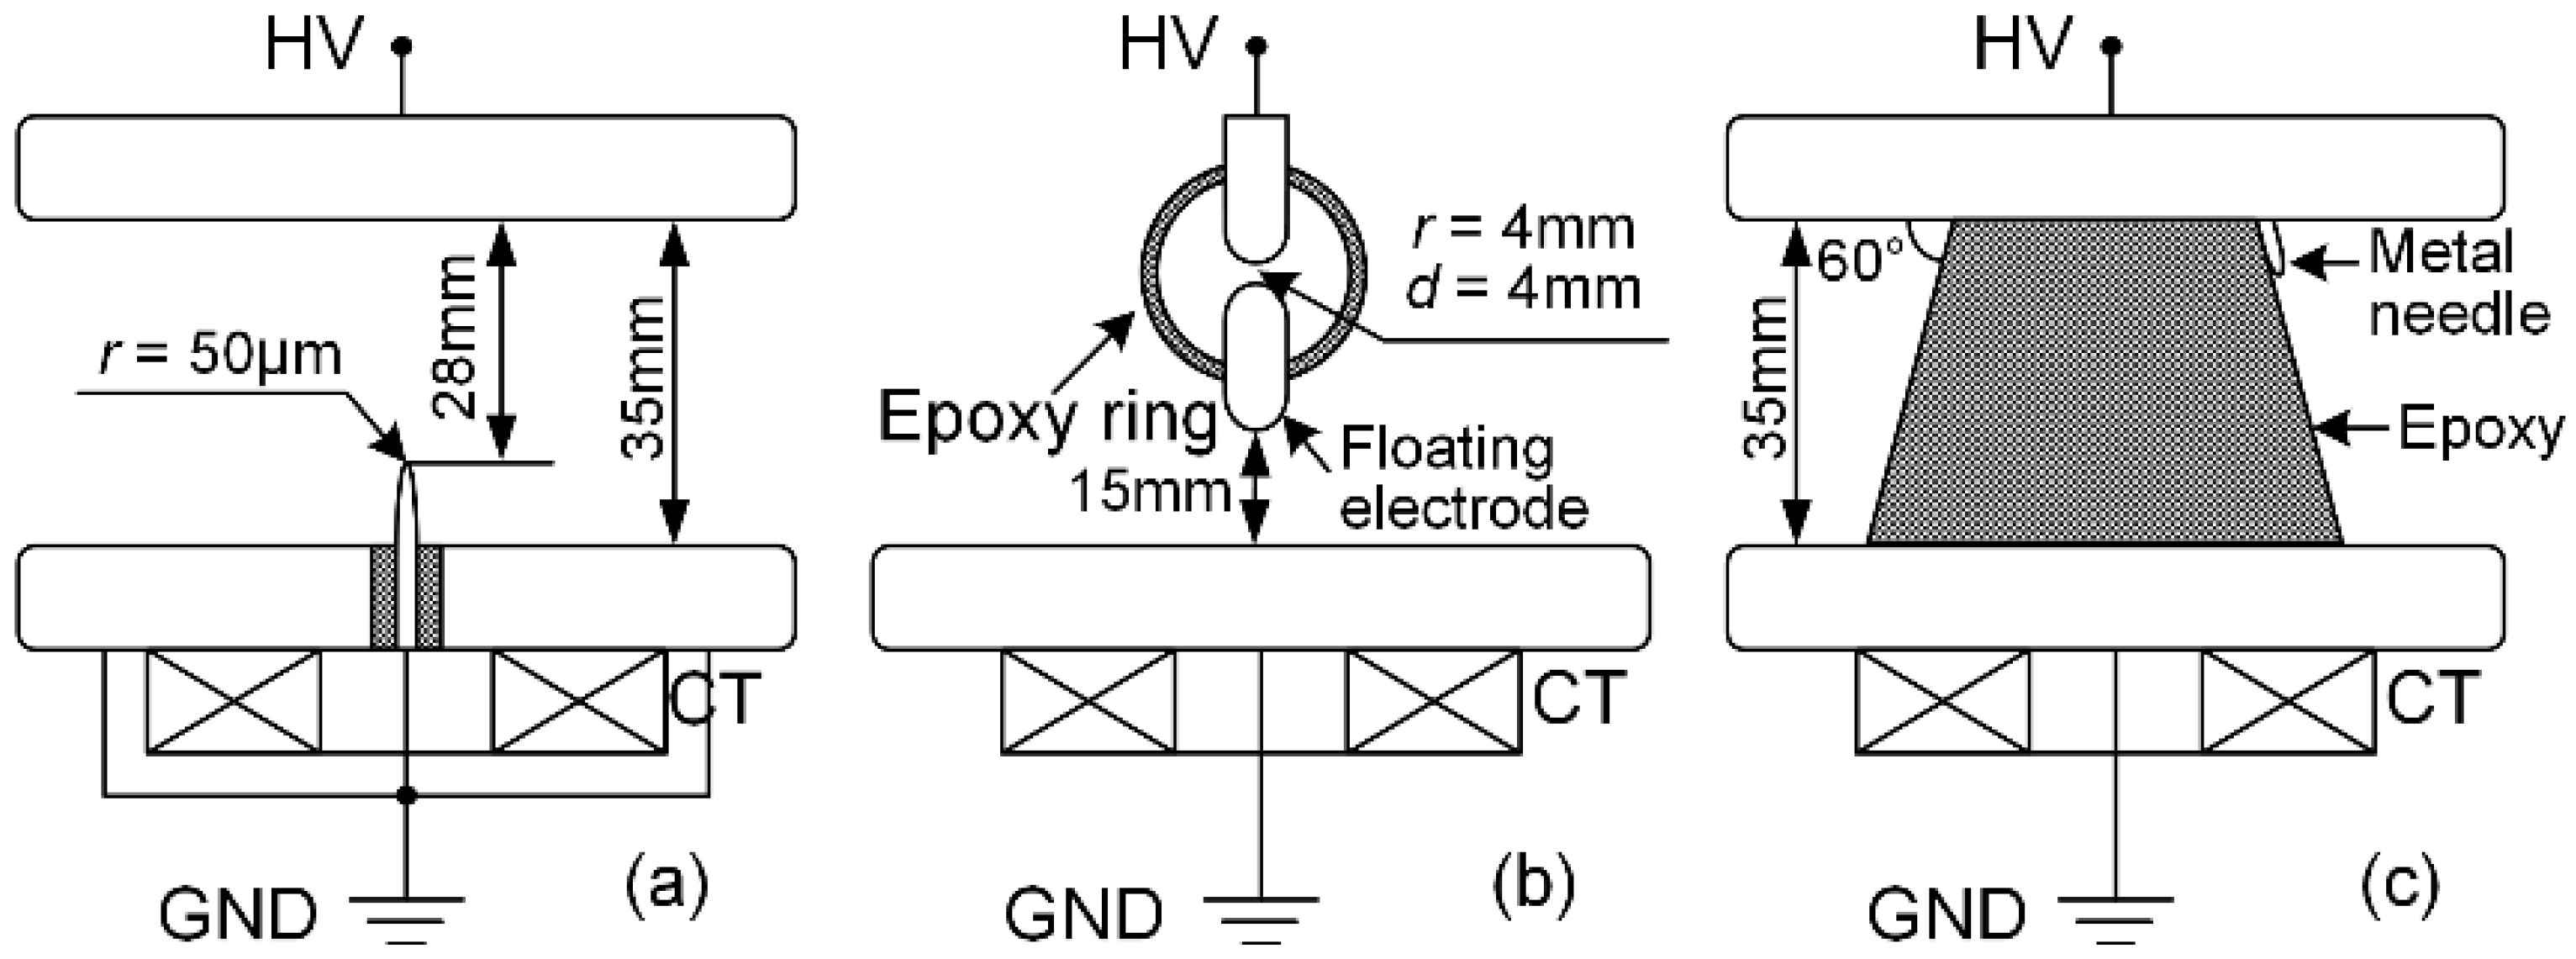
2.1. Artificial Defect Models

Three artificial defect models were developed to simulate PDs occurring at a protrusion fixed on a conductor, a suspended metal particle, and local enhanced field along the surface of the insulator, as shown in the experimental setup in Figure 1. The electrodes containing artificial defects were made of TU2 copper. The distance between the PD source and the light detection window was 155 mm. The influence of the electrode material on the PD is not discussed in this work. The artificial defect was set in a test chamber constructed of Crl8Ni9Ti stainless steel that could withstand gas pressures of 50 Pa–0.6 MPa and applied voltages up to 150 kV (50 Hz AC). The chamber had four optical windows constructed of synthetic fused silica glass (above 85% transmittance from 175 nm onward and 90% from 220 nm onward). Three windows were utilized for light detection via photomultiplier tubes (PMTs), with the fourth being used for spectrum measurement.

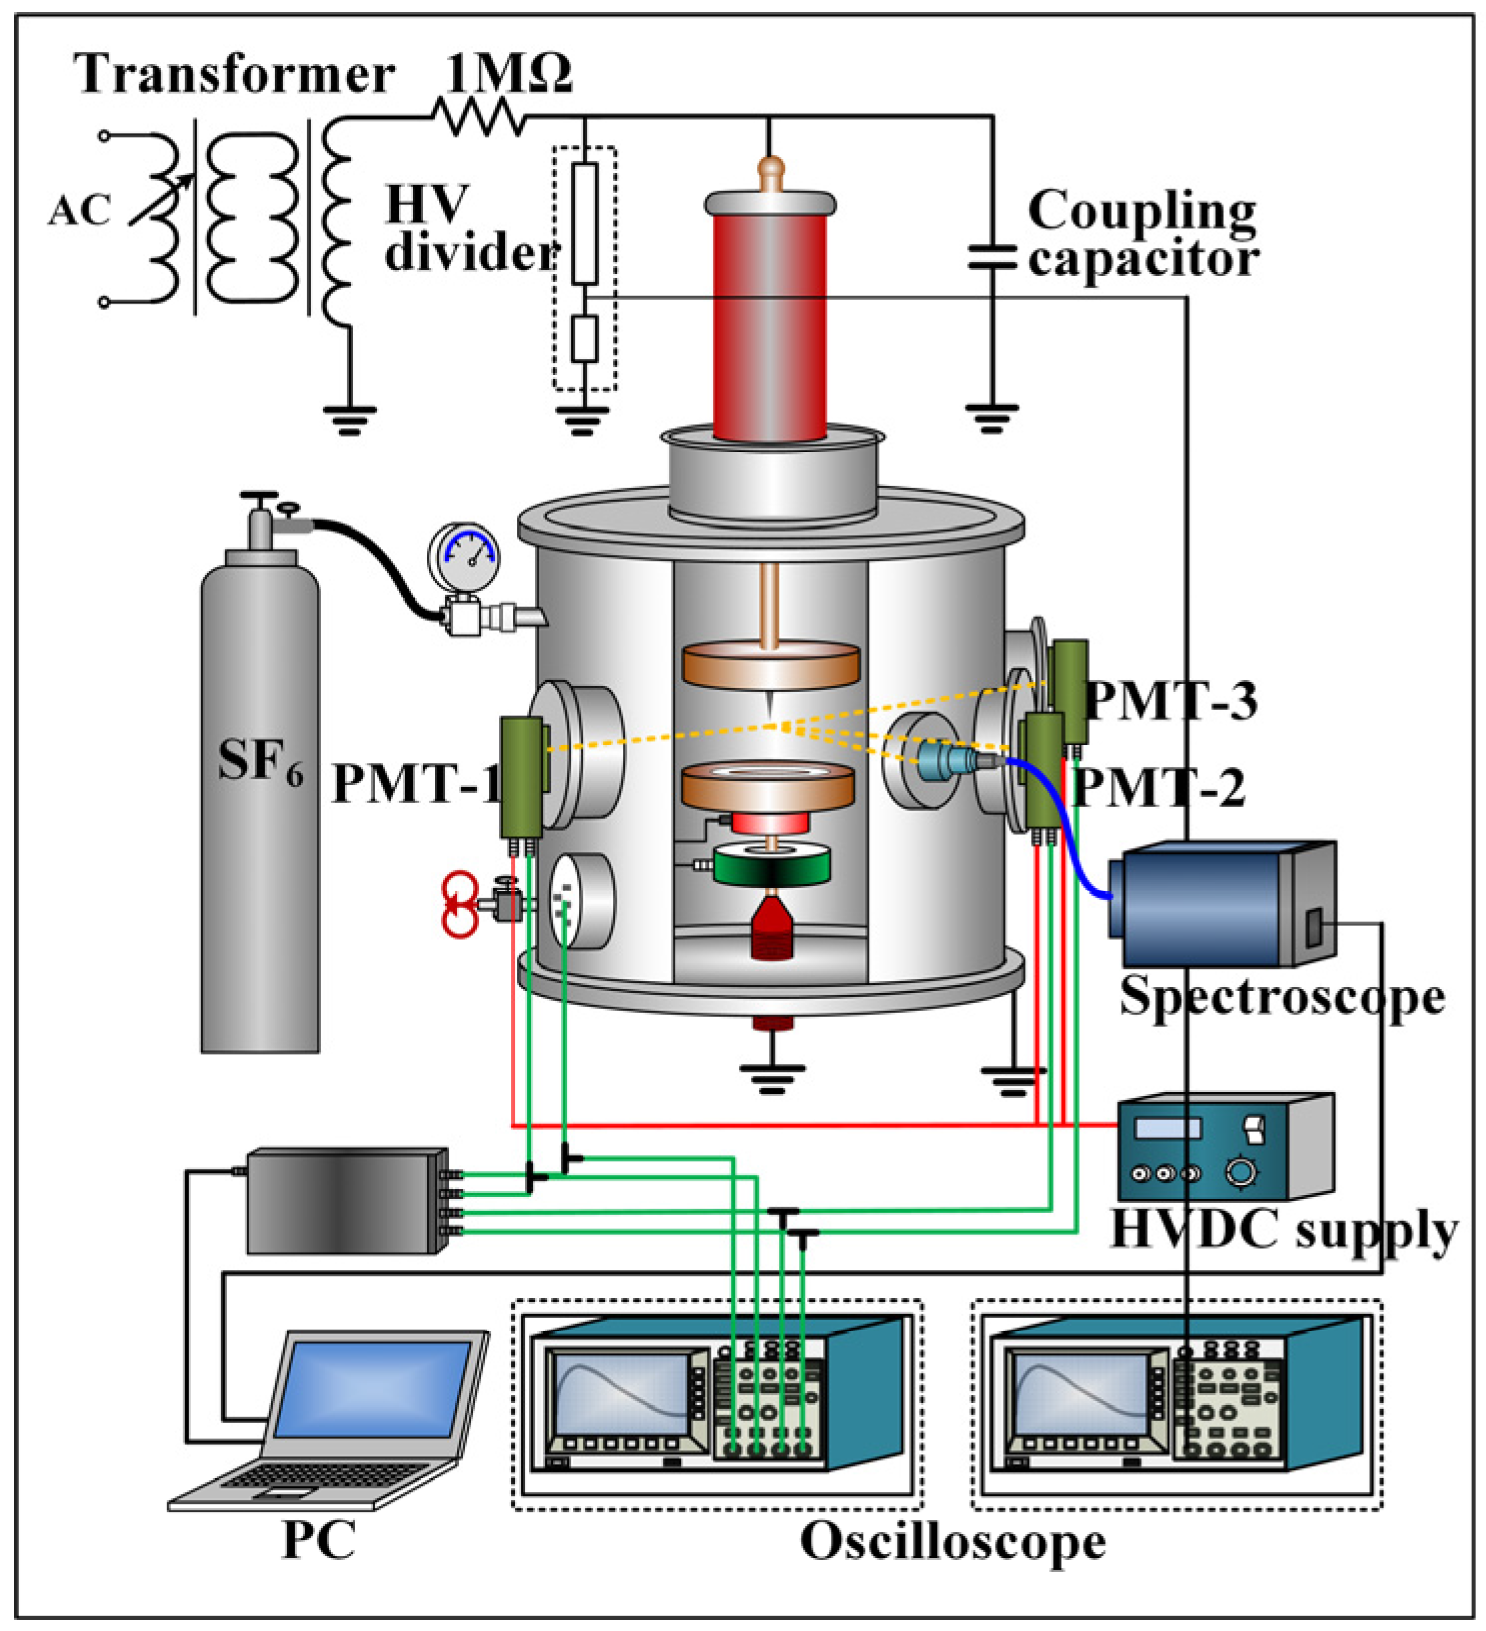
2.2. Optical and Current Measurement System

We constructed a synchronous measuring system comprising a PD current pulse current detection setup and a light emission detection system, as shown in Figure 2.
PD current pulses were coupled to a wideband current transformer (Pearson 6585, 400 Hz–200 MHz) around the ground wire. By means of calibration, we ensured that PD detection system could respond to PD current pulses with magnitudes above 1 pC. Because the pulse duration was of the order of only several nanoseconds and also because light emission from a single PD was very faint, the transient spectrum could not be properly measured within the limits of the response speed and sensitivity of the optic spectroscope used. Thus, instead of obtaining the transient spectrum of a single PD, we measured the integral spectrum of continuous PDs over several minutes. This approach can lower the requirement on the response rate of optical signal processing. A fiber-optic spectroscope (StellarNet) with a wavelength response of 200–1150 nm was employed to analyze the PD emission. To improve the receiving efficiency, a collecting lens aimed at the PD point was installed outside the quartz glass window in the test chamber. A 19-core optical fiber (200–1100 nm) was used to transfer the light from the collecting lens to the spectroscope. Three identical photomultipliers (PMs, Zolix. S1-CR131) with a flat response range of 180–920 nm were installed behind three different optical glass filters to detect the emitted light pulses in the UV, VIS, and NIR spectrum ranges. To eliminate the differences in light intensities of PDs caused either by the light propagation and or by the intrinsic sensitivity, the gain of each PMT was adjusted respectively via controlling the operation voltage of PMT. The actual transmittance curves of the glass filters are shown in Figure 3. The three light outputs from the PMs and the PD current output were transferred to a high-speed data acquisition card controlled by a personal computer. A 50-Hz transformer with a maximum voltage output of 150 kV was employed as the high-voltage power supply. A coupling capacitor of 1500 pF was connected in parallel with the test chamber.
In order to address the influence of different types of light losses on account of utilizing different glass filters on the experiment results, the actual intensities of the light emitted by the PDs and the actual response wavelength range should be determined prior to analysis. By means of numerically solving Equation (1) below, the equivalent lower and upper limits of the response wavelength can be estimated.
{ T a v ( l l o w e r l u p p e r ) = 0 l limit T ( l ) d l = A T ( l u p p e r ) = 0.707 T a v    ,           f o r     U V T ( l l o w e r ) = 0.707 T a v    ,           f o r     N I R T ( l l o w e r ) = T ( l u p p e r ) = 0.707 T a v    ,           f o r     V I S
here, l represents the wavelength, and the transmittance, T, is a function of the wavelength, i.e., T(l). Further, Tav represents the average transmittance, and llower and lupper the lower and upper limits of the response wavelength, respectively. Further, llimit denotes the maximum response wavelength of the optical sensor. The area below the transmittance curves as shown in Figure 3, which can be calculated by integrating T(l) from 0 to llimit. The detected light intensities in the UV, VIS, and NIR spectrum ranges were multiplied by the correction factor (k) (Equation (2)) to eliminate the influence of the glass filter on the transmittance. Owing to technical constraints, there were certain blind or overlapping regions such as the wavelength ranges of 300–425 nm and 675–740 nm.
k = 1 T a v
The lower and upper limits of the response wavelength and the correction factor for each optical spectrum are listed in Table 1.

3. Results and Analysis

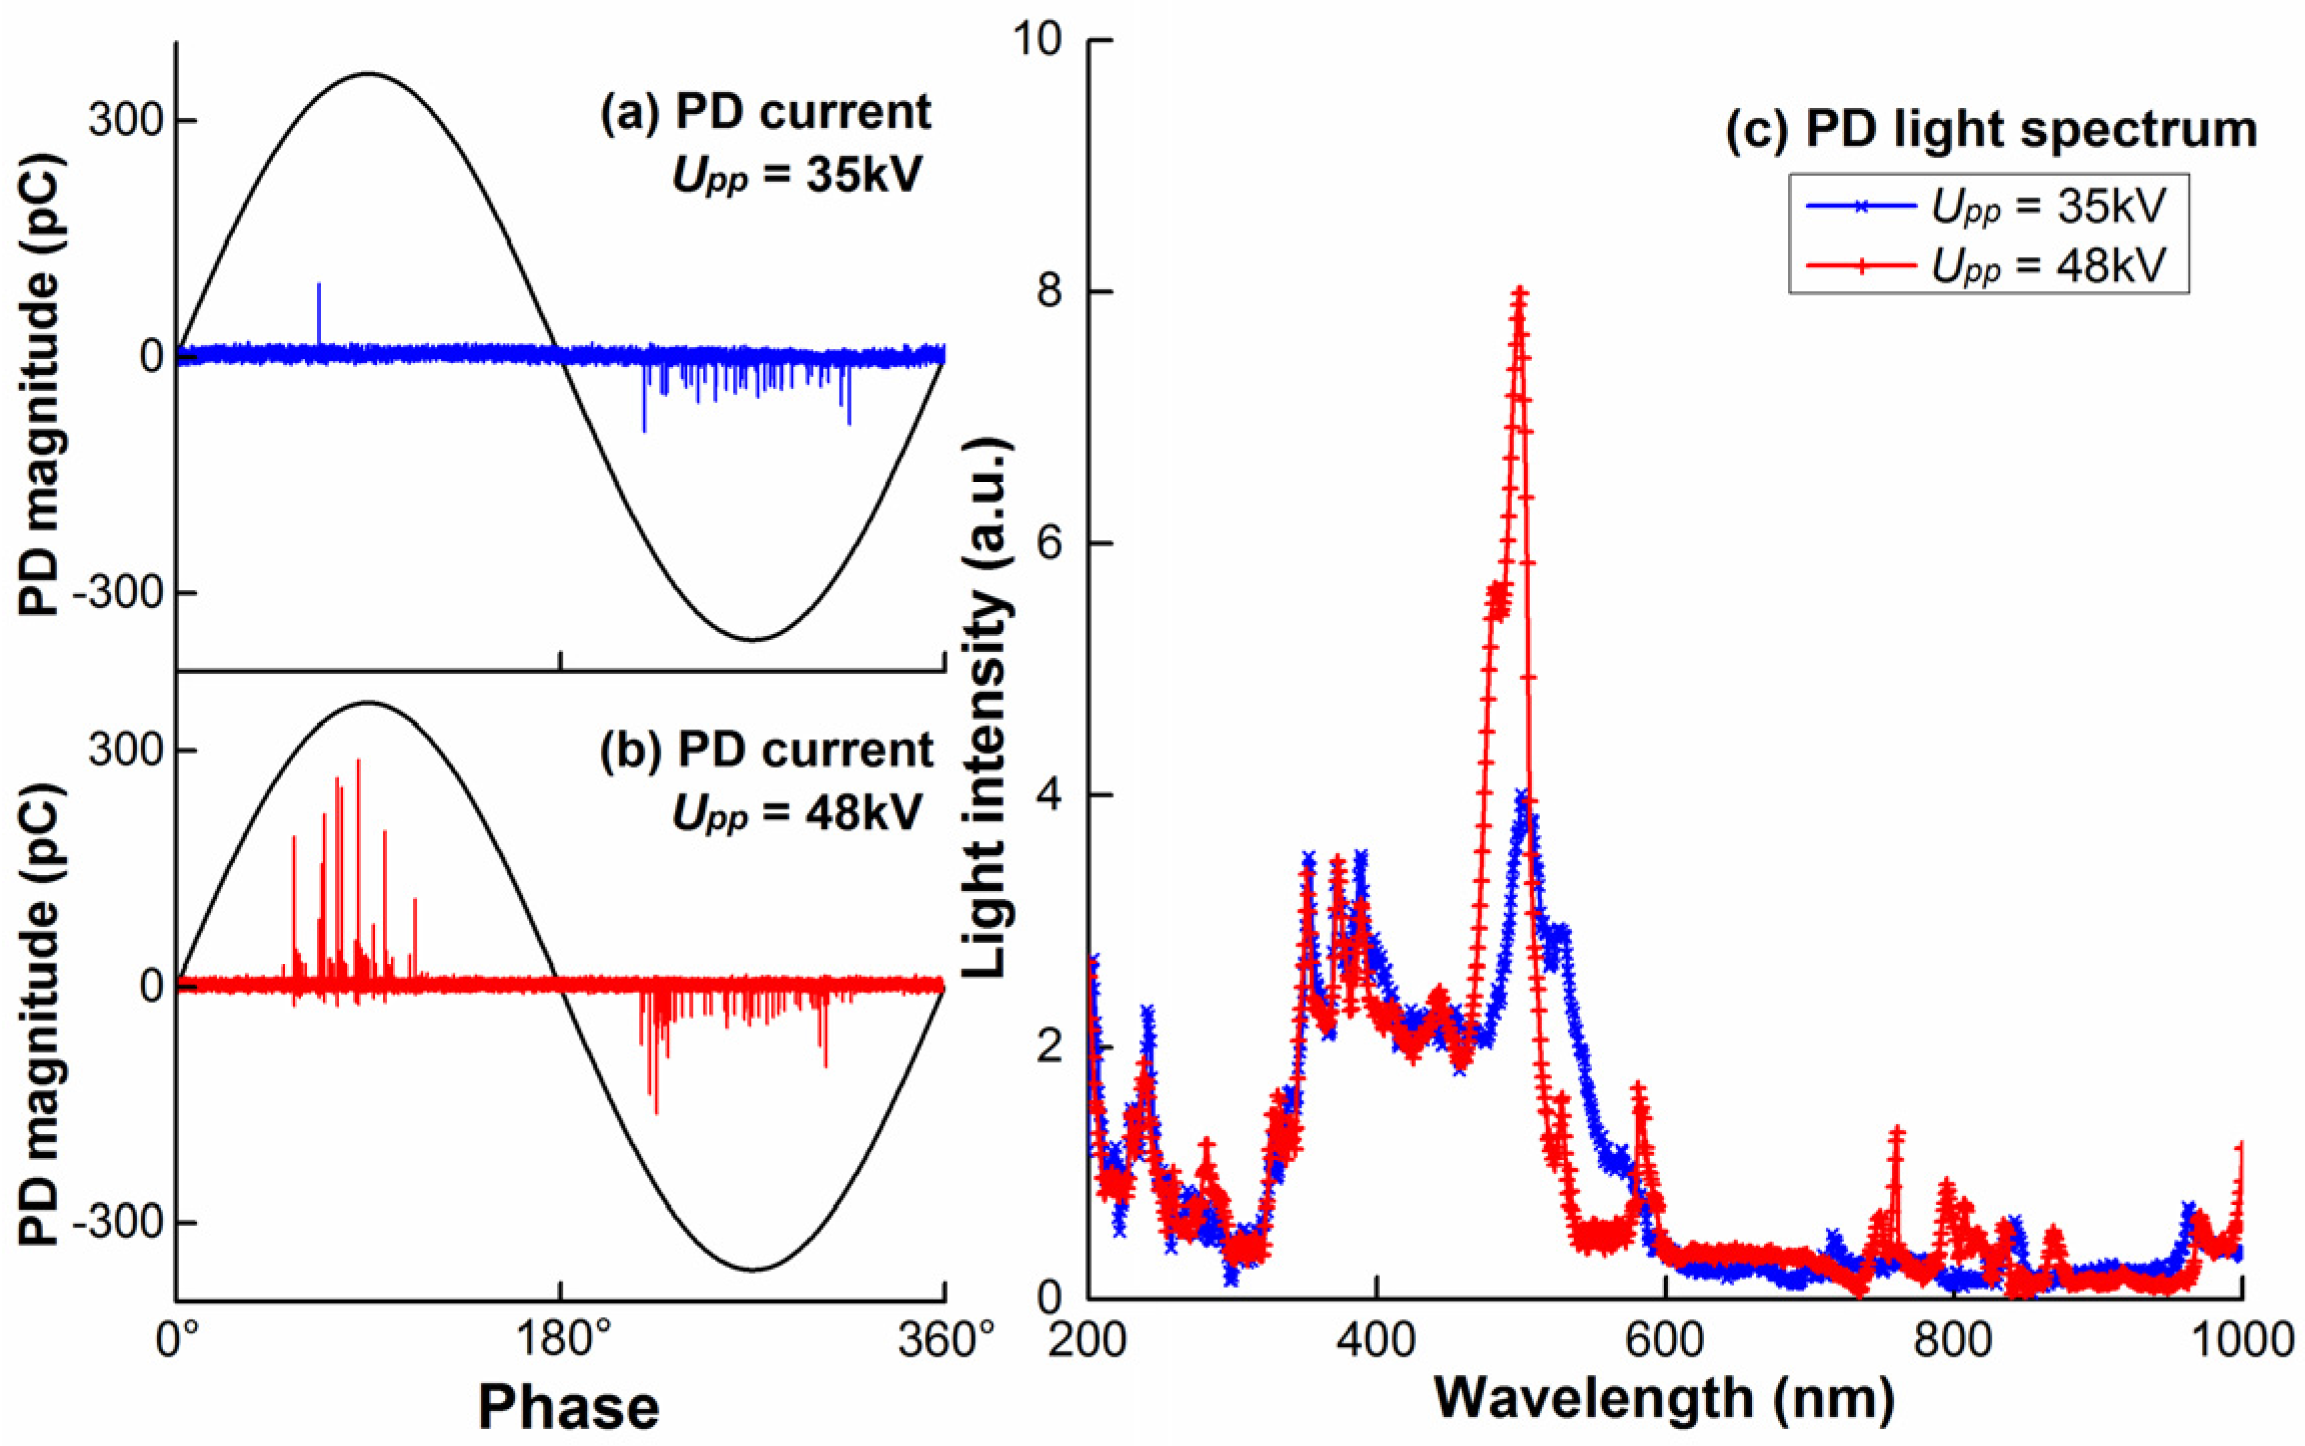
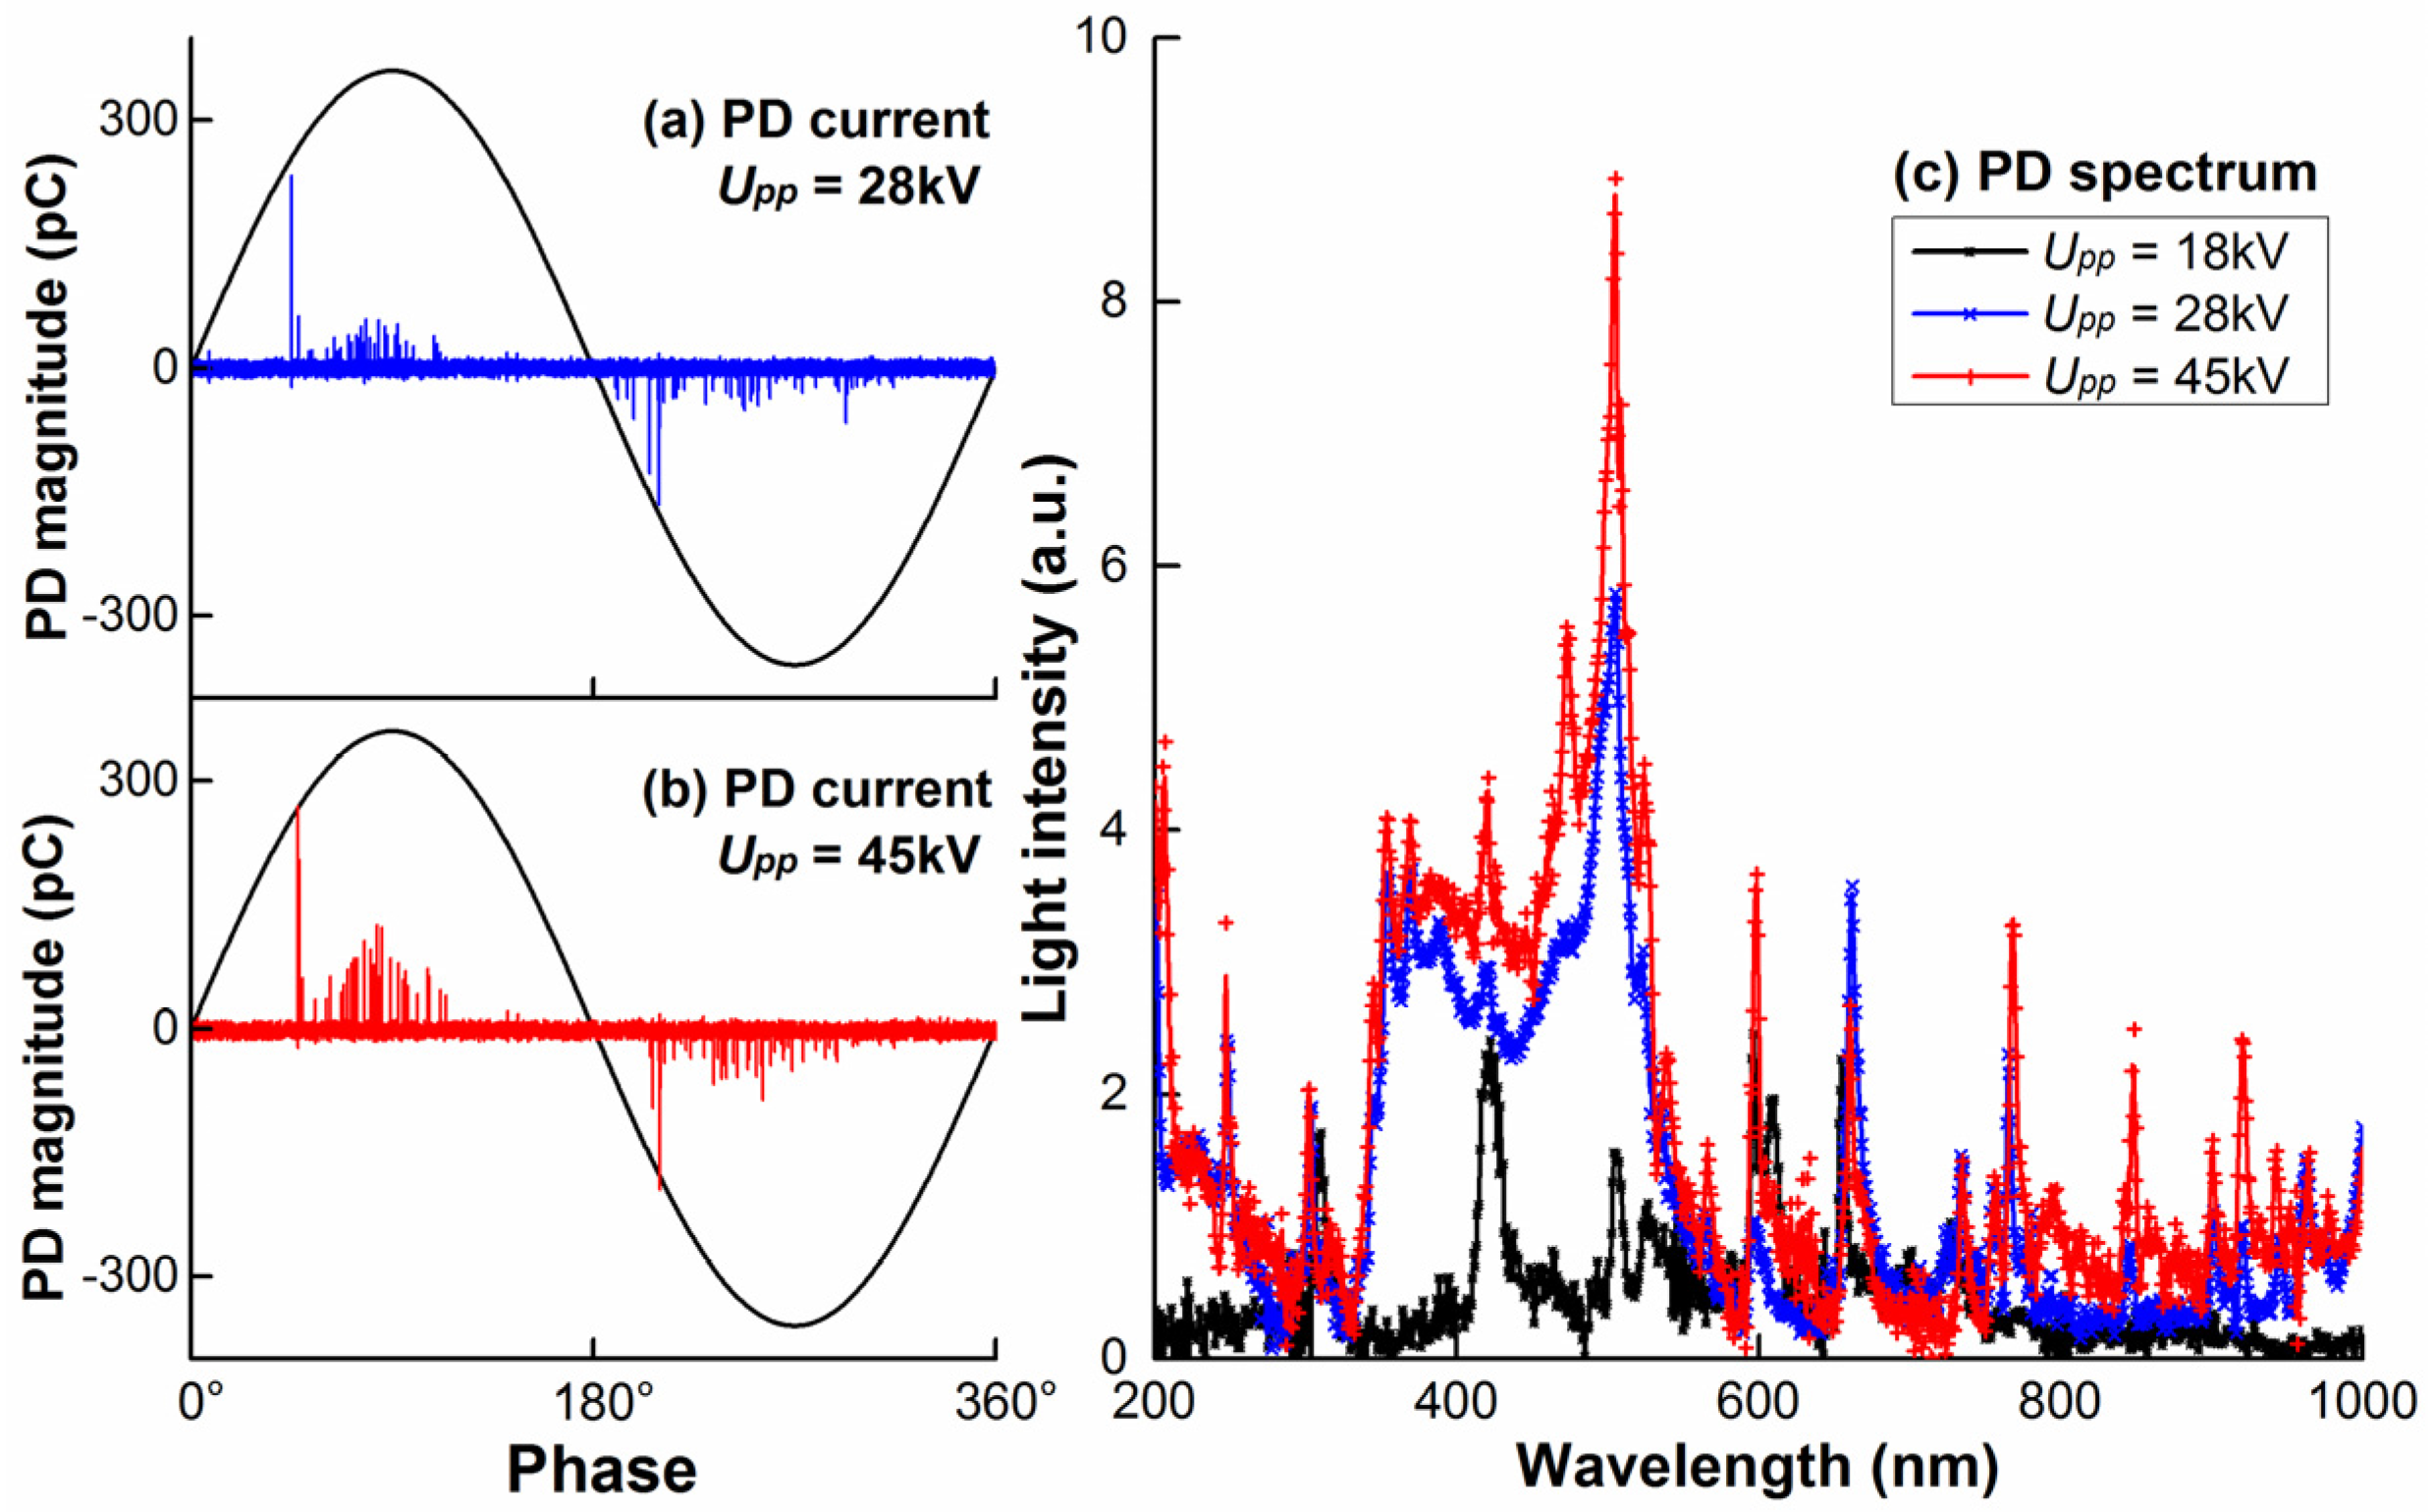
3.1. Spectra of Different Types of PDs at Various Voltage Levels

First, the spectrum of the PD radiation in SF6 and its variation with various defects and discharge energy require to be determined for the application of the optical method in PD detection. In actuality, the optical spectrum covers the UV, VIS, and the IR ranges. The spectrum varies with changes in the discharge energy driving different discharge types, which are determined by the gas condition and applied electric field, and it is also influenced by the interface lying along the discharge path in the presence of the insulator surface. The resulting optical spectrum depends on sensor parameters such as the UV corona scope, night vision, fluorescent intensifier, and other photoelectric devices. In this work, the variations in the UV, VIS, and NIR spectra are discussed based on the PD current measurement. The gas pressure of SF6 was 0.2 MPa.
Figure 4 shows the PD currents and corresponding spectra triggered by the fixed protrusion. The PDs begin with a small magnitude and exhibit frequent recurrences over the negative half-cycle when the applied voltage slightly exceeds the PD inception voltage (PDIV), as shown in Figure 4a. The integral spectrum light emitted from the point of negative potential within 3 min was mainly distributed in the wavelength range from 300 nm to 500 nm. The three characteristic peaks observed in the range from 340 nm to 400 nm were attributed to emission from the nitrogen from residual air molecules. Trace amounts of nitrogen can significantly influence the spectrum response, as has been reported in the literature [16,17]. With increase in the applied voltage, more discharges appear in the positive half-cycles with greater magnitudes, which corresponds to an increase in intensity at 500 nm as well as 580 nm and in the NIR range.
The PDs triggered by the floating particle exhibit two phases with increase in applied voltage. At relatively low applied voltages, the PDs initially occur along the side of the floating electrode that is closer to the upper electrode. In this stage, the PD series is manifested as several PDs with constant and large magnitudes of 500 pC, followed by several PDs with considerably smaller magnitudes, as shown in Figure 5a. The former PDs are generated by partial-breakdown sparks in the small gap between the floating particle and the upper electrode and the latter are composed of weak continuous corona generated on both sides of the particle. In our study, owing to the polarity effect, the abovementioned PD series was firstly observed in the negative half-cycles and then in the positive ones as the applied voltage increased, as shown in Figure 5b. In this case, the influence of the applied voltage level on the light spectrum was similar to that in the case of the protrusion. The spark discharges driven by different mechanisms from the faint corona resulted in more complex spectral lines in the range of 600–695 nm. This result has also been reported in the literature [15] via rapid spectrum measurement. The result has been attributed to light emission originating from certain dissociation reactions involving fluorine based on the assumption that the electrons involved in streamer-like discharges may have obtained energies above 14 eV to excite fluorine.
With respect to PDs generated by a particle on the insulator surface, more specific light emission processes are involved in surface discharges. In particular, electroluminescence (prior to gas ionization) caused by electron–hole recombination and collision excitation by energetic charge carriers under high electric fields [18] and the degradation of the material during surface discharges make the spectra more complex. The spectrum lines at 425, 505, and 590 nm in the integral spectrum response obtained for 3 min were made by the light emission due to the former process, as shown in Figure 6. Insulation degradation may be accelerated on account of the increase in the number and magnitudes of PDs occurring within both polarity cycles with increase in the applied voltage, as shown in Figure 6a,b.
In general, the applied voltage level affects the spectrum via variation in the type of discharges from unipolar to bipolar and the discharge energy from faint to intensive. In our study, no obvious differences in the distributions of the spectra were observed for various gas pressures ranging from 0.1 MPa to 0.3 MPa.

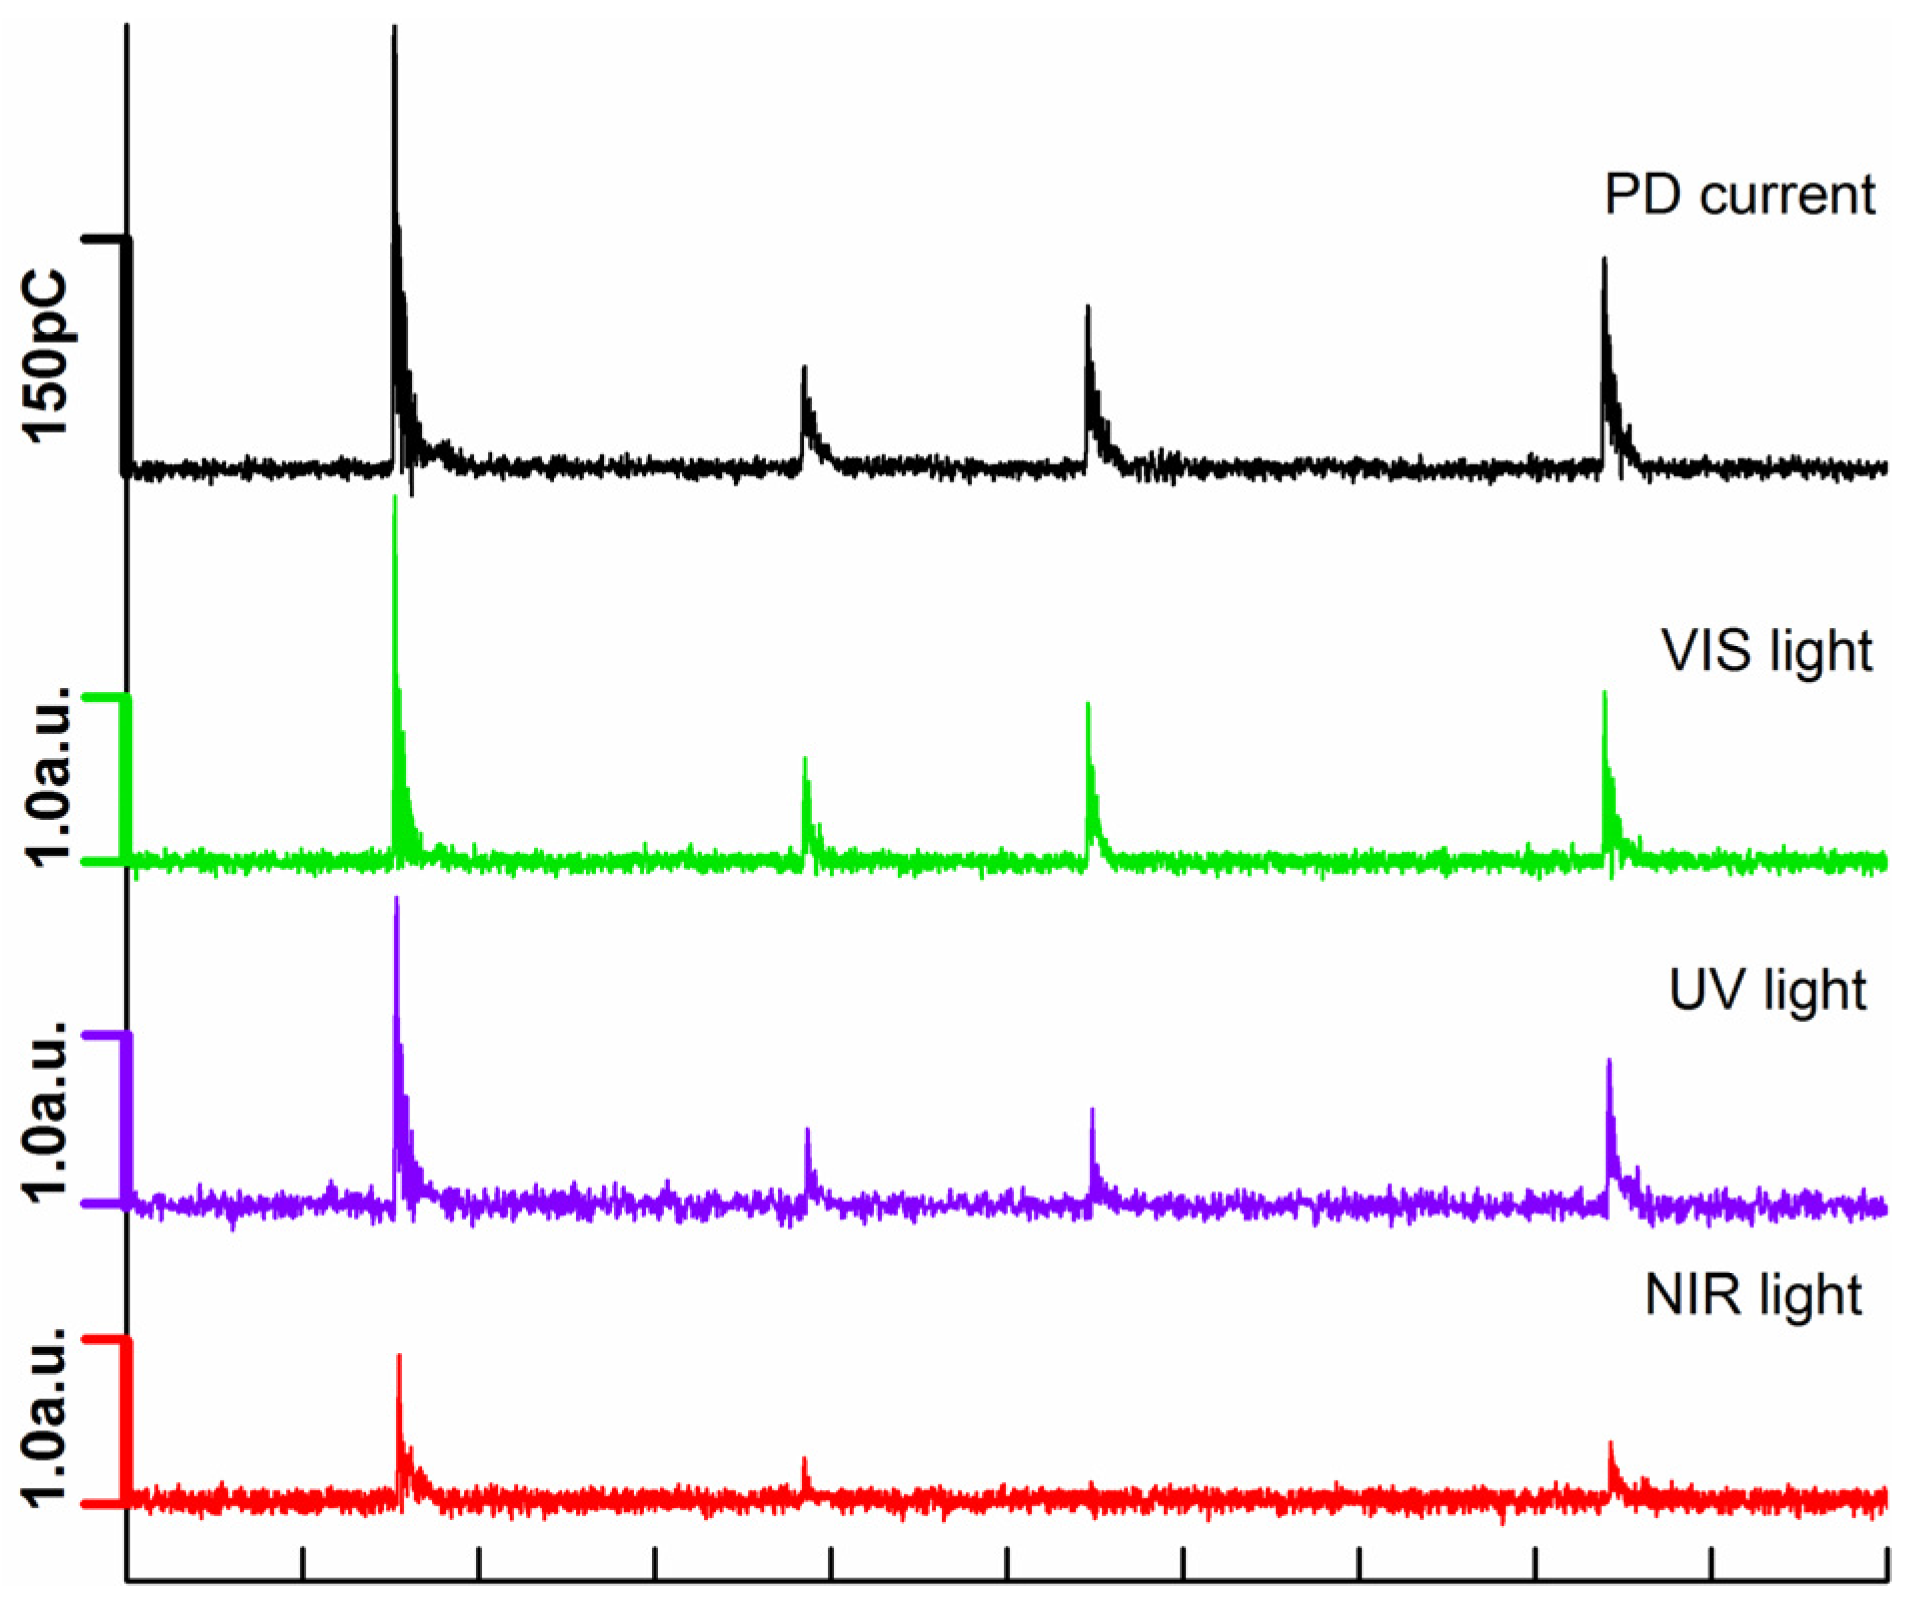
3.2. PRPD Analysis of Light Pulses in UV, VIS, and NIR Spectral Ranges

The influence of the spectrum response of the optical sensor on light detection and diagnosis cannot be ignored because the relationship between the photon number and the PD charge varies over different spectral ranges. In this section, we discuss the statistical characteristics of the light pulses emitted by PDs in the UV, VIS, and NIR ranges by means of studying the corresponding PRPD patterns and the influence of the response spectrum on the PRPD.
The PRPD distributions (Φ–q, Φ–N) of the PD current and light in the UV, VIS, and NIR spectra corresponding to PDs triggered by the fixed protrusion are described by exemplifying the results for two levels of applied voltages, as shown in Figure 7a,b, which depict the typical patterns at the inception of the PD and the verge of breakdown. The distributions of light pulses in the three spectra are consistent with those of the current pulses in terms of outline and quantity. For the UV results, the light pulses in the positive half-cycles could hardly be detected at relatively low voltages even when positive-point PDs of large magnitudes frequently occurred. On the contrary, the positive-point PDs emitted significant amounts of light in the VIS and NIR ranges, thereby indicating VIS and NIR sensitivity to positive-point PDs, particularly when the applied voltage increased. Very few light pulses in the NIR range were observed in the negative half-cycles over the entire range of applied voltage level.
The PRPD patterns of the PD current pulses and light pulses induced by the floating particle are shown in Figure 8. PDs with large and nearly constant magnitudes are caused by the spark breakdown in the gap between the upper point of the floating particle and the plate electrode as the potential drop along the gap recovers to the critical value of the spark breakdown in SF6 gas. This type of PD can be detected in all the three spectrum ranges with different magnitudes. The PD exhibits more light emission in the VIS range than in the UV and NIR ranges. It is to be noted that during PDs of large magnitudes up to 1.0 nC, some continuous faint corona discharges also occur on both sides of the floating particle following the PDs, as mentioned in Section 3.1. This type of PD was observed only via UV-light-pulse detection. Therefore, the distributions of the UV light pulses during the entire range of applied voltage level exhibited a dispersed emission pattern instead of intermittent emission.
With respect to PDs triggered by the particle on the insulator surface, discharges occurred along both the gas path and the surface, giving rise to complex PRPD patterns. In general, more light pulses were detected in the VIS spectrum range, particularly when the applied voltage was small. The light intensity detected in the NIR range remained unchanged at a relatively low value with increase in the applied voltage.
Table 2 lists the overall comparisons of the PD charges, relative light intensities and the pulse number in each case based on the statistical results shown in Figure 7, Figure 8 and Figure 9.

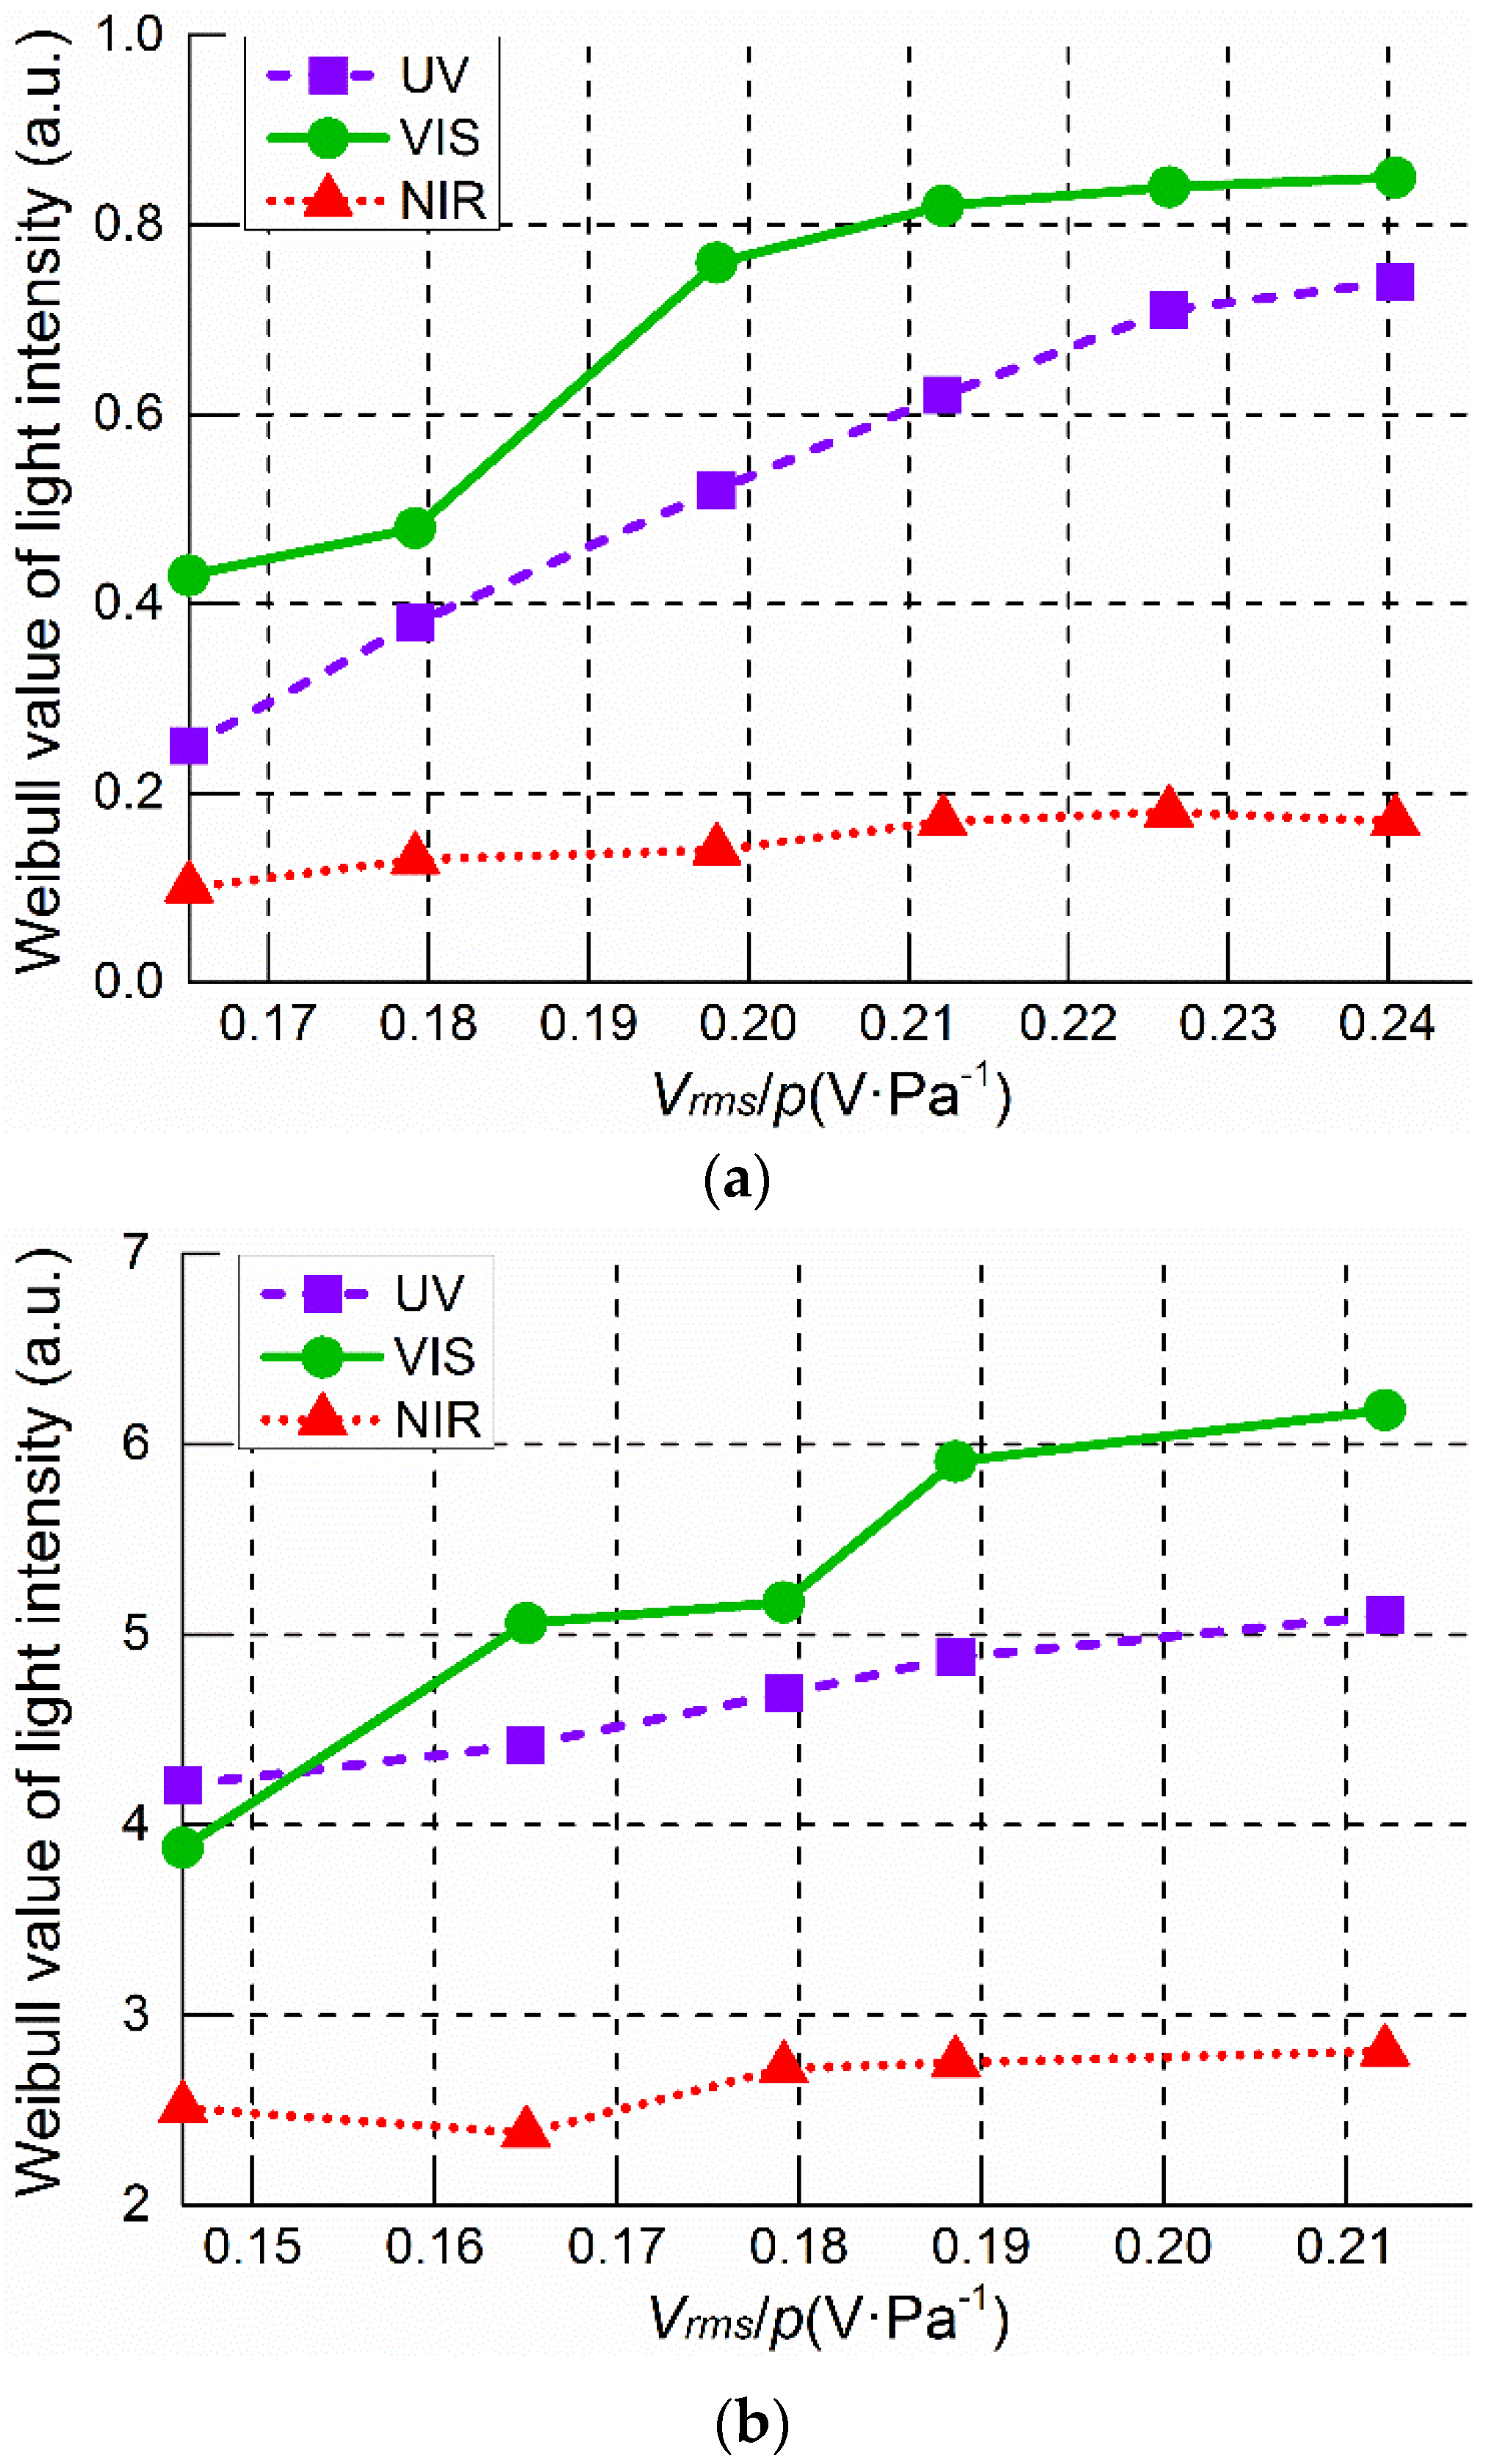
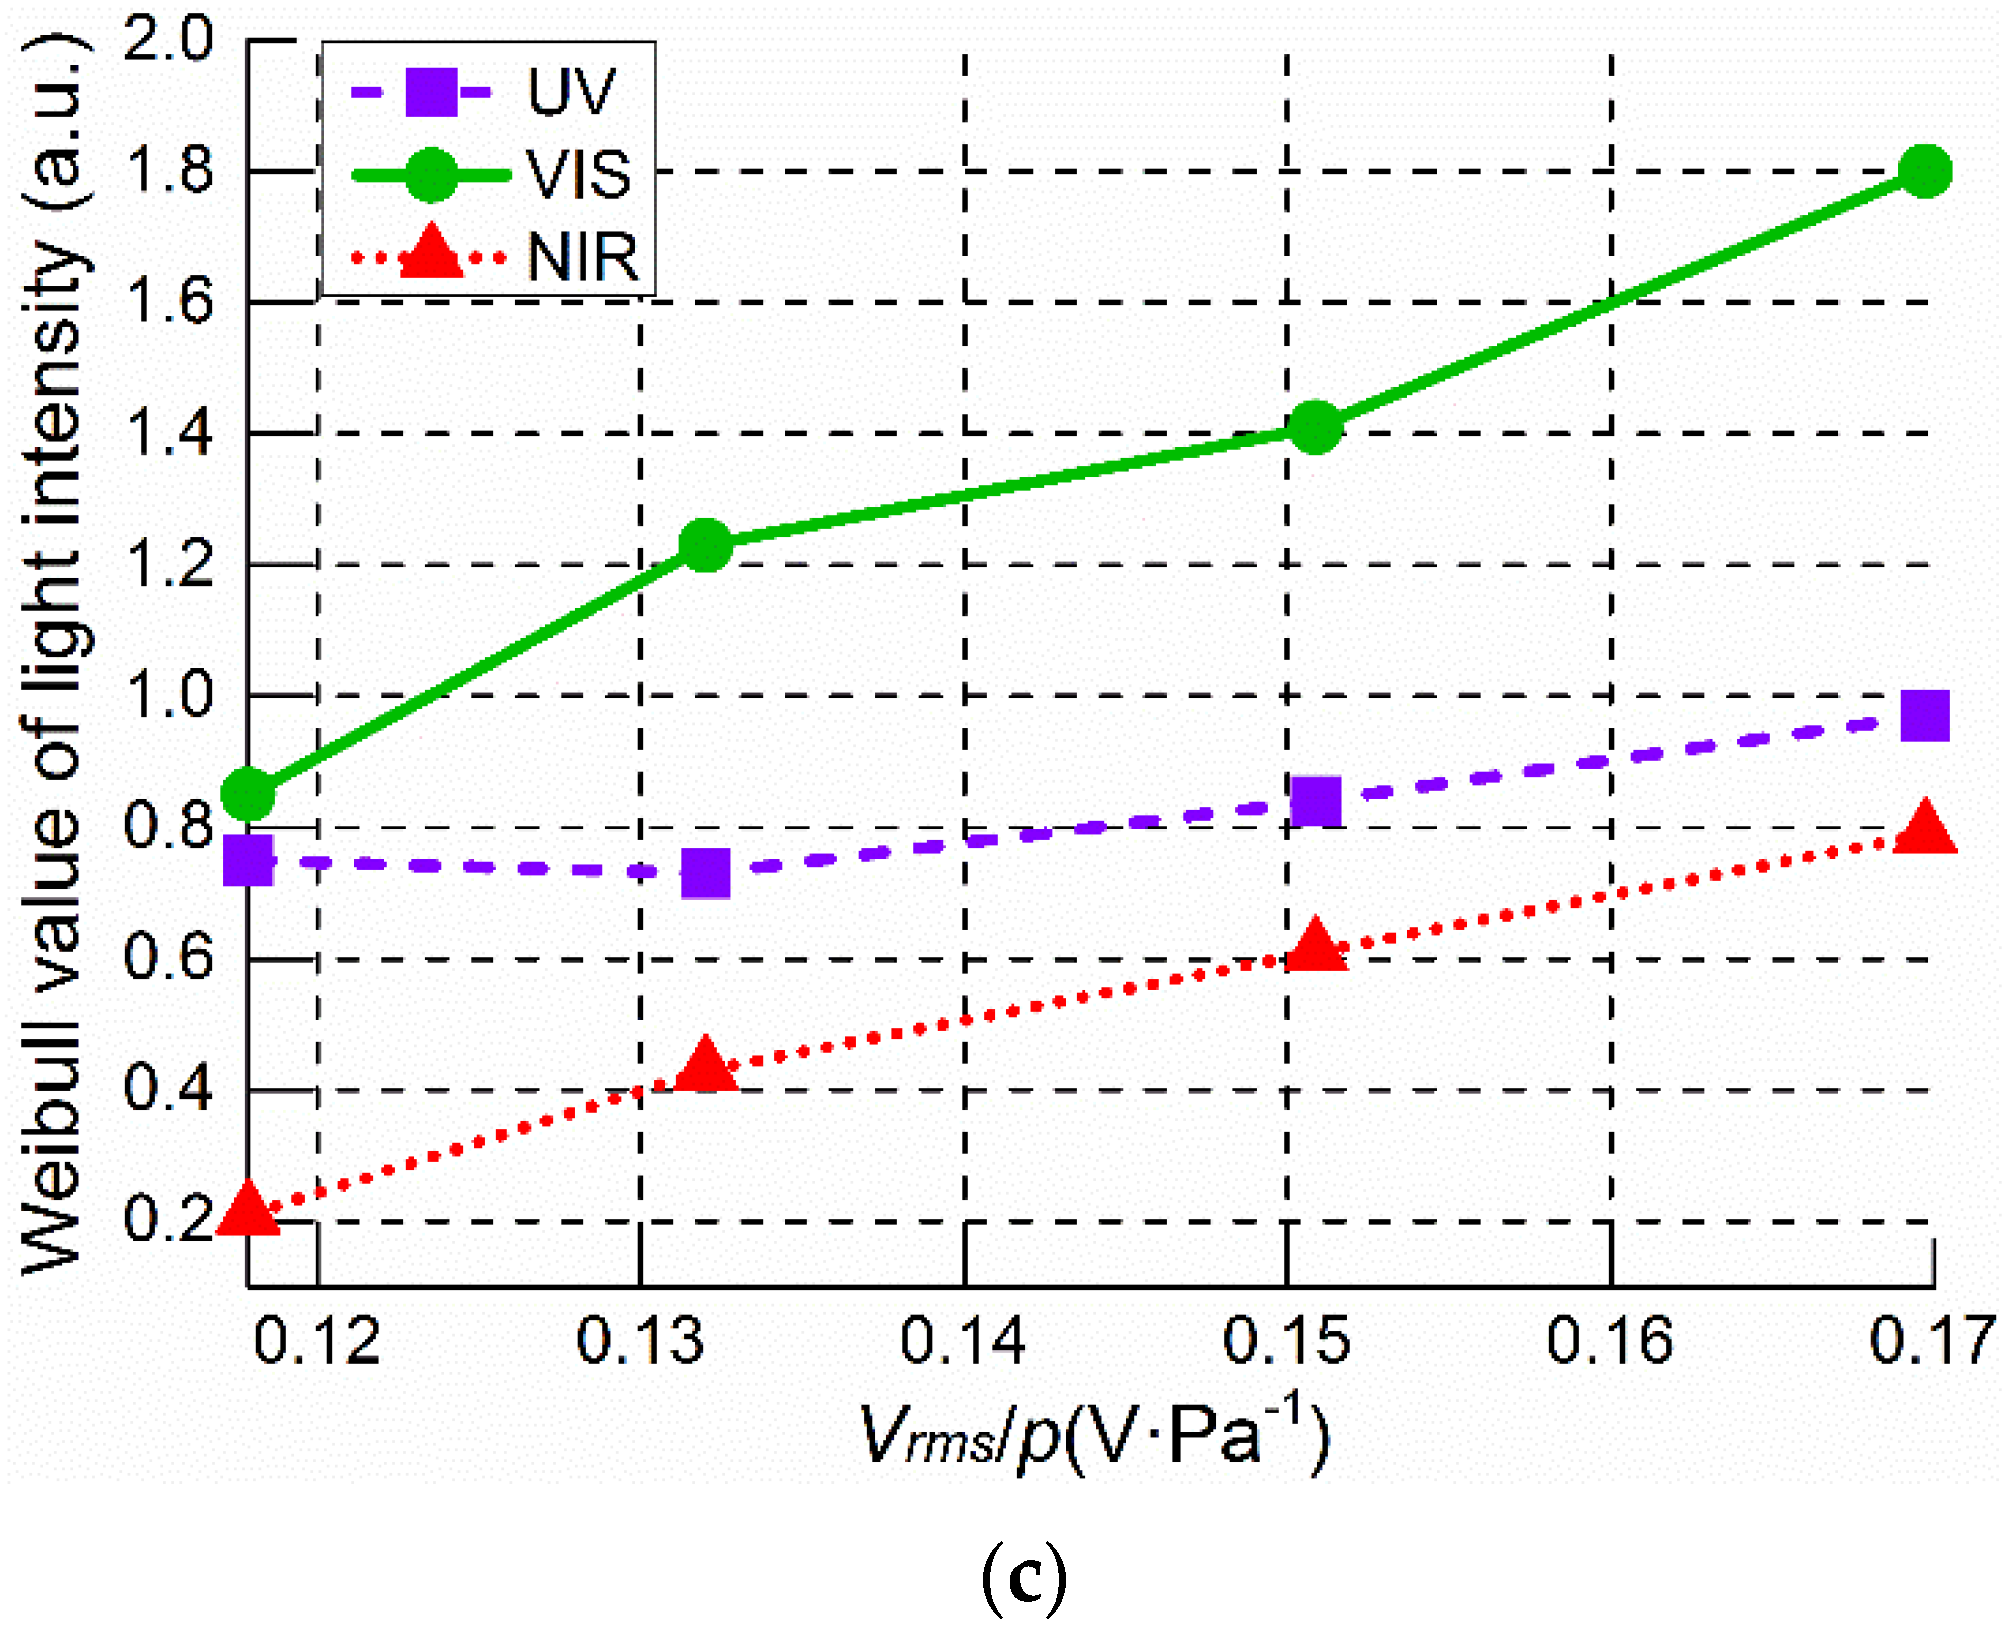
3.3. Variations in Light Intensity of PDs with Increasing Voltage

Apart from the attenuation of light intensity during propagation caused by the absorption of SF6 gas, photons were emitted during the processes of ionization, attachment, and recombination [19], and this was determined by the electron energy distribution. With respect to PD diagnosis based on light detection, the integral intensities of the light emission detected in different spectral ranges can be investigated as a function of applied voltage, which can aid in understanding the effectiveness of the different optical detections in detecting PDs with different electron energy distributions. In the present work, the relative light intensity was obtained via Weibull probability analysis [20], (Equation (3)), and the RMS value of the applied voltage was normalized by the gas pressure.
ln ( ln ( 1 F ( l ) ) ) = β ln l β ln l 0
here, F represents the probability as a function of the light intensity l, which can be obtained by using the empirical Equation (4) with experimental data. Further, the shape parameter β and light intensity l0 can be estimated by the linear fitting of Equation (3) [20].
F ( l ) = i 0.5 n + 0.25
here, i denotes the number of data points less than l and n the total number of data points.
Figure 10 shows the Weibull light intensities of the three spectral ranges as a function of the gas-pressure-normalized applied voltage. In the case of the protrusion, the light intensities generally increase with increasing Vrms/p, particularly for the UV and VIS ranges. For the VIS light intensity, there is a dramatic increase in the Vrms/p region from 0.179 to 0.198, as can be observed in Figure 10a. This dramatic increase corresponds to the instant when the PDs begin to form in the positive half-cycles with increasing voltage. The large-magnitude positive PDs contribute to newer components in the VIS spectrum, thereby leading to increase in intensity. This result can also be proved via the spectrum analysis provided in Section 3.1. This kind of increase in the VIS light intensity can also be observed in the case of PDs induced by the particle on the insulator (Figure 10c). For the NIR case, the light intensity changes slightly with increase in Vrms/p because there is very little emission in the NIR range, and it remains unchanged over the entire range of Vrms/p investigated. With regard to the case of the floating metal particle, two dramatic surges in the intensity are observed in the Vrms/p ranges of 0.146–0.165 and 0.179–0.185, as shown in Figure 10b. The first one is caused by the inception of the positive-point-induced spark discharges in the negative half-cycles, and the second is due to the inception of the negative-point-induced spark discharges in the positive half-cycles. In comparison with the VIS light intensity, the intensities of the UV and NIR emissions increase slowly with increasing Vrms/p. In general, the light emission from the PDs in the floating particle case in all the three spectral ranges was considerably more intense than those of the protrusion case. For PDs occurring along the insulator surface, both the VIS and NIR intensities exhibited an obvious increasing tendency with increase in Vrms/p. These results are attributed to new spectrum components in the VIS and NIR ranges arising due to the presence of the insulator surface with increasing discharge energy.

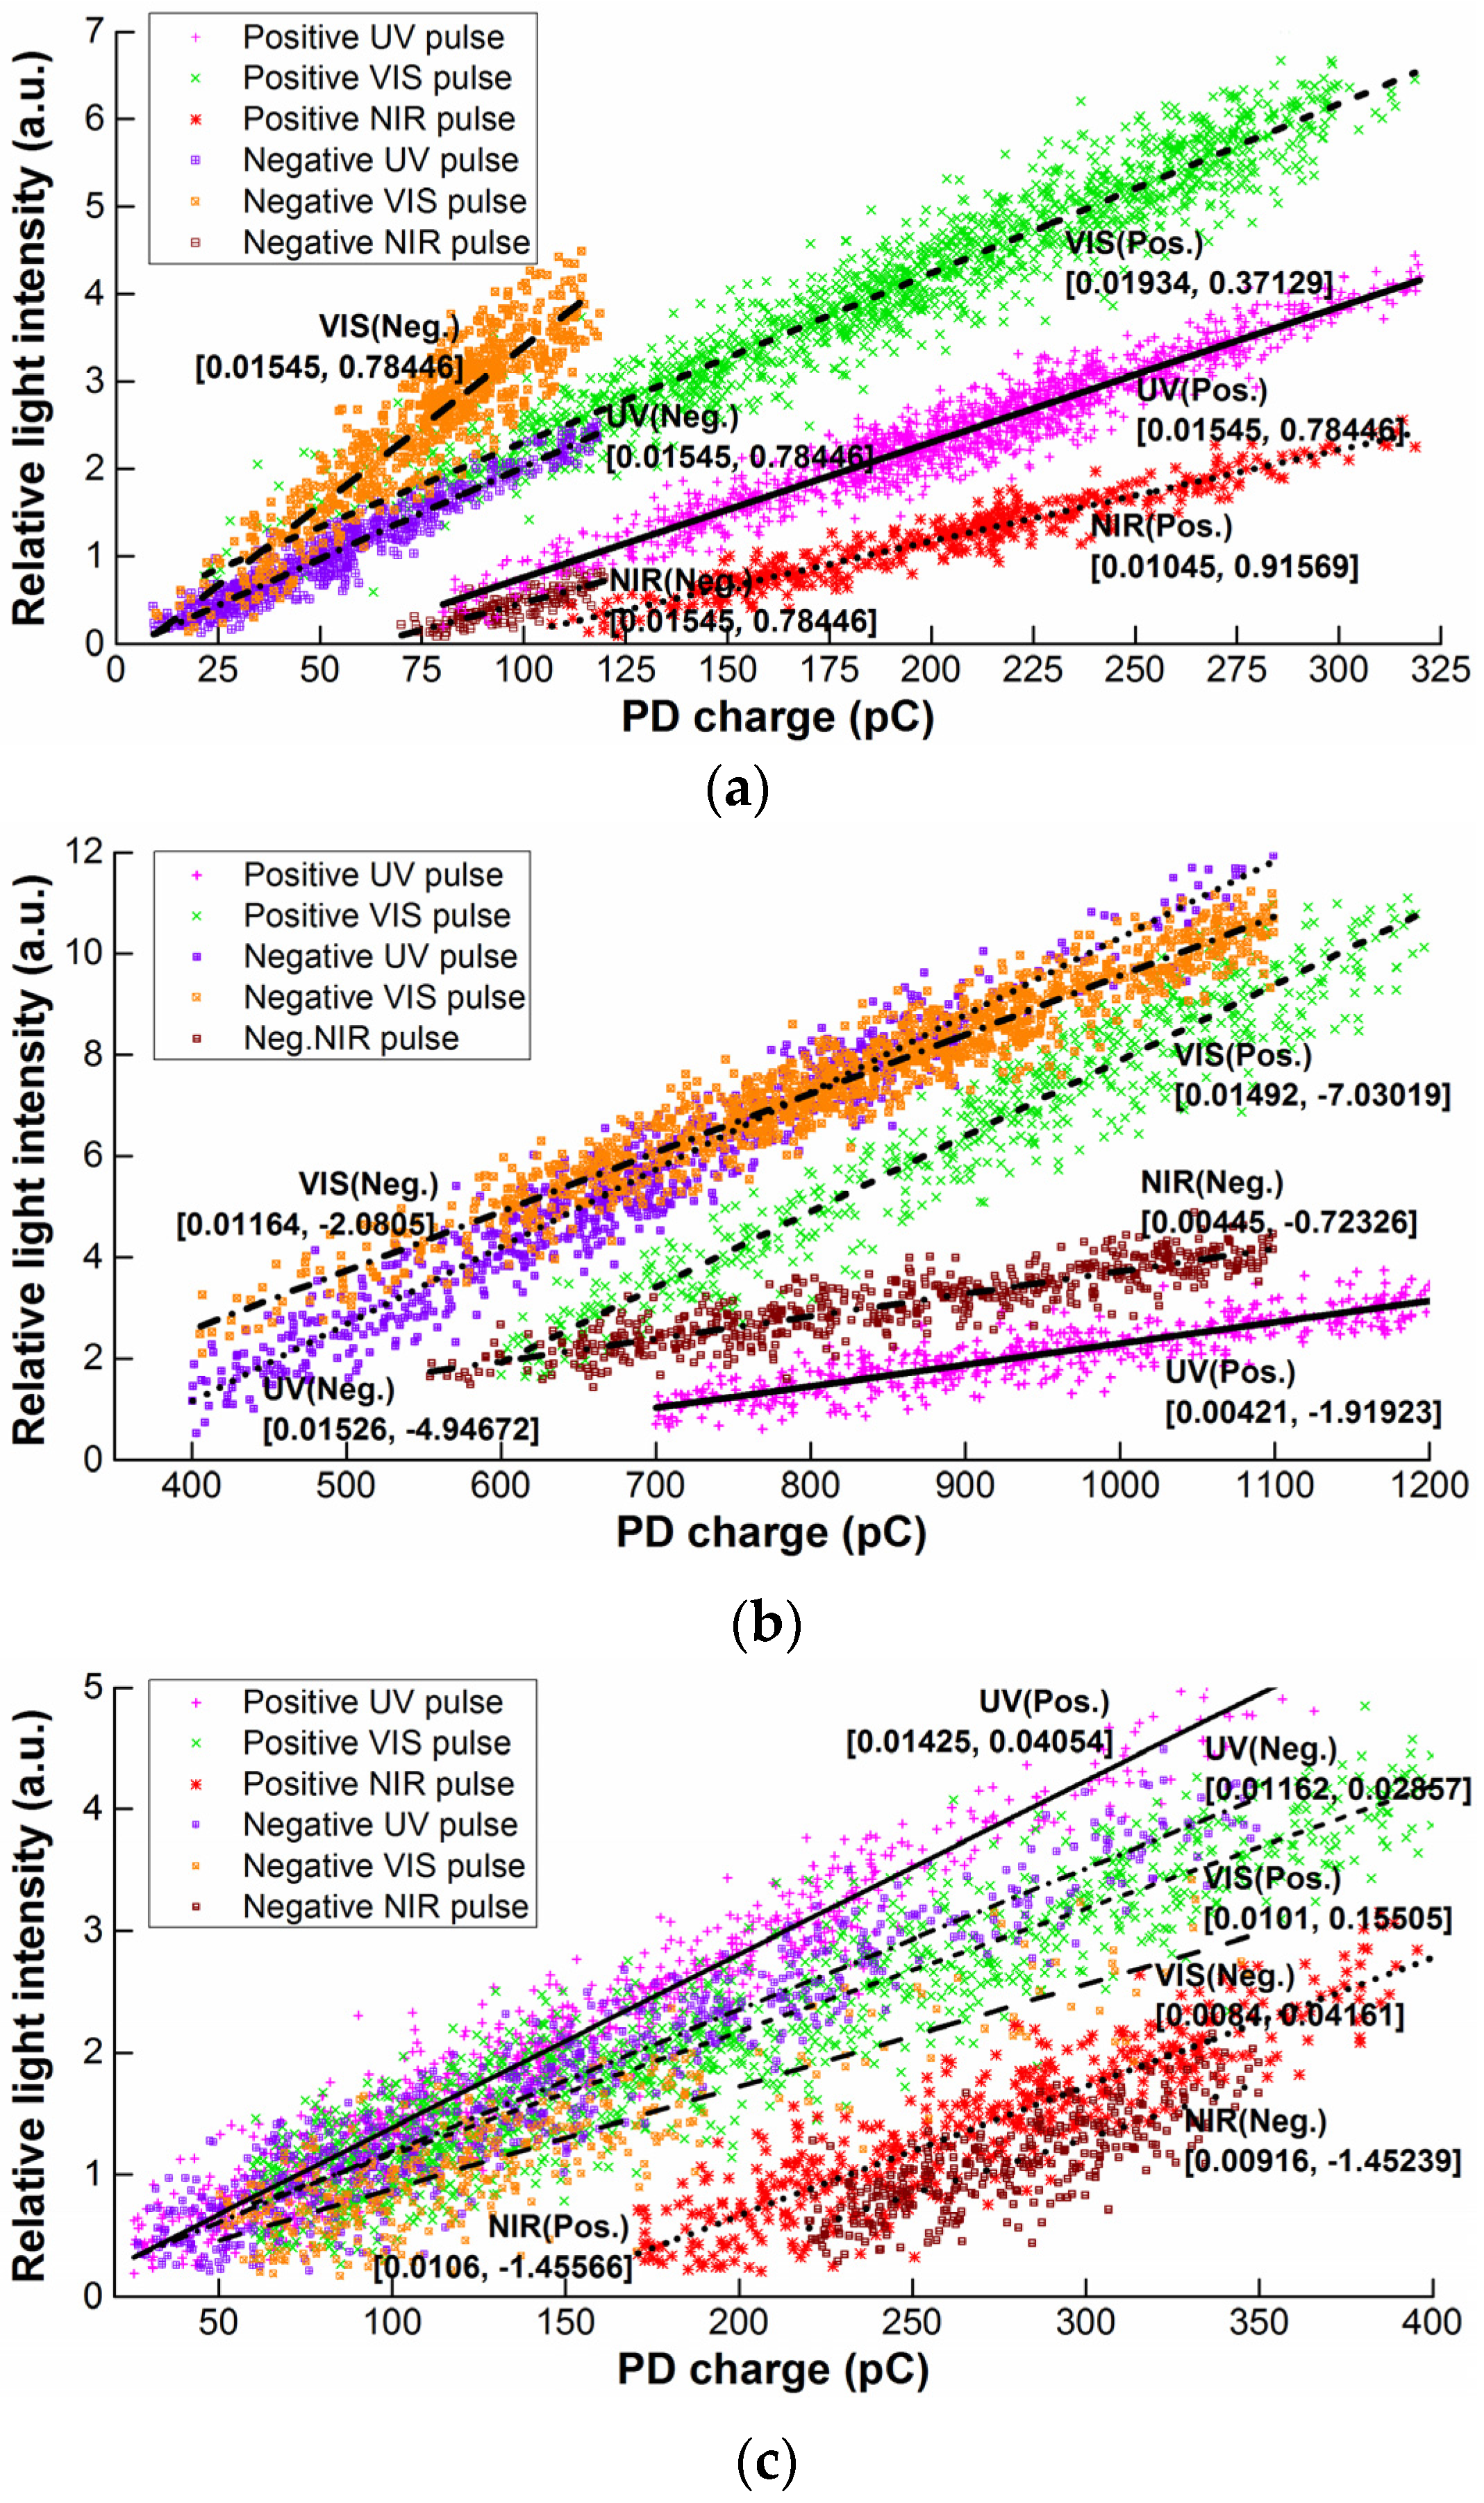
3.4. Relationship between Light Intensity and PD Charge

The pulse current measurement approach is the only method that enables quantitative evaluation of the severity of PDs triggered by defects. This is because the apparent PD charge (or PD magnitude detected via pulse current measurements as defined by the IEC 60270 standard) is in proportion to the actual charge released by the PD event even though the scaling factor cannot be obtained for an insulation system with unknown defects. The linearity of optical detection with PD severity requires to be investigated because it affects the characterization of PDs. In this work, the intensities of the light pulses in the three spectral ranges were compared with the PD current magnitudes by means of simultaneous measurement to investigate their relationships for the three types of defects (Figure 11). By means of recording the magnitudes of the light pulses and the corresponding magnitude of the current pulses simultaneously, we performed a statistical analysis of the relationships between these two parameters.
The distributions of the relative light intensities in the three spectral ranges as functions of the PD charge were redrawn with a unified scale, as shown in Figure 12. Here, we remark that sensitivity and linearity form the two important factors for optical PD detection. In this context, linear fitting was directly applied to describe the relationships between the light and current signals (Equation (5)). The slope (A) and intercept (B) of the fitting line were used to describe the sensitivity of the optical detection. The standard error (SE) and adjusted R2 value were used to characterize the degrees of linearity and dispersion, respectively. The fitting lines for the different cases are shown in Figure 12.
Light    intensity = A PD    charge    + B
The parameters of linear fitting used for examining the relationships between light pulses and current pulses of PDs in different cases are summarized in Table 3. The table entries indicate that in both the positive and negative half-cycles, the VIS optical detection exhibited high sensitivity to PDs, as reflected by the relatively large slope and intercept values of the fitting line regardless of whether PDs occurred at the SF6/electrode interface (protrusion and floating particle) or SF6/electrode/insulator junction. As regards UV detection, in most cases, a large linearity was observed with respect to the VIS and NIR detection cases, as reflected by the smaller SEs and the adjusted R2 value tending closer to 1. As regards NIR optical detection, the sensitivity to PD charge was smaller, and a relatively large dispersion was observed in the fitting. Most of the light-pulse data points were distributed in the high-PD-magnitude region.

4. Conclusions

In this study, we realized the optical detection of PDs triggered by three typical artificial defects in SF6 gas in the UV, VIS, and NIR spectral ranges. The PD light pulses were analyzed statistically via PD current measurements. The following conclusions can be drawn from our results.
PDs occurring at the interface between SF6 and the electrode (fixed protrusion and floating particle) began with negative point with light emission spectra ranging from UV to VIS, and a majority of the spectral components was due to emission from the nitrogen of air impurities present in the gas. More discharges independent of the impurity influence were observed in the positive half-cycle, resulting in spectral expansion up to the NIR range. With regards to PDs formed at the triple junction of SF6 gas, the electrode, and the insulator, certain spectrum lines in the VIS range were observed prior to PD inception, which was caused by electroluminescence. The spectral complexities of the VIS and NIR ranges increased in the presence of the insulator surface.
The light emission induced by PDs in SF6 gas depends upon the discharge energy, discharge interface, applied voltage polarity, and gas pressure, which eventually led to inconsistencies of the results with respect to current pulses in terms of outline and magnitude in the PRPD patterns. In general, the PRPD of UV light pulses yielded a pattern covering very weak negative electroluminescence, corona, and PDs. The PRPD of VIS light accurately depicted the actual features of the current PD pattern in most cases. The NIR-PRPD was relevant for severe PDs only.
Our Weibull probability analysis indicated that the light intensities increased with increasing applied voltage. The observed drastic increases in the VIS intensity were due to the initiation of PDs in the positive half-cycles with increasing Vrms/p, resulting in the generation of new spectral components in the VIS spectrum, thus yielding an increase in intensity. For the NIR emission induced at the SF6/electrode interface, the intensity changed slightly with increase in Vrms/p because the NIR emission component was small, and it remained unchanged over the entire range of Vrms/p investigated. For PDs occurring along the insulator surface, the NIR spectrum exhibited an obvious increasing tendency with increase in Vrms/p.
Our linear fitting analysis on the relationships between the light pulses and current pulses of PDs in different cases indicated that VIS optical detection exhibited high detection sensitivity regardless of whether PDs occurred at the SF6/electrode interface (protrusion and floating particle) or the SF6/electrode/insulator junction (particle on surface). In most cases, UV detection exhibited greater linearity with respect to VIS and NIR detection.
We believe that our findings can significantly contribute to optical partial discharge diagnosis of high-voltage systems.

Acknowledgments

The authors would like to thank the project supported by the National Natural Science Foundation of China (Grant No. 51507130) and China Postdoctoral Science Foundation (Grant No. 2014M560777) for the financial support.

Author Contributions

In this work, Ming Ren designed the experiments and drafted the manuscript. Ming Dong conceived of the study and helped to draft the manuscript. Jialin Liu participated in all the electrical tests in the study, performed the analysis of data and was also involved in drafting the manuscript.

Conflicts of Interest

The authors declare no conflict of interest.

References

  1. Laux, C.O.; Spence, T.G.; Kruger, C.H.; Zare, R.N. Optical diagnostics of atmospheric pressure air plasmas. Plasma Sources Sci. Technol. 2003, 12, 125–138. [Google Scholar] [CrossRef]
  2. Boczar, T.; Fracz, P.; Zmarzly, D. Analysis of the light radiation spectra emitted by electrical discharges in insulation oil. Phys. Chem. Solid State 2003, 4, 729–736. [Google Scholar]
  3. Yoshimura, N.; Nishida, M.; Noto, F. Light-emission from tracking discharges on organic insulation. IEEE Trans. Electr. Insul. 1984, 19, 149–155. [Google Scholar] [CrossRef]
  4. Niemeyer, L. A generalized approach to partial discharge modeling. IEEE Trans. Dielectr. Electr. Insul. 1995, 2, 510–528. [Google Scholar] [CrossRef]
  5. Tenbohlen, S.; Denissov, D.; Hoek, S.M. Partial discharge measurement in the ultra high frequency (UHF) range. IEEE Trans. Dielectr. Electr. Insul. 2008, 15, 1544–1552. [Google Scholar] [CrossRef]
  6. Judd, M.D.; Farish, O.; Hampton, B.F. The excitation of UHF signals by partial discharges in GIS. IEEE Trans. Dielectr. Electr. Insul. 1996, 3, 213–228. [Google Scholar] [CrossRef]
  7. Álvarez, F.; Garnacho, F.; Ortego, J.; Urán, M.A.S. Application of HFCT and UHF sensors in on-line partial discharge measurements for insulation diagnosis of high voltage equipment. Sensors 2015, 15, 7360–7387. [Google Scholar] [CrossRef] [PubMed]
  8. Standard in Development: PD IEC/TS 62478 High Voltage Test Techniques—Measurement of Partial Discharges by Electromagnetic and Acoustic Methods? Proposed Horizontal Standard. Available online: https://standardsdevelopment.bsigroup.com/Home/Project/201102555 (accessed on 27 February 2016).
  9. Lundgaard, L.E. Partial discharge-Part XIV: Acoustic partial discharge detection-practical application. IEEE Electr. Insul. Mag. 1992, 8, 34–43. [Google Scholar] [CrossRef]
  10. Roman, J.P.; Souto, J.A.G.; Serano, J.R. Fiber optic sensor for acoustic detection of partial discharges in oil-paper insulated electrical systems. Sensors 2012, 12, 4793–4802. [Google Scholar] [CrossRef] [PubMed]
  11. IEC 60270. High-Voltage Test Techniques: Partial Discharge Measurements. Available online: http://www.blockadebooks.org/download/?id=1999754 (accessed on 21 December 2000).
  12. Tang, J.; Zhou, J.B.; Zhang, X.X.; Liu, F. A transformer partial discharge measurement system based on fluorescent fiber. Energies 2012, 5, 1490–1502. [Google Scholar] [CrossRef]
  13. Farenc, J.; Mangeret, R.; Boulanger, A.; Destruel, P.; Lescure, M. A fluorescent plastic optical fiber sensor for the detection of corona discharges in high voltage electrical equipment. Rev. Sci. Instrum. 1994, 65, 155–160. [Google Scholar] [CrossRef]
  14. Zengin, V.; Süzer, S.; Gökmen, A.; Rumeli, A.; Dinçer, M.S. Analysis of SF6 Discharge by Optical Spectroscopy. In Gaseous Dielectrics VI; Christophorou, L.G., Sauers, I., Eds.; Plenum Press: New York, NY, USA, 1991; pp. 595–599. [Google Scholar]
  15. Yoshida, S.; Kojima, H.; Hayakawa, N.; Endo, F.; Okubo, H. Light emission spectrum depending on propagation of partial discharge in SF6. In Proceedings of the Conference of IEEE International Symposium on Electrical Insulation, Vancouver, BC, Canada, 9–12 June 2008; pp. 365–368.
  16. Teich, T.H.; Braunlich, R. UV Radiation from Electron Avalanches in SF6 with Small Admixtures of Nitrogen; Proceedings of the Fourth International Symposium on Gaseous Dielectrics, Knoxville, TN, USA, 29 April–3 May 1984; Pergamon Press: Oxford, UK.
  17. Fujii, K.; Yamada, M.; Tanaka, A.; Kurosawa, K. Emission spectrum of partial discharge light in SF6 gas. In Proceedings of the IEEE International Symposium on Electrical Insulation, Baltimore, MD, USA, 7–10 June 1992; pp. 332–335.
  18. Stone, G.C.; van Heeswijk, R.G.; Bartnikas, R. Electroluminescence in epoxy insulation. IEEE Trans. Electr. Insul. 1992, 27, 221–232. [Google Scholar] [CrossRef]
  19. Christophorou, L.G.; Olthoff, J.K. Electron interactions with SF6. J. Phys. Chem. Ref. Data 2000, 29, 267–330. [Google Scholar] [CrossRef]
  20. Nelson, W.B. Applied Life Data Analysis, 1st ed.; Wiley-Interscience Press: New York, NY, USA, 2003. [Google Scholar]
Figure 1. Configurations of partial discharge (PD) defect models. (a) Metal needle in uniform background field; (b) Floating-potential metal electrode; (c) Metal particle with 10 μm radius fixed on insulator surface in contact with upper electrode. All the metal electrodes were made of copper (TU2) except for the stainless steel (Crl8Ni9Ti) needle electrode.
Energies 09 00152 g001
Figure 2. Configuration of synchronous measuring system used in the study.
Energies 09 00152 g002
Figure 3. Transmittances of light filters used in the measurement setup. The solid lines are the experimental results and the dotted curves are calculated equivalent responses of the three spectral detections.
Energies 09 00152 g003
Figure 4. Partial discharge (PD) currents and integral spectra corresponding to PDs triggered by the fixed protrusion under different applied voltage levels. (a) PD current under applied voltage of 35kV; (b) PD current under applied voltage of 48kV; (c) PD light spectra under different applied voltages.
Energies 09 00152 g004
Figure 5. Partial discharge (PD) currents and integral spectra corresponding to PDs triggered by the floating particle under different applied voltage levels. (a) PD current under applied voltage of 35kV; (b) PD current under applied voltage of 45kV; (c) PD light spectra under different applied voltages.
Energies 09 00152 g005
Figure 6. Partial discharge (PD) currents and integral spectra corresponding to PD triggered by a particle on the insulator surface under different applied voltage levels. (a) PD current under applied voltage of 28kV; (b) PD current under applied voltage of 45 kV; (c) PD light spectra under different applied voltages.
Energies 09 00152 g006
Figure 7. Phase-resolved partial discharge (PRPD) patterns (Φ–q, Φ–N) of partial discharge (PD) current pulses and light pulses in UV, VIS, and NIR ranges for PDs triggered by the protrusion fixed on the electrode. (a) PRPD results at applied voltage of 35 kV (1.2 PDIV); (b) PRPD results at applied voltage of 45 kV (1.5 PDIV). The gas pressure was 0.2 MPa, and the measurement duration was 2 min for each case.
Energies 09 00152 g007
Figure 8. Phase-resolved partial discharge (PRPD) patterns (Φ–q, Φ–N) of partial discharge (PD) current pulses and light pulses in the UV, VIS, and NIR ranges for PDs triggered by the floating electrode. (a) PRPD results at applied voltage of 35 kV (1.2 PDIV); (b) PRPD results at applied voltage of 45 kV (1.5 PDIV). The gas pressure was 0.2 MPa, and the measurement duration was 2 min for each case.
Energies 09 00152 g008
Figure 9. Phase-resolved partial discharge (PRPD) patterns (Φ–q, Φ–N) of partial discharge (PD) current pulses and light pulses in UV, VIS, and NIR ranges for PDs triggered by a particle on the insulator surface in contact with electrode. (a) PRPD results at applied voltage of 25 kV (1.2 PDIV); (b) PRPD results at applied voltage of 35 kV (1.5 PDIV). The gas pressure was 0.2 MPa, and the measurement duration was 2 min for each case.
Energies 09 00152 g009
Figure 10. Variations in light intensity with increasing voltage. (a) Protrusion fixed on conductor; (b) floating metal particle; (c) metal particle on insulator surface.
Energies 09 00152 g010aEnergies 09 00152 g010b
Figure 11. Partial discharge (PD) current and VIS, UV, and NIR light-pulse intensities induced by the protrusion defect in 0.15-MPa SF6 gas at an applied voltage of 1.3 PDIV. PD current was measured by means of a current transformer, and light pulses were measured by means of a photomultiplier tube.
Energies 09 00152 g011
Figure 12. Relative light intensities as function of PD charge. (a) Metal needle in uniform background field; (b) floating-potential metal electrode; (c) metal particle on insulator surface.
Energies 09 00152 g012
Table 1. Calculated results of lower (llower) and upper (lupper) response wavelength limits and correction factor (k).
ParametersUV RangeVIS RangeNIR Range
llower~lupper189 nm~354 nm381 nm~675 nm737 nm~920 nm
k2.7011.0591.038
Table 2. PD charge (q, pC), relative light intensity (l, a.u.) and pulse number (N, min−1).
DefectsProtrusionFloating PotentialSurface Defect
Parametersq/l (pC/a.u.)N/minq/l (pC/a.u.)N/minq/l (pC/a.u.)N (min−1)
1.2PDIVCurrent26.33852692.5540159.94330
UV0.5217054.614550.711743
VIS0.8223125.2221521.033470
NIR0.189032.137500.28784
1.5PDIVCurrent31.417965813.4622297.24555
UV0.7337615.1323050.933421
VIS0.8733106.1739511.794073
NIR0.2910332.6510130.782344
Table 3. Parameters of linear fitting for relationships between light pulses and current pulses of PDs.
Parameters(×2.71) UV(Pos.)(×1.07) VIS(Pos.)(×1.04) NIR(Pos.)(×2.71) UV(Neg.)(×1.07) VIS(Neg.)(×1.04) NIR(Neg.)
Protrusion fixed on conductor
Slope (A)0.015450.019340.010450.021070.036320.01243
SE of slope1.1503 × 10−41.3928 × 10−41.5638 × 10−42.4230 × 10−46.0850 × 10−47.1965 × 10⁻⁴
Intercept (B)−0.784460.37129−0.91569−0.0826−0.23616−0.77071
SE of intercept0.024370.027730.032670.014710.048210.0706
Adj. R20.928940.928120.917170.927130.844030.6619
Floating metal particle
Slope (A)0.004210.01492NA0.015260.011640.00445
SE of slope1.0281 × 10−41.8394 × 10⁻⁴NA1.3002 × 10−49.2958 × 10−41.0215 × 10−4
Intercept (B)−1.91923−7.03019NA−4.94672−2.0805−0.72326
SE of intercept0.098650.17157NA0.092820.077820.08868
Adj. R20.838070.81718NA0.946790.950390.77994
Metal particle on insulator surface
Slope (A)0.014250.01010.01060.011620.00840.00916
SE of slope0.980 × 10−41.0698 × 10−42.2567 × 10−41.3625 × 10−42.4575 × 10−44.0147 × 10⁻⁴
Intercept (B)−0.040540.15505−1.455660.028570.04161−1.45239
SE of intercept0.017240.022550.062690.022660.037060.11251
Adj. R20.953660.873940.824510.91120.753360.62311
Pos. = positive half cycle; Neg. = negative half cycle; Adj. R2 = Adjusted R2.

