1. Introduction
The demand for palm oil and palm oil products has increased following rapid economic development in China, India, and South East Asian countries. Indonesia, Malaysia, and Thailand are the largest producers of palm oil and palm kernel oil, accounting for more than 80% of the total world production [
1]. Indonesia has seen a considerable increase in palm oil production, with an annual growth of about 10% during 2002–2009 [
2]. This reflects massive expansion in palm plantations, particularly in Sumatera and Kalimantan. The total plantation area is projected to reach approximately 13 million hectares by 2020 [
3]. The export of palm oil, palm kernel oil, and oil products has become one of Indonesia’s main sources of income. Palm oil and palm kernel oil are extracted from the mesocarp fiber and palm kernel, respectively. The former is rich in unsaturated acids (palmitic, oleic, and linoleic), while the latter is rich in saturated acids (lauric and myristic) [
4].
Unfortunately, palm plantations and oil production have brought serious environmental problems including greenhouse gas emissions (GHGs), land conversion, and the production of huge amounts of agricultural waste. Basiron [
5] reported that only about 10% of the whole palm tree is used for palm oil production. The solid waste includes the stripped fruit bunches, fiber, and palm kernel shell (PKS). Fiber is often used as fuel to generate both the electricity and steam required for milling. The stripped fruit bunches are generally recycled back to the plantation as mulch to maintain the nutrient cycle and prevent soil erosion. Compared with other solid wastes, PKS has the advantage of a higher calorific value and lower moisture and ash contents [
6]. It is recovered during the extraction of the palm kernel after the palm oil has been recovered from the mesocarp fiber. As the percentage of PKS is about 5%–7% of the fresh fruit bunch (FFB), the total potential of PKS in Indonesia has been estimated at about 54.87 GJ·y
−1 [
7].
Methods of utilizing biomass for power generation through combustion can be divided into dedicated firing and co-firing. Biomass co-firing has advantages compared with dedicated biomass burning when used in existing power plants, especially coal-fired power plants. These include lower capital costs and higher combustion efficiency [
8]. The addition of biomass in a coal-fired power plant can significantly reduce GHG emissions and reduce slagging inside the combustor. Newly-built coal fired power plants in some European countries, Japan, and China are largely co-fired, with biomass accounting for 10%–20% of output on a calorie basis [
9]. Studies of biomass combustion have also progressed significantly, using both experiments and numerical analysis. Karim and Naser [
10] reviewed the combustion of biomass in packed beds, and identified emerging trends. Modeling of combustion technologies including coal and biomass co-firing has been described in detail in [
11].
In Indonesia, electricity is mainly supplied by coal. Indonesia is one of the biggest coal exporters, and domestic coal reserves are estimated to be sufficient to meet future demand for about 80 years [
12]. Most domestic coal is classified as low rank coal (LRC), with a heating value near that of biomass. LRC also has a high moisture content, a low sulfur content, high reactivity, and a low calorific value [
13,
14,
15]. Co-firing of biomass can help improve domestic energy security as well as increasing the share of renewable biomass used in power plants initially designed for coal burning. Indonesia has released a vision for renewable energy, called Vision 25/25, in which renewable energy will meet 25% of the total energy demand in 2025 [
16].
As PKS is widely available in Indonesia, the development of PKS co-firing in existing or planned coal-fired power plants has great potential. Unfortunately, almost no studies have been conducted to evaluate PKS co-firing. In this study, computational fluid dynamics (CFD) was used to analyze the thermal behavior of PKS co-fired coal-fired power plants, and the composition of the exhaust gases CO2, CO, O2, NOx, and SOx.
2. Computational Modeling of Palm Kernel Shell Co-Firing
Co-firing of biomass in a coal-fired combustor can be performed using different methods, including injection, co-milling, pre-gasification, and parallel co-firing. Injection co-firing, in which pre-milled biomass is mixed with the pulverized coal fed to the combustor, is considered to be the most feasible method, because of its relatively low capital cost and high co-firing ratio [
17]. Injection co-firing was therefore chosen for investigation in this study. It was assumed that the PKS is injected with the pulverized coal into the combustor, after being dried and ground separately.
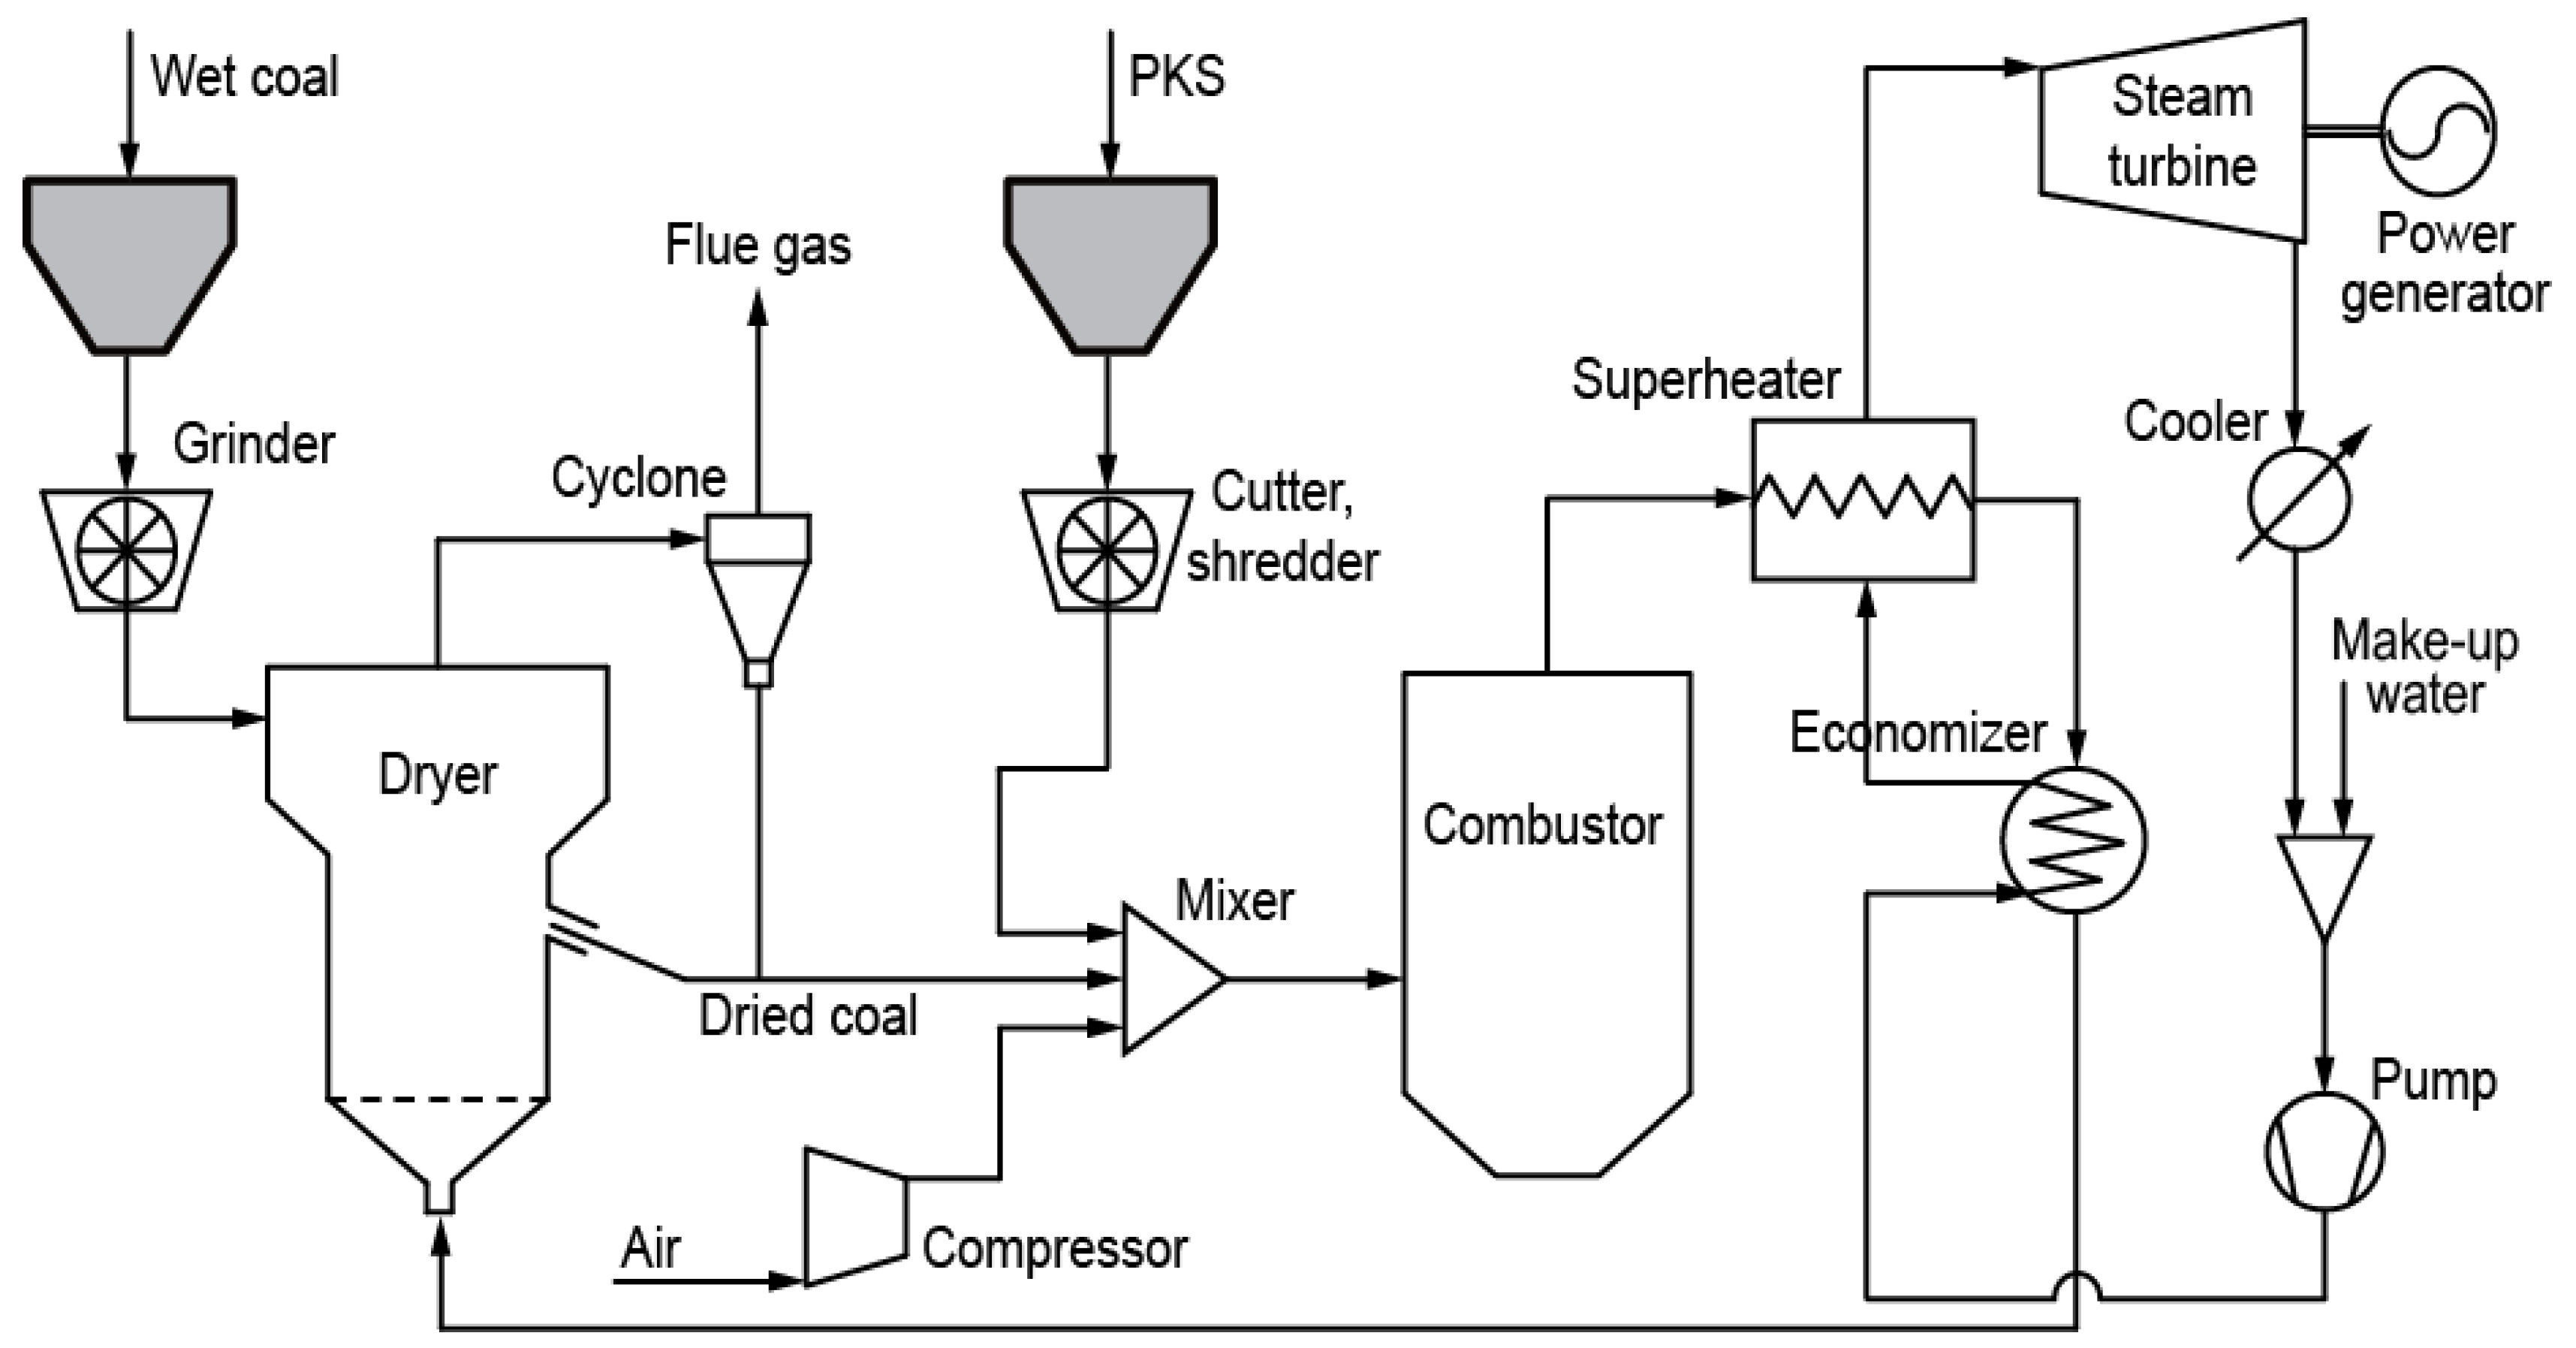
Figure 1 shows a basic schematic diagram of a PKS and coal system employing injection co-firing. It comprises three modules, one each for drying, combustion, and power generation. The raw wet coal is ground into small particles before being fed to the dryer. A fluidized bed or rotary dryer may be used, considering solid mixing, heat and mass transfer, and temperature uniformity [
18,
19]. The CO
2-rich exhaust gas from the power generation module is fed to the dryer as the drying medium. In a fluidized bed dryer, the dried coal particles rise to the top of the bed due to their lower density, resulting in overflow of the dry coal particles.
The coal and PKS are then blended and fed to the combustor using air as the feed gas. The heat from combustion is recovered by a superheater and economizer and used to generate steam for the turbine. Flue gas with a relatively low exergy rate is used to supply heat to the drying module and as the fluidizing gas in the bed.
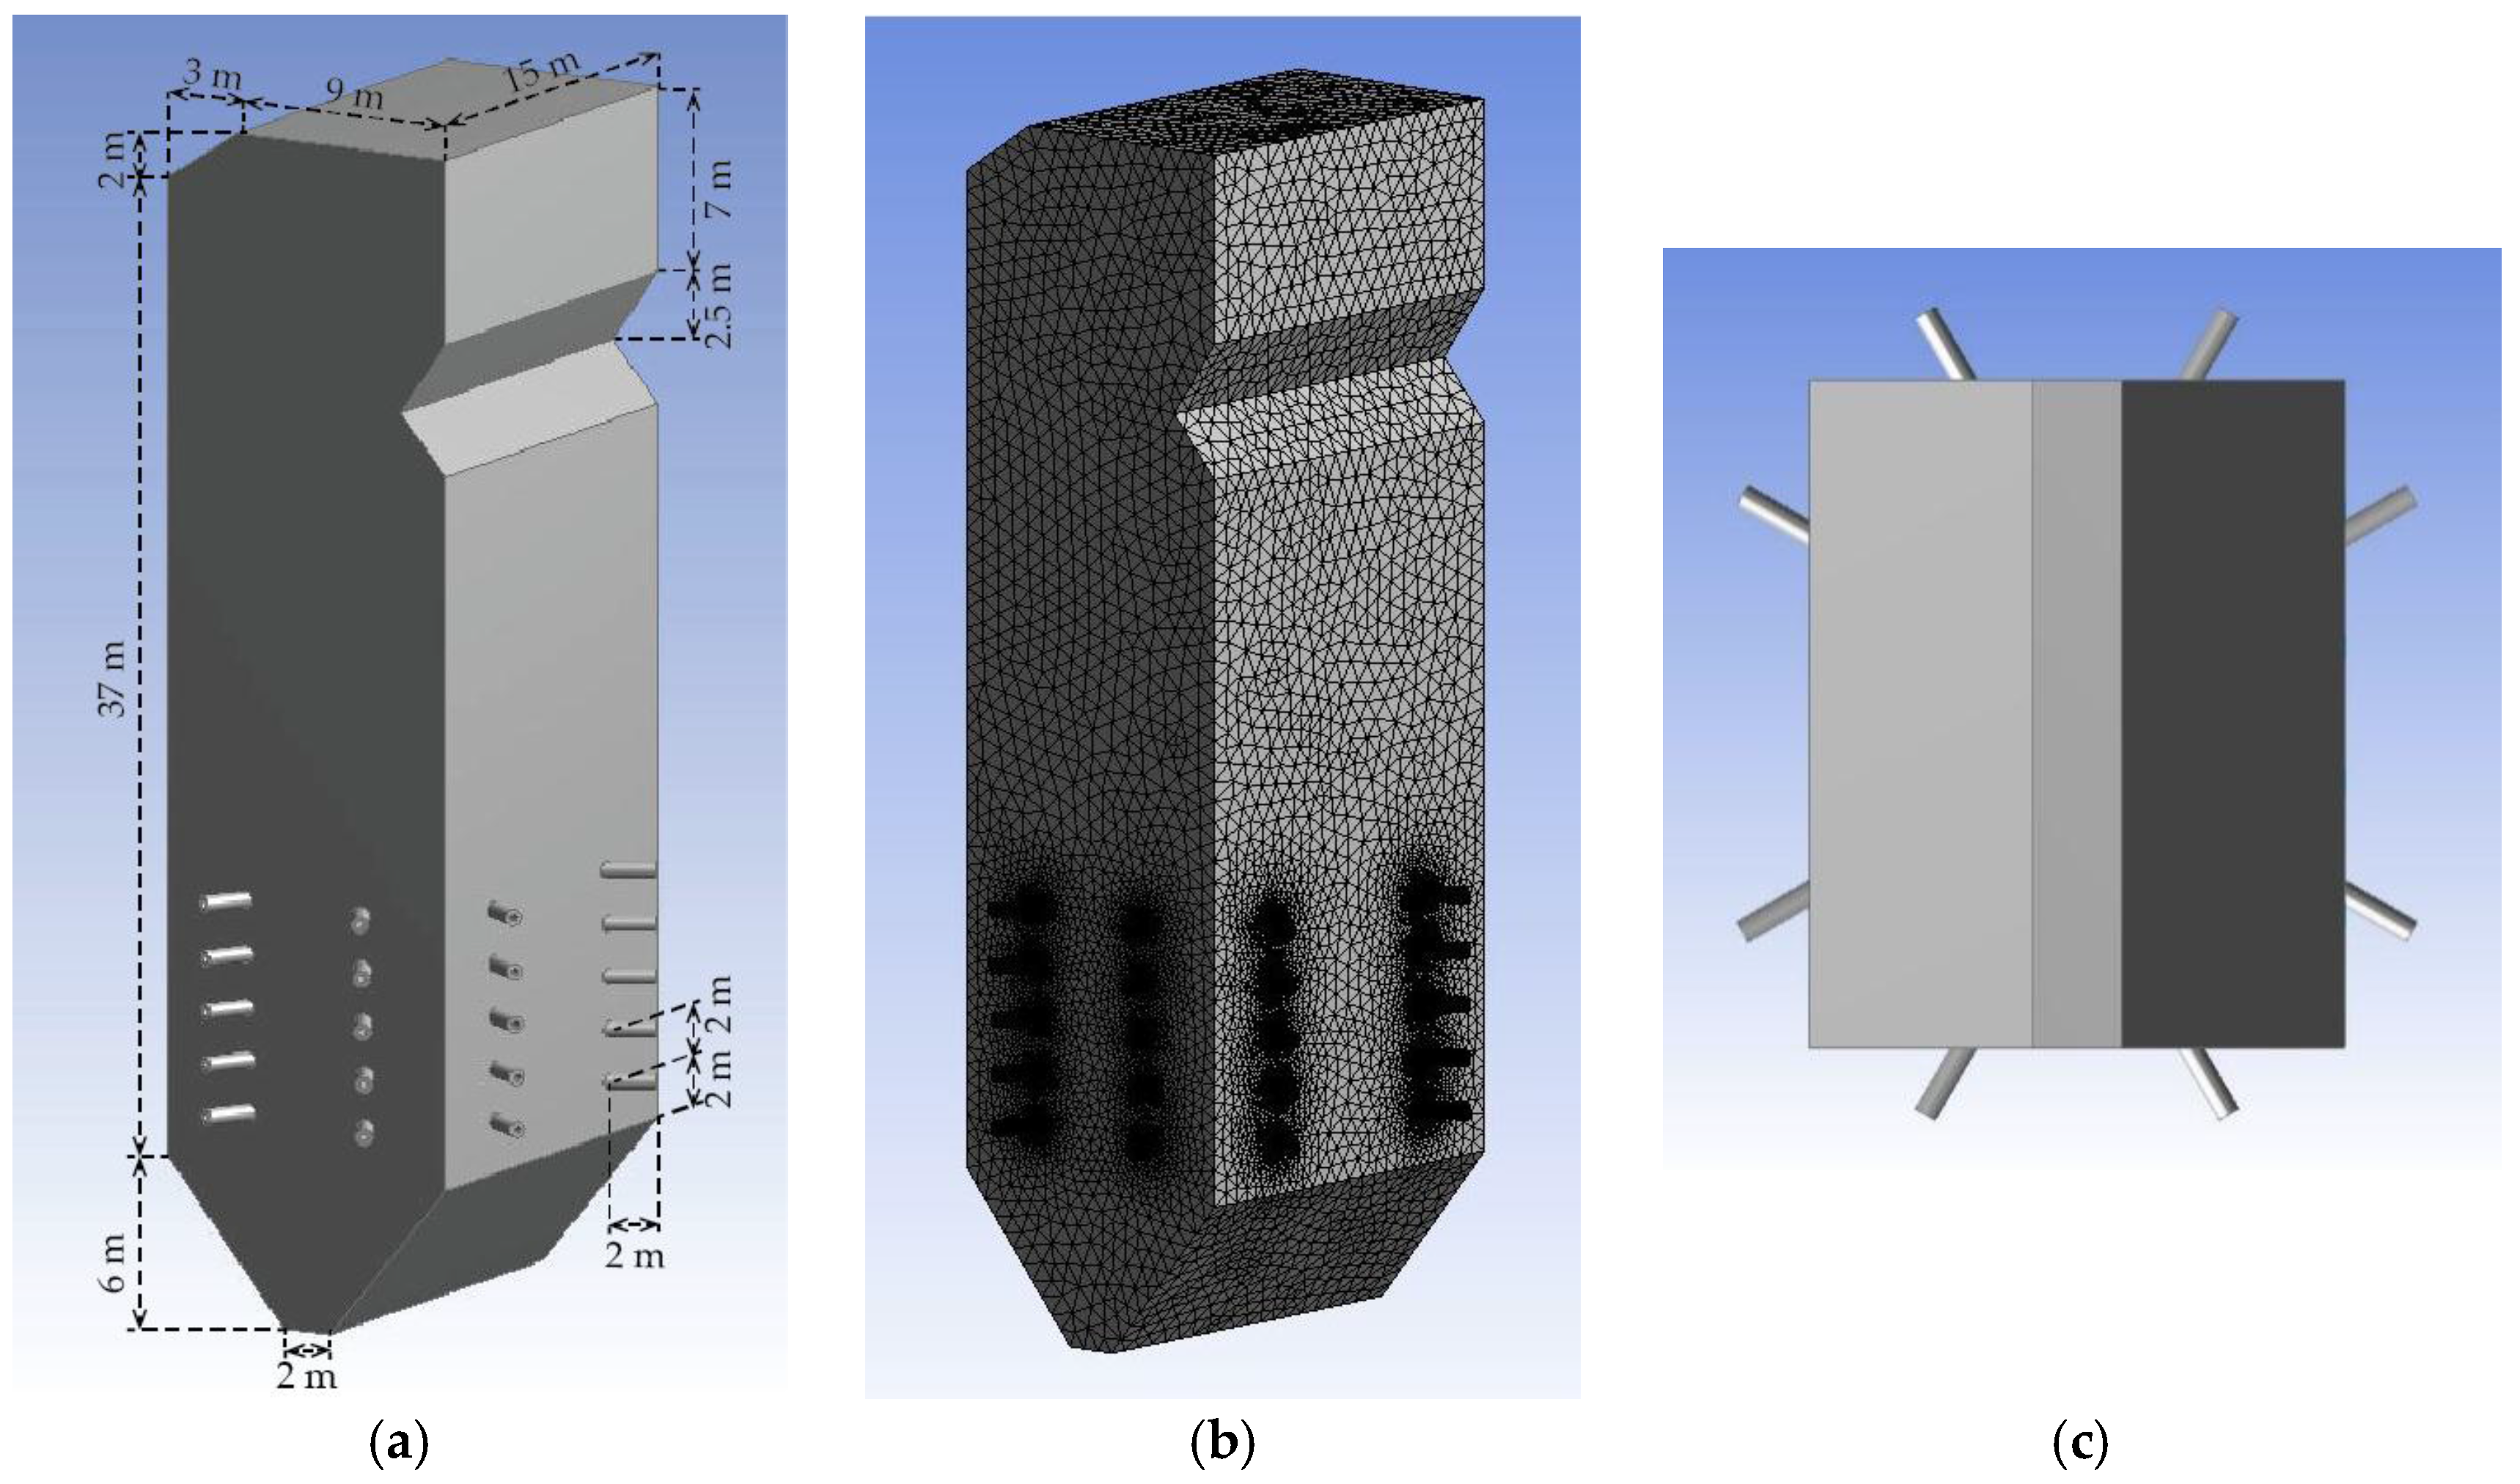
Figure 2 shows a schematic view of the combustor used in this study, including its dimensions and the layout of the meshing and feeding inlets in cross section. The feed inlet was a coaxial dual tube in which the fuel was fed through the inner tube. The combustor was based on those of existing 300 MWe coal-fired power plants. The combustor had a height, width, and breadth of 45 m, 12 m, and 15 m, respectively. Commercial CFD software was used to create the simulation. ANSYS Design Modeler was used to build the combustor model in 3D, and ANSYS Fluent version 16.2 (ANSYS Inc., Concord, MA, USA) was used to analyze the co-firing behavior. The co-firing simulation took account of governing equations (mass, momentum, and enthalpy), turbulence, radiative heat transfer, and reactions in both the particle and gas phases.
The study modeled the co-firing behavior of PKS and coal using the CFD method, as this is an effective tool for calculating fluid flows, heat and mass transfers, chemical reactions, and solid and fluid interactions [
20,
21]. CFD modeling is significantly more time and cost effective than physical investigation through experiments, and is also safe and easy to scale up. It is therefore often used as a precursor to experimental studies. When applied to co-firing, CFD analysis was expected to clarify the combustion process including the combustion temperature and the concentrations of the gases produced.
Coal and PKS particles entered the combustor through feeding inlets distributed at the lower side. Air was used as the feeding gas as well as supplying the oxygen required for combustion. There were two different flows: primary and secondary. The former acted as the feeding gas for the fuel and flowed through the inner tube, while the latter supplied the extra air required for combustion and flowed through the outer tube. Once the particles entered the combustor, continuous reactions occurred, including heating, drying, devolatilization, gas and char combustion, pollutant formation, and heat radiation [
22]. The numerical calculation continued until the convergent condition was achieved (less than 10
−4 for all residuals). The combination of velocity and pressure in the Navier-Stokes equations was calculated using the SIMPLE algorithm, which is a semi-implicit method for pressure linked equations. The Eulerian-Lagrangian approach was used to solve the gas-solid two-phase flow, and gas phase modeling was performed in the Eulerian domain by solving the steady-state Reynolds averaged Navier-Stokes (RANS) equations.
In this study, the initial coal flowrate (kg·s−1) required for combustion was stipulated as the baseline rate from which the flowrate of the PKS and coal was calculated using the designated PKS mass fraction. Five different PKS mass fractions were evaluated: 0% (100% coal), 10%, 15%, 25%, and 50%. The temperature distribution and the concentration of the gases produced during co-firing were observed.
2.1. Governing Equations
Co-firing is typically approximated and modeled as a dilute two-phase (solid and gas) flow using the Eulerian-Lagrangian approach, in which the gas phase is approximated through the Navier-Stokes model, while the solid phase is treated as a discrete phase. The trajectory of each particle was modeled by Newton’s laws of motion and particle collision is treated as a sphere model [
23]. The gas concentration and temperature of the particles were calculated using the energy and mass transfer equations. The interactions of mass, momentum and energy between the gas and solid particles were solved using the particle-in-cell (PIC) approach considering the particle state along the particle trajectories.
The mathematical calculations were essentially governed by the flow of fluid and the heat transfer. It was assumed that the fluid dynamics represented a viscous flow, so that each governing equation can be written as follows:
where, ρ,
,
U,
t,
p, τ,
f, and
e are density, rate of volumetric heat addition per unit mass, velocity, time, pressure (Reynolds averaged), stress tensor (viscous and Reynolds stresses), the component of body force per unit mass, and the internal energy per unit mass, respectively. In addition,
u,
v, and
w are the velocity in each corresponding
x,
y, and
z direction. Equation (1) represents the mass (continuity equation) in non-conservation form. Equations (2)–(4) represent the momentum (Newton’s second law) equation in non-conservation form in each component of the
x,
y, and
z directions. Equation (5) is the energy (first law of thermodynamics) equation in non-conservation form [
24,
25].
2.2. Turbulence
The flow in the combustor during co-firing was turbulent due to fluid inertia, including time-dependent and convective acceleration, and characterized by fluctuations in velocity due to the complex geometry and high flow rates. Turbulence influences both heat and mass transfer and was therefore an important factor when modeling co-firing inside the combustor. In this study the
k-ε turbulence model, which is one of the standard models used in Fluent, was adopted to solve the RANS equations used to model the co-firing. In CFD modeling, this
k-ε turbulence model is widely used to calculate the swirling combustion flows. It is a robust and easy model to implement [
19] and is used in many industrial applications [
26]. Two main equations in this model relates to turbulent kinetic energy
k and the turbulent dissipation rate ε. They can be expressed by Equations (6) and (7), respectively [
27]:
where µ
t,
Pk,
Pb, and
Ym represent turbulent viscosity, the production of the
k term, the effect of the buoyancy term, and the contribution of dilatation fluctuation to the overall dissipation rate, respectively. Both
Sk and
Sε are user-defined source terms while µ
t,
Pk, and
Pb were calculated using Equations (8)–(10):
where,
gi,
T, and
Prt are acceleration due to gravity in the
ith direction, temperature, and the turbulent Prandtl number, respectively. Here, β is the coefficient of thermal expansion that can be derived by Equation (11).
C1ɛ,
C2ɛ,
Cμ, σ
k, and σ
ε are constants used in this study, and their values were as follows:
C1ɛ = 1.44;
C2ɛ = 1.92;
Cμ = 0.09; σ
k = 1.0; σ
ɛ = 1.3.
C3e was calculated from the following equation:
where,
vb and
ub are velocity components that are parallel and perpendicular to the gravitational vector, respectively.
2.3. Radiation
Heat transfer through radiation becomes dominant when the combustion temperature is relatively high. It governs both heat transfer and heat flux, especially during heating, drying, ignition, devolatilization, and char combustion. In this work, the P-1 radiation model was adopted to solve the radiative heat transfer, based on the expansion of radiation intensity to an orthogonal series of spherical harmonics [
20]. The radiation model can be expressed as follows:
where,
G, σ,
a,
ap,
Ep,
V, and σ
p are the incident radiation, the Stefan-Boltzmann constant, the absorption coefficient, the equivalent absorption coefficient due to the presence of particulates, the equivalent emission, the volume, and the equivalent particle scattering factor, respectively. In addition, ε
pn,
Apn,
Tpn, and
fpn are emissivity, the projected area, the temperature, and a scattering factor associated with particle
n.
2.4. Particle Phase Reaction Mechanisms
The mixture of PKS and coal can be considered as a typical gas-solid flow in which chemical reactions occur. The hydrodynamics can be approximated using the Eulerian-Lagrangian model. The particles were modeled separately as two discrete phase models. Some reactions occurred in the particle phase, especially during char combustion, which was assumed to be char oxidation producing CO, which was then released to the bulk gas in the combustor. It is important to note that char from biomass is generally more reactive than char from coal, and has a higher heating rate. A global 1-step heterogeneous reaction mechanism was adopted in this study to approximate char combustion under air. The combustion reactions for the coal char and PKS char can be expressed as follows:
2.5. Gas Phase Reaction Mechanisms
During devolatilization, the volatile matter from both PKS and coal are released and then react with oxygen, inducing further combustion. The oxidation reaction of volatile matter from both PKS and coal was approximated as a global 2-step reaction mechanism in which CO is an intermediate component [
28]. PKS and coal were treated as different components, and both composition and enthalpy formation were derived from proximate and ultimate analyses of each material. The reaction mechanisms for the volatile matter in the gas phase can be expressed by the Westbrook-Dryer mechanism [
29]:
The kinetic reaction rate coefficient can be expressed as Equation (24), which is based on the Arrhenius equation for activation energy
Ei.
Table 1 shows the kinetic parameters used in the study for each corresponding reaction in both the particle and gas phases [
22,
30,
31]. The coal was assumed to be lignite.
3. Calculation Conditions
The composition of the coal and PKS particles assumed in this study is shown in
Table 2. The coal was sourced from Kalimantan, Indonesia, which is classified as LRC and has relatively high moisture content. The PKS was sourced from palm mills located in Sumatera, Indonesia. The as-received and as-used coal compositions represent the condition at the drying inlet when received from the mine, and at the combustion inlet after being dried. Initial drying was performed to reduce the moisture content of the coal from 48.76 wt % to 17.30 wt %. The PKS is as-used PKS because it was received from the palm mill and used for co-firing without any initial pre-treatment except crushing.
The simulated coal-fired power station had a power generation capacity of 300 MWe with a basic combustion efficiency of 30%. The flow rates of coal and air under ambient condition were 73 kg·s−1 and 630 kg·s−1, respectively. Each particle was assumed to be a solid sphere, with sizes in the range 60–200 mesh (74–250 μm). The bulk densities of the coal and PKS were assumed to be 700 kg·m−3 and 600 kg·m−3, respectively. The ambient temperature, combustor wall thickness, and external and internal emissivity coefficients were set at 300 K, 0.2 m, 0.9, and 0.6, respectively. The air was assumed to contain 79 mol % N2 and 21 mol % O2.
The total mesh of the 3D model used to represent the combustor was an approximately 1,805,305 tetrahedral cell unstructured grid. In the CFD modeling, the temperature distribution and concentration of the exhaust gases (CO2, CO, O2, NOx, and SOx) were observed, and their cross-sectional profiles were plotted on an xy plane at intervals of 6 m in height (the z axis), with the lowermost plot located 12 m above the base of the combustor. Six plot profiles were drawn, representing the distribution of each observed profile. Modeling was performed on a work station with a Quad-core Intel Core i7 2.9 GHz CPU and 16 GB of random-access memory (RAM).
4. Results and Discussion
4.1. Temperature Distribution
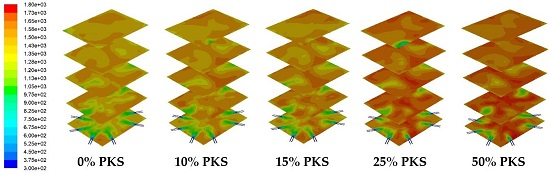
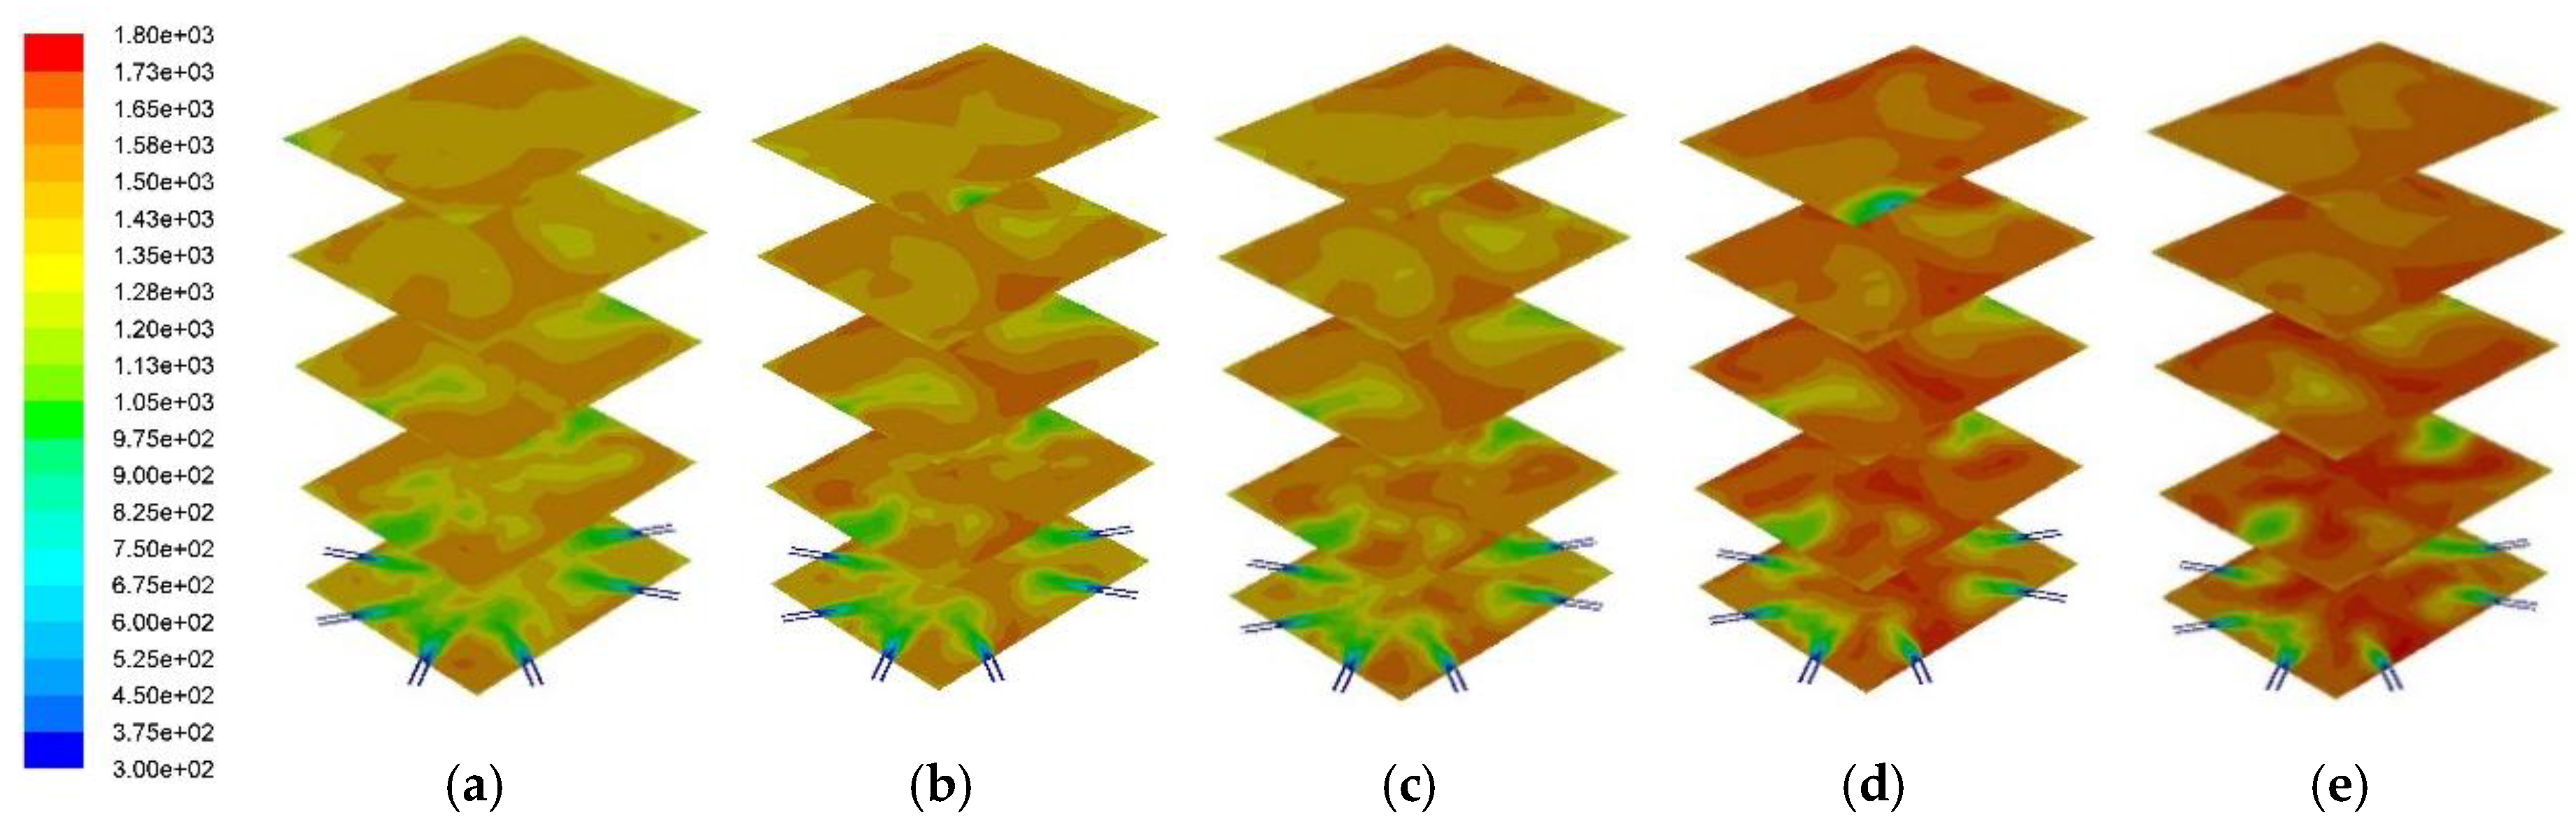
Figure 3 shows the temperature profile across the combustor for each corresponding PKS mass fraction. In general, higher PKS mass fractions produced higher flame temperatures inside the combustor as well as in the exhaust gases flowing to the superheater for energy recovery. The flame temperature became more uniform as the height in the combustor increased.
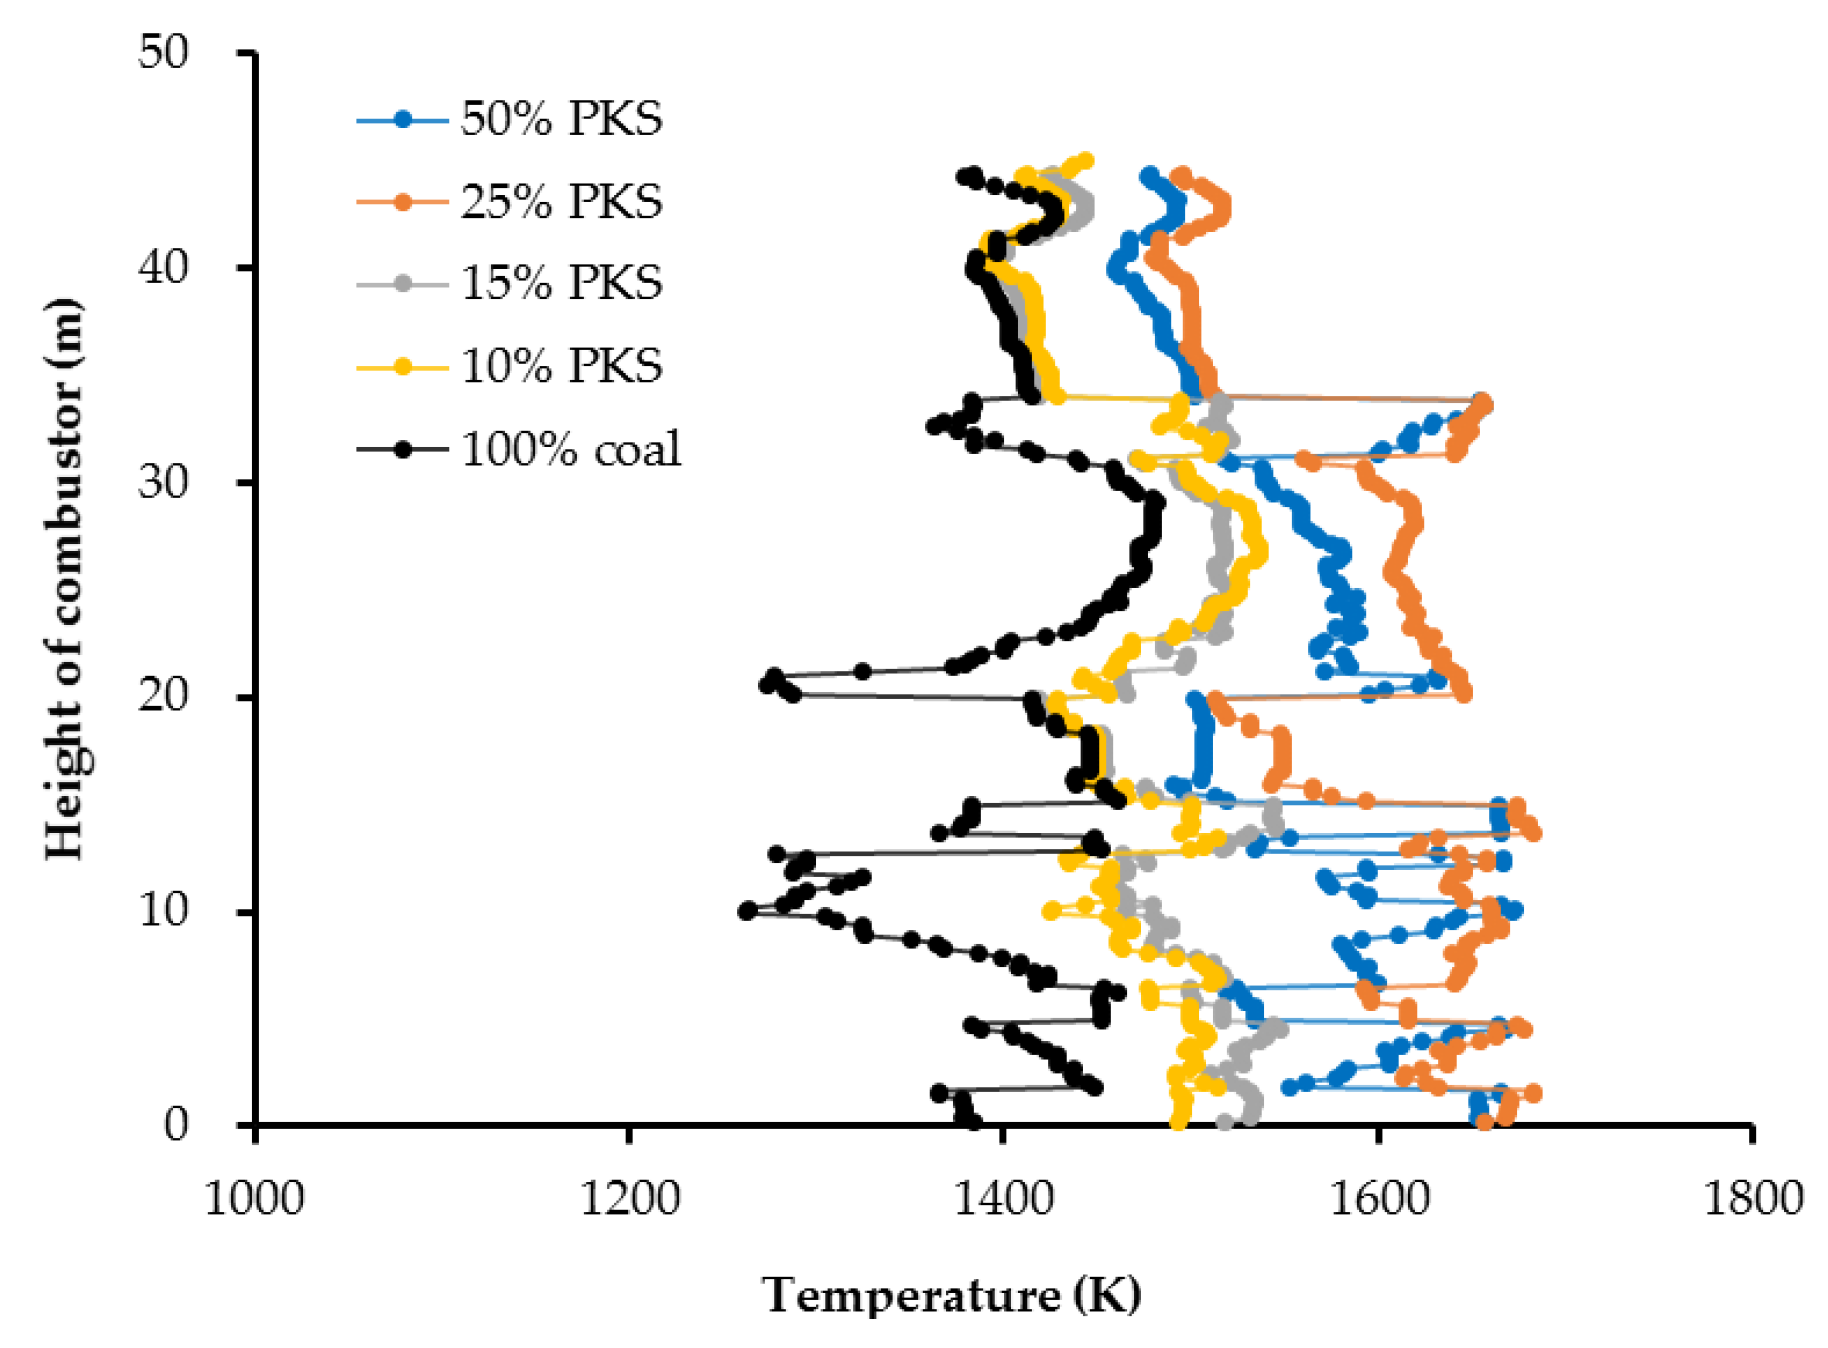
Figure 4 shows the temperature distribution at the center of the combustor for each different PKS mass fraction. A higher PKS mass fraction resulted in a higher total volatile matter content during co-firing. The average temperature in the upper part of combustor, especially the freeboard, was lower than that of the lower part. This was probably a result of heat loss across the combustor.
As can be observed from
Table 2, the PKS was higher in volatile matter but had a lower moisture content than the coal. As the coal used was LRC, it also had a relatively low calorific value. The lower moisture content of the PKS meant that devolatilization of the PKS particles was faster and earlier than devolatilization of the coal particles. The coal particles required a longer drying time before being devolatilized. As a result, at high PKS mass fractions, the combustion temperature was higher and more uniformly distributed in the lower part of the combustor where the feeding inlets were located. The lower moisture content of the PKS also meant that increasing the PKS mass fraction reduced the total moisture content of the mixed fuel. This affected the combustion temperature, as water has a relatively high heat capacity.
Co-firing with a PKS mass fraction of 25% produced a higher combustion temperature than a mass fraction of 50%, although the difference was insignificant. The highest center of combustor temperature was 1,683 K, recorded with a 25% PKS, and followed by 50% PKS (1675 K), 15% PKS (1548 K), 10% PKS (1536 K), and 0% PKS (1481 K). The average temperature at the combustor outlet for PKS mass fractions of 0%, 10%, 15%, 25%, and 50% were 1390 K, 1414 K, 1422 K, 1513 K, and 1494 K, respectively. In contrast to the moisture content, a higher PKS mass fraction reduced the total amount of fixed carbon (including char) in the mixed fuel, and the heat obtained from char combustion fell as the PKS mass fraction increased. The temperature distribution profile suggested that the optimum combustion performance of coal and PKS co-firing is achieved at a PKS mass fraction of 25%.
Large random temperature changes occurred at heights of less than 20 m, probably due to factors including the particle dynamics and random stages of combustion. The former is related both to the distribution of the feeding inlets, which ranged in height from 8 m to 16 m, and to the different physical properties of the coal and PKS particles. The latter is correlated with the different stages of combustion for different fuel particles. According to Williams
et al. [
32], combustion of coal and other solid fuels (including biomass) occurs in four stages: drying, devolatilization, char combustion, and ash formation. These stages of combustion are different for different fuels. This can be observed not only in the temperature distribution, but in other distributions discussed below.
4.2. Distribution of CO2, CO, and O2
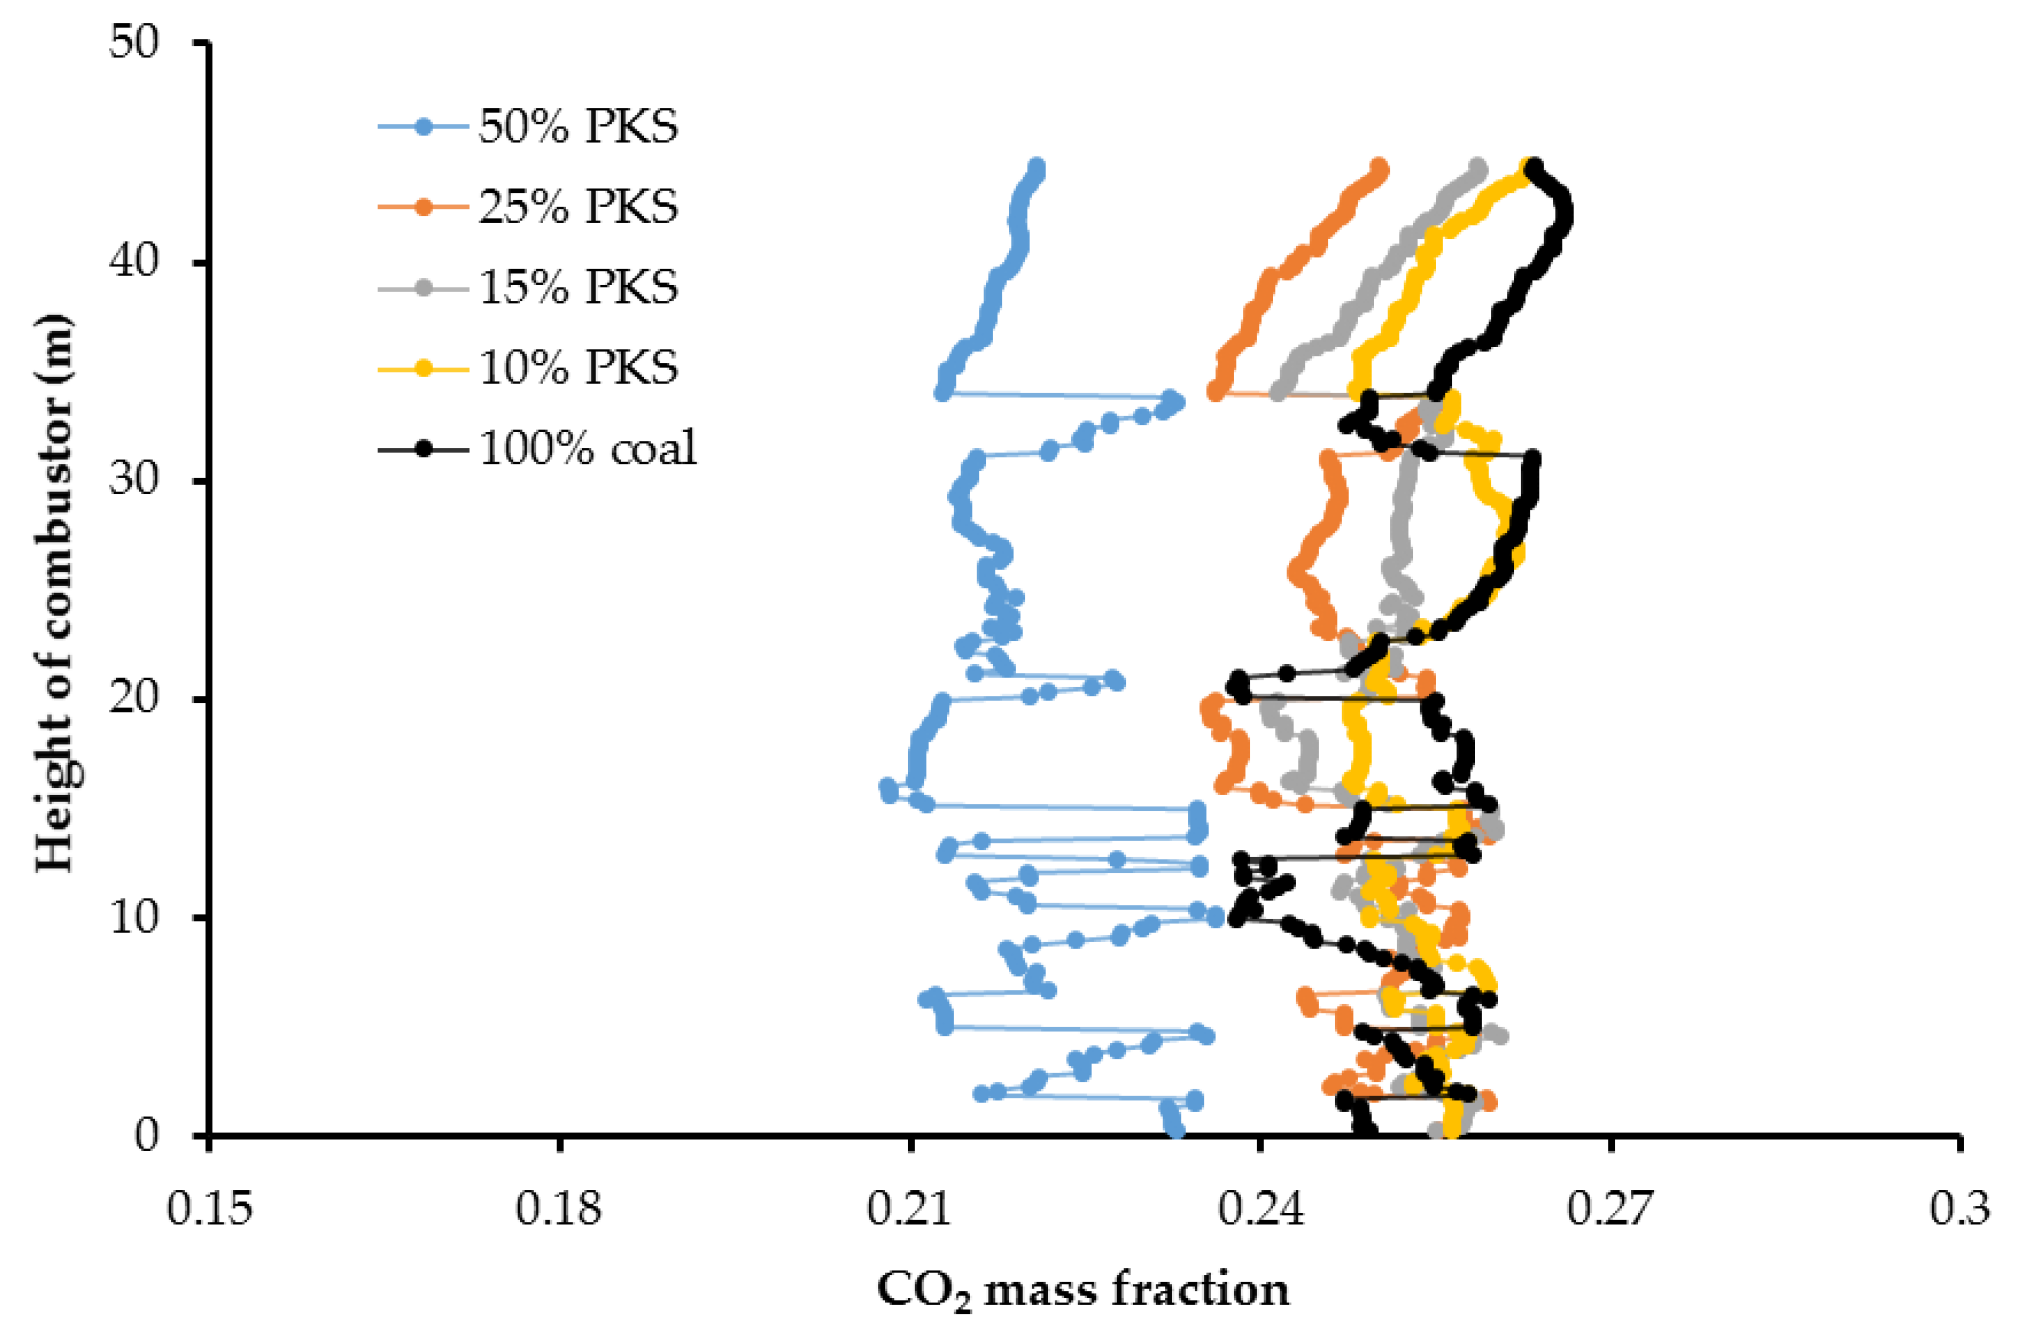
Figure 5 and
Figure 6 represent the cross-sectional CO
2 distribution profile and CO
2 distribution at the center of the combustor. A higher PKS mass fraction resulted in a lower CO
2 concentration in the exhaust gas. Numerically, the average CO
2 mass fraction in the exhaust gas at the combustor outlet for PKS mass fractions of 0%, 10%, 15%, 25%, and 50% were 0.262, 0.256, 0.253, 0.246, and 0.220, respectively. In the reactions shown in (19–23), the carbon is mainly converted to CO
2. As coal has a higher carbon content than PKS, the total amount of carbon decreased as the PKS mass fraction increased.
CO
2 also has a lower specific volume (higher density) than gases such as N
2 and O
2, leading to a higher volumetric heat capacity and a swirling tendency in the flame [
33]. A higher mass fraction of CO
2 was found in the lower part of combustor. As a result, a higher PKS mass fraction produced less turbulence, and slightly increased the gas velocity in the combustor. The average gas velocities at PKS mass fractions of 0%, 10%, 15%, 25%, and 50% were 22.9 m·s
−1, 23.1 m·s
−1, 23.5 m·s
−1, 24.2 m·s
−1, and 25.1 m·s
−1, respectively.
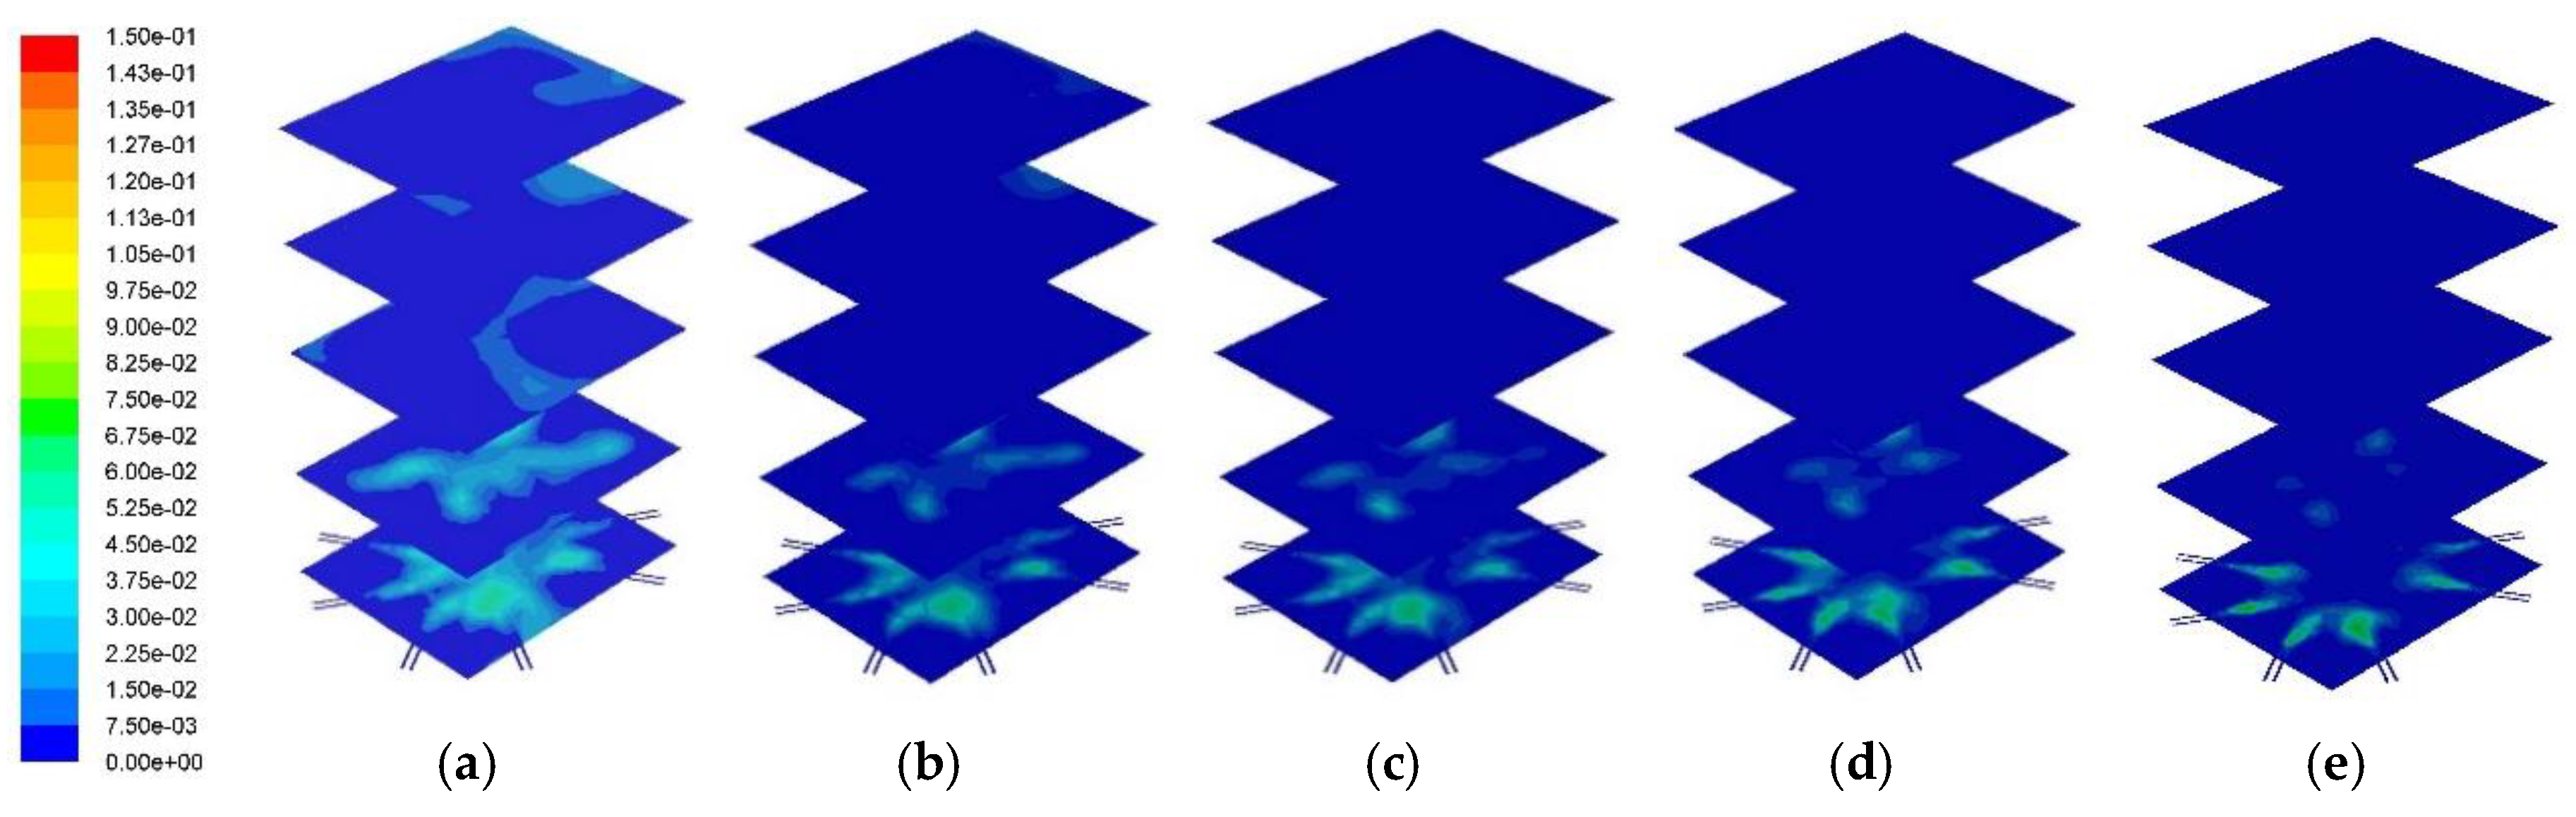
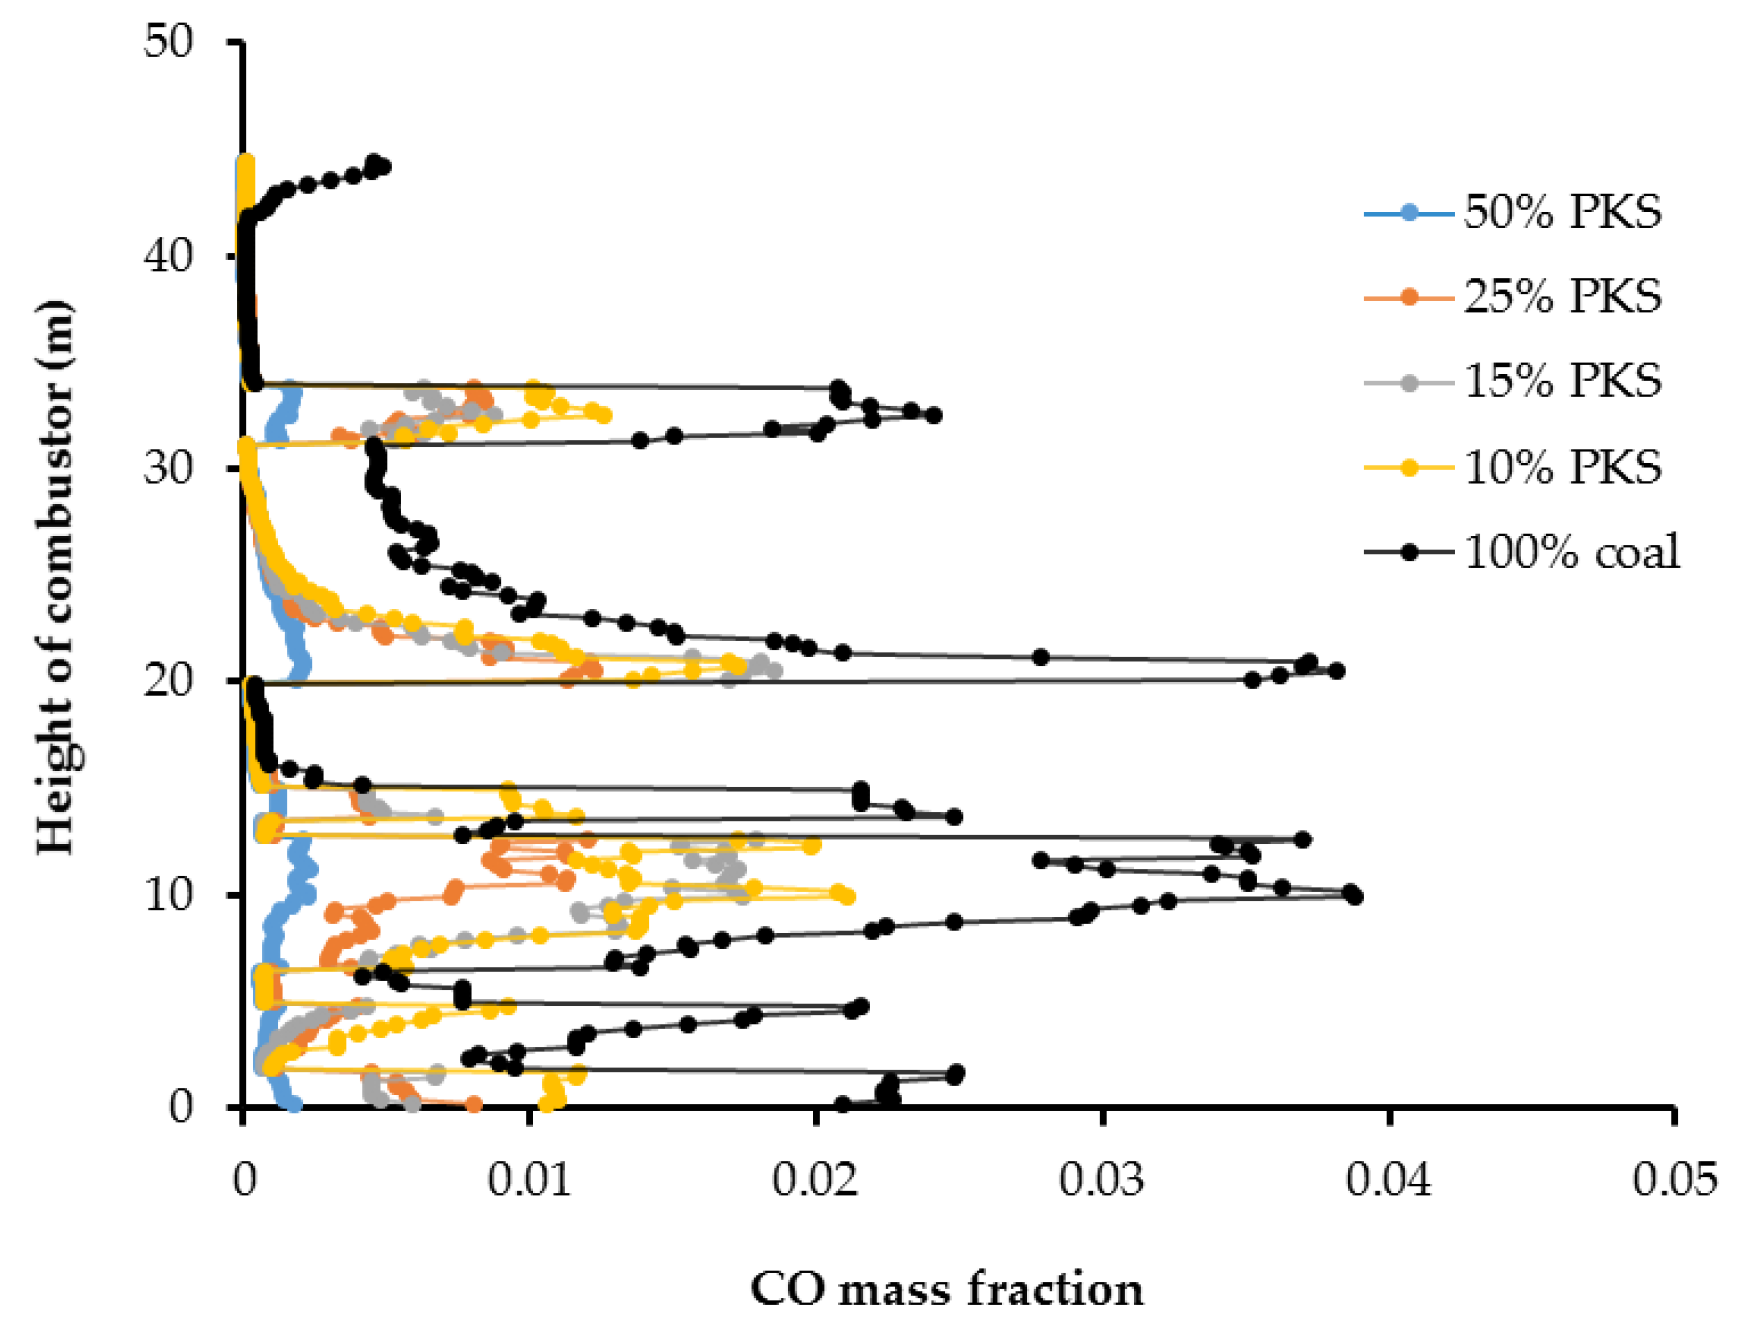
Figure 7 and
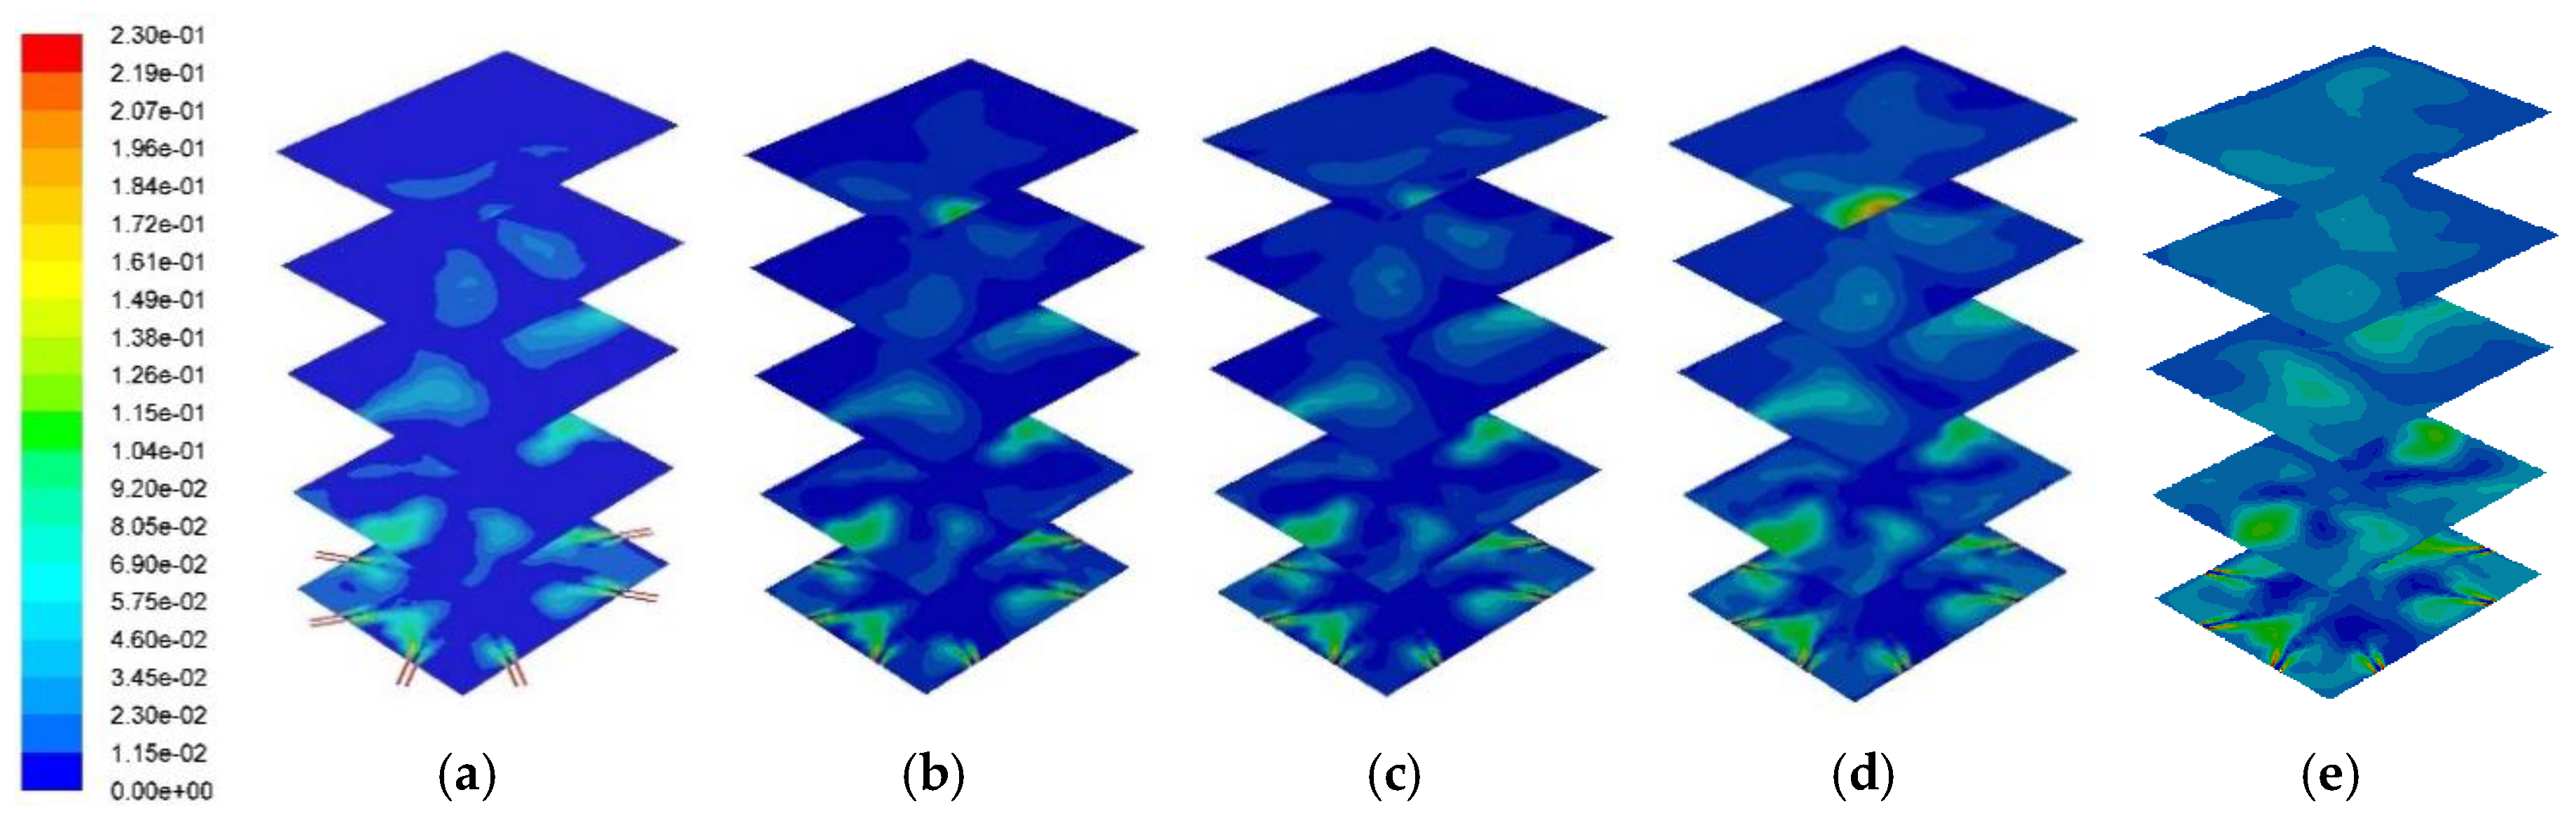
Figure 8 show the cross-sectional CO distribution profile and its distribution at the center of combustor, respectively. As the PKS mass fraction increased, the mass fraction of CO decreased. The average CO mass fractions at the combustor outlet for PKS mass fractions of 0%, 10%, 15%, 25%, and 50% were 0.0041, 0.0017, 0.0014, 0.0008, and 0.0002, respectively. When co-firing with PKS, almost no CO remained in the upper part of the combustor, suggesting that all the CO produced during devolatilization was burned during combustion. Coal has a higher carbon content than PKS and produces a higher mass fraction of CO during devolatilization. In coal firing without PKS, this CO remains in the flue gas, although at very small concentrations. This causes environmental problems. Co-firing with PKS therefore has the additional advantage of eliminating the CO from the exhaust gas.
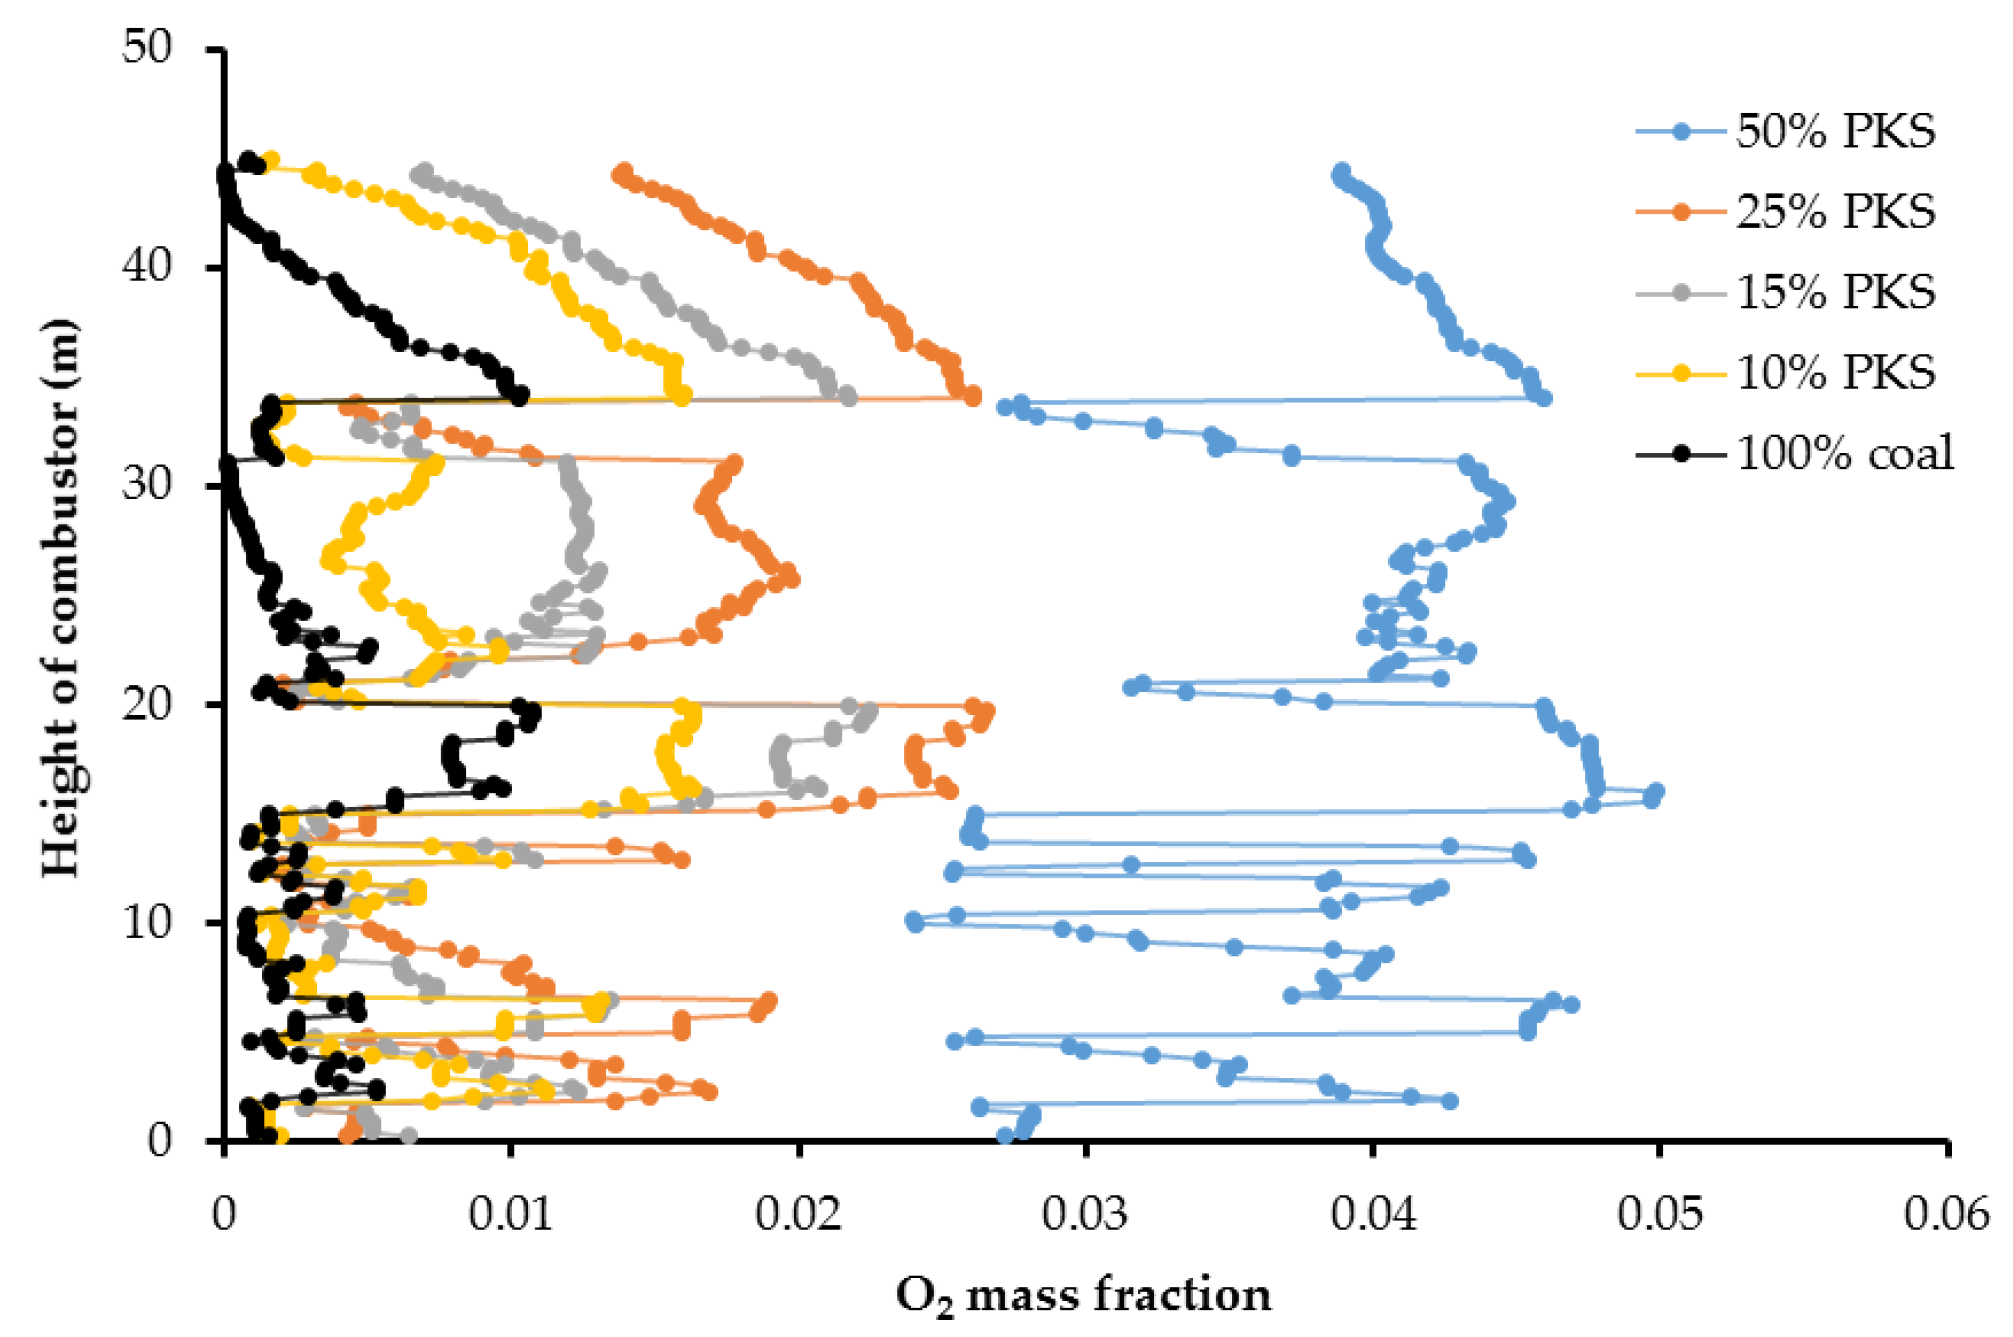
Figure 9 and
Figure 10 show the cross-sectional oxygen distribution profile and the oxygen distribution at the center of the combustor at different PKS mass fractions. A higher PKS mass fraction led to a higher oxygen concentration. This is because PKS has a relatively high oxygen content, part of which persists and is exhausted together with the nitrogen and other flue gases. The averaged mass fraction of O
2 at the combustor outlet for PKS mass fractions of 0%, 10%, 15%, 25%, and 50% were 0.0017, 0.008, 0.011, 0.017, and 0.039, respectively.
4.3. Distribution of NOx and SOx
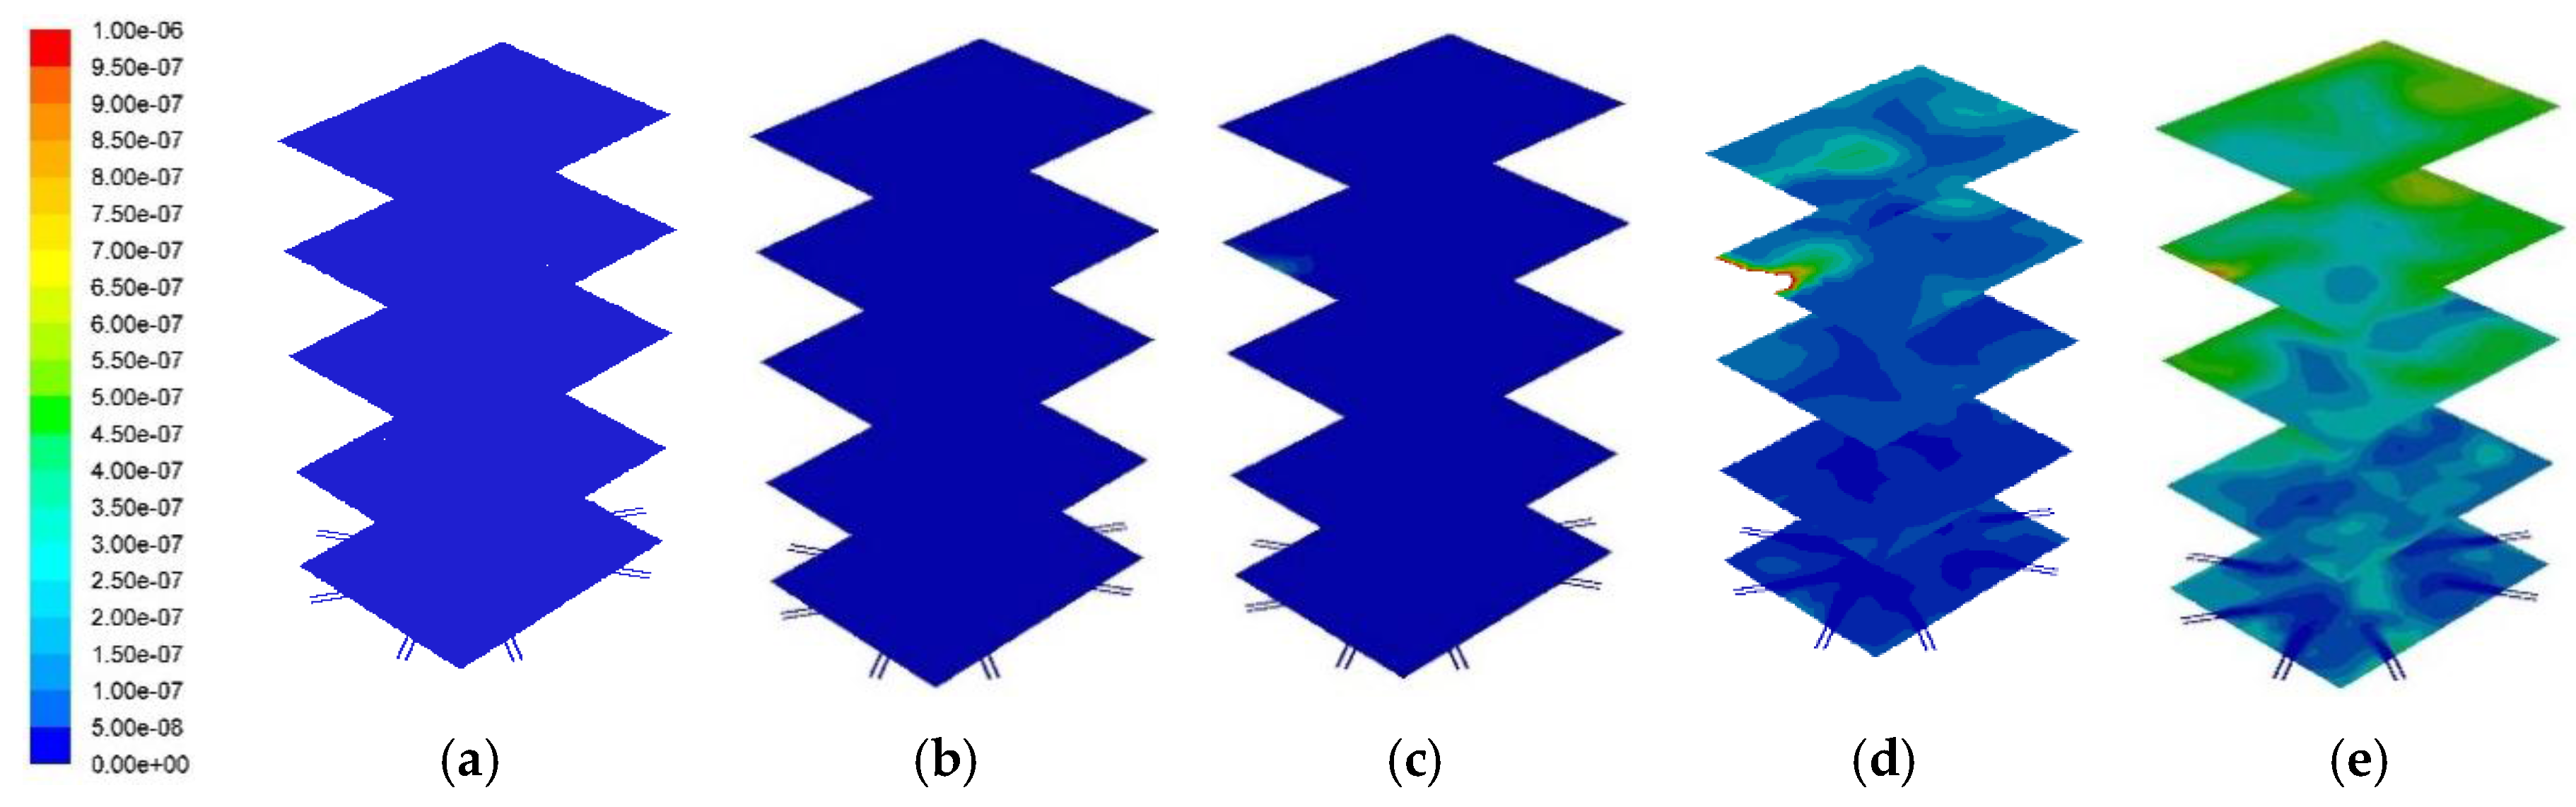
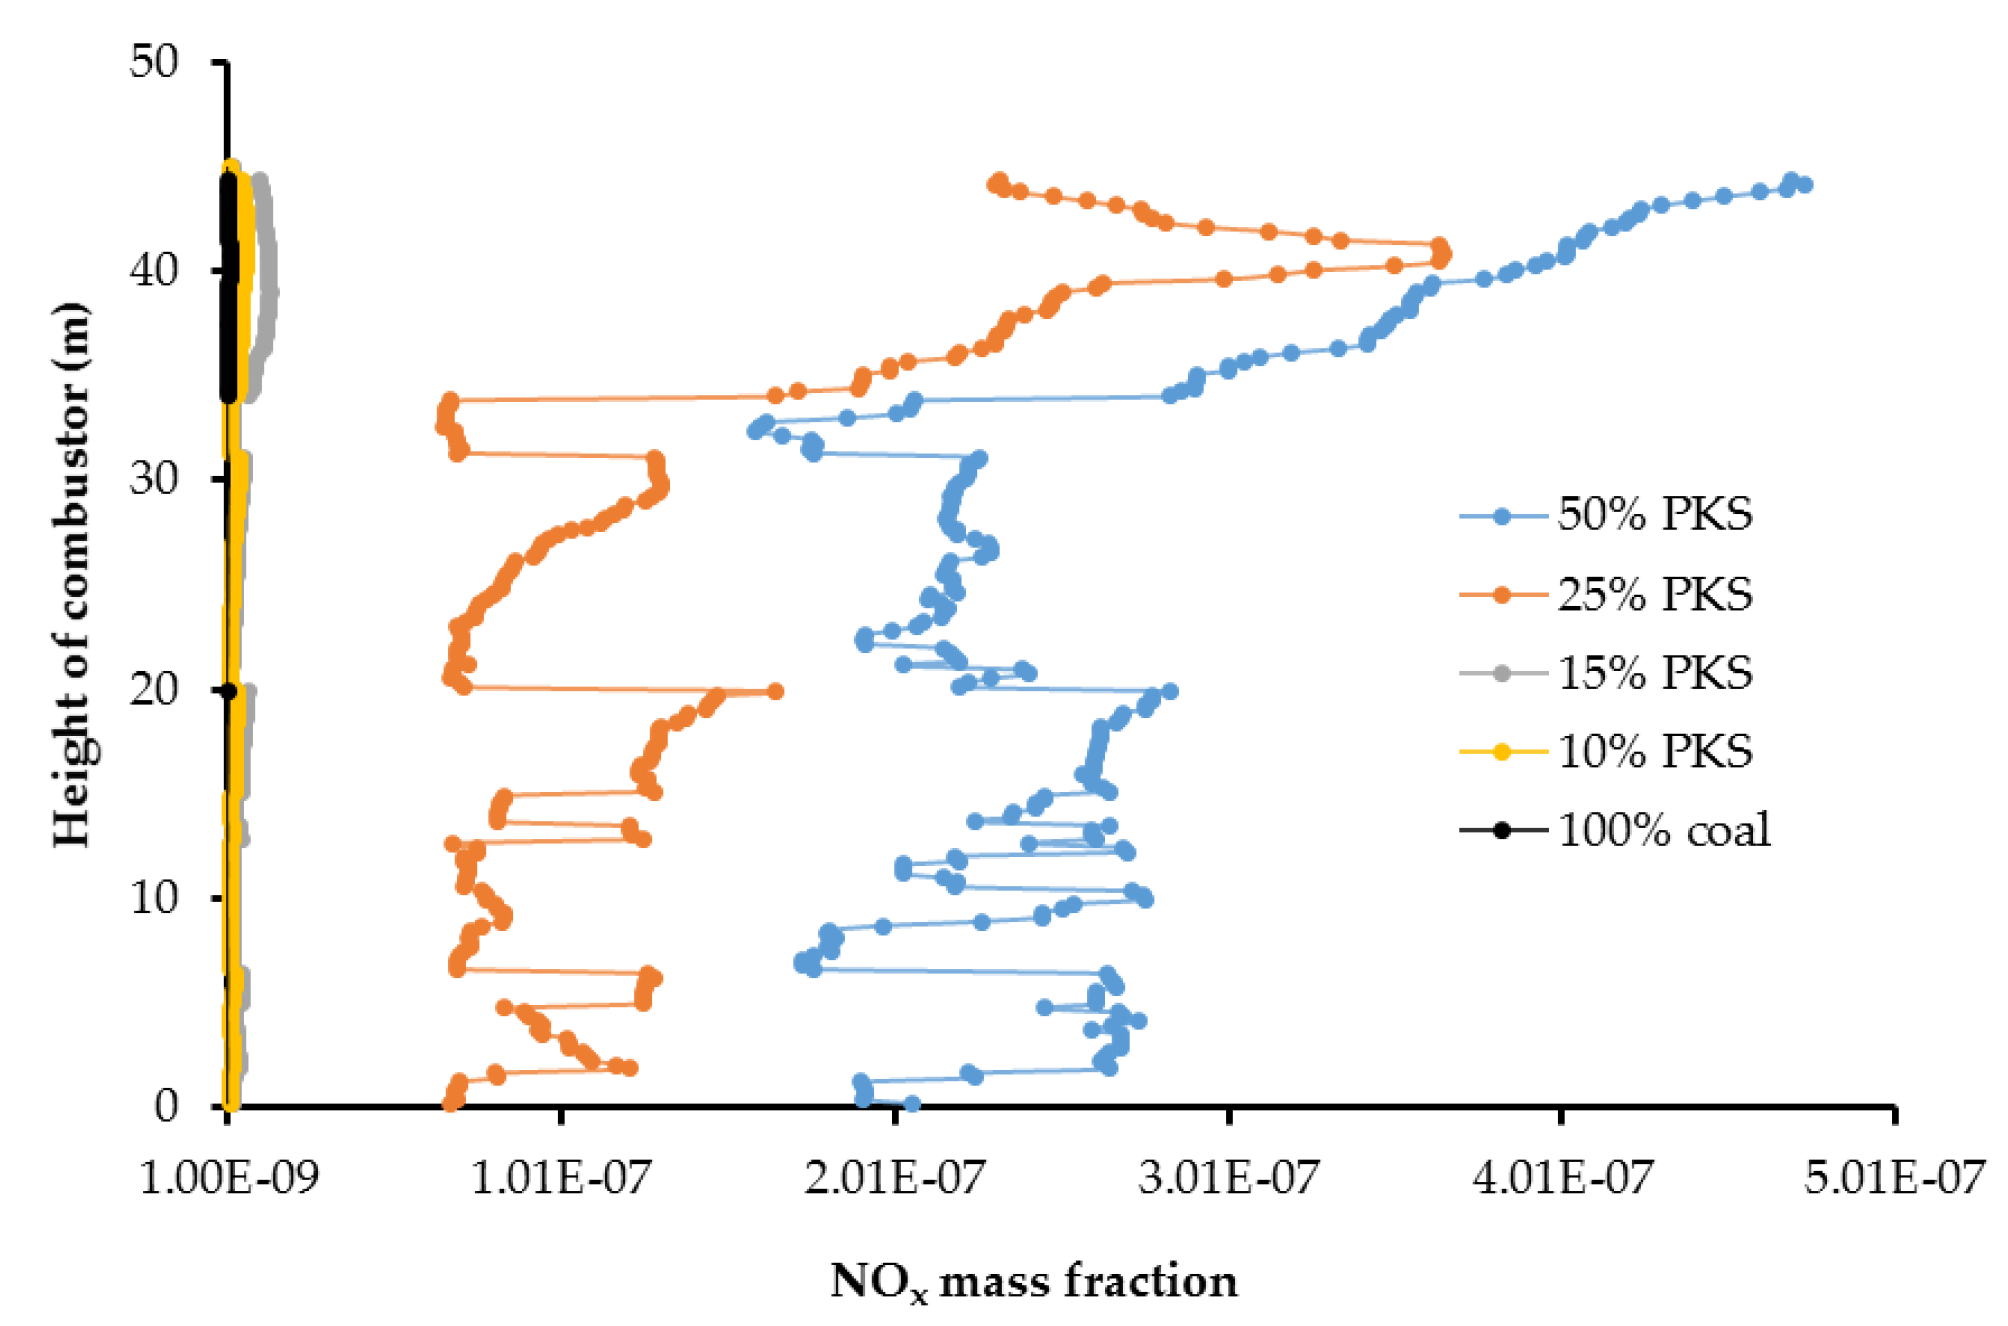
Figure 11 and
Figure 12 represent the cross sectional NO
x distribution profile and its distribution at the center of the combustor. A higher PKS mass fraction produced a higher NO
x concentration. Numerically, the average NO
x mass fractions at the combustor outlet for PKS mass fractions of 0%, 10%, 15%, 25%, and 50% were 1.2 × 10
−9, 5.5 × 10
−9, 1.2 × 10
−8, 2.7 × 10
−7, and 3.9 × 10
−7, respectively. Although the PKS contained less nitrogen than coal (
Table 1), NO
x production increased in line with the PKS mass fraction, and was most pronounced at PKS mass fractions of 25% and 50%. It is known that there are three different primary sources of NO
x from combustion: thermal, fuel, and prompt NO
x. In this study, thermal NO
x was considered to account for most of the exhausted NO
x, and this was related to the PKS mass fraction.
The NO
x concentration increased significantly as the PKS mass fraction increased to 25%. According to the Zeldovich mechanism [
34], thermal NO
x is generated at temperatures above 1600 K. The maximum combustion temperature at PKS mass fractions of 25% and 50% exceeded this value. This suggested that a lower PKS, of up to 15%, is the appropriate co-firing condition for limiting NO
x emissions.
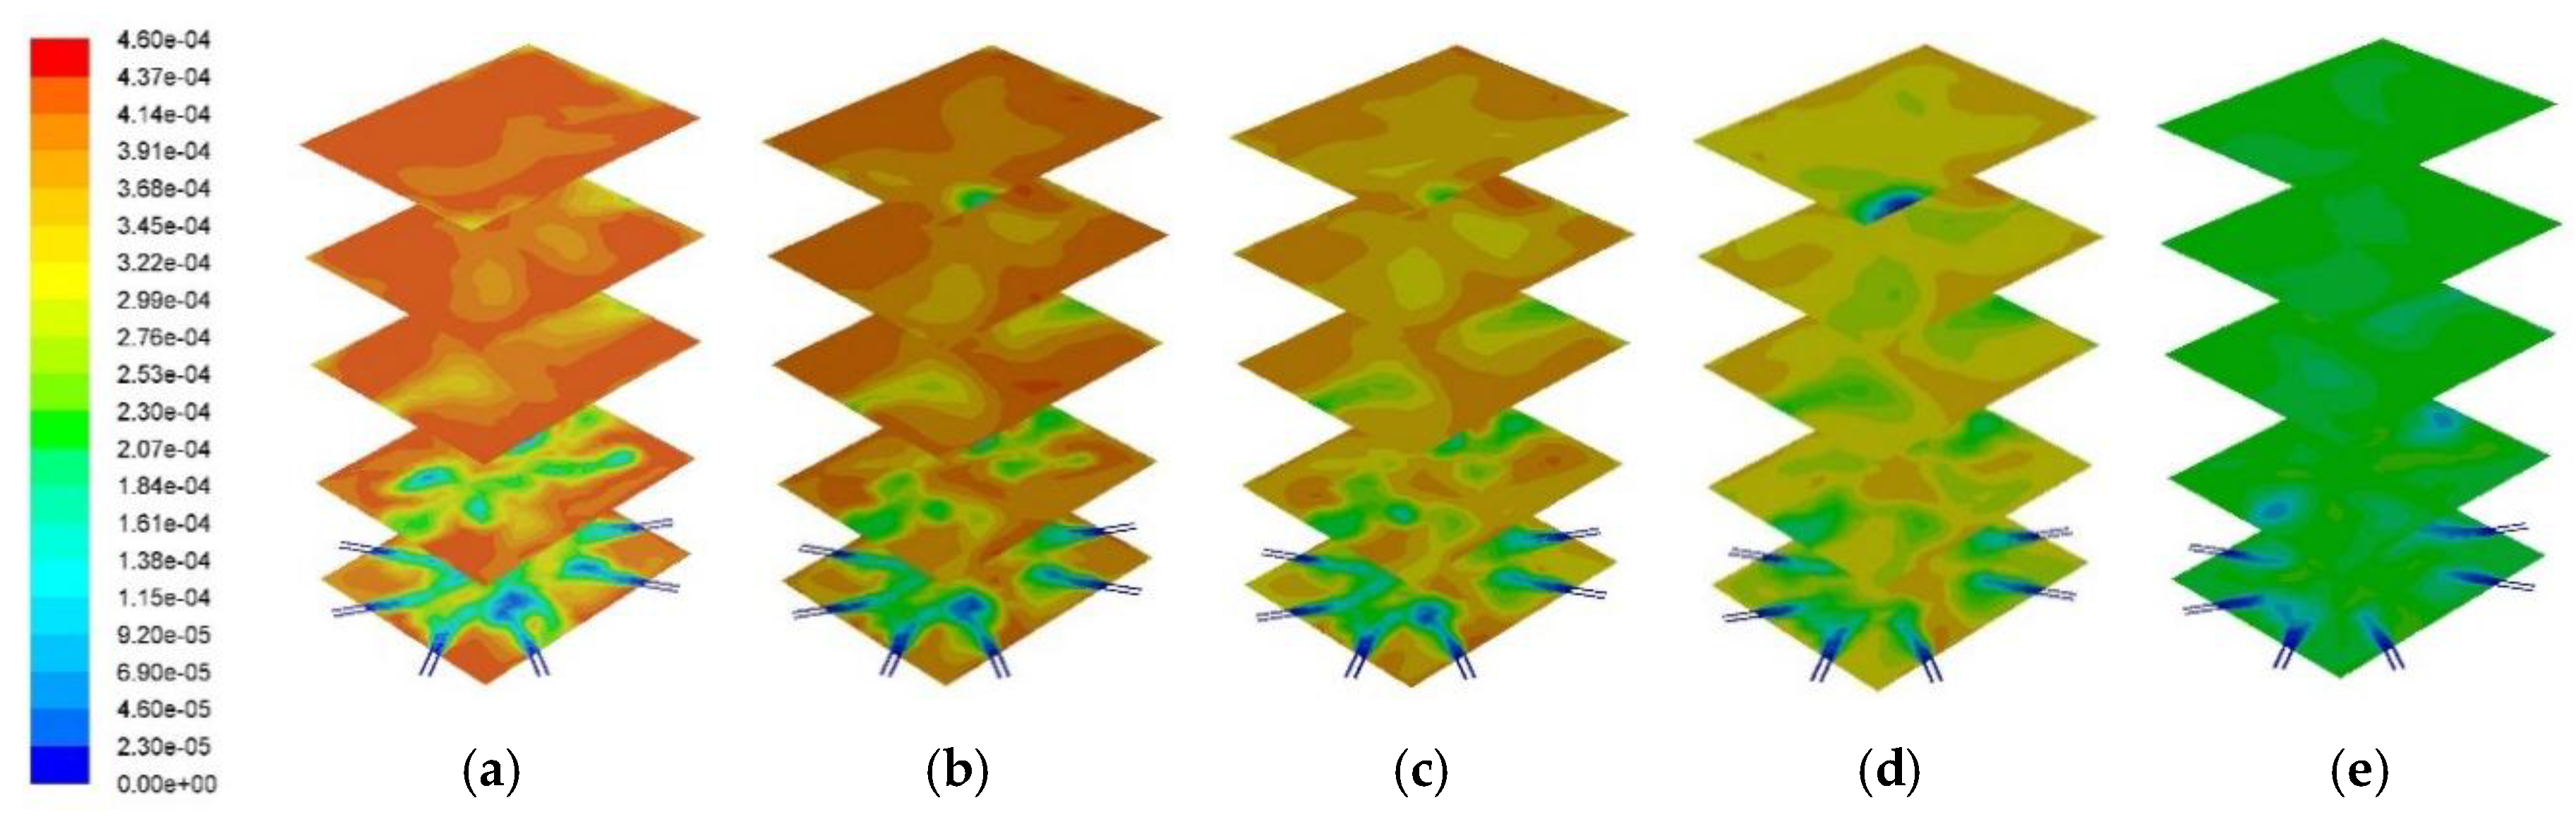
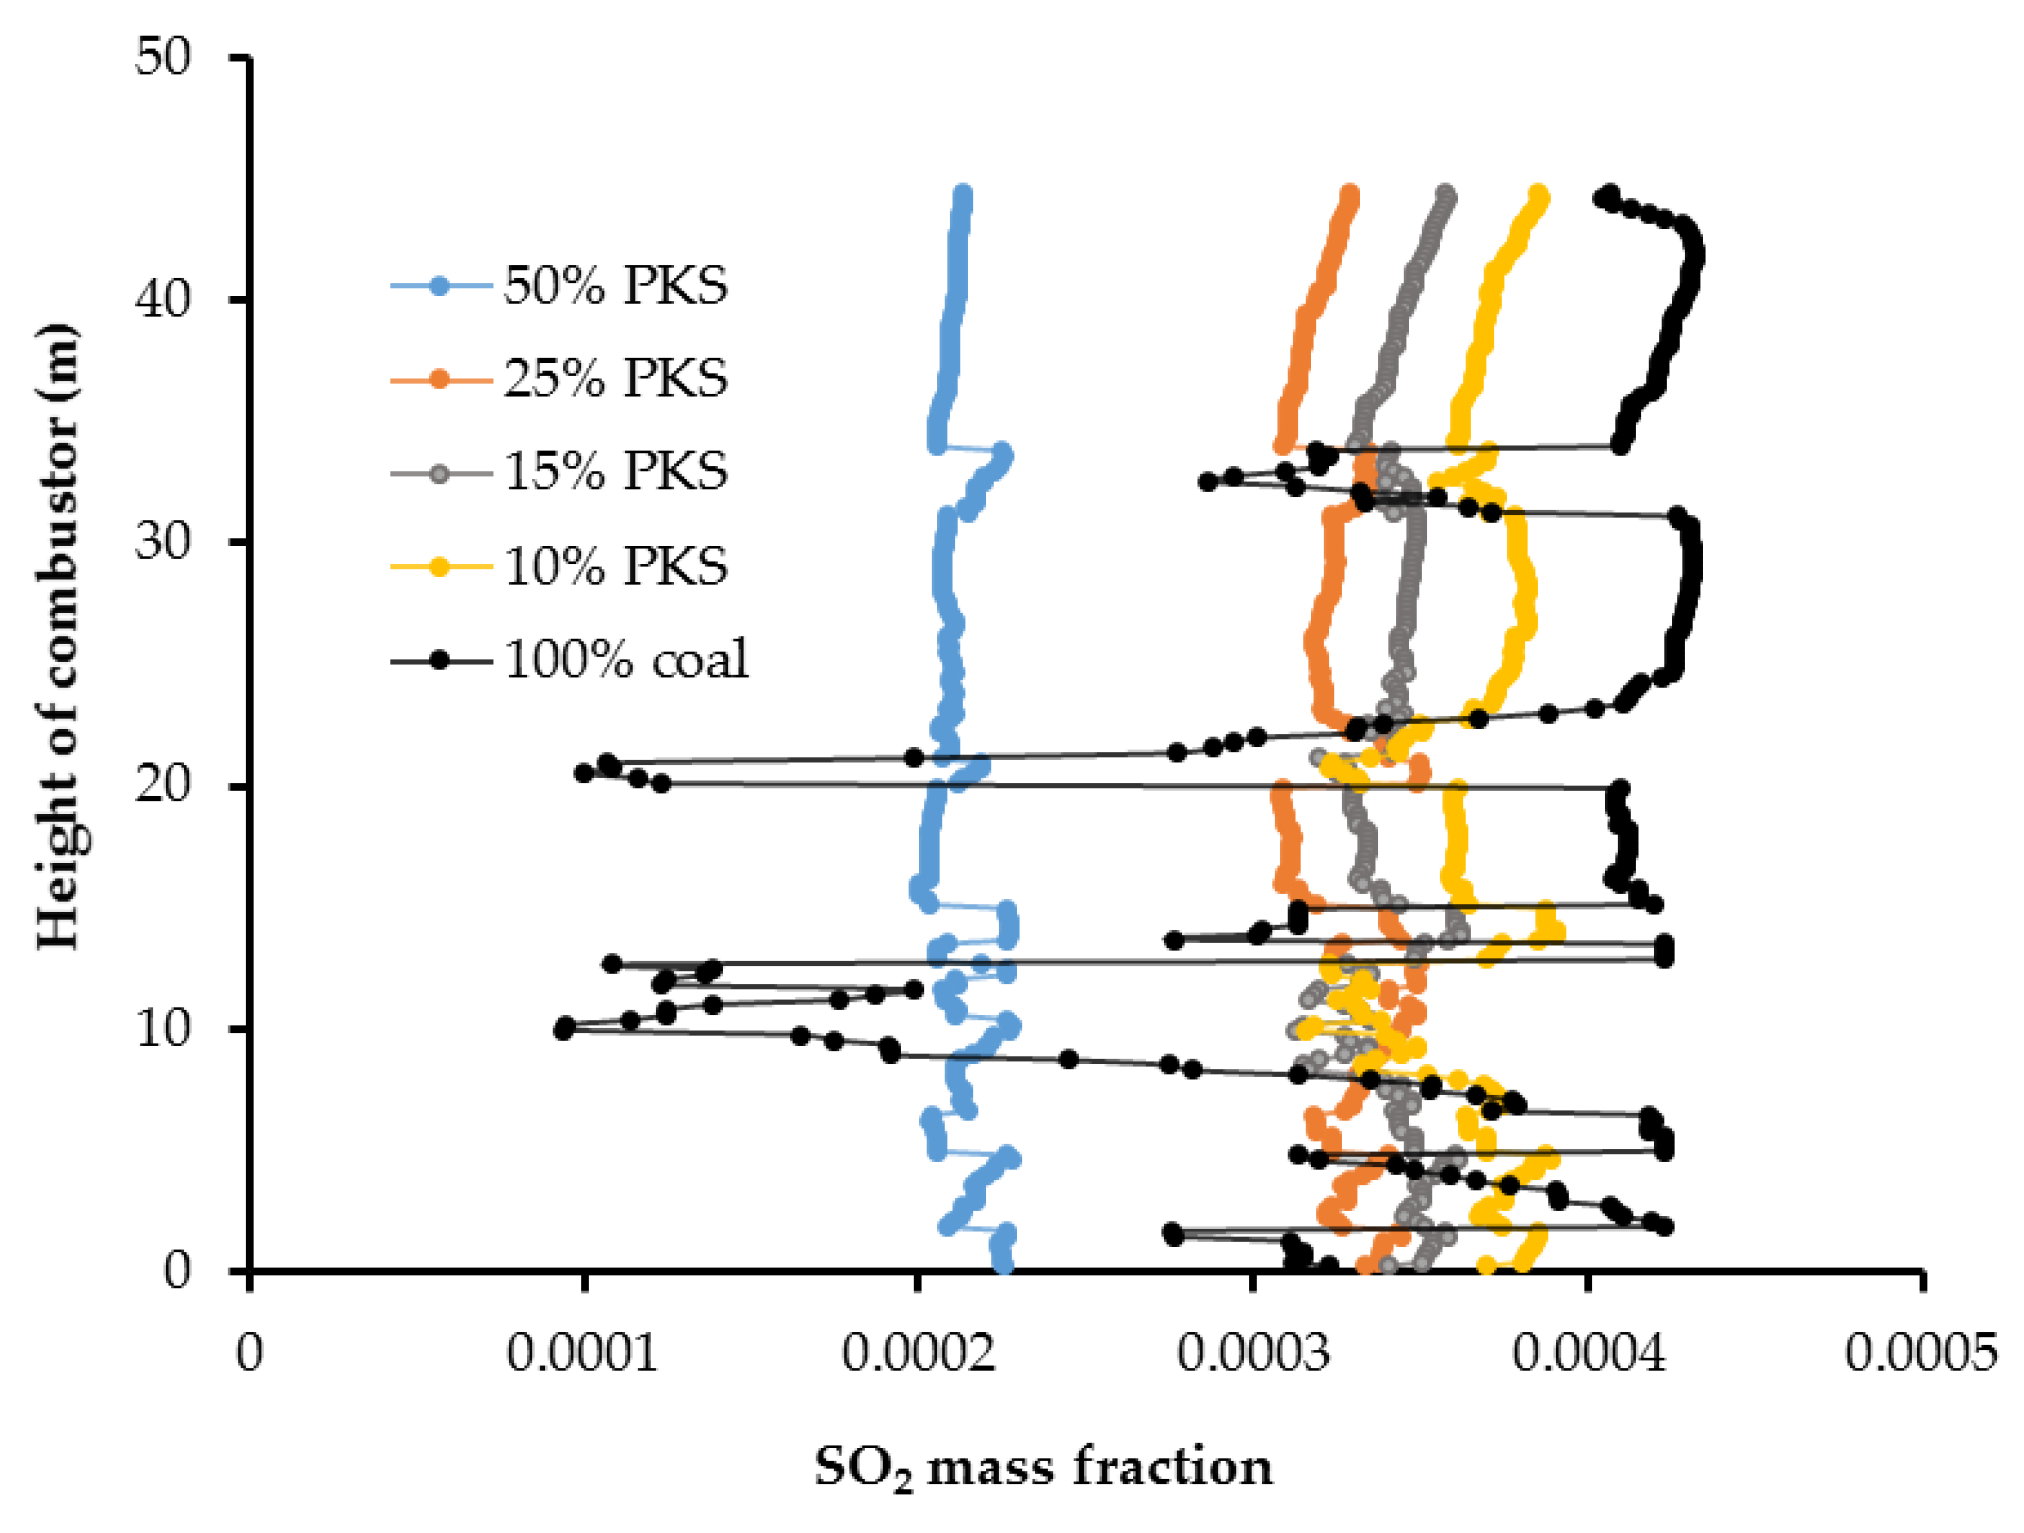
Figure 13 and
Figure 14 show the cross sectional SO
2 distribution profile and its distribution at the center of the combustor at different PKS mass fractions. A higher PKS mass fraction was associated with a significant reduction in the SO
2 concentration. PKS has almost no sulfur content, in contrast with coal, so increasing the PKS mass fraction has the advantage of reducing the amount of SO
2 in the exhaust gas.
5. Conclusions
Co-firing of PKS in a pulverized coal power plant was studied using CFD. We examined a range of co-firing behavior including the temperature distribution and the concentrations of CO2, CO, O2, NOx, and SOx in the exhaust gases. Inclusion of 25% PKS was shown to improve the combustion temperature and the concentrations of CO2, CO, and SOx in the flue gas. However, it produced relatively large amounts of NOx, which is considered an atmospheric pollutant. Balancing these parameters, PKS mass fractions of 10% and 15% emerged as the appropriate co-firing conditions.
However, it is also very important to take account of the PKS supply from the surrounding palm mills. Given that the average palm mill capacity in Indonesia is 60 t-FFB h−1 and the ratio of produced PKS is 7%, PKS would need to be collected from about 10 palm mills to supply sufficient PKS for co-firing at 15% PKS and from 7 palm mills for co-firing at 10% PKS.
Co-firing of PKS and coal should be conducted at a pilot experimental scale before being applied in real power plants. For the future, we plan to undertake theoretical and experimental studies of the use of other solid wastes from palm mills, including empty fruit bunches.
Acknowledgments
The authors deeply thank New Energy Foundation (NEF), Japan, for the financial support through the Researcher Invitation Program 2015 through which this research has been conducted. The proximate and ultimate analyses of PKS and coal are provided by Agency for the Assessment and Application of Technology (BPPT), Indonesia.
Author Contributions
Dwika Budianto modeled and performed the CFD analysis for co-firing; Muhammad Aziz created the overall research plan and results analysis; Muhammad Aziz and Dwika Budianto wrote the manuscript; and Takuya Oda analyzed the results and checked the manuscript.
Conflicts of Interest
The authors declare no conflict of interest.
Abbreviations
The following abbreviations are used in this manuscript:
| CFD | Computational fluid dynamics |
| FFB | Fresh fruit bunch |
| LRC | Low rank coal |
| PIC | Particle-in-cell |
| PKS | Palm kernel shell |
| RANS | Reynolds averaged Navier-Stokes |
| SIMPLE | Semi-implicit method for pressure linked equations |
| VM | Volatile matter |
References
- Aziz, M.; Oda, T.; Kashiwagi, T. Innovative steam drying of empty fruit bunch with high energy efficiency. Dry. Technol. 2015, 33, 395–405. [Google Scholar] [CrossRef]
- Aziz, M.; Prawisudha, P.; Prabowo, B.; Budiman, B.A. Integration of energy-efficient empty fruit bunch drying with gasification/combined cycle systems. Appl. Energy 2015, 139, 188–195. [Google Scholar] [CrossRef]
- Miettinen, J.; Hoiijer, A.; Tollenaar, D.; Page, S.; Malins, C.; Vernimmen, R.; Shi, C.; Liew, S.C. Historical Analysis and Projection of Oil Palm Plantation Expansion on Peat Land in Southeast Asia; ICCT White Paper No. 17; International Council on Clean Transportation: Washington, DC, USA, 2012. [Google Scholar]
- Aziz, M.; Oda, T.; Kashiwagi, T. Design and analysis of energy-efficient integrated crude palm oil and palm kernel oil processes. J. Jpn. Inst. Energy 2015, 94, 143–150. [Google Scholar] [CrossRef]
- Basiron, Y. Palm oil production through sustainable plantations. Eur. J. Lipid Sci. Technol. 2007, 109, 289–295. [Google Scholar] [CrossRef]
- Bazargan, A.; Rough, S.L.; McKay, G. Compaction of palm kernel shell biochars for application as solid fuel. Biomass Bioenergy 2014, 70, 489–497. [Google Scholar] [CrossRef]
- Febriansyah, H.; Setiawan, A.A.; Suryopratomo, K.; Setiawan, A. Gama stove: Biomass stove for palm kernel shell in Indonesia. Energy Procedia 2014, 47, 123–132. [Google Scholar] [CrossRef]
- Griffin, W.M. Availability of biomass residues for co-firing in peninsular Malaysia: Implications for cost and GHG emissions in the electricity sector. Energies 2014, 7, 804–823. [Google Scholar] [CrossRef]
- Livingston, W.R. Biomass ash and the mixed ashes from co-firing biomass with coal. In Proceedings of the IEA Clean Coal Workshop, Drax Power Station, London, UK, 25–26 January 2011.
- Karim, M.R.; Naser, J. Progress in numerical modelling of packed bed biomass combustion. In Proceedings of the 19th Australasian Fluid Mechanics Conference, Melbourne, Australia, 8–11 December 2014.
- Bhuiyan, A.B.; Karim, M.R.; Naser, J. Modeling of solid and bio-fuel combustion technologies. In Thermofluid Modeling for Energy Efficiency Applications; Khan, M.M.K., Hassan, N.M.S., Eds.; Elsevier: London, UK, 2016; pp. 259–309. [Google Scholar]
- Indonesia Investments. Coal Mining in Indonesia. Available online: http://www.indonesia-investments.com/business/commodities/coal/item236 (accessed on 2 December 2015).
- Aziz, M.; Kansha, Y.; Kishimoto, A.; Kotani, Y.; Liu, Y.; Tsutsumi, A. Advanced energy saving in low rank coal drying based on self-heat recuperation technology. Fuel Process. Technol. 2012, 104, 16–22. [Google Scholar] [CrossRef]
- Aziz, M.; Oda, T.; Kashiwagi, T. Energy-efficient low rank coal drying based on enhanced vapor recompression technology. Dry. Technol. 2014, 32, 1621–1631. [Google Scholar] [CrossRef]
- Liu, Y.; Aziz, M.; Kansha, Y.; Tsutsumi, A. A novel exergy recuperative drying module and its application for energy-saving drying with superheated steam. Chem. Eng. Sci. 2013, 100, 392–401. [Google Scholar] [CrossRef]
- Saptoadi, H. The future of biomass energy in Indonesia. In Proceedings of the 2nd AUN/SEED-Net Regional Conference on Energy Engineering, Bangkok, Thailand, 13–14 November 2015.
- Xu, W.; Niu, Y.; Tan, H.; Wang, D.; Du, W.; Hui, S. A new agro/forestry residues co-firing model in a large pulverized coal furnace: Technical and economic assessments. Energies 2013, 6, 4377–4393. [Google Scholar] [CrossRef]
- Aziz, M.; Oda, T.; Kashiwagi, T. Advanced energy harvesting from algae—Innovative integration of drying, gasification and combined cycle. Energies 2014, 7, 8217–8235. [Google Scholar] [CrossRef]
- Aziz, M.; Oda, T.; Kashiwagi, T. Clean hydrogen production from low rank coal: Novel integration of drying, gasification, chemical looping, and hydrogenation. Chem. Eng. Trans. 2015, 45, 613–618. [Google Scholar]
- Ranade, V.V.; Gupta, D.F. Computational Modeling of Pulverized Coal Fired Boilers; CRC Press: Boca Raton, FL, USA, 2015; pp. 19–31. [Google Scholar]
- Bhuiyan, A.A.; Naser, J. CFD modelling of co-firing of biomass with coal under oxy-fuel combustion in a large scale power plant. Fuel 2015, 159, 150–168. [Google Scholar] [CrossRef]
- Tabet, F.; Gokalp, I. Review on CFD based models for co-firing coal and biomass. Renew. Sustain. Energy Rev. 2015, 51, 1101–1114. [Google Scholar] [CrossRef]
- Oevermann, M.; Gerber, S.; Behrendt, F. Euler-Lagrange/DEM simulation of wood gasification in a bubbling fluidized bed reactor. Particuology 2009, 7, 307–316. [Google Scholar] [CrossRef]
- Anderson, J.D. Governing Equations of Fluid Dynamics. In Computational Fluid Dynamics: An Introduction; Wendt, J., Ed.; Springer: Berlin, Germany, 2009; pp. 15–51. [Google Scholar]
- Norton, T.; Sun, D.W.; Grant, J.; Fallon, R.; Dodd, V. Application of computational fluid dynamics (CFD) in the modelling and design of ventilation systems in the agricultural industry: A review. Bioresour. Technol. 2007, 98, 2386–2424. [Google Scholar] [CrossRef] [PubMed]
- Bhuiyan, A.A.; Naser, J. Computational modelling of co-firing of biomass with coal under oxy-fuel condition in a small scale furnace. Fuel 2015, 143, 455–466. [Google Scholar] [CrossRef]
- Launder, B.E.; Sharma, B.I. Application of the energy dissipation model of turbulence to the calculation of flow near a spinning disc. Lett. Heat Mass Transf. 1974, 1, 131–138. [Google Scholar] [CrossRef]
- Yin, C.; Kaer, S.K.; Rosendahl, L.; Hvid, S.L. Modeling of pulverized coal and biomass co-firing in a 150 kW swirling stabilized burner and experimental validation. In Proceedings of the International Conference on Powder Engineering-09 (ICOPE-09), Kobe, Japan, 16–20 November 2009.
- Westbrook, C.K.; Dryer, F.L. Simplified reaction-mechanisms for the oxidation of hydrocarbon fuels in flames. Combust. Sci. Technol. 1981, 27, 31–34. [Google Scholar] [CrossRef]
- Sami, M.; Annamalai, K.; Wooldridge, M. Co-firing of coal and biomass fuel blends. Prog. Energy Combust. Sci. 2001, 27, 171–214. [Google Scholar] [CrossRef]
- Ninduangdee, P.; Kuprianov, V.I.; Cha, E.Y.; Kaewrath, R.; Youngyuen, P.; Atthawethworawuth, W. Thermogravimetric studies of oil palm empty fruit bunch and palm kernel shell: TG/DTG analysis and modeling. Energy Procedia 2015, 79, 453–458. [Google Scholar] [CrossRef]
- Williams, A.M.; Pourkashanian, M.; Jones, J.M. The combustion of coal and some other solid fuels. Proc. Combust. Inst. 2000, 28, 2141–2162. [Google Scholar] [CrossRef]
- Khare, S.P.; Wall, T.F.; Farida, A.Z.; Liu, Y.; Moghtaderi, B.; Gupta, R.P. Factors influencing the ignition of flames from air-fired swirl pf burners retrofitted to oxy-fuel. Fuel 2008, 87, 1042–1049. [Google Scholar] [CrossRef]
- Clean Air Technology Center (MD-12), Nitrogen Oxides (NOx), Why and How They Are Controlled, Technical Bulletin of Environmental Protection Agency, EPA 456/F-99-006R, 1999, North Carolina, USA. Available online: http://www3.epa.gov/ttncatc1/cica/other7_e.html (accessed on 5 December 2015).
© 2016 by the authors; licensee MDPI, Basel, Switzerland. This article is an open access article distributed under the terms and conditions of the Creative Commons by Attribution (CC-BY) license (http://creativecommons.org/licenses/by/4.0/).


