
Field Study on Humidification Performance of a Desiccant Air-Conditioning System Combined with a Heat Pump

 ,
,
Abstract
:1. Introduction
- By adsorbing water vapor from the air and using it as the source of humidity instead of water, a water source and drain pan will not be necessary.
- Peripheral equipment and piping work for heating and humidification, as well as the corresponding maintenance required to treat limescale, will not be necessary.
- The risk of microbial growth inside the drain pan and water tank of the air-conditioning unit will be eliminated, and an improved IAQ is expected. A dew-free environment could be achieved both inside the air-conditioning unit and indoors throughout the year.
- Under ideal conditions during the summer, where both the process and regeneration sides operate is isenthalpically, the regeneration energy is used to convert the latent-heat energy on the process side at the desiccant wheel to sensible-heat energy without reducing the enthalpy. To use high-temperature dehumidified air for cooling, its enthalpy must be reduced by a sensible-heat exchange wheel and cooling coil. When the system is used for humidification during the winter, all of the regeneration energy put into the regeneration side, i.e., the humidification side during the winter, is converted to enthalpy. Thus, a high-temperature air supply with increased humidity is obtained, thereby producing highly efficient humidification-heating compared to the process used for dehumidification during the summer.
- The amount of water vapor adsorbed by the wheel is increased by increasing the amount of water vapor in the OA supplied to the moisture-adsorption side.
- Passing a large volume of low-temperature OA through the moisture-adsorption side quickly cools the wheel on the moisture-adsorption side, which increases the moisture-adsorption efficiency.
- On the other hand, cooling the moisture-adsorption side slows the heating of the wheel on the humidification side, thereby reducing the desorption performance.
2. Outline of Experiment
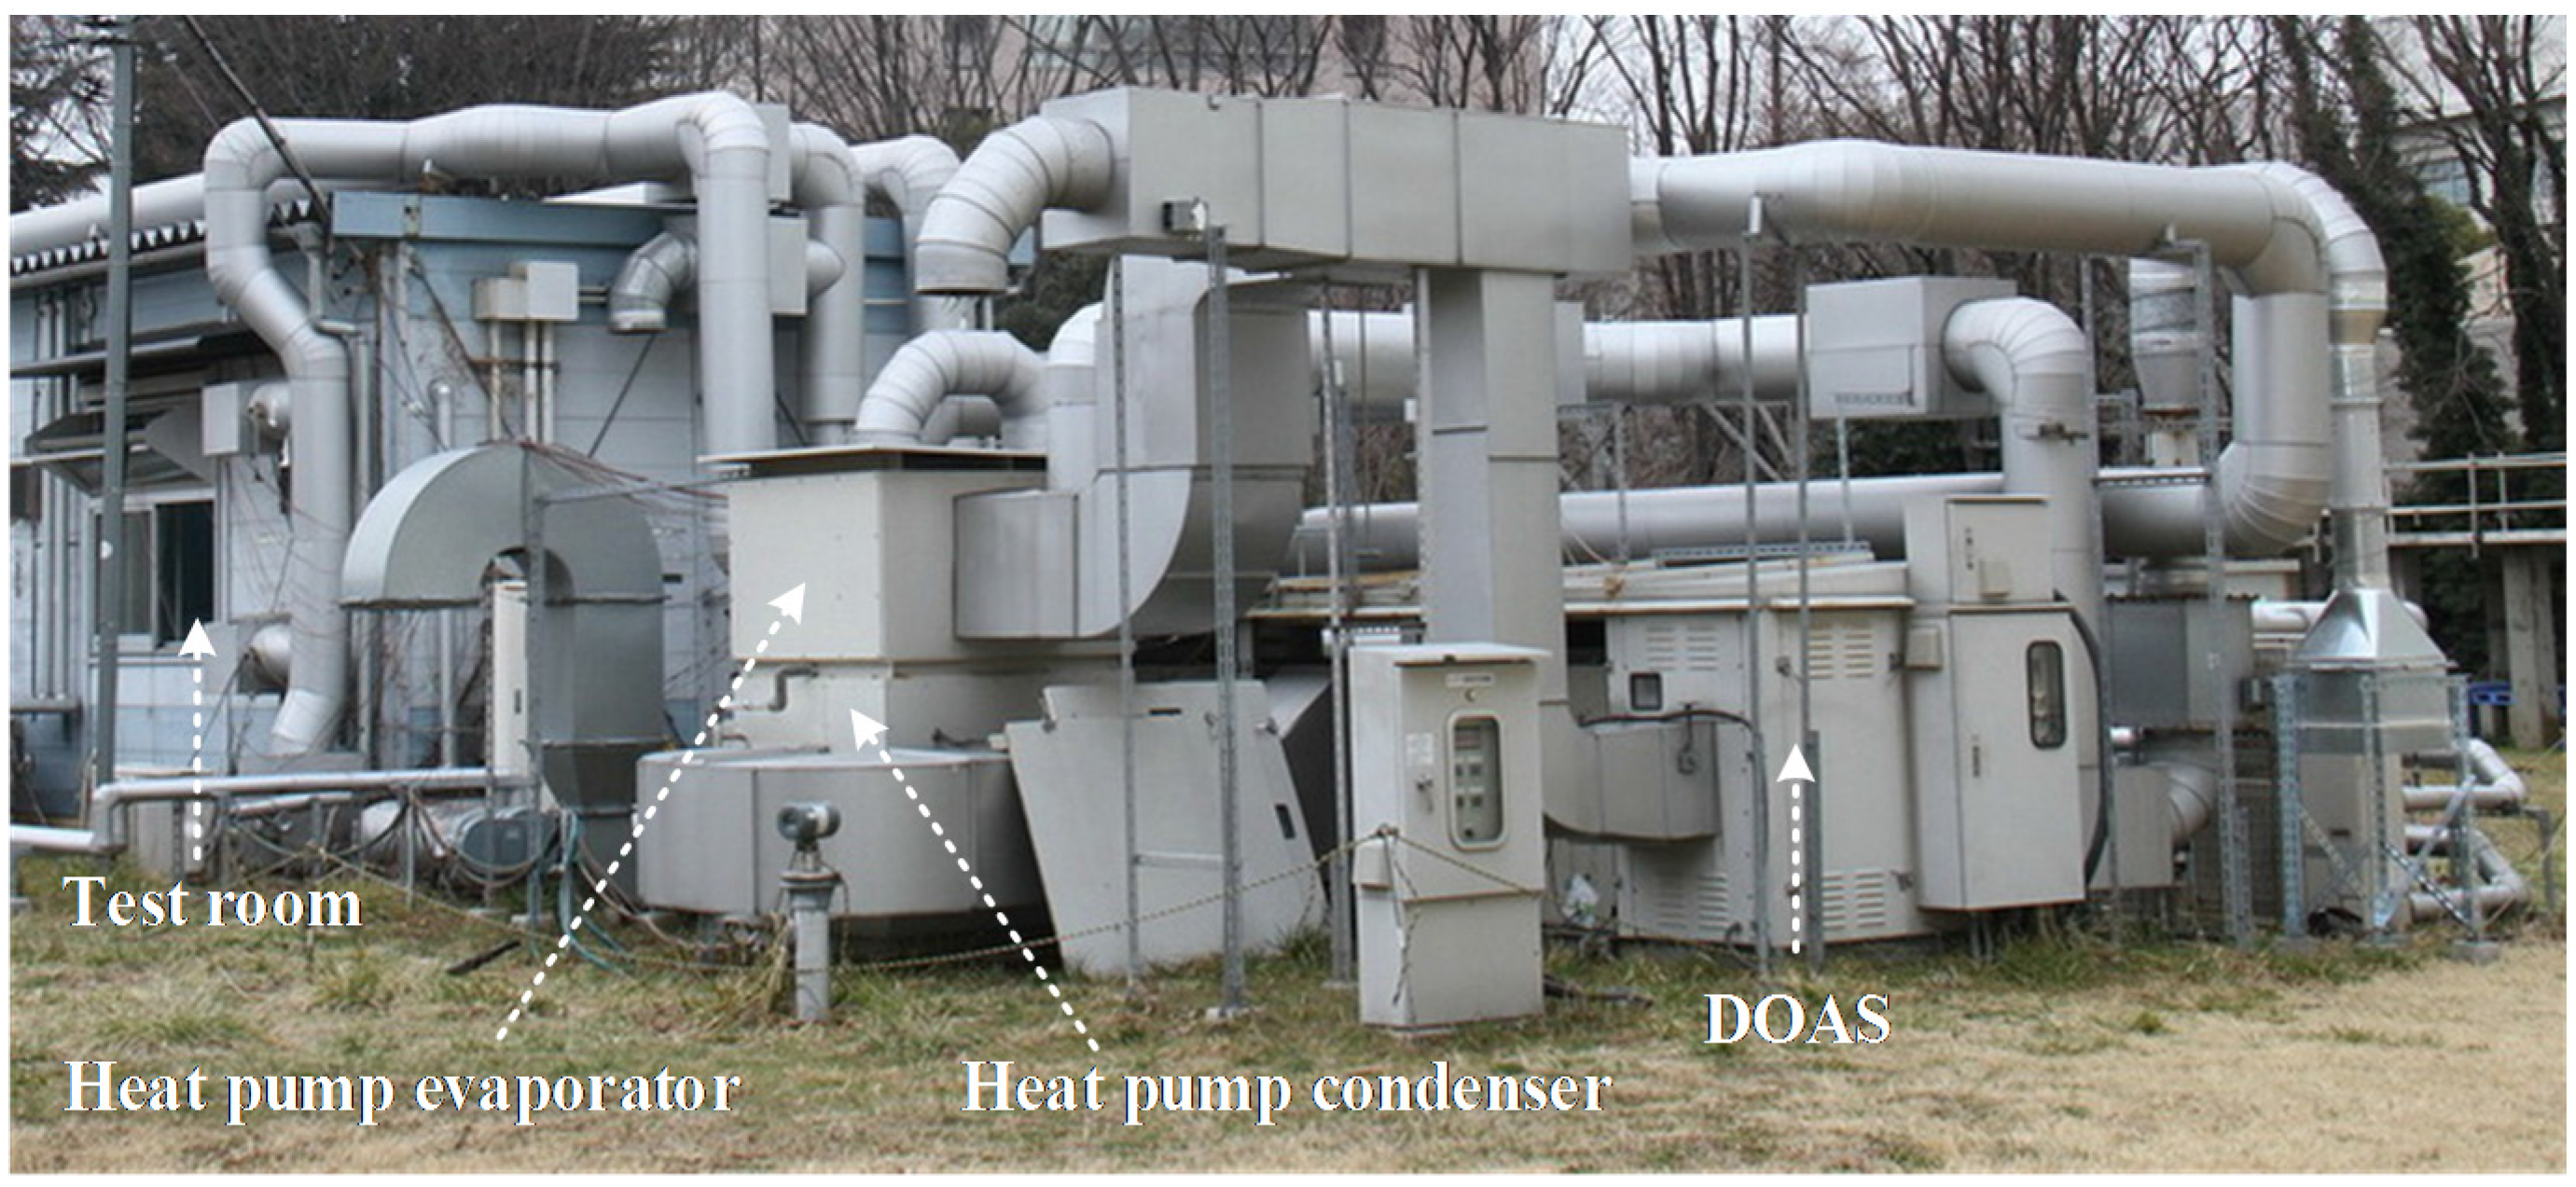
2.1. Overview of the Experimental Setup

| Desiccant wheel | Silica gel; diameter = 800 mm; thickness = 200 mm; moisture-adsorption side = 0°–180°; humidification side = 180°–360° | |
| Sensible-heat exchange wheel | Aluminum; diameter = 800 mm; thickness = 200 mm; moisture-adsorption side = 0°–180°; humidification side = 180°–360° nominal sensible-heat exchange efficiency = 75% (when the face air velocity on both sides is 3 m/s) | |
| Regeneration heat pump | Evaporator | Cooling capacity = 7.2 kW (when the refrigerant boiling temperature is −5 °C and the air temperature to condenser is 32 °C); boiling was controlled by an electronic expansion valve |
| Condenser | Heating capacity = 10.7 kW (when the refrigerant boiling temperature is −5 °C and the air temperature to condenser is 32 °C); finned-tube-type air-cooling; high-pressure control achieved with a microcomputer-controlled fan | |
| Compressor | Closed-loop; air-cooled refrigerant; condensing type; nominal output = 3.5 kW (when the refrigerant boiling temperature is −5 °C and the air temperature to condenser is 32 °C); vertical DC twin-rotary-type; refrigerant = R407C | |
| Fans | Moisture-adsorption side (inlet) | Turbo fan; nominal power = 1.5 kW; fan is controlled by the frequency of the inverters |
| Moisture-adsorption side (exhaustion) | Sirocco fan; nominal power = 3.7 kW; fan is controlled by the frequency of the inverters | |
| Humidification side (supply) | Turbo fan; nominal power = 0.75 kW; fan is controlled by the frequency of the inverters | |
| Drive motor for wheels | Desiccant wheel | Geared motor; nominal power = 0.4 kW; motor is controlled by the frequency of the inverters |
| Sensible-heat exchange wheel | Geared motor; nominal power = 0.4 kW; motor is controlled by the frequency of the inverters | |
| Measuring instruments | Measuring points * 1, 3, 5, 7 and 8 for temperature and relative humidity | Temperature sensor = Pt100 RTD 1/3 class B IEC 751; polymer-type humidity sensor; temperature range = −40–100 °C; humidity (relative humidity) range = 0%–100%; accuracy of temperature measurements = ±0.2 °C; accuracy of humidity measurements = ±1% (0%–90%) |
| Measuring points * 2, 4 and 6 for temperature | T-type thermocouple; measuring range = −40–350 °C; accuracy = ±1.5 °C | |
| Measuring points * 1, 5 and 7 for airflow rate | Measuring method = Multi-pitot tube traverse method according to Japanese Industrial Standards (JIS) B 8330; maximum range of airflow rate measurement = 6350 m3/h; accuracy of airflow rate measurements = ±2% | |

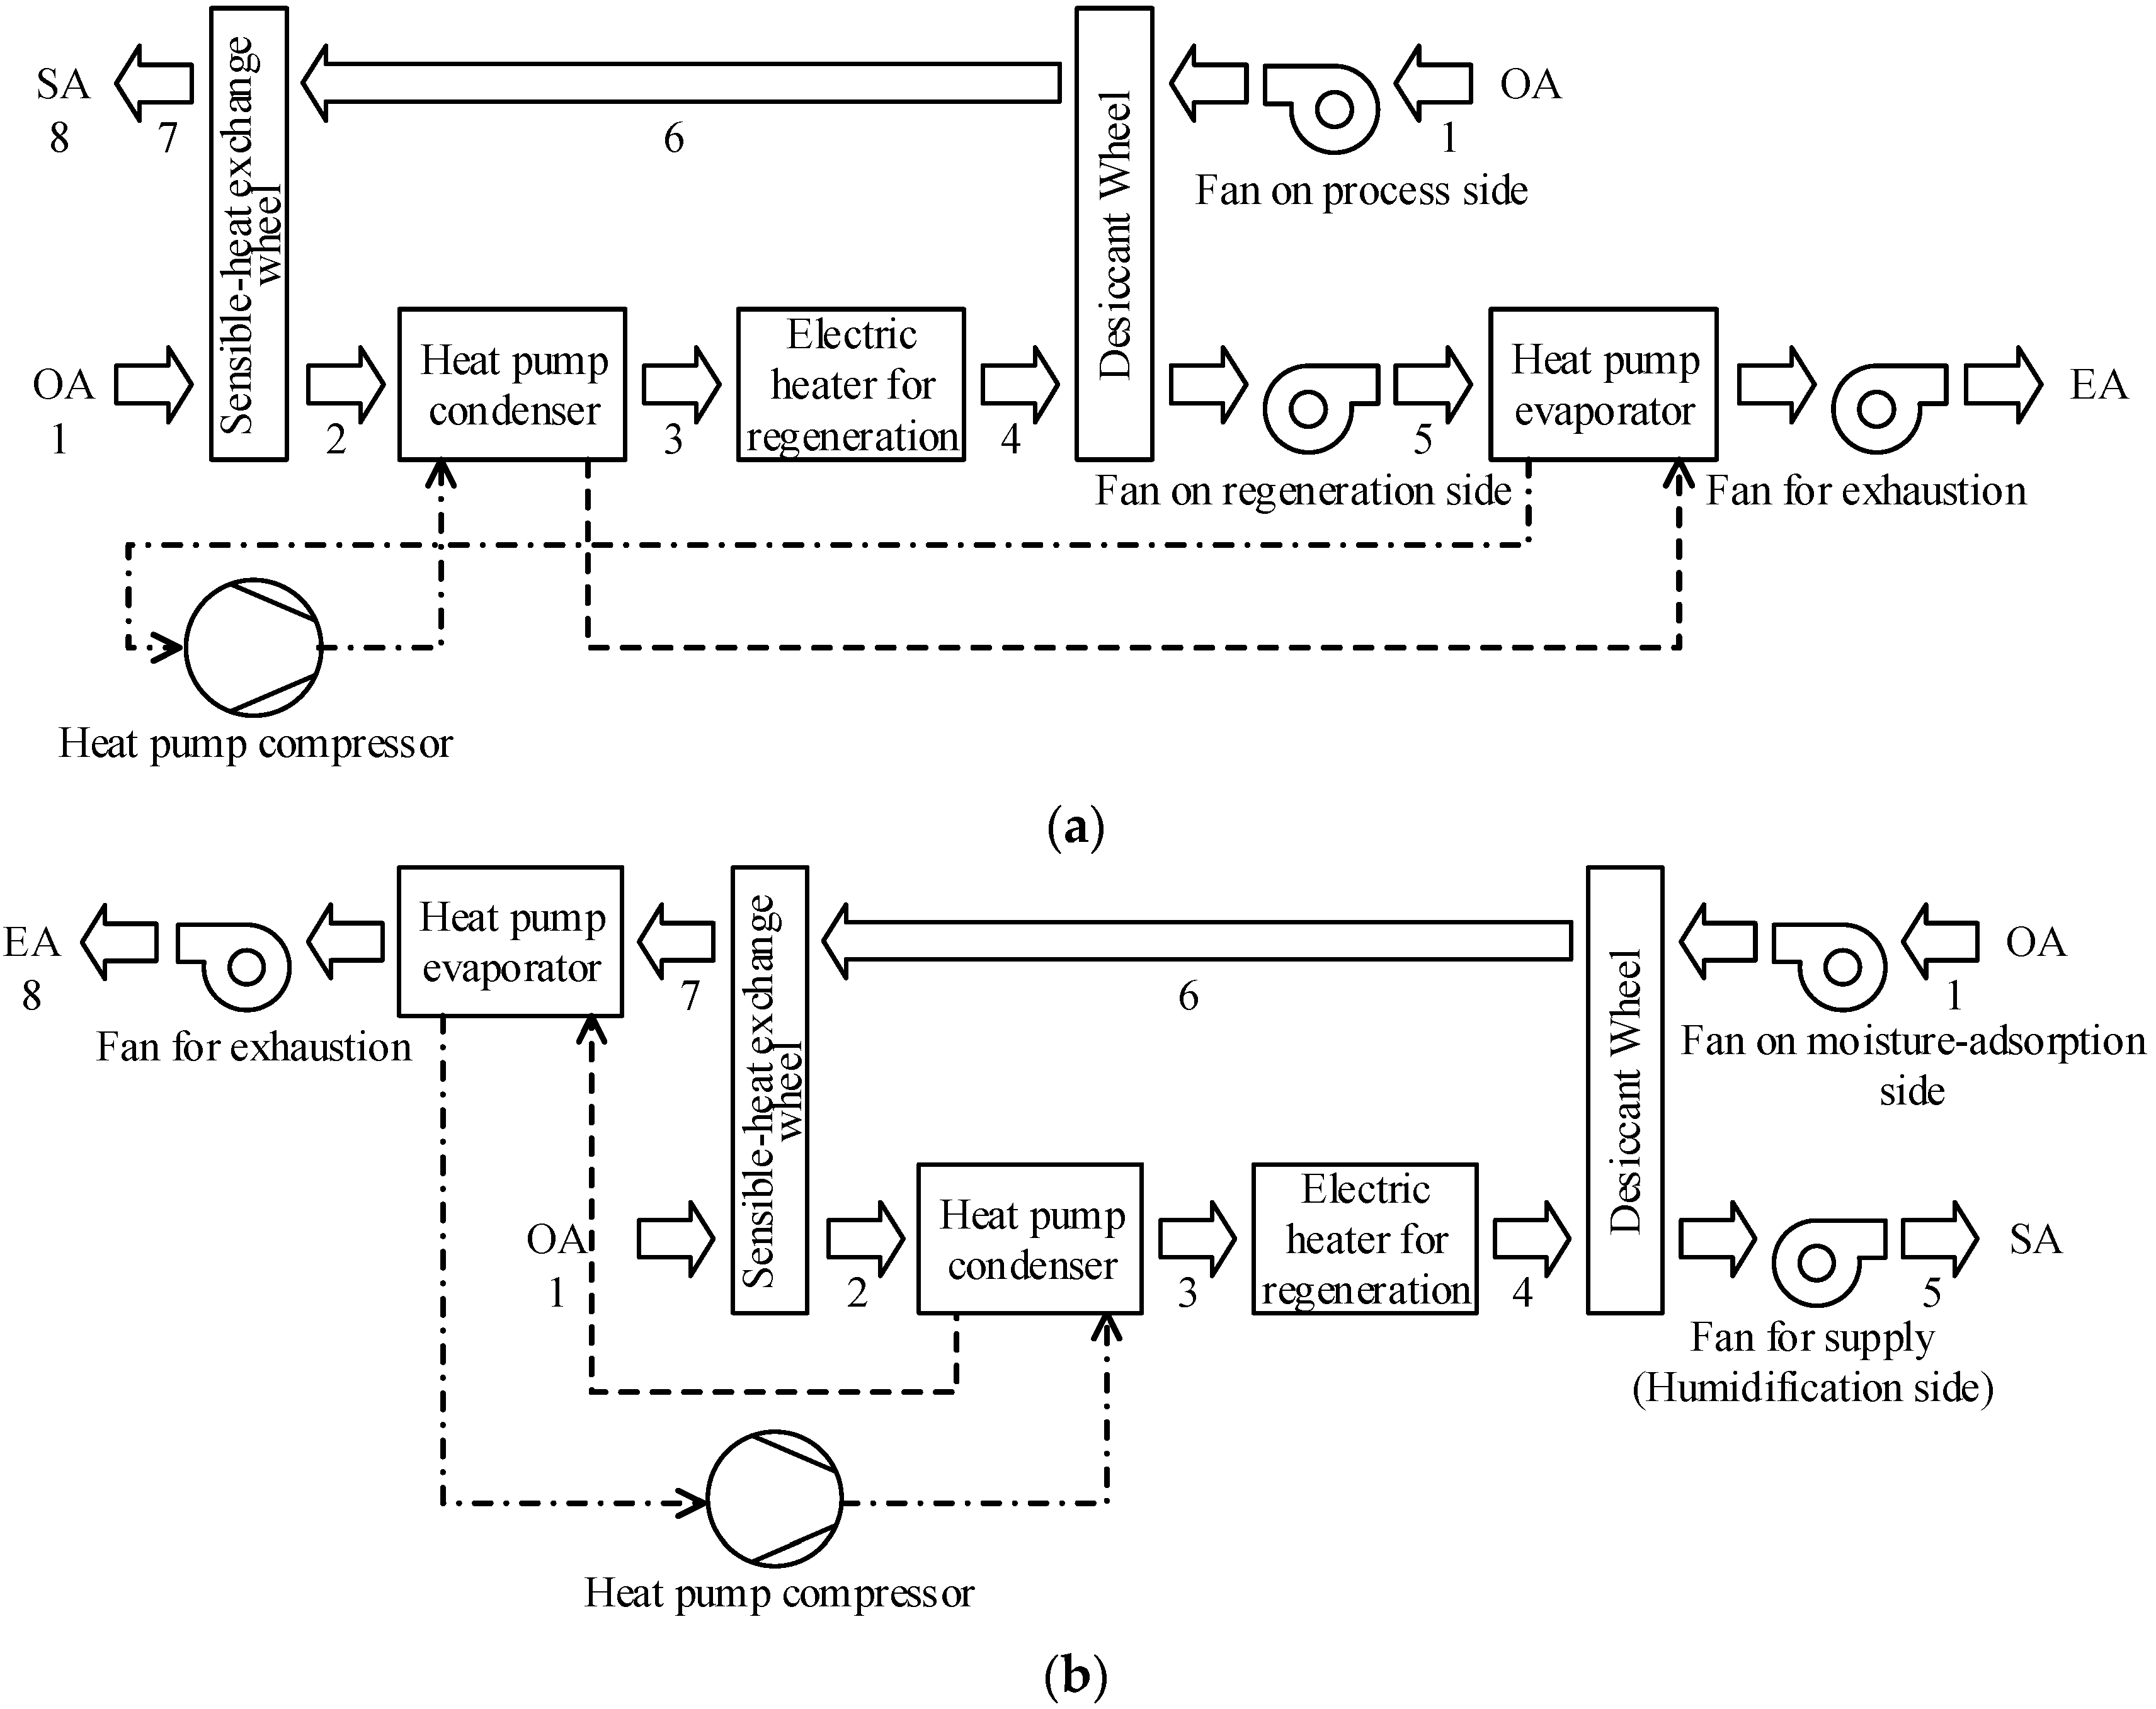
2.1.1. System for Summer Operation
2.1.2. System for Winter Operation
- (1)
- The heat-pump condenser was placed upstream of the electric heater for regeneration. Therefore, when the heating of the desiccant wheel with the heat-pump condenser was insufficient, the electric heater was turned on.
- (2)
- The sensible-heat exchange wheel was placed upstream of the heat pump condenser, which enabled the heating of the desiccant wheel, when necessary, by recovering the sensible energy from the high-temperature air caused by adsorption on the moisture-adsorption side.
- (3)
- The air temperature at the condenser outlet was controlled at the upper limit, which was slightly below the high-pressure cut-out temperature (approximately 50 °C), by the DC inverter.
- (4)
- The evaporator was positioned at the EA on the moisture-adsorption side. It pumped the heat from the high-temperature EA on the moisture-adsorption side to the humidification side and maintained the high-boiling temperature of the heat pump to enable high-efficiency operation. It also simultaneously cooled the low-humidity air after moisture-adsorption to minimize frost generation.
- (5)
- The airflow rate was controllable at both the humidification and moisture-adsorption sides, and the evaporator was controlled with an electronic expansion valve to accommodate the changes in conditions.
- (6)
- In the airflows of Figure 3b, the temperature of path point 2 → 3 → 4 → 5 after the sensible-heat exchange wheel on the humidification side was insulated, whereas path point 1 → 2 between the OA and after the sensible-heat wheel was not. Path point 7 → 8, downstream of the sensible-heat wheel on the moisture-adsorption side, was insulated, but path point 1 → 6 → 7 was not. This is because the experimental system was manufactured for summer dehumidification, where the air dehumidified by the desiccant wheel becomes warmer than the OA. Furthermore, cooling of the dehumidification path is required before the air is supplied. For heat dissipation to the OA, the insulation was not provided.
- (7)
- The partial air of the moisture-adsorption side leaked to the humidification side via the sensible-heat exchange wheel. The detailed mechanisms of the air leakage are described in (2) of Section 3.1.
2.2. Details of the Experiments
| Experiment | 1st Experiment | 2nd Experiment | |||||
|---|---|---|---|---|---|---|---|
| Period of experiment | 8–13 March 2012 | ||||||
| Location of experimental setup | 1–8 Yayoicho, Inageku, Chiba 263–0022, Japan | ||||||
| Outdoor conditions | Temperature (°C) | 7–8 | 6–11 | ||||
| Humidity ratio (g/kg DA) | 4.7–5.9 | 1.8–2.3 | |||||
| Atmospheric pressure (hPa) | 1015 | ||||||
| Case | Case A1 | Case A2 | Case B1 | Case B2 | Case C1 | Case C2 | |
| Airflow rate | Humidification side (supply) (m3/h) | 500 | |||||
| Moisture-adsorption side (inlet) (m3/h) | 500 | 1000 | 500 | 1000 | 1000 | 1500 | |
| Rotation speed of the desiccant wheel (rph) | 5 | 10 | 5 | ||||
| Regeneration temperature (°C) | 50/60/70 | ||||||
| Heat pump compressor | Output changed to achieve the required regeneration temperature | ||||||
| Rotation speed of the sensible-heat exchange wheel (rph) | 0 | ||||||
3. Results and Discussion


| Title | Case A1 | Case A2 | Case B1 | Case B2 | Case C1 | Case C2 | ||||||||||||
|---|---|---|---|---|---|---|---|---|---|---|---|---|---|---|---|---|---|---|
| RT * (°C) | 50 | 60 | 70 | 50 | 60 | 70 | 50 | 60 | 70 | 50 | 60 | 70 | 50 | 60 | 70 | 50 | 60 | 70 |
| ER_HP (kW) | 3.381 | 3.490 | 3.367 | 3.466 | 3.143 | 3.138 | 3.467 | 3.361 | 3.241 | 3.237 | 3.098 | 3.009 | 3.180 | 3.215 | 2.875 | 3.038 | 3.072 | 2.945 |
| ER_EH (kW) | 1.243 | 2.372 | 3.764 | 1.051 | 2.328 | 3.668 | 1.178 | 2.222 | 3.784 | 0.986 | 2.223 | 3.714 | 0.598 | 1.495 | 2.806 | 0.000 | 0.933 | 2.609 |
| EF (kW) | 0.797 | 0.910 | 0.797 | 0.910 | 0.910 | 0.945 | ||||||||||||
| EW (kW) | 0.014 | 0.016 | 0.014 | |||||||||||||||

3.1. Humidification Performance
- (1)
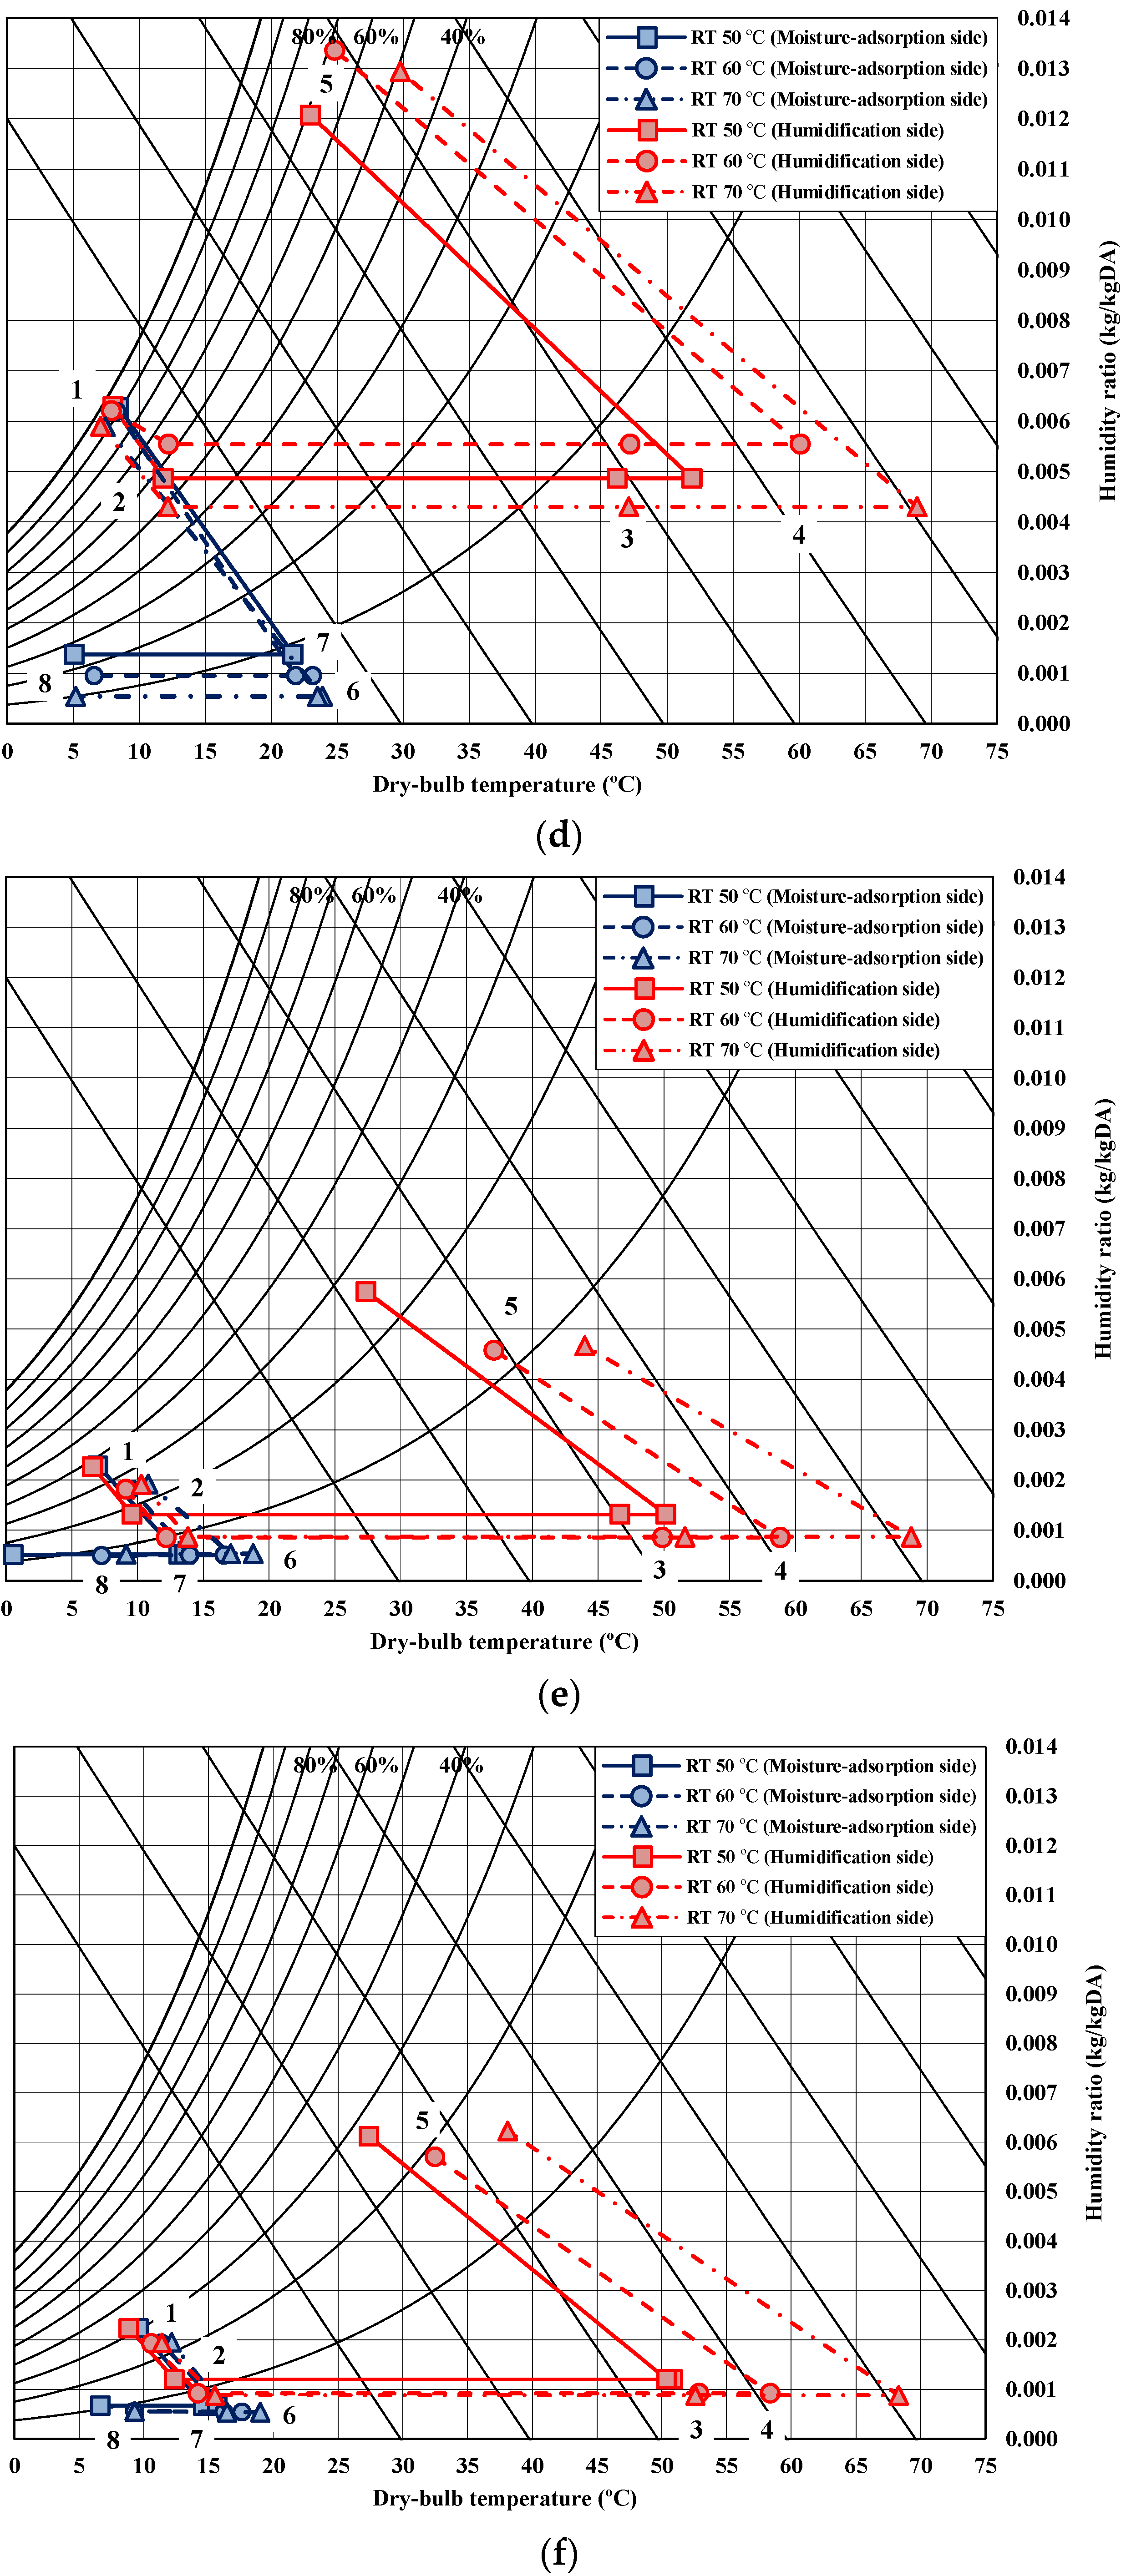
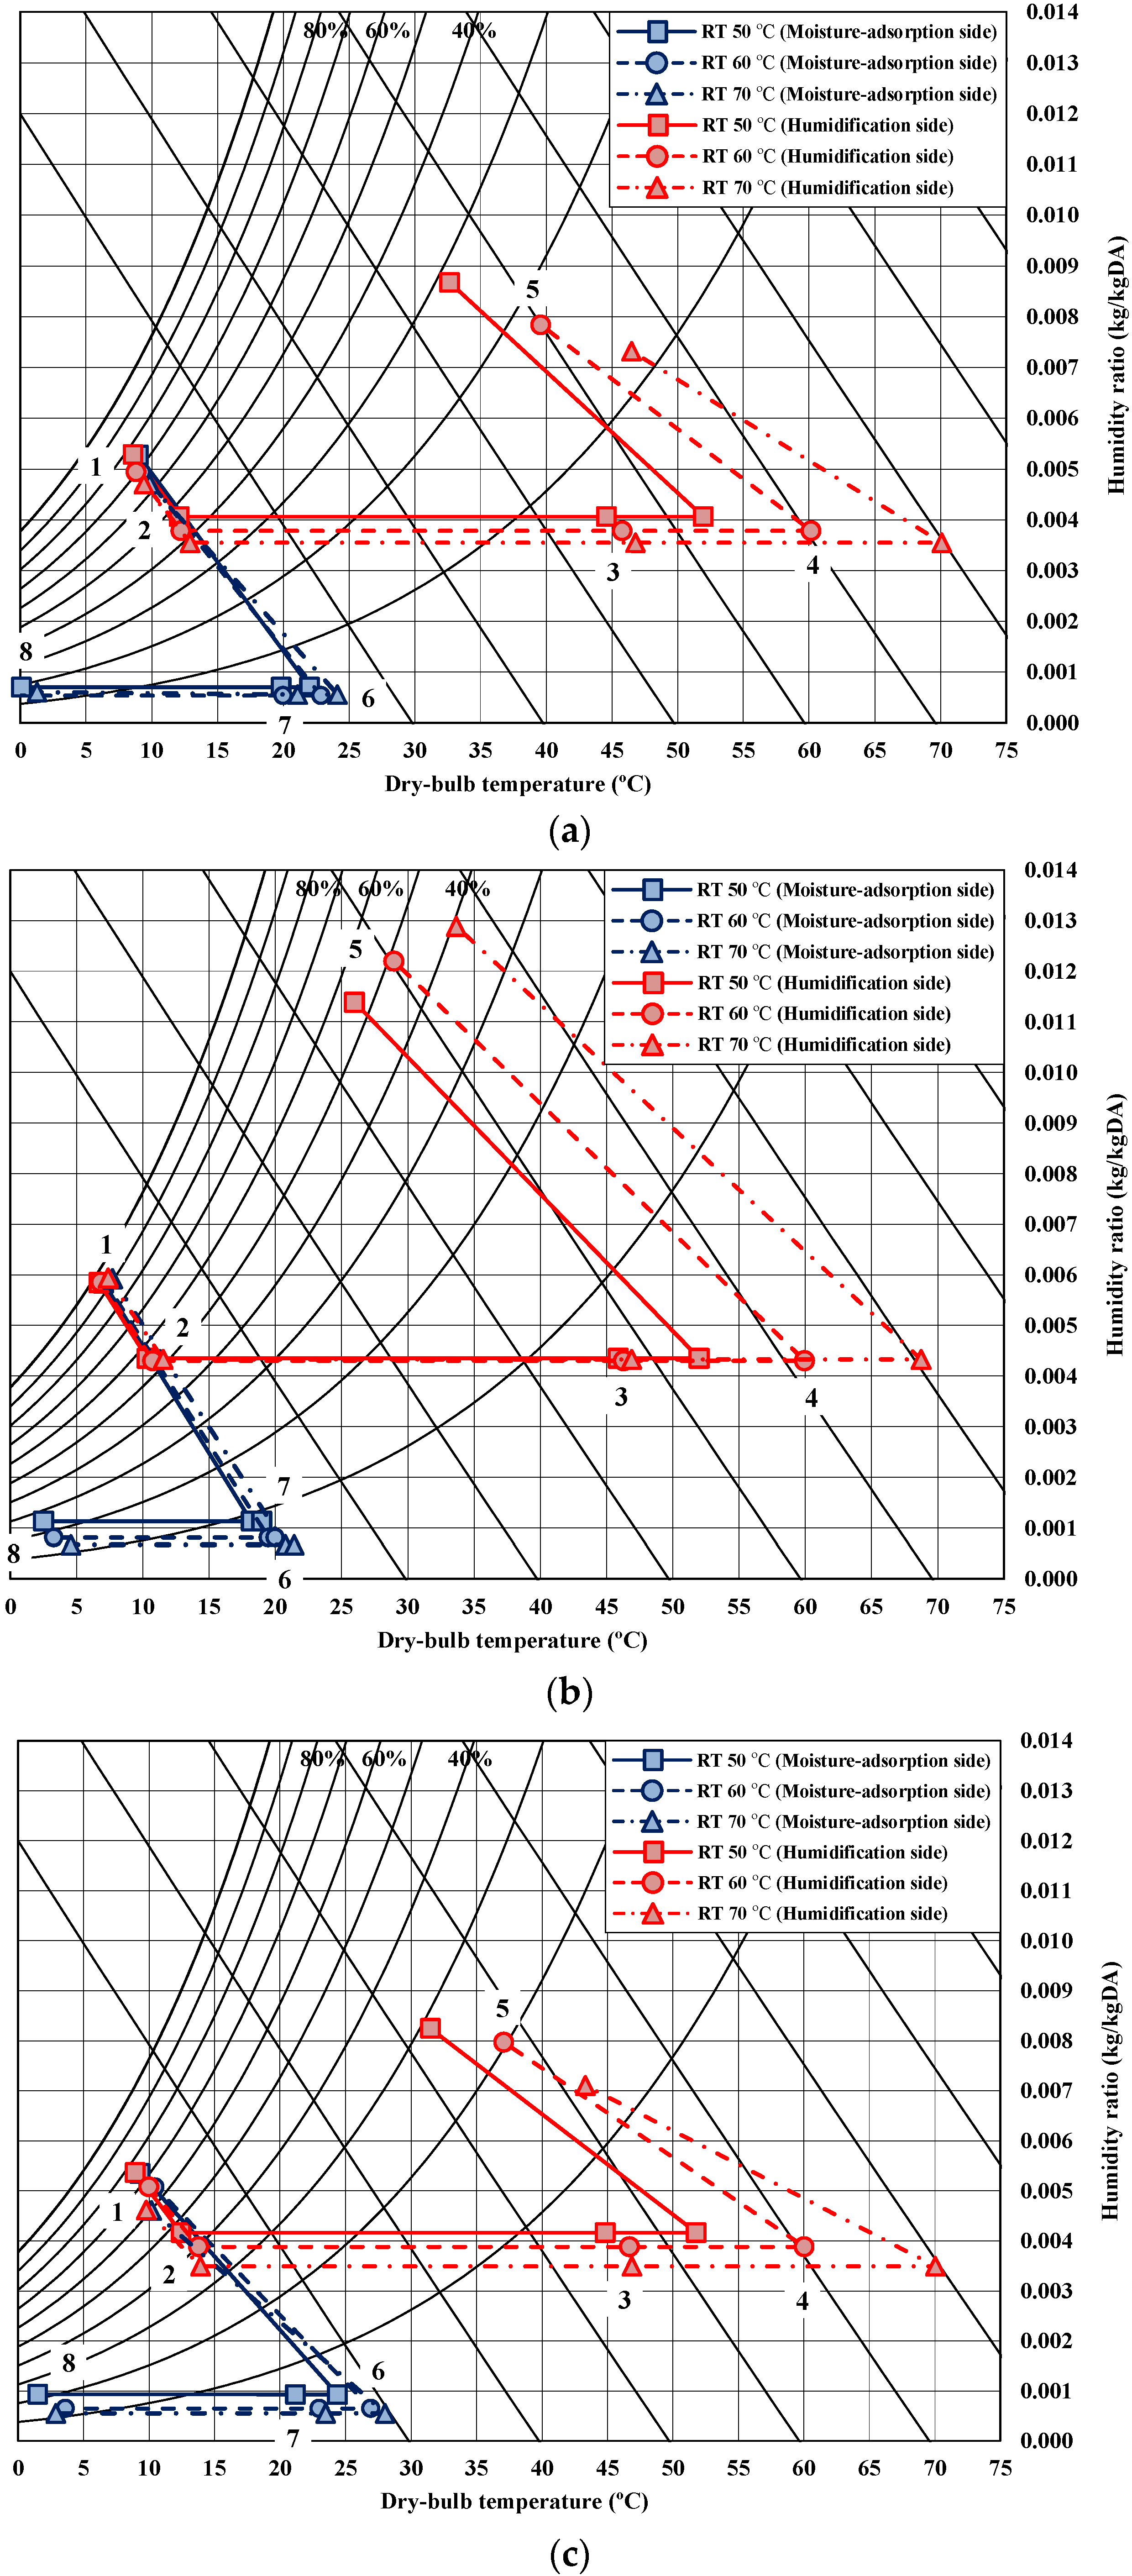
- Figure 5e,f indicate that the minimum humidity ratio of 5.8 g/kg DA is achieved at the outlet on the humidification side (SA or point 5 in Figure 3b) under certain operating conditions, even when the humidity ratio of the OA was approximately 2 g/kg DA in the second experiment. This satisfies the minimum humidification performance requirements of a DOAS in most areas of Japan. The required humidification performance is achievable by selecting the appropriate parameters, such as increasing the airflow rate on the moisture-adsorption side or increasing the regeneration temperature.
- (2)
- In all of the cases shown in Figure 5, a reduction of the humidity ratio occurs for path point 1 → 2 of the humidification side in Figure 3b. This is caused by the air leaking from the moisture-adsorption side to the humidification side via the sensible-heat exchange wheel. In a typical desiccant air-conditioning system for summer dehumidification, the degradation of the dehumidification performance is due to the inflow of high-humidity air from the regeneration side (humidification side during winter operation) to the process side (moisture-adsorption side during winter operation). To prevent this dehumidification performance degradation, a fan is positioned on the process side to push the humid air away, and another fan is positioned on the regeneration side to pull the air out. This arrangement maintains a positive pressure on the dehumidification side with respect to the regeneration side. In addition, to prevent the transportation of air from the regeneration side to the process side via the rotation of the sensible-heat exchange wheel, a channel is created in a portion of the wheel that allows the air on the process side to pass through. This intentionally permits some of the air on the process side to flow to the regeneration side. In this study, this setup also caused the air to leak from the moisture-adsorption side to the humidification side, reducing the efficiency of the DOAS for humidification applications.
- (3)
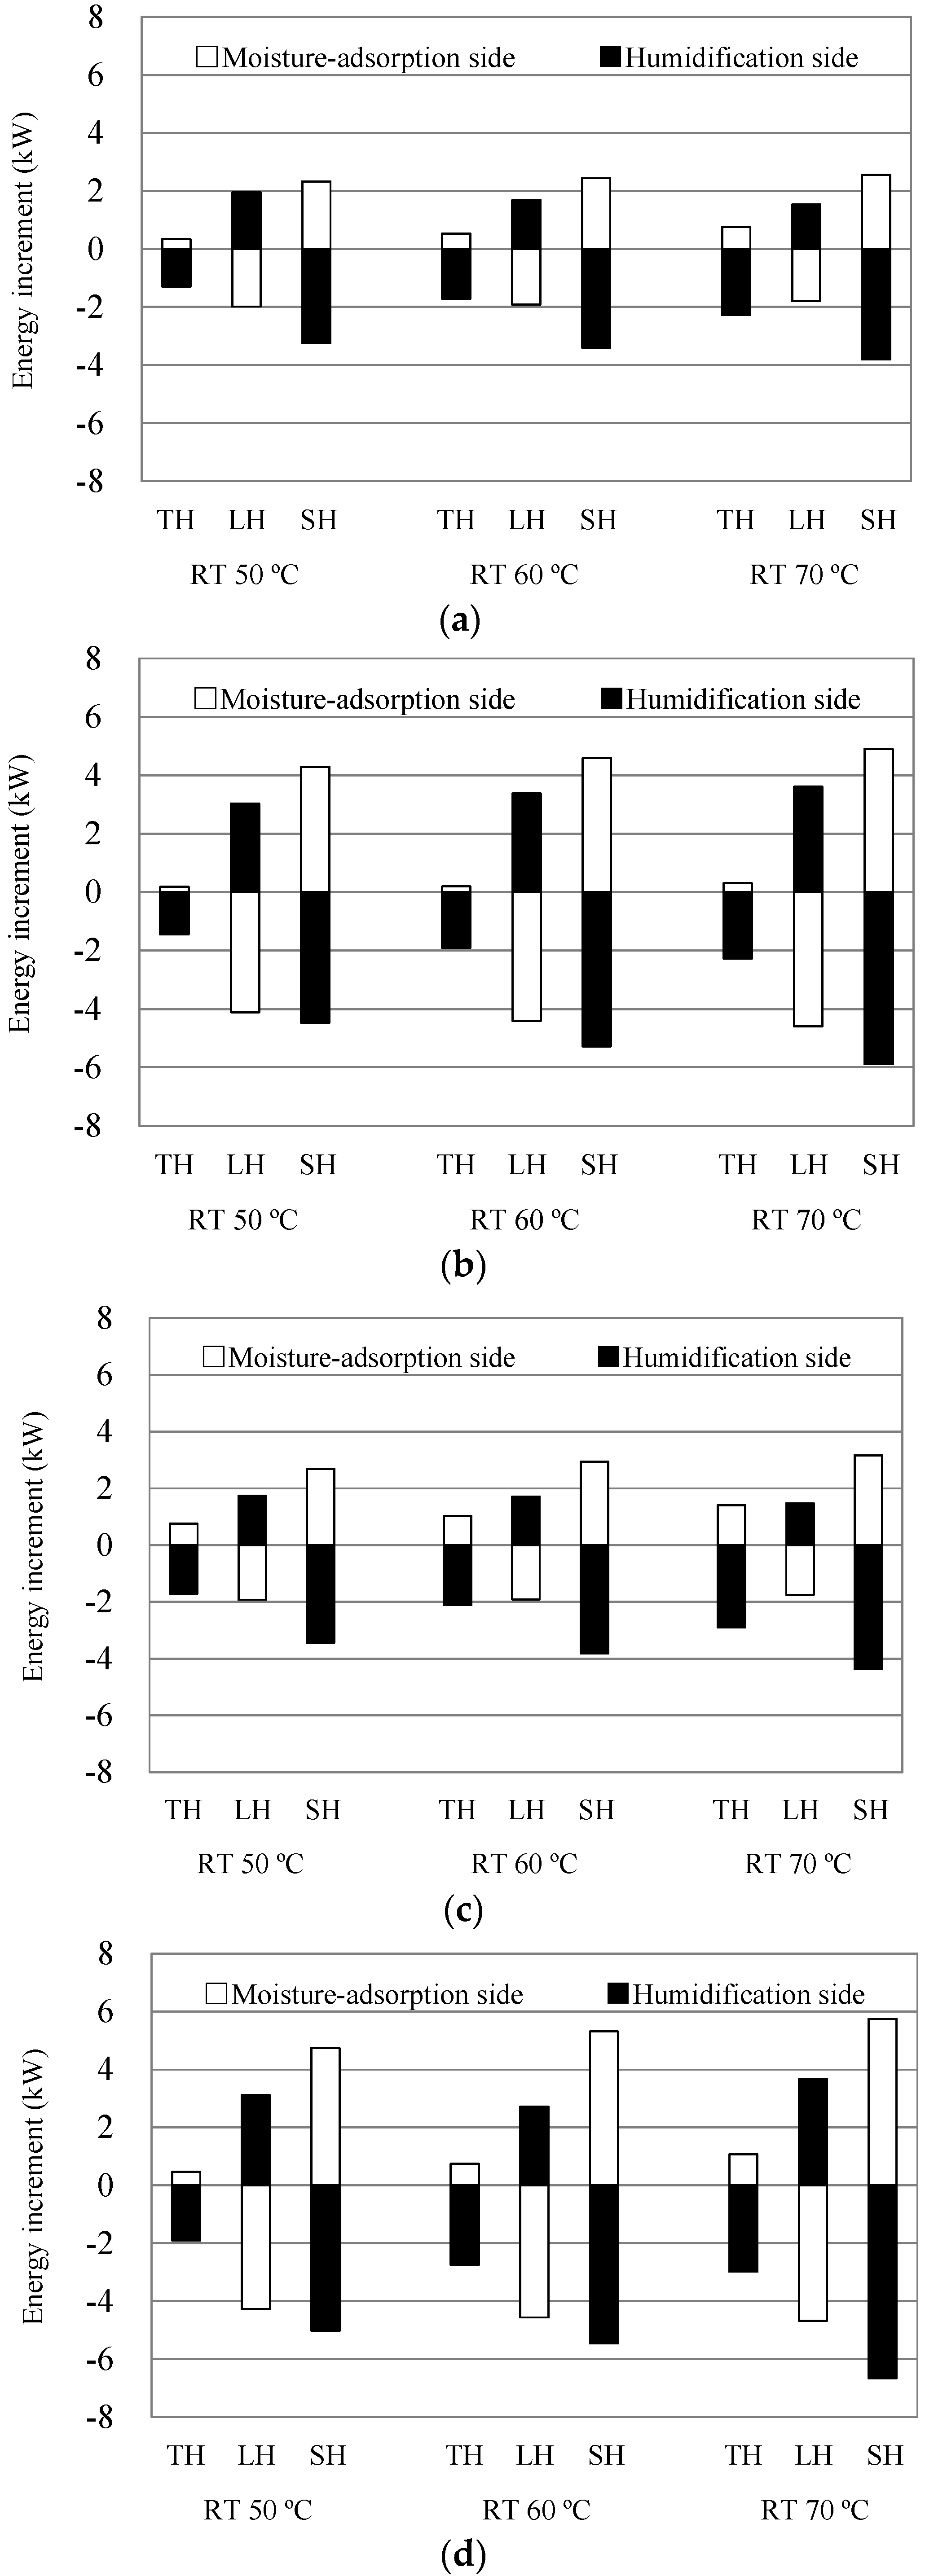
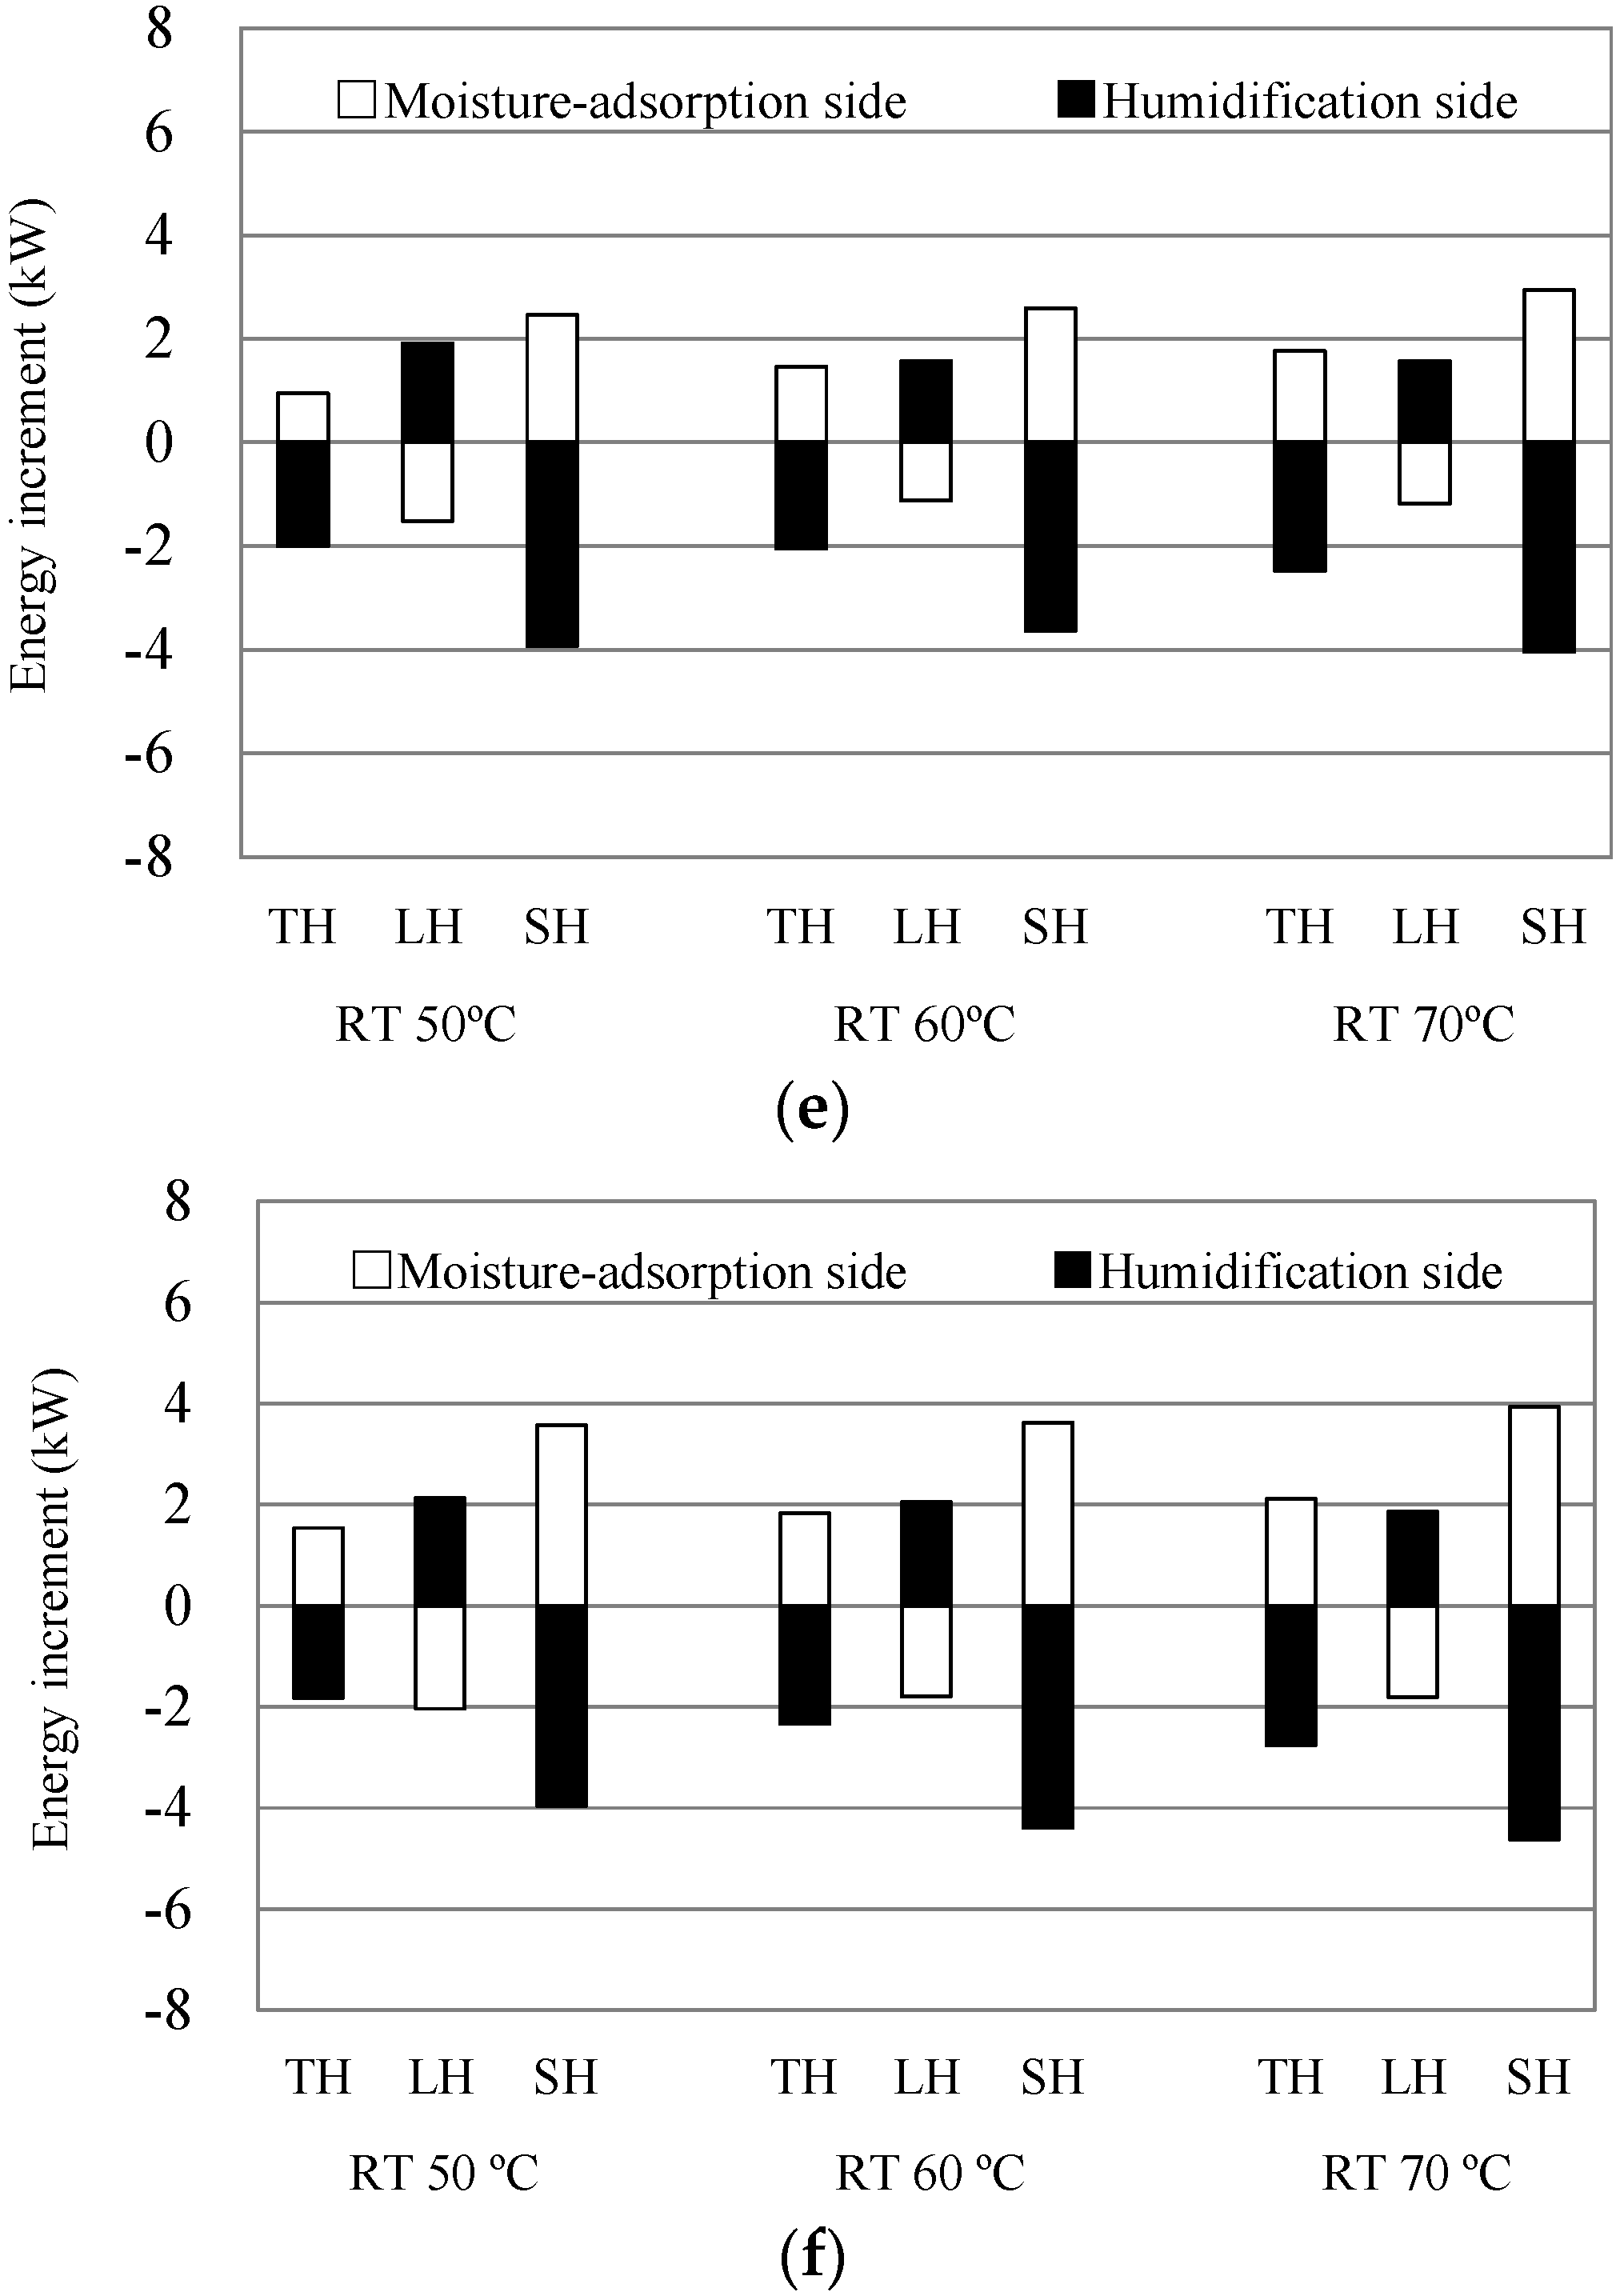
- Once the operation of the desiccant air-conditioning system becomes stable, the size of the latent-heat energy decrement on the moisture-adsorption side (point 1 → 6 in Figure 3b) becomes equal to the latent-heat energy increment on the humidification side (point 4 → 5 in Figure 3b). Each case in Figure 6 also shows that the increments and decrements in the latent-heat energy at the desiccant wheel are approximately equivalent.
- (4)
- Normally, both the level of moisture-adsorption and humidification of the desiccant wheel increase as the regeneration temperature increases. However, the levels of moisture-adsorption (size of the latent-heat energy decrement on the moisture-adsorption side) and humidification (size of the latent-heat energy increment on the humidification side) are almost constant in Figure 6a,c,e,f, regardless of the regeneration temperature. The minimum values for the humidity ratio after moisture-adsorption (point 6 in Figure 3b) in all of the cases shown in Figure 5 range from 0.5 to 0.7 g/kg DA. Therefore, it can be concluded that the lowest possible humidity ratio after moisture-adsorption (point 6 in Figure 3b) in this experimental setup is 0.5 g/kg DA, and neither the level of dehumidification nor that of humidification can increase once this limit is reached. Most of the water vapor in the OA is adsorbed at this lower limit by the wheel and released to the humidification side, regardless of the regeneration temperature. On the other hand, in Figure 6b,d, both the level of moisture-adsorption and humidification increase slightly as the regeneration temperature increases. This is probably because the humidity ratio of the OA (point 1 in both Figure 5b,d) was high, and thus, the potential for moisture-adsorption was higher than in the other cases.
- (5)
- Comparison of Figure 6a–f shows that the level of humidification increases as the airflow rate on the moisture-adsorption side is increased with respect to the flow on the humidification side.
- (6)
- In all of the cases shown in Figure 6, the absolute value of the sensible-heat energy increment on the moisture-adsorption side, which should be nearly identical for all cases, is smaller than the absolute value of the sensible-heat energy decrement on the humidification side. A slight difference between the increment and decrement of the latent-heat energy is also observed, but it is small compared to that of the sensible-heat energy. Therefore, this difference between the increment and decrement of the sensible-heat energy is attributed to the difference between the gradients of the moisture-adsorption side (point 1 → 6 in Figure 3b) and humidification side (point 4 → 5 in Figure 3b) on the psychrometric charts (Figure 5). It is also attributed to the difference between the increment of the total heat energy on the moisture-adsorption side (point 1 → 6 in Figure 3b) and its decrement on the humidification side (point 4 → 5 in Figure 3b), as shown in Figure 6. These phenomena are assigned to the loss of sensible-heat energy (heat that is released from the air-conditioning system to the low-temperature OA during the winter) on the moisture-adsorption side. This loss of sensible-heat energy is caused by path point 1 → 6 → 7 on the moisture-adsorption side because it is not insulated, while path point 2 → 3 → 4 → 5 on the humidification side is insulated (see Figure 3b). Thus, if path point 1 → 6 → 7 on the moisture-adsorption side in Figure 3b were insulated, it can be expected that the air temperature of point 8 and the boiling temperature of the heat pump increase, which in turn improves the efficiency of the heat pump. In addition, no frost was observed on the evaporator side during any of the experiments.
3.2. Efficiency of the System
- (1)
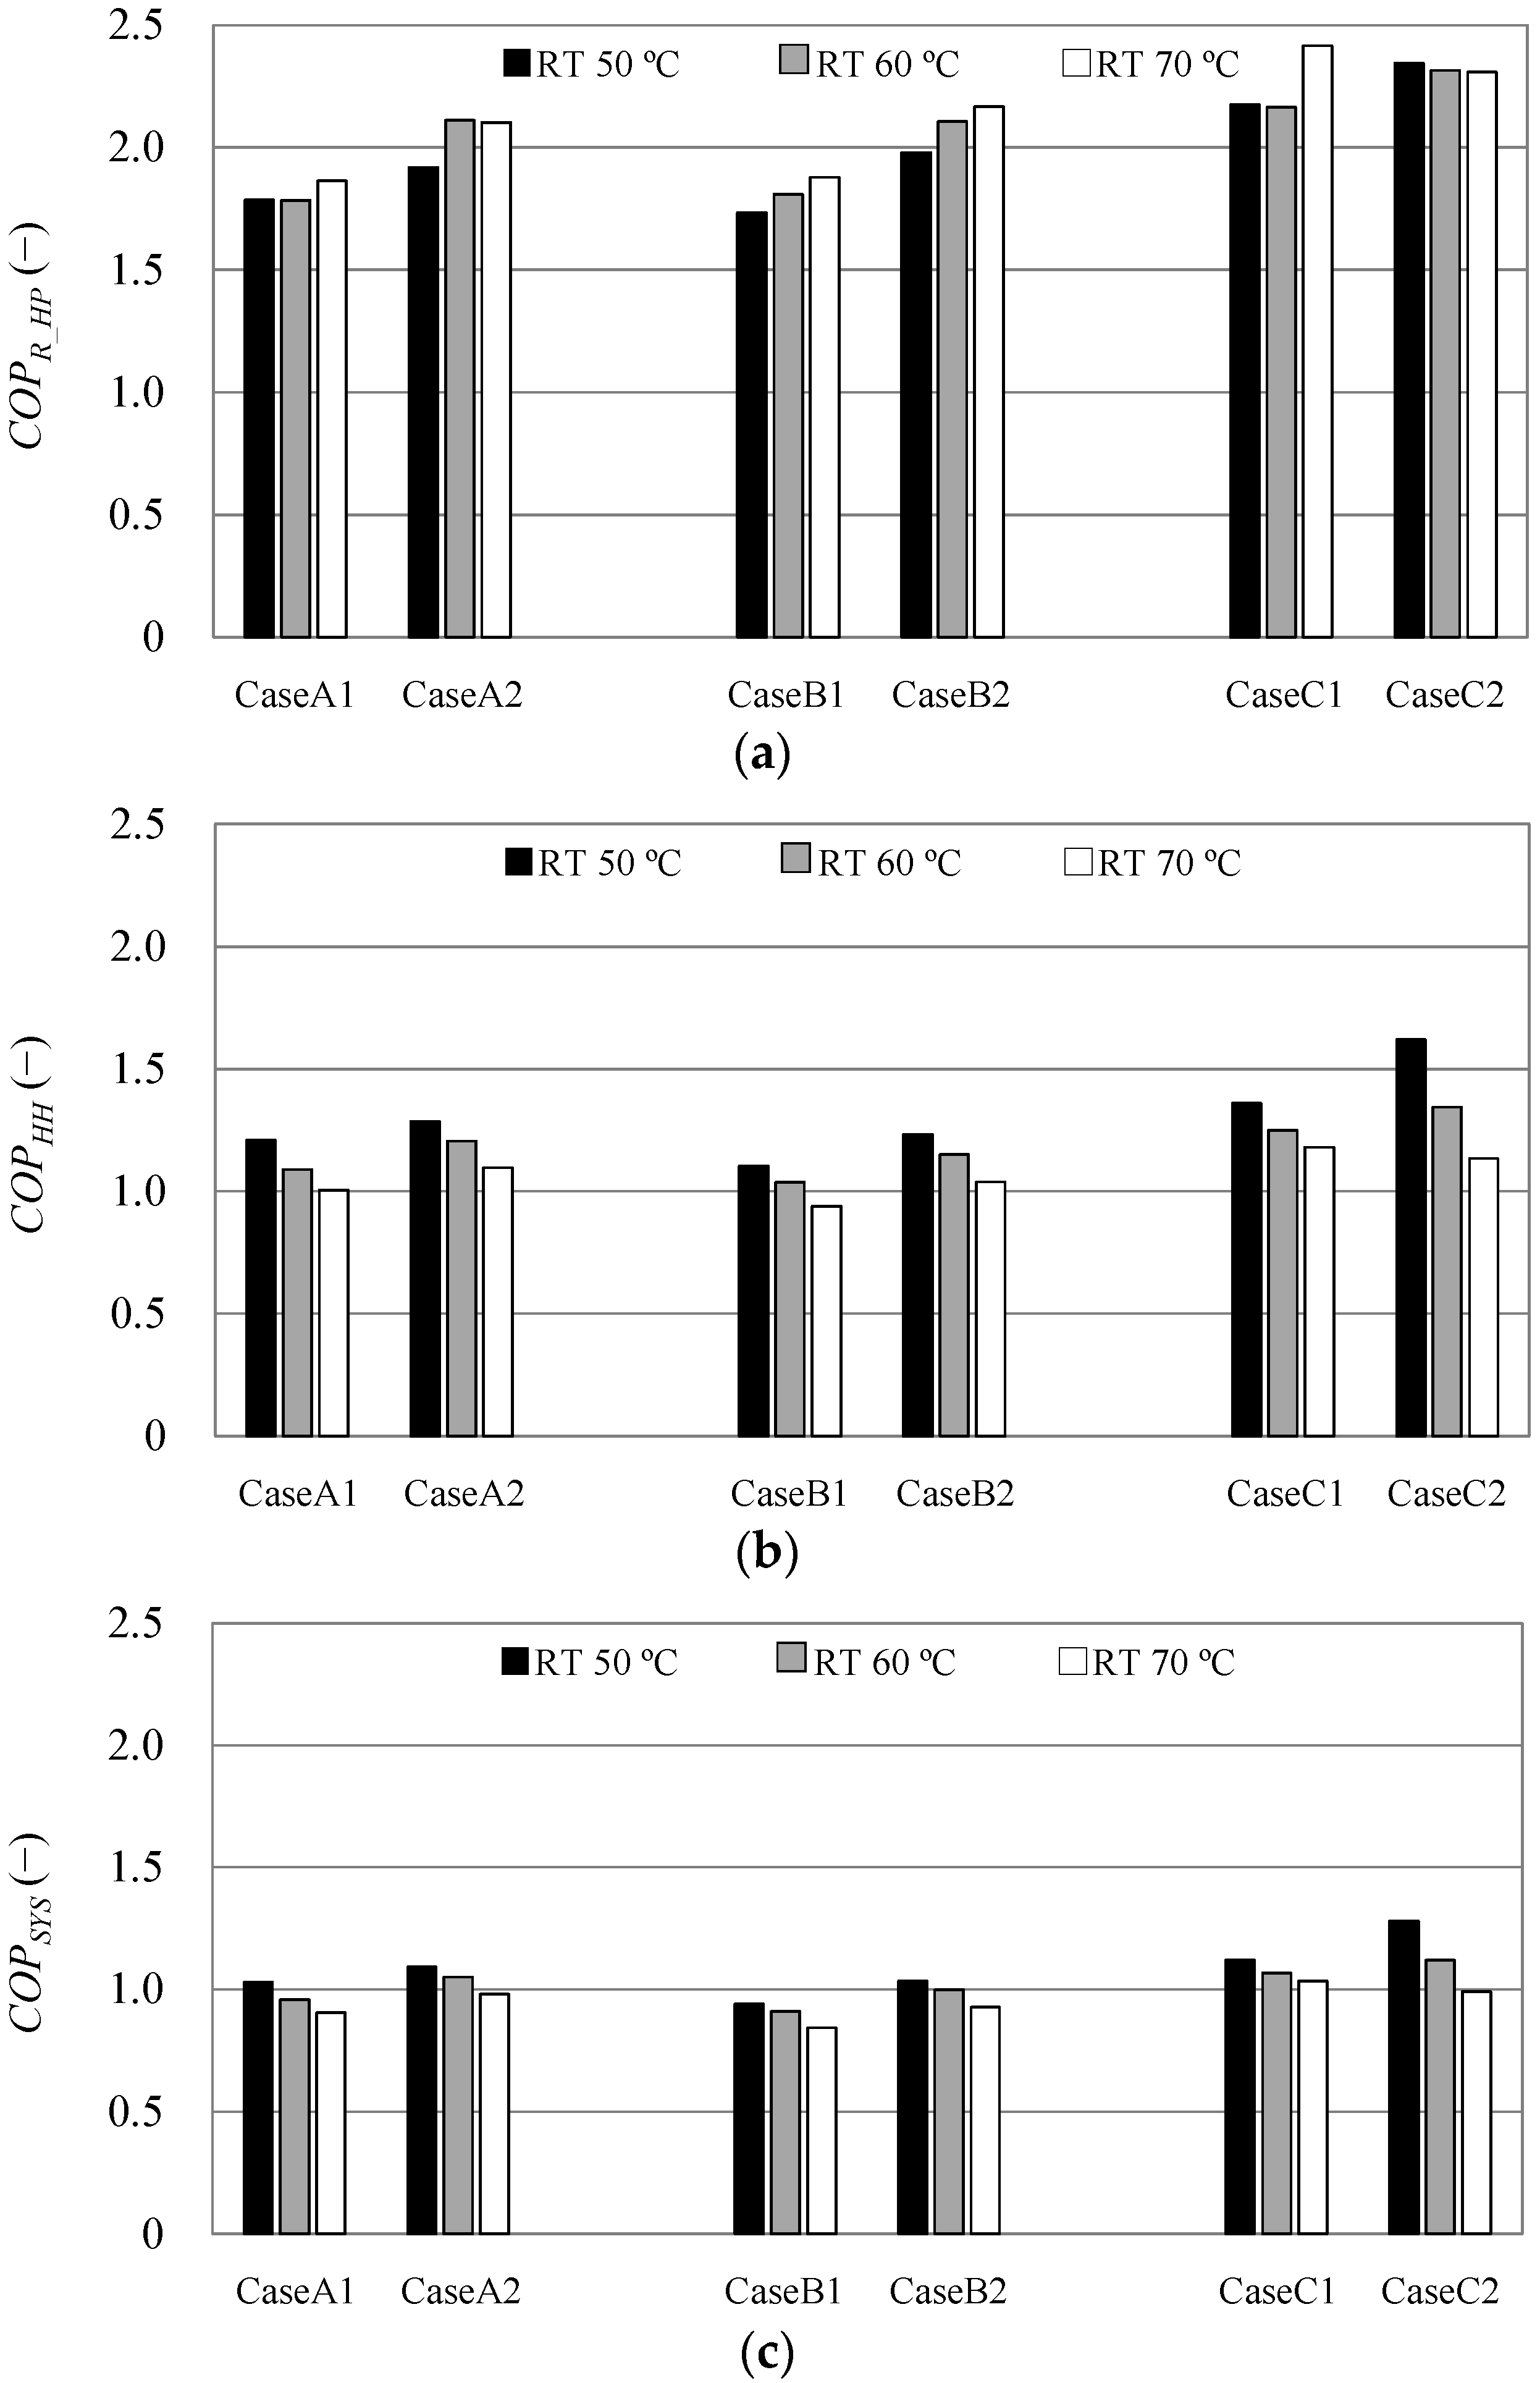
- The shape of the ducts and fans in this experimental setup were not optimized for winter operation, and therefore, the COPHH values were evaluated by only considering the heat pump for regeneration and the electric heater. In addition, the power consumption of the fan and rotating power of the wheel were excluded. Figure 7b indicates that the COPHH values range from 0.8 to 1.59, which are very low efficiency values for a heat-pump-assisted system. The possible causes for this are as follows:
- (a)
- The lines representing the moisture-adsorption side of the desiccant wheel (point 4 → 5 in Figure 3b) are more inclined towards the left-hand side than the isenthalpic line in the psychrometric charts (Figure 4), indicating a substantial enthalpy loss, which is primarily caused by a transfer of sensible-heat energy from the humidification side to the moisture-adsorption side. The enthalpy transferred from the humidification side (the regeneration side during summer operation) to the moisture-adsorption side (the process side during summer operation) occurs because of the rotation of the desiccant wheel, regardless of the season. Compared to the summer operation for dehumidification, the air temperature in the moisture-adsorption side and the temperature of the OA are relatively low during winter operation, and thus, the heat released from the humidification side to the moisture-adsorption side and OA is larger than that during summer operation. Figure 6 shows that the total heat loss on the humidification side increases as the regeneration temperature increases while all of the other conditions remain the same. This confirms that the temperature differential between the humidification and moisture-adsorption sides is the major cause of the total heat loss. Comparison of Figure 6a,b, Figure 6c,d, Figure 6e,f show that there are no significant difference in the total heat loss on the humidification side, even when the airflow rate on the moisture-adsorption side is increased. Regarding the effect of the rotating speed of the desiccant wheel, there is no substantial difference in the total heat-energy loss on the humidification side, as shown by comparing Figure 6a,c, Figure 6b,d. However, the total heat-energy losses are slightly greater at 10 rph (Cases B1 and B2) than at 5 rph (Cases A1 and A2). It is believed that the speed of the desiccant wheel affects the level of sensible-heat transportation.
- (b)
- The condensation temperature of the heat pump for regeneration is high at approximately 50 °C. The boiling temperature of the heat pump, which was estimated from the temperature measured at point 8 in Figure 3b, is low at 0 °C and below. This results in the low efficiency of the heat pump.
- (c)
- The heat pump was operating under a partial load.
- (2)
- For each case, as the regeneration temperature decreased, the operating rate of the low-efficiency electric heater was also decreased. Conversely, both the COPHH and COPSYS values tend to increase.
- (3)
- When the other conditions are the same, both the COPHH and COPSYS values increase faster as the airflow rate on the moisture-adsorption side increases with respect to the flow on the humidification side. It is concluded that the main reason for the improved efficiency is that the quantity of heat transferred from the heat pump condenser to the humidification side is approximately the same. This also causes the quantity of heat to cool the moisture-adsorption side to be approximately equal. The increasing temperature of point 8 in Figure 3 is due to the increased airflow rate on the moisture-adsorption side increasing the boiling temperature of the heat pump. The COPR_HP values are also higher when the airflow rate of the moisture-adsorption side is set at 1000 m3/h instead of 500 m3/h.
- (4)
- In Figure 7, a comparison of Cases A1 and B1, and Cases A2 and B2 shows that the COP values are slightly higher when the rotation speed of the desiccant wheel is 5 rph (Cases A1 and A2) instead of 10 rph (Cases B1 and B2). The differences between the total heat-energy losses on the humidification side, as previously discussed, are believed to affect these results. No overall tendency can be inferred from the results in Figure 7b for the effect of the rotation speed of the desiccant wheel on the COPR_HP value of the heat pump. The efficiency can be improved slightly by applying an optimal rotation speed to the desiccant wheel.
4. Conclusions
- (1)
- Even under OA conditions that were the equivalent of the outdoor winter conditions for designing an air-conditioning system, a humidity ratio of 5.8 g/kg DA or more was achieved for the SA by selecting the appropriate parameters, such as increasing the airflow rate on the moisture-adsorption side or increasing the regeneration temperature. In addition, it was confirmed that the system satisfied the minimum level of humidification performance required for a DOAS in Japan.
- (2)
- The configuration of the air-conditioning system was optimized for dehumidification, and therefore, the air leaking from the moisture-adsorption side to the humidification side substantially reduced the humidification performance. To use the desiccant air-conditioning system for winter humidification, its structure must be improved to minimize such leaks.
- (3)
- It is desirable to keep the sensible-heat exchange wheel stationary because the negative effects, which are due to the transportation of latent heat from the moisture-adsorption side to the humidification side by rotation, are greater than the adsorption heat recovered by the rotation of the sensible-heat exchange wheel.
- (4)
- In the case of a desiccant air-conditioning system that is combined with a heat pump for winter humidification, the moisture-adsorption side should be insulated to improve the efficiency of the heat pump for humidification-heating.
- (5)
- The COPSYS and COPR_HP values in an actual controlled operation will be higher than the ones shown in Figure 7 in most cases. The dew-points of SA were higher than the required one. To obtain the required dew point, an automatic controller would calculate and set a lower regeneration temperature than that in this experiment. Lower controlled regeneration temperature by automatic controller leads higher COPSYS and COPR_HP values by reducing the operation of the low efficient electric heater or the lower condensation temperature of the heat pump.
- (6)
- Air leakage on the humidification side (point 1 → 2 in Figure 3b) causes a larger amount of humidification at the set dew-point of SA in an actual controlled operation. A smaller amount of humidification due to no leakage requires a lower regeneration temperature lower. This also leads higher COPSYS and COPR_HP values by reducing the operation of the low efficient electric heater or the lower condensation temperature of the heat pump. Improvement rate of the COPSYS and COPR_HP values depends on outdoor air conditions.
- (7)
- The lowest possible humidity ratio after moisture-adsorption with this system was 0.5 g/kg DA. Neither the level of moisture-adsorption nor that of humidification was improved by increasing the regeneration temperature once this limit was reached.
- (8)
- By increasing the airflow rate of the moisture-adsorption side with respect to the rate on the humidification side, the level of humidification increased approximately in proportion to the increase in the airflow rate on the moisture-adsorption side.
- (9)
- The COPR_HP, COPHH, and COPSYS values were also improved when the airflow rate on the moisture-adsorption side was increased with respect to the flow on the humidification side.
- (a)
- The boiling temperature of the evaporator of the heat pump used for humidification-heating at the downstream of the moisture-adsorption side rises, thereby increasing the efficiency of the heat pump.
- (b)
- In addition, increasing the boiling temperature of the evaporator can minimize the possibility of frost.
- (c)
- A high humidity ratio in the SA can be achieved, even when the humidity ratio of the OA is low. This makes it possible to restrict the regeneration temperature to low values to obtain the same humidity ratio at the outlet, which also reduces the input energy.
- (d)
- Controlling the level of humidification (dew-point of the SA) by varying the regeneration temperature can reduce the operating rate of the low-efficiency electric heater when the heat-pump capacity is insufficient. Even when its capacity is sufficient and the electric heater is not operating, reducing the compressor speed increases the boiling temperature when under a constant condensation temperature. This is expected to increase the scale of the efficiency improvements. When the humidity ratio of the OA is low, the moisture is only adsorbed to the adsorption limit of the desiccant wheel, even if the regeneration temperature is increased. By setting the humidity ratio after moisture-adsorption to the adsorption limit (0.5 g/kg DA in the case of this study) to control the lower limit of the regeneration temperature, it is possible that unnecessary energy inputs can be avoided.
Author Contributions
Conflicts of Interest
Nomenclature
| σT | Ratio of temperature differences, dimensionless value |
| TN | Dry-bulb temperature at the measuring point N in Figure 3b, °C |
| σX | Ratio of humidity ratio differences, dimensionless value |
| XN | Humidity ratio at the measuring point N in Figure 3b, kg/kg DA |
| EITH_M-A | Total heat increment of desiccant wheel on the moisture-adsorption side, kW |
| HN | Enthalpy at the measuring point N in Figure 3b, kJ/kg |
| QN | Airflow rate at the measuring point N in Figure 3b, m3/s |
| ρN | Density of moist air at the measuring point N in Figure 3b, kg/m3 |
| EISH_M-A | Sensible heat increment of desiccant wheel on the moisture-adsorption side, kW |
| cpA | Specific heat of air, kJ/(kg·K) |
| EILH_M-A | Latent heat increment of desiccant wheel on the moisture-adsorption side, kW |
| EITH_H | Total heat increment of desiccant wheel on the humidification side, kW |
| EISH_H | Sensible heat increment of desiccant wheel on the humidification side, kW |
| EILH_H | Latent heat increment of desiccant wheel on the humidification side, kW |
| COPR_HP | Heating efficiency of the heat pump for regeneration, dimensionless value |
| COPHH | Humidification-heating efficiency on the heat-source side, dimensionless value |
| ER_HP | Electric energy consumption of the heat pump for regeneration, kW |
| ER_EH | Electric energy consumption of electric heater, kW |
| COPSYS | Humidification-heating efficiency of the whole system, dimensionless value |
| EF | Electric energy consumption of the fans (fan on the moisture-adsorption side and supply fans in Figure 3b), kW |
| EW | Electric energy consumption of the rotating motor for the desiccant wheel, kW |
References
- Burge, S.; Hedge, A.; Wilson, S.; Bass, J.H.; Robertson, A. Sick building syndrome: A study of 4373 office workers. Ann. Occup. Hyg. 1987, 31, 493–504. [Google Scholar] [CrossRef] [PubMed]
- Bluyssen, P.M.; Cox, C.; Seppänen, O.; de Oliveira Fernandes, E.; Clausen, G.; Müller, B.; Roulet, C.A. Why, when and how do HVAC-systems pollute the indoor environment and what to do about it? The European AIRLESS project. Build. Environ. 2003, 38, 209–225. [Google Scholar] [CrossRef]
- Wolfe, E.I. Desiccants’ Experimental Performance Characteristics and Effectiveness as an Air Conditioning System. Master’s Thesis, Lehigh University, Bethlehem, PA, USA, 1 December 1993. [Google Scholar]
- Tsay, Y.S.; Kato, S.; Ooka, R.; Koganei, M.; Nishida, K.; Kawamoto, K. Study on noncondensing air-conditioning system performance when combining a desiccant cooling system with a CO2 heat pump. Hvac R Res. 2006, 12, 917–933. [Google Scholar] [CrossRef]
- Liu, X.; Jiang, Y. Application of liquid desiccant system. In Desiccant-Assisted Cooling: Fundamentals and Applications; Nóbrega, C.E.L., Brum, N.C.L., Eds.; Springer: London, UK, 2014; pp. 249–281. [Google Scholar]
- Li, Z.; Liu, X.; Jiang, Y.; Chen, X. New type of fresh air processor with liquid desiccant total heat recovery. Energy Build. 2005, 37, 587–593. [Google Scholar] [CrossRef]
- Mumma, S.A. Designing dedicated outdoor air systems. ASHRAE J. 2001, 43, 28–32. [Google Scholar]
- Liu, W.; Lian, Z.; Radermacher, R.; Yao, Y. Energy consumption analysis on a dedicated outdoor air system with rotary desiccant wheel. Energy 2007, 32, 1749–1760. [Google Scholar] [CrossRef]
- Murphy, J. Smart dedicated outdoor air systems. ASHRAE J. 2006, 48, 30–37. [Google Scholar]
- Dieckmann, J.; Roth, K.W.; Brodrick, J. Dedicated outdoor air systems. ASHRAE J. 2003, 45, 58–59. [Google Scholar]
- Ruivo, C.R.; Hernández, F.F.; López, J.M.C. Influence of the desiccant wheel effectiveness method approaches, with fix and variable effectiveness parameters, on the performance results of an airport air-conditioning system. Energy Convers. Manag. 2015, 94, 458–471. [Google Scholar] [CrossRef]
- Kim, M.H.; Park, J.Y.; Park, J.S.; Jeong, J.W. Application of desiccant systems for improving the performance of an evaporative cooling-assisted 100% outdoor air system in hot and humid climates. J. Build. Perform. Simul. 2015, 8, 173–190. [Google Scholar] [CrossRef]
- Ge, G.; Xiao, F.; Xu, X. Model-based optimal control of a dedicated outdoor air-chilled ceiling system using liquid desiccant and membrane-based total heat recovery. Appl. Energy 2011, 88, 4180–4190. [Google Scholar] [CrossRef]
- Niu, X.; Xiao, F.; Ge, G. Performance analysis of liquid desiccant based air-conditioning system under variable fresh air ratios. Energy Build. 2010, 42, 2457–2464. [Google Scholar] [CrossRef]
- Jain, S.; Tripathi, S.; Das, R.S. Experimental performance of a liquid desiccant dehumidification system under tropical climates. Energy Convers. Manag. 2011, 52, 2461–2466. [Google Scholar] [CrossRef]
- Katejanekarn, T.; Kumar, S. Performance of a solar-regenerated liquid desiccant ventilation pre-conditioning system. Energy Build. 2008, 40, 1252–1267. [Google Scholar] [CrossRef]
- Humidification. Available online: http://www.daikinaircon.com/roomaircon/feature/kasitu (accessed on 20 March 2014).
- Zhang, L.; Dang, C.; Hihara, E. Performance analysis of a no-frost hybrid air conditioning system with integrated liquid desiccant dehumidification. Int. J. Refrig. 2010, 33, 116–124. [Google Scholar] [CrossRef]
- Kabeel, A.E. Dehumidification and humidification process of desiccant solution by air injection. Energy 2010, 35, 5192–5201. [Google Scholar] [CrossRef]
- Liu, X.; Li, Z.; Jiang, Y.; Lin, B. Annual performance of liquid desiccant based independent humidity control HVAC system. Appl. Therm. Eng. 2006, 26, 1198–1207. [Google Scholar] [CrossRef]
- De Antonellis, S.; Intini, M.; Joppolo, C.M.; Molinaroli, L.; Romano, F. Desiccant wheels for air humidification: An experimental and numerical analysis. Energy Convers. Manag. 2015, 106, 355–364. [Google Scholar] [CrossRef]
- La, D.; Dai, Y.; Li, H.; Li, Y.; Kiplagat, J.K.; Wang, R. Experimental investigation and theoretical analysis of solar heating and humidification system with desiccant rotor. Energy Build. 2011, 43, 1113–1122. [Google Scholar] [CrossRef]
- Wada, K.; Mashimo, K.; Takahashi, M.; Tanaka, K.; Toya, S.; Tateyama, R.; Miyamoto, K.; Yamaguchi, M. Desiccant humidity control system using waste heat of water source heat pump. Trans. Jpn. Soc. Refrig. Air Cond. Eng. 2011, 26, 501–510. [Google Scholar]
- Fukudome, J. Desiccant Air Conditioner. U.S. Patent Application 13/583,354, 9 March 2011. [Google Scholar]
- Mathiprakasam, B. Hybrid Vapor Compression and Desiccant Air Conditioning System. U.S. Patent No 4,430,864, 14 February 1984. [Google Scholar]
- Purushothama, B. 3-Different Types of Humidification. In Humidification and Ventilation Management in Textile Industry; Elsevier Ltd.: San Diego, CA, USA, 2009; pp. 22–40. [Google Scholar]
- Farley, R.D.; Franklin, D.H. Development of a humidifier for patient ventilation using a semi-permeable tube to minimize system condensate. J. Biomed. Eng. 1992, 14, 426–430. [Google Scholar] [CrossRef]
- Vesley, D.; Anderson, J.; Halbert, M.M.; Wyman, L. Bacterial output from three respiratory therapy humidifying devices. Respir. Care 1979, 24, 228–234. [Google Scholar] [PubMed]
- Thorn, A. Case study of a sick building: Could an integrated bio-psycho-social perspective prevent chronicity? In Proceedings of the Qualitative Evidence-Based Practice Conference, Coventry University, Coventry, UK, 15–17 May 2000.
- Strindehag, O.; Josefsson, I.; Henningson, E. Emission of bacteria from air humidifiers. Environ. Int. 1991, 17, 235–241. [Google Scholar] [CrossRef]
- Seppänen, O.; Fisk, W. Association of ventilation system type with SBS symptoms in office workers. Indoor Air 2002, 12, 98–112. [Google Scholar] [CrossRef] [PubMed]
- Oie, S.; Masumoto, N.; Hironaga, K.; Koshiro, A.; Kamiya, A. Microbial contamination of ambient air by ultrasonic humidifier and preventive measures. Microbios 1991, 72, 161–166. [Google Scholar]
- Xu, Z.; Xiao, Y.; Wang, Y. Experimental and theoretical studies on air humidification by a water spray at elevated pressure. Appl. Therm. Eng. 2007, 27, 2549–2558. [Google Scholar] [CrossRef]
- Thörn, Å. The sick building syndrome: A diagnostic dilemma. Soc. Sci. Med. 1998, 47, 1307–1312. [Google Scholar]
- Thörn, Å. Case study of a sick building. Eur. J. Public Health 2000, 10, 133–137. [Google Scholar]
- Rozej, A.; Dudzinska, M.R.; Gaska-Jedruch, U. Seasonal variation and size distribution of bioaerosols in an air-conditioned auditorium—A case study. Manag. Indoor Air Qual. 2011, 21, 21–40. [Google Scholar]
- Farnsworth, J.E.; Goyal, S.M.; Kim, S.; Kuehn, T.H.; Raynor, P.C.; Ramakrishnan, M.A.; Anantharaman, S.; Tang, W. Development of a method for bacteria and virus recovery from heating, ventilation, and air conditioning (HVAC) filters. J. Environ. Monit. 2006, 8, 1006–1013. [Google Scholar] [CrossRef] [PubMed]
- Dahl, E. Physicochemical aspects of disinfection of water by means of ultrasound and ozone. Water Res. 1976, 10, 677–684. [Google Scholar] [CrossRef]
- Kelly, D.; Kelly-Winterberg, K.; Sherman, D.; South, S. Rapid Sterilization of an Air Filter Medium. U.S. Patent Application 10/491,767, 2 February 2002. [Google Scholar]
- Feldman, P.L.; Helfritch, D.J. Air Filter with Combined Enhanced Collection Efficiency and Surface Sterilization. U.S. Patent No. 6,245,132, 12 June 2001. [Google Scholar]
- Green, C.F.; Scarpino, P.V. The use of ultraviolet germicidal irradiation (UVGI) in disinfection of airborne bacteria. Environ. Eng. Policy 2001, 3, 101–107. [Google Scholar] [CrossRef]
- Noakes, C.J.; Fletcher, L.A.; Beggs, C.B.; Sleigh, P.A.; Kerr, K.G. Development of a numerical model to simulate the biological inactivation of airborne microorganisms in the presence of ultraviolet light. J. Aerosol. Sci. 2004, 35, 489–507. [Google Scholar] [CrossRef]
- Ruivo, C.R.; Angrisani, G.; Minichiello, F. Influence of the rotation speed on the effectiveness parameters of a desiccant wheel: An assessment using experimental data and manufacturer software. Renew. Energ. 2015, 76, 484–493. [Google Scholar] [CrossRef]
- Ruivo, C.R.; Costa, J.J.; Figueiredo, A.R.; Kodama, A. Effectiveness parameters for the prediction of the global performance of desiccant wheels—An assessment based on experimental data. Renew. Energ. 2012, 38, 181–187. [Google Scholar] [CrossRef]
© 2016 by the authors; licensee MDPI, Basel, Switzerland. This article is an open access article distributed under the terms and conditions of the Creative Commons by Attribution (CC-BY) license (http://creativecommons.org/licenses/by/4.0/).
Share and Cite
Kawamoto, K.; Cho, W.; Kohno, H.; Koganei, M.; Ooka, R.; Kato, S. Field Study on Humidification Performance of a Desiccant Air-Conditioning System Combined with a Heat Pump. Energies 2016, 9, 89. https://doi.org/10.3390/en9020089
Kawamoto K, Cho W, Kohno H, Koganei M, Ooka R, Kato S. Field Study on Humidification Performance of a Desiccant Air-Conditioning System Combined with a Heat Pump. Energies. 2016; 9(2):89. https://doi.org/10.3390/en9020089
Chicago/Turabian StyleKawamoto, Koichi, Wanghee Cho, Hitoshi Kohno, Makoto Koganei, Ryozo Ooka, and Shinsuke Kato. 2016. "Field Study on Humidification Performance of a Desiccant Air-Conditioning System Combined with a Heat Pump" Energies 9, no. 2: 89. https://doi.org/10.3390/en9020089