
The Health Costs of Revised Coal Mining Limits in Northern Bohemia

Charles University Environment Center, Jose Martiho 2, 160 00 Prague 6, Czech Republic
*
Author to whom correspondence should be addressed.
Energies 2016, 9(2), 81; https://doi.org/10.3390/en9020081
Submission received: 21 November 2015
/
Revised: 20 January 2016
/
Accepted: 21 January 2016
/
Published: 27 January 2016
Abstract
:Brown coal has been the major source of energy for more than 150 years for the Czech economy, but its role in the coming decades is nowadays the source of heated debate. Many of the recurring discussions address the coal reserves that were set aside in 1991 in order to halt the massive destruction of the landscape and the unprecedented deterioration of the human environment in Northern Bohemia. We study the proposed variants of the revised mining limits using the impact-pathway approach in order to quantify and monetize the health effects of airborne emissions from coal mining and the use of extracted coal for the production of electricity and heat. We find that the dominant health impacts associated with the revision of the limits, estimated to be up to 7 billion euros over the 2015–2050 period, will stem from the use of coal for the production of electricity and heat and that a large part of the impact will be borne by populations outside the Czech Republic.
1. Introduction
Brown coal has been the most important of the primary energy sources in the Czech Republic for decades, in particular for electricity generation. Its share among primary sources has been decreasing, however, from 36.6% in 2000 to 28.9% in 2013, although it still accounts for over 40% of gross electricity production. A particular feature of the Czech energy system is the large scale deployment of district heating systems that compete with power plants for available brown coal. It is therefore no doubt that the availability of brown coal is a key issue in current energy policy considerations. The declining annual coal extraction trend is largely determined by diminishing exploitable reserves, but also the generally decreasing quality of coal (lower calorific value, higher sulphur and ash content) also plays a role.
For the last five years the Ministry of Industry and Trade has been working on an update of the 2004 National Energy Policy, a key policy document setting the long-term priorities for the development of the Czech energy sector. In spite of the fact that the first draft was published already in 2010, and a revised version in 2012 and 2014, the update was finally adopted by Czech government only in May 2015. The key priority of the National Energy Policy following the 2015 update (“NEP2015”) is “a balanced mix of primary energy sources and sources for electricity generation based on a broad portfolio, the effective use of all available domestic energy sources and maintaining a surplus in the energy system output balance with sufficient reserves” [1].
The NEP2015 foresees an increase in decentralized energy generation and renewables (biomass in the first place), and at the same time a gradual phasing out of coal-fired plants due to outdated technology, lack of compliance with emission limits set by Industrial Emission Directive and a shrinking brown coal supply. In particular, the shrinking reserves of domestic brown coal within the existing mining limits are seen as a potentially major limiting factor.
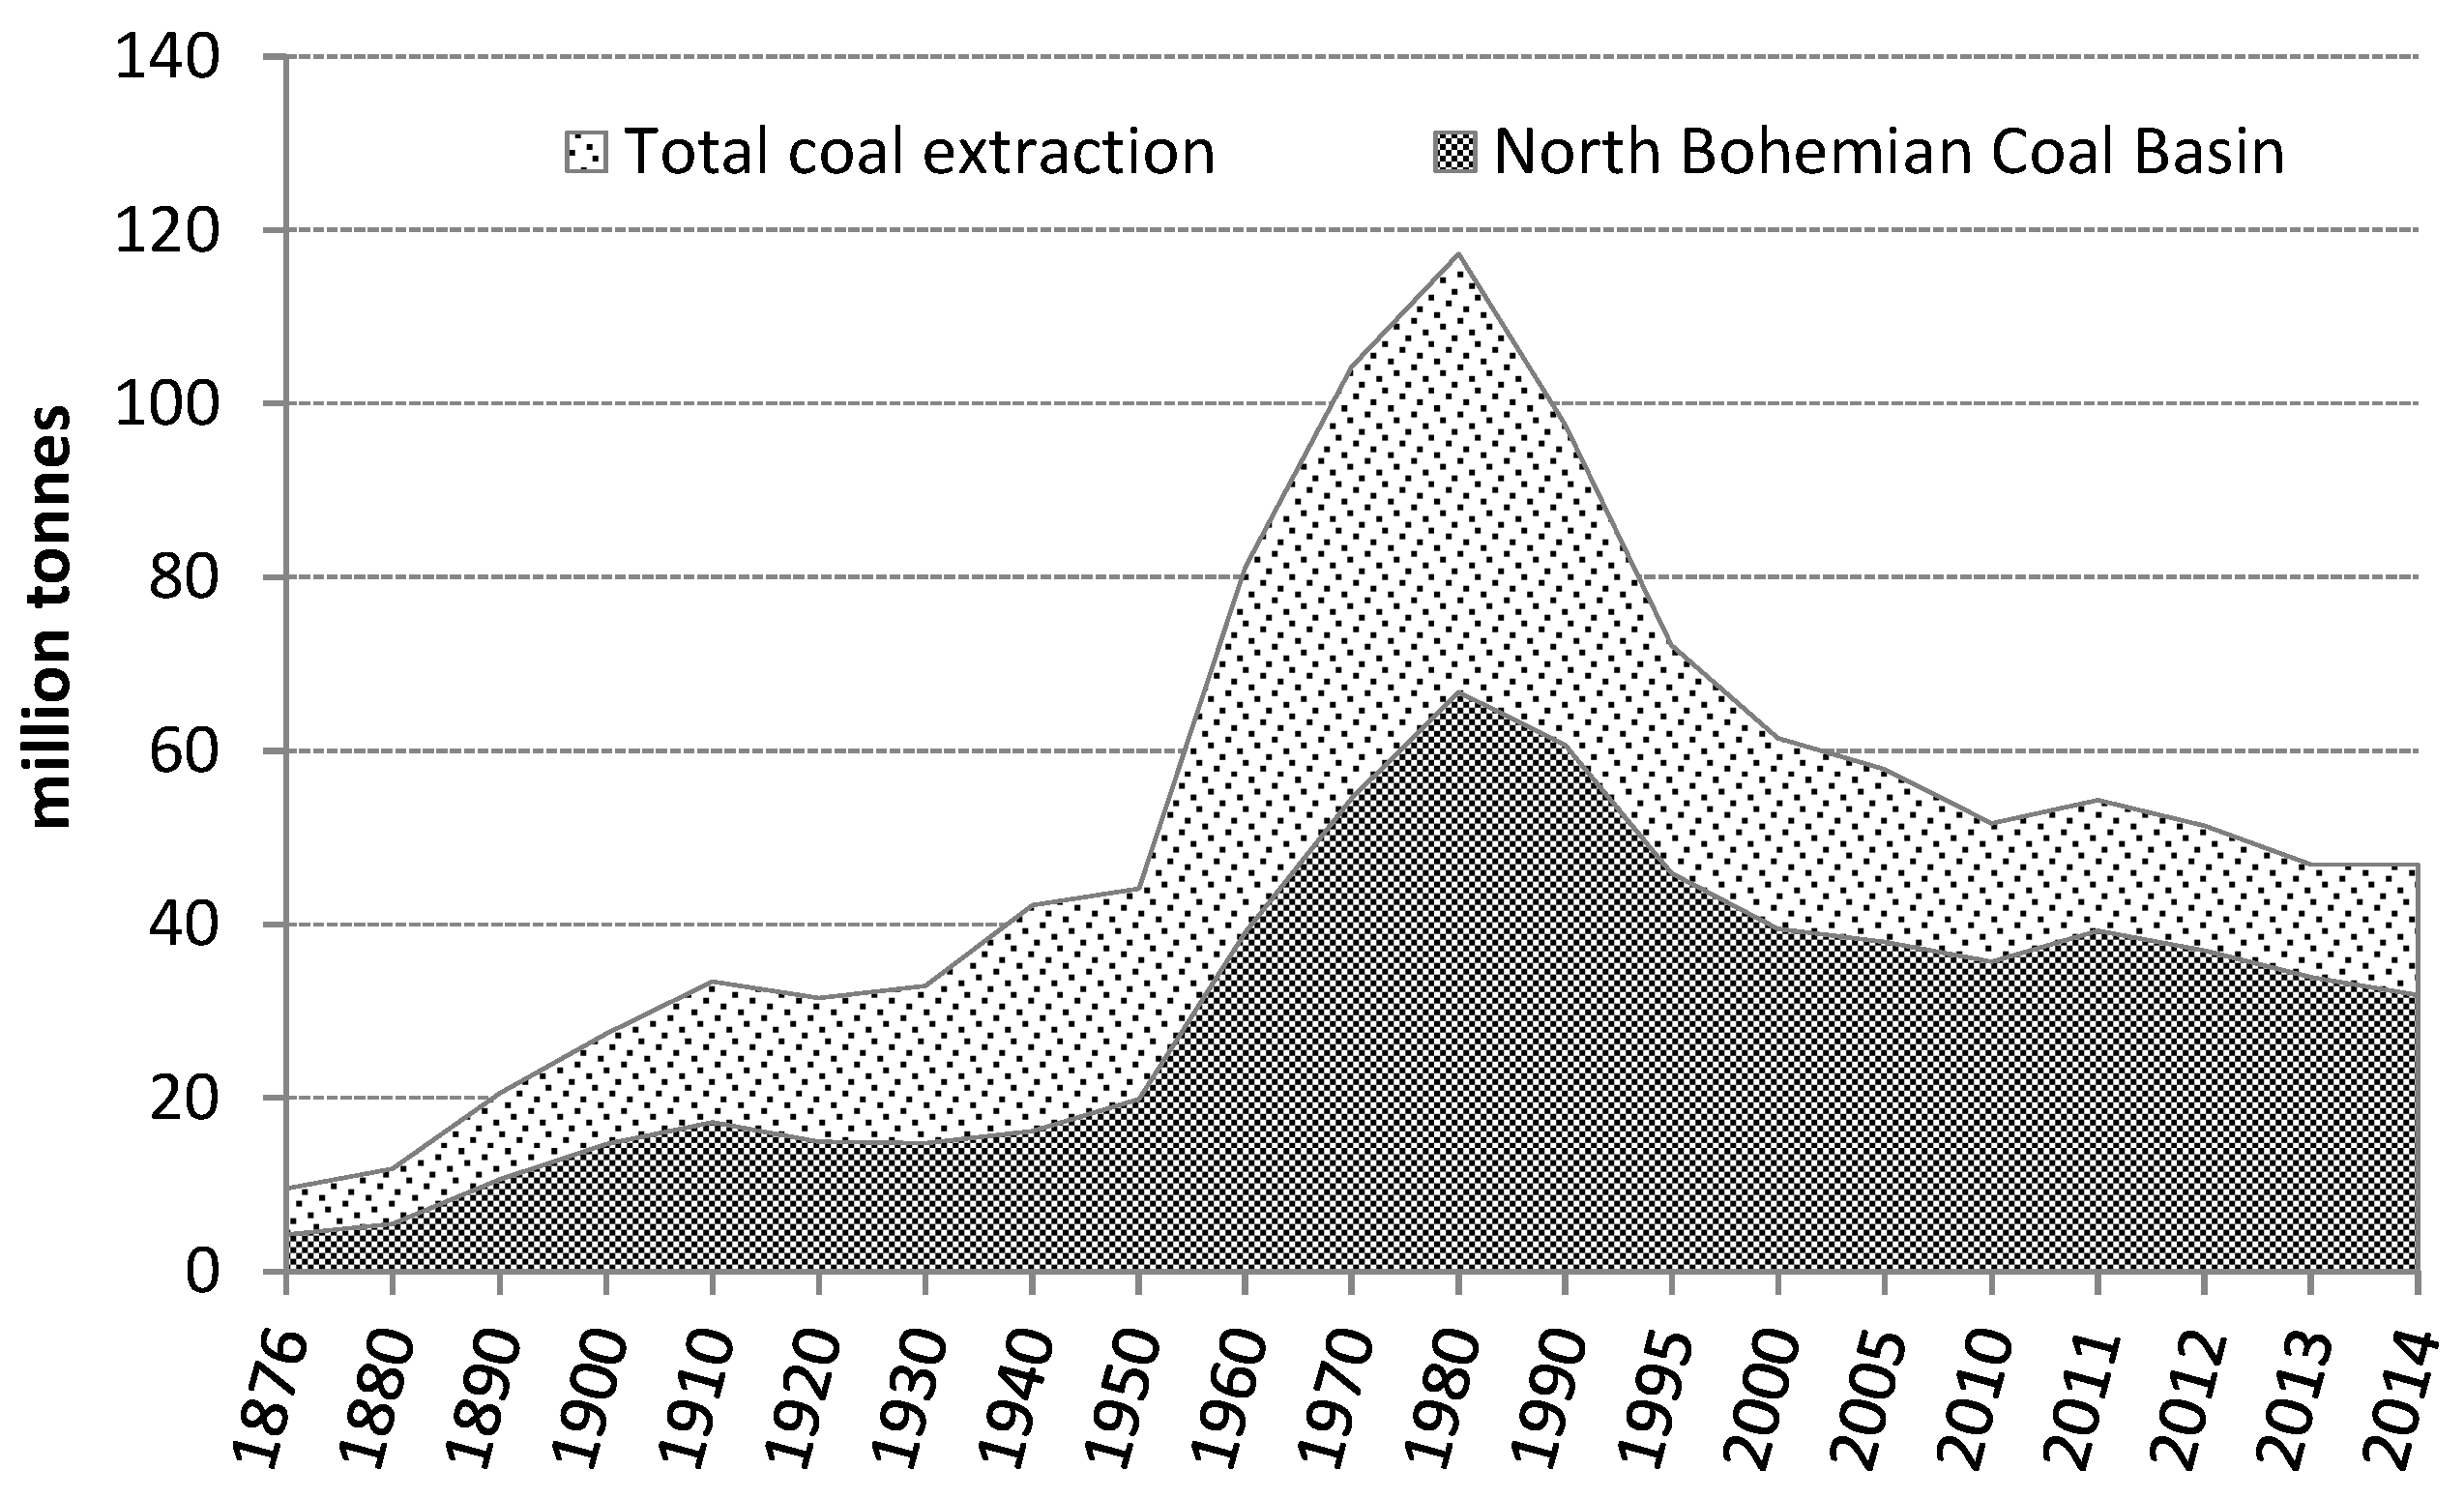
The main brown coal deposits in the Czech Republic are located in the North Bohemian Brown Coal Basin in the foothills of the Ore Mountains, a natural border with Germany. The mining activities accelerated greatly in the 1950s and 1960s (see Figure 1), and together with the associated industrial production (electricity and heat generation, oil processing, heavy chemistry, etc.) they imposed a huge burden on the people and environment of the region, a part of the infamously renown Black Triangle. It was only in 1991, shortly after the collapse of the Soviet bloc, that the Czech government decided to curtail the opencast mining in the region. A Government Resolution in 1991 imposed mining limits in six mining locations in the North Bohemian Brown Coal Basin. Mining authorities were obliged to modify mining areas and write-off the coal reserves. This has been accomplished in all but two mines—Czechoslovak Army (henceforth “CSA”) and Bilina. If the mining limits were revoked at these two mines, about 400 million tonnes of brown coal would become available for future mining.
Figure 1.
Coal mining in the Czech Republic (black, brown coal and lignite).
The mining limits were meant to set “unbreakable spatial borders beyond which mining or energy production activities cannot directly disturb and destroy natural elements that constitute the territorial system of landscape ecological stability, residential structures and infrastructure safeguarding the liveability of the territory and the maximum permissible pressures on key environmental elements—soil, water and air” [2]. The mining limits were to be reflected in the National Energy Policy until 2005, and it was originally anticipated that these would be revisited during the drafting of a new energy policy to see if there were any more environmentally-friendly alternatives to open-cast mining that could possibly be used. Yet, a powerful lobby of mining companies, mining trade unions and the Ministry of Industry and Trade continued to press for the abolition of the coal mining limits in the two mines by drawing a gloomy picture of massive unemployment in the region (and beyond) without the mines and arguing that brown coal is the only abundant domestic energy source and as such would bolster national energy security. In spite of this lobby, the National Energy Policy of 2004 was adopted in a version that kept the limits in place. During the governmental discussions about the recent update of the National Energy Policy, it was repeatedly argued that any decision that may interfere with the mining limits should be preceded by proper analyses of the economic, social and environmental consequences of repealing the limits.
So far, the market has coped well with the declining annual volumes of brown coal being extracted, but concerns about the future of district heating systems and energy security in general poses a challenge to decision-makers. If the coal mining limits are preserved in their current state, it is expected that by 2038 the only brown coal mine to remain in operation would be Vrsany; its reserves can last until around 2060. The overall situation regarding future demand and the supply of domestic brown coal depicting the potential gains from three recently discussed mining limit revision options is illustrated in Figure 2.
Figure 2.
Domestic brown coal supply and demand for heat and electricity production under the revised mining limits [3].
Figure 2.
Domestic brown coal supply and demand for heat and electricity production under the revised mining limits [3].
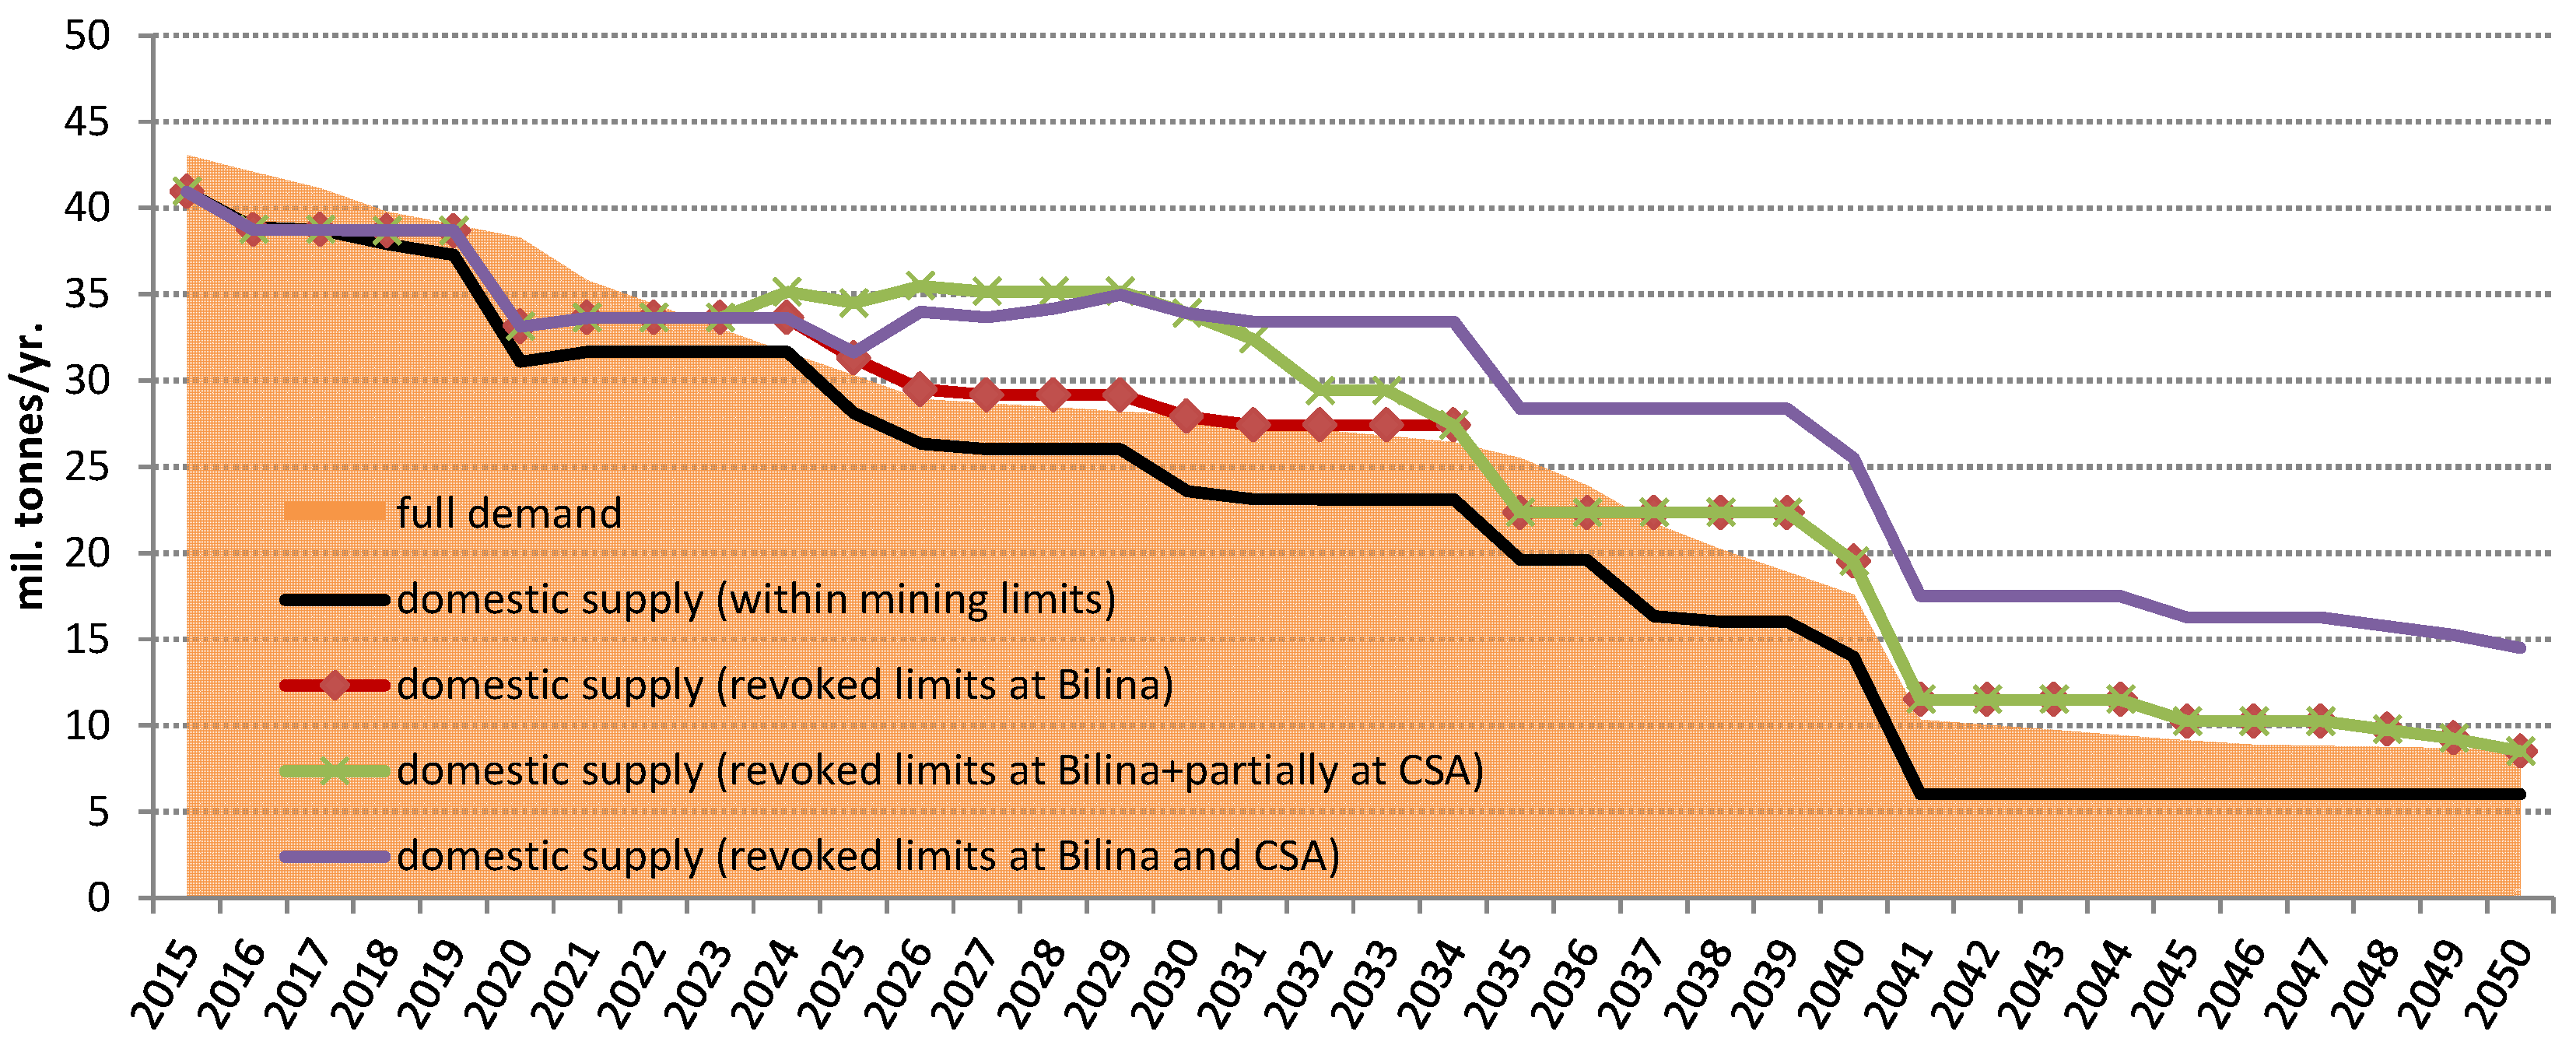
The figure suggests that the pace with which the coal reserves within the mining limits will be depleted is greater than the planned gradual decommissioning of the power and heating plants. While questioned by some experts, it provides strong argumentation to Ministry of Industry and Trade to abolish (at least one of) the mining limits, although this is not openly advocated in the NEP2015.
There are two important external drivers, apart from the mining limits, that exert pressure for the gradual abandonment of brown coal mining and its use for energy generation in the not too distant future. The first concerns the EU leaders’ commitment to reduce CO2 emissions by 80%–95% by 2050 (compared to 1990) that led the European Commission in early 2015 to announce the Energy Union Package aimed at creating a sustainable, low-carbon and climate-friendly energy system. It claims, inter alia, that “we have to move away from an economy driven by fossil fuels, an economy where energy is based on a centralised, supply-side approach” [4]. Clearly, decarbonisation of the economy is one of the five key dimensions of the Energy Union strategy, although the means to achieve this goal are (mostly) old ones—an emission trading scheme, renewable energy targets and direct support schemes.
A second driver, acting through interconnected electricity networks and markets, comes from neighbouring Germany where a massive energy transition package (Energiewende) is being sought. This effort accelerated following the Fukushima nuclear accident in 2011 when 40% of nuclear generating capacity was closed down in Germany almost immediately, with the remaining units to be phased out by 2022. This decline was partly compensated with electricity from coal and as a consequence, brown coal accounted for a 29.5% share in energy sources for electricity production in 2012, the highest figure in a decade, but the share since then has shrank to 28.8% in 2014, according to the German Energy Balances Working Group (AGEB). The role of coal in the energy transition is still under discussion, with some arguing for the need to secure employment in coal mining regions. Yet a recent modelling study by the German Institute for Economic Research (DIW) [5] suggests that the construction of new brown/lignite coal power plants in Germany is not viable either from an economic, technical and environmental perspective. In addition, the study asserts that it is likely that a gradual phasing out of brown coal/lignite from the German electricity system will culminate in 2040–2045 with the closure of the last plants.
Hence, in light of these diverging interests, this article aims to illustrate the extent of the health impacts associated with a policy decision regarding mining limits. Our focus is limited here to the health impacts from airborne emissions related to coal mining and the burning of coal during electricity and heat generation that would be released were the coal reserves beyond the mining limits at coal mines Bilina and CSA to be extracted.
2. Previous Research
Over recent decades a great deal of environmental cost studies focused on quantifying the environmental and health effects of various energy generation pathways (fuel cycles) have been undertaken to establish monetary values that can be readily incorporated into public (and private) decision-making. A recent review [6] provides a critical methodological review for accounting for the true costs of electricity based on four influential primary costing studies conducted in the United States and the European Union [7,8,9,10,11].
Cost estimates are commonly made by either a damage function approach or an abatement cost approach. The first approach estimates the increase in health and environmental impacts by projecting changes in emissions and exposure to pollutants using a predefined set of exposure-response relationships; a valuation of welfare change due to any suffering from these effects is subsequently provided by specific (unit) values for respective health outcomes. The latter—abatement cost—approach examines the costs of achieving mandated emission limits, using it as a proxy for damage, i.e., assuming that the regulation mandates for the optimal level of pollution. This is essentially a very strong assumption because to establish an optimal level of regulation, an estimation of damage costs would be needed anyway. Consequently, the damage function approach is considered more appropriate if data are available.
A frequently used “shortcut” is the benefit-transfer that adapts engineering, environmental, or economic data from previous studies to a new study (assuming transferability between donor and transfer location and other characteristics). Even primary costing studies rely in some stages on a benefit transfer (e.g., in a valuation of impacts), but benefit-transfer studies commonly use benefit-transfer to skip some of the steps in the damage function approach (e.g., by using average values like euro or dollar per tonne of emission estimates from previous studies). Another example of a shortcut in the damage function approach can be illustrated by the stream of research on the health impacts of one open cast mining method—mountaintop removal (MTR)—in the Appalachian Mountains in the USA, showing that living near active MTR operations is associated with higher risks of cardiovascular, cardiopulmonary, lung, kidney and chronic respiratory diseases [12,13,14], mortality risks from lung, colorectal and bladder cancer and leukaemia [15,16], as well elevated risks of birth defects [17]. In a similar vein, the association between distance from mining activity and mortality from neoplasms was also observed in a study by Fernández-Navarro [18] and colleagues in Spain.
An important distinction among environmental costing studies arises from what activities (and related environmental burdens) preceding and following energy generation are included in the assessment. The two extreme options are to focus either on full life cycle or on generation only, the latter occurring much more frequently. Burtraw and colleagues [6] point out that analyses confined to just the electricity generation phase will underestimate the total burden while full life cycle may be quite complex and resource demanding, and suggest effective compromise by adding selectively those components of the fuel cycle that are likely to contribute significantly to the external cost estimates.
In several national implementations of the European ExternE methodology [11] coal mining was included in the coal fuel cycle assessment. In the German national implementation, the coal fuel cycles assessed include both underground and open pit mining (reference mines were in Ruhrgebiet for hard coal and Garzweiler mine for opencast mining). The latter variant uses electrically driven conveyor belts for transporting coal from the mine to the power plant. The study points to high emissions of particulates from the loading and unloading of coal/lignite (0.2 kg dust per tonne as provided by the German Umweltbundesamt), although these emissions are not taken into account in the impact assessment for their local impact. Discharges of effluents from mining activities are not quantified, although the authors note the potentially significant impacts on groundwater systems. Occupational health effects from brown coal opencast mining are considered to be very similar to average industrial activities (as opposed to underground mining). Other considered impacts include the negative effects of mining on aquatic ecosystems (low pH from sulphur) and the resettlement of local communities on the mine locality. About 95% of public health damage from the lignite fuel cycle, estimated at approx. 1.6 eurocents/kWh, come from power generation, with the remaining 5% from other fuel cycle stages.
The Spanish national implementation considered the coal fuel cycle with open cast coal mining in Puertollano. As in the German case, PM emissions from coal mining are considerable but it is expected that their impact will be low since they are emitted near ground level and are quickly deposited (presumably affecting only mine workers and these effects are accounted for as occupational health impacts). Like the German case, the overwhelming majority of estimated public health damage (2.6 eurocents/kWh) originates from power generation, while occupational health impacts from other fuel cycle stages bring an additional 0.24 eurocents/kWh.
In a Belgian case study, emissions from mining (coal imported from abroad) are taken from the ecoinvent life-cycle database and occupational health impacts were also quantified (although they are considered less important). Conversely, liquid effluents were not quantified, but it is acknowledged that they can play an important role. The results show that non-global warming impacts are by and large dominated by the public health impact from power generation, and especially by the chronic mortality impacts occurring at the regional scale.
A study on the external cost of coal conducted by the Dutch consultancy CE Delft for Greenpeace International [19,20] assessed the impacts on human health from air pollution, climate change damage, and fatalities due to major accidents in mining from a global perspective. Hence, instead of site-specific data they built upon emission factors from national inventories and the Life Cycle Assessment (LCA) database. They find that the overwhelming majority of external costs originates from emissions from coal combustion in power plants, with a central estimate of 365 billion euros, and mining emissions contributing an additional 674 million euros and occupational mining externalities (with part of these assumed to be internalised through insurance) 161 million euros.
Recently, the Health and Environment Alliance (HEAL) published a study on the health impacts of coal-fired power plants in Europe [21], claiming that EU-wide health impacts from coal combustion amount to more than 18,200 premature deaths, 8500 new cases of chronic bronchitis and over 4 million lost working days annually. This totals between 15.5–42.8 billion euros in the EU-27 per year (depending on what valuation metrics were used for premature mortality) or—denominated per kWh—on average between 6.2 and 95 eurocents.
Beyond the EU, Epstein et al. [22] addressed the full costs of the coal life cycle in the USA. They account for the external costs of different phases in the coal cycle—mining, transport, combustion—and impact categories, including land disturbance, emissions of air pollutants, carcinogens, mercury and greenhouse gases. The best estimate for externalities related to coal is 17.84 US cents per kWh (low and high estimates 9.42 and 26.89 US cents per kWh, respectively); slightly more than half of these externalities originate from emissions of air pollutants from combustion and a further quarter from the public health burden of communities in the Appalachian region where the mining takes place.
Mahapatra and colleagues [23] analysed the life-cycle environmental impacts of coal-based electricity generation in Ahmedabad in western India. They applied spatially resolved estimates of damage to human health, crops and building materials from coal mining and power plant operations. For source apportionment, the authors opted for the energy balance accounting approach (providing the amount of coal related emissions from the power sector) instead of receptor modelling conventionally used in the impact-pathway approach. Coal mining impacts were calculated as the sum of impacts from mine fires, mine dust emissions, and fugitive (methane) and CO2 emissions. The authors estimated the external costs of mining at around 12 paisa per kWh (approximately 0.27 US cents per kWh) and the overall external costs of electricity generation at around 206.8 paisa per kWh (4.6 US cents per kWh).
Nkambule and Blignaut [24] analysed the external costs of coal mining and transportation to the Kusile power plant near Emelahleni in South Africa. They quantify the external costs to human health (air pollution and accidents) and the environment (climate change, water pollution and consumption, loss of ecosystem services) mostly based on benefit transfer. The external costs are estimated at around 20–40 cents per kWh (i.e., 50%–100% of the average electricity price). Over 90% of the impacts quantified were due to water consumption that was quantified using a benefit transfer from [25], who used the production function approach to derive the opportunity costs of water. In this respect, it is highly specific to local conditions and the estimation of the production function is also rather tentative for its hypothetical setup and mixing different power generation technologies.
Wang et al. [26] compared the external costs of power plants fired by coal versus biomass in a stylized life cycle approach. The (hard) coal mining part of their external cost quantification accounts for gangue, water contamination, methane emissions and occupational mortality and morbidity, and the quantification of these impacts follows a top-down approach. They find that the coal combustion stage makes a large majority of external costs quantified (0.067 US cents per kWh) compared to coal mining (0.003 US cents per kWh) and other upstream processes.
Any comparison of the published estimates of the externalities of coal should made cautiously. In particular, there are huge differences among various studies in terms of scope and impacts covered, methods used for the quantification of impacts and their monetization [27]. Frequent use of benefit-transfer also hinders the possibility of tracking down particular methodological assumptions and technicalities. In the valuation part, a profound difference results from the choice of metric for mortality valuation. In the US, the value of statistical life (VSL) is conventionally used for valuation of premature deaths, while in Europe (in particular in ExternE methodology since 2003) it is primarily estimated as change in life expectancy leading to Years of Life Lost (YOLLs). This difference is further exacerbated when these estimates are transferred for use in other countries or regions by using different adjustment factors for the local economic conditions (e.g., purchasing power vs. exchange rate) as well as when the values are transferred in relation to time. This often explains some relatively surprising results, such as the considerably low external cost estimates in China or India. On the one hand, less stringent emission control technologies are employed in these countries and larger populations tends to be exposed, but on the other hand the monetary valuation of impacts is adjusted for the prevailing economic conditions there.
In spite of these numerous differences, primary costing studies looking beyond the electricity generation phase tend to confirm that airborne (and greenhouse gas) emissions from power generation represent a major portion of estimated external costs. Nkambule and Blignaut’s work [24] is an exception to this rule, but their estimates are not consistent with the damage function approach. Occupational impacts may also be important but more so in underground mines and in countries with a lack of or ineffective occupational safety laws.
3. Methods
The approach used here for the quantification of external costs is based on a bottom-up Impact Pathway Approach (IPA) developed in the ExternE project series [10]. IPA allows the evaluation of impacts in a detailed spatial and technology resolution (local and regional meteorological conditions, population density, fuel specification, installed capacity, load hours, etc.). This analysis tracks all pollutant pathways from the point where it is emitted to the affected receptors (inhabitants, crops, natural ecosystems, buildings, etc.). The relationship between the increase in pollutant concentration and physical impacts on receptors is then determined by means of concentration-response functions (e.g., increase in asthma attacks as a consequence of a higher ambient air concentration of NO2).
The IPA is conceptually compatible with Life Cycle Assessment (LCA), hence a site-specific IPA can principally be conducted for a full LCA (i.e., cradle-to-grave). In spite of this overarching perspective, a large majority of IPA applications encompasses electricity generation in power plants only. Yet the operation part, i.e., electricity production, is linked both to up-stream (transport, mining, construction, etc.) and down-stream (electricity transport, waste disposal, decommissioning of power plants, etc.) processes.
The choice of impact pathways is largely limited by the ability to establish a relationship between the environmental and/or health impact and the burden that causes that impact and the receptor bearing the burden. Air pollution is arguably the best established domain of environmental impacts (and on human health in particular). In spite of the vast knowledge on both the short and long term health effects of air pollution there are still great uncertainties. One of the most intriguing questions is whether there is sufficient evidence on the differential health effects of particulate matter (beyond differentiation to coarse and fine particles, PM10 and PM2.5 respectively) according to its components and sources (such as coal or biomass burning, road traffic, secondary particles formed by chemical reactions in the atmosphere). Particulate matter is a complex mixture including black/elemental carbon, secondary inorganic aerosols, and primary and secondary organic aerosols. While it is unlikely that all components have the same health effect potential, the evidence currently available remains insufficient to attribute different health damaging potentials to these components or as an Health Effects Institute’s Review Panel of National Particle Component Toxicity (NPACT) Initiative studies stated “it is not likely to easily identify a single culprit PM component or source category (of PM toxicity)” [28]. This is a conclusion also shared by the WHO’s Review of evidence on health aspects of air pollution (REVIHAAP) report [29] and recent statement by the UK Committee on the Medical Effects of Air Pollutants [30]. Another intriguing question concerns the direct health effects from NO2 exposure and their additivity to effects attributed to particulate matter. The latest evidence gathered in the REVIHAAP review corroborates the finding that a direct effect remains after adjusting for other pollutants not only for a short-term effect but also for long term effects [29].
Our take on IPA consists of a combination of a local scale modelling of emissions from mining and regional scale modelling of impacts from coal burning in large combustion (heating and) power plants. The dispersion of dust emissions from coal mining, namely PM2.5 and PM10 fractions, was modelled using the Gaussian dispersion model ATEM (ATEM Ltd., Prague, Czech Republic) (a reference method for dispersion modelling in urban and rural areas pursuant to Czech air quality legislation) with detailed climatic and meteorological data. Annual concentrations of PM2.5 and PM10 were calculated as contributions from individual pollution sources in the mining area and related (mainly transport) activities. The dispersion of emissions of dust, PM10, PM2.5, SO2, NOx (NO2) and non-methane volatile organic compounds (NMVOC) from a set of 32 (33) large combustion plants and imposed health impacts was estimated via an EcoSenseWeb (Institute for Rational Use of Energy, University of Stuttgart, Germany) model, an integrated atmospheric dispersion and exposure assessment model developed in the ExternE project series. In EcoSenseWeb the transport of primary air pollutants on a local scale (100 km × 100 km around the pollution source) is modelled with the Industrial Source Complex Model, a Gaussian plume model, while the formation and deposition of secondary pollutants (secondary inorganic aerosols-sulphates and nitrates, and tropospheric ozone) on a European scale is done with Source-Receptor matrices parameterized with the European Monitoring and Evaluation Programme/Meteorological Synthesizing Centre’s (EMEP/MSC-West) Eulerian dispersion model [31].
To accommodate our assessment with recently updated epidemiological evidence on the health risks of air pollution and a recommended set of concentration-response functions by the twin WHO projects REVIHAAP and HRAPIE (Health Risks of Air Pollution In Europe), we use a subset of concentration-response functions that are additive in their effects from the HRAPIE set compiled for the cost-benefit analysis of the EU Clean Air Package [32] instead of the default set of functions contained in EcoSenseWeb. Necessary background data for these updated concentration-response functions such as population age distribution or mortality and morbidity incidences were compiled from WHO, EUROSTAT and World Bank databases for all 64 countries distinguished in the EcoSenseWeb model (52 European, five North African, five Middle Eastern and two Asian post-Soviet countries), with a total population exceeding 1 billion people. In cases where no data were available we input the regional average or neighbouring country data if the latter seemed more appropriate.
The valuation of health impacts is based on a set of unit values updated for a cost-benefit analysis of the EU’s Thematic Strategy on Air Pollution [33] with the following modifications—the valuation of mortality is pursued solely using the value of a life year (VOLY) derived by Desaigues et al. [34], i.e., the lower range suggested by [33]. For infant mortality, the value used is the middle of the range suggested in [33]. This set of unit monetary values was primarily compiled as EU central values (see Table 1, last column), but as our assessment stretches beyond the EU, we opted to transfer these central values to country-specific values. We note that a convenient alternative would be to take a stance of a Czech decision-maker and value all the impacts based on Czech preferences. Somewhat surprisingly, however, the Czech decision-makers were concerned only with impacts incurred in the Czech Republic, arguing that they have to weight costs and benefits of the revision of mining limits on behalf of their (Czech) electorate. By using country-specific values we aimed to reflect individual preferences (albeit at the country-level only), i.e. what the valuation studies notoriously show that the valuation of a health impairment is driven by income/wealth and generally is higher in Western European than in Eastern European countries. This also reflects that the valuation of morbidity entails a loss of productivity and resource costs that differ among countries and (to some extent) in relation to the income level. The country-specific values were calculated by multiplying EU central values by the ratio of country vs. EU GDP per capita at purchasing parity power using data from the World Bank, in manner similar to the sensitivity analysis by [19]. Impacts attributed to a particular country were consequently valued using these country-specific values.
In addition, as our assessment stretches over a longer time period it means that economies will evolve as well and this will affect valuation of endpoints. Considerable empirical evidence shows that valuation of health (i.e., willingness-to-pay) rises with income. As future income is unknown, we use as a proxy GDP growth for the 2015–2050 period from the integrated assessment World Induced Technical Change Hybrid (WITCH) model [35,36]. The WITCH model estimated GDP endogenously for 13 regions of the world assuming that economic growth follows the trajectory of greenhouse gas emissions evolving according to the Representative Concentration Pathways (RCP) mitigation scenario 4.5. We use GDP growth predicted for 4 regions, starting at 4.3% per year in Middle Eastern and North African countries, 3.7% in post-Soviet non-EU countries, 2.7% in Eastern European EU countries and 1.6% in Western European countries, and gradually declining to 2.3%, 2.3%, 1.5% and 1.3% in the respective regions at the end of the period. In addition, we use income elasticities of willingness to pay of 0.65, 0.68 and 0.3 for mortality, severe and mild health endpoints, respectively, in line with [37], to translate the assumed income rise to a valuation of health endpoints.
A list of health endpoints that appear in the concentration-response functions used along with their classification into two groups (a limited set consisting of functions quantified against larger epidemiological evidence and an extended set with additional functions) as well as EU central monetary values attributed to these endpoints is shown in Table 1.

| Pollutant | Endpoint | In Limited Set | Monetary Value (€2014) |
|---|---|---|---|
| Long-Term Exposure | |||
| PM2.5 | Adult mortality (loss of life expectancy, YOLLs) | yes | 65,066 |
| PM10 | Post-neonatal infant mortality | no | 2,762,767 |
| PM10 | Incidence of chronic bronchitis in adults | no | 60,443 |
| PM10 | Prevalence of bronchitis in children | no | 663 |
| Short-Term Exposure | |||
| PM2.5 | Restricted activity days | no | 104 |
| PM2.5 | Work days lost | no | 147 |
| PM2.5 | Hospital admissions, respiratory diseases | yes | 2503 |
| PM2.5 | Hospital admissions, cardiovascular diseases | yes | 2503 |
| PM10 | Incidence of asthma symptoms in asthmatic children | no | 47 |
| O3 | Adult mortality (YOLLs) | yes | 65,066 |
| O3 | Hospital admissions, respiratory diseases | yes | 2503 |
| O3 | Hospital admissions, cardiovascular diseases | yes | 2503 |
| O3 | Minor restricted activity days | no | 47 |
4. Data and Scenarios
4.1. Scenarios
In order to reflect the options and preferences for the use of coal beyond the mining limits at the Bilina and CSA mines, four scenarios were assessed (see also Figure 2 above). The status quo scenario (Variant 1) assumes the mining limits will remain unchanged and mining will be wound down at the Bilina mine by 2037 and at the CSA mine by 2024. In Variant 2 the mining limits are abolished at the Bilina mine only, resulting in continued extraction at this mine beyond 2050, but at the same time mining at the CSA mine will conclude by 2024. In Variant 3 the mining limits are abolished at the Bilina mine and partially at the CSA mine also, resulting in an extension of mining in the latter case by 10 years until 2034. Finally, in Variant 4 the mining limits are completely abolished at both mines and both keep operating beyond 2050.
4.2. Emissions from Coal Mining
The dominant sources of emissions from strip mining activities are topsoil (overburden) removal and coal mining with dragline excavators, overburden replacement by conveyors, transportation of coal to a coal preparation plant (using conveyors) and the loading of coal onto railcars and trucks. In all variants considered the overburden is deposited in the mining pit and therefore we do not consider any other impacts from waste disposal although in different settings these might be important.
At the Bilina mine it is expected that two overburden and two coal excavators will be used for the whole period until 2050 and these excavators are modelled as two line sources (they move continually over a year on the mining front). Conveyor belts are located around the southern edge of the mine and will be extended as the mining proceeds westwards and the emissions are estimated based on the length of the belts and the operating hours. Overburden deposition (spoil piles) will move from the eastern side of the mine as the mining proceeds by a corresponding distance westwards. Three “snapshots” (the years 2015, 2035 and 2048) were chosen for detailed modelling of mining activities at the Bilina mine and its impacts on the surrounding area comprising over 93,000 inhabitants. Emissions of dust were modelled upon annual extraction of about 9, 6, 4 million tonnes of coal and 57, 36, 12 million m3 of overburden in 2015, 2035 and 2048, respectively.
At the CSA mine the mining line stretches in a north-easterly direction and the conveyor belts are located on the south-eastern edge of the mine. Similarly as at the Bilina mine, no external deposition of extracted overburden is planned. At the CSA mine, the three “snapshots” chosen for detailed modelling of mining activities are slightly different—corresponding to planned mining in 2015, 2030 and 2050. At this mine, the three mining variants considered differ in the distribution of the affected population, and in the two variants based on a revision of the mining limits a relocation of inhabitants is assumed to take place around 2020—this would affect about 800 inhabitants of Horni Jiretin in the event of a partial abolition of the limits or about 2150 inhabitants of Horni Jiretin and Cernice in the event of a full abolition of the mining limits at the CSA mine. Emissions of dust were modelled for annual extraction of about 3.4, 6 and 6 million tonnes of coal and 34.5, 34.5 and 17 million m3 of overburden in 2015, 2030 and 2050, respectively.
The main characteristics of the current mining activities and related emissions were derived from respective environmental impact assessment (EIA) documentations. Emissions from transfers of both coal and overburden between conveyors are related to the total volume of extracted material and its moisture content; the average moisture was taken from the US EPA AP-42 Compilation of Air Pollutant Emission Factors [38]. Coal expedition is modelled as an area source, including vehicle movements, accounting for both direct exhaust emissions and dust resuspension from vehicle movements. For dust resuspension by wind, a methodology developed for the Usti Regional Authority is used [39]. As not all emissions from mining and related activities enter ambient air (i.e., do not get beyond the mining area) the estimated emissions are factored by reduction coefficients suggested in [39]. The reduction coefficients account for horizontal and vertical distance from the mine edge and days with rain and snow. Estimated PM10 emissions from coal mining and related activities amount to about 250 tonnes per year (PM2.5 about 75 tonnes per year) at the Bilina mine [40]. At the CSA mine estimated PM10 emissions vary—generally depending on the volume of extraction—between 125 tonnes (year 2015) and 223 tonnes (year 2050), and similarly PM2.5 emissions vary between 37 and 67 tonnes per year (in 2015 and 2050, respectively) [40].
4.3. Emissions from Heat and Power Generation
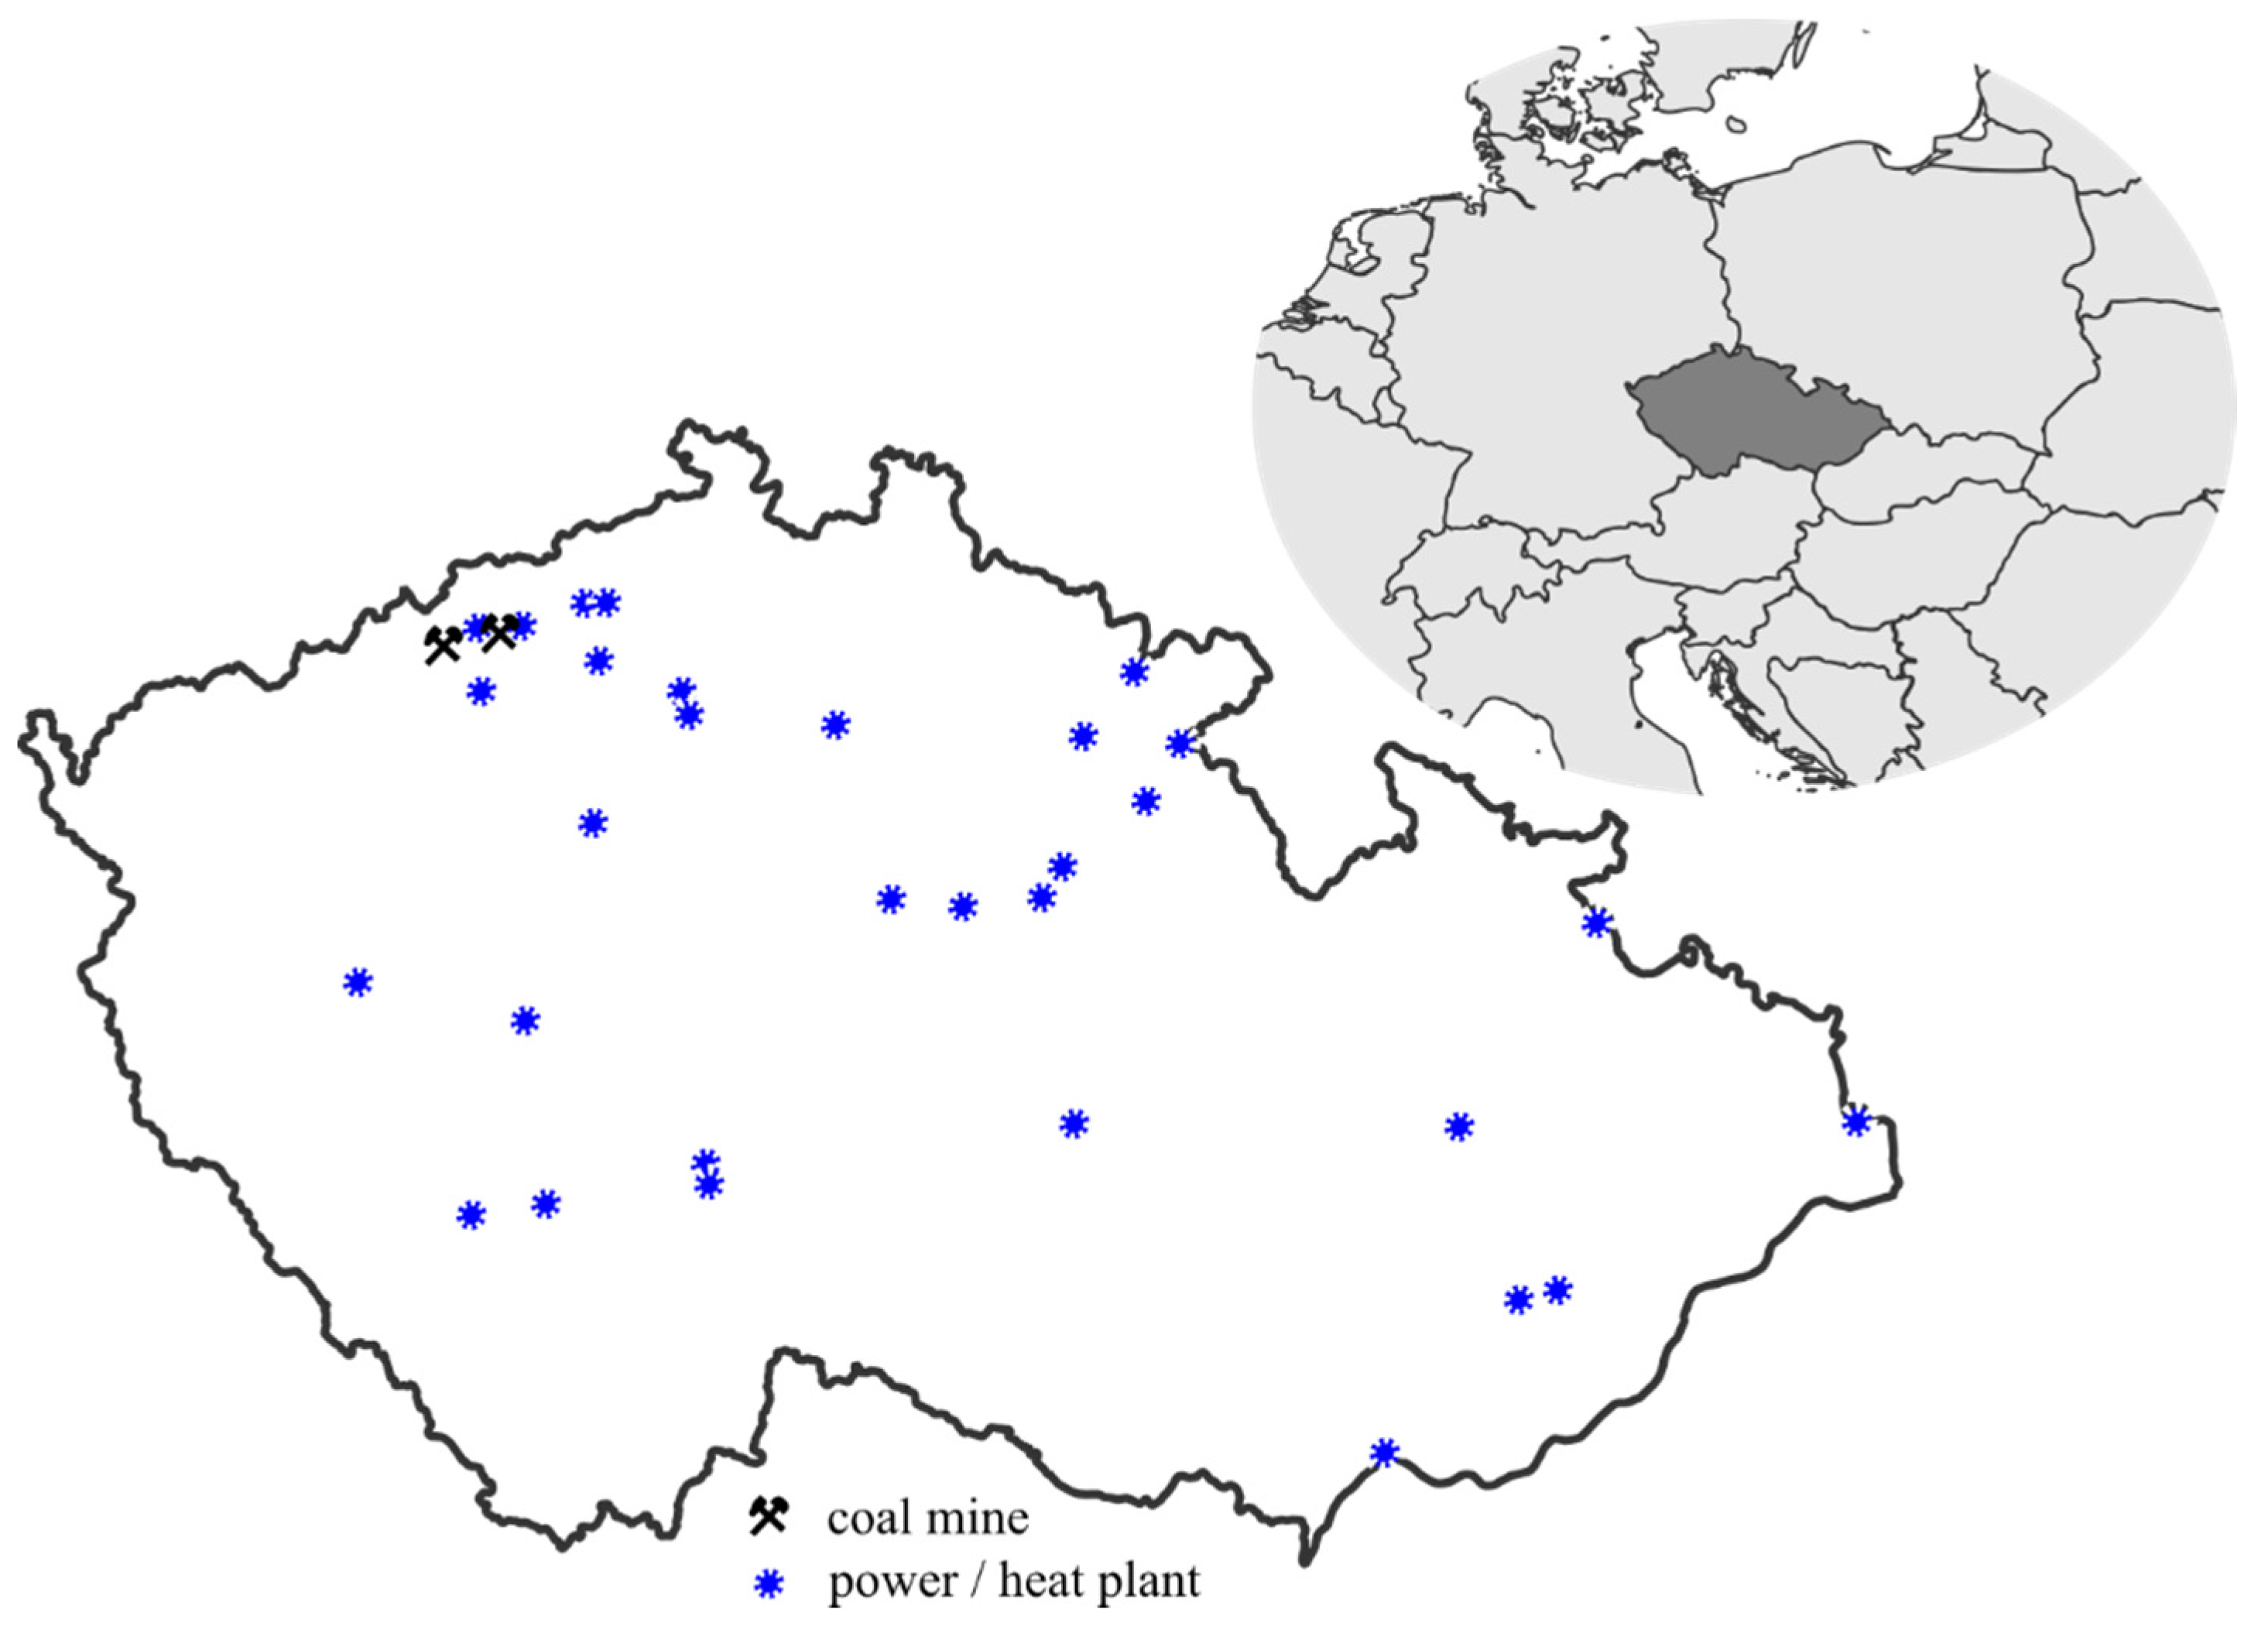
In a bottom-up approach such as IPA, estimating the health impacts of coal use needs a precise allocation where (in what facility) the coal extracted at the Bilina and/or CSA mine is going to be used. Circumventing a complex energy system optimization, we chose to maintain the current allocation of coal from the two mines and to restrict our assessment to large stationary combustion plants only. The latter limitation is mostly a practical one because modelling emission dispersion from residential coal use was not thought to be feasible in such detail that would correspond to dispersion modelling from large combustion sources. The location of large combustion sources—power plants and combined heating and power plants (along with the location of the two mines)—is shown in Figure 3. In total, 33 sources are considered, 31 are currently in operation and a new power plant in Ledvice (to be set in operation in 2016) and in Pocerady (a future power plant relevant only in the variant relating to the total abolition of mining limits from 2041 onwards). The allocation of coal extracted at the Bilina and CSA mines under respective mining limit variants to these power (and heating) plants was proportional up to their full capacity.
Figure 3.
Location of the two coal mines and 33 power and heating plants.

The emissions of dust, PM10, PM2.5, SO2, NOx (NO2) and NMVOC for these 33 plants were established for every year until 2050 (or their expected lifetime if prior to 2050) in such a manner that it reflects both their actual emissions and the envisaged tightening of future regulation of large combustion plant (LCP) emissions. Hence for 2015 the emissions were derived from 2014 data obtained from the Emission and Stationary Sources Registry maintained by the Czech Hydrometeorological Institute and adapted to planned coal consumption (“actual” emissions). For the 2016–2020 period, the emission ceilings set in the Transitional National Plan of the Czech Republic [41] were used if the “actual” emissions were higher. In the same vein, the upper limit values from the BREF Draft 2 version [42] were attributed for the post-2020 period.
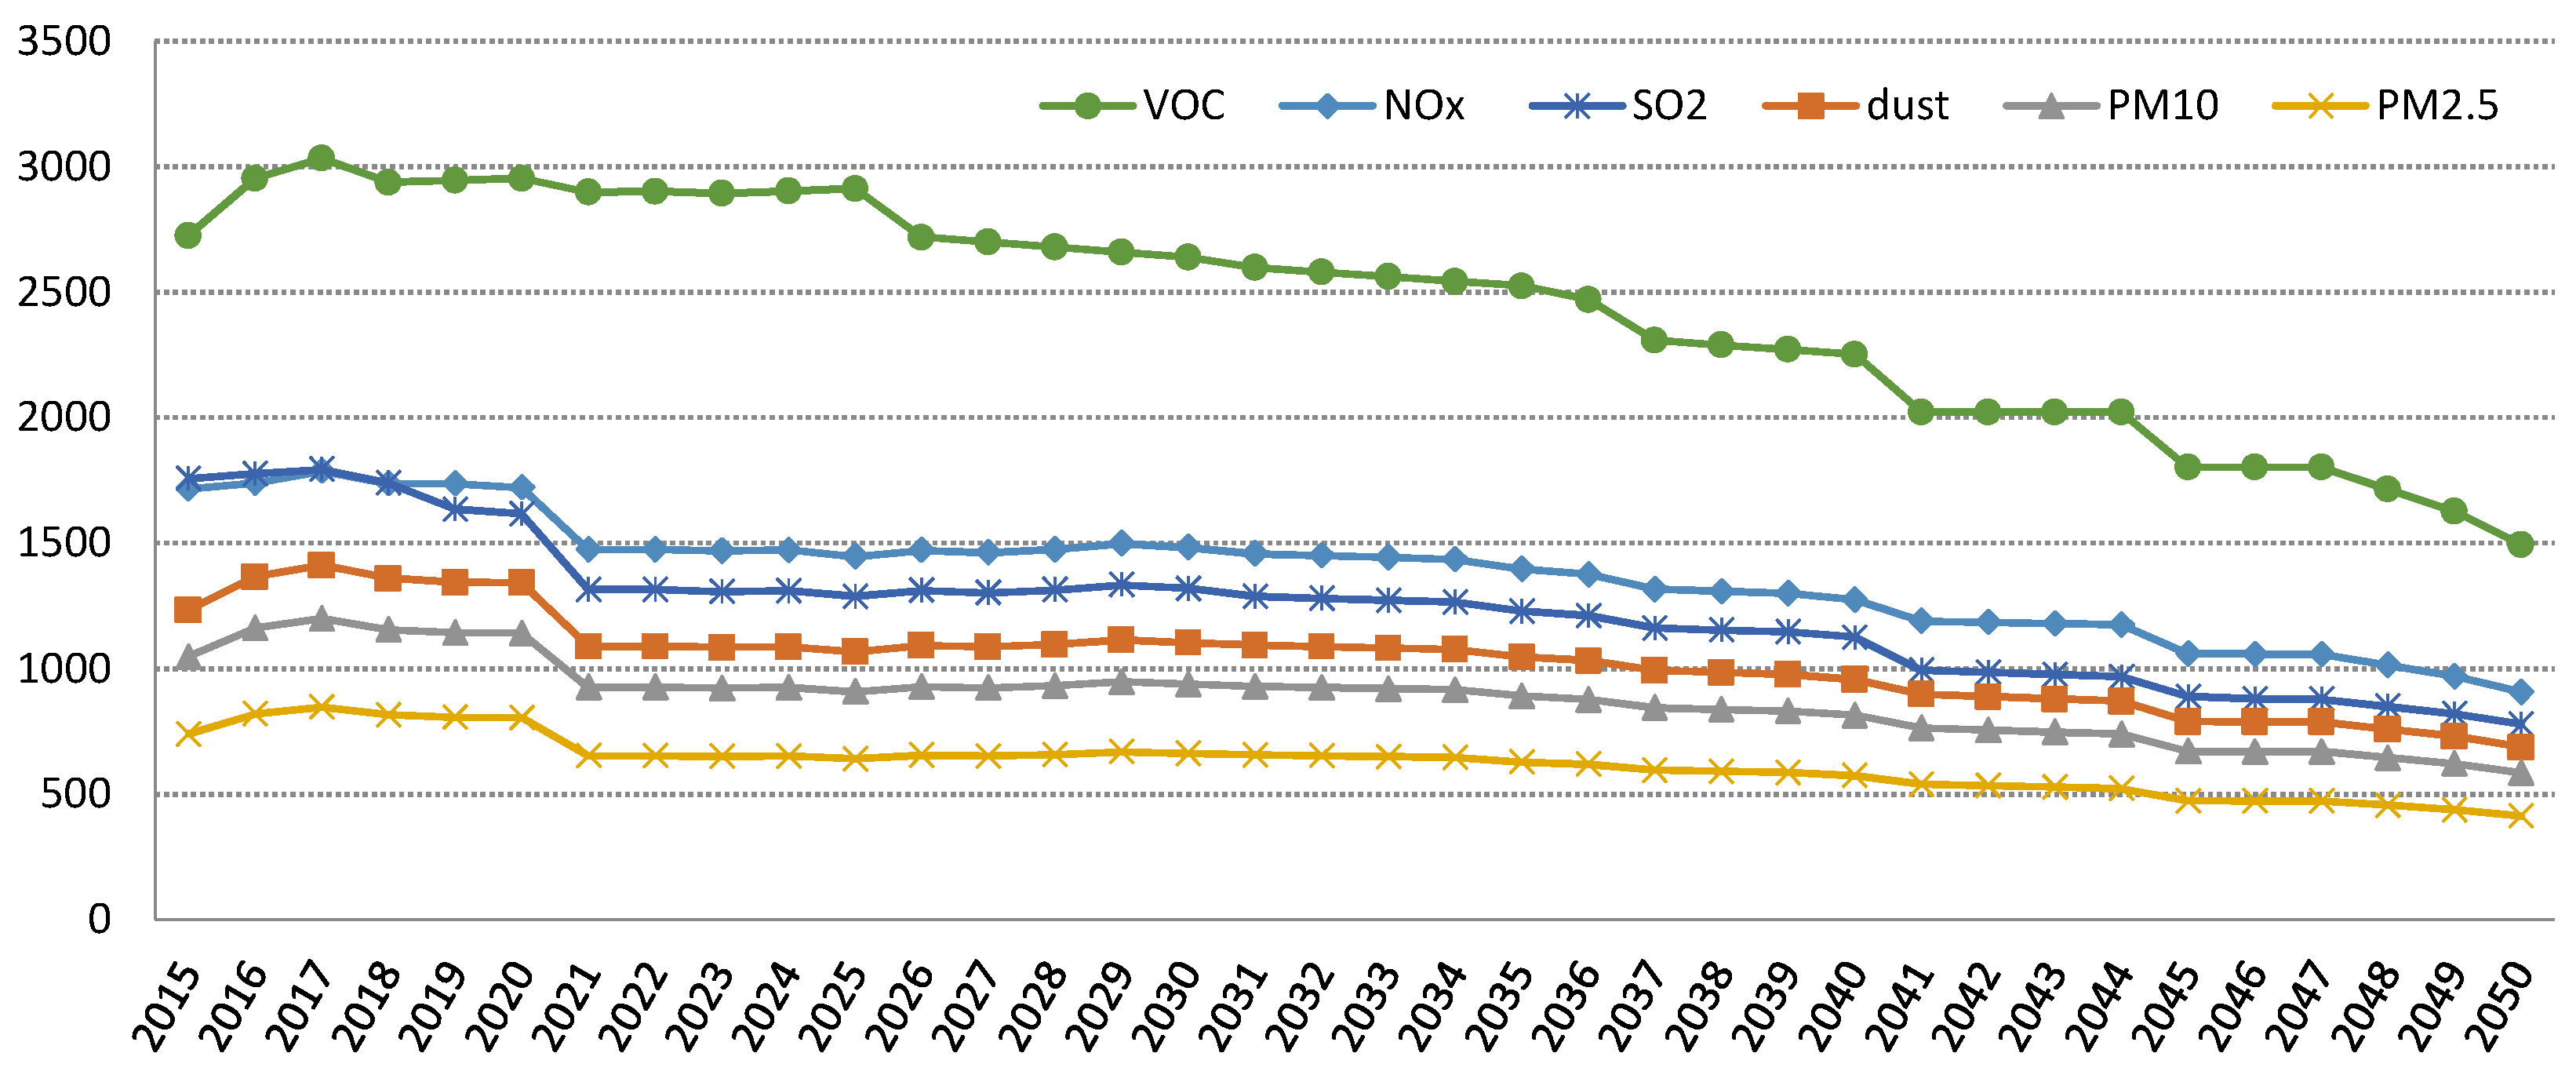
These emission characteristics refer to (or close to) the full load operation of these LCPs, but the proportional allocation of coal from Bilina and CSA mines—particularly in the variant regarding maintained mining limits—results in substantial shortages of coal from the two mines for our set of LCPs. To avoid the need to address the series of resulting pitfalls (unrealistic operation conditions leading to higher emissions, unrealistically low flue gas volumes spread to lower troposphere layers affecting dispersion modelling, etc.), a full load of LCPs was modelled and only the share of emissions proportional to the volume of coal originating from Bilina and/or CSA was then used for a subsequent calculation of the health impacts. The additional coal was assumed to possess the average parameters of the remaining brown coal mined in the Czech Republic. A sketch of total estimated emissions from selected LCPs for the analysed period 2015–2050 is depicted in Figure 4.
Figure 4.
Modelled annual emissions from 33 large combustion plants in full load operation (in tonnes, except for SO2 and NOx in tonnes/10).
Figure 4.
Modelled annual emissions from 33 large combustion plants in full load operation (in tonnes, except for SO2 and NOx in tonnes/10).

5. Results
5.1. Health Impacts from Coal Mining
The highest annual average concentrations of PM10 attributable to coal mining at Bilina can be as high as 30 μg/m3 locally around overburden and coal transfers, but decrease rapidly with distance. In the most exposed inhabited area (parts of 4 municipalities closest to the mine’s borders) the annual contributions to PM10 concentration levels are at most about 1–2 μg/m3 and about 0.25–1.0 μg/m3 in adjacent settlements of a further 4 municipalities. Annual concentrations of suspended PM2.5 are estimated at considerably lower levels, i.e., peaking at about 1.5 μg/m3 at the mine’s northern edge and decreasing rapidly with distance. The increases in adjacent settlements are relatively small, around 0.1–0.4 μg/m3 in the four closest municipalities and below 0.1 μg/m3 in more remote municipalities.
Modelled annual concentrations of PM10 and PM2.5 attributable to coal mining at the CSA mine are generally somewhat lower compared to the Bilina mine, the highest annual PM10 concentrations in inhabited areas are at most 1.6 μg/m3 in 2015 and 1.5 μg/m3 in 2030 and 2050, and the highest annual PM2.5 concentrations in inhabited areas are (mostly irrespective of variant and year) below 0.4 μg/m3.
Using concentration-response functions defined for PM10 and PM2.5 exposures and the population exposed to respective concentrations, attributable cases of respective health effects were estimated for the “snapshot” years. These estimates were then interpolated over the whole 2015–2050 period (effectively until 2037 in the variant where mining limits are kept in place at Bilina, and until 2024 in the variants with the mining limits kept in place at CSA or until 2034 in the event of the partial limit abolition at the CSA mine) while taking account of the forecast volume of coal extraction (i.e., assuming a linear correlation between coal and overburden extraction and related emissions) and population resettlement at the CSA mine in Variants 3 and 4.
Table 2 details the estimated health effects from the mining of coal for both variants at the Bilina mine and for the three variants considered for the CSA mine up to 2050. In short, were the mining limits to be repealed at Bilina the health impacts will more than double, i.e., an increase from 121 to 272 attributable asthma episodes in children or from 2400 to 5600 attributable restricted activity days. This on the other hand more or less corresponds to an almost doubling of total coal extraction (from 135 million tonnes within the limits to 258 million tonnes, including the coal beyond the limits).
In the event of the partial abolition of the mining limits at the CSA mine, the estimated health impacts will roughly double compared to maintaining the mining limits. In the event of the total abolition of mining limits the health impacts will be approximately 5.5 times higher compared to the situation where limits would remain in place. Again, this roughly corresponds to an increase in volume of coal extraction (from 31 million tonnes within the limits to a total of 75 million tonnes in the event of the partial revision of mining limits to a total of 177 million tonnes until 2050 in the event of the total abolition of the mining limits).
| Health Outcome | Unit | Bilina Mine | CSA Mine | |||
|---|---|---|---|---|---|---|
| Within Limits | Limits Abolished | Within Limits | Partial Abolition | Total Abolition | ||
| Infant mortality | Cases | 0.003 | 0.007 | 0.0003 | 0.0006 | 0.0017 |
| Chronic bronchitis in adults | New cases | 4.38 | 10.4 | 0.4 | 0.9 | 2.6 |
| Children asthma symptoms | Asthma episodes | 121.1 | 271.5 | 12 | 25 | 68 |
| Bronchitis in children | New cases | 14 | 30. 9 | 1 | 3 | 8 |
| Adult mortality | YOLLs | 27.5 | 65.2 | 3 | 6 | 16 |
| Cardiovascular hospital admissions | Cases | 1.1 | 2.58 | 0.1 | 0.2 | 0.6 |
| Respiratory hospital admissions | Cases | 0.1 | 0.23 | 0.01 | 0.02 | 0.06 |
| Work days lost | Days | 1031 | 2327 | 105 | 216 | 582 |
| Restricted activity days | Days | 2396 | 5605 | 246 | 511 | 1389 |
Note: YOLLs stands for Years of Life Lost.
On a per tonne (of extracted coal) basis the health impacts of mining at the Bilina mine are more than twice as high as health impacts of mining at the CSA mine. This is due to the denser population in the settlements adjacent to the Bilina mine and a planned relocation of inhabitants from Horni Jiretin in the event of the abolition of the coal mine limits at the CSA mine.
Table 3 summarizes the estimated health impacts of all four mining limit revision variants put forward by the Ministry of Industry and Trade.
| Health Outcome | Unit | Variant 1 | Variant 2 | Variant 3 | Variant 4 |
|---|---|---|---|---|---|
| Within Limits | Limit Lifted at BILINA | Limits Lifted at Bilina and CSA Partially | Both Limits Lifted | ||
| Infant mortality | Cases | 0.0033 | 0.0072 | 0.0075 | 0.0086 |
| Chronic bronchitis in adults | New cases | 4.8 | 10.8 | 11.3 | 13.0 |
| Children asthma symptoms | Asthma episodes | 133 | 284 | 297 | 339 |
| Bronchitis in children | Cases | 15 | 32 | 34 | 39 |
| Adult mortality | YOLLs | 30 | 68 | 71 | 81 |
| Cardiovascular hospital admissions | Cases | 1.2 | 2.7 | 2.8 | 3.2 |
| Respiratory hospital admissions | Cases | 0.11 | 0.24 | 0.25 | 0.29 |
| Work days lost | Days | 1136 | 2431 | 2543 | 2908 |
| Restricted activity days | Days | 2642 | 5851 | 6116 | 6994 |
Note: YOLLs stands for Years of Life Lost.
5.2. Monetized Impacts from Coal Mining
To establish monetized health impacts from coal mining the estimated physical health impacts are multiplied by unit costs. The latter are adjusted at the Czech level to EU GDP per capita (in purchasing parity power) and predicted GDP growth in the 2015–2050 period as all the impacts are incurred in the Czech territory. The estimated health damages are presented in Table 4 for the respective mines, and in Table 5 for the respective revised mining limit variant. Table 4 clearly confirms elevated impacts at the Bilina mine compared to the CSA mine.
Table 4.
Monetized impacts from future mining variants at the Bilina and CSA mines in 2015–2050 period (thousands of euros).
| Health Outcome | Bilina Mine | CSA Mine | |||
|---|---|---|---|---|---|
| Within Limits | Limits Abolished | Within Limits | Partial Abolition | Full Abolition | |
| Infant mortality | 9.2 | 25.1 | 0.8 | 2.0 | 7.0 |
| Chronic bronchitis in adults | 291.6 | 842.6 | 26.9 | 64.3 | 228.6 |
| Children asthma symptoms | 6.2 | 16.9 | 0.6 | 1.3 | 4.7 |
| Bronchitis in children | 10.1 | 26.9 | 0.9 | 2.2 | 7.6 |
| Adult mortality | 1972 | 5687 | 185 | 439 | 1552 |
| Cardiovascular hospital admissions | 3.0 | 8.6 | 0.3 | 0.7 | 2.4 |
| Respiratory hospital admissions | 0.3 | 0.8 | 0.0 | 0.1 | 0.2 |
| Work days lost | 165.8 | 452.4 | 15.4 | 36.3 | 126.3 |
| Restricted activity days | 273.9 | 778.5 | 25.6 | 60.7 | 213.7 |
| Total (limited set of impacts) | 1976 | 5696 | 185 | 440 | 1555 |
| Total (extended set of impacts) | 2732 | 7839 | 255 | 607 | 2143 |
Table 5.
Monetized impacts by revised mining limit variants in the 2015–2050 period (thousands of euros).
| Health Outcome | Variant 1 | Variant 2 | Variant 3 | Variant 4 |
|---|---|---|---|---|
| Infant mortality | 10.0 | 26.0 | 27.1 | 32.1 |
| Chronic bronchitis in adults | 318.5 | 869.5 | 906.8 | 1071.2 |
| Children asthma symptoms | 6.8 | 17.4 | 18.2 | 21.6 |
| Bronchitis in children | 11.0 | 27.8 | 29.1 | 34.5 |
| Adult mortality | 2157 | 5871 | 6126 | 7239 |
| Cardiovascular hospital admissions | 3.3 | 8.9 | 9.3 | 11.0 |
| Respiratory hospital admissions | 0.3 | 0.8 | 0.8 | 1.0 |
| Work days lost | 181.2 | 467.8 | 488.6 | 578.7 |
| Restricted activity days | 299.5 | 804.1 | 839.2 | 992.3 |
| Total (limited set of impacts) | 2161 | 5881 | 6137 | 7251 |
| Total (extended set of impacts) | 2988 | 8094 | 8446 | 9982 |
Damage is reported both for a limited set of impacts and for an extended set of impacts. The vast majority of impacts is represented by adult (chronic) mortality, making over 99% of monetized impacts quantified in the limited set and over 72% of impacts in the extended set of impacts.
5.3. Health Impacts from Coal Use
Projected emissions of pollutants per facility were plugged into EcoSenseWeb model. The resulting health impacts were recalculated to reflect the subset of additive concentration-response functions suggested by the HRAPIE project. No direct impact of NO2 emissions were estimated, however, but secondary inorganic aerosols (including nitrates) are evaluated in the same manner as primary particulate matter.
Total health impacts from the use of coal from the Bilina and CSA mines by revised mining limit variant are shown in Table 6. Overall, the estimated attributable health impacts are substantial, including tens of thousands years of life lost both from chronic and acute exposure to air pollution, several thousands of new cases of chronic bronchitis in adults, tens of thousands asthma symptoms in asthmatic children and millions of milder health outcomes such as restricted activity days and days of work loss. The assessment accounts not only for impact of primary emissions released from large combustion sources, but source-receptor matrices also provide estimates of the contribution of released emissions (mainly NOx, SO2 and VOCs) to secondary pollutants (ozone, inorganic aerosols/particles) and their health impacts. These secondary particles are the main culprits of estimated health impacts, responsible for almost 95% of the total impact from particulate mass.
Table 6.
Health effects from the use of coal from Bilina and CSA by revised mining limit variant in the 2015–2050 period.
| Health Outcome | Unit | Variant 1 | Variant 2 | Variant 3 | Variant 4 |
|---|---|---|---|---|---|
| Chronic mortality | YOLLs | 40,797 | 68,465 | 80,136 | 106,930 |
| Post-neonatal infant mortality | Cases | 6 | 10 | 12 | 16 |
| Chronic bronchitis | New cases | 3062 | 5142 | 6022 | 8048 |
| Bronchitis in children | Cases | 9996 | 16,784 | 19,657 | 26,263 |
| Acute mortality | Yolls | 304 | 514 | 604 | 820 |
| Asthma symptoms in asthmatic children | New cases | 109,958 | 184,787 | 216,598 | 289,990 |
| Cardiovascular hospital admissions | Cases | 3308 | 5567 | 6524 | 8754 |
| Respiratory hospital admissions | Cases | 490 | 825 | 967 | 1301 |
| Minor restricted activity days | Days | 1,285,065 | 2,177,167 | 2,556,027 | 3,470,902 |
| Restricted activity days | Days | 5,639,809 | 9,464,720 | 11,079,845 | 14,786,501 |
| Work loss days | Days | 2,266,459 | 3,811,767 | 4,470,263 | 5,996,024 |
Note: YOLLs stands for Years of Life Lost.
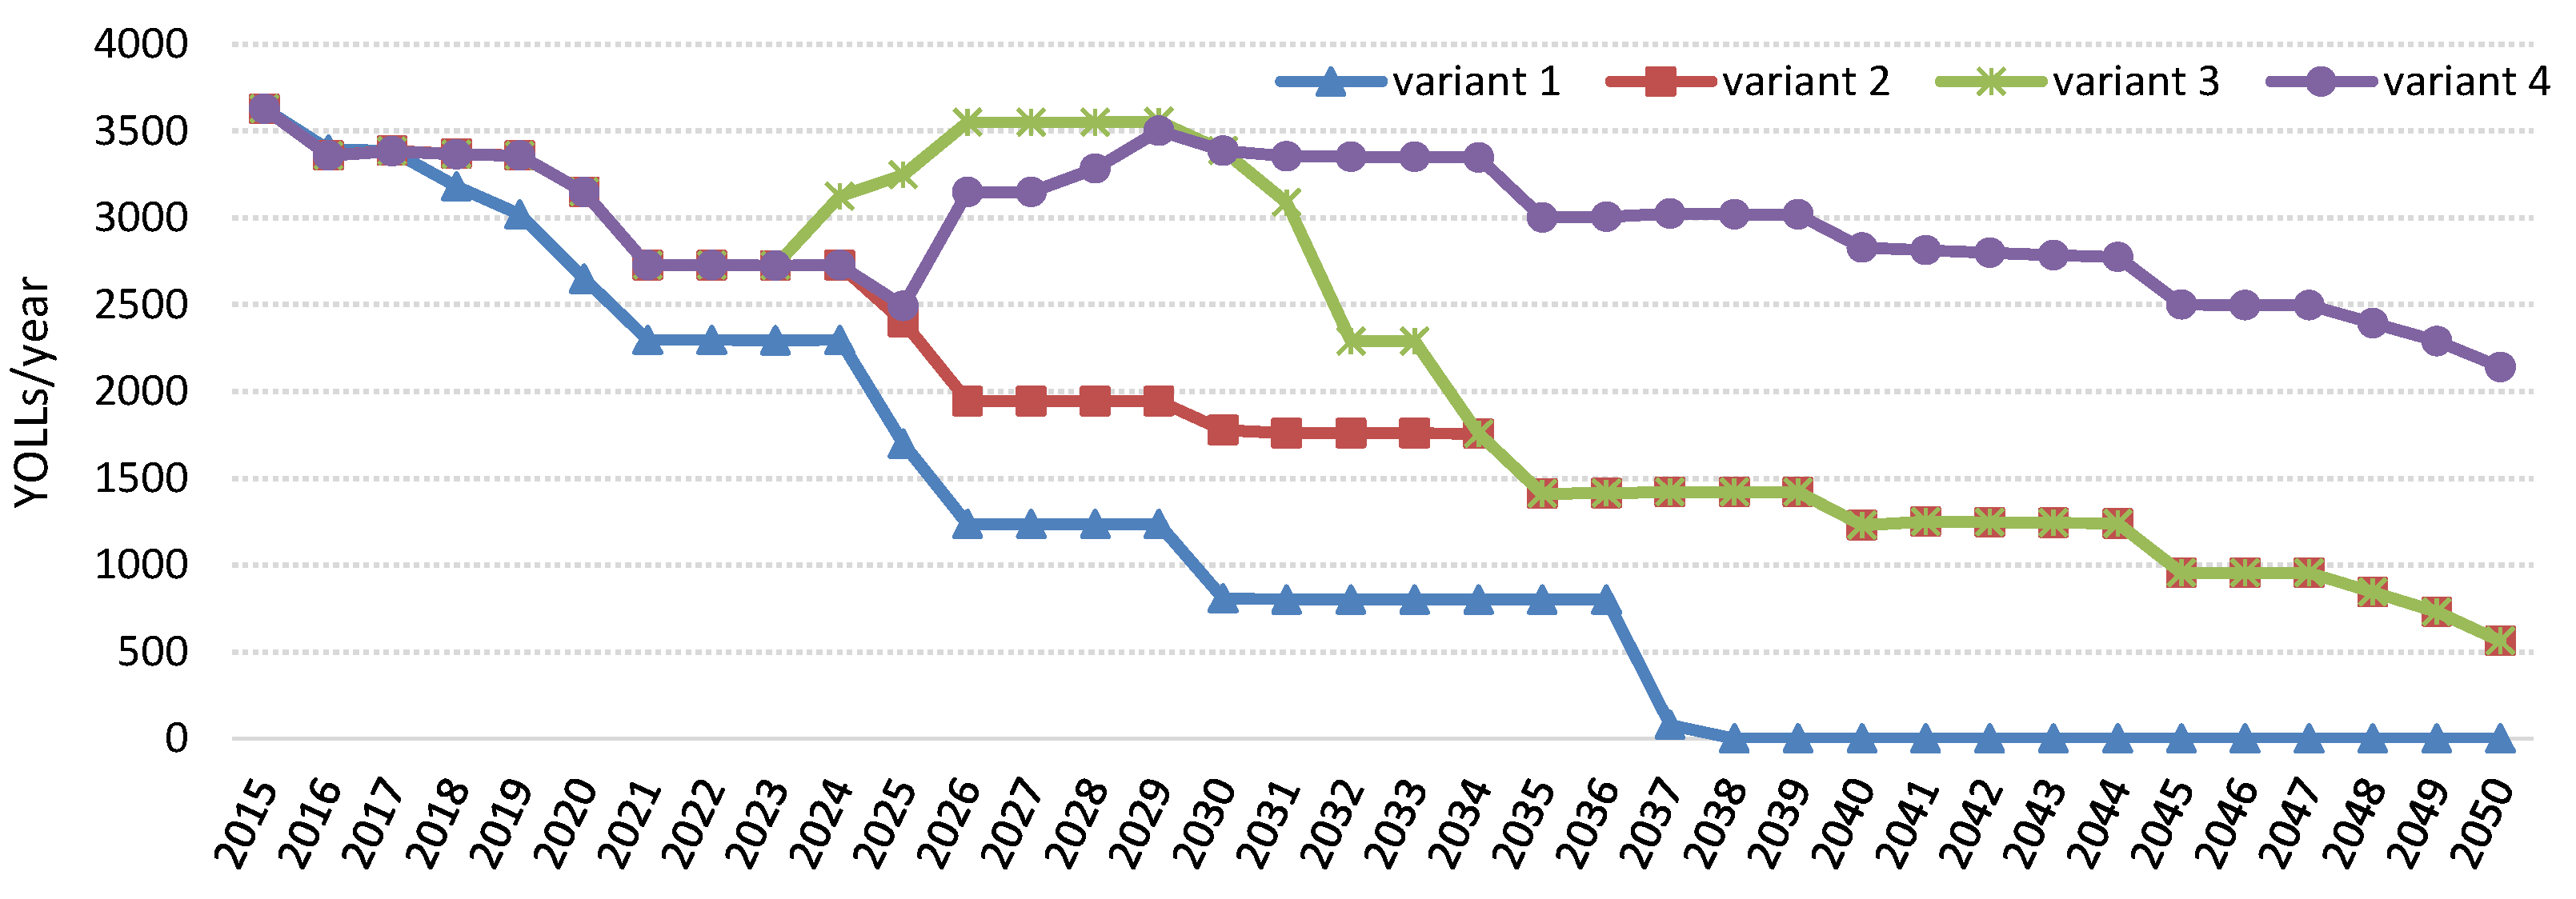
In order to illustrate the temporal distribution of health impacts by the respective variants the following Figure 5 depicts mortality impacts from chronic exposure to PM2.5 (both primary and secondary particles) in terms of life years lost.
Figure 5.
Chronic mortality impacts from exposure to fine particulates by variant (YOLLs per year).

5.4. Monetized Impacts from Coal Use
To arrive at monetized health impacts from coal use we multiply the estimated physical health impacts by unit costs that were localized to country specific values and adjusted for regionally specific predicted GDP growth, i.e., differentiating spatial and temporal differences in the monetary valuation of impacts.
The total monetized health impacts from coal use in large (heating and) power plants are shown in Table 7. The estimates are shown for the four variants and two alternative sets of impacts considered, i.e., either limited set impacts only or extended set impacts (see Table 1 for endpoints contained in the limited set). The limited set of impacts gives estimated monetary damages ranging from 2.7 billion euros in Variant 1 to 7.8 billion euros in Variant 4. Damage from Variants 2 and 3 lies within this range with 4.8 billion euros in Variant 2 and 5.6 billion euros in Variant 3. Over 90% of these monetized impacts are due to chronic mortality from exposure to secondary particles. Using the extended set these impacts are estimated at 3.9 (Variant 1), 6.9 (Variant 2), 8 (Variant 3) and 11.1 (Variant 4) billion euros for the whole 2015–2050 period. Irrespective of the variant assessed, around 65% of these impacts are due to chronic mortality. Additional impacts in the extended set make about 30% of total estimated damages.
| Health Impacts by Compounds | Variant 1 | Variant 2 | Variant 3 | Variant 4 | Variant 1 | Variant 2 | Variant 3 | Variant 4 |
|---|---|---|---|---|---|---|---|---|
| Limited Set | Extended Set | |||||||
| Mortality | ||||||||
| Primary particles | 143 | 256 | 300 | 418 | 143 | 256 | 300 | 418 |
| Secondary particles | 2510 | 4472 | 5253 | 7281 | 2510 | 4472 | 5253 | 7281 |
| Ozone | 19 | 34 | 40 | 56 | 19 | 34 | 40 | 56 |
| Morbidity | ||||||||
| Primary particles | 0.4 | 0.6 | 0.7 | 1.0 | 62 | 107 | 125 | 172 |
| Secondary particles | 6 | 11 | 13 | 18 | 1079 | 1875 | 2200 | 3005 |
| Ozone | 3 | 6 | 7 | 9 | 63 | 109 | 128 | 177 |
| Total | 2682 | 4779 | 5613 | 7783 | 3875 | 6852 | 8047 | 11,109 |
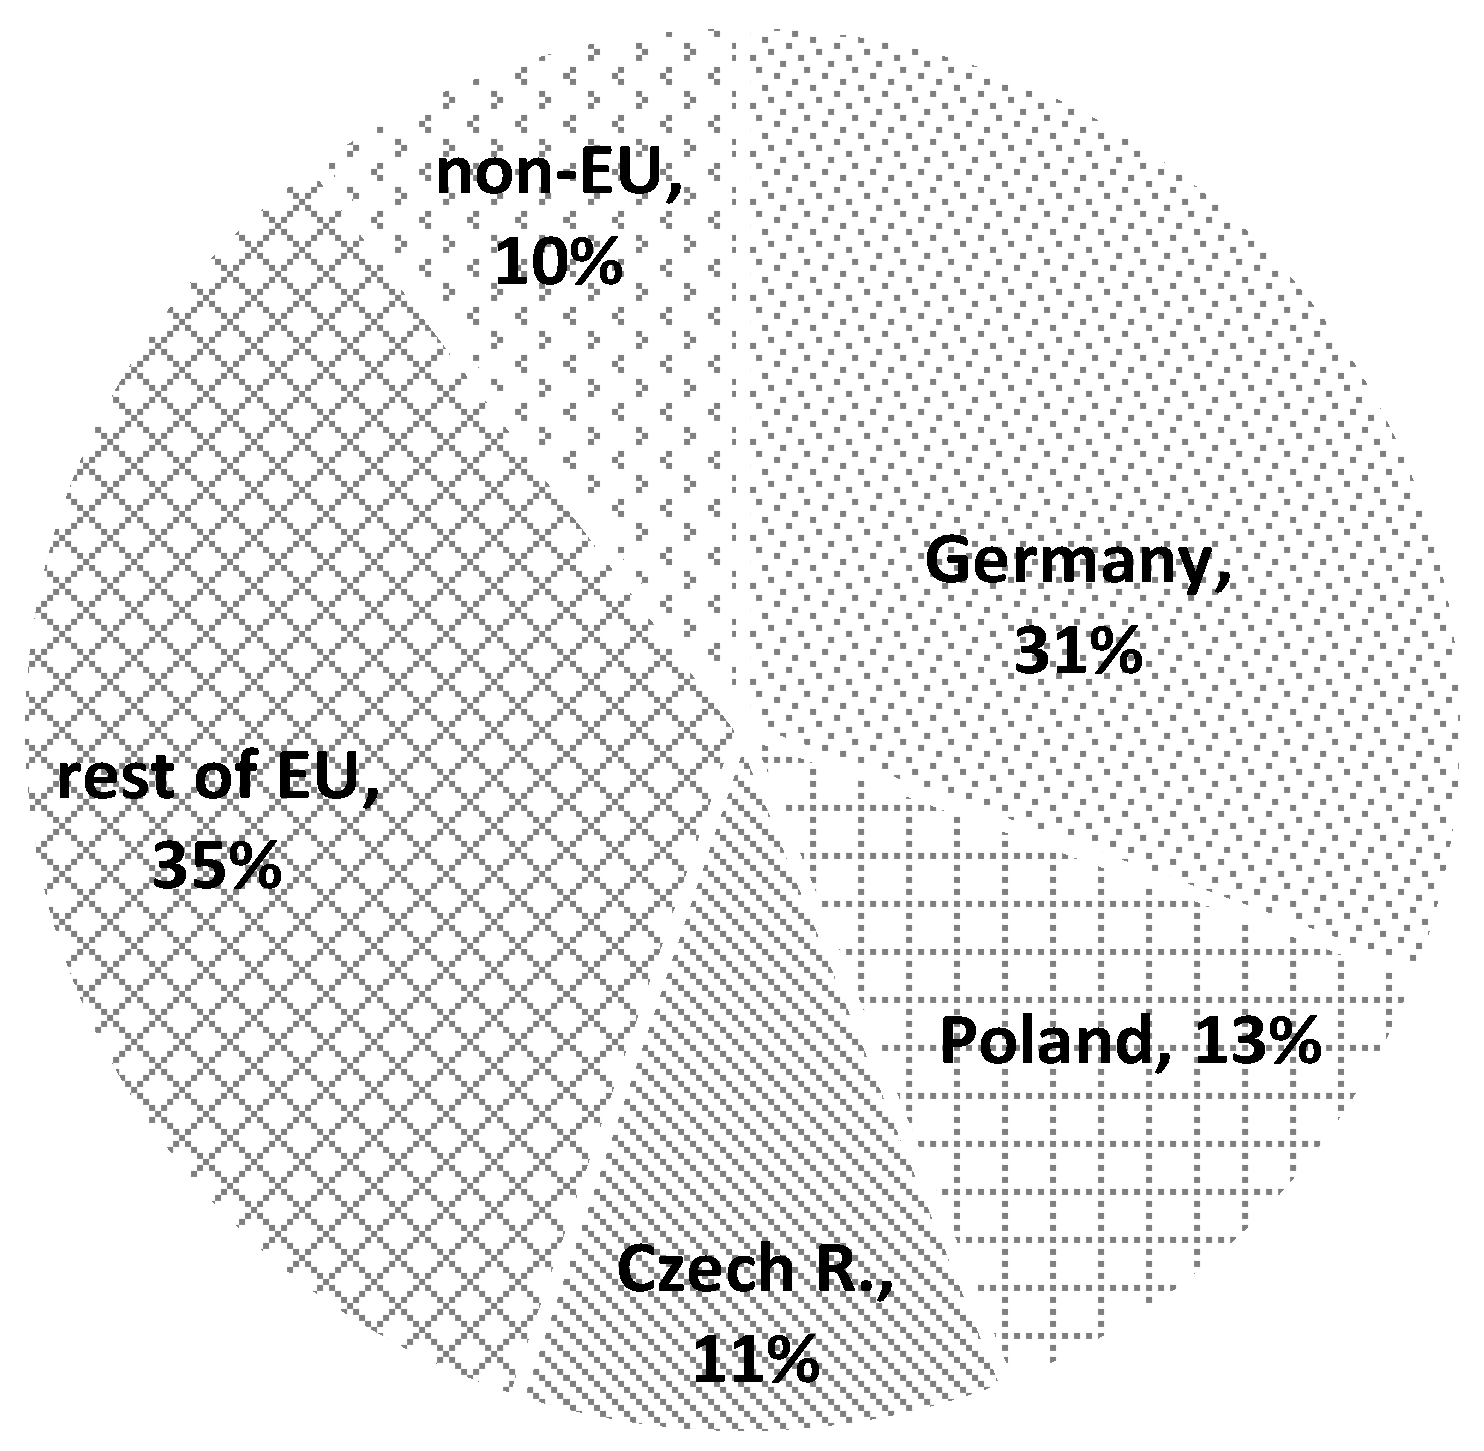
The emissions released from the modelled large Czech power plants contribute to transboundary pollution as they are emitted high above the ground and thus the impacts are exported well beyond Czech borders. The regional distribution of monetized impacts is shown in Figure 6. These estimates suggest that only slightly over 10% of total damage is incurred by the Czech population, and that its two larger neighbouring countries, Germany and Poland, both bear a higher share of the damage, 31% and 13%, respectively. The remainder of the EU countries bears a further 35% of monetized impacts and the last 10% of monetized impacts is borne by populations in all non-EU European, five North African, five Middle Eastern and two Asian ex-Soviet countries.
Figure 6.
Regional distribution of monetized health impacts. Notes: “rest of EU countries” encompasses the remaining 25 EU member countries and “other countries” comprises all remaining European non-EU countries, North African and Middle East countries.
Figure 6.
Regional distribution of monetized health impacts. Notes: “rest of EU countries” encompasses the remaining 25 EU member countries and “other countries” comprises all remaining European non-EU countries, North African and Middle East countries.

5.5. Total Monetized Impacts from Coal Mining and Use
The final step in this assessment lies in combining the estimated health impacts from coal mining and coal use. This summation is provided in Table 8, but the results do not differ from the tables on the impacts of coal use. The overwhelming majority (>99%) of quantified health impacts originates from coal use; only between 0.07% and 0.12% of the total sum for respective health impacts is attributed to coal mining.
Finally, to estimate the net consequences of mining limit revision the results should be related to Variant 1 taken as the status quo. The revision of coal mining limits in Variant 2 (i.e., abolishing mining limits at the Bilina coal mine only) increases the estimated health impacts by about 2–3 billion euro or 77% (virtually irrespective to whether the limited or extended set of impacts is used). If the third variant is pursued (i.e., limits revised at Bilina and partially at the CSA mine), the monetized health impacts will be higher by 3–4 billion euro, or in relative terms more than twice as high (+108%). Finally, if the limits are abolished at both the Bilina and CSA mines the health impacts will reach 5–7 billion euro or almost triple the price (+187%) compared to the status quo.
Table 8.
Health impacts from both coal mining and use for energy generation over 2015–2050 period (in million euros).
| Health Impacts by Phase | Variant 1 | Variant 2 | Variant 3 | Variant 4 |
|---|---|---|---|---|
| Mining | ||||
| limited set of impacts | 2 | 6 | 6 | 7 |
| extended set of impacts | 3 | 8 | 8 | 10 |
| Use | ||||
| limited set of impacts | 2682 | 4779 | 5613 | 7783 |
| extended set of impacts | 3875 | 6852 | 8047 | 11,109 |
| Total | ||||
| limited set of impacts | 2684 | 4785 | 5619 | 7790 |
| extended set of impacts | 3878 | 6860 | 8055 | 11,119 |
6. Discussion and Conclusions
Over the last decade energy policies in most EU countries have faced several substantial challenges, from climate change targets for limiting CO2 emissions and stabilizing its atmospheric concentration, to energy security, most frequently triggered by interrupted gas deliveries from the Russian Federation, to an increased uptake of renewable energy sources, raising the fears about the stability of energy systems. Among those many issues and the discussion started by the process of updating the National Energy Policy revealed an apparent conflict over the coal mining limits in the Northern Bohemia Coal Basin. To enrich such a discussion, this study makes use of the impact-pathway approach to estimate the health impacts of coal extraction and use for electricity and heat generation in the Czech Republic. Unlike previous studies, a detailed modelling exercise was conducted to estimate impacts from dust originating from coal extraction activities, along with a comprehensive estimation of the damage to health from electricity (and heat) generation in large combustion plants.
We find that lifting of the mining limits is likely to lead to damage worth several billions of euros over the 2015–2050 period. If the limits are lifted at the Bilina mine only, the related damage to health from coal extraction and use will be in the range of 2–3 billion euros. If the limits are revised fully at the Bilina mine and partially at the CSA mine, this will lead to damage of about 3–4 billion euros. Finally, if both mining limits are lifted the related damages from extraction and use will more than double to 5–7 billion euros. The major part of the damage (~55%) will be borne by the German, Polish and Czech population. This last finding, i.e., that a substantial share of the impact is “exported” well beyond Czech borders, is somewhat startling, but a similar result is reported by Brandt and colleagues [43], who estimated that total health-related external costs from all Danish emissions in Europe account for 4.9 billion euros per year while in Denmark for only 817 million euros per year, i.e., about 17% of the total.
From the perspective of international environmental policy, one should ask how this aligns with the fact that the Czech Republic is a contractual party to both the Convention on Long-Range Transboundary Air Pollution (“CLRTAP”), as well as the Convention on Environmental Impact Assessment in Transboundary Context (“Espoo Convention”) that aim to limit transboundary pollution and provide the means for participating in impact assessments of projects capable of affecting the environment beyond borders. In short, neither of the two treaties will empower neighbouring countries to voice their concerns about those potential impacts on their populations if mining beyond the current limits takes place. Perhaps the only exception would be if a new power plant were planned (e.g., a new plant in Pocerady as envisioned in our Variant 4) then a neighbouring country can take part in an environmental impact assessment as mandated by the Espoo Convention.
Another finding is that airborne pollution impacts from electricity and heat generation vastly outnumber impacts from dust emitted during coal mining. This is roughly in line with previous studies that considered the damage to health from airborne emissions from the coal cycle, including the mining stage [11,19], although the level of detail largely differs. While it is possible to compare impacts from mining and electricity generation directly, as we use dispersion models (although accommodated to a spatial range of dispersion), and the same CR functions and monetary values, one should be aware that the much higher impacts from power generation take place over a much larger space. Coal mining analysis focuses on short range effects only because (based i.e., on EIA documentation) dust is by and large a dominant emission from mining activities. These emissions are typically emitted just above ground level when leaving the mining pit. Hence dust concentrations due to mining activities are significantly elevated in a restricted area within and closely adjacent to the mine pit only, i.e., more than 1 μg/m3 increase in annual PM10 concentration affects no more than 1000 residents there. In this respect, we did not account for the possible negative health effects of unfavourable meteorological conditions that may lead to temporarily elevated dust concentrations possibly affecting a greater population for a shorter period. In addition, it should be noted that the impact of mining may not be fully captured as a dominant constituent of dust emissions from mining activities is coarse fraction (PM10 contribution is roughly 20 times higher than PM2.5), but health effects that usually dominate in the quantification of impacts are linked to PM2.5 (adult mortality, work days lost, restricted activity days).
The picture is different in the case of power generation where emissions are released from high stacks usually at about 100+ m above the ground. The stack height is not the only reason for dealing with emissions from power generation on a regional scale however. An even more important role is played by NOx and SO2 emissions acting as precursors of secondary particles and ozone, as these transformations take place in the atmosphere on a larger scale than usually occurs with the dispersion of primary particles. This means that impacts from exposure not only take place over much larger area, but also in different forms—not only as exposure to primary pollutants, but also secondary pollutants—ozone, sulphates and nitrates—originating from chemical transformations in the atmosphere. And in fact these latter ones, sulphates and nitrates, are those which account for about 95% of total health impacts. This finding also projects a note of uncertainty into the calculation, as the current scientific evidence considers particulate matter components at the respective fraction level (i.e., components of PM10 or PM2.5) to be equally harmful, but this evidence is relatively disperse and may be revised with more epidemiological knowledge to come.
Apart from these explicit limitations in our study (stemming from the disregarding of other than airborne pollution, and other coal cycle phases than coal mining and power generation) a huge legacy of environmental burden lies in Northern Bohemia that profoundly affects the quality of life of people living in the region. This encompasses not only the well documented long-term impacts on health [44], but also other dimensions of wellbeing that the damage function approach can barely capture. As anecdotal evidence of a compromised liveability we note that this region hosts the highest number of socially excluded localities and has the lowest prices of residential housing among all regions of the Czech Republic. These latter effects indicate a much broader range of—often interlinked—social and environmental burden imposed by coal mining and related activities on the region that existing costing studies are usually not able to encompass. Indeed, several studies already have pointed out to the wider social and psychological effects of mining (and post-mining) associated with environmental and health inequalities in Appalachia [45], Australia [46,47] and in Canada [48]. This is definitely an interesting topic for future research on environmental/social justice, as well as the long-term perspective for the region and people in the post-carbon future when the mine will close.
The policy lesson from this external cost quantification exercise (and environmental concerns in general) is rather mixed. In spite of the health impacts documented here, and even more importantly in facing climate change mitigation imperatives, the Czech government decided in late 2015 on revising the mining limits at the Bilina mine, i.e., pursuing Variant 2. The timing of this decision paradoxically coincides with negotiation of COP21’s Paris Agreement, where the Czech Republic as a part of EU committed itself to reduce greenhouse gas emissions by at least 40% by 2030. The key argument for such a decision was the need to secure the coal for the heating sector, but at the same time the national energy utility CEZ J.S.C. (operating the Bilina mine through its subsidiary) is about to set in operation a new supercritical power plant in Ledvice in the vicinity of the mine. In addition, the Ministry of Industry and Trade was instructed to analyse the need for brown coal as a part of periodical review of NEP in 2020, and in the event of substantial failures in achieving the goals of NEP2015 (i.e., an increase in renewables, nuclear and energy savings) the possibility looms that the mining limits at the CSA mine may be revised as well.
Acknowledgments
The analysis reported in this article was supported by the Technology Agency of the Czech Republic, project No. TD020183. Scenarios and respective data were collected and developed under a service contract for the Ministry of Industry and Trade of the Czech Republic. The collaboration of the consultancy ATEM Ltd. on the development of scenarios, emission balances and dispersion modelling of dust emissions from coal mining within the service contract is gratefully acknowledged. Responsibility for errors and omissions remains with the authors.
Author Contributions
Vojtěch Máca contributed to the study design and data acquisition, developed the impact and damage assessment of coal mining, and drafted the manuscript. Jan Melichar contributed to the study design and data acquisition, developed the impact and damage assessment of coal use, and revised the manuscript.
Conflicts of Interest
The authors declare no conflict of interest.
References
- National Energy Policy of the Czech Republic; Ministry of Industry and Trade of the Czech Republic: Prague, Czech Republic, 2015.
- Government Resolution of 30 October 1991 No. 444 on the Report on Territorial Environmental Limits for Brown Coal Mining and Energy Generation in the North Bohemian Brown Coal Basin; Government of the Czech Republic: Prague, Czech Republic, 1991. (In Czech)
- Ministry of Industry and Trade of the Czech Republic. Analysis of the Supply Needs of Brown Coal for Heating with Respect to the Proposed Options of Territorial Environmental Limits Revision; Ministry of Industry and Trade of the Czech Republic: Prague, Czech Republic, 2015. (In Czech) [Google Scholar]
- Communication from the Commission—A Framework Strategy for a Resilient Energy Union with a Forward-Looking Climate Change Policy, COM (2015) 80 Final; European Commission: Brussels, Belgium, 2015.
- Gerbaulet, C.; Egerer, J.; Oei, P.-Y.; Paeper, J.; Hirschhausen, C. Die Zukunft der Braunkohle in Deutschland im Rahmen der Energiewende; Deutsches Institut für Wirtschaftsforschung: Berlin, Germany, 2012. [Google Scholar]
- Burtraw, D.; Krupnick, A.; Sampson, G.; Isaac, W.; Chu, J.; Beasley, B. The True Cost of Electric Power: An Inventory of Methodologies to Support Future Decisionmaking in Comparing the Cost and Competitiveness of Electricity Generation Technologies; Resources for the Future: Washington, DC, USA, 2012. [Google Scholar]
- Rowe, R.D.; Lang, C.M.; Chestnut, L.G. Critical factors in computing externalities for electricity resources. Resour. Energy Econ. 1996, 18, 363–394. [Google Scholar] [CrossRef]
- Estimating Externalities of Coal Fuel Cycles. Report No. 3 on the External Costs and Benefits of Fuel Cycles: A Study by the US Department of Energy and the Commission of the European Communities; McGraw-Hill/Utility Data Institute: Washington, DC, USA, 1995.
- National Research Council. Hidden Costs of Energy: Unpriced Consequences of Energy Production and Use; National Academies: Washington, DC, USA, 2009. [Google Scholar]
- ExternE: Externalities of Energy. Methodology 2005 Update; Bickel, P.; Friedrich, R. (Eds.) Office for Official Publications of the European Communities: Luxembourg, Luxembourg, 2004.
- ExternE: Externalities of Energy. Vol. 10: National Implementation; Aróstegui, M.; Leal, J.; Linares, P.; Sáez, R.; Varela, M. (Eds.) Office for Official Publications of the European Communities: Luxembourg, Luxembourg, 1999.
- Hendryx, M.; Ahern, M.M.; Nurkiewicz, T.R. Hospitalization patterns associated with Appalachian coal mining. J. Toxicol. Environ. Health A 2007, 70, 2064–2070. [Google Scholar] [CrossRef] [PubMed]
- Esch, L.; Hendryx, M. Chronic cardiovascular disease mortality in mountaintop mining areas of central Appalachian states. J. Rural Health 2011, 27, 350–357. [Google Scholar] [CrossRef] [PubMed]
- Hendryx, M.; Zullig, K.J. Higher coronary heart disease and heart attack morbidity in Appalachian coal mining regions. Prev. Med. 2009, 49, 355–359. [Google Scholar] [CrossRef] [PubMed]
- Ahern, M.; Hendryx, M. Cancer mortality rates in appalachian mountaintop coal mining areas. J. Environ. Occup. Sci. 2012, 1, 63–70. [Google Scholar] [CrossRef]
- Hendryx, M.; O’Donnell, K.; Horn, K. Lung cancer mortality is elevated in coal-mining areas of Appalachia. Lung Cancer 2008, 62, 1–7. [Google Scholar] [CrossRef] [PubMed]
- Ahern, M.M.; Hendryx, M.; Conley, J.; Fedorko, E.; Ducatman, A.; Zullig, K.J. The association between mountaintop mining and birth defects among live births in central Appalachia, 1996–2003. Environ. Res. 2011, 111, 838–846. [Google Scholar] [CrossRef] [PubMed]
- Fernández-Navarro, P.; García-Pérez, J.; Ramis, R.; Boldo, E.; López-Abente, G. Proximity to mining industry and cancer mortality. Sci. Total Environ. 2012, 435–436, 66–73. [Google Scholar] [CrossRef] [PubMed]
- Sevenster, M.; Croezen, H.; van Valkengoed, M.; Markowska, A.; Doenszelmann, E. External Costs of Coal. Global Estimate; CE Delft: Delft, The Netherlands, 2008. [Google Scholar]
- Bjureby, E.; Britten, M.; Cheng, I.; Kazmierska, M.; Mezak, E.; Munnik, V.; Nandi, J.; Pennington, S.; Rochon, E.; Schulz, N.; et al. The True Cost of Coal: How People and the Planet Are Paying the Price for the World’s Dirtiest Fuel; Greenpeace International: Amsterdam, The Netherlands, 2008. [Google Scholar]
- Huscher, J.; Smith, D. The Unpaid Health Bill: How Coal Power Plants Make Us Sick; Health and Environment Alliance: Brussels, Belgium, 2013. [Google Scholar]
- Epstein, P.R.; Buonocore, J.J.; Eckerle, K.; Hendryx, M.; Stout, B.M.; Heinberg, R.; Clapp, R.W.; May, B.; Reinhart, N.L.; Ahern, M.M.; et al. Full cost accounting for the life cycle of coal. Ann. N. Y. Acad. Sci. 2011, 1219, 73–98. [Google Scholar] [CrossRef] [PubMed]
- Mahapatra, D.; Shukla, P.; Dhar, S. External cost of coal based electricity generation: A tale of Ahmedabad city. Energy Policy 2012, 49, 253–265. [Google Scholar] [CrossRef]
- Nkambule, N.; Blignaut, J. The external costs of coal mining: The case of collieries supplying Kusile power station. J. Energy South. Africa 2012, 23, 85–93. [Google Scholar]
- Inglesi-Lotz, R.; Blignaut, J. Estimating the opportunity cost of water for the Kusile and Medupi coal-fired electricity power plants in South Africa. J. Energy South. Africa 2012, 23, 76–84. [Google Scholar]
- Wang, L.; Watanabe, T.; Xu, Z. Monetization of external costs using lifecycle analysis—A comparative case study of coal-fired and biomass power plants in Northeast China. Energies 2015, 8, 1440–1467. [Google Scholar] [CrossRef]
- Schleisner, L. Comparison of methodologies for externality assessment. Energy Policy 2000, 28, 1127–1136. [Google Scholar] [CrossRef]
- HEI NPACT Review Panel HEI’s National Particle Component Toxicity (NPACT) Initiative. Executive Summary; HEI Research Reports 177 & 178; Health Effects Institute: Boston, MA, USA, 2013; pp. 177–178. [Google Scholar]
- Review of Evidence on Health Aspects of Air Pollution—REVIHAAP Project; World Health Organization: Copenhagen, Denmark, 2013.
- Committee on the Medical Effects of Air Pollutants. Statement on the Evidence for Differential Health Effects of Particulate Matter According to Source or Components; Public Health England: London, UK, 2015. [Google Scholar]
- Preiss, P.; Klotz, V. EcoSenseWeb V1.3: User’s Manual & Description of Updated and Extended Draft Tools for the Detailed Site-Dependent Assessment of External Costs; Institute for Rational Use of Energy, University of Stuttgart: Stuttgart, Germany, 2008. [Google Scholar]
- Holland, M. Implementation of the HRAPIE Recommendations for European Air Pollution CBA Work 2014. Available online: http://ec.europa.eu/environment/air/pdf/CBA HRAPIE implement.pdf (accessed on 20 November 2015).
- Holland, M. Cost-Benefit Analysis of Final Policy Scenarios for the EU Clean Air Package 2014. Available online: http://ec.europa.eu/environment/air/pdf/TSAP%20CBA.pdf (accessed on 20 November 2015).
- Desaigues, B.; Ami, D.; Bartczak, A.; Braun-Kohlová, M.; Chilton, S.; Czajkowski, M.; Farreras, V.; Hunt, A.; Hutchison, M.; Jeanrenaud, C.; et al. Economic valuation of air pollution mortality: A 9-country contingent valuation survey of value of a life year (VOLY). Ecol. Indic. 2011, 11, 902–910. [Google Scholar] [CrossRef]
- Ščasný, M.; Massetti, E.; Melichar, J.; Carrara, S. Quantifying the ancillary benefits of the representative concentration pathways on air quality in Europe. Environ. Resour. Econ. 2015, 62, 383–415. [Google Scholar] [CrossRef]
- Massetti, E.; Bosello, F.; Carrara, S.; Enei, R.; Leimbach, M.; Parrado, R.; Stevanovic, M.; Havlík, P.; Piontek, F.; Popp, A. Scenarios of Global Challenges with Full Adaptation; GLOBAL-IQ Deliverable 5.1; Fondazione Eni Enrico Mattei: Venice, Italy, 2014. [Google Scholar]
- Ludwig, L.; Neumann, J. Updating Income Elasticity Estimates in EPA’s BenMAP Air Pollution Benefits Estimation System. 2012. Available online: http://www3.epa.gov/ttnecas1/regdata/Benefits/IncomeElasticityUpdate_Recommendationswithappendices.pdf (accessed on 20 November 2015). [Google Scholar]
- U.S. Environmental Protection Agency. Emissions Factors & AP 42, Compilation of Air Pollutant Emission Factors; U.S. Environmental Protection Agency: Washington, DC, USA, 2011.
- Brown Coal Reserach Institute. Summary of Existing Knowledge and the Proposal for Calculation of Dust Emissions from Surface Mine; Brown Coal Reserach Institute: Most, Czech Republic, 2014. (In Czech) [Google Scholar]
- ATEM Ltd. Quantification of Environmental Impacts (from Air Pollution and Noise) of Brown Coal Surface Mining in the North Bohemian Brown Coal Basin at BILINA and CSA Opencast Mines and Utilization of Extracted Coal in Combustion Processes for the Production of Electricity and Heat in the Czech Republic; Ministry of Industry and Trade of the Czech Republic: Prague, Czech Republic, 2015. (In Czech) [Google Scholar]
- European Commission. Decision C (2015) 2298 on the Notification by the Czech Republic of a Transitional National Plan Referred to in Article 32 of Directive 2010/75/EU of the European Parliament and of the Council on Industrial Emissions; European Union: Brussels, Belgium, 2015. [Google Scholar]
- LCP BREF Technical Working Group. Draft 2 of LCP BREF Review; European Commission, Joint Research Centre: Seville, Spain, 2015. [Google Scholar]
- Brandt, J.; Silver, J.D.; Christensen, J.H.; Andersen, M.S.; Bønløkke, J.H.; Sigsgaard, T.; Geels, C.; Gross, A.; Hansen, A.B.; Hansen, K.M.; et al. Contribution from the ten major emission sectors in Europe and Denmark to the health-cost externalities of air pollution using the EVA model system—An integrated modelling approach. Atmos. Chem. Phys. 2013, 13, 7725–7746. [Google Scholar] [CrossRef]
- Šrám, R.J.; Beneš, I.; Binková, B.; Dejmek, J.; Horstman, D.; Kotĕsovec, F.; Otto, D.; Perreault, S.D.; Rubeš, J.; Selevan, S.G.; et al. Teplice program—The impact of air pollution on human health. Environ. Health Perspect. 1996, 104 (Suppl. 4), 699–714. [Google Scholar] [PubMed]
- Cordial, P.; Riding-Malon, R.; Lips, H. The effects of mountaintop removal coal mining on mental health, well-being, and community health in Central Appalachia. Ecopsychology 2012, 4, 201–208. [Google Scholar] [CrossRef]
- Higginbotham, N.; Freeman, S.; Connor, L.; Albrecht, G. Environmental injustice and air pollution in coal affected communities, Hunter Valley, Australia. Health Place 2010, 16, 259–266. [Google Scholar] [CrossRef] [PubMed]
- Morrice, E.; Colagiuri, R. Coal mining, social injustice and health: A universal conflict of power and priorities. Health Place 2013, 19, 74–79. [Google Scholar] [CrossRef] [PubMed]
- Shandro, J.A.; Veiga, M.M.; Shoveller, J.; Scoble, M.; Koehoorn, M. Perspectives on community health issues and the mining boom-bust cycle. Resour. Policy 2011, 36, 178–186. [Google Scholar] [CrossRef]
© 2016 by the authors; licensee MDPI, Basel, Switzerland. This article is an open access article distributed under the terms and conditions of the Creative Commons by Attribution (CC-BY) license (http://creativecommons.org/licenses/by/4.0/).
Share and Cite
MDPI and ACS Style
Máca, V.; Melichar, J. The Health Costs of Revised Coal Mining Limits in Northern Bohemia. Energies 2016, 9, 81. https://doi.org/10.3390/en9020081
AMA Style
Máca V, Melichar J. The Health Costs of Revised Coal Mining Limits in Northern Bohemia. Energies. 2016; 9(2):81. https://doi.org/10.3390/en9020081
Chicago/Turabian StyleMáca, Vojtěch, and Jan Melichar. 2016. "The Health Costs of Revised Coal Mining Limits in Northern Bohemia" Energies 9, no. 2: 81. https://doi.org/10.3390/en9020081
Note that from the first issue of 2016, this journal uses article numbers instead of page numbers. See further details here.