3.1. Preliminary Investigation
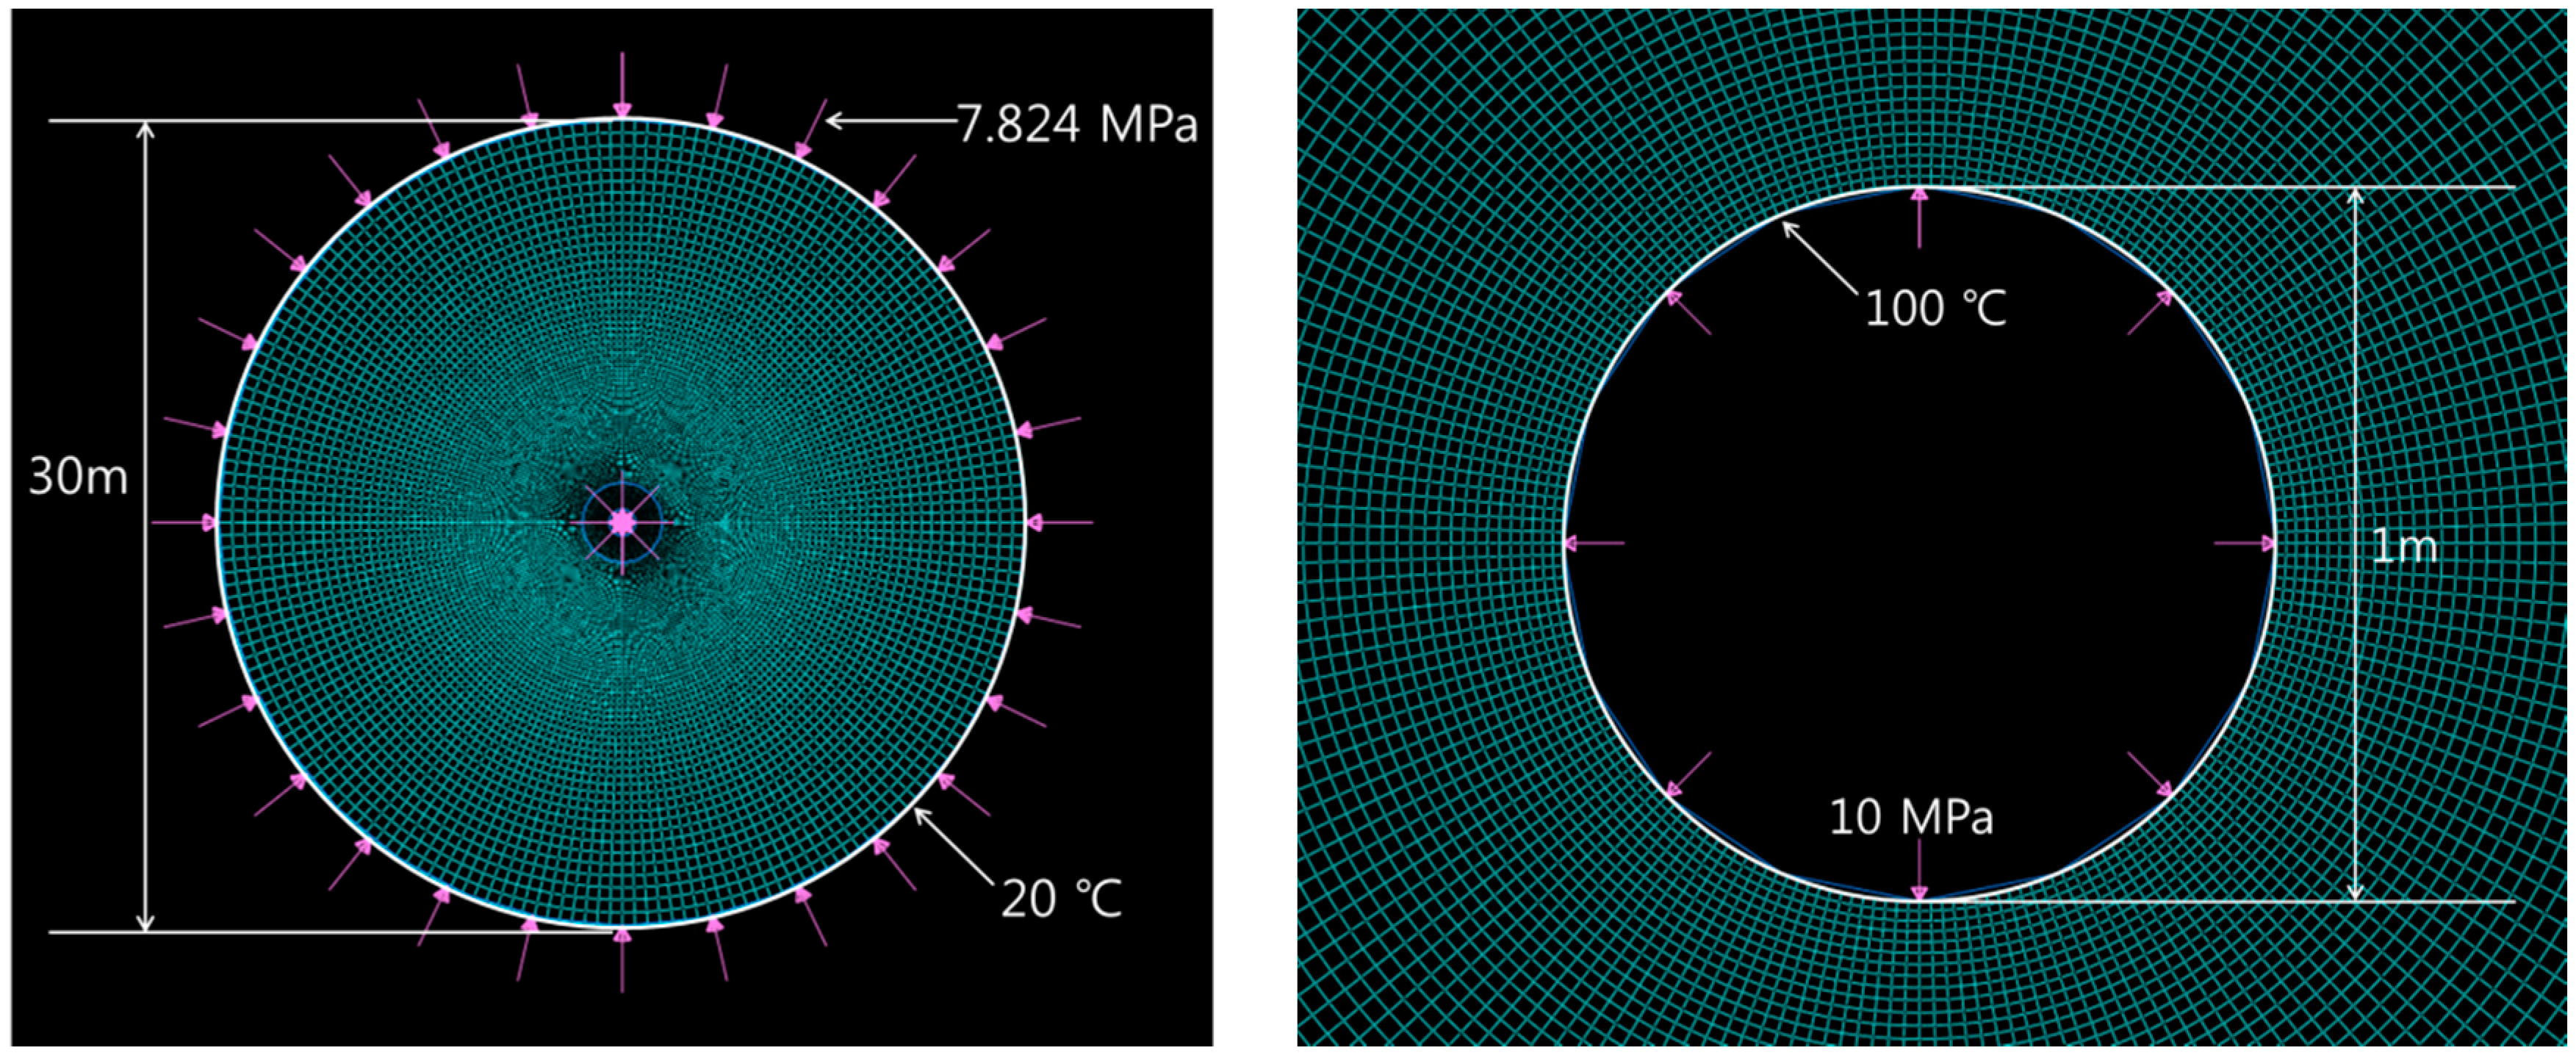
In order to verify boundary conditions around a geothermal wall, a 2-D plane strain model of a geothermal well under internal and external pressure loadings was generated in the domain (
Figure 2), which will be adopted in the numerical analysis for the geothermal well. The well diameter is modeled to be 1.0 m corresponding to the diameter of the geothermal well at 200 m depth. The diameter of the model domain is 30.0 m, which is considerably greater than the well diameter to avoid boundary effects.
Four different boundary conditions applied to the model are presented in
Table 4. The first boundary condition (Case 1) implies the first stage of well excavation only with horizontal earth stress (i.e., pressure). The second boundary condition (Case 2) represents an addition of internal fluid pressure to Case 1 to simulate well operation with no installation of the casing and cementing. In Case 3 and 4, thermal stress is applied to Case 1 and 2, respectively, by maintaining the temperature inside well at 100°C and in the ground formation at 20 °C.
The analytical closed-form solutions to Cases 1 and 2 are well referred and compared with results of the numerical analyses to verify the numerical model of the geothermal well. Kirsch’s solution to Case 1 provides the radial stress (σ
r), tangential stress (σ
θ), and radial displacement (
ur) along with the normalized distance (
r/
a) from the center of well as follows (Hoek and Brown, 1980) [
17]:
where σ
v0 is the initial in-situ vertical stress (Pa),
K0 is the coefficient of earth pressure at rest (-) and assumed to be unity,
a is the radius of well (m),
r is the radial distance from the center of well (m), θ is the angle from the horizontal line (-), and
G is the shear modulus of ground formation (Pa). When the model domain is much larger than the radius of well (
r >>
a), which corresponds to the numerical domain presented herein (refer to
Figure 2), The analytical solutions to the boundary condition of Case 2 are obtained with consideration of internal fluid pressure (
Pi) exerted inside the well described as follows:
where
P0 is the external pressure applied to outside boundary (Pa), and ν is the Poisson’s ratio of ground (-).
The effect of boundary conditions for Cases 3 and 4 was exclusively evaluated by numerical analysis since there is no appropriate analytical solution relevant to such boundary conditions. The material properties input in the numerical model are summarized in
Table 5, which corresponds to the result of the site investigation in the Pohang site (Lee, 2007) [
18]. In other to apply thermal stress in Cases 3 and 4, the ground temperature was set to 20 °C representing the temperature at shallow depth (less than 200 m), and the temperature inside well of 100 °C was applied to consider high fluid temperature during operation of a production well.
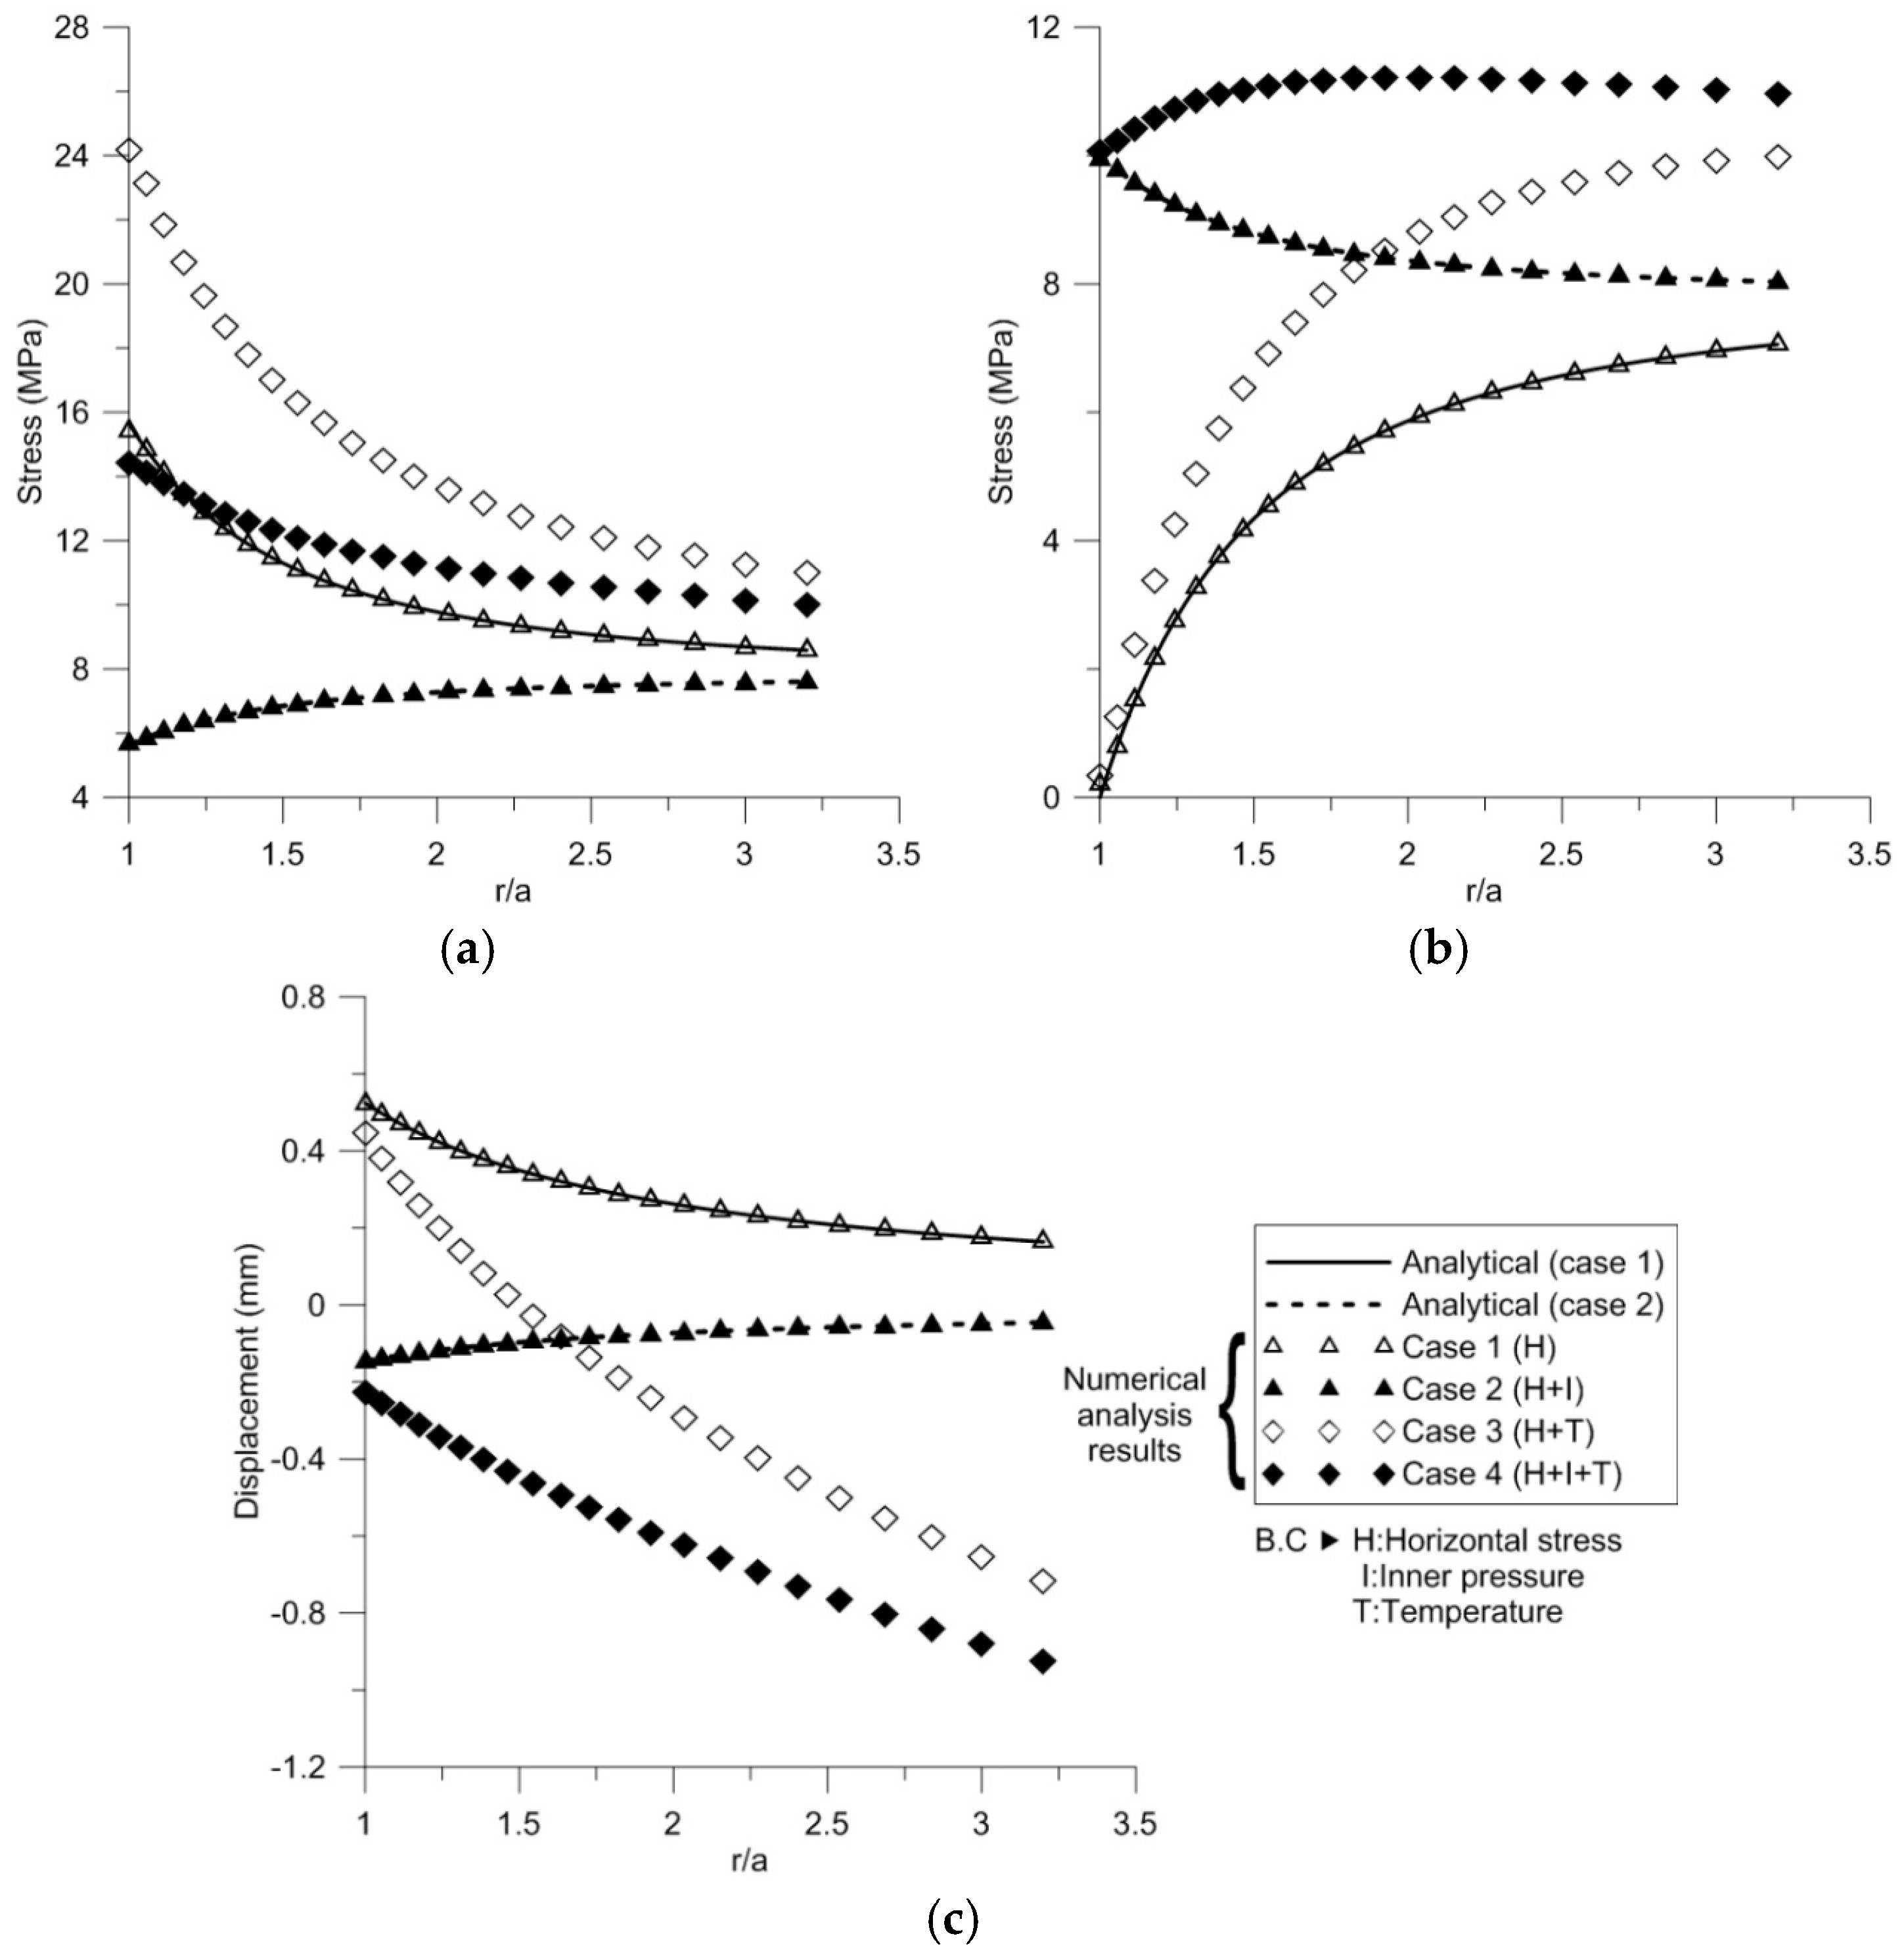
Figure 3 compares the four boundary conditions demonstrating the tangential stress (σ
θ), radial stress (σ
r) and radial displacement (
ur) along with the normalized radial distance (
r/
a). For Cases 1 and 2, the σ
θ, σ
r, and
ur profiles obtained from the numerical analyses are in a good agreement with the analytical solutions (Equations (2)–(4) for Case 1 and Equations (5)–(7) for Case 2). In Case 1, representing the first stage of well excavation without internal fluid pressure, it is observed that the tangential stress is concentrated around the well perimeter, and the radial stress has vanished, which are typical in the elastic solution for a circular hole. In Case 2 with application of internal fluid pressure (10 MPa), the tangential stress decreases, and the radial stress increases substantially by applying the inner pressure. Both the tangential and radial stresses asymptotically converge to the horizontal earth pressure with increasing the radial distance (
r/
a > 5).
The largest value of tangential stress around the well perimeter is observed in Case 3 due to the induced thermal stress by applying the temperature inside well at 100 °C and in the ground formation at 20 °C, respectively. However, Case 4 that approximately represents a real geothermal well in operation shows less tangential stress concentration than Case 3 because the induced thermal stress seems to be counterbalanced with the inner pressure. The radial displacement, which is one of the crucial considerations for the well stability, is compared in
Figure 3c. The positive signed displacement means convergence into the well or inward displacement. Both Cases 1 and 2 show a positive radial displacement, with smaller convergence in Case 2 due to the application of internal fluid pressure. However, the induced temperature boundary conditions (i.e., Cases 3 and 4) yield thermal expansion, which causes a negative signed displacement. Similar to the tangential stress profile, Case 3 shows the steepest change in radial displacement due to the absence of inner pressure, which indicates well stability can be undermined without the application of proper internal fluid pressure.
3.2. Geothermal Well Modeling
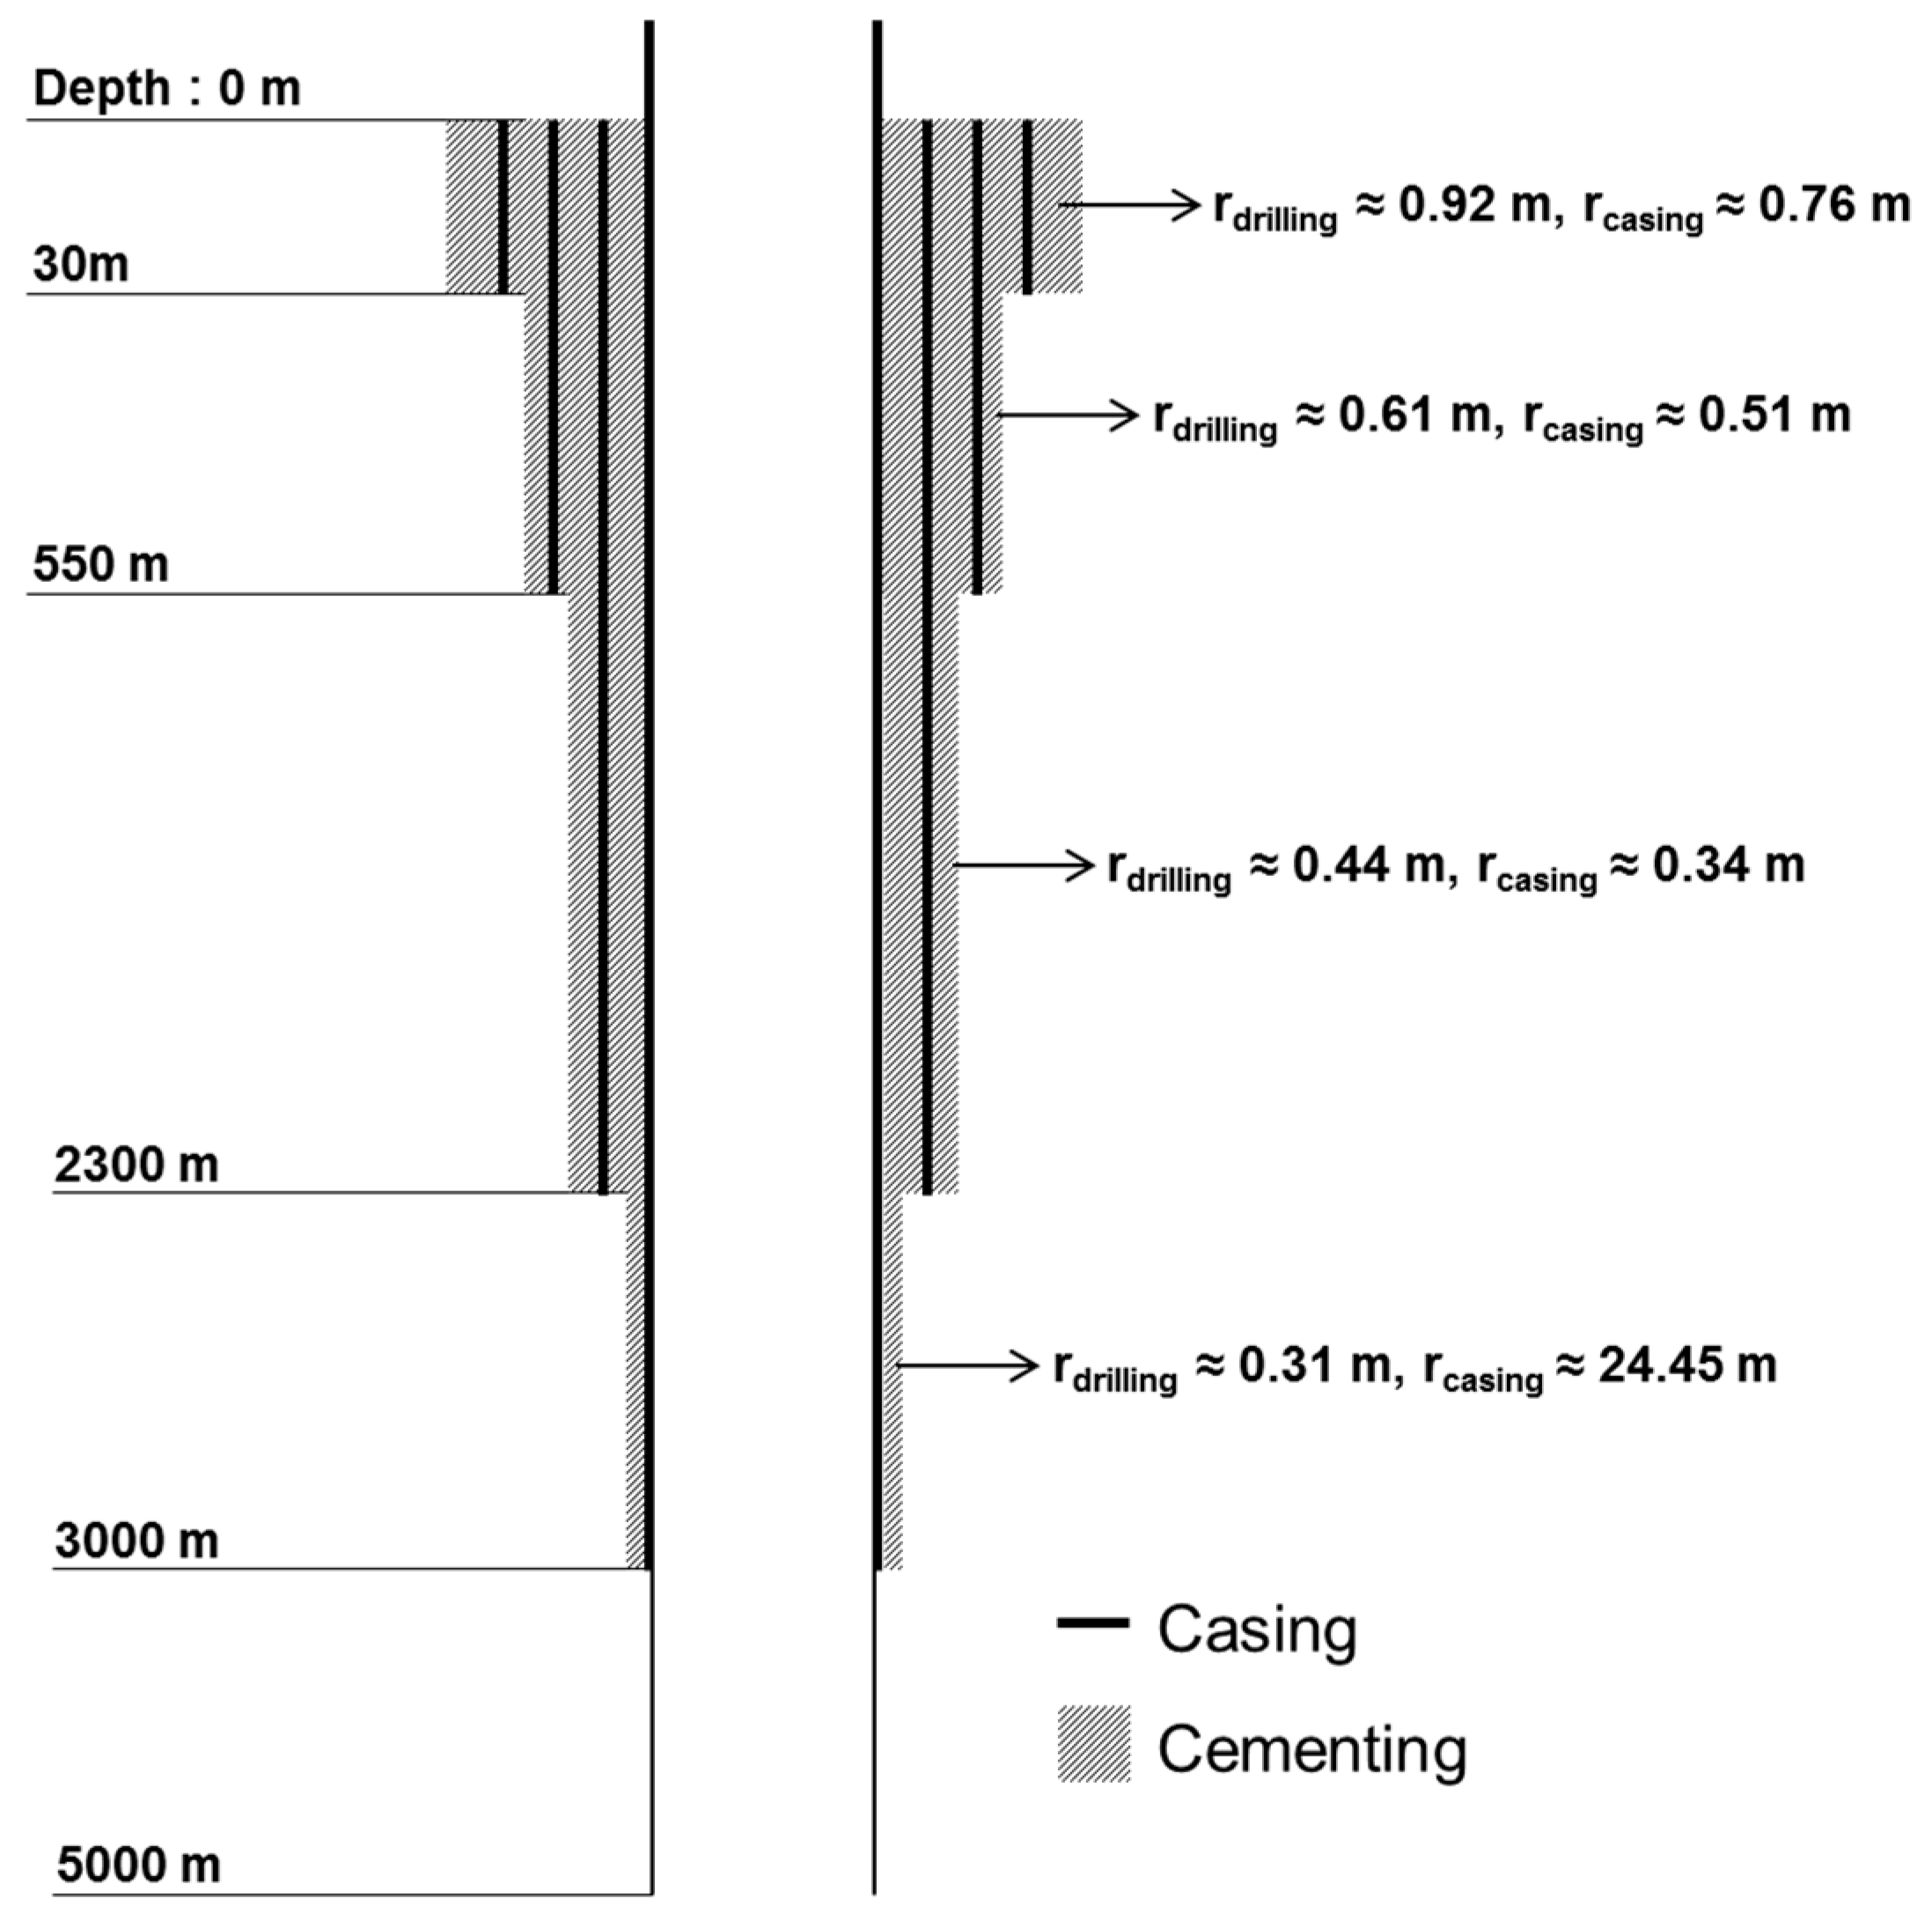
A series of numerical analyses were performed for simulating a production well with five different cross-sections at depths of 200, 1000, 1500, 2000 and 2500 m from the ground surface. The configuration of each cross-section was determined based on the schematic drawing of the geothermal well (as shown in
Figure 4), which is under construction in Pohang, South Korea. The number of casing and cementing component layers decreases as the well goes deeper reflecting the configuration of cross sections at each depth. The dimension of the entire model domain is more than 15 times as large as the well diameter to minimize the boundary effect.
A large deformation analysis was performed using the ABAQUS/Standard program with generating 26,200 quad structured meshes in the domain. Sequentially, a series of coupled thermal stress analyses was implemented to observe thermo-mechanical behavior of the geothermal well. An axisymmetric model was adopted in this paper for computational efficiency (a quarter of
Figure 2). Meshes were made smaller and more compact approaching from the outer ground boundary to the center of the well by applying the proper bias ratio at the straight edge of the domain. The convergence of the analysis was obtained until the largest residual force at any node is less than 0.5%. Bae et al. (2008) [
19] reported the range of horizontal stress distribution with depth by performing a linear regression of the measured data adjacent to the Pohang area. In this paper, the in-situ horizontal stress for each depth was determined by averaging the upper and lower bound of horizontal stresses, which was applied to the outer boundary of the model domain corresponding to the five designated depths (200, 1000, 1500, 2000 and 2500 m). The in-situ ground temperature profile was obtained by adopting the Bullard method as follows (Bullard 1939; Beck and Sass 1966) [
20,
21]:
where
T(
z) is the in-situ ground temperature at depth
z (°C),
T0 is the ground surface temperature (°C),
q is the heat flow (W/m
2),
∆zi is
ith depth interval (m), and
ki is the average thermal conductivity at ∆
zi (W/mK or W/m·°C). According to the thermal characteristics of the Pohang area,
T0 = 15 °C,
q = 78.3 MW/m
2 and
ki = 2.8 W/mK were applied in the model.
Refering to
Table 5, the thermal and mechanical properties of the ground formation were obained from the experimental data for the Pohang area (Lee, 2007) [
18]. The typical thermal and mechanical properties of the casing and cementing adopted in the model are summarized in
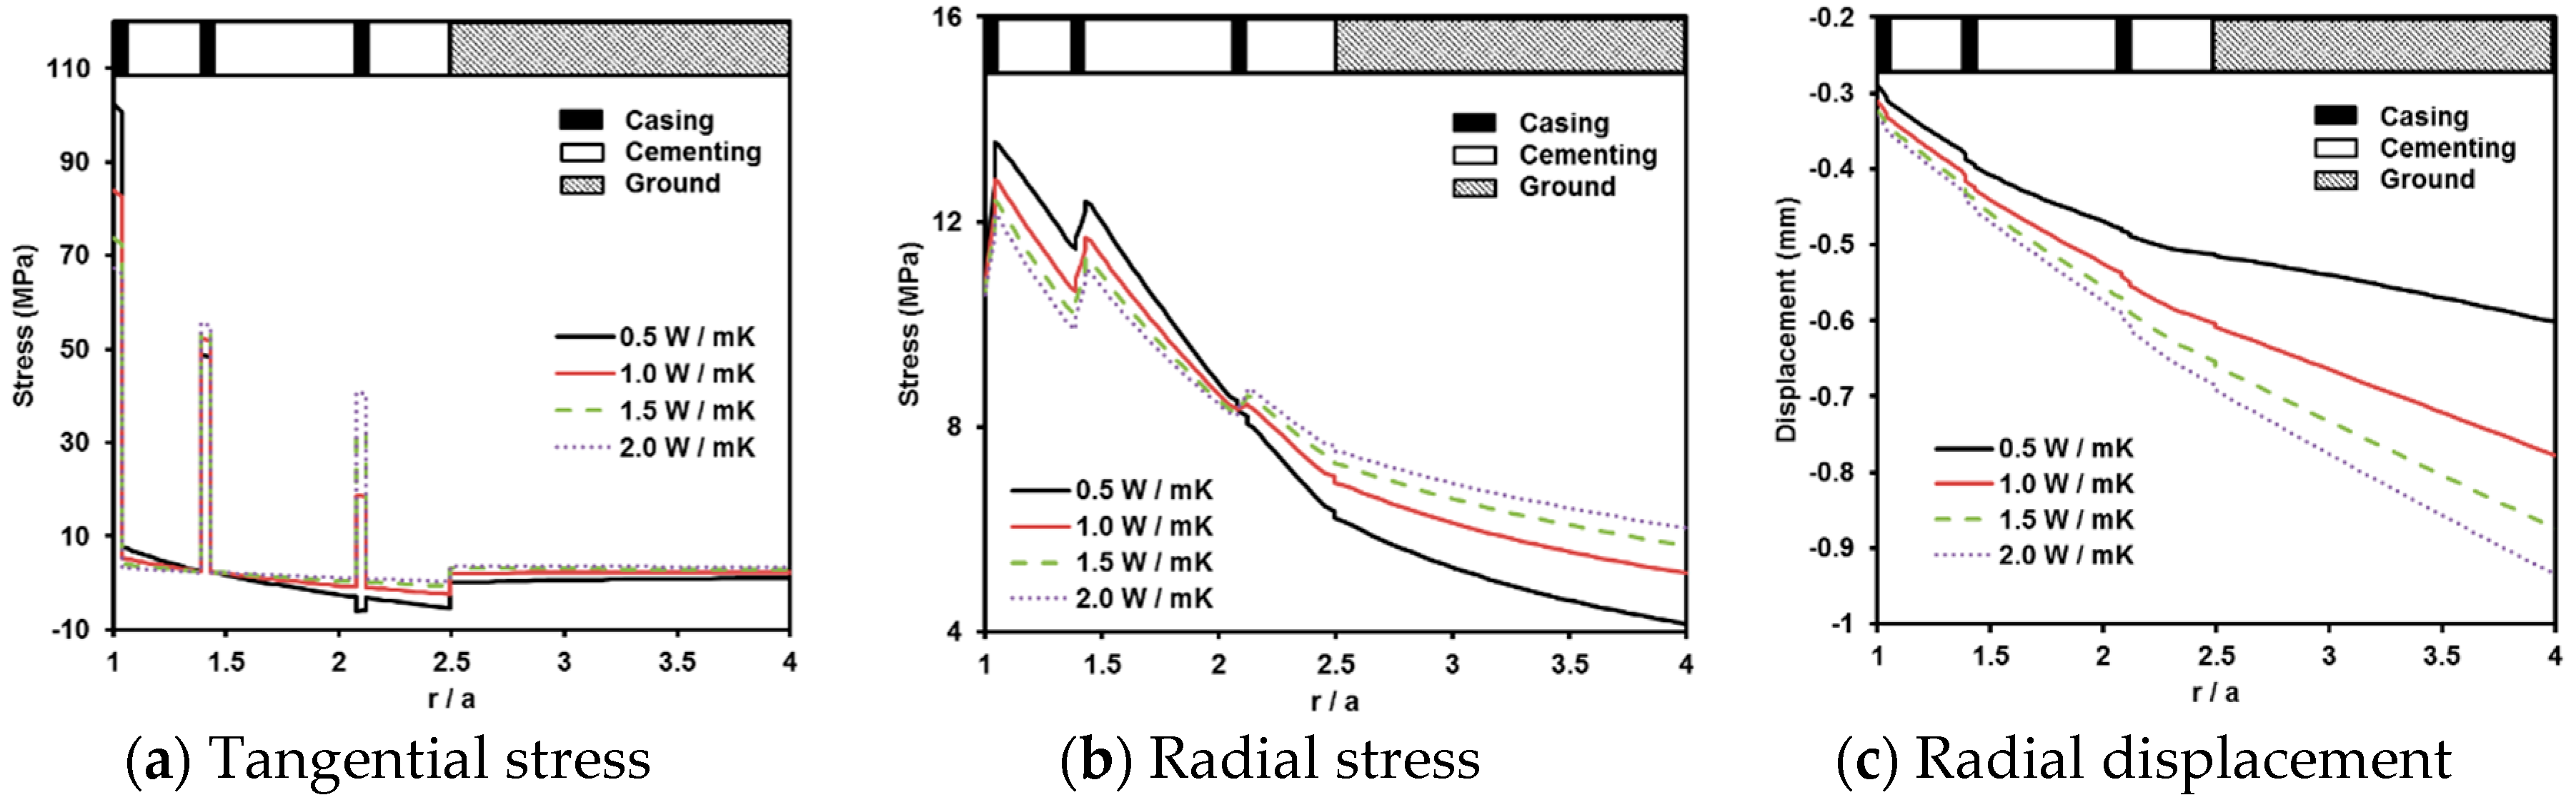
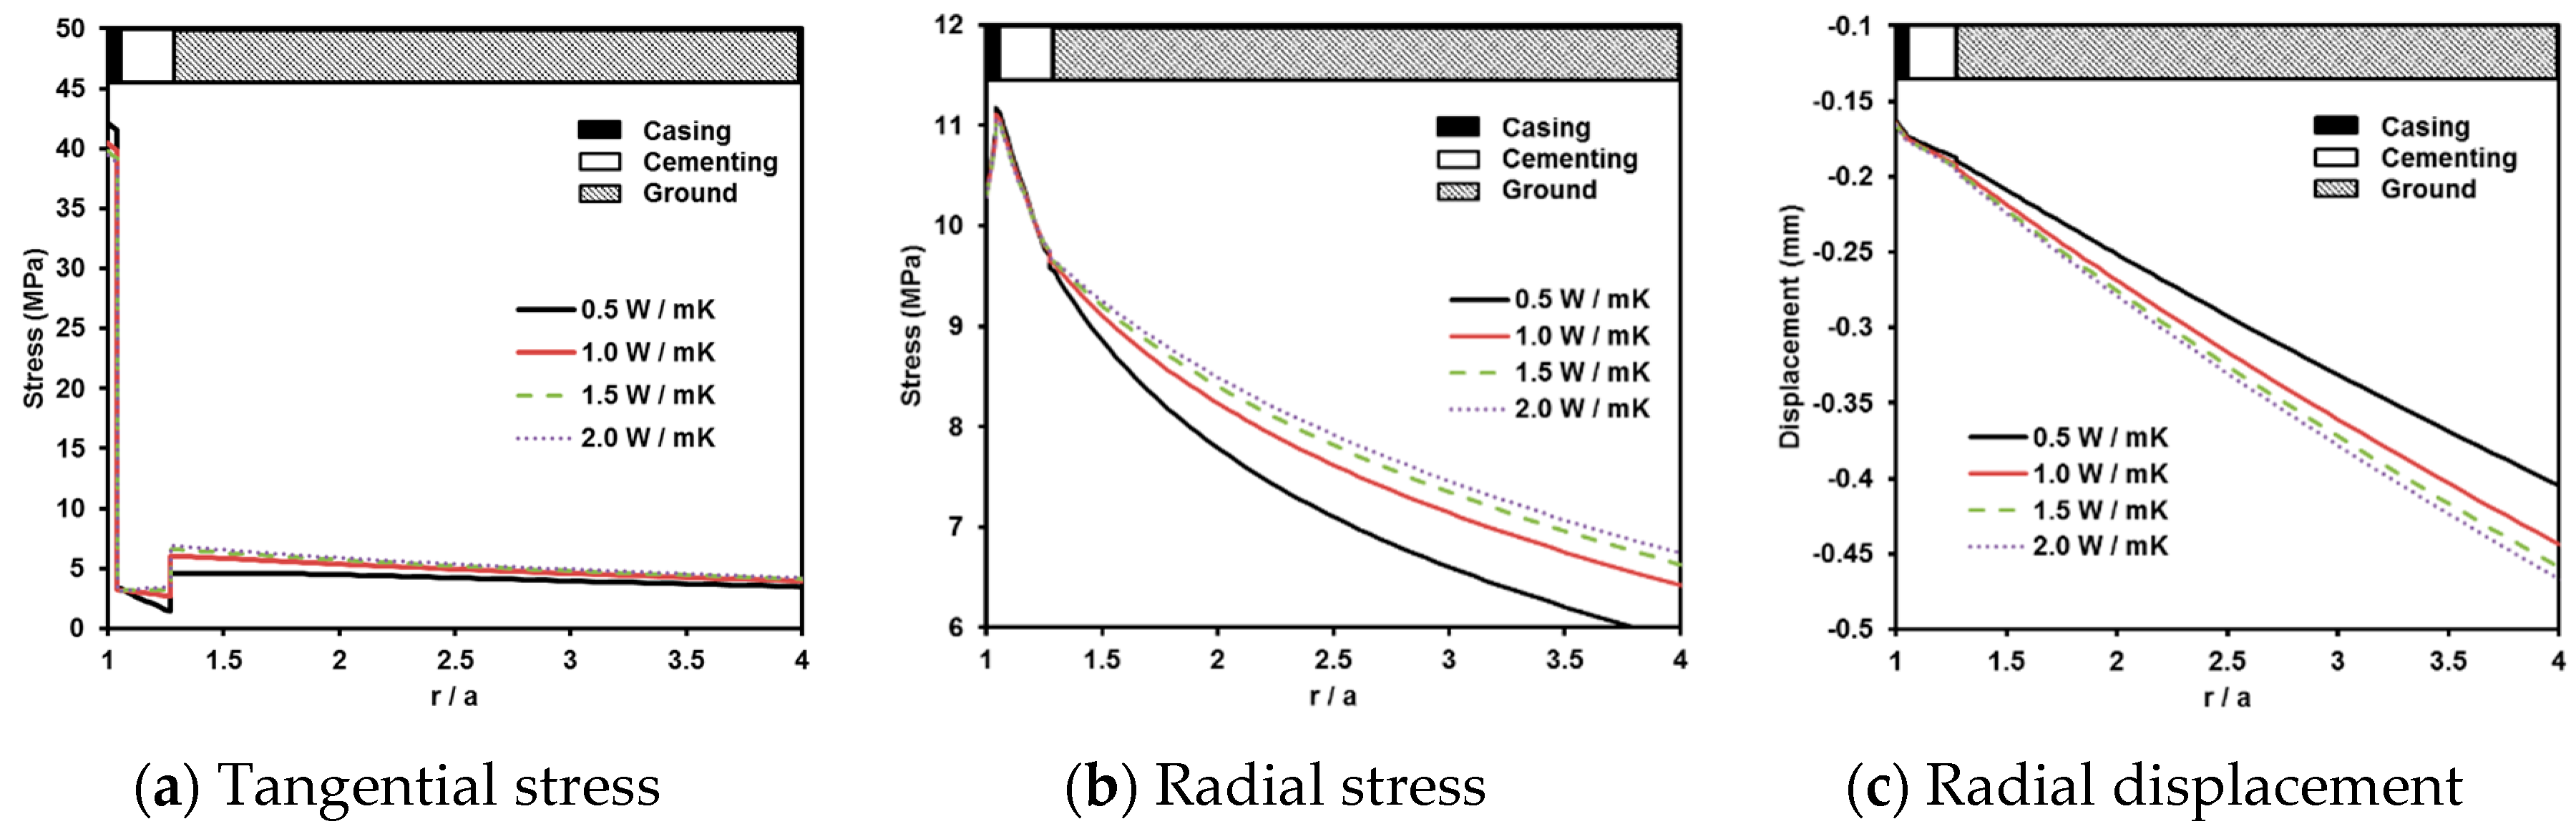
Table 6. In addition, the thermal conductivity of the cementing component was selected to be 0.5 W/mK, which reflects the decreasing trend of thermal conductivity with an increase in the surrounding temperature (refer to
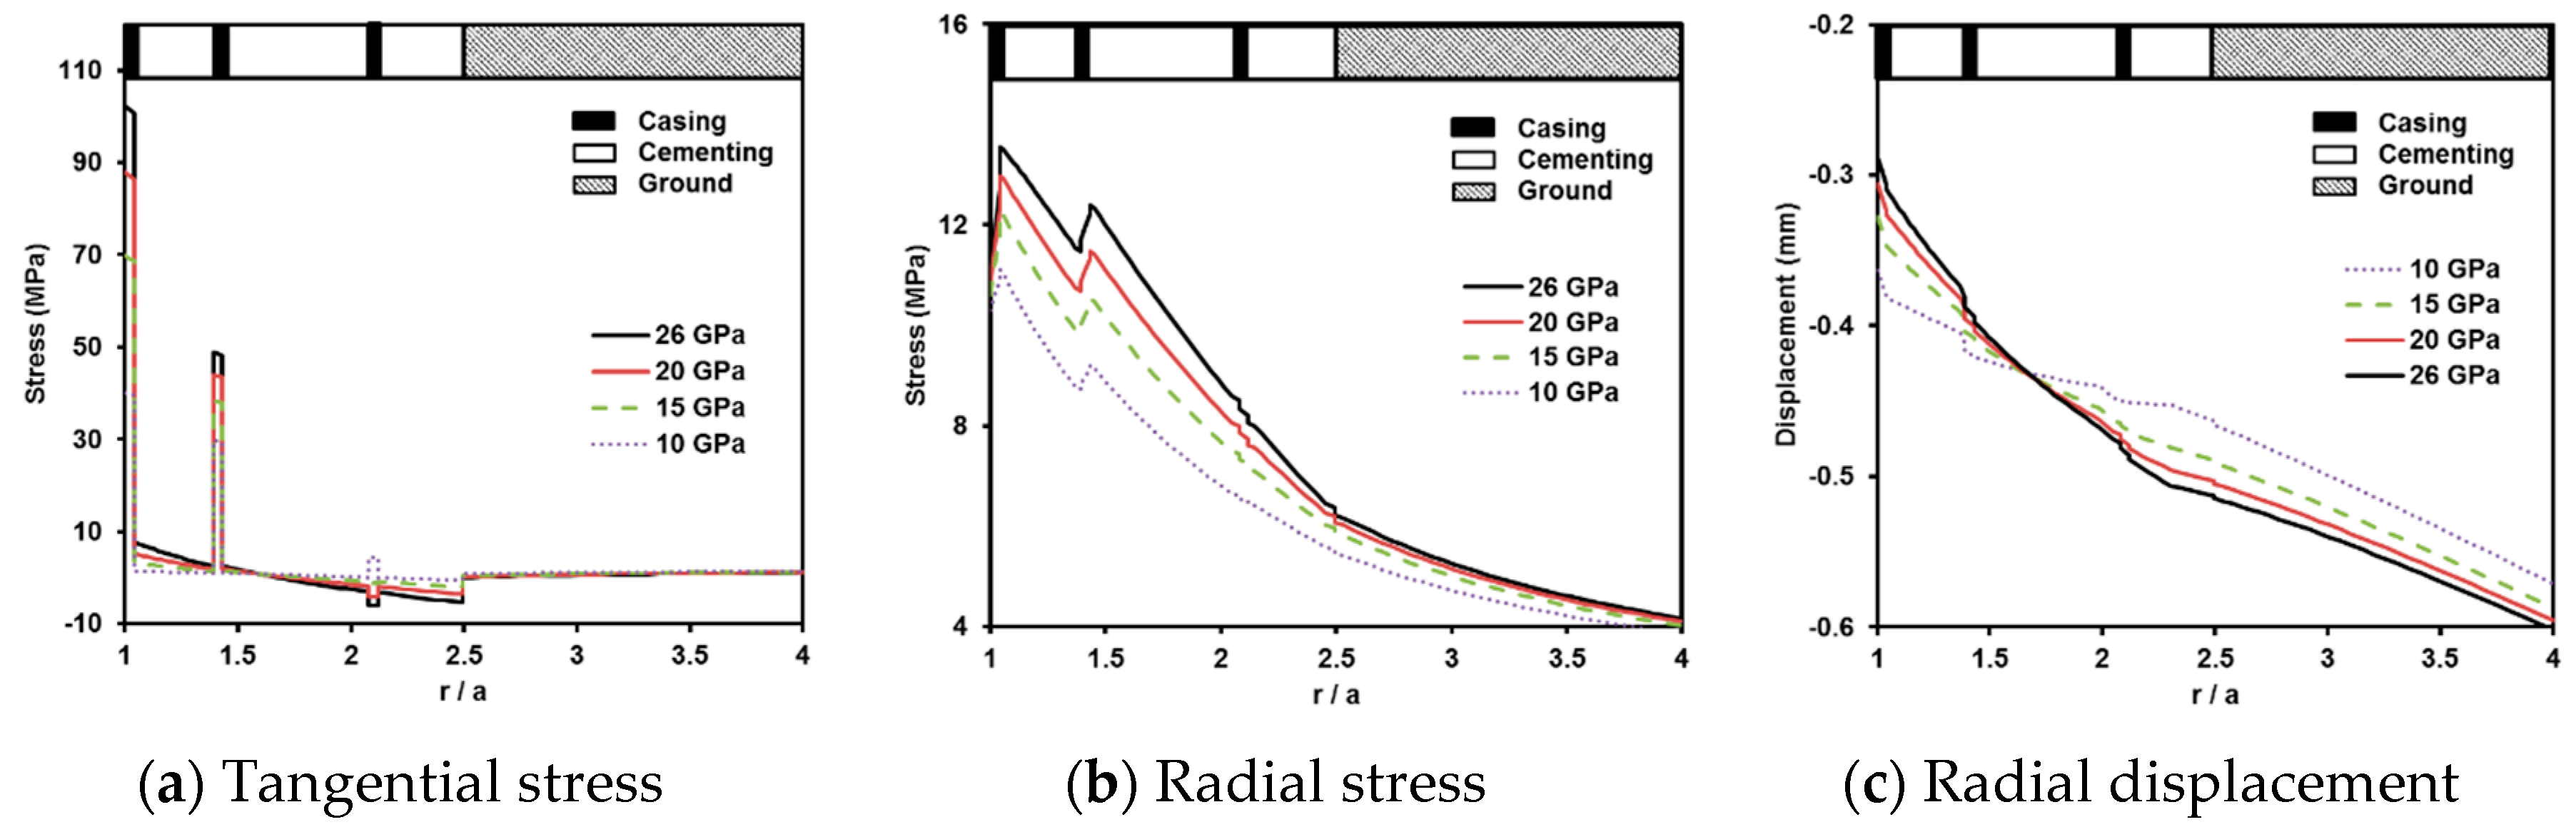
Table 2). Young’s modulus and Poisson’s ratio of cementing were determined by the uniaxial strength test presented in the previous section and density of cementing was applied based on the mixture design presented in
Table 1 (Philippacopoulos and Berndt, 2000 [
11]). The coefficient of thermal expansion and specific heat of cementing were referred to typical ranges of two properties presented in Cruz and Gillen (1980) [
22] and Fu and Chung (1997) [
23], respectively, and properties of casing were referred to steel properties presented in Eurocode 3 (1993) [
24].
The inner pressure was assumed to be 10 MPa regardless of the depth with consideration of the Soultz project case in France (Tester et al., 2006) [
25], and the temperature in the well was fixed to 180 °C at 5 km, which is the target temperature of the Pohang project at the depth of 5 km (Lee et al., 2011) [
26]. The maximum temperature difference between the geothermal reservoir and circulating fluid at the ground surface was assumed to be 20 °C. In other words, the thermal energy is dissipated in the production well while the circulating fluid transports from the deep subsurface to the ground surface with the final temperature of 160 °C at the surface.
3.3. Numerical Simulation of Geothermal Well
The numerical simulation results are compared in
Figure 5, which shows the profiles of tangential stress, radial stress, and radial displacement at the different depths. All results are plotted herein from the first layer of inner casing (
r/
a = 1) to the far field of the ground with
r/
a ratio of 4. The positive sign indicates compressive stress to the material, and the negative signed radial displacement indicates the expansion of the geothermal well.
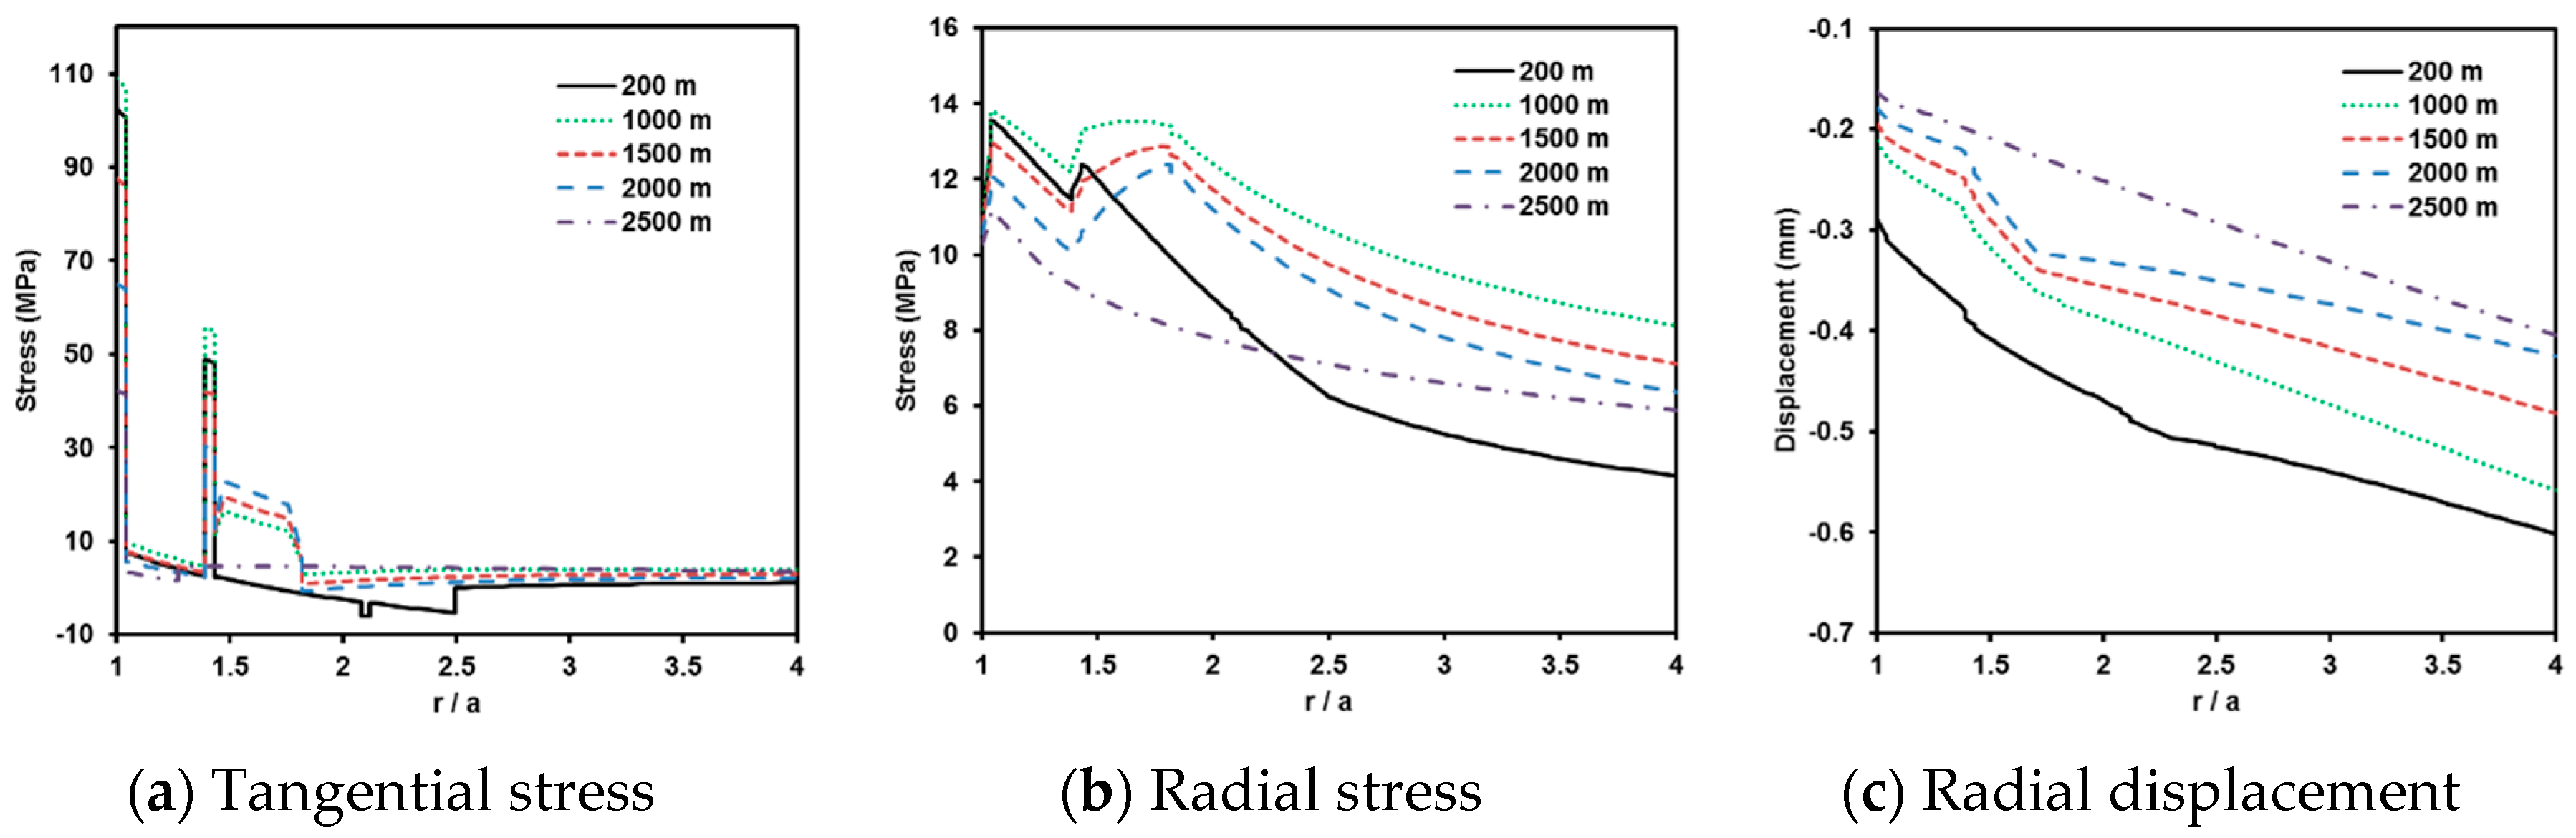
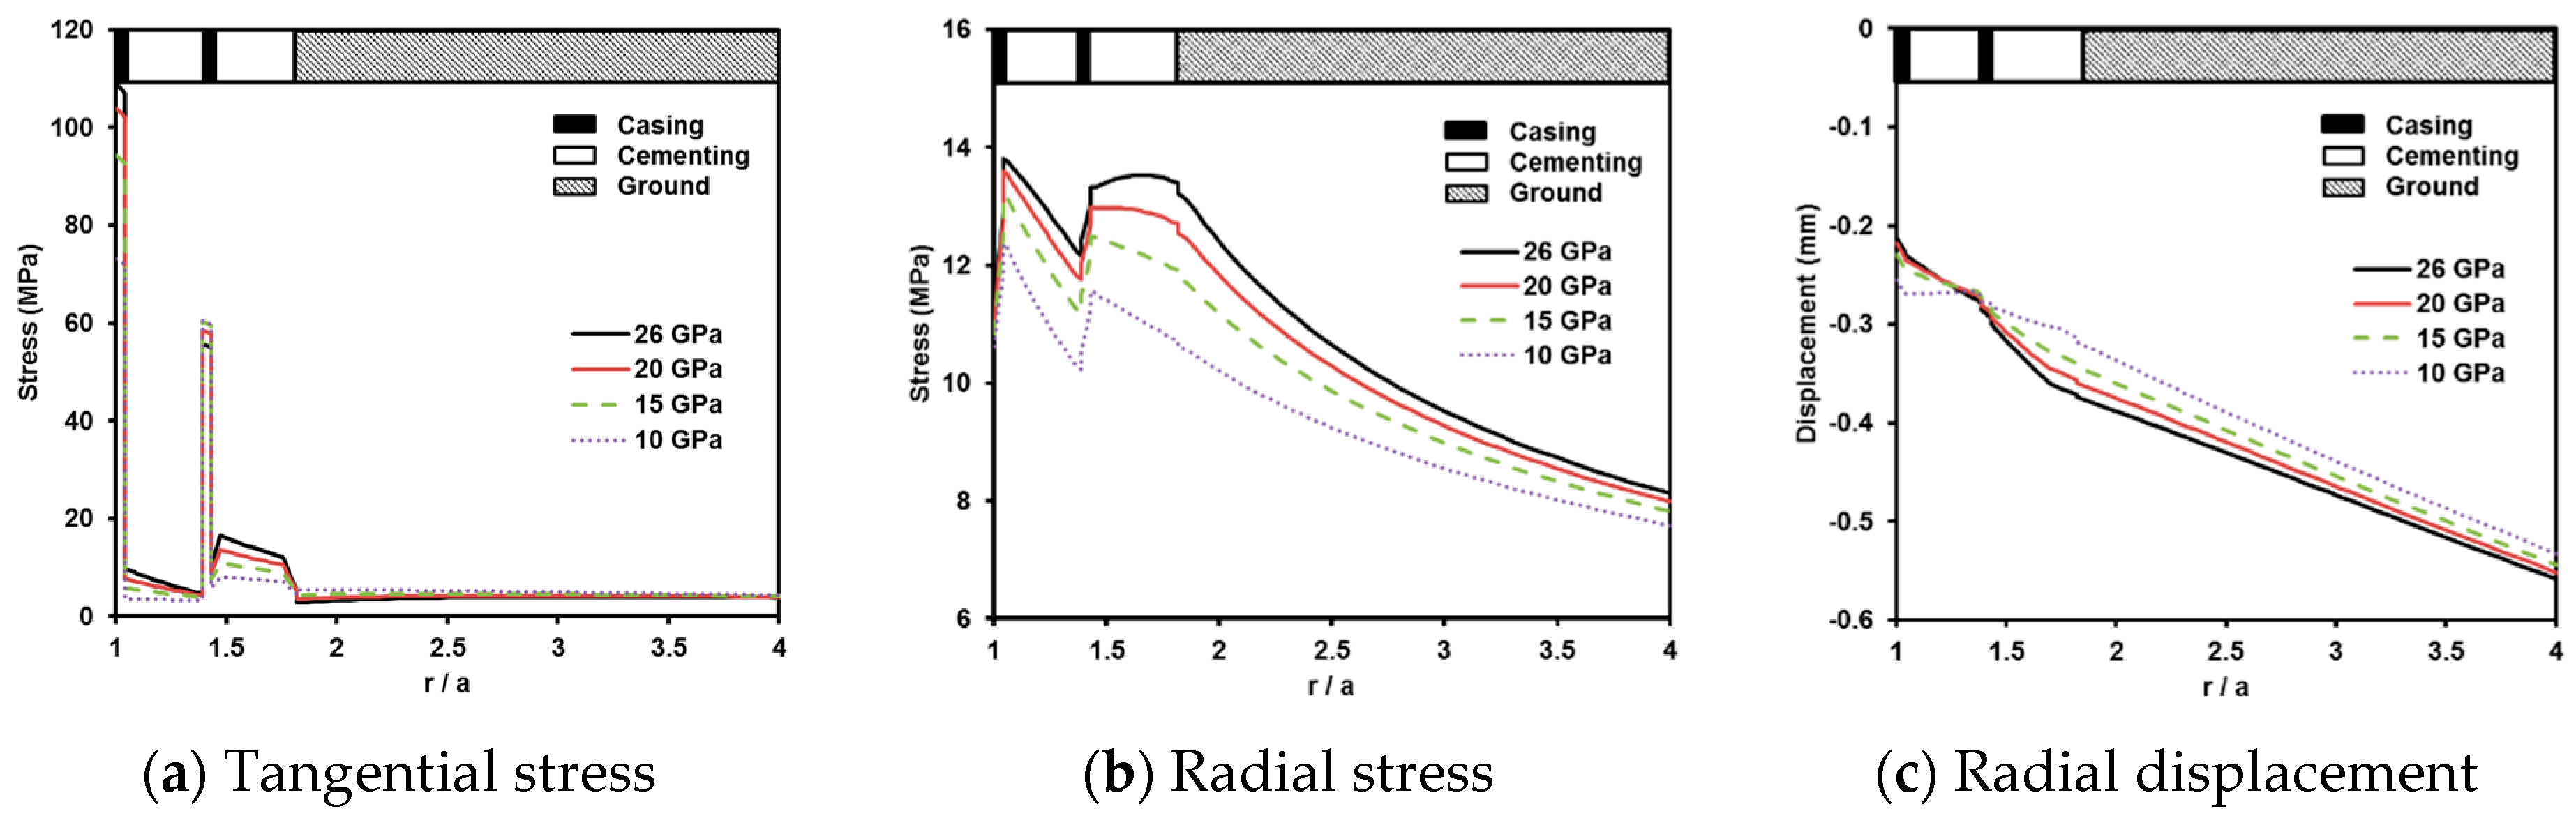
At all five designated depths, the tangential stress concentration is much greater than the radial stress in terms of the thermo-mechanical behavior of the geothermal well. As shown in
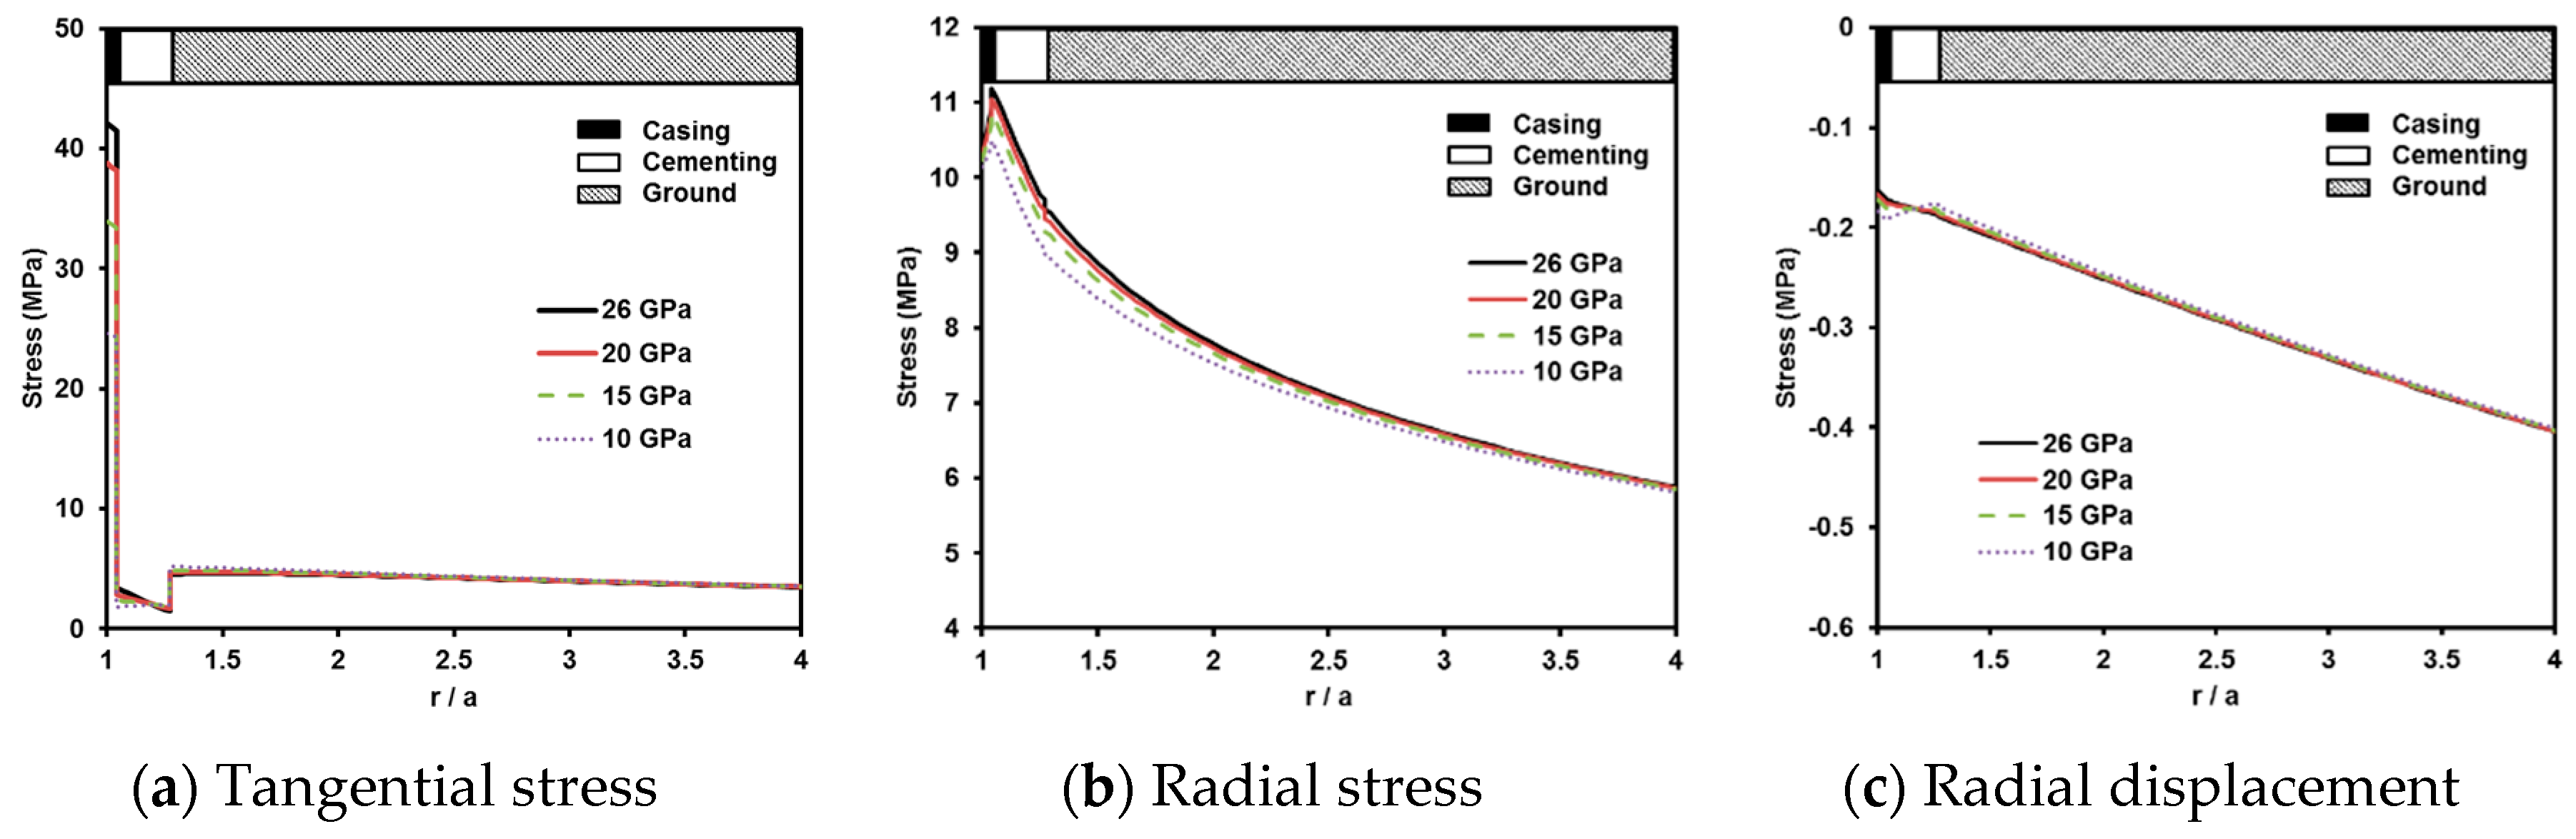
Figure 5a, the first inner casing component is most vulnerable to tangential stress concentration with the maximum tangential stress of about 110 MPa at 1000 m depth, which is slightly lower than the compressive strength of ordinary steel normally, that is about 150 MPa. Note that the geothermal well undergoes tensile stress in some parts at the depth of 200 m. On the other hand, at the depths of 1000, 1500, and 2000 m, the outer cementing component undergoes relatively high tangential stress compared with the surrounding ground formation due to the relatively higher Young’s modulus. Since steel possesses high tensile strength (normally about 400 MPa), mechanical stability should be considered in the most outer cementing component at 200 m depth because cement only has a tensile strength of a few MPa. As the number of casing components increases, the less tangential stress concentration is exerted to the cementing component, so the steel casing can take the role of protecting the cementing component.
As shown in
Figure 5b, the radial stress at the first inner casing (
r/
a = 1) is equal to the applied inner pressure of 10 MPa. With exhibiting radial stress concentration at the streel casings due to high modulus, the radial stress is asymptotically converged to the horizontal earth pressure exerted at each designated depth.
The radial displacement shows a negative sign (i.e., the geothermal well is expanded) at all designated depths and all components of the geothermal well due to the application of inner fluid pressure and the thermal expansion. The deeper the designated depth is, the less radial displacement is induced. That is to say, the radial displacement is greatest at the depth of 200 m because of the relatively high thermal expansion (the high temperature difference between the inside well and surrounding ground formation). One additional reason for this is that increasing of in-situ horizontal stress with depth may compensate the effect of the inner fluid pressure and thermal expansion.


