Article

Optimal Sizing of Vanadium Redox Flow Battery Systems for Residential Applications Based on Battery Electrochemical Characteristics

School of Chemical Engineering, The University of New South Wales, Sydney, NSW 2052, Australia
*
Author to whom correspondence should be addressed.
Energies 2016, 9(10), 857; https://doi.org/10.3390/en9100857
Submission received: 18 August 2016 / Revised: 30 September 2016 / Accepted: 13 October 2016 / Published: 22 October 2016
(This article belongs to the Special Issue Selected Papers from 2nd Energy Future Conference)

Abstract

:
The penetration of solar photovoltaic (PV) systems in residential areas contributes to the generation and usage of renewable energy. Despite its advantages, the PV system also creates problems caused by the intermittency of renewable energy. As suggested by researchers, such problems deteriorate the applicability of the PV system and have to be resolved by employing a battery energy storage system (BESS). With concern for the high investment cost, the choice of a cost-effective BESS with proper sizing is necessary. To this end, this paper proposes the employment of a vanadium redox flow battery (VRB), which possesses a long cycle life and high energy efficiency, for residential users with PV systems. It further proposes methods of computing the capital and maintenance cost of VRB systems and evaluating battery efficiency based on VRB electrochemical characteristics. Furthermore, by considering the cost and efficiency of VRB, the prevalent time-of-use electricity price, the solar feed-in tariff, the solar power profile and the user load pattern, an optimal sizing algorithm for VRB systems is proposed. Simulation studies are carried out to show the effectiveness of the proposed methods.

1. Introduction

In recent years, rooftop solar photovoltaic (PV) systems are increasingly used in residential areas [1,2]. By harvesting the solar energy, reduced electricity bills and lower greenhouse gas emissions are expected by the investors. However, due to the intermittent nature of solar irradiance, unpredictable fluctuations will be generated in the harvested solar energy, making it unsuitable for direct load power supply and/or grid integration [3,4]. To attenuate the effects of solar intermittency, the employment of a local battery energy storage system (BESS) is proposed by researchers [5,6]. Furthermore, in view of the high grid electricity price and very low solar feed-in tariffs in some countries, such as Spain and Australia [7,8], selling solar energy back to the grid is not a wise choice. Instead, storing surplus solar energy and utilizing it for load levelling becomes more desirable. This means that the usage of BESS is not only technically, but also economically beneficial for PV system owners. In fact, time-varying electricity prices, i.e., time-of-use (TOU) rates, have been proposed and adopted in several countries and areas [9,10,11]. In view of such situations, the benefit of employing BESS can be further extended through peak shaving in high price regions. This means users with BESS will be able to reduce peak-hour load consumption by purchasing and storing energy during off-peak hours in addition to the storage of solar energy.
Despite its advantages, the high cost of BESS necessitates the selection of appropriate battery technology. In reality, among all types of batteries, the vanadium redox flow battery (VRB) is considered to be one of the most promising candidates for renewable and residential applications [12]. It possesses attractive features of a long cycle life, high energy efficiency and low maintenance cost [13,14]. Therefore, the employment of VRB in residential areas with PV generation is cost effective. From the viewpoint of BESS users, another important factor that needs to be considered is the sizing of BESS. In the past decade, a substantial amount of research attention has been given to the appropriate sizing of BESS. Unfortunately, the majority of them focus on the lead-acid or Li-ion batteries [15,16,17]. These types of batteries have coupled power and energy ratings. Thus, the corresponding sizing approaches are not directly applicable to VRB. In recent years, some research articles have been published on the characterization and sizing of VRB systems for microgrid applications [18,19]. Nonetheless, the proposed methods for battery efficiency and cost evaluation are based on a specific set of field test data and empirical equations, respectively. Consequently, they may not be accurate for general VRB systems. In fact, several important variables, which affect VRB cost, are not explicitly considered by the cost evaluation method in [20]. Moreover, the study in [19] investigates the sizing of VRB from the viewpoint of the microgrid operator rather than users in residential areas. Thus, further studies are required on the proper sizing of VRB systems for residential applications with more accurate efficiency and cost evaluation approaches.
As concerns such scenarios, this paper proposes an optimal sizing method for the VRB system in residential applications. It provides a guideline for the computation of the capital and maintenance costs of the VRB system. Furthermore, it presents a generalized efficiency evaluation approach based on a detailed VRB electrochemical model and a typical charge/discharge strategy. The proposed optimal sizing method is carried out offline by using historical data of solar generation and load consumption. It can be efficiently implemented in the MATLAB environment.
The remaining part of this paper is structured as follows: In Section 2, the computational method of VRB capital and maintenance costs is presented. Then, a generalized VRB efficiency evaluation approach is provided in Section 3. To illustrate the time-varying electricity price in the residential retail power market, the Australian TOU price policy is reviewed in Section 4. Subsequently, the proposed optimal VRB sizing algorithm is presented in Section 5 with an illustrative case study. Finally, the conclusion is drawn in Section 6. Acronyms are listed in Table 1.

2. Computation of VRB Costs

2.1. Capital Cost

Theoretically, a VRB consists of electrolyte tanks (positive and negative tanks), stacks, endplates and pumps. Its configuration is briefly depicted in Figure 1. The capital costs of key components of VRB can be computed by using Equations (1) to (10). Notations used in these equations are defined in the nomenclature on the next page. The numerical values of 1.35 in Equations (1) and (2) and 1.1 in Equation (3) represent the average open-circuit potential at 50% SOC and the nominal design of the membrane (where the area of the membrane is slightly larger than the area of the electrode to avoid internal leakage), respectively. In general, Equation (1) calculates the nominal current I n o m i n a l flowing through a single stack and its density I d e n s i t y by considering the voltage efficiency v e f f i c i e n c y . Equation (2) firstly calculates the nominal cell voltage v c e l l as the difference between average open-circuit potential and the internal voltage drop. Then, it computes the number of cells to be connected in each stack to provide the desired stack terminal voltage v s t a c k . In Equation (3), the areas of electrode, membrane and graphite are computed, where S e l e c t r o d e represents the total area of the electrode and is expressed as the product of the electrode area per cell (in units of m 2 ) and the number of cells. Since the area of the membrane has to be slightly larger than that of the electrode to prevent internal leakage and each cell has two graphite plates, the coefficients 1.1 and two are used in the calculation of the membrane and graphite areas, respectively. To estimate the cost of the electrolyte, its volume has to be computed first as V e l e c t r o l y t e in Equation (4), where the vanadium concentration μ v a n a d i u m , the coefficient of moles per kWh μ m o l e s and the actual utilization rate μ u t i l i z a t i o n are used. Similarly, the weight of vanadium pentoxide is calculated in the bracket of the first term of Equation (8). Equations (4) to (9) summarize the cost of different parts of VRB, and their summation provides the capital cost of VRB, as shown in (10). Noticeably, the coefficient two has been introduced in the computations of the costs of the endplate C e n d p l a t e and flow frame C f l o w because the quantity of endplates, flow frames and electrodes in each cell is two.
I n o m i n a l = P n o m i n a l v s t a c k × N s t a c k , I d e n s i t y = 1 . 35 × ( 1 v e f f i c i e n c y ) R c e l l × ( 1 + v e f f i c i e n c y )
v c e l l = 1.35 I d e n s i t y × R c e l l , N c e l l = v s t a c k v c e l l × N s t a c k
S e l e c t r o d e = I n o m i n a l I d e n s i t y × N c e l l 10000 , S m e m b r a n e = 1.1 × S e l e c t r o d e , S g r a p h i t e = 2 × S e l e c t r o d e
V e l e c t r o l y t e = P n o m i n a l × H n o m i n a l × μ m o l e s μ u t i l i z a t i o n × μ v a n a d i u m , C m e m b r a n e = β m e m b r a n e / m 2 × S m e m b r a n e
C g r a p h i t e = β g r a p h i t e / m 2 × S g r a p h i t e , C e n d p l a t e = N s t a c k × β e n d p l a t e × 2
C f l o w = N c e l l × β e l e c t r o f a b r × 2 + N c e l l × β f l o w f a b r × 2 , C a s s e m b l e = N s t a c k × β a s s e m b l e / s t a c k
C s t a c k = C m e m b r a n e + C g r a p h i t e + C e n d p l a t e + C f l o w + C a s s e m b l e
C e l e c t r o l y t e = ( μ e l e c t r o l y t e μ u t i l i z a t i o n × P n o m i n a l × H n o m i n a l ) × β v a n a d i u m + V e l e c t r o l y t e × β a c i d
C t a n k = β t a n k / k W h × P n o m i n a l × H n o m i n a l , C p u m p = 2 × β p u m p × ( N s t a c k × P s t a c k )
C V R B = C s t a c k + C e l e c t r o l y t e + C t a n k + C p u m p
Furthermore, it is pointed out that the number of stacks used in a VRB is determined by battery nominal power P n o m i n a l and the maximum power handling capability of each stack P s t a c k , where N s t a c k P n o m i n a l P s t a c k ( N s t a c k N ). In most cases, the maximum power that a VRB stack can handle is larger than its nominal power. For instance, a 5-kW stack can handle a peak power of 10 kW (i.e., P s t a c k = 10 kW), and a 30-kW stack can support charging/discharging power up to 50 kW (i.e., P s t a c k = 50 kW). In practical applications, the maximum power handling capability of a VRB stack is determined by its manufacturing data. Since the configuration of multiple 5-kW stacks is commonly used in the VRB system, a 5-kW stack is selected as the basic module of VRB in this paper.
Of course, to properly control the charging/discharging processes of VRB, a power electronic inverter is necessary. In reality, the cost of such an inverter is usually much lower than that of VRB. This is especially true considering the rapidly decreasing prices of power electronic devices. In view of this, the capital cost of the power inverter is briefly estimated as a function of the VRB nominal power as shown in Equation (11).
C i n v e r t e r = β i n v e r t e r × P n o m i n a l
In theory, the total capital cost of the VRB system is equal to the sum of battery cost C V R B and inverter cost C i n v e r t e r . However, to compensate for the uncertainties and price variations of different components in the VRB system, it is helpful to add a mark-up factor to the actual total capital cost. This is shown in Equation (12), where β m a r k u p denotes the mark-up factor. It is a user-defined factor and is selected to be one in this paper for a conservative capital cost estimation.
C V R B S y s = ( C V R B + C i n v e r t e r ) × ( 1 + β m a r k u p )

2.2. Maintenance Cost

The maintenance of the VRB system requires timely replacement of the membrane and annual preventive overhaul. Theoretically, the cost of the former term is dependent on the lifespan of the membrane and the VRB nominal power; whereas, the cost of the latter term is more or less fixed. Consequently, the maintenance cost of the VRB system can be summarized by Equations (13) and (14), where the lifespans of VRB L V R B and membrane L M e m b r a n e are expected to be 24 years and eight years, respectively.
C r e p l a c e = C m e m b r a n e + β r e p l a c e × P n o m i n a l
C m a i n t e n a n c e = β a n n u a l × L V R B + C r e p l a c e × ( L V R B L M e m b r a n e 1 )

2.3. Overall Cost

By adding up capital and maintenance costs, the overall cost of the VRB system in a 24-year lifetime can be worked out. To provide an illustrative example, the parameters for the VRB cost computation are tabulated in Table 2. Based on these parameters, the overall cost/kWh of a VRB system (overall cost/(nominal power × capacity)) can be computed. The results are shown by blue curves in Figure 2 and Figure 3, where the nominal power and capacity of BESS are varied, respectively.
From these figures, it can be seen that the cost/kWh of VRB drops significantly with the increase of its energy storage capability in kWh. It is noted that the zigzag shape in the blue curve of Figure 2 is caused by the increase of the number of stacks to satisfy higher power demand. As is known, VRB is famous for its low cost/kWh compared to some other batteries with a very limited cycle life, such as the lithium battery. To make a comparison, the overall cost/kWh of employing the lithium battery in 24 years’ time is briefly estimated by using the approach and data presented in [21,22]. The lithium battery with a standard 3000 life cycles (which has a lifespan of approximately 4.1 years with two charge/discharge cycles every day) and the peripheral power inverter is chosen, where the inverter cost is taken to be equal to that of VRB systems under the same ratings. Furthermore, the battery depreciation cost is neglected, and the annual maintenance cost is chosen to be only 2% of the battery capital cost [22] to examine the minimum overall cost/kWh of lithium batteries. Assuming two charge/discharge cycles for off-peak and daytime operations in each day, the cost/kWh can be worked out. The results are shown by red curves in Figure 2 and Figure 3. Since the cost/kWh of the lithium battery is generally several times higher than that of VRB, only 20% of its cost is plotted in the two figures to ensure proper resolution. Apparently, the cost/kWh of the lithium battery is several times higher than that of VRB, making it less attractive for residential applications. Furthermore, the variations of the battery capacity/nominal power have very limited/nearly no impact on the cost/kWh of the lithium battery. It is worth noting that the actual cost of VRB for each kWh used during its lifetime is very small because of the long cycle life. It can be easily calculated through dividing the cost/kWh by the total number of charge and discharge hours in the 24-year lifetime. Generally, the value is in the magnitude of a few cents or even smaller. Therefore, it can be concluded that VRB is a promising candidate for residential applications where frequent charge/discharge is needed.
In addition, the overall cost varies in a large range with the variations of nominal power and capacity. Thus, on behalf of VRB users, proper sizing of the battery is necessary. Generally, there are three main factors affecting the sizing of batteries, i.e., user PV and load profiles, battery efficiency and market policy. As user PV and load profiles are usually extracted from historical data, attention is given to the investigation of the battery efficiency and market policy in the following sections.

3. VRB Charging and Discharging Efficiencies

In theory, VRB charging and discharging efficiencies depend on several factors, such as battery power, state of charge (SOC) and charging/discharging strategy. To accurately estimate the efficiency of VRB, experiments or simulations are necessary. It is understandable that battery efficiency curves obtained based on extensive experimental data can provide good accuracy. Nevertheless, such efficiency curves may not be accurate for VRBs with different ratings under different operating conditions. Moreover, carrying out a large amount of experiments for the investigation of one specific VRB is inefficient and cost ineffective.
As concerns such situations, this paper proposes a simulation-based VRB efficiency estimation approach. In this approach, an accurate battery model [23], which characterizes the electrochemical features of VRB, and constant power charging/discharging strategies are used. By simulating VRB charge and discharge processes, the dynamics of battery energy storage and losses, including ohmic loss, over-potential loss and battery self-discharge, can be observed and recorded. Then, dividing the VRB energy consumption with these losses by the VRB energy consumption without losses, the charging and discharging efficiency of VRB can be obtained. Following such a principle, the efficiencies of a single-stack VRB (multiple-stack VRBs share similar efficiency curves due to the duplication of single stacks) can be plotted with respect to the varying battery power as shown by the blue and green curves in Figure 4, where the initial SOC for charging (blue curve) and discharging (green curve) is 10% and 80%, respectively.
To investigate the impact of SOC on charge/discharge efficiency, comparative simulations are carried out by changing the initial SOC for charging and discharging to be 40% and 50%, respectively (i.e., 30% SOC variation for both charging and discharging processes), while maintaining all of the other factors unchanged. The results are presented by the red and black curves in Figure 4. By comparing the red and blue curves, it is observable that the efficiency variation caused by different SOCs is very small and appears to be negligible in the main operating range of VRB. Therefore, for simplicity, it is neglected in this study.

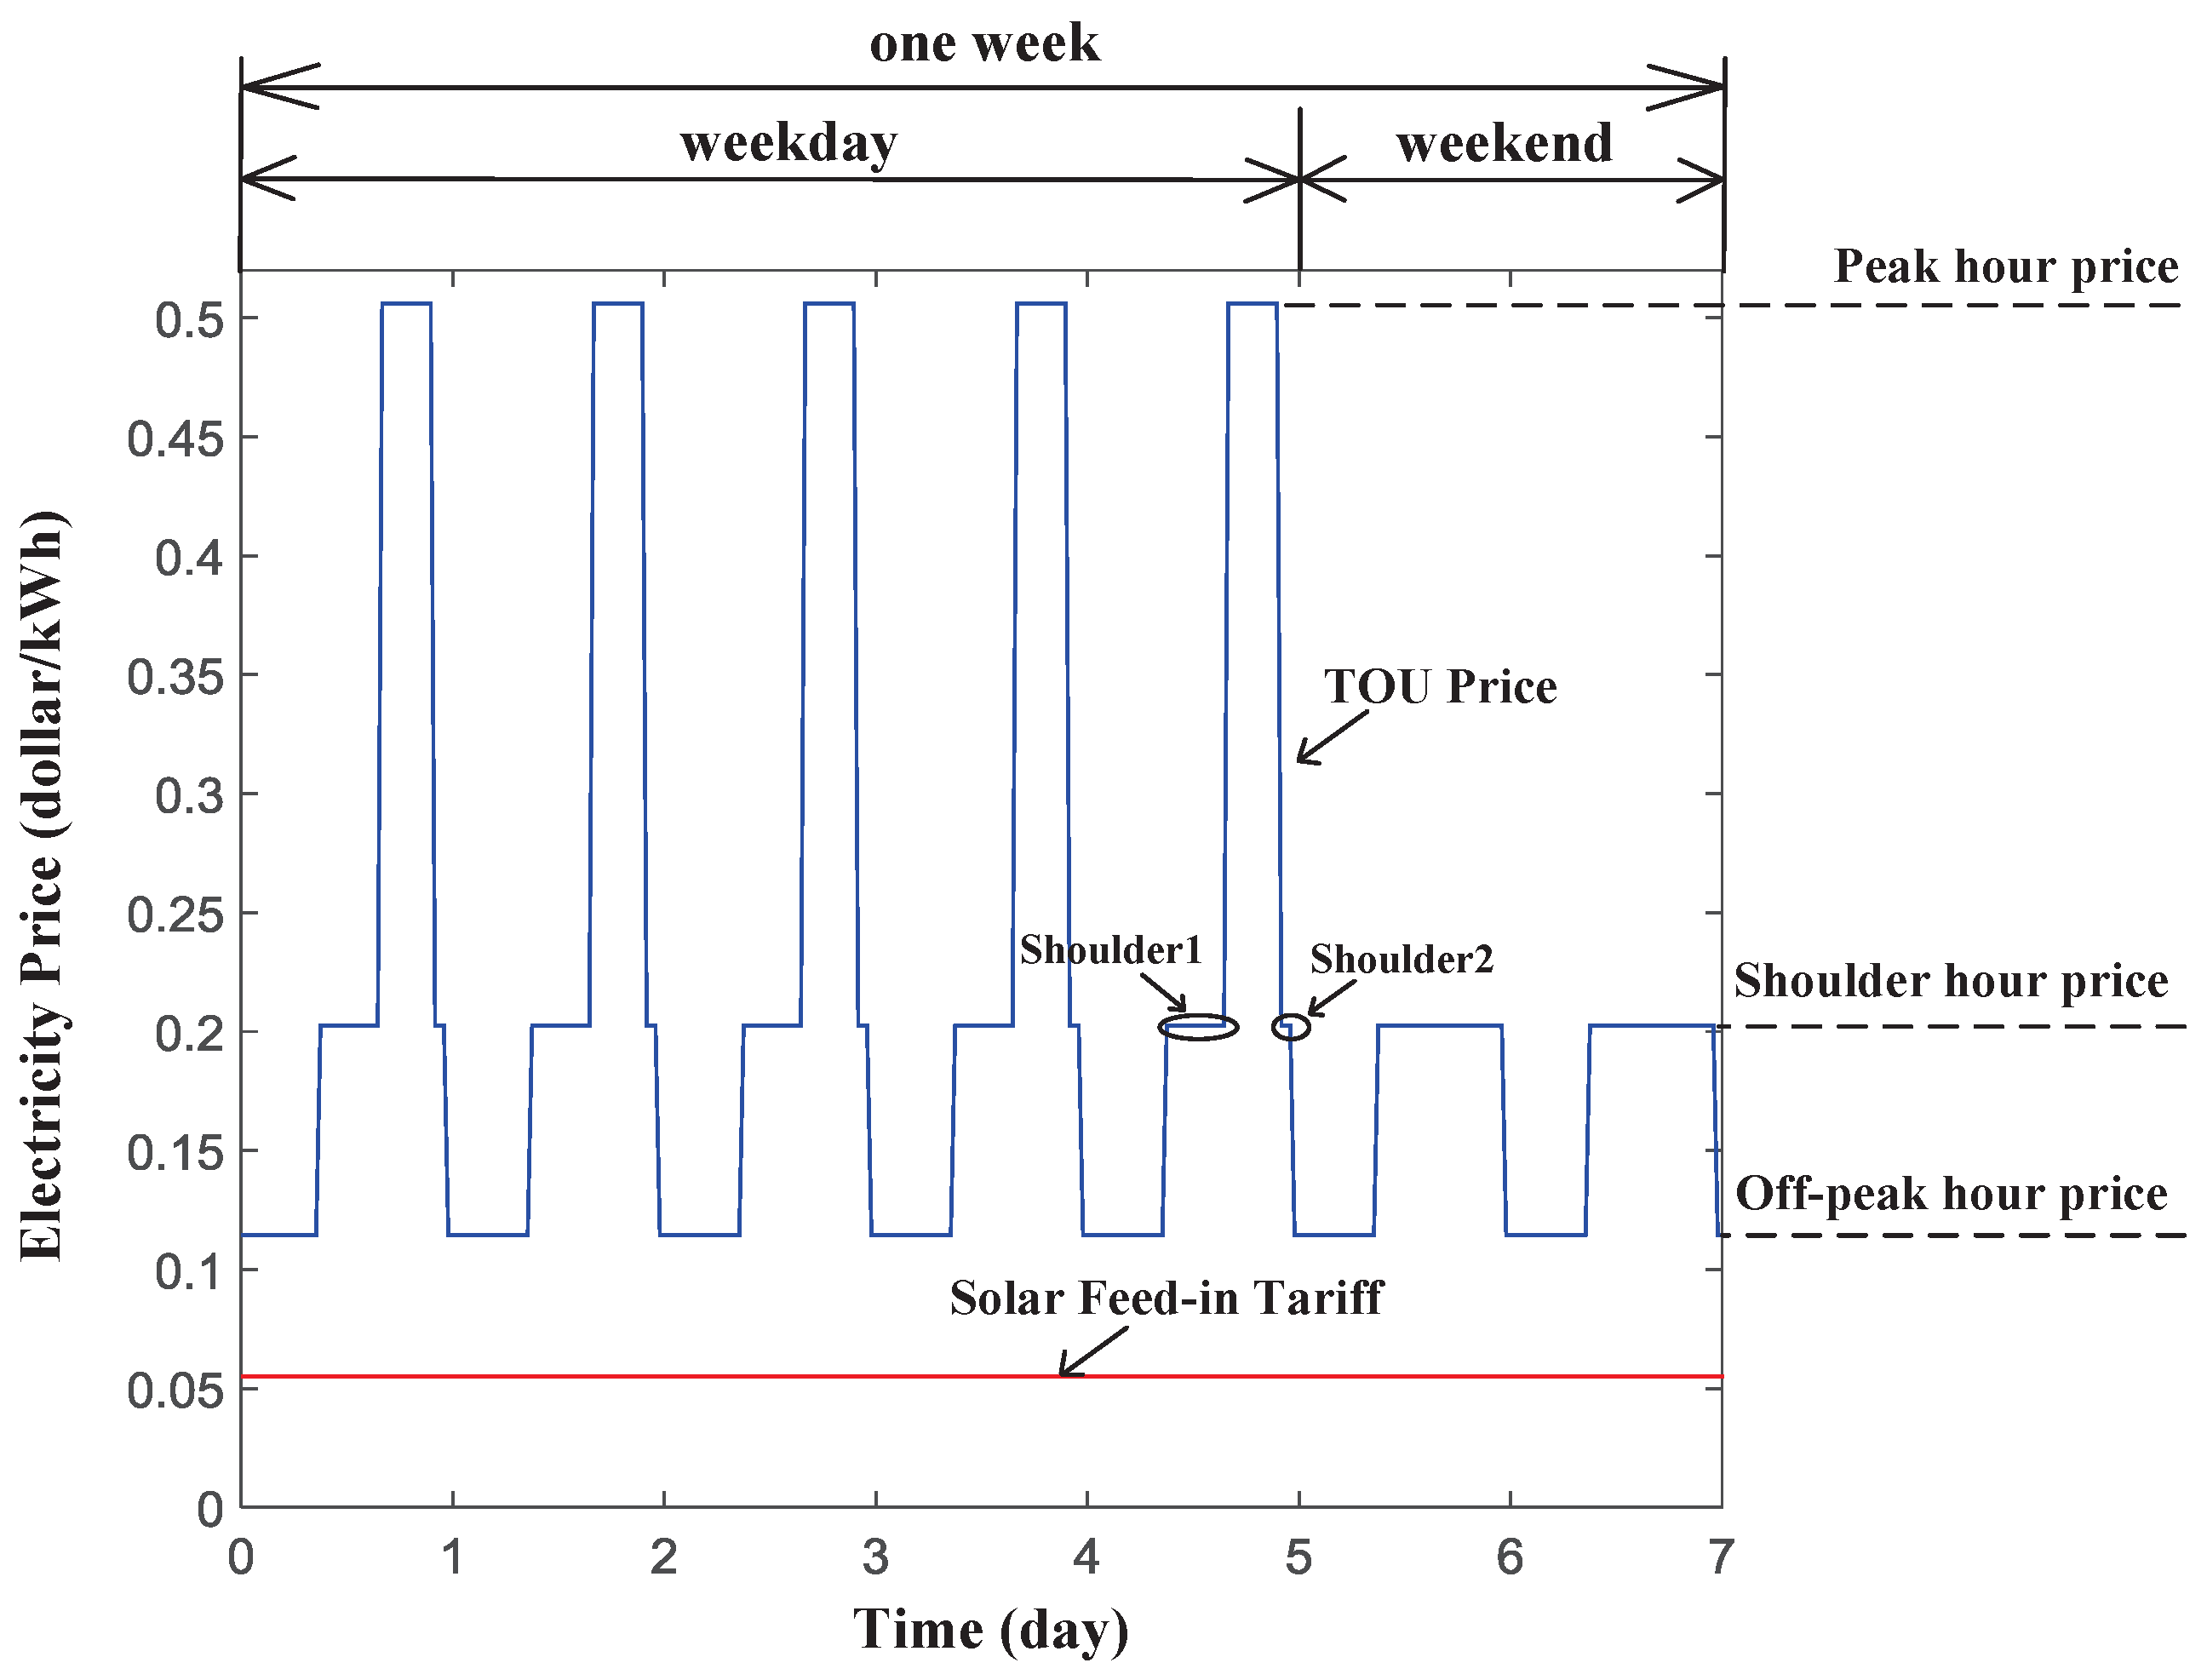
4. Australian Time-Of-Use Market Policy

As discussed in the Introduction, one of the main reasons for employing BESS in residential applications is to reduce the electricity bills of users. Such a requirement necessitates the investigation of relevant market policy. In reality, the TOU retail market policy becomes increasingly prevalent in residential areas. Thus, this section mainly introduces the TOU electricity price (the price that the grid operator charges users when they buy electricity) [9], which varies with respect to time. Without loss of generality, the TOU electricity price in Australia is used as an illustrative example. Its profile is given by the blue curve in Figure 5, where two different price patterns are periodically used in weekdays (three price regions: peak, shoulder and off-peak) and weekends (two price regions: shoulder and off-peak). In comparison, the low solar feed-in tariff (the price the grid operator pays users when they sell solar energy back to the grid) [7] is shown by the red line in Figure 5, from which it can be clearly seen that selling energy back to the grid is not an economically-desirable choice.
In addition, it is visible from the TOU price curve that the peak hour electricity price is much higher than that of off-peak hours, and the shoulder hour price approximates twice the off-peak hour price. Hence, from the economic point of view, it is desirable for users to charge BESS by using surplus solar energy and the electric energy purchased in off-peak hours and discharge BESS to support load during peak and shoulder hours. Under such circumstances, BESS will be frequently charged and discharged, indicating the necessity of using long cycle life and high energy efficiency batteries. Consequently, the VRB system becomes one of the best choices.

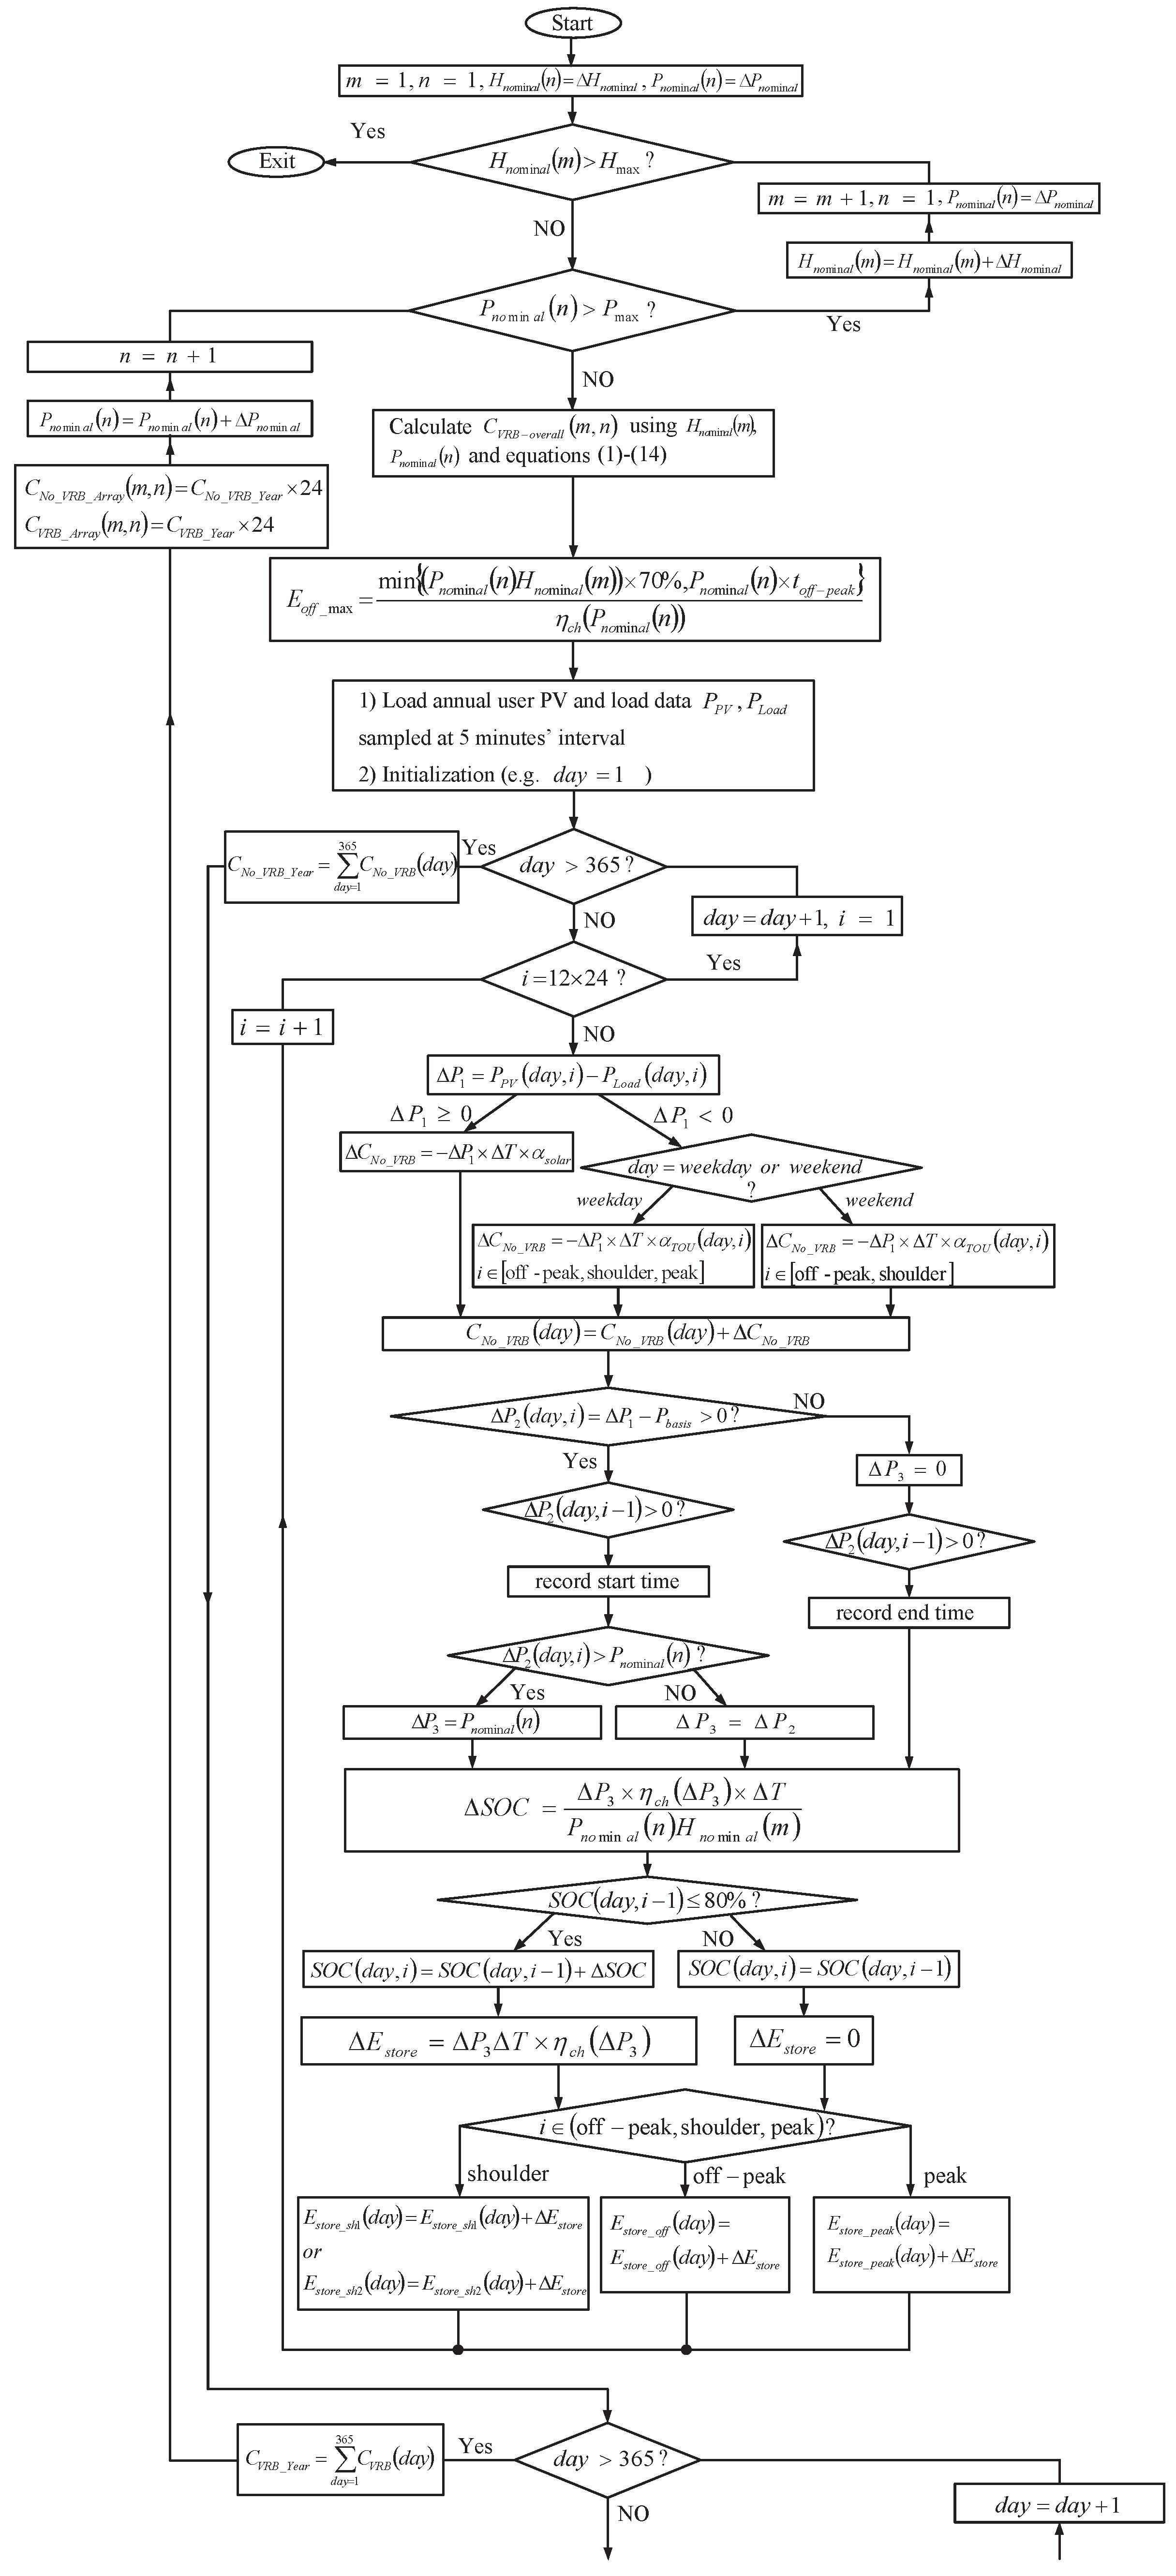
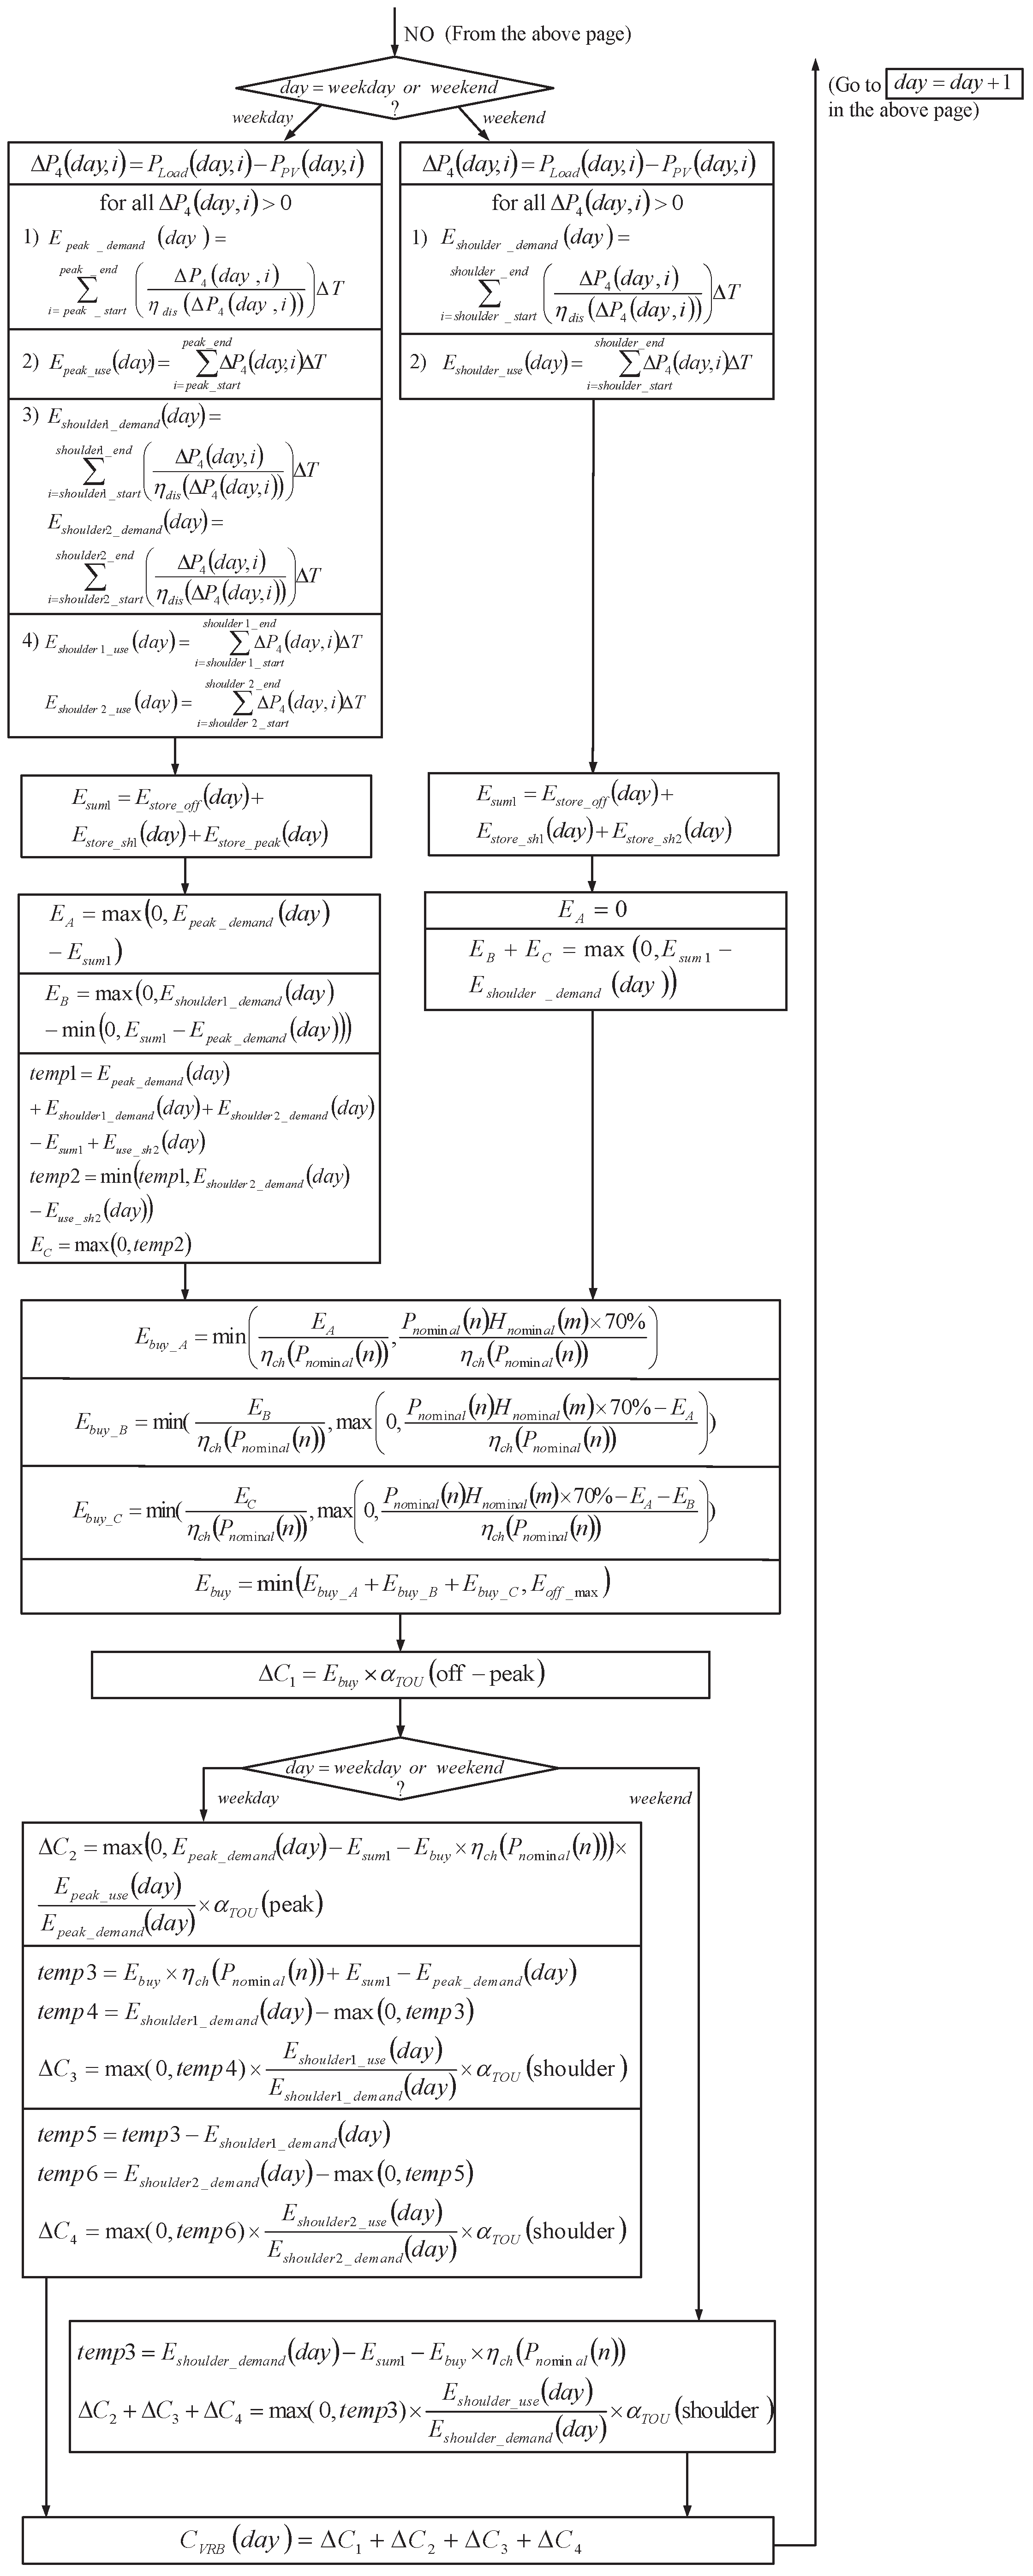
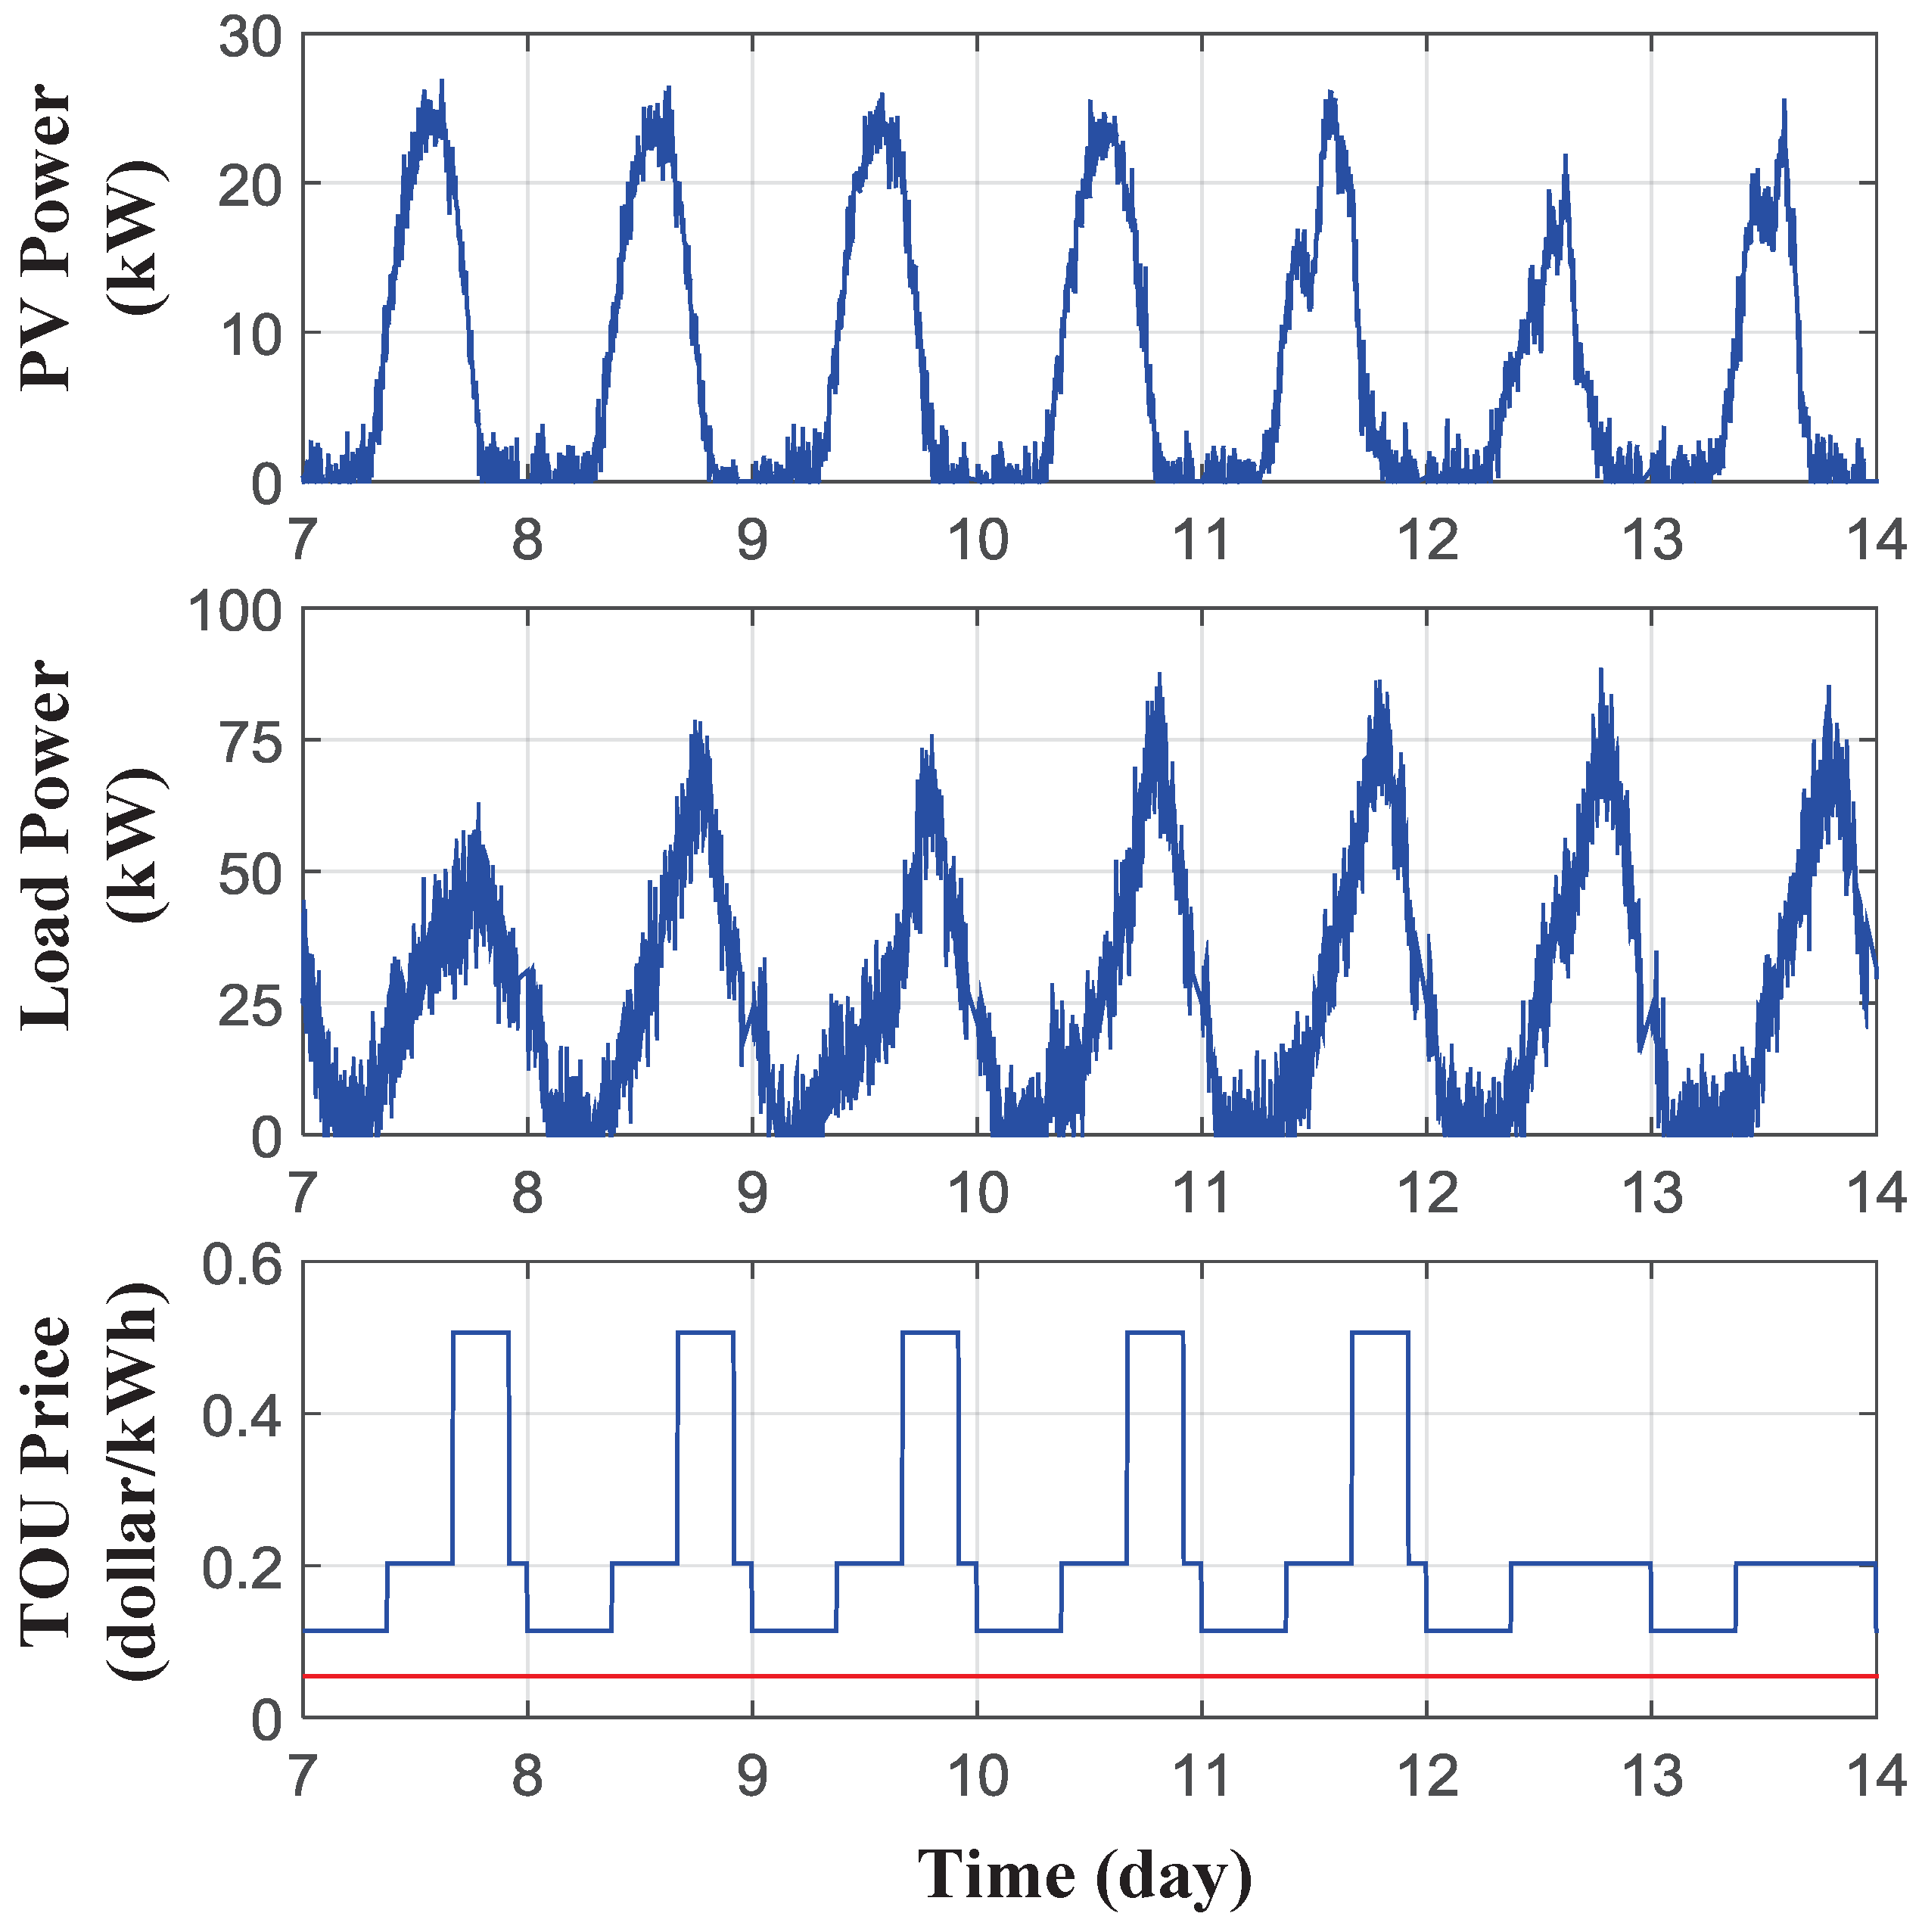
5. Optimal Sizing of VRB

In order to optimize the economic benefit of users in residential areas, appropriate sizing of the VRB system is important. Theoretically, the sizing algorithm should consider the electricity price profile, charging VRB with available solar energy, charging VRB with purchased electric energy in off-peak hours, discharging VRB to support load in high price regions, battery efficiency and system basic power loss. Taking these factors into account, this paper proposes an algorithm for optimal sizing of VRB, as illustrated in Figure 6. The notations employed in this flow chart are defined in Table 3.
In this algorithm, the basic VRB energy loss caused by pump and shunt current is briefly estimated by Equation (15), where the pump and shunt current loss is assumed to be 5% and 1.5% of the battery power, respectively. As shown in Figure 6, the proposed algorithm calculates the overall cost of employing VRB (denoted as C V R B o v e r a l l , which is the sum of capital and maintenance costs) and the saving by employing the VRB system (the difference of residential electricity bills without and with VRB) under different combinations of battery nominal power and capacity. It is implemented iteratively with two for-loops updating increments to capacity H n o m i n a l ( m ) (where m is the iteration index) and nominal power P n o m i n a l ( n ) (where n is the iteration index) until the user-defined upper limits of capacity and nominal power ( H m a x and P m a x , respectively) are reached.
In each combination, VRB cost is computed by Equations (1) to (14). Then, the maximum amount of energy that can be bought for charging VRB in the off-peak region, i.e., E o f f _ m a x , is calculated by comparing the VRB energy storage limit ( P n o m i n a l ( n ) H n o m i n a l ( m ) × 70 % , where the allowable VRB SOC operating range is chosen as 10% to 80%) and the available energy in off-peak time interval ( P n o m i n a l ( n ) × t o f f p e a k ) and, subsequently, dividing VRB charge efficiency to compensate for energy loss. In the next step, the annual user PV and load power data, which are sampled at five-minute intervals, are loaded, and two internal iterations for daily electricity cost estimation (denoted by ( d a y > 365 ? ) in the rhombus) are started.
In the first iteration, the difference between the generated PV power and load power demand is calculated and evaluated as surplus ( P 1 0 ) or insufficient ( P 1 < 0 ) power at each sampling point of each day. Based on this, the earnings of selling energy to the grid (when P 1 × T 0 ) or the cost of buying energy from the grid (when P 1 × T < 0 ) are determined and, subsequently, added up to compute the daily cost/earnings C N o _ V R B ( d a y ) for users without VRB. Then, the regions where PV supply exceeds load demand are recorded, and the amount of solar energy that can be harvested in each step is calculated by taking into account the VRB charge efficiency η c h , which is a function of charge power P 3 . Furthermore, the VRB SOC limit is checked at each step to determine whether or not the solar energy is charged into VRB. Here, the solar energy stored in different time intervals (peak, Shoulder 1, Shoulder 2 and off-peak for weekdays, as depicted in Figure 5; Shoulder 1 = shoulder and off-peak for weekend) are summed separately. The annual overall electricity cost of users without VRB is summed at the end of this iteration.
P b a s i s = P p u m p + P s h u n t = | P p v P l o a d | × ( 5 % + 1.5 % )
In the second iteration, total load energy demand in different time intervals of each day is calculated depending the category of a day (weekday or weekend). It is noted that the start and end points of each summation are recorded in the first iteration. Then, the solar energy stored in VRB is compared with the load energy demand in each time interval to determine the amount of energy that is desired to be stored in VRB in the off-peak region for daily load support, i.e., E A , E B , E C . The results are then divided by the charge efficiency to compensate for energy loss during charging and compared with the remaining VRB energy storage capability to estimate the amount of energy that is actually bought and stored in VRB in the off-peak region for load support different time intervals, i.e., E b u y _ A , E b u y _ B , E b u y _ C . Subsequently, E b u y _ A , E b u y _ B and E b u y _ C are summed and compared with E o f f _ m a x to determine the total amount of energy to be bought in the off-peak region. In the next stage, the cost of electricity usage in different time intervals (off-peak, peak, Shoulder 1 and Shoulder 2 for weekdays; off-peak and shoulder for the weekend) are computed by considering the TOU price, the available energy storage in VRB, load demand and the priority of VRB energy usage (for weekdays, the priority of VRB energy usage in the peak region is higher than shoulder regions; for weekends, there is no priority due to the absence of peak region). It is worth noting that the terms E p e a k _ u s e ( d a y ) E p e a k _ d e m a n d ( d a y ) , E s h o u l d e r 1 _ u s e ( d a y ) E s h o u l d e r 1 _ d e m a n d ( d a y ) , E s h o u l d e r 2 _ u s e ( d a y ) E s h o u l d e r 2 _ d e m a n d ( d a y ) and E s h o u l d e r _ u s e ( d a y ) E s h o u l d e r _ d e m a n d ( d a y ) are introduced as the average utilization rate to transform the insufficient energy storage in VRB to the actual energy that has to be bought and used in each region. Eventually, the cost of electricity for users with VRB is computed for each day ( C V R B ( d a y ) ) and summed to find the annual total cost ( C V R B _ Y e a r ).
By multiplying such annual electricity bills with battery lifespan (assuming the PV and load power profiles are approximately the same for different years), the overall economic savings by using the VRB system can be estimated. Then, by subtracting the investment cost, the net economic benefit of employing the VRB system can be figured out.
It is pointed out that the proposed algorithm aims to provide an estimation of the potential economic benefit by employing the VRB system, which serves as a guideline for users to optimize the size of their VRB. It is implemented in the offline planning stage by using historical user load and/or PV data depending on the availability of PV system. For instance, for users without PV system, this algorithm is also applicable by setting input PV power to zero. To demonstrate its effectiveness, two sets of simulations are carried out by using the load and PV data in residential areas, which are sampled at 5-min intervals, as shown in Figure 7 and Figure 8. Here, Figure 7 presents the annual power profiles, and Figure 8 gives an enlarged view of part of Figure 7 aligned with the TOU price profile. The original PV and load data are downloaded from PVOutput [24] and Australian Energy Market Operator (AEMO) [25], respectively. In this study, they are re-scaled to represent the annual PV and load power of a typical residential building (usually consisting of tens of homes).
In the first place, simulation results of earned net economic benefit (total savings on electricity bill subtracting VRB investment cost), the rate of return (the ratio of net benefit and investment cost of VRB) and payback period (the ratio of overall VRB cost and annual net economic benefit) by employing VRB with the PV system are presented in Figure 9, Figure 10 and Figure 11, respectively.
From Figure 9, it is observable that the economic benefit earned by VRB can be quite significant, and it varies with respect to battery nominal power and capacity. Here, the ranges of VRB nominal power and capacity variations are selected to be the same as those in the overall cost computation (Figure 2). They can be modified by users according to their expectations. Obviously, under such circumstances, the peak region of net economic benefit is reached by selecting VRBs with high capacity (9 h) and reasonably high nominal power (between 40 kW to 60 kW). The maximum net economic benefit of nearly 500 thousand dollars is gained by choosing VRB rated at 49.5 kW and 9 h. It is noted that the discontinuities on the surface of Figure 9 are caused by the varying numbers of VRB stacks.
In addition to the investigation of net economic benefit, the analysis of the rate of return and payback period is also crucial for users to quantitatively evaluate the effectiveness of their investment. In the studied case of VRB with the PV system, the rate of return and payback period are illustrated in Figure 10 and Figure 11, respectively (again, discontinuities on the surface of Figure 10 and Figure 11 are the result of the sudden VRB stack number changes due to the increasing nominal battery power). From Figure 10, it is seen that investing in VRBs with low nominal power can usually lead to a high earning rate. Furthermore, in the range of 40 to 80 kW, a higher rate of return can be obtained by choosing VRB capacity to be within 4 to 6 h. In most cases, a VRB with suitable ratings can provide a reasonably good earning rate. For instance, the rate of return of the VRB offering maximum net economic benefit is approximately 2.98, which is quite attractive. The payback period is generally maintained at acceptable levels for VRB with high capacity, as shown in Figure 11. It increases drastically when the VRB capacity is too low. For the VRB offering maximum net economic benefit, the payback period is about six years, which means the investment cost can be earned back within one fourth of the battery lifespan. The large net benefit, high rate of return and short payback period qualify VRB as a promising battery technology for residential applications. In comparison, the cost of the lithium battery rated at 49.5 kW and 9 h with a required working period of 24 years can be estimated by using the approach and coefficients in [21,22] as discussed in Section 2.3. Based on such estimation, it is found that the cost of the lithium battery is nearly 12-times the cost of VRB, even if only one charge/discharge cycle is implemented every day, making it undesirable for residential applications. This is especially true when renewable generation is employed by users, because the lifetime of the lithium battery will be shortened by more frequent charge/discharge operations in each day.
In the second place, to investigate the economics of employing VRB without the PV system, simulations are carried out, and the corresponding results are depicted in Figure 12, Figure 13 and Figure 14. By comparing these figures with their counterparts in the case of VRB with the PV system, it is seen that a higher net benefit and larger rate of return are obtainable. This is mainly because the demanded load power becomes larger when solar energy is unavailable, indicating an enlarged profitable region for employing BESS. Of course, the resultant payback period also becomes longer owing to the absence of free energy (users do not need to pay for solar energy if they are already equipped with PV systems) harvested by the PV system. Under such circumstances, the maximum net benefit of 597.5 thousand dollars is obtained by selecting VRB rated at 69 kW and 9 h. The corresponding rate of return and payback period for this VRB configuration is about 2.43 and seven years, respectively. Apparently, such a VRB system is worth investing in.
Noticeably, some users in residential areas may not be willing to start with a large-sized VRB by considering its initial investment cost. Under such situations, they can define an acceptable range of VRB ratings and can choose a local optimal VRB size within their expected range of ratings. Therefore, the proposed method can provide a useful selection guide for users with different expectations. For instance, if a user would like to install a VRB when the PV system is unavailable and the expected ranges of ratings are 5 to 15 kW and 2 to 4 h, he/she can follow the proposed method and evaluate the profits by employing VRB with a size in that specific range. Subsequently, the user can choose the optimal VRB size based on the information of net economic benefit, rate of return and payback period. In the previously studied case, VRB within the ranges of 5 to 15 kW and 2 to 4 h can provide the maximum net benefit of 117.5 thousand dollars at ratings of 9 kW and 4 h. Its corresponding rate of return and payback period is about 5.17 and 3.9 years, respectively.
To illustrate the potential application of the VRB system in areas at a high latitude, such as northern Europe, a simulation study is carried out with annual PV and load power data in such areas as shown in Figure 15. Since the TOU electricity price varies from area to area and has not yet been widely adopted in the areas at a high latitude, the TOU price profile in Figure 5 is used here for illustrative purpose. Under such situations, the net economic benefit, rate of return and payback period with varying VRB nominal power and capacity can be calculated, and the results are shown in Figure 16, Figure 17 and Figure 18, respectively. From these figures, it is visible that the employment of the VRB system in high latitude areas is also an attractive investment if the TOU electricity price policy is adopted. In fact, with an increasing population density and the penetration of electrical appliances in residential areas, the TOU electricity price can become an effective tool for shaving the peak power demand and, thus, should be widely advocated.

6. Conclusions

This paper proposes methods of computing the overall cost and evaluating the efficiency of a vanadium redox flow battery based on its electrochemical characteristics. Compared to existing approaches, these methods are more accurate and systematic. Then, an optimal sizing algorithm for a vanadium redox flow battery employed in residential applications is proposed by taking into account battery cost and efficiency, time-varying electricity price, solar feed-in tariff and user load and PV power profiles. The proposed methods are illustrated by simulation studies using data from the Australian power market. In addition, the economic benefits of employing the vanadium redox flow battery are demonstrated.

Acknowledgments

This work is supported by the Australian Research Council Discovery Projects DP150103100.

Author Contributions

X.Z. and Y.L. designed the battery sizing algorithm and conducted simulation studies; Y.L. developed the detailed battery simulation model; M.S-K. advised on detailed cost estimation of vanadium battery components and co-supervised the research project; J.B. advised on battery dynamics analysis for system size optimization and supervised the research project.

Conflicts of Interest

The authors declare no conflict of interest.

Nomenclature

P n o m i n a l Nominal power of VRB in kW
I n o m i n a l Nominal current of VRB in amperes
H n o m i n a l Nominal capacity of VRB in hours
I d e n s i t y Current density of VRB in amperes/cm 2
P s t a c k Maximum power rating of each VRB stack in kW (chosen as 10 kW in this paper)
P p u m p Estimated power loss caused by pumping in kW
P s h u n t Estimated power loss caused by shunt current in kW
P b a s i s Estimated total extra power loss in kW
N s t a c k Total number of stacks in VRB
v s t a c k Nominal stack voltage in volts
N c e l l Total number of cells in VRB
v c e l l Cell discharge voltage at 50% SOC in volts
R c e l l Cell resistance in Ohm·cm 2
v e f f i c i e n c y Voltage efficiency at nominal power
V e l e c t r o l y t e Volume of electrolyte in litres
C m e m b r a n e Cost of membrane in dollars
C g r a p h i t e Cost of graphite in dollars
C e n d p l a t e Cost of endplate in dollars
C f l o w Cost of flow frame in dollars
C a s s e m b l e Cost of assembling in dollars
C s t a c k Cost of each stack in dollars
C e l e c t r o l y t e Cost of electrolyte in dollars
C t a n k Cost of tank in dollars
C p u m p Cost of pump in dollars
C V R B Total cost of VRB in dollars
C i n v e r t e r Cost of inverter in dollars
C r e p l a c e Cost of parts replacement in dollars
C m a i n t e n a n c e Cost of maintenance in dollars
C V R B - S y s Overall cost of VRB system in dollars
L V R B Life span of VRB in years
L M e m b r a n e Lifespan of membrane in years
S e l e c t r o d e Area of electrode in cm 2
S m e m b r a n e Area of membrane in cm 2
S g r a p h i t e Area of graphite in cm 2

Greek Symbols

μ e l e c t r o l y t e Electrolyte weight (kg) per kWh at 100% utilization rate
μ m o l e s Moles per kWh at 100% utilization rate
μ u t i l i z a t i o n Electrolyte utilization rate
μ v a n a d i u m Vanadium concentration in moles/litre
β m e m b r a n e / m 2 Rate of membrane cost in dollars/m 2
β g r a p h i t e / m 2 Rate of graphite cost in dollars/m 2
β e n d p l a t e Rate of endplate cost in dollars/each
β e l e c t r o - f a b r Rate of electrode fabrication cost in dollars/each
β a s s e m b l e / s t a c k Rate of assembling cost in dollars/stack
β f l o w - f a b r Rate of flow frame fabrication cost in dollars/each
β v a n a d i u m Rate of vanadium cost in dollars/kg
β a c i d Rate of acid cost in dollars/litre
β t a n k / k W h Rate of tank cost in dollars/kWh
β p u m p Rate of pump cost in dollars/kW
β i n v e r t e r Rate of inverter cost in dollars/kW
β a n n u a l Rate of annual maintenance cost in dollars/year
β m a r k - u p Coefficient of mark-up
β r e p l a c e Coefficient of replacement labour cost/kW

References

  1. Smith, J.; Sunderman, W.; Dugan, R.; Seal, B. Smart inverter volt/var control functions for high penetration of PV on distribution systems. In Proceedings of the 2011 IEEE/PES Power Systems Conference and Exposition (PSCE), Phoenix, AZ, USA, 20–23 March 2011; pp. 1–6.
  2. Eftekharnejad, S.; Vittal, V.; Heydt, G.T.; Keel, B.; Loehr, J. Impact of increased penetration of photovoltaic generation on power systems. IEEE Trans. Power Syst. 2013, 28, 893–901. [Google Scholar] [CrossRef]
  3. Wang, Y.; Zhang, P.; Li, W.; Xiao, W.; Abdollahi, A. Online overvoltage prevention control of photovoltaic generators in microgrids. IEEE Trans. Smart Grid 2012, 3, 2071–2078. [Google Scholar] [CrossRef]
  4. Tonkoski, R.; Turcotte, D.; El-Fouly, T.H. Impact of high PV penetration on voltage profiles in residential neighborhoods. IEEE Trans. Sustain. Energy 2012, 3, 518–527. [Google Scholar] [CrossRef]
  5. Alam, M.; Muttaqi, K.; Sutanto, D. Mitigation of rooftop solar PV impacts and evening peak support by managing available capacity of distributed energy storage systems. IEEE Trans. Power Syst. 2013, 28, 3874–3884. [Google Scholar] [CrossRef]
  6. Shi, H.; Zhuo, F.; Yi, H.; Wang, F.; Zhang, D.; Geng, Z. A novel real-time voltage and frequency compensation strategy for photovoltaic-based microgrid. IEEE Trans. Ind. Electron. 2015, 62, 3545–3556. [Google Scholar] [CrossRef]
  7. Mountain, B. Electricity Prices in Australia: An International Comparison; Carbonmarkets: Melbourne, Austrilia, March 2012. [Google Scholar]
  8. De la Hoz, J.; Martín, H.; Miret, J.; Castilla, M.; Guzman, R. Evaluating the 2014 retroactive regulatory framework applied to the grid connected PV systems in Spain. Appl. Energy 2016, 170, 329–344. [Google Scholar] [CrossRef]
  9. Faruqui, A.; Hledik, R.; Palmer, J. Time-Varying and Dynamic Rate Design; Regulatory Assistance Project: Montpelier, VT, USA, 2012. [Google Scholar]
  10. Matters, E. Feed-In Tariff for Grid-Connected Solar Power Systems. 2011. Available online: http://www.energymatters.com.au/rebates-incentives/feedintariff/ (accessed on 20 August 2016).
  11. Matters, E. Battery Storage And Solar Feed In Tariffs—State of Play. 2015. Available online: http://www.energymatters.com.au/renewable-news/solar-fit-batteries-em5074/ (accessed on 20 August 2016).
  12. Divya, K.; Østergaard, J. Battery energy storage technology for power systems—An overview. Electr. Power Syst. Res. 2009, 79, 511–520. [Google Scholar] [CrossRef]
  13. Qiu, X.; Nguyen, T.A.; Guggenberger, J.D.; Crow, M.L.; Elmore, A.C. A field validated model of a vanadium redox flow battery for microgrids. IEEE Trans. Smart Grid 2014, 5, 1592–1601. [Google Scholar] [CrossRef]
  14. Li, L.; Kim, S.; Wang, W.; Vijayakumar, M.; Nie, Z.; Chen, B.; Zhang, J.; Xia, G.; Hu, J.; Graff, G.; et al. A stable vanadium redox-flow battery with high energy density for large-scale energy storage. Adv. Energy Mater. 2011, 1, 394–400. [Google Scholar] [CrossRef]
  15. Borowy, B.S.; Salameh, Z.M. Methodology for optimally sizing the combination of a battery bank and PV array in a wind/PV hybrid system. IEEE Trans. Energy Convers. 1996, 11, 367–375. [Google Scholar] [CrossRef]
  16. Elhadidy, M.; Shaahid, S. Optimal sizing of battery storage for hybrid (wind+ diesel) power systems. Renew. Energy 1999, 18, 77–86. [Google Scholar] [CrossRef]
  17. Arun, P.; Banerjee, R.; Bandyopadhyay, S. Optimum sizing of battery-integrated diesel generator for remote electrification through design-space approach. Energy 2008, 33, 1155–1168. [Google Scholar] [CrossRef]
  18. Nguyen, T.A.; Qiu, X.; Guggenberger, J.D., II; Crow, M.L.; Elmore, A.C. Performance characterization for photovoltaic-vanadium redox battery microgrid systems. IEEE Trans. Sustain. Energy 2014, 5, 1379–1388. [Google Scholar] [CrossRef]
  19. Nguyen, T.A.; Crow, M.L.; Elmore, A.C. Optimal sizing of a Vanadium Redox battery system for microgrid systems. IEEE Trans. Sustain. Energy 2015, 6, 729–737. [Google Scholar] [CrossRef]
  20. Eckroad, S. Vanadium Redox Flow Batteries: An In-Depth Analysis; Electric Power Research Institute: Palo Alto, CA, USA, 2007. [Google Scholar]
  21. Tant, J.; Geth, F.; Six, D.; Tant, P.; Driesen, J. Multiobjective battery storage to improve PV integration in residential distribution grids. IEEE Trans. Sustain. Energy 2013, 4, 182–191. [Google Scholar] [CrossRef]
  22. Ahlert, K.H. Economics of Distributed Storage Systems; Karlsruher Institut Für Technologie: Karlsruhe, Germany, 2010. [Google Scholar]
  23. Li, Y.; Skyllas-Kazacos, M.; Bao, J. A dynamic plug flow reactor model for a vanadium redox flow battery cell. J. Power Sources 2016, 311, 57–67. [Google Scholar] [CrossRef]
  24. Burke, K.B. The reliability of distributed solar in critical peak demand: A capital value assessment. Renew. Energy 2014, 68, 103–110. [Google Scholar] [CrossRef]
  25. Fan, S.; Hyndman, R.J. Short-term load forecasting based on a semi-parametric additive model. IEEE Trans. Power Syst. 2012, 27, 134–141. [Google Scholar] [CrossRef]
Figure 1. Basic configuration of the vanadium redox flow battery.
Energies 09 00857 g001
Figure 2. Cost(dollar)/kWh of VRB (blue) and lithium battery (red) with fixed capacity (2 h), but varying nominal power.
Energies 09 00857 g002
Figure 3. Cost(dollar)/kWh of VRB (blue) and lithium battery (red) with fixed nominal power (5 kW), but varying capacity.
Energies 09 00857 g003
Figure 4. VRB charge and discharge efficiencies with respect to varying battery power: ‘−’ VRB charge efficiency with SOC starting at 10% (blue) and 40% (red); ‘ * ’ VRB discharge efficiency with SOC starting at 80% (green) and 50% (black).
Energies 09 00857 g004
Figure 5. Profile of Australian time-of-use electricity price.
Energies 09 00857 g005
Figure 6. Flow chart of the proposed optimal sizing algorithm.
Energies 09 00857 g006aEnergies 09 00857 g006b
Figure 7. Annual PV and load power data of a residential building.
Energies 09 00857 g007
Figure 8. Zoomed in profiles of annual PV and load power.
Energies 09 00857 g008
Figure 9. Net economic benefit earned by the VRB system with PV (in thousand dollars).
Energies 09 00857 g009
Figure 10. Rate of return (ratio between the net benefit and investment cost) of the VRB system with PV.
Energies 09 00857 g010
Figure 11. Payback period of the VRB system with PV (years).
Energies 09 00857 g011
Figure 12. Net economic benefit earned by the VRB system without PV (in thousand dollars).
Energies 09 00857 g012
Figure 13. Rate of return (ratio between the net benefit and investment cost) of the VRB system without PV.
Energies 09 00857 g013
Figure 14. Payback period of the VRB system without PV (years).
Energies 09 00857 g014
Figure 15. Annual PV and load power data of a residential building in a high altitude area.
Energies 09 00857 g015
Figure 16. Net economic benefit earned by the VRB system with PV in a high latitude area (in thousand dollars).
Energies 09 00857 g016
Figure 17. Rate of return (ratio between the net benefit and investment cost) of the VRB system with PV in a high latitude area.
Energies 09 00857 g017
Figure 18. Payback period of the VRB system with PV in a high latitude area (years).
Energies 09 00857 g018
Table 1. Table of acronyms.
AcronymMeaning
PVsolar photovoltaic system
BESSbattery energy storage system
VRBvanadium redox flow battery
TOUtime-of-use
SOCbattery state of charge
Table 2. Key parameters for VRB cost computation.
ParameterValueParameterValue
P_stack10 kWv_stack48 V
R_cell1.5 Ohm·cm 2 v_efficiency0.82
μ e l e c t r o l y t e 5.22 kg/kWh μ m o l e s 57.4 mole/kWh
μ u t i l i z a t i o n 70% μ v a n a d i u m 1.6 mole/L
β m e m b r a n e / m 2 50 dollar/m 2 β g r a p h i t e / m 2 10 dollar/m 2
β e n d p l a t e 500 dollar/each β e l e c t r o f a b r 5 dollar/each
β f l o w f a b r 2 dollar/each β v a n a d i u m 11 dollar/kg
β a c i d 0.2 dollar/L β t a n k / k W h 25 dollar/kWh
β p u m p 100 dollar/kW β i n v e r t e r 100 dollar/kW
β a n n u a l 100 dollar/year β a s s e m b l e 500 dollar/stack
β r e p l a c e 10 dollar/kW β m a r k up 1
L M e m b r a n e 8 years L V R B 24 years
Table 3. Definition of notations in the flow chart of Figure 6.
NotationDefinition
P n o m i n a l step increment of VRB nominal power in each iteration (kW)
H n o m i n a l step increment of VRB nominal capacity in each iteration (hour)
m, niteration index of VRB capacity, nominal power
d a y iteration index of days in one year
iiteration index of sampling point in each day (data sampled every 5 min)
C V R B o v e r a l l overall cost of VRB system including maintenance cost
η c h , η d i s efficiency of VRB charge, discharge
t o f f p e a k time interval of off-peak region (s)
E o f f _ m a x The maximum amount of energy that can be bought in the off-peak region to charge VRB (kWh)
P P V generated power of the PV panel (kW)
P L o a d demanded load power (kW)
P 1 to P 4 temporary variables
C N o _ V R B increment of electricity cost for users without VRB
C N o _ V R B ( d a y ) daily electricity cost for users without VRB
C N o _ V R B _ Y e a r annual electricity cost for users without VRB
C N o _ V R B _ A r r a y array that stores the annual electricity cost for users without VRB under different nominal power and capacity combinations
E s t o r e increment of energy stored in VRB
E s t o r e _ p e a k / s h 1 / s h 2 / o f f ( d a y ) energy stored in VRB during regions of peak, Shoulder 1, Shoulder 2 and off-peak
E p e a k / s h o u l d e r 1 / s h o u l d e r 2 _ d e m a n d ( d a y ) the demanded energy storage in VRB to support load in peak, Shoulder 1 and Shoulder 2 regions in weekdays
E s h o u l d e r _ d e m a n d ( d a y ) the demanded energy storage in VRB to support load in the shoulder region in weekends
E p e a k / s h o u l d e r 1 / s h o u l d e r 2 _ u s e ( d a y ) the actually used energy for load in peak, Shoulder 1 and Shoulder 2 regions in weekdays
E s h o u l d e r _ u s e ( d a y ) the actually used energy for load in the shoulder region in weekends
t e m p 1 to t e m p 6 temporary variables
T PV and load data sampling interval (5 min)
E A , E B , E C the amount of energy that is desired to be stored in VRB in the off-peak region to support load in peak, shoulder 1 and Shoulder 2 regions
E b u y _ A , E b u y _ B , E b u y _ C the amount of energy that is actually bought and stored in VRB in off-peak region to support load in peak, Shoulder 1 and Shoulder2 regions
E b u y the total amount of energy that is actually bought in off-peak and stored in VRB
C 1 / 2 / 3 / 4 increment of electricity cost in off-peak, peak, Shoulder 1 and Shoulder 2 regions
C V R B ( d a y ) daily electricity cost for users with VRB
C V R B _ Y e a r annual electricity cost for users with VRB
C V R B _ A r r a y array that stores the annual electricity cost for users with VRB under different nominal power and capacity combinations

