Article

Use of a Pre-Drilled Hole for Implementing Thermal Needle Probe Method for Soils and Rocks

1
Department of Civil and Environmental Engineering, Korea Advanced Institute of Science and Technology (KAIST), Daejeon 34141, Korea
2
Norwegian Geotechnical Institute (NGI), Oslo N-0806, Norway
3
Power Transmission Laboratory, Korea Electric Power Research Institute, Daejeon 34056, Korea
4
Department of Civil Engineering, Inha University, Incheon 22212, Korea
*
Author to whom correspondence should be addressed.
Energies 2016, 9(10), 846; https://doi.org/10.3390/en9100846
Submission received: 19 July 2016 / Revised: 5 October 2016 / Accepted: 12 October 2016 / Published: 20 October 2016

Abstract

:
The thermal needle probe method, which is widely used for measuring the thermal conductivity λ of soils, deploys a long and thin metallic probe that houses a line heater and a temperature sensor. However, inserting such probes into consolidated or densely compacted soils or rocks is difficult, frequently causing buckling of the probe and severe disturbance to the surrounding ground, leading to unreliable measurements. We found that the use of a pre-drilled hole filled with thermally conductive grease for installing a thermal needle probe was feasible to overcome such challenges, and still yielded reliable measurements of thermal conductivity. The proposed method, i.e., the pre-drilling thermal needle probe method, was verified by finite element calculations and laboratory experiments by varying various parameters, such as the pre-drilled hole diameter, probe diameter, and thermal conductivity of thermal grease. It was observed that increases in the pre-drilled hole diameter and probe diameter and a decrease in the thermal conductivity of the thermal grease caused delays in temperature increase owing to the slowed heat transfer. Nevertheless, all the estimated λ values agreed well with the reference λ values with acceptable errors. Thus, the proposed method yields reliable measurements and can be applied for a wide range of soils from compacted soils to hard rocks.

1. Introduction

As thermal conduction is the predominant heat transfer mechanism [1,2,3,4,5], it is essential to determine thermal conductivity of geo-materials for designing energy-related geo-structures, including underground heat pumps and underground electric power cable tunnels [6,7,8,9]. As geo-materials such as soils and rocks are multiphase porous media that consist of solid grains and pore fluids, heat transfer in soils and rocks is heavily affected by volumetric fractions of constituents and the constituents’ thermal conductivity. There are a variety of methods for determining thermal conductivity of materials from the steady-state method, using cold and hot plates [10], to the transient hot wire method, using a line heat source [11,12]. In particular for the transient hot wire method, also referred to as the thermal needle probe method, a long and thin metallic probe that houses a line heat source and a temperature sensor (or thermal needle probe) is inserted in the target medium and the line heat source generates heat at a controlled and constant heat flux; then, the temperature sensor acquires the transient thermal response, as shown in Figure 1a [1,11,12,13,14,15,16,17,18]). This method is widely used because of its convenient practice in fields when measuring for exposed near-surface soils as well as for laboratory measurements.
While the thermal needle probe method should be in contact with the target medium, inserting such probes into hard ground, such as consolidated or densely compacted soils and rocks, is difficult because the probes frequently buckle in this process owing to the relatively high length-to-thickness ratio. Moreover, inserting a probe into hard ground causes severe disturbance around it, leading to poor contact between the probe and the target medium and resulting in unreliable thermal conductivity measurements. For measuring thermal conductivity of such hard geo-materials in in situ fields, the transient hot wire method, in a half-space configuration where the heating wire is mounted on the flat surface of a reference material of known thermal conductivity and good thermal insulation, can be used [10]. This method also requires a good contact between the flat surface and the ground to be measured; however, uneven and rough surface conditions of natural geo-materials makes the thermal conductivity measurement daunting and challenging.
Therefore, an improved pre-drilling thermal needle probe method using a pre-drilled hole filled with thermally conductive grease (thermal grease) is proposed in this study, as shown in Figure 1b. Thermal grease fills the gaps between the probe and the medium, and transfers heat from the heat source to the ground. The reliability of the suggested method, referred to as the pre-drilling thermal needle probe method, was examined via numerical simulation using a finite element code and through laboratory experiments. The parameters, such as the pre-drilled hole diameter, probe diameter, and thermal conductivity of thermal grease, were varied, and the thermal responses obtained in different environments were analyzed to identify the effect of these parameters. We found that the use of a pre-drilled hole filled with thermally conductive grease for installing a thermal needle probe still yielded reliable measurements of thermal conductivity, while overcoming the previous limitation of the conventional method. However, as a trade-off, the measurement time also increased with an increase in the hole diameter. In addition, it was found that the finite element calculations and physical experiments were an effective way to investigate the transient heat transfer from a line heat source.

2. Materials and Methods

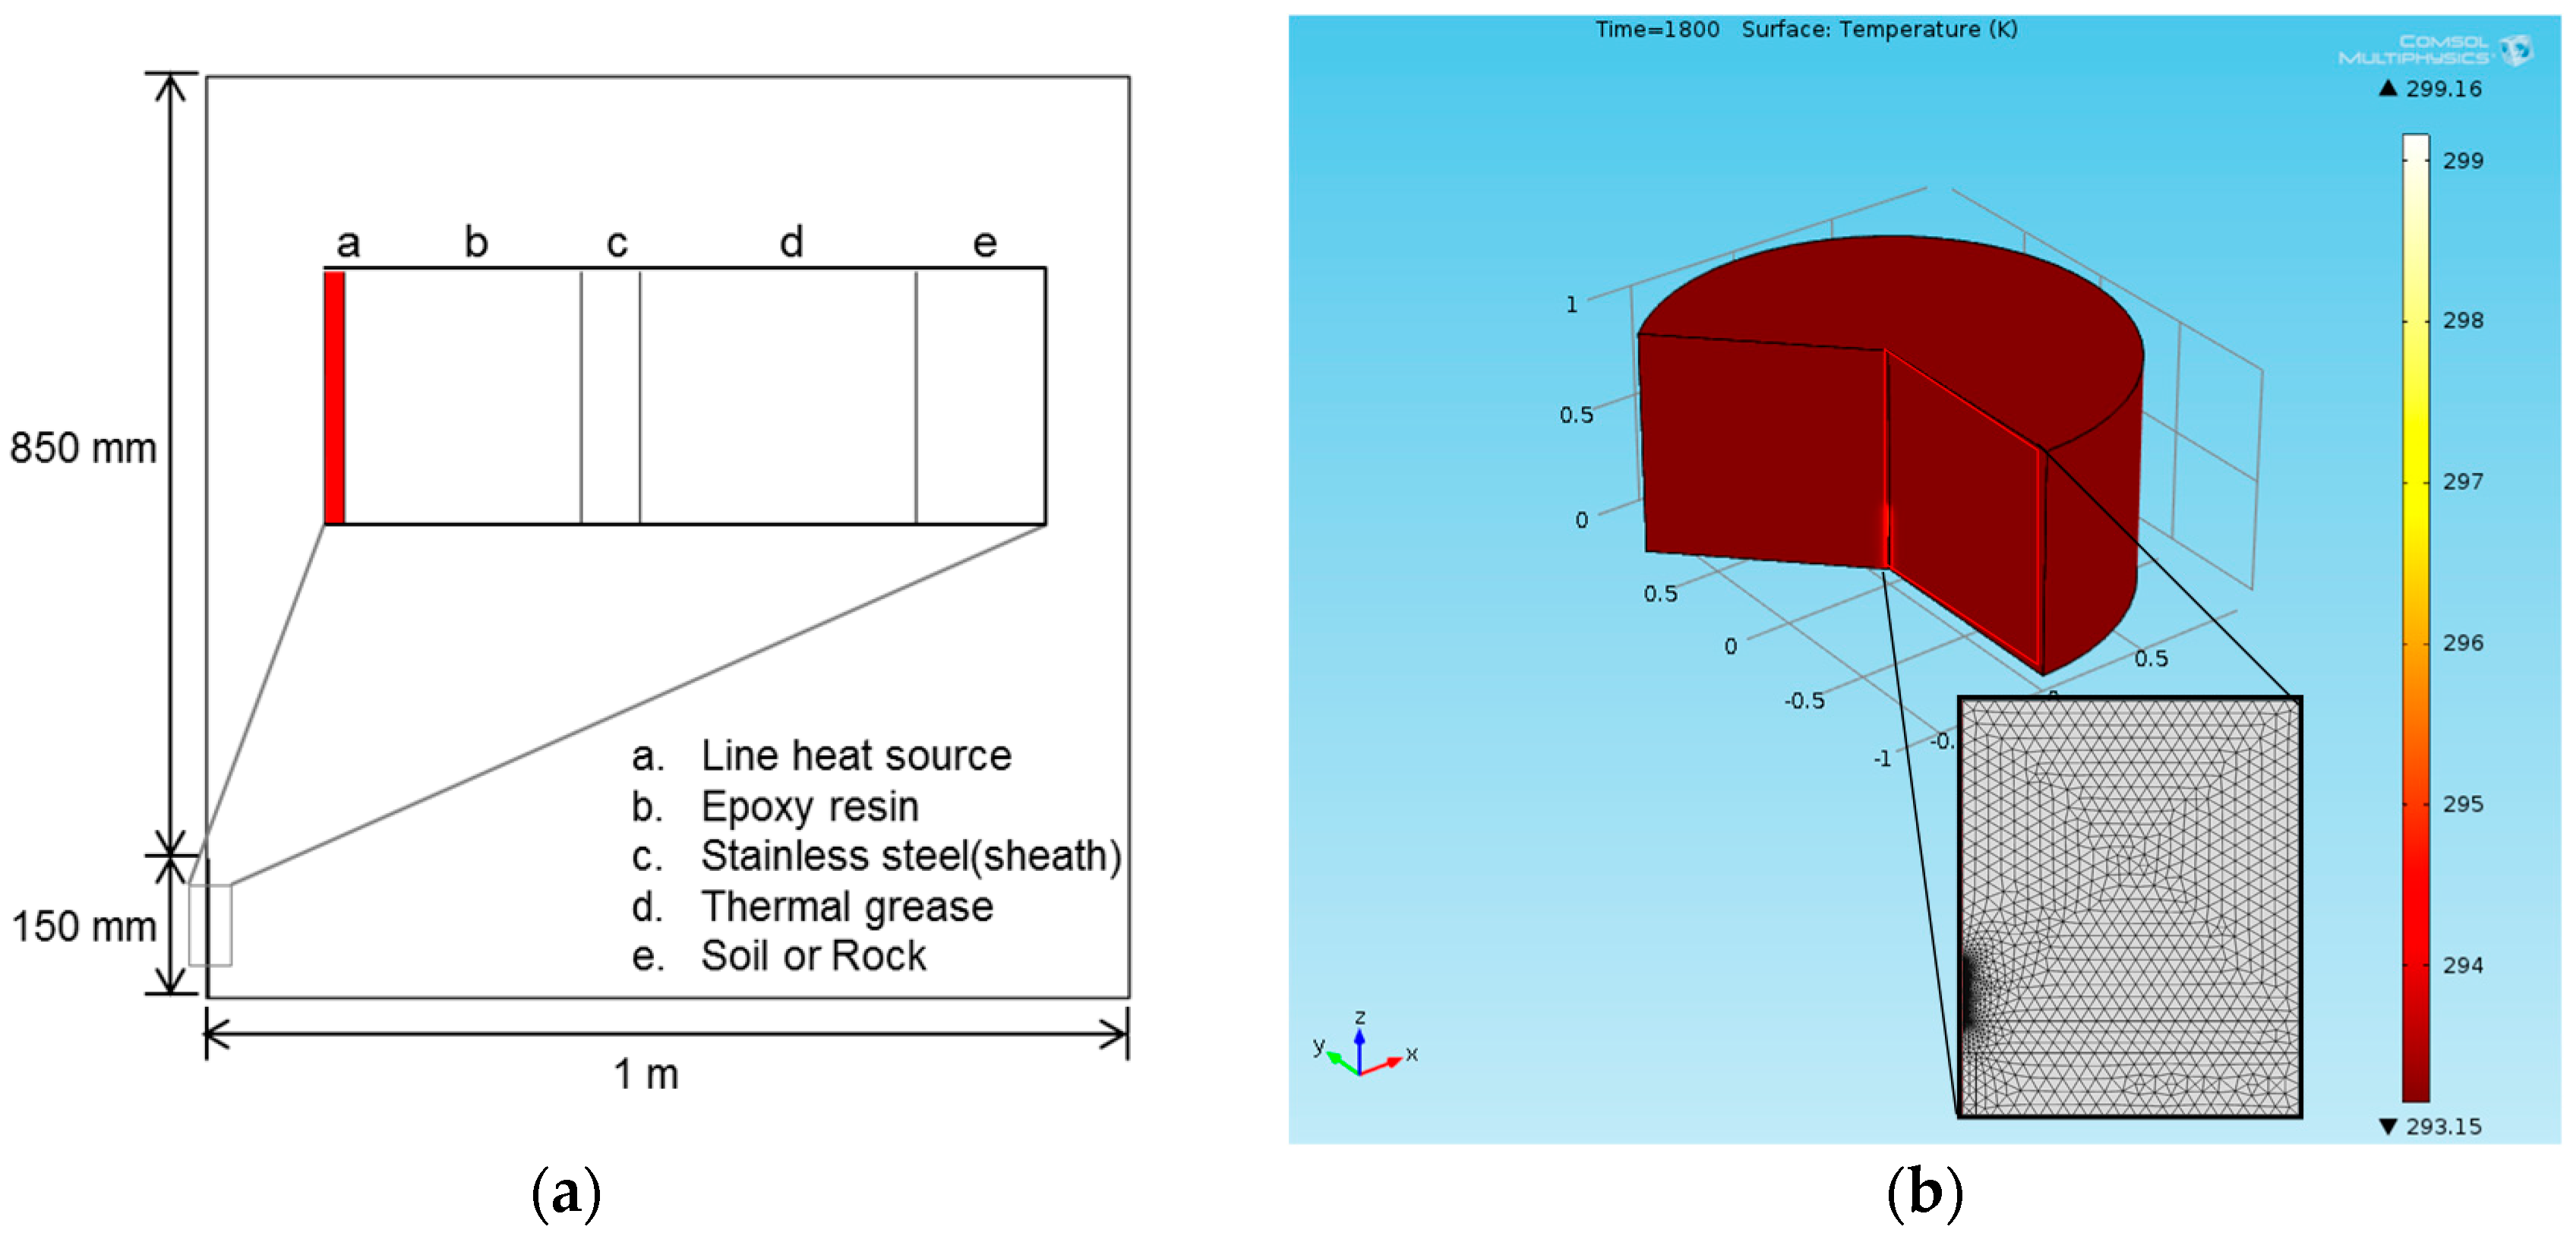
2.1. Numerical Simulation: Geometry and Mesh Configuration

Heat conduction from a line heat source through an inserted probe and thermal grease to a surrounding medium was numerically simulated in an axisymmetric domain by using a finite element code, COMSOL Multiphysics (version 4.2a) [19,20,21]. In this study, a Fourier-type heat conduction model was adopted for modeling heat transfer in geo-materials, as this has been widely used to predict heat transfer at macro-scale and to extract representative thermal properties of soils and rocks (e.g., [4,7,8,14]). However, it is worth noting that heat conduction in nonhomogeneous, dispersive and dissipative media shows dual-phase-lag behaviors and thus it is captured more accurately by a hyperbolic heat conduction equation than a Fourier equation [22].
Figure 2 shows the geometry and configuration of the probe and the surrounding medium used in our numerical simulation. Two thermal needle probes—a thin probe of radius 0.8 mm (or diameter 1/16 inch) and a thick probe of radius 1.6 mm (or diameter 1/8 inch)—each of length 150 mm, were used. Both probes were made of a stainless steel tube and filled with epoxy resin. A 150-mm-long line heat source was installed at the center of the probes that were placed at the center of the axisymmetric domain, as shown in Figure 2a. The length-to-diameter ratio (or L/D ratio) of the probes are ~94 and ~47, respectively, both of which are larger than the recommended value of 30 suggested by Blackwell [12]. The chosen configurations of these thermal needle probes are consistent with the commonly available thermal needle probe designs. A layer of the thermal grease, followed by the target geo-material, was laid over the thermal needle probe. The whole domain size was 1 × 1 m (height × width) with the origin at the center, as shown in Figure 2b. A constant heat flow Q of 3 W∙m−1 was applied to the line heat source, and the temperature variation at half the height of the probe was recorded every second for 1800 s. This temperature variation was later used to estimate the thermal conductivity of the surrounding medium.
To investigate the role of the probe diameter, pre-drilled hole diameter, and thermal conductivity of thermal grease in determining the thermal response of the probe and thermal conductivity of the target geo-materials, various conditions were simulated using the input parameters, as listed in Table 1.

2.2. Experimental Program

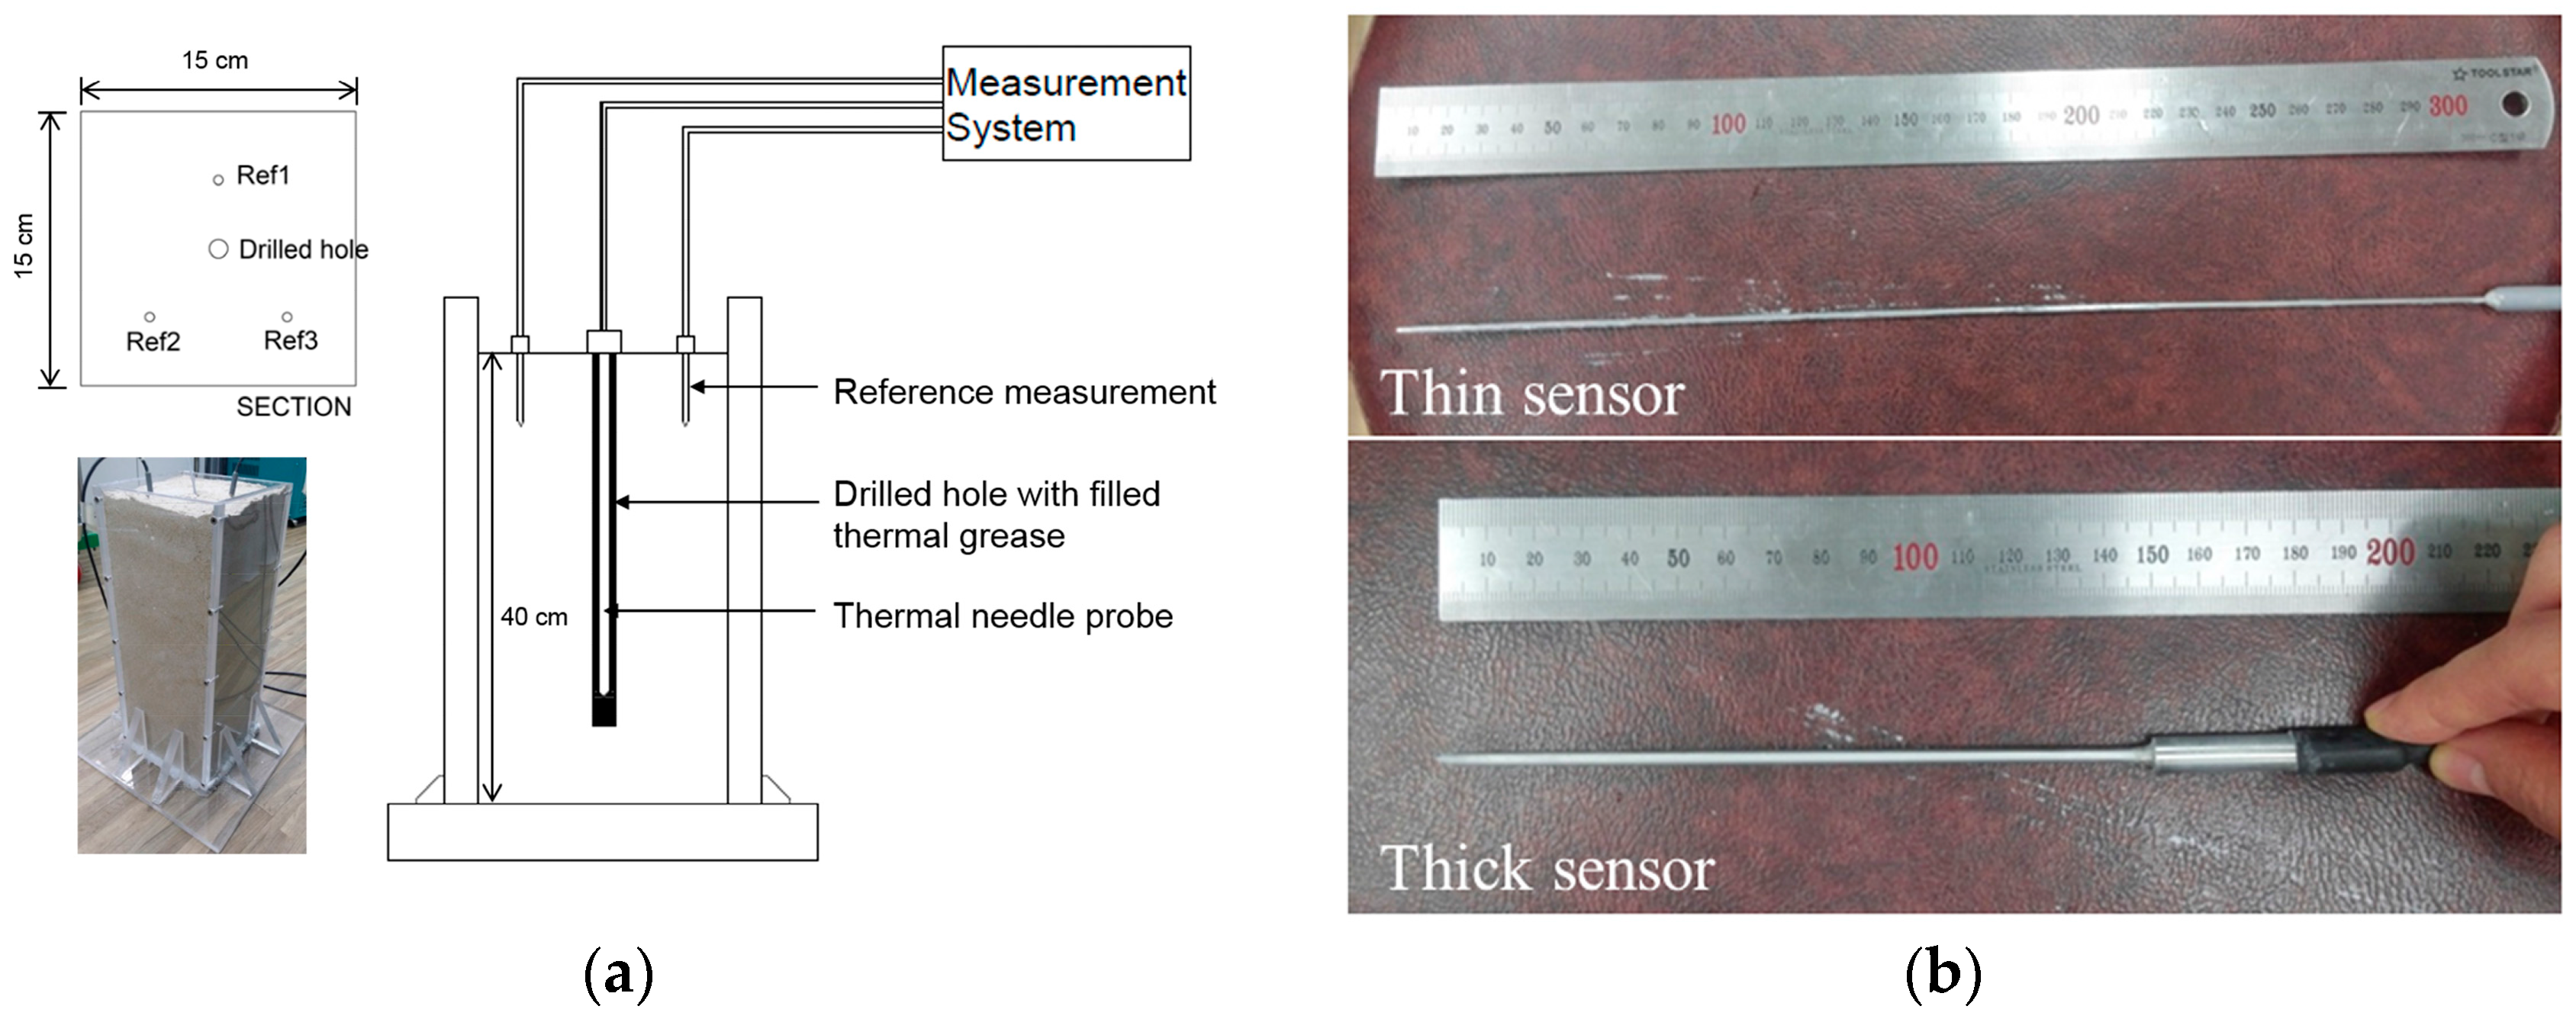
2.2.1. Sample Preparation

Laboratory experiments were conducted using cemented sands to verify the feasibility of the use of a pre-drilled hole for the thermal needle probe method. Figure 3 shows the experimental set-up and the two thermal needle probes (diameters: 1.6 and 3.2 mm) used in this study. Joomunjin silica sand from Korea and gypsum plaster were chosen as the host soil and the cementing agent, respectively. Mixtures of dry sand and dry gypsum plaster were first prepared, and the pre-determined amounts of water were added to the sand–gypsum mixtures and thoroughly mixed prior to compaction. Then, the sand–gypsum–water pastes were hand-tamped in an acrylic mold of dimensions 150 × 150 × 400 mm (width × length × height; Figure 3a). The mixing ratios of sand, gypsum, and water were controlled to achieve thermal conductivity values ranging from ~0.563 W∙m−1∙K−1 to ~1.82 W∙m−1∙K−1, as listed in Table 2. Then, the samples were cured at ambient room temperature (~20 °C) for more than 24 h before measurement.

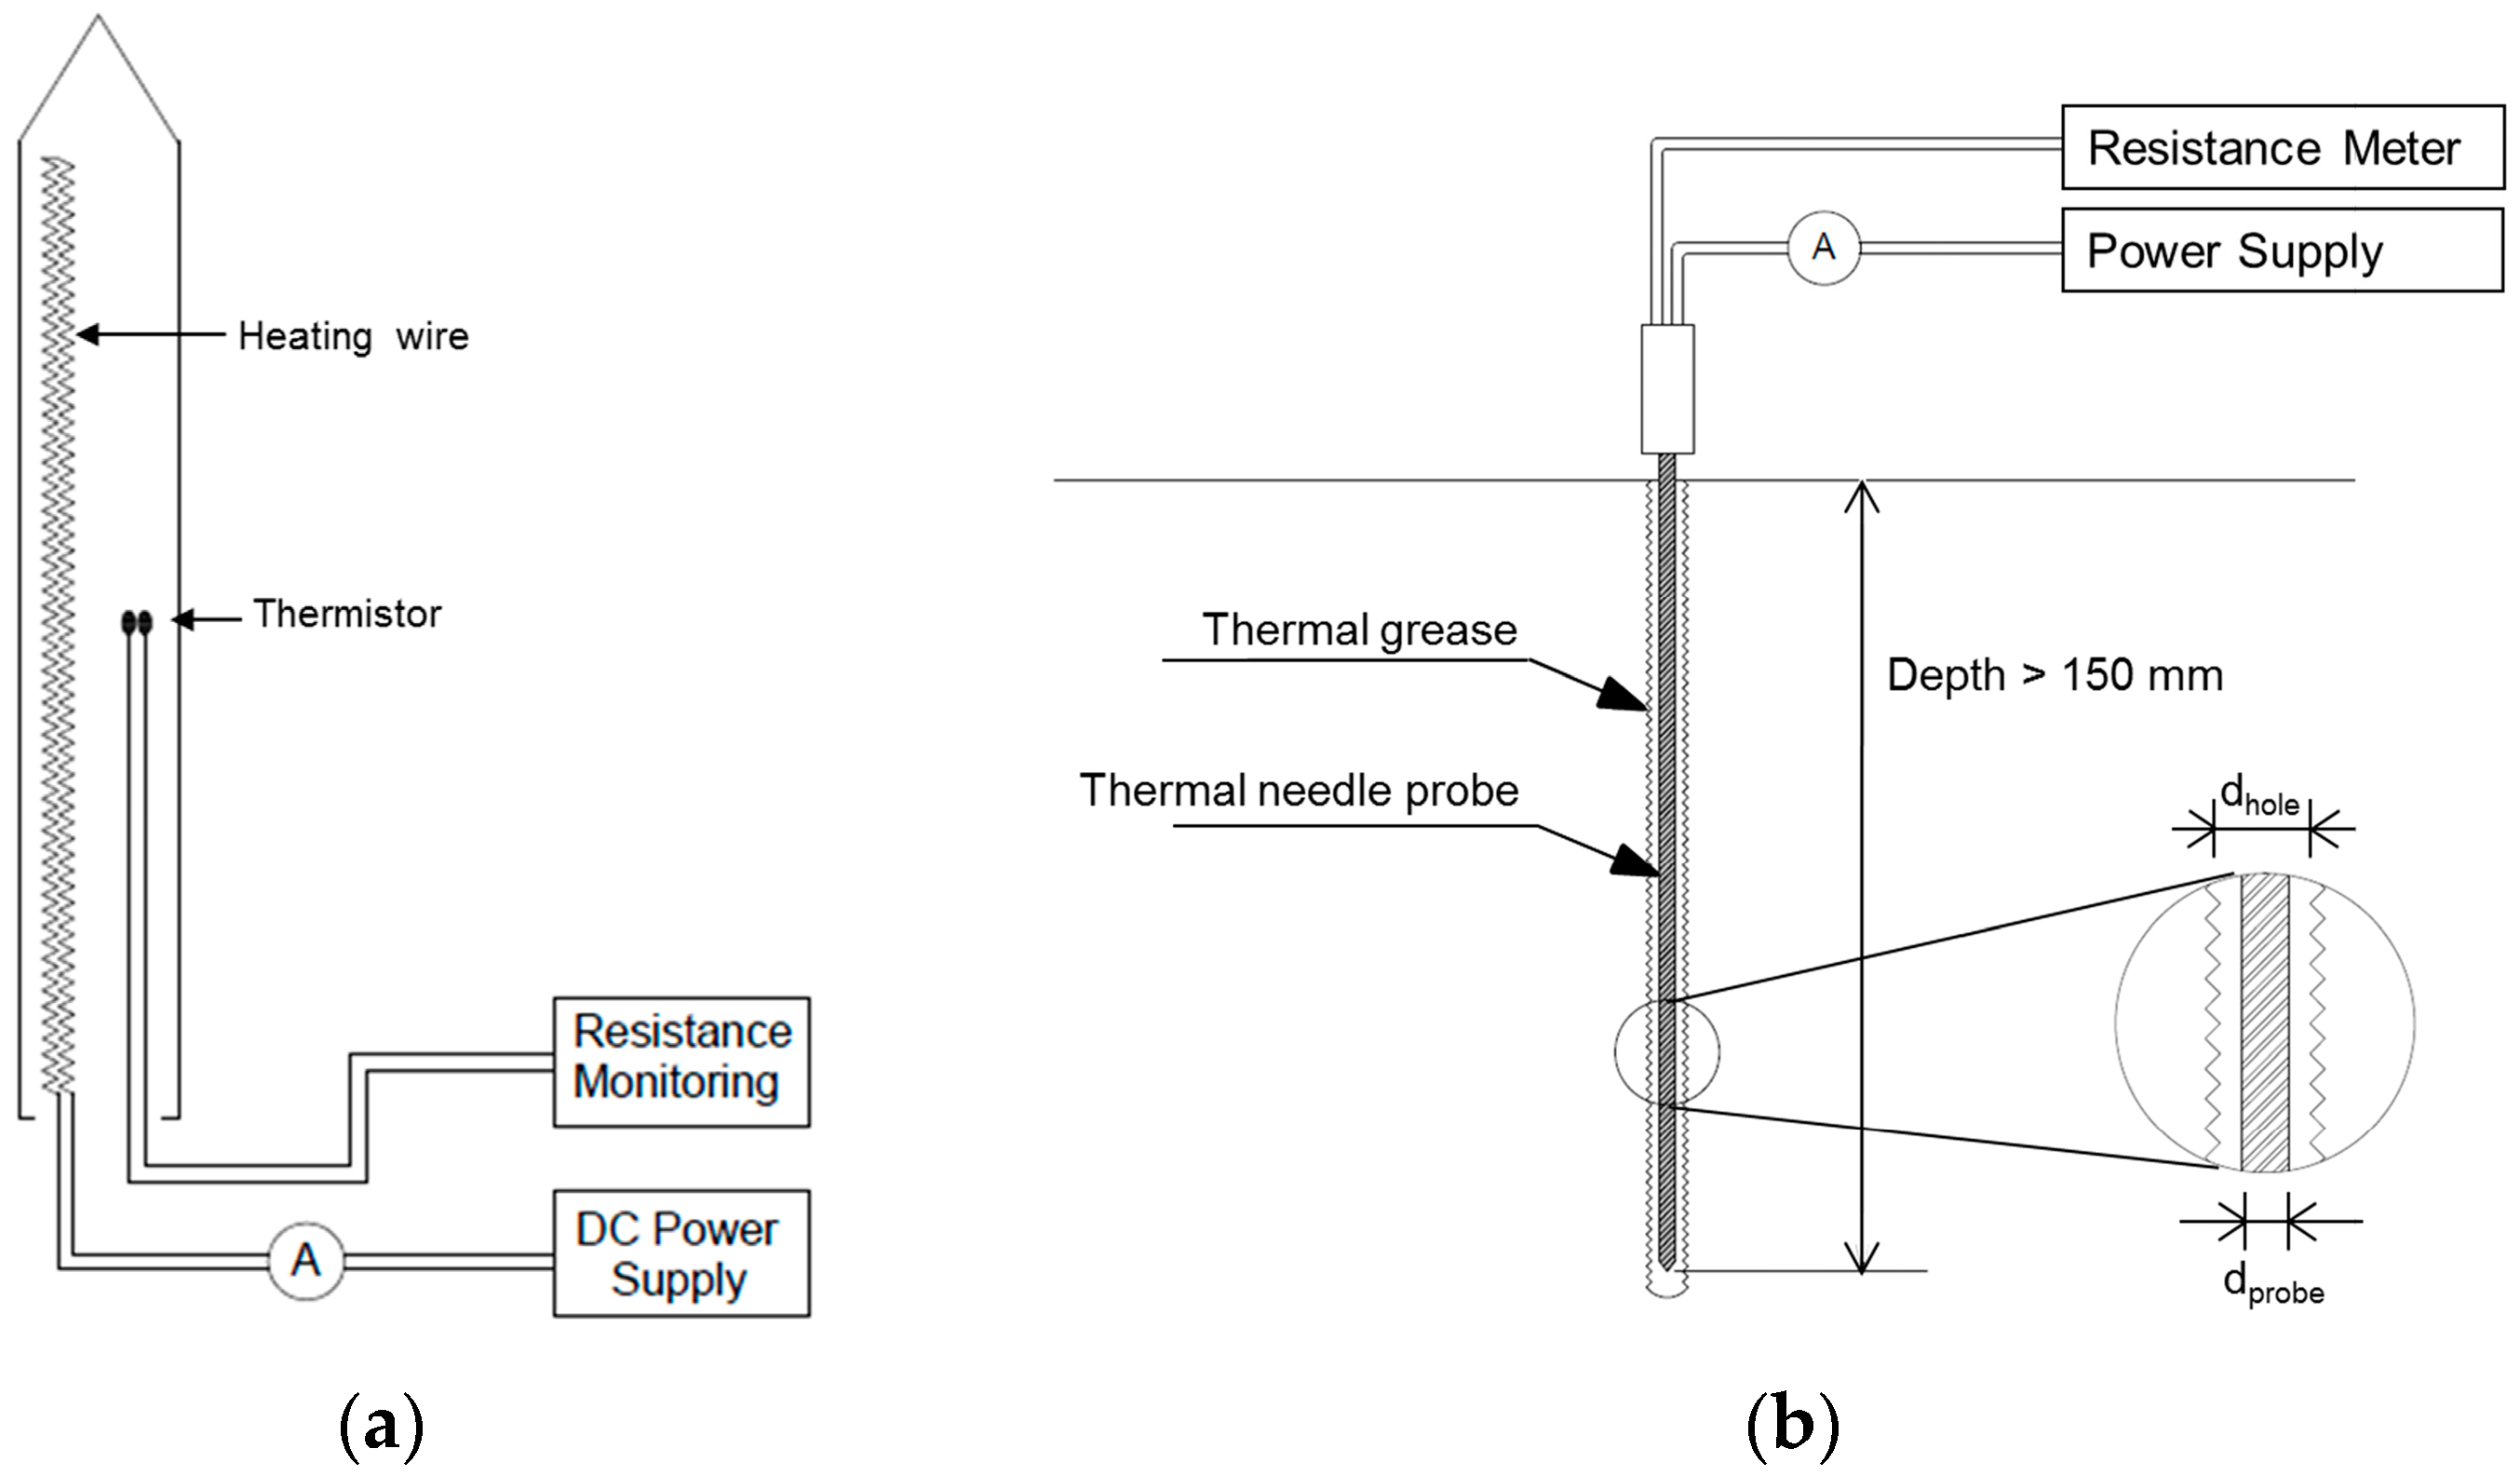
2.2.2. Measurement Procedures

Four thermal needle probes were used for thermal conductivity measurement: one thin probe (East 30 Sensors; Pullman, WA, USA), one thick probe (Hankook Electric Heater; Daejeon, Korea), and two reference probes (East 30 Sensors; Pullman, WA, USA), as shown in Figure 3b. The thin probe was 300 mm long and had a diameter of 1.6 mm; the thick probe was 150 mm long and had a diameter of 3.2 mm. The reference probe was 60 mm long and 1.6 mm in diameter. During sample preparation, the two reference probes were placed prior to the complete curing of gypsum plaster, as shown in Figure 3a. These reference probes were used to obtain the baseline thermal conductivity of the samples for comparison with the results of the proposed method.
Upon complete curing, a straight vertical hole of diameter 6 mm and depth 30 cm was drilled from the top and center of the sample surface. Then, thermal grease with a thermal conductivity of 4.3 W∙m−1∙K−1 (TC-5622; Dow Corning, Auburn, MI, USA) was injected using a plastic disposable syringe until it filled the whole depth of the drilled hole. Thereafter, the thin probe was inserted in the hole, such that the thermal needle probe was surrounded by thermal grease. Finally, Direct current (DC) voltage of 6–15 V was applied to the probe for 30 min; meanwhile, the thermal response of the probe was logged every second. The obtained response was used to estimate the thermal conductivity of the test sample. To verify the repeatability, the thermal response was obtained thrice. Once measurement with the thin probe was completed, measurements were made using the thick probe and the thermal conductivity was estimated similarly. This procedure was applied to all prepared samples.

3. Results and Discussion

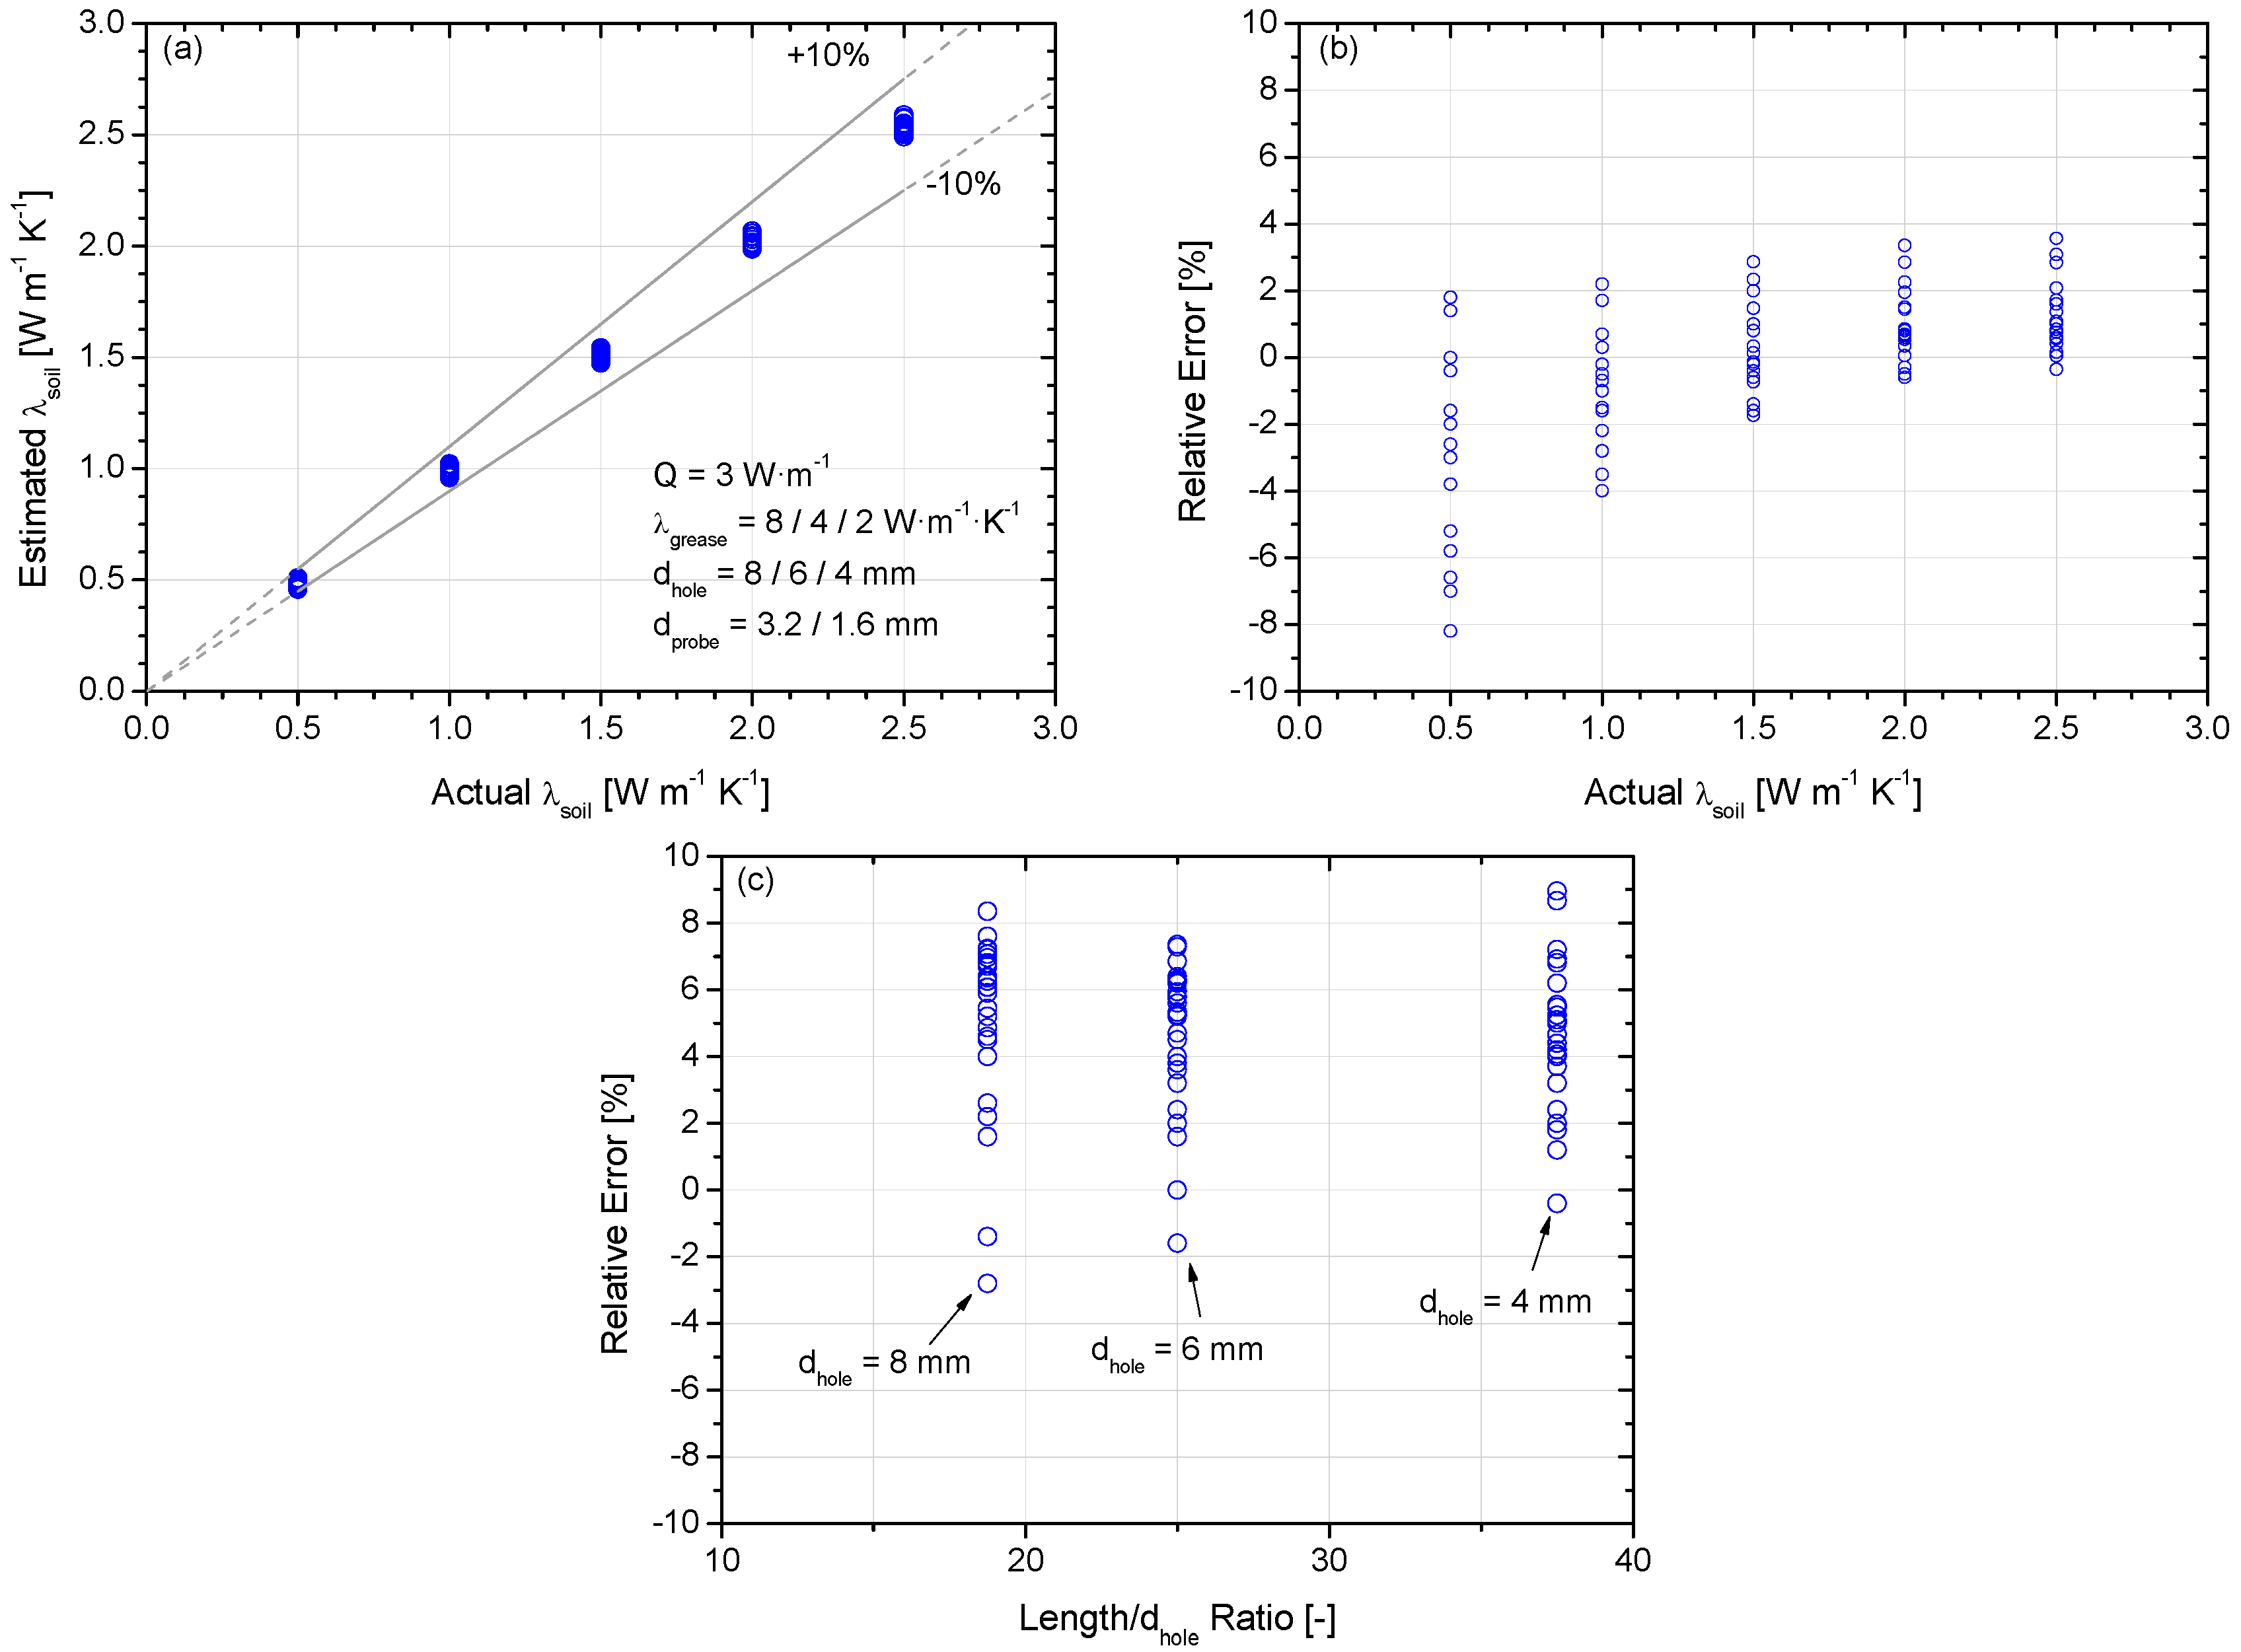
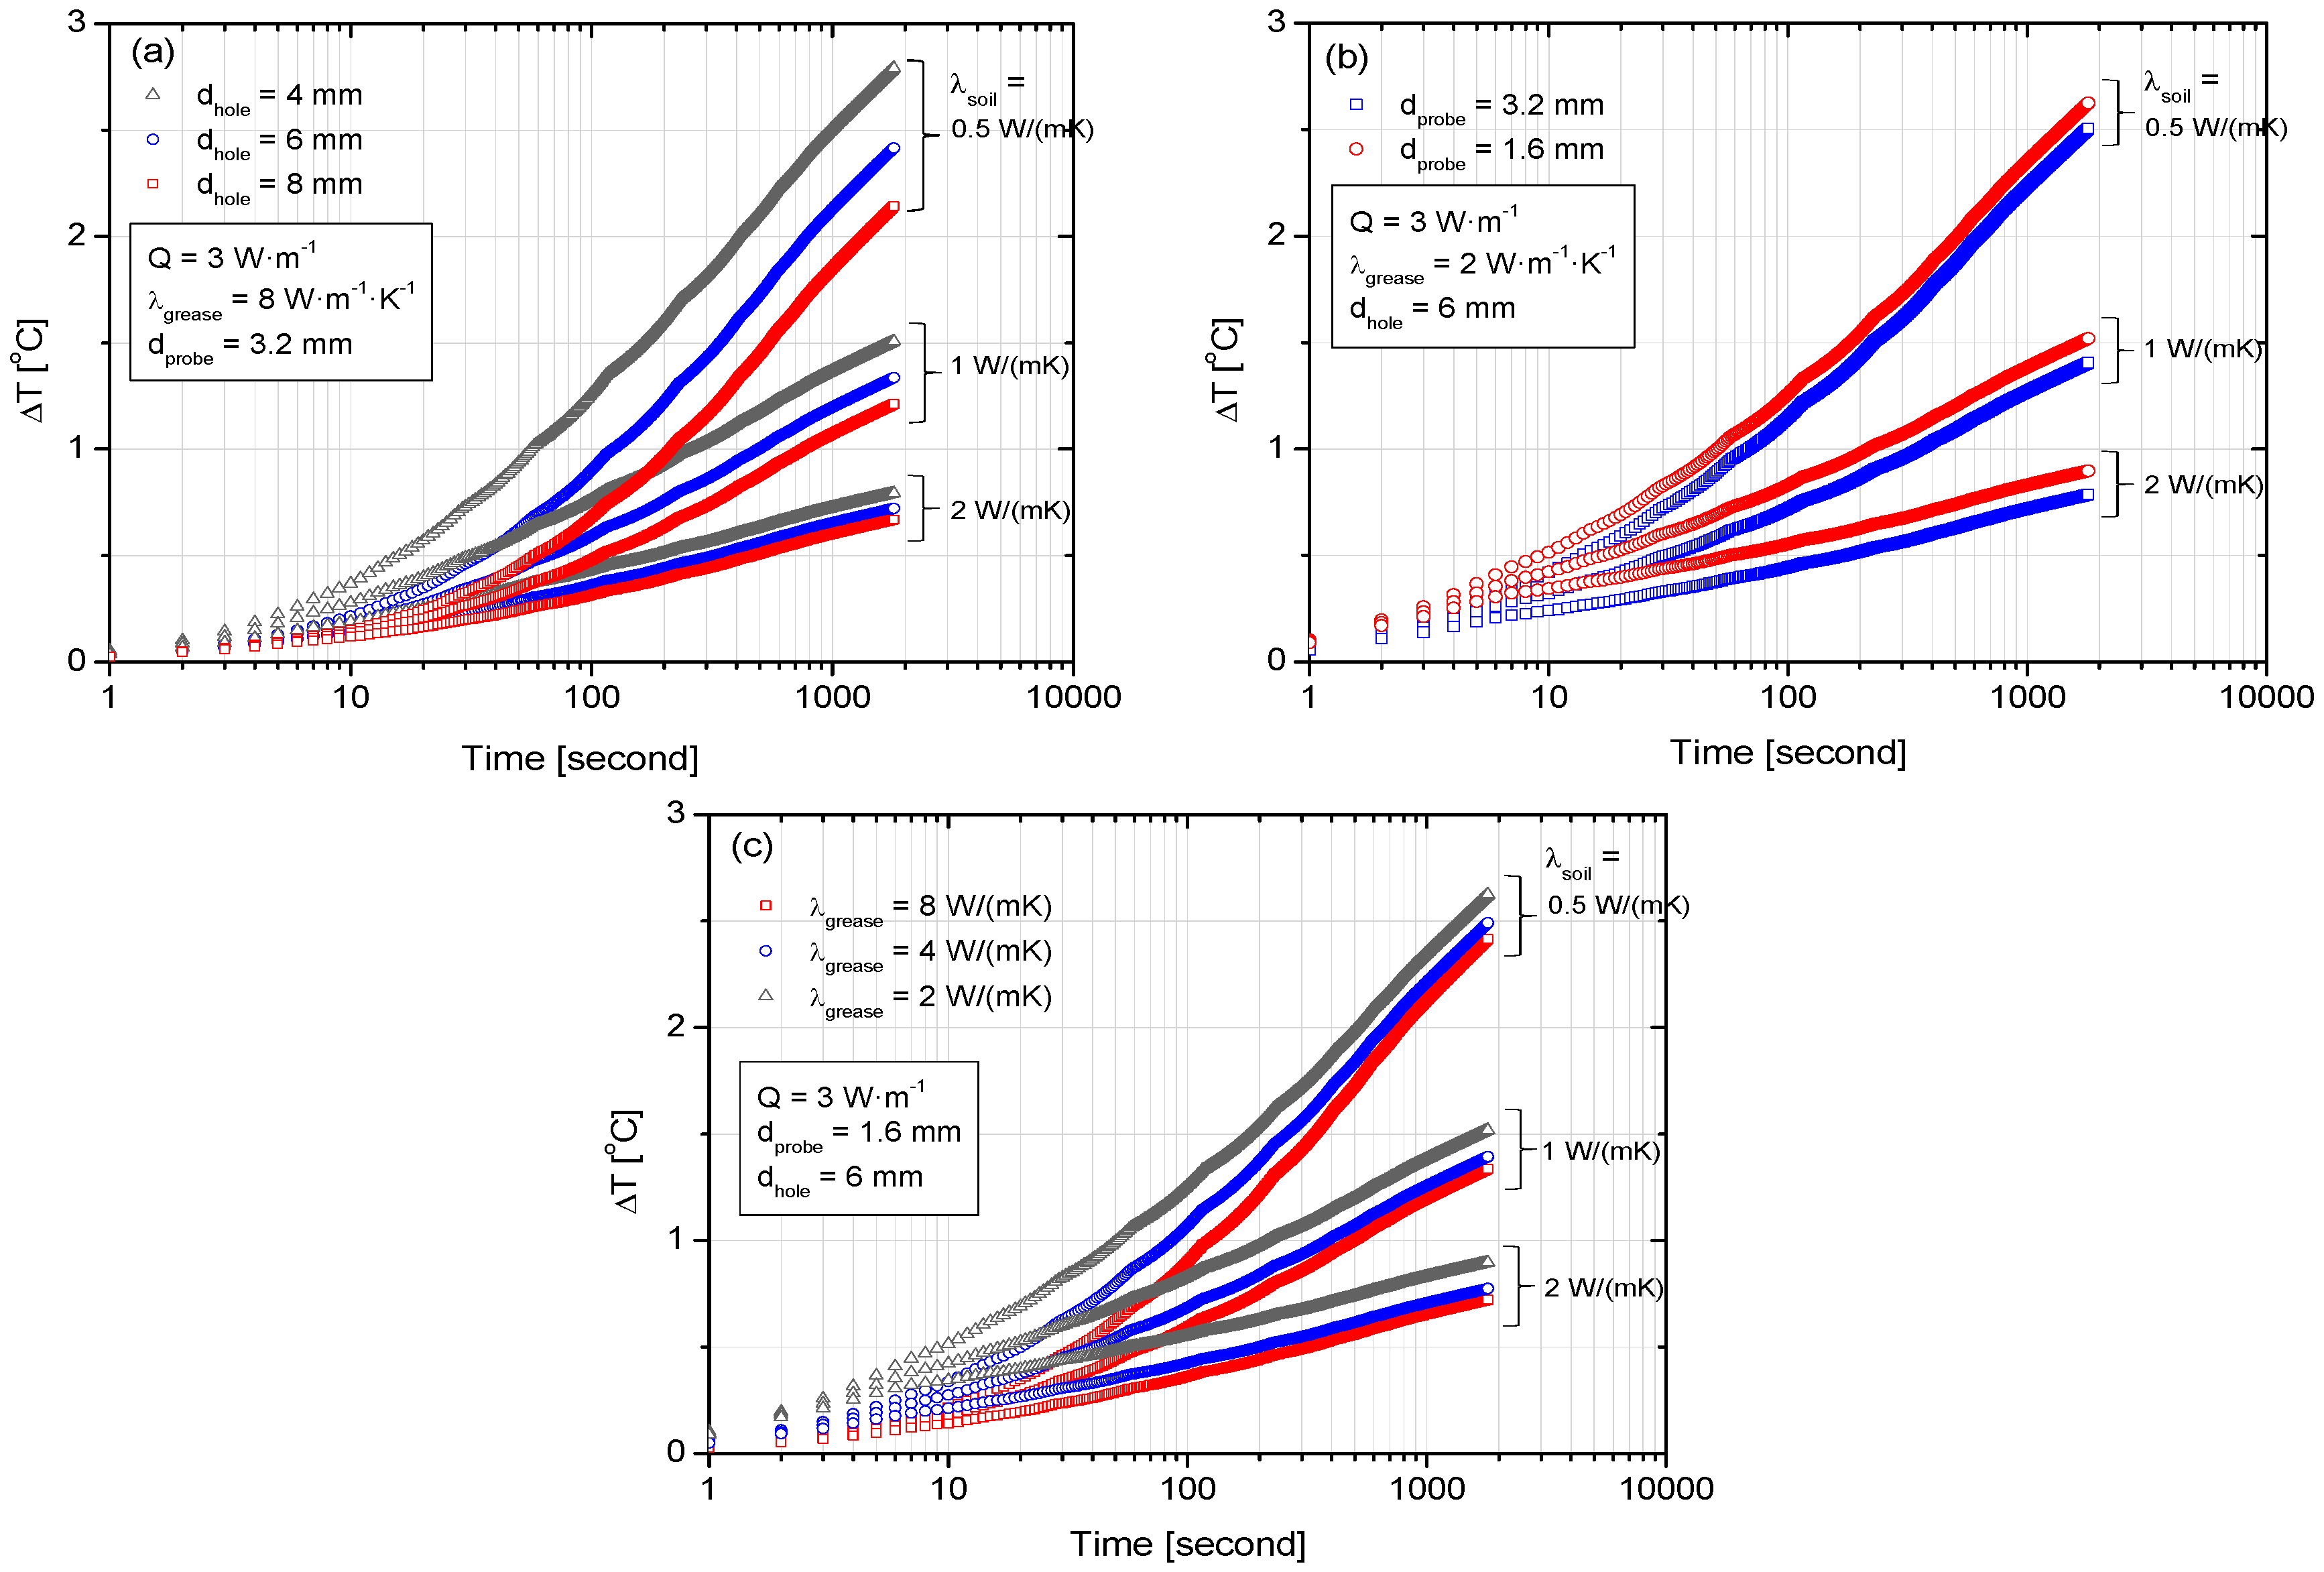
3.1. Effects of Drilled Hole Diameter, Probe Diameter, and Thermal Conductivity of Thermal Grease: Observations from Numerical Simulations

Figure 4 shows the temperature variations at half the height of the probe when a constant heat flux Q of 3 W∙m−1 was applied to the line heat source. The thermal responses varied depending on the thermal conductivities of the surrounding soils and thermal grease, and the diameters of the pre-drilled hole and probe. In all cases, the increases in the thermal conductivity of soils from 0.5 W∙m−1∙K−1 to 2.0 W∙m−1∙K−1 gradually decreased the rate of temperature increase (Figure 4a–c). This indicates that more heat was diffused because of the higher thermal conductivity of soils, resulting in slower temperature rising.
The effect of the drilled hole diameter is shown in Figure 4a. For a given soil thermal conductivity, as the drilled hole diameter increased, the temperature increased slowly. A larger hole diameter implies a thicker layer filled with thermal grease (λ = 8 W∙m−1∙K−1); thus, the higher thermal conductivity of grease than that of soil led to the faster heat diffusion. However, as the soil thermal conductivity increased, this trend was observed to become less significant. The effect of the probe diameter is shown in Figure 4b. The larger the diameter of the probe, the slower was the rise in temperature. This was because thicker probes had more epoxy resin (λ = 0.35 W∙m−1∙K−1) filling, which delayed heat transfer from the line heat source. As the thermal conductivity of the thermal grease filling the gap between the probe and soil increased to 8 W∙m−1∙K−1, the observed trend diminished remarkably; the temperature increase for the probes of diameters 1.6 mm and 3.2 mm differed only slightly. This was because heat was transferred faster through the thermal grease layer. Therefore, the effect of the probe diameter became almost negligible when thermal grease was used. The effect of thermal conductivity of thermal grease is shown in Figure 4c. For soil of a given thermal conductivity, as the thermal conductivity of thermal grease increased, the rate of temperature increase slowed. This clearly indicated that the heat transfer was accelerated by the higher thermal conductivity of the material filling the gap.

3.2. Estimation of Thermal Conductivity: Observations from Numerical Simulations

When the temperature variation was plotted against elapsed time on a semi-logarithmic scale of ΔT-log(time) (Figure 4a–c), a region with the straight ΔT-log(time) curve was observed after ~600 s in all the cases. In other words, regardless of the input parameters, the slope of the curve, i.e., ΔT/Δln(time) became constant after ~600 s. Accordingly, the time interval from 600 s to 1800 s was chosen for thermal conductivity estimation.
Figure 5a shows the comparison between the estimated thermal conductivity and the input thermal conductivity of soil surrounding the pre-drilled hole. The estimated values agreed well with the input thermal conductivity with a relative error less than 9% (also see Table 3). Therefore, it can be concluded that the use of a pre-drilled hole permits the reliable estimation of thermal conductivity with a marginal error less than 10% in cases when appropriate hole size, thermal grease, and time interval are chosen.
The relative error was plotted against the input thermal conductivity in Figure 5b. Although the maximum error was less than 9%, the measurement error was large when the thermal conductivity of soil was low. However, the error margin decreased with increasing thermal conductivity. This was attributed to the relatively consistent noise level in the thermal response, which limits the precision for estimating the slope ΔT/Δln(time). In addition, the relative error showed a fairly consistent range, not affected by the length-to-diameter (L/D) ratio of the drilled hole, as shown in Figure 5c.

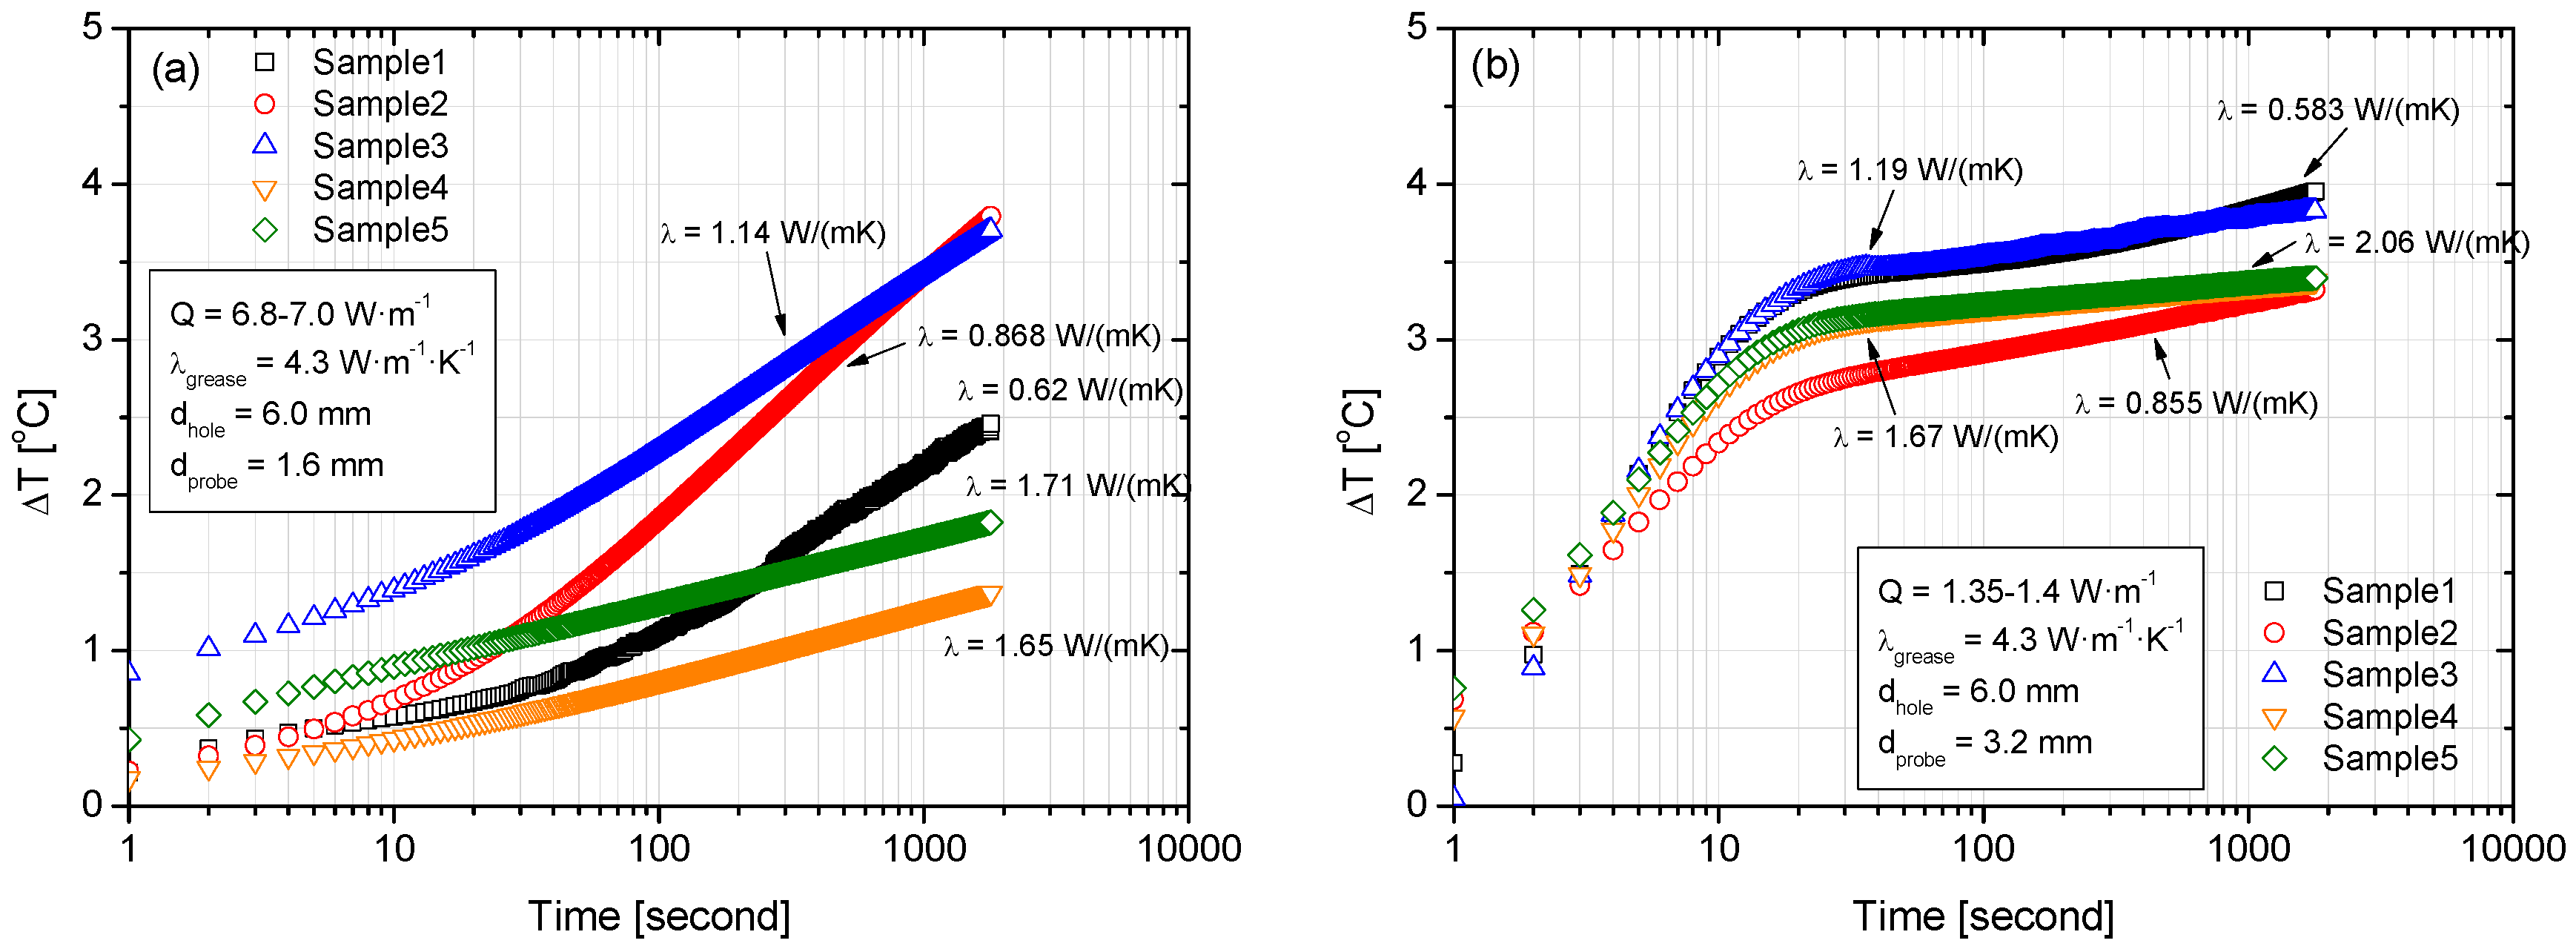
3.3. Verification Using Physical Experiments

Figure 6 shows the experimental thermal responses for the prepared samples. Regardless of the probe diameter, the slope ΔT/Δln(time) was the most gentle for the sample with the highest thermal conductivity (λ = 1.82 W∙m−1∙K−1), while the slope was the steepest for the sample with the lowest thermal conductivity (λ = 0.563 W∙m−1∙K−1). This is consistent with the theory of Carlslaw and Jaeger [1], according to which the slope is inversely proportional to the thermal conductivity of the material surrounding an infinite line heat source. The time interval from 600 s to 1800 s was considered to estimate the thermal conductivity as follows:
λ = Q 4 π Δ T ln ( t 2 t 1 ) ,
where λ is the thermal conductivity (W∙m−1∙K−1); Q is the power per unit length of the line heater (W∙m−1); T is the temperature (K); and t is the time (s). The thermal conductivity, measured by using the pre-drilled hole, was compared with the baseline thermal conductivity, measured by using the reference thermal needle probes (Table 4). All estimated values were in good agreement with the reference values with a marginal error of 10%. Our results provide evidence that the proposed method can provide a reliable measurement for consolidated and cemented soils, and rocks cannot be easily penetrated manually.

4. Conclusions

This study explored the feasibility of using a pre-drilled hole and thermally conductive grease for using a thermal needle probe for measuring the thermal conductivity of soils and rocks. The thermal conductivity obtained by the proposed pre-drilling thermal needle probe method were examined via numerical simulation using a finite element code and through a set of laboratory experiments. Various parameters, such as the pre-drilled hole diameter, probe diameter, and thermal conductivity of thermal grease, were varied to study their influence. An increase in the pre-drilled hole diameter and probe diameter and a decrease in the thermal conductivity of thermal grease led to delays in temperature increase because of slow heat transfer; all the estimated values agreed well with the reference values with relative errors of less than 10%. That is, the temperature increase is mainly governed by the thermal conductivity of soils after a certain time elapsed. Our results prove that the proposed method provides reliable thermal conductivity measurements with an acceptable error and has applications for materials ranging from compacted soils and soft rocks to hard rocks, which cannot be penetrated manually.

Acknowledgments

This research was supported by the Korea Institute of Energy Technology Evaluation and Planning (KETEP) and the Ministry of Trade, Industry and Energy (MOTIE) of the Republic of Korea (20152520100760), and by a grant (13SCIPS04) from Smart Civil Infrastructure Research Program funded by the Ministry of Land, Infrastructure and Transport (MOLIT) of the Korea government and Korea Agency for Infrastructure Technology Advancement (KAIA).

Author Contributions

S.-J. Lee and J.-C. Choi performed the numerical simulation; S. Baek and H.-H. Ryu performed experiments, T.-H. Kwon and K.-I. Song analyzed the data; authors made equal contribution and efforts on writing the manuscript.

Conflicts of Interest

The authors declare no conflict of interest.

References

  1. Carslaw, H.S.; Jaeger, J.C. Conduction of Heat in Solids, 2nd ed.; Oxford University Press: London, UK, 1959; pp. 1–455. [Google Scholar]
  2. Incropera, F.P.; Burkhard, S. Fundamentals of Heat and Mass Transfer, 4th ed.; John Wiley and Sons: Hoboken, NJ, USA, 1996; pp. 1–241. [Google Scholar]
  3. Chen, S.X. Thermal conductivity of sands. Heat Mass Transf. 2008, 44, 1241–1246. [Google Scholar] [CrossRef]
  4. Yun, T.S.; Santamarina, J.C. Fundamental study of thermal conduction in dry soils. Granul. Matter 2008, 10, 197–207. [Google Scholar] [CrossRef]
  5. Nasirian, A.; Cortes, D.D.; Dai, S. The physical nature of thermal conduction in dry granular media. Géotech. Lett. 2015, 5, 1–5. [Google Scholar] [CrossRef]
  6. Kumai, W.; Hashimoto, I.; Ohsawa, S.; Mitani, M.; Matsuda, Y. Completion of high-efficiency water pipe cooling system for underground transmission line. IEEE Trans. Power Deliv. 1994, 9, 585–590. [Google Scholar] [CrossRef]
  7. Brandl, H. Energy foundations and other thermos-active ground structures. Géotechnique 2006, 56, 81–122. [Google Scholar] [CrossRef]
  8. Johnston, I.W.; Narsilio, G.A.; Colls, S. Emerging geothermal energy technologies. KSCE J. Civ. Eng. 2011, 15, 643–653. [Google Scholar] [CrossRef]
  9. Choi, J.C.; Lee, S.R.; Lee, D.S. Numerical simulation of vertical ground heat exchangers: Intermittent operation in unsaturated soil conditions. Comput. Geotech. 2011, 38, 949–958. [Google Scholar] [CrossRef]
  10. Sass, J.H.; Stone, C.; Munroe, R.J. Thermal conductivity determinations on solid rock—A comparison between a steady-state divided-bar apparatus and a commercial transient line-source device. J. Volcanol. Geotherm. Res. 1984, 20, 145–153. [Google Scholar] [CrossRef]
  11. Van Der Held, E.F.M.; Van Drunen, F.G. A method of measuring thermal conductivity of liquids. Physica 1949, 15, 865–881. [Google Scholar] [CrossRef]
  12. Blackwell, J.H. The axial-flow error in the thermal conductivity probe. Can. J Phys. 1956, 34, 412–417. [Google Scholar] [CrossRef]
  13. Von Herzen, R.; Maxwell, A.E. The measurement of thermal conductivity of deep-sea sediments by a needle-probe method. J. Geophys. Res. 1959, 64, 1557–1563. [Google Scholar] [CrossRef]
  14. Woodside, W.M.J.H.; Messmer, J.H. Thermal conductivity of porous media. I. Unconsolidated sands. J. Appl. Phys. 1961, 32, 1688–1699. [Google Scholar] [CrossRef]
  15. Jones, B.W. Thermal conductivity probe: Development of method and application to a coarse granular medium. J. Phys. E Sci. Instrum. 1988, 21, 832–839. [Google Scholar] [CrossRef]
  16. Gori, F.; Marino, C.; Pietrafesa, M. Experimental measurements and theoretical predictions of the thermal conductivity of two phases glass beads. Int. Commun. Heat Mass. 2001, 28, 1091–1102. [Google Scholar] [CrossRef]
  17. Go, G.H.; Lee, S.R.; Kim, Y.S.; Park, H.K.; Yoon, S. A new thermal conductivity estimation model for weathered granite soils in Korea. Geomech. Eng. 2014, 6, 359–376. [Google Scholar] [CrossRef]
  18. Standard Test Method for Determination of Thermal Conductivity by Thermal Needle Probe Procedure; ASTM D5334-14; ASTM International: West Conshohocken, PA, USA, 2014.
  19. COMSOL. COMSOL Multiphysics User’s Guide (Version 4.2a); COMSOL Inc.: Stockholm, Sweden, 2011. [Google Scholar]
  20. Park, H.; Lee, S.R.; Yoon, S.; Shin, H.; Lee, D.S. Case study of heat transfer behavior of helical ground heat exchanger. Energy Build. 2012, 53, 137–144. [Google Scholar] [CrossRef]
  21. Yoon, S.; Lee, S.R.; Go, G.H. A numerical and experimental approach to the estimation of borehole thermal resistance in ground heat exchanger. Energy 2014, 71, 547–555. [Google Scholar] [CrossRef]
  22. Kaminski, W. Hyperbolic heat conduction equation for materials with a nonhomogeneous inner structure. J. Heat Transf. 1990, 112, 555–560. [Google Scholar] [CrossRef]
Figure 1. Schematics of thermal needle probe (a); and the proposed thermal conductivity measurement method (b).
Energies 09 00846 g001
Figure 2. (a) Axisymmetry geometry and (b) the mesh configuration in finite element simulation.
Energies 09 00846 g002
Figure 3. (a) Set-up and sensor locations for experiments; and (b) thermal needle probes used in this study.
Energies 09 00846 g003
Figure 4. Numerical simulation results varying (a) drilled hole diameter; (b) probe thickness; and (c) thermal conductivity of grease.
Energies 09 00846 g004
Figure 5. (a) Comparison between the estimated and actual thermal conductivity values; (b) the relative error versus the thermal conductivity of soil; and (c) the relative error versus the length-to-diameter ratio of the drilled hole.
Energies 09 00846 g005
Figure 6. Thermal responses obtained from experiments: (a) the thin sensor; and (b) the thick sensor.
Energies 09 00846 g006
Table 1. Input parameters for numerical simulation.
MaterialThermal Conductivity λ (W∙m−1∙K−1)Specific Heat Capacity Cp (J∙kg−1∙K−1)Density ρ (kg∙m−3)Thickness for Thick Sensor (mm)Thickness for Thin Sensor (mm)
Stainless steel16.250178500.30.3
Epoxy0.3510001271.51.30.5
Thermal grease890040000.41.2
490020001.42.2
290010002.43.2
Soil 10.59001600--
Soil 2111001700--
Soil 31.513001800--
Soil 4215001900--
Soil 52.518002000--
Table 2. Conditions for sample preparation.
Sample NumberMass of Mixtures (kg)Estimated Porosity 2 (%)Estimated Water Saturation 3 (%)Reference Thermal Conductivity (W∙m−1∙K−1)
SandGypsum Plaster 1Water
110.41.61.06427.400.563
29.11.0780.737.000.945
39.12.1561.428.501.165
49.12.82.816.5751.710
59.12.83.521.5951.820
1 The density of gypsum was measured as 0.98 g/cm3 and the water required for complete hydration of the gypsum plaster was assumed to be ~66.7% of the gypsum plaster mass. 2 The estimated porosity was defined as the void volume divided by the volume of sand and gypsum after curing. 3 The water saturation was defined as the volume of water left divided by the void volume after curing.
Table 3. Summary of numerical simulation results.
λgrease (W∙m−1∙K−1)dhole (mm)λsoil (W∙m−1∙K−1)Thick SensorThin Sensor
λcalculated (W∙m−1∙K−1)Relative Error (%)λcalculated (W∙m−1∙K−1)Relative Error (%)
880.50.467−6.60.459−8.2
10.972−2.80.96−4.0
1.51.489−0.71.474−1.7
22.0120.61.994−0.3
2.52.5341.42.5140.6
60.50.471−5.80.465−7.0
10.978−2.20.965−3.5
1.51.494−0.41.476−1.6
22.0130.61.99−0.5
2.52.5251.02.5010.0
40.50.481−3.80.474−5.2
10.985−1.50.972−2.8
1.51.498−0.11.479−1.4
22.0110.61.988−0.6
2.52.5150.62.491−0.4
480.50.467−6.60.49−2.0
10.972−2.80.998−0.2
1.51.489−0.71.5151.0
22.0120.62.0452.3
2.52.5341.42.5712.8
60.50.492−1.60.487−2.6
10.998−0.20.99−1.0
1.51.5120.81.5020.1
22.0291.52.0170.8
2.52.5431.72.5271.1
40.50.49−2.00.485−3.0
10.993−0.70.984−1.6
1.51.532.01.491−0.6
22.0140.72.0010.0
2.52.5190.82.5040.2
280.50.5091.80.5071.4
11.0222.21.0171.7
1.51.5432.91.5352.3
22.0673.42.0572.9
2.52.5893.62.5773.1
60.50.50.00.498−0.4
11.0070.71.0030.3
1.51.5221.51.5151.0
22.0392.02.031.5
2.52.5522.12.541.6
40.50.492−1.60.49−2.0
10.995−0.50.99−1.0
1.51.5050.31.497−0.2
22.0160.82.0070.4
2.52.5210.82.510.4
Relative error was defined as (λsoil – λcalculated)/λsoil × 100 (%).
Table 4. Summary of experiment results.
Sample NumberReference λ (W∙m−1∙K−1)λ Estimated by the Thin Sensor (W∙m−1∙K−1)Relative Error (%)λ Estimated by the Thick Sensor (W∙m−1∙K−1)Relative Error (%)
10.5630.620−10.10.583−3.6
20.9450.8688.10.8559.5
31.171.142.61.19−1.7
41.711.653.51.672.3
51.821.716.02.06−13.2
Relative error was defined as (λreference – λestimated)/λreference × 100 (%).

