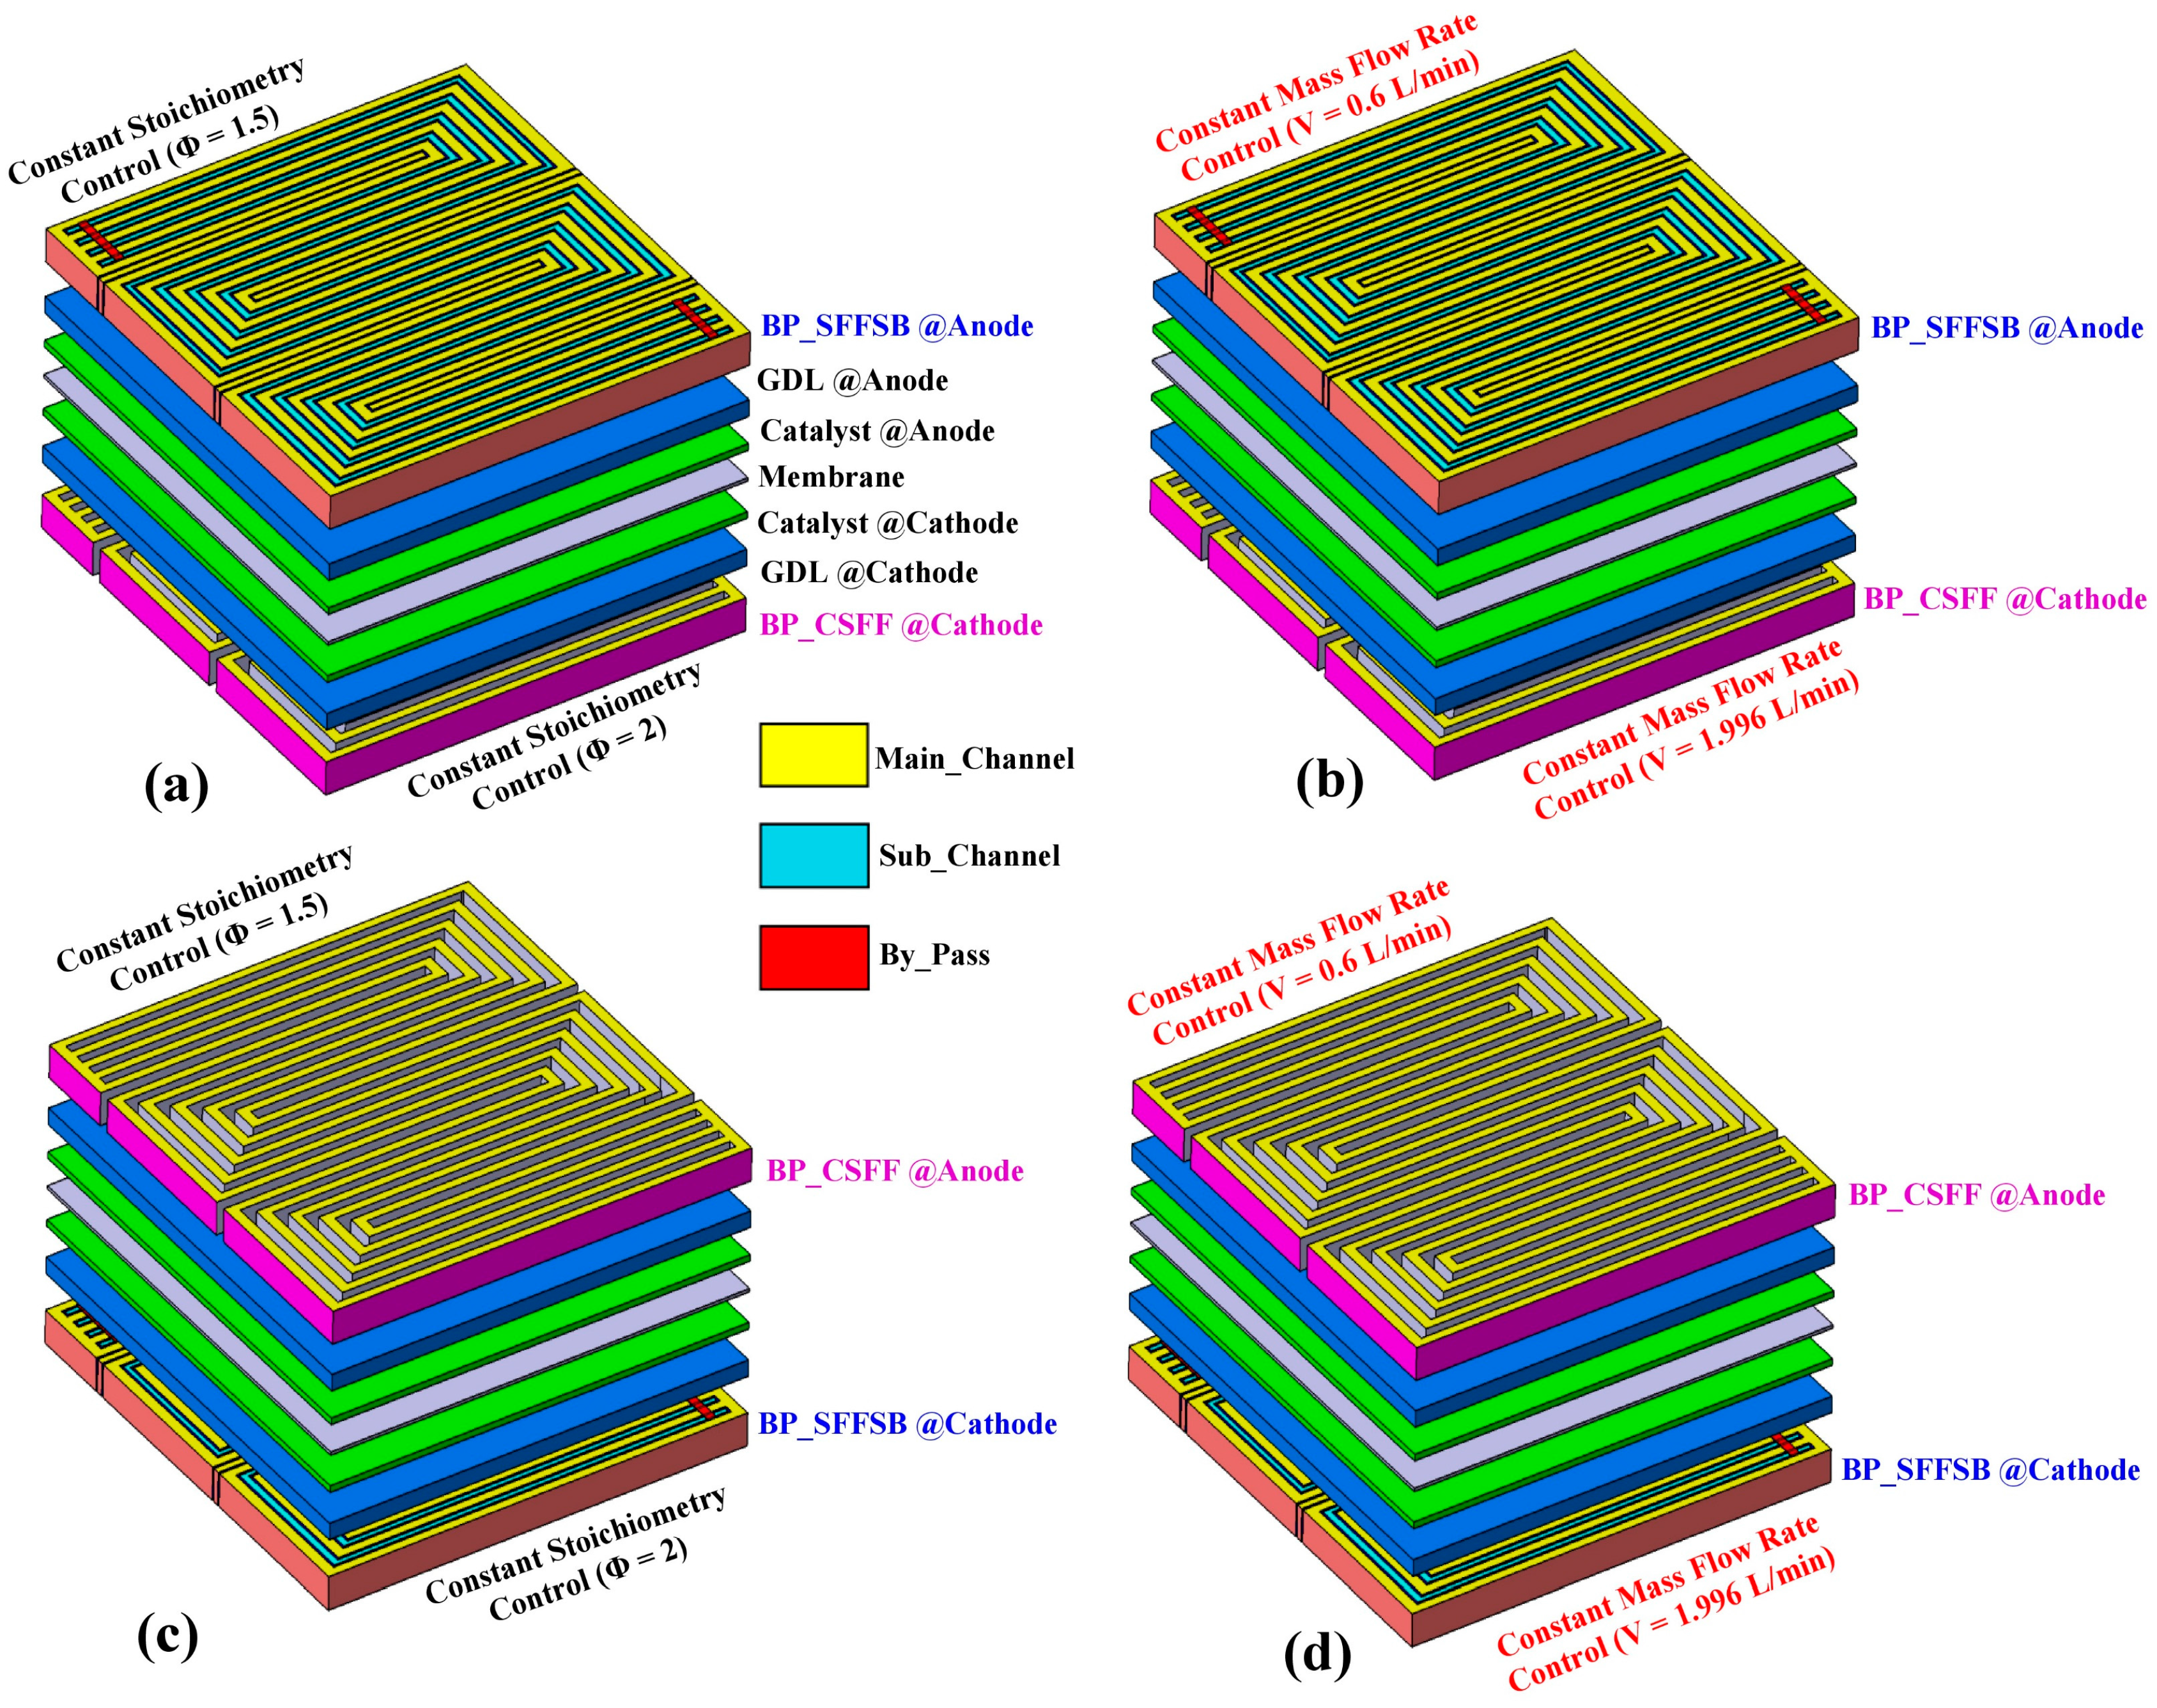
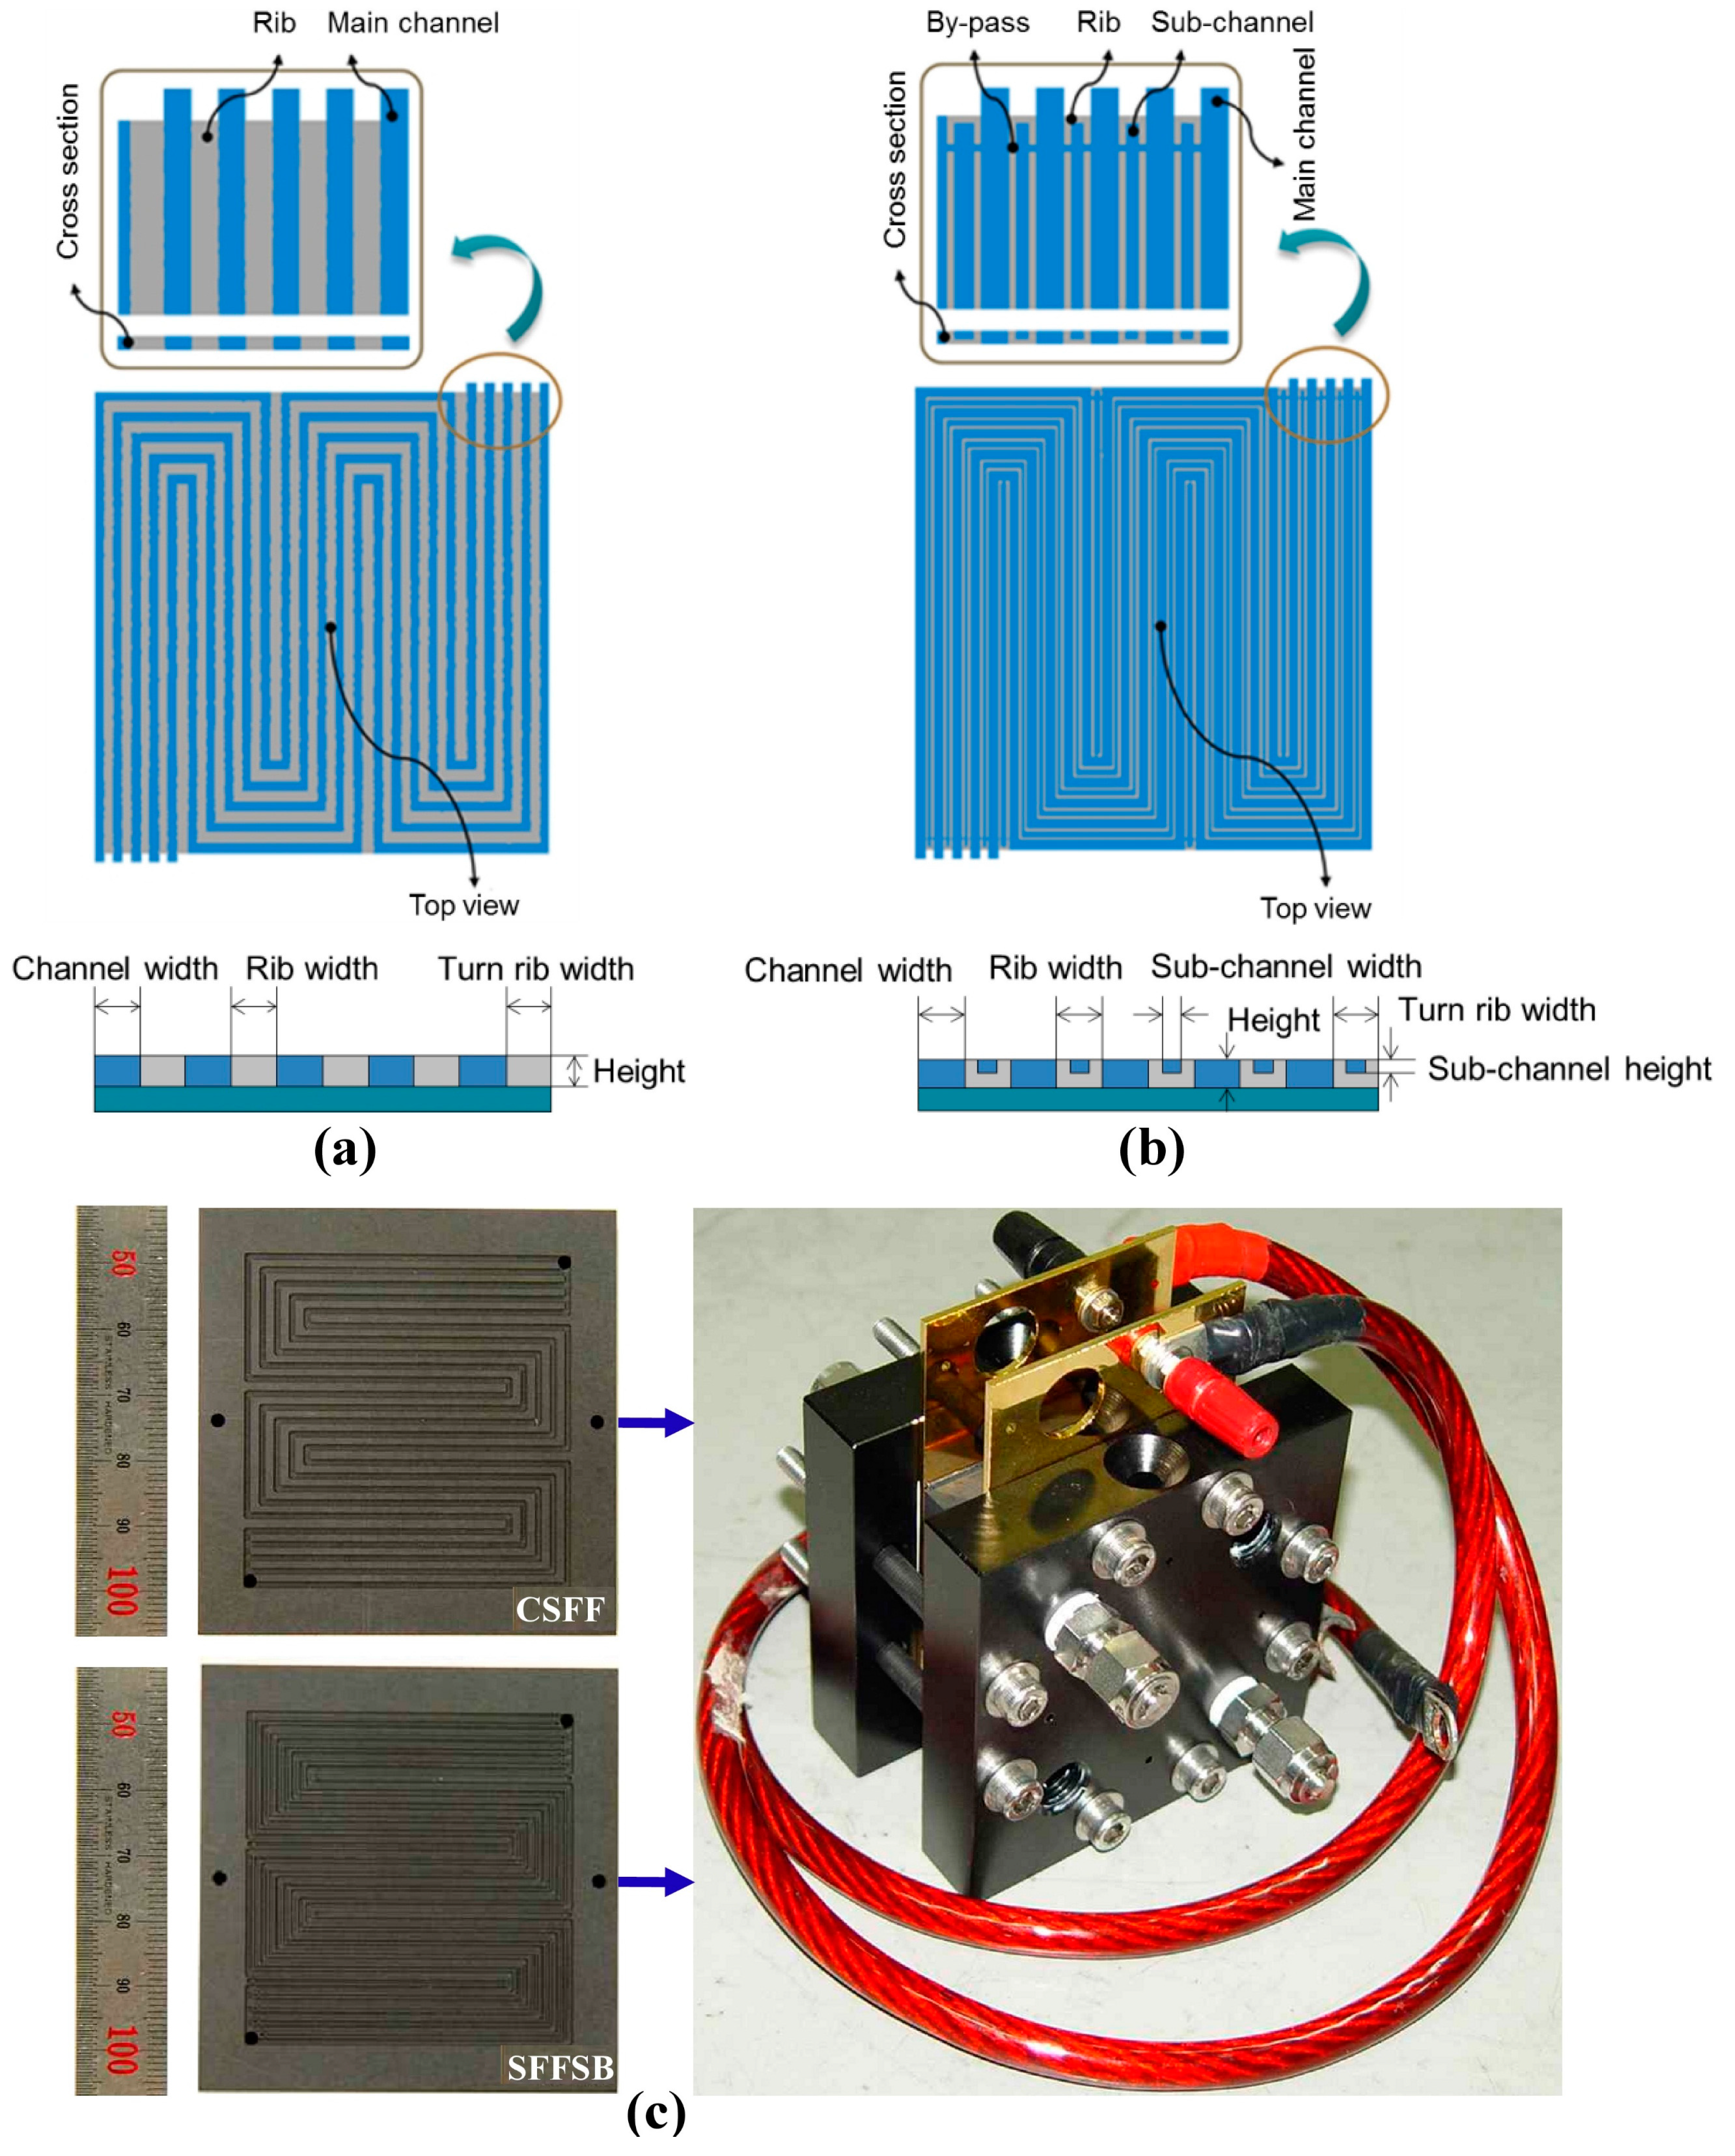
4.1. Effect of Flow-Field Design on Temperature and Pressure Distribution
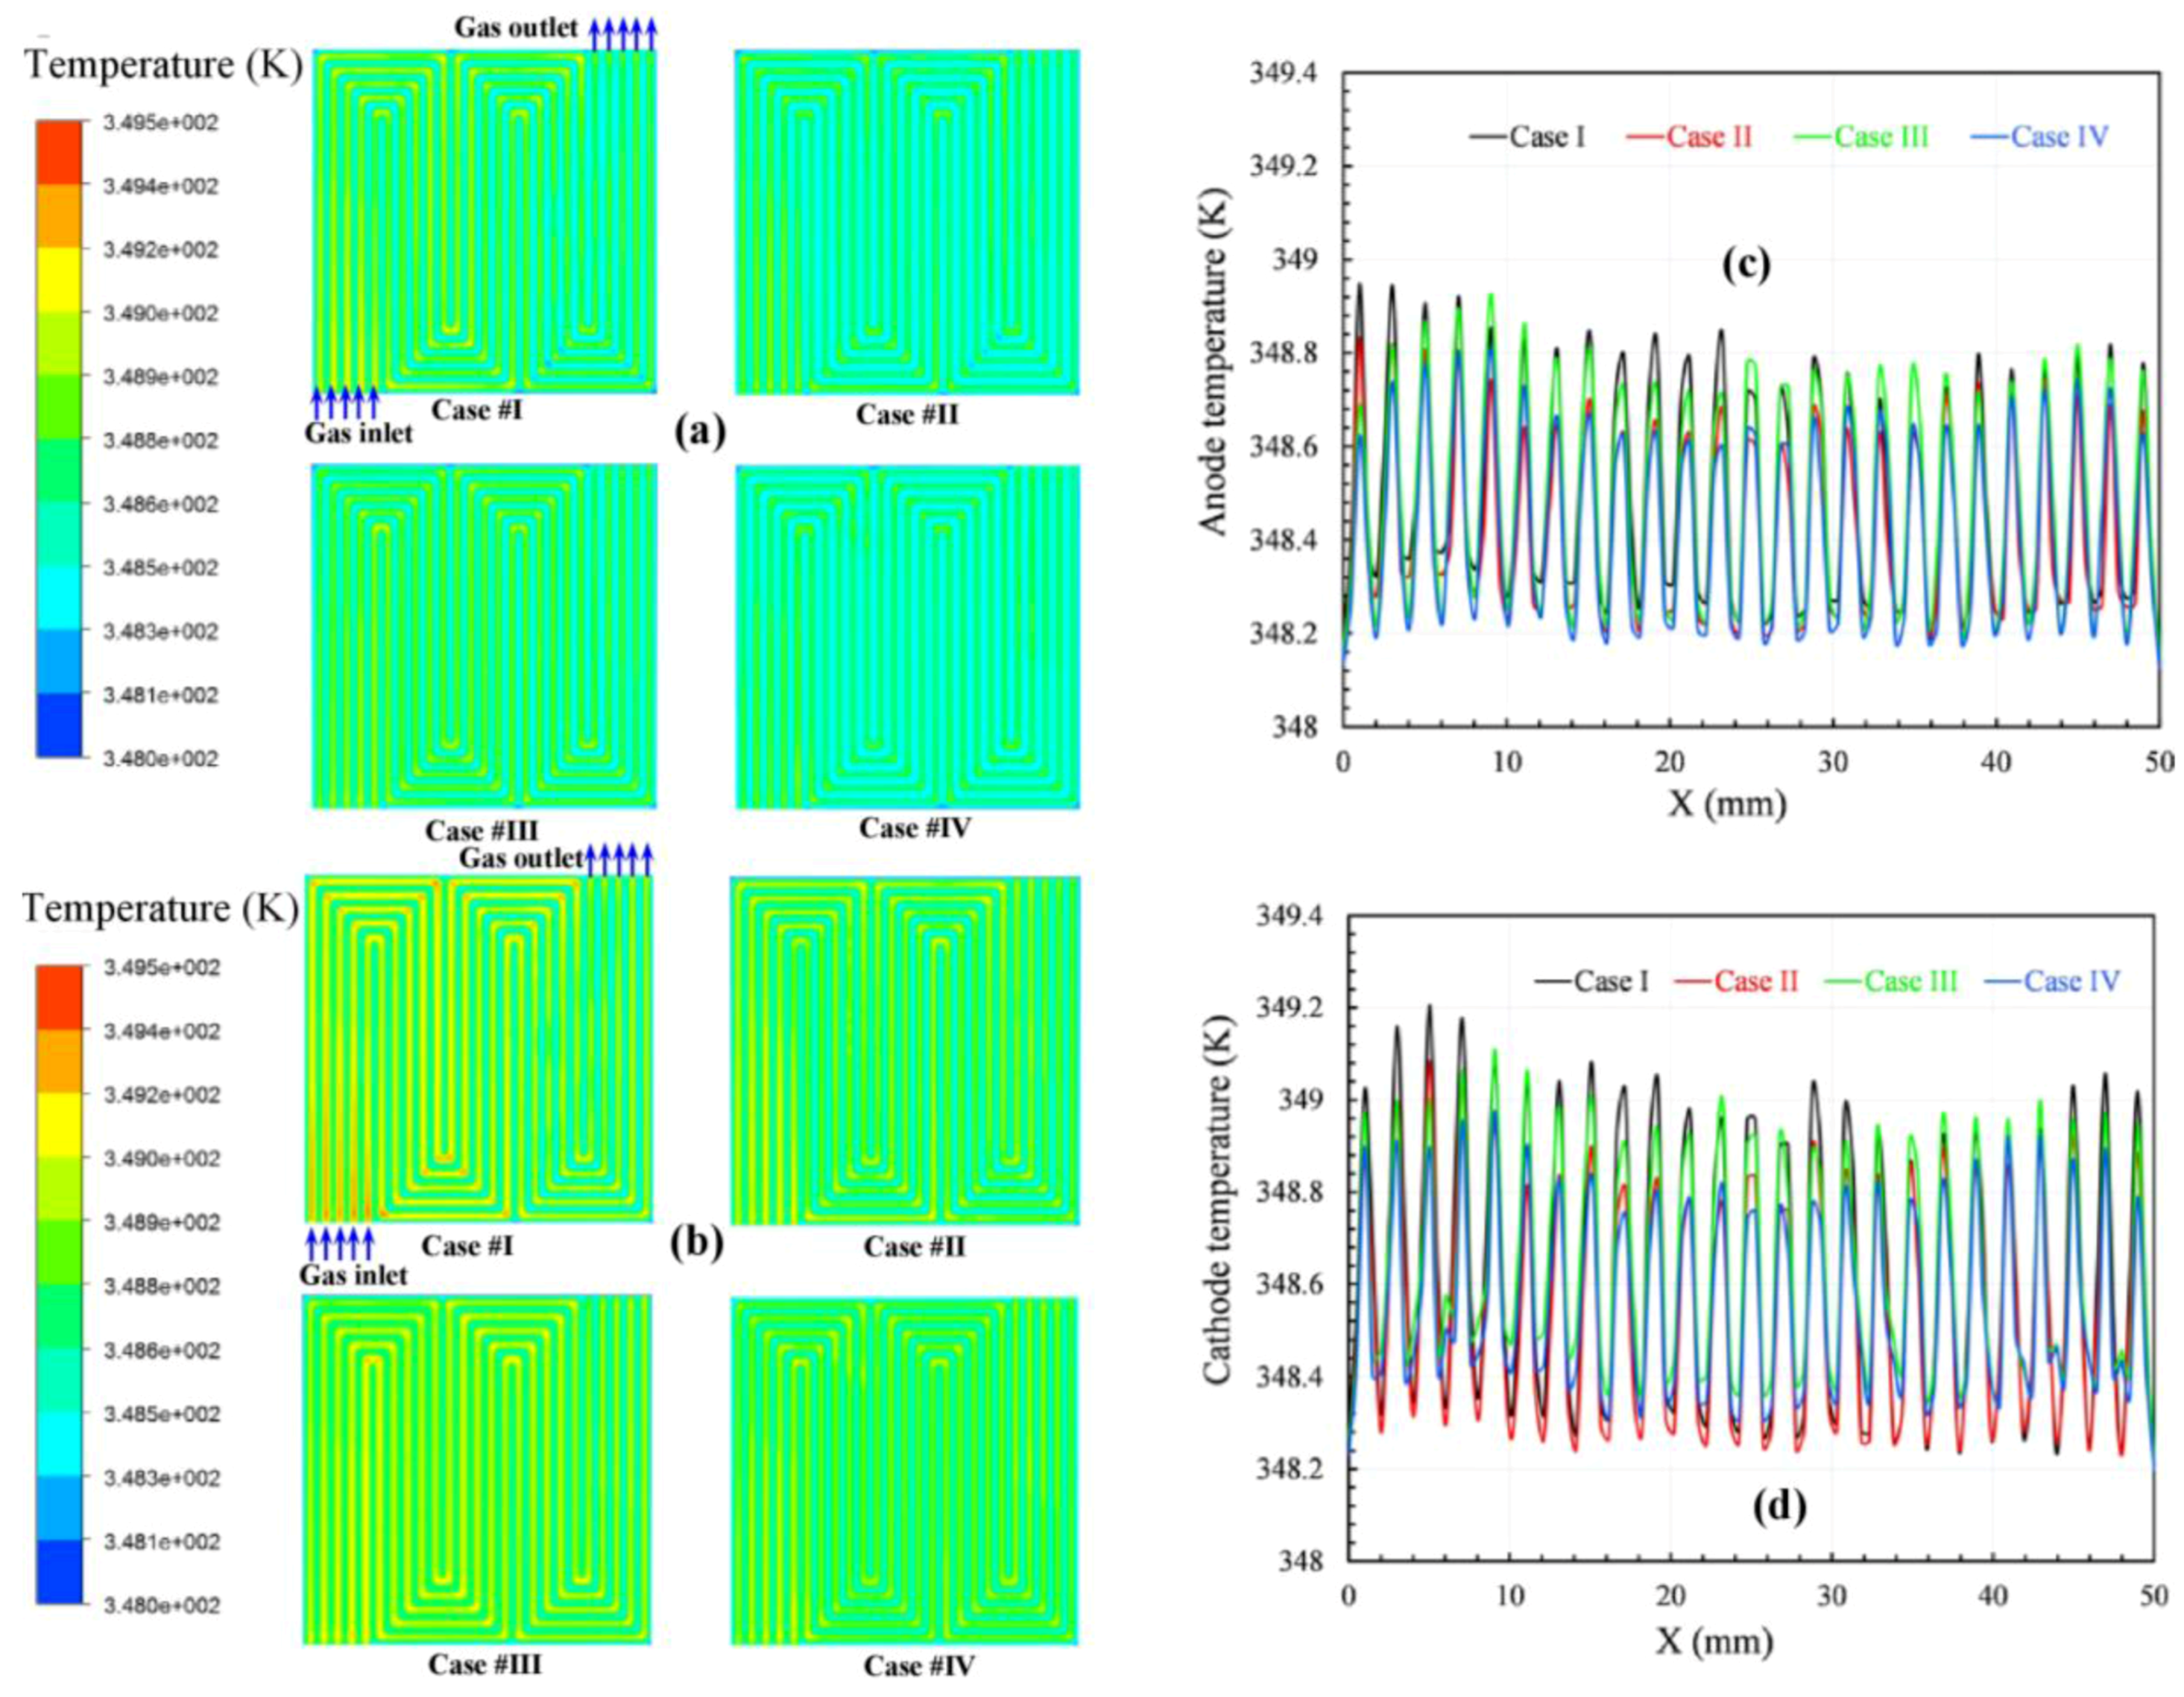
The performance-related parameters of the temperature distributions and the temperatures along a reference location of the four simulation cases are compared at an average current density of 1.2 A/cm
2, as shown in
Figure 3. Generally, the temperature difference between the membrane surface and flow channel is less than 2 K. In addition, the temperature distributions along the flow path are uniform because the insulated boundary is on the top surfaces of both the cathode and anode side.
Figure 3a,b show the temperature profiles at the membrane surfaces on the anode and cathode side along the flow path for configurations (a) and (b) with two different boundary conditions for the inlet gases, namely, a constant mass flow rate and a constant stoichiometry ratio. The local temperature depends on the electrochemical reaction rate, and this rate is usually governed by the reactant concentration, which varies along the channel. Generally, the temperature on the cathode side is higher than that on the anode side. Since the heat produced in the rib area is more easily transferred to the graphite block in comparison with the heat produced in the channels, then the temperature under the rib areas is lower than that under the adjacent channel areas. In addition, the heat released is also carried by the stream gases. Consequently, when comparing the same locations corresponding to a current density of 1.2 A/cm
2, the temperatures of configurations I and III are higher than those of configurations II and IV because the mass flow rates of the gases in the case of constant mass flow rate are higher than in the case of constant stoichiometry ratios, as shown in
Table 4. In addition, the temperature decreases from the inlet toward the outlet because the water formation increases along the axial flow channel due to the cooling of the liquid water at the outlet. The temperature distribution of configuration (b) is also more uniform than that of configuration (a). This finding suggests that applying SFFSB for the cathode bipolar plate better enhances heat transfer in fuel cells.
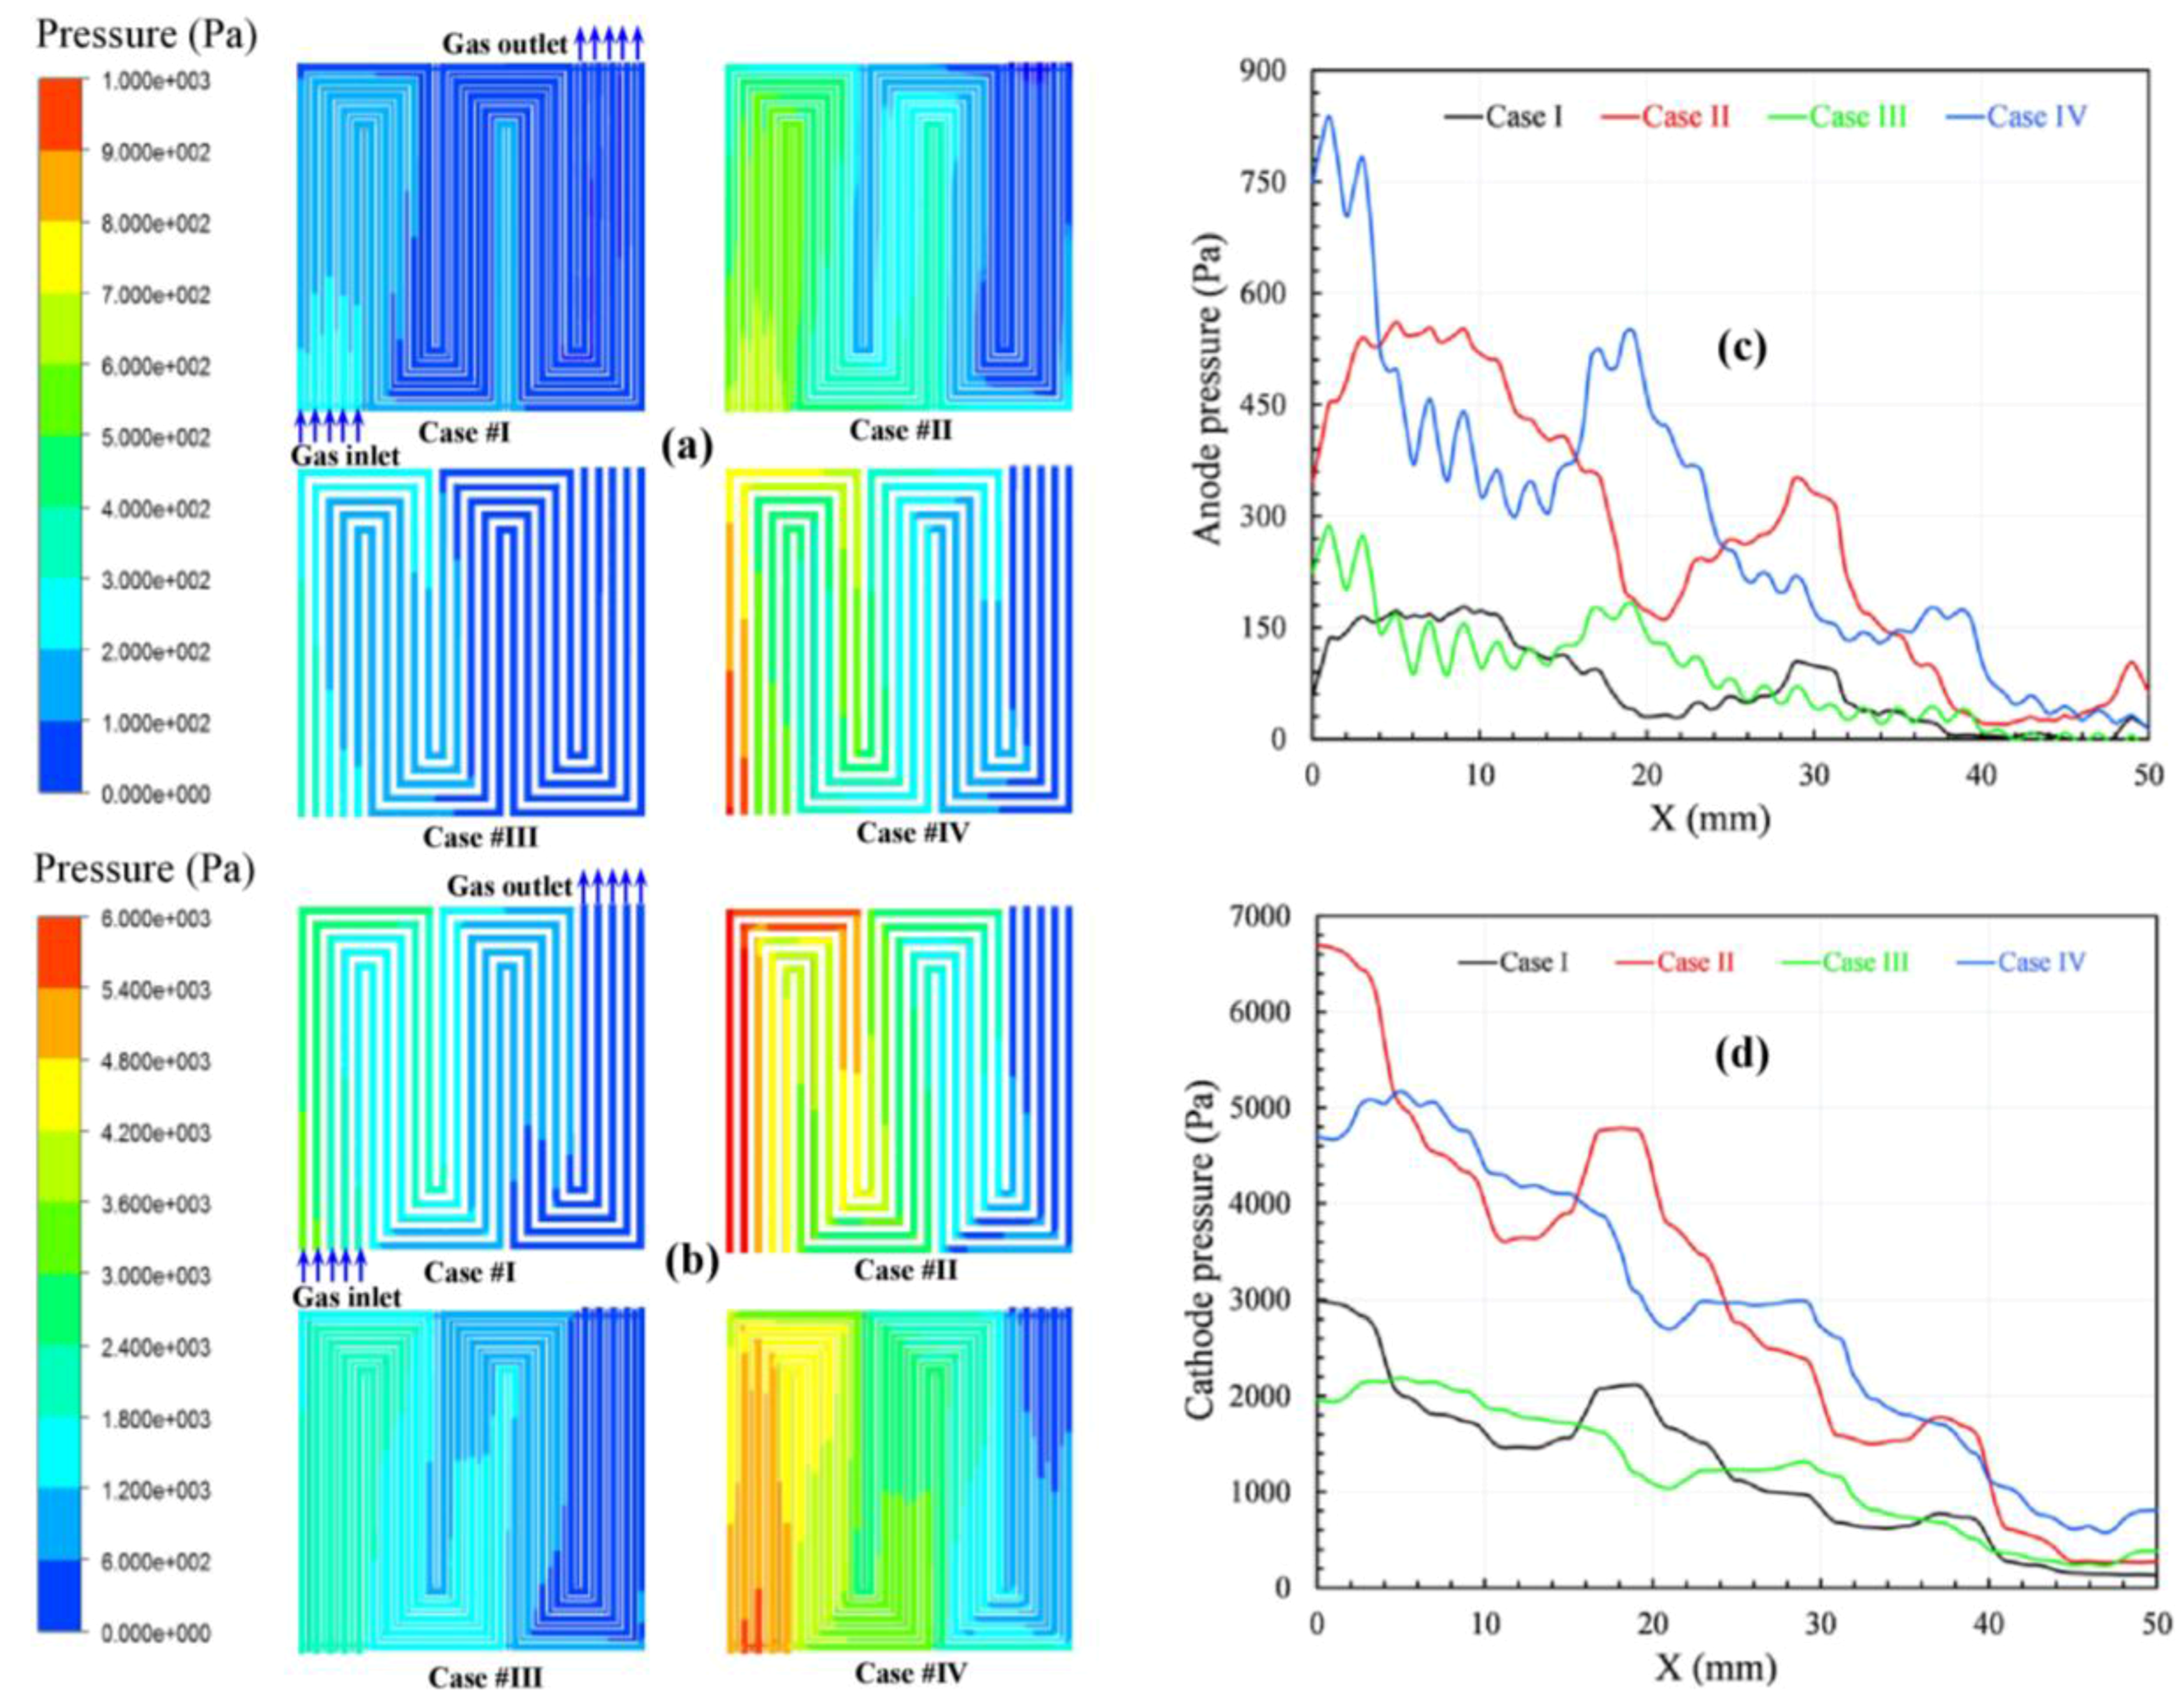
Figure 4 compares the pressure profiles on the anode and cathode channels at an average current density of 1.2 A/cm
2. Generally, the pressure on the cathode side is higher than that on the anode side because of the higher mass flow rate of oxygen compared to hydrogen. Additionally, the total pressure decreases from the inlet toward the outlet in both the anode and cathode gas channels because of the pressure drop caused by the frictional and bending losses in the gas flow channel [
1,
26]. However, the total pressure fluctuates dramatically when considering the local positions due to the mutual effects of the channel areas and rib channel areas. The pressure drop at the corresponding location between the adjacent channels is substantial, and a significant pressure gradient is thus created across the porous electrode. This pressure gradient is much larger than that along the channel direction, which results in considerable cross-leakage flow between the adjacent channels. In fact, this flow generates a strong convection in the electrode; as a result, the reactant distribution and the water discharge are improved. This flow is responsible for the improvement in overall performance.
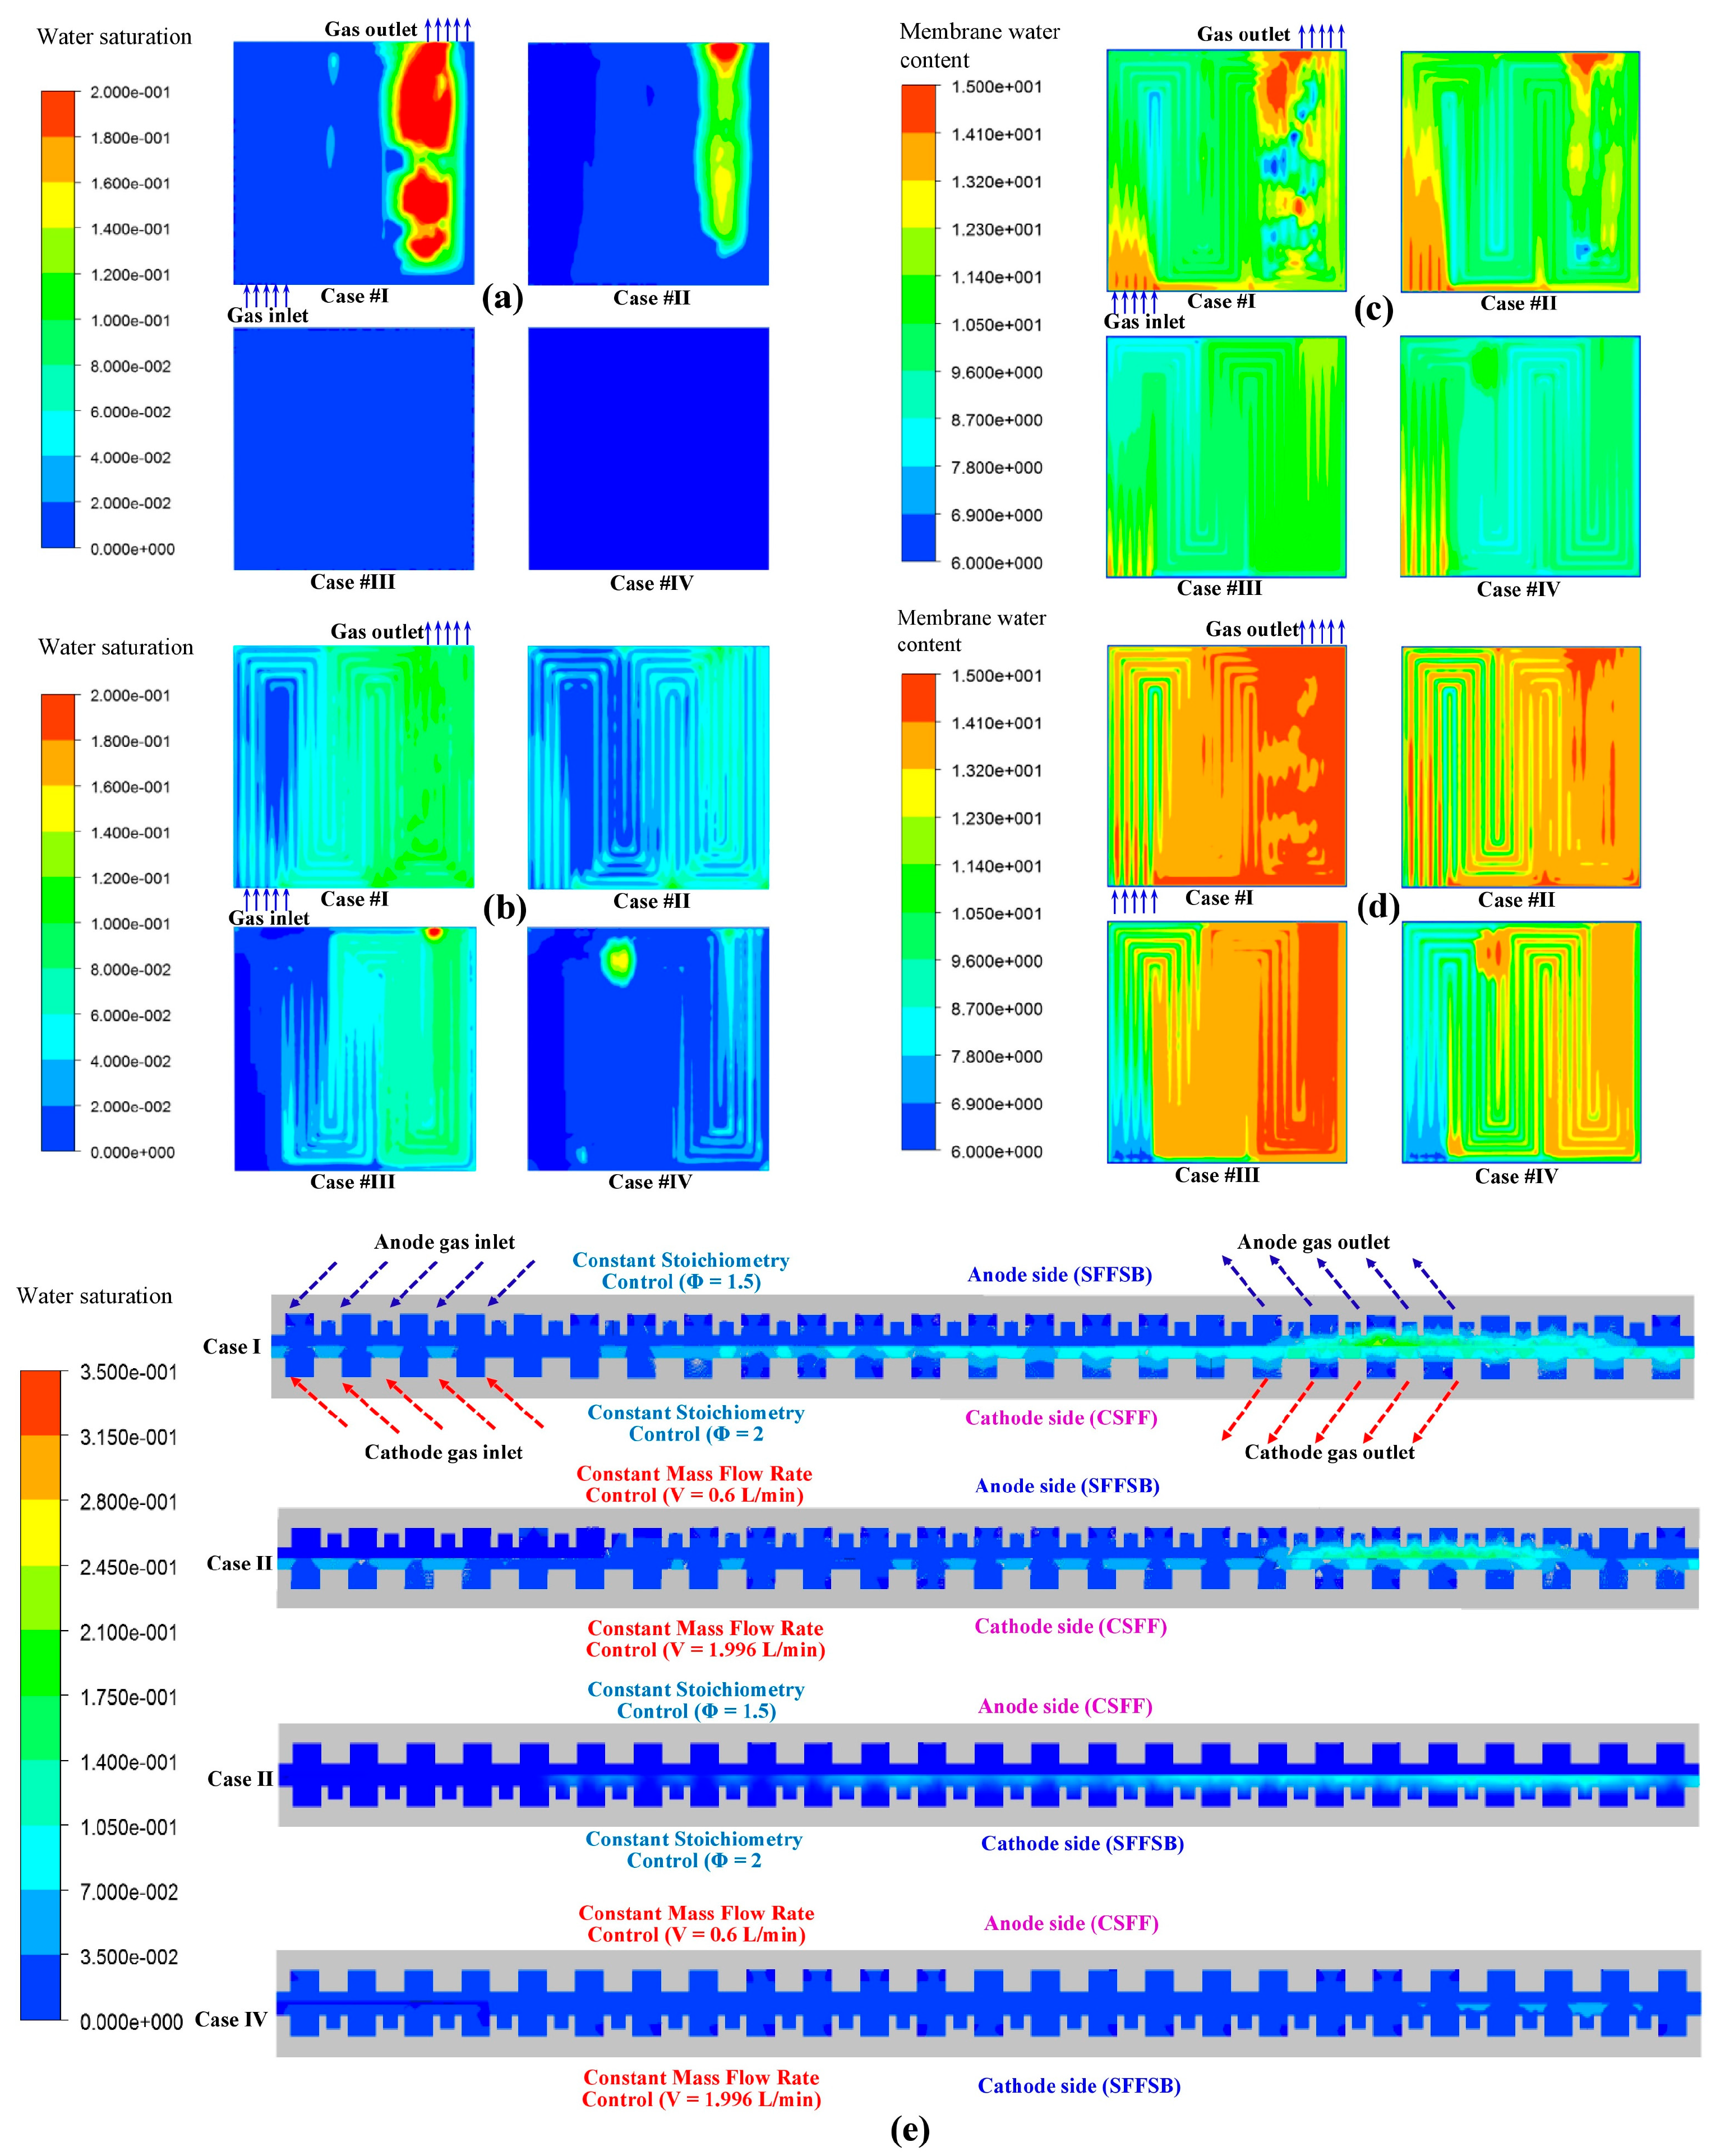
4.2. Effect of Flow-Field Design on Water Formation and Discharge
Because PEMFCs operate normally at temperatures significantly below 100 °C, the water vapor formed from chemical reactions may condense into the liquid phase, especially at high current densities. While the liquid water keeps the membrane hydrated, it also blocks the gas diffusion, reducing the diffusion rate and the effective reaction surface area and hence the PEMFC performance. In this numerical simulation, the formation and transport of liquid water are calculated by solving the conservation equation for the volume fraction of liquid water, which considers the capillary flow, the clogging of the porous media, and surface tension.
Figure 5a,b compares the liquid water distributions on the 25-cm
2 active area of the anode and cathode membrane surfaces among the four configurations (I–IV) at an average current density of 1.2 A/cm
2. The water saturation is negligible at the anode. However, there are some local areas of high water saturation for configurations I and II, when SFFSB and CSFF are used for the anode and cathode BPs, respectively. Meanwhile, the water saturation is dramatically high at the cathode side, especially the outlet area since the configuration of SFFSB plays a better role in discharging water formed in the cathode side than that of CAFF. The trend for the temperature profiles is observed for the water saturation as well; the water saturation of configurations I and III is higher than that of configurations II and IV because the lower mass flow rate of the supplied air leads to lower water discharges. These phenomena can be explained by the feature of PEMFC operation described in [
1], where water is formed as a reaction product on the cathode side. Furthermore, water also reaches the membrane surface of the cathode side due to the osmotic water transport by the hydrated protons transferred from the anode side. This unilateral membrane water transport is compensated partially, but not completely, by the back diffusion of water because of the concentration gradient that develops. Anode dehydration is more serious at the inlet of the cell because of the higher water back-diffusion to the anode at the outlet of the cell, which is not surprising because the water content at the outlet of the cathode is higher due to water draining, and thus the back-diffusion is higher as well [
30,
31]. All these phenomena may lead to the huge difference in water saturation between the anode and cathode sides observed in
Figure 5e. This difference hinders the improvement of fuel cell performance. Excess water at the cathode side leads to water flooding of the pores of the active layers through which oxygen reaches the catalyst. On the other hand, membrane dehydration on the anode side can increase the ohmic resistance and thereby decrease the discharge voltage of the cell [
30,
31].
The water content of the membrane is another important parameter for evaluating the water management of fuel cells. It is also determined by the balance between water formation and three water transport processes, including the water electro-osmotic drag, water back diffusion, and the diffusion of water to/from the oxidant/fuel gas streams, as mentioned in [
32]. As cited in many studies, the membrane water content depends on the water activity, which is affected by the total pressure [
1,
29,
31]. Use of a hydrophilic material is a major contributor to the membrane ionic conductivity (
), which is related to the membrane water content (
) and the water activity (
) such that [
1,
18,
24].
where
is the vapor pressure of water in stream
k,
is the mole fraction of water in stream
k,
is the pressure in Pa and
is the diffusion temperature in K.
Water activity is defined based on the total water or super-saturated water vapor and used in the membrane hydration model to determine water transport through the membrane. Water is transported from the membrane to the channel via a GDL as a gas and a liquid; therefore, under-saturated and saturated conditions should be considered separately. Under the under-saturated conditions, the water vapor transport direction depends on the relative humidity in the channel and that at the membrane/GDL interface. Under the saturated conditions, water generated in the catalyst layer will be transported through the GDL in liquid form. The liquid water in the GDL not only provides higher resistance to gas diffusion but also covers some of the activation sites on the catalyst layer, reducing the cell voltage [
33].
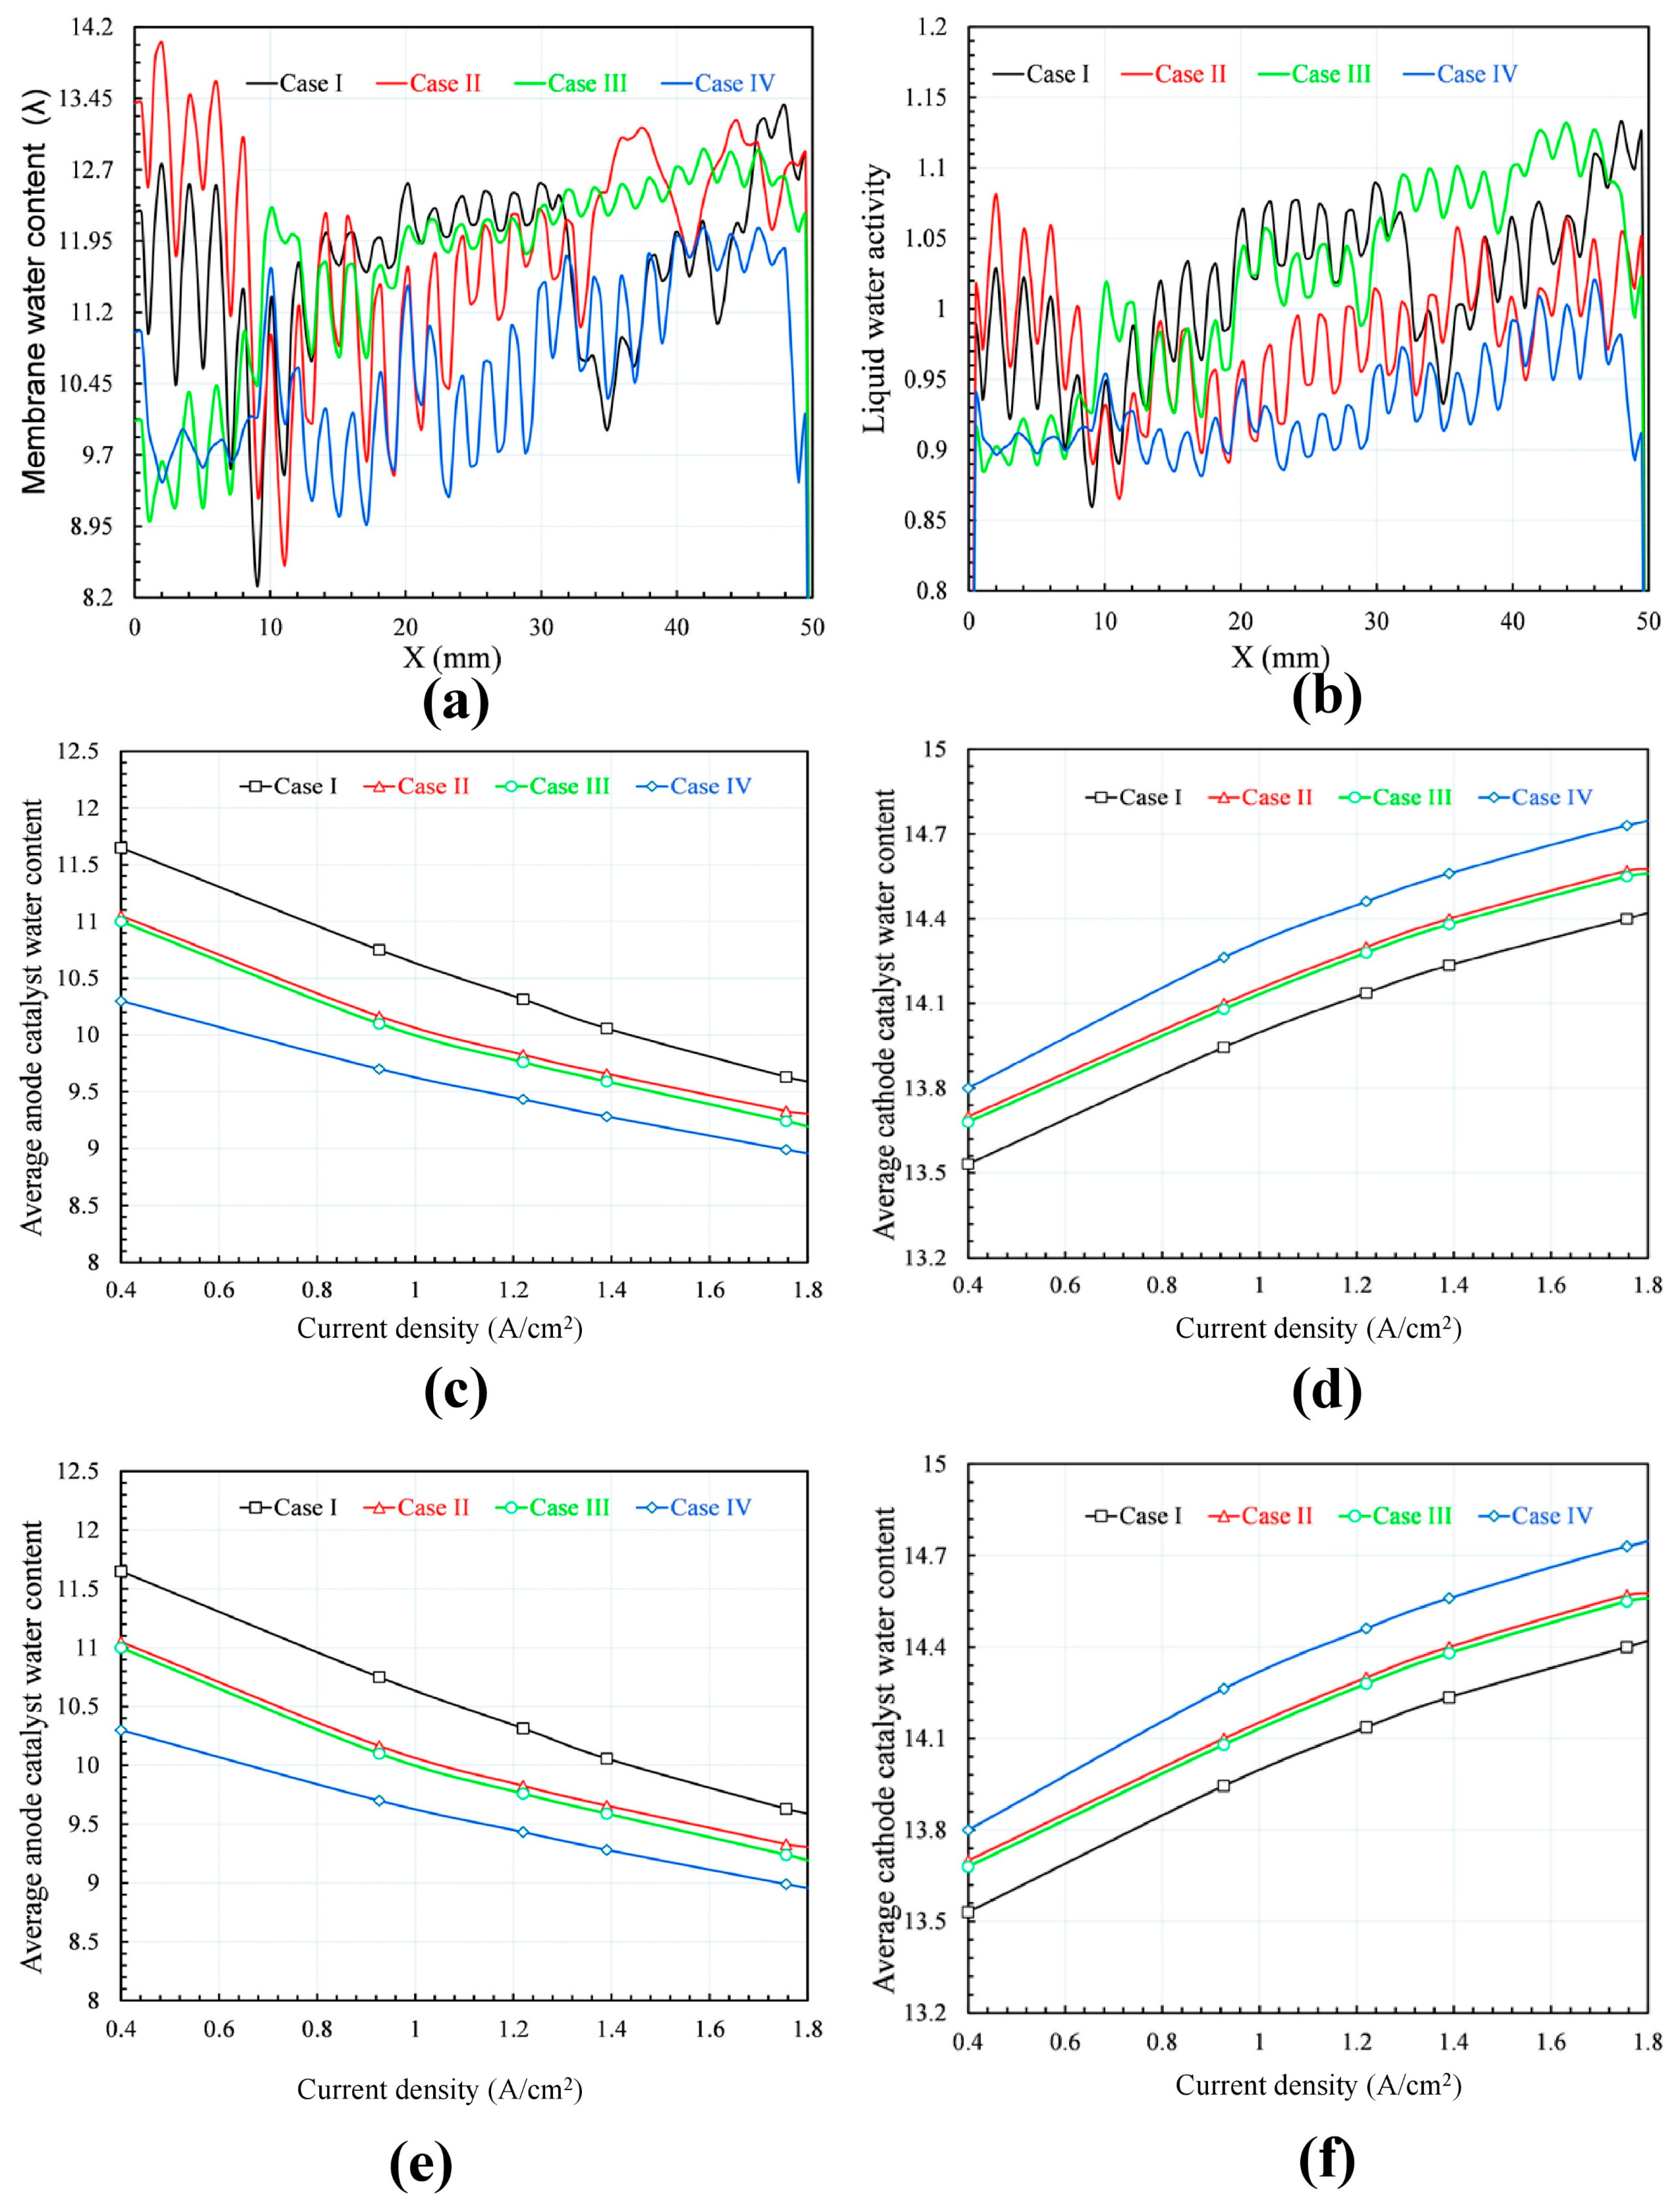
Figure 5b shows that the liquid water activity fluctuates between the peak under the channels and the trough under the ribs, and the variation increases from the inlet toward the outlet. The liquid water activity directly affects the membrane water content as described in Equation (1).
Figure 5c,d shows the water content distributions on the anode and cathode sides of the membrane. Generally, since much of the water formed at the GDL and rib area is absorbed into the membrane by under-rib convection, then the water content under the rib is higher than that under the adjacent channel. Under-rib convection is the same process as cross-leakage flow [
28]. On the membrane’s cathode side, the water content increases from the inlet toward the outlet because the decrease of total pressure affects the water discharge conducted by the air flow. The effect of flow gases on the membrane water content is also obvious, causing the membrane water contents of configurations I and II to be higher than those of configurations III and IV due to the difference in mass flow rate of the supplied gases. The SFFSB prevails against CSFF in contributing to the improvement of water discharge on both the anode and cathode membrane sides; as a result, the water distribution of the membrane water contents of configurations III and IV are more uniform than those of configurations I and II. The average water contents of the membrane, anode, and cathode catalysts are compared for the four configurations (I–IV) at various current densities in
Figure 6c–e. The water content increases from the anode to the cathode and peaks at the cathode catalyst because the contents of the membranes and the anode catalysts are inversely proportional to the current density [
1,
29]. However, the trend is opposite in the cathode catalysts, where the water content increases with increasing current density. These phenomena can be explained as follows. An increasing current density results in an increase in the amount of water in the cathode catalyst because the back diffusion is not sufficiently high to compensate for the electro-osmotic drag in drying at the anode, and the anode drying is faster than the velocity of moving water [
13]. For a fully humidified condition, a membrane water content value of λ = 14 is appropriate, as defined in Equation (1); therefore, it is assumed that flooding occurs at values of λ over 14 [
1,
27]. All the simulation results show that the average water content of the membrane is less than 14; thus, water flooding is predicted to be insignificant at the membranes. However, it may still occur in some local areas of the membrane and cathode catalyst areas where the water contents are very high despite the average water content of the whole being significantly less than the value of λ = 14, especially under high current density and low mass flow rate of the supplied gases. Indeed, as shown in
Figure 6d, there are significant areas of the membrane cathode side of configurations I and III with water contents greater than 14. Additionally, there are some small areas of configuration II situated at the outlet zone where the membrane water content is higher than 14; meanwhile, membrane configuration I is dry enough to prevent flooding in all parts of the membrane due to the effective contribution of the SFFSB configuration.
The ionic conductivity membrane modeled by Equation (3) plays an important role in PEMFC operation, as it functions as a fuel and oxygen barrier and as a proton transport path from the anode to cathode to complete the reaction. The ionic conductivity of the membrane depends on the water content and is highest when the membrane is fully saturated [
1]. As mentioned above, water is produced from the cell reactions as liquid and should be removed from the fuel cell. Too much water in the cell will cause the flooding of the electrodes and reduce gas diffusion. However, too little water in the cell will result in the dehydration of the membrane and a reduction in ionic conductivity. As shown in
Figure 6e,f, the water content of the anode catalysts and the membranes of configurations I and II are somewhat higher than those of configurations III and IV, respectively; as a result, the average membrane conductivities of the four simulation cases also vary according to the same trends.
4.3. Effect of Flow-Field Design on Fuel Cell Performance
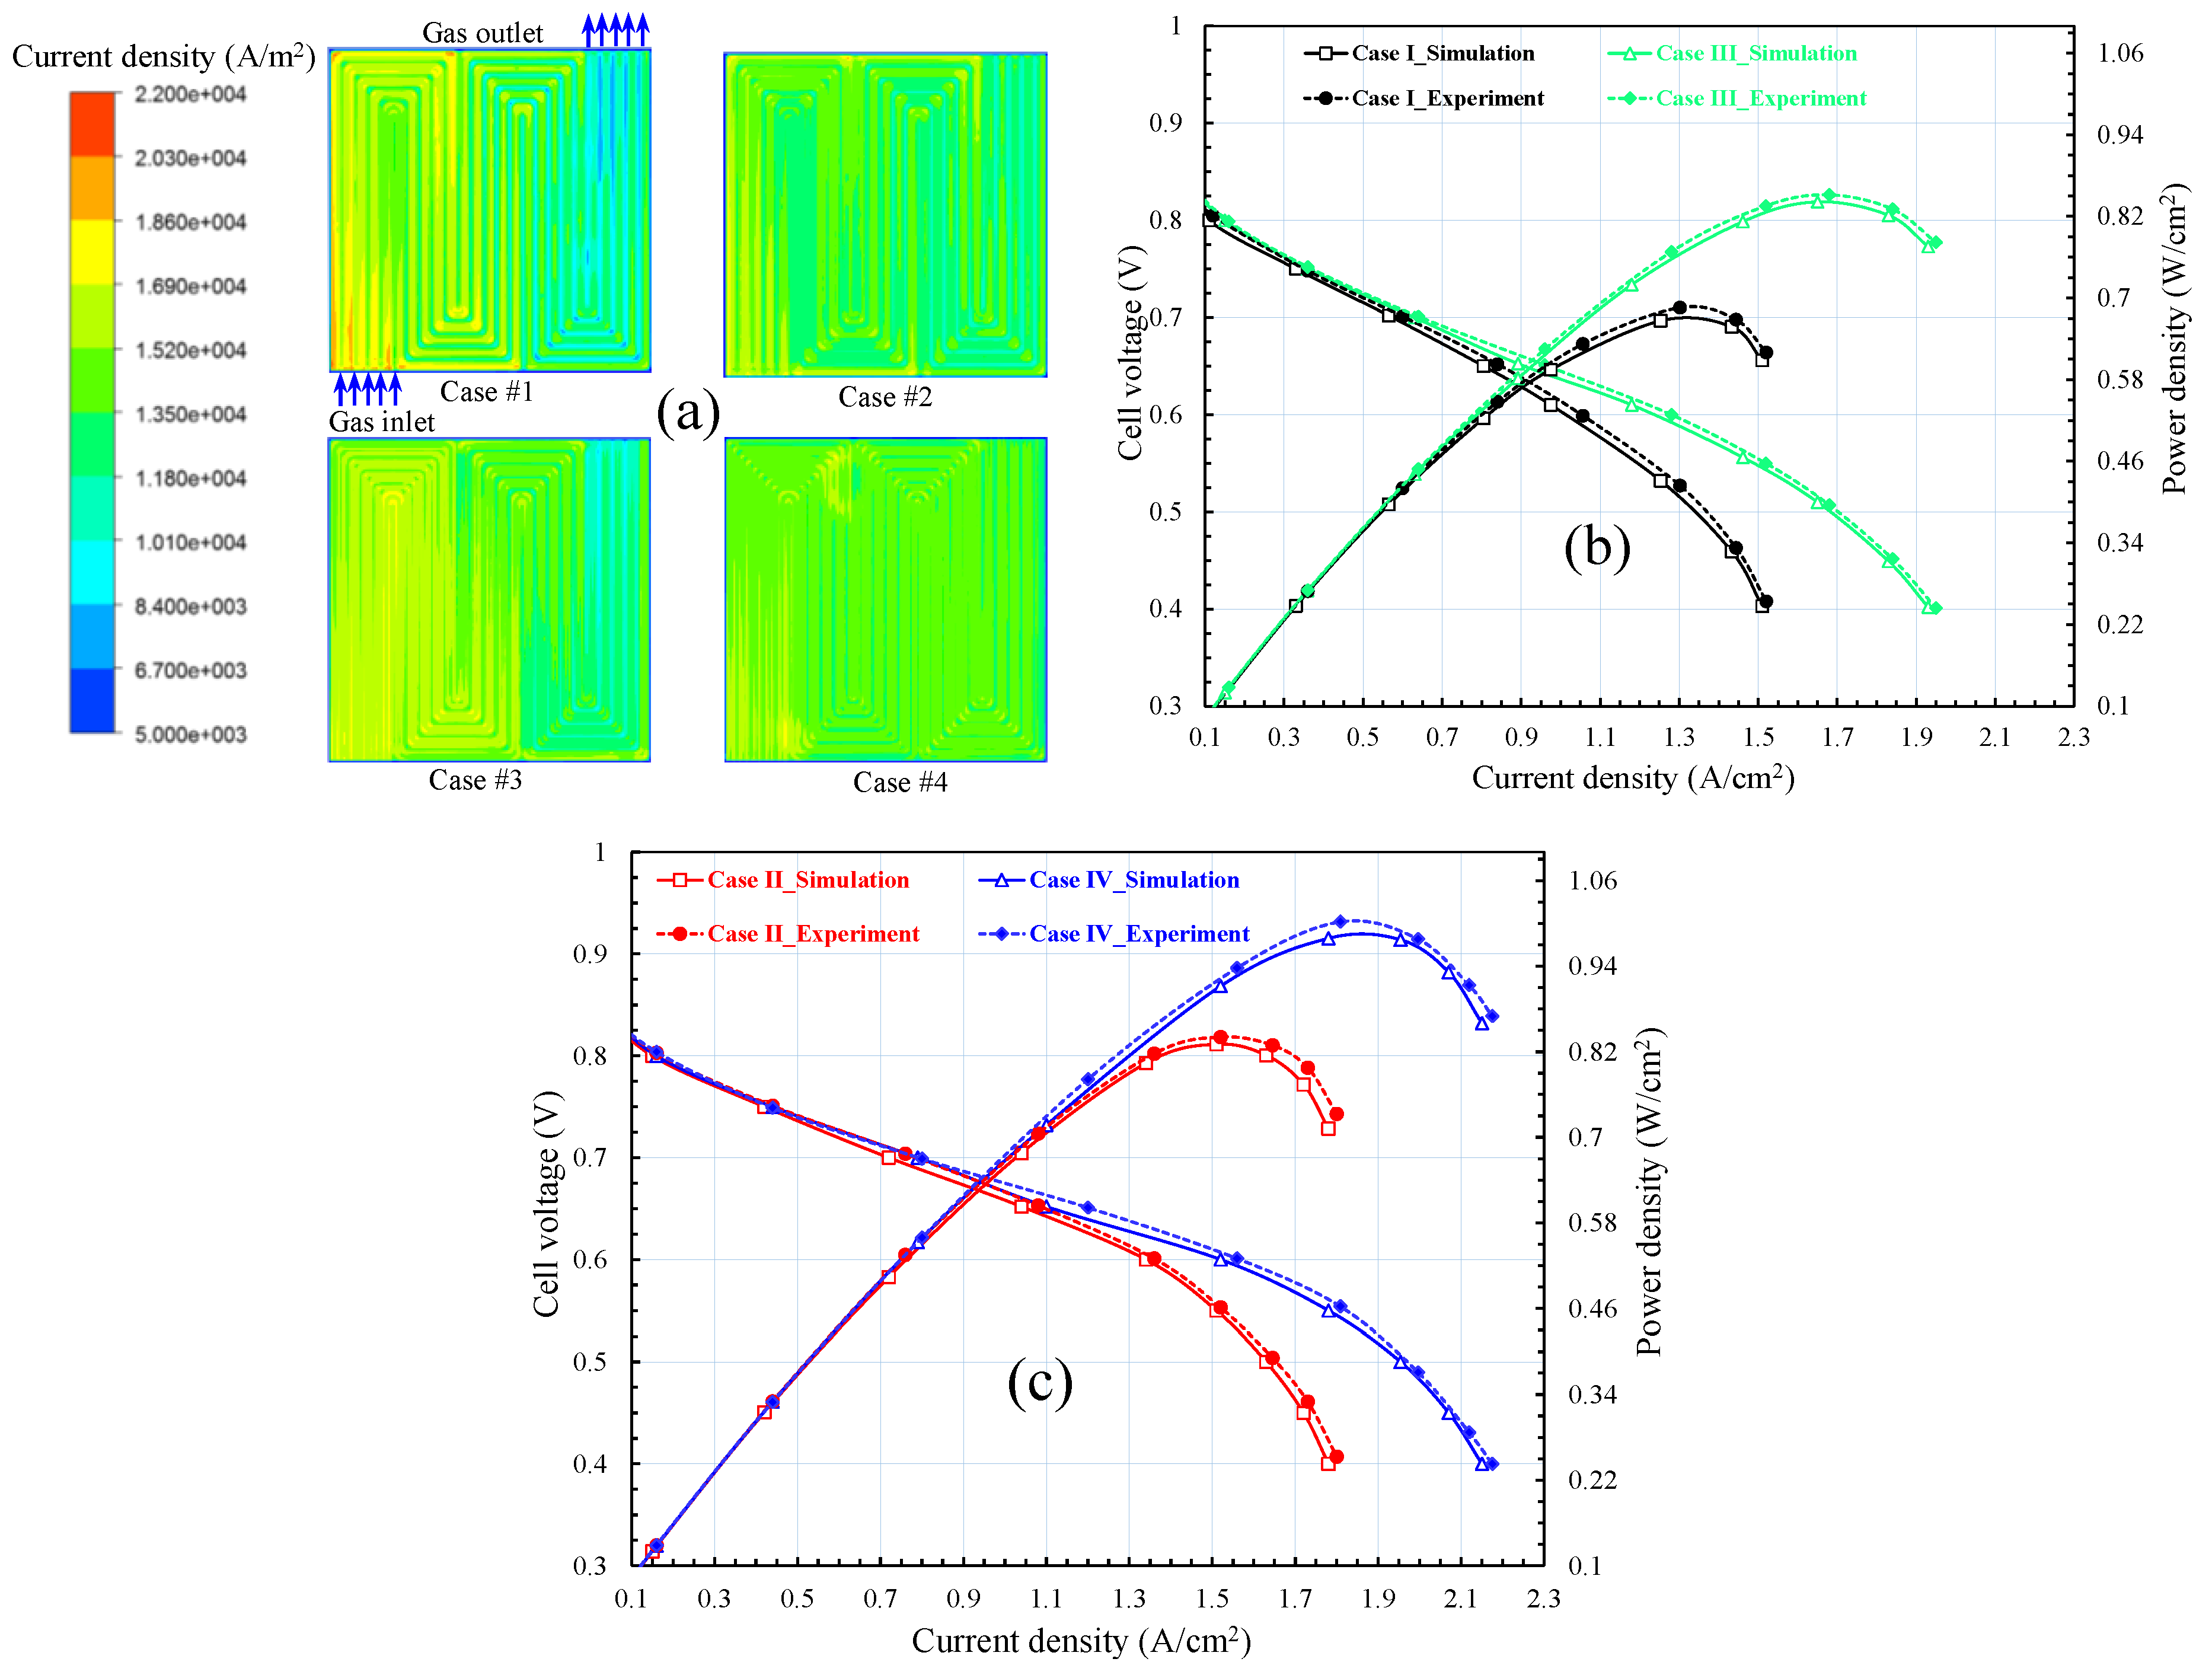
Figure 7a presents the current density distributions on the MEA surface of the four simulated configurations I to IV at an average current density of 1.2 A/cm
2. Generally, the local current density degrades from the inlet toward the outlet because of the reduction of reacting gases. However, the current density distributions are changed because the different flow-field configurations have uneven electrochemical reactions. The average current densities of four simulation cases at 1.2 A/cm
2 are respectively 0.5199 V, 0.5210 V, 0.5588 V, and 0.5599 V. When the current density is constant, the differences of the cell voltages between these cases may be attributed to the differences of pressure drop, water concentration, and membrane conductivity among those which relate directly to water content and liquid water saturation of catalyst and membrane [
1]. Compared to the other cases, the membrane current density distribution of configuration IV is the most uniform. Meanwhile, the distribution is very non-uniform in configuration I especially not only between the inlet and outlet area but also the rib and channel area. In configuration III, the distribution of the inlet area is also slightly higher than the outlet area; however, the differences between the local rib and neighboring flow-channels areas are not significant. A highly uniform current distribution can also be observed in configuration II when the differences in current density contribution throughout all areas are small. These results prove that the SFFSB configuration of the cathode BP contributes positively to the uniform current density distribution; meanwhile, its role when applying to the anode BP is ambiguous. SFFSB prevails against CSFF in contributing to the improvement of water discharge in the cathode side where water is formed through the recombination and subsequent reaction between hydrogen ions, electrons and oxygen; as a result, reaction gases may penetrate throughout all the catalytic surface areas without the obstruction from water flooding to react and create electricity. In addition, the high gas flow rate also plays an important role in the water discharge and transfer of the reacting gases to the catalyst surface; thus, the current density distributions of configurations II and IV are more uniform than those of configurations I and III.
Figure 7b,c shows the polarization and power density curves of different configurations I–IV obtained by numerical simulation and experimental test according to the different boundary conditions of the flow gases. Generally, the result reveals that the power densities of configurations III and IV are higher in comparison with the flow-field configurations I and II. Maximum power densities of the four simulation configurations I–IV are 0.6665 W/cm
2, 0.8305 W/cm
2, 0.8415 W/cm
2, and 0.9790 W/cm
2, respectively. Meanwhile, these values are slightly higher in the experiment with the same boundary condition tests. In addition, there is always a good agreement between the experimental and simulation results for the cell voltage and power density curves at every test point when the maximum difference is only approximately 5%. As mentioned in [
1], small variations between the experimental and simulated data can be a result of the assumptions of the simulation process; however, these assumptions cannot be controlled in the experiments. Furthermore, many important imported parameters used in the simulations are very difficult to verify in the experiment. Nonetheless, the simulations are still helpful for predicting the trends of the polarization, power density curves, and physical transport phenomena occurring within the fuel cell.
As shown in
Figure 7, corresponding to the boundary conditions of constant stoichiometry control and constant mass flow rate control, the fuel cell performance is different. In case of constant stoichiometry control applied to configurations I and III, the constant stoichiometry ratios of supply gases were controlled by the values of 1.5 and 2 corresponding to the anode and cathode inlet boundary conditions, respectively. In general, the power densities of configuration III are dramatically higher than configuration I when comparing at the same current density. These results can be explained by the effects of CSFF and SFFSB on gas-flow contribution, water discharge, and other physical transport phenomena occurring within the fuel cell. The adoption of SFFSB at the cathode bipolar plate increases the output power density because when inserting sub-channels between the main channels, a shorter distance between channels results in a lower resistance to flow through the porous media and therefore increases the flow rate between adjacent channels. In addition, reducing the space between channels, even locally, improves the flow rate between channels. Consequently, the under-rib convection flows from the main channel toward the adjacent rib because of the pressure difference, which causes changes in that the internal pressure is reduced by the diffusion of reacting gases, water behavior, uniform temperature, and current density distribution [
1,
26]. Compared to CSFF, SFFSB makes a feature of low pressure at the entrance; therefore, it shows a better characteristic than that of CSFF due to the reacting gases transfer being closer to the exit, which generates a more effective utilization of the electrocatalysts by improving the mass transfer rates of the reactants from the flow channel to the inner catalyst layer. However, as mentioned above, the role of SFFSB prevails in the cathode side when it minimizes the pressure drop and facilitates the discharge of liquid water to reduce the water flooding. Meanwhile, its role in the anode side was not obvious because the water is only generated at the cathode–electrolyte interface by the electrochemical reaction, the water concentration therefore tends to be higher at the cathode side and water transport from the cathode side to the anode side is by back diffusion. This is in the opposite direction to the water transport caused by the electro-osmotic drag of protons from the anode side to the cathode side. However, electro-osmotic drag in a PEM fuel cell often dominates over the back diffusion and causes drying of the membrane at the anode side and results in the higher accumulation of water or the so-called flooding of the membrane at the cathode side. For these reasons, when applying the SFFSB for the cathode BP it will increase the water discharge; however, anode drying may occur when the SFFSB is applied to the anode BP. Nevertheless, in the case of using the CSFF for the cathode BP, cathode flooding can be serious due to its lack of contribution to water discharge. While drying of the membrane significantly reduces the proton transport in the membrane, flooding of the membrane at the cathode side prevents oxygen reactant gas from reaching the cathode–electrolyte interface for the electrochemical reaction, which dramatically reduces the fuel cell performance. To overcome the cathode flooding, some studies suggested that the PEM fuel cell should be maintained at a higher pressure at the cathode side. This means that high mass flow rates of inlet gases should be supplied. Indeed, both the simulation and experimental results of this research show that the power densities of configurations II and IV are higher than those of configurations I and III, respectively, due to the higher mass flow rates of inlet gases of configurations II and IV as described above.


