Article

Polylactic Acid Improves the Rheological Properties, and Promotes the Degradation of Sodium Carboxymethyl Cellulose-Modified Alkali-Activated Cement

School of Engineering and Technology, China University of Geosciences (Beijing), Beijing 100083, China
*
Author to whom correspondence should be addressed.
Energies 2016, 9(10), 823; https://doi.org/10.3390/en9100823
Submission received: 29 May 2016 / Revised: 28 September 2016 / Accepted: 7 October 2016 / Published: 14 October 2016

Abstract

:
In consideration of the insolubility in water, sensitivity to heat and wide application in the oil and gas industry as a degradable additive, this paper introduces polylactic acid (PLA) to a self-degradable temporary sealing material (SDTSM) to investigate its effect on the SDTSM performance and evaluate its potential to improve the rheological properties and further promote the self-degradation of the material. The thermal degradation of PLA, the rheological properties, compressive strength, hydrated products and water absorption of SDTSMs with different PLA dosages were tested. The analysis showed that the addition of 2% PLA increased the fluidity by 13.18% and reduced the plastic viscosity by 38.04%, when compared to those of the SDTSM without PLA. PLA increased the water absorption of 200 °C-heated SDTSM and had small effect on the types but decreased the hydrate products of 85 °C-cured SDTSM, and created plenty of pores in 200 °C-heated SDTSM. PLA enhanced the self-degradation level of SDTSM by generating a large amount of pores in cement. These pores worked in two ways: one was such a large amount of pores led to a looser microstructure; the other was these pores made the water impregnate the cement more easily, and then made the dissolution of substances in the 200 °C-heated SDTSM progress faster to generate heat and to destruct the microstructure.

Graphical Abstract

1. Introduction

The development of geothermal reservoirs usually encounters highly permeable formations that are either naturally fractured or created through stimulation operations [1,2,3]. To control the loss of drilling fluids, these fractures must be plugged during drilling and reopened for production when the drilling is completed. A temporary sealing material is required not only to plug the fractures at 85 °C, but also to self-degrade both in hot water at 200 °C and when coming in contact with water during stimulation operations after the dry heat of 200 °C, depending on the conditions of geothermal wells [4]. Sugama [4,5] and Li [6] added sodium carboxymethyl cellulose (CMC) into sodium silicate-activated slag/Class C fly ash cementitious materials, to develop a self-degradable temporary sealing material (SDTSM), which could meet these requirements.
The alkali-activated fly ash/slag cements, prepared from industrial by-products of the fly ash and slag with pozzolanic properties has an ability to withstand the hot acidic environment caused by the combination of concentrated dihydrogen sulfide (H2S) and carbon dioxide (CO2) [4]. The cements are characterized by their high mechanical performance, low energy cost and low pollutant gas emission, less environmental deterioration, and their thermal resistance together with significantly reduced energy costs [7,8].
CMC, which is commonly used as an additive in water-based drilling fluids to control fluid loss, can significantly increase the viscosities of fluids [9,10]. However, the high viscosity of cement reduces its pumpability and should be kept low enough during the entire cementing operation [11]. PLA is sensitive to heat and will obviously degrade when the temperature is above 200 °C [12]. Additionally, in consideration of PLA’s insolubility in water and application as a degradable polymer, this paper introduced PLA to SDTSM aiming to improve the rheological properties and further promote the self-degradation of the material.
PLA has been widely used in medical field, daily life and oil & gas industry as a degradable additive. In medical operations, PLA is applied as an additive in bone cement, which will degrade to cause high porosity of cements when it contacts with body fluids, thereby providing inter-connective channels for the bone [13,14,15]. As a green environmental material, PLA was also used to manufacture daily products, fresh-food packages, shopping bags and bed sheets, etc., replacing the petroleum-based products [16,17]. In oil and gas industry, PLA is combined with other materials to form degradable particulates in temporary sealant slurry for plugging the preexisting fractures, and then degraded to remove the sealer after the re-fracturing operations [18]. PLA is used to coat proppant sand or gravel pack sand, which will degrade to leave conducting channels at the end of a fracturing or gravel packing operations [19]. It is also employed to form degradable diverter plugs for reducing the time for operation, equipment standby and fluid flow back and reducing the risk of premature setting of the fracturing plugs, by avoiding the need to drill out the plugs before production [20].
Thermogravimetric analysis (TGA) and Pyrolysis-gas chromatography/mass spectroscopy (Py-GC/MS) were employed to test the thermal decomposition properties of PLA. X-ray diffraction analysis (XRD) was used to study the hydrated cement products. The rheological properties, compressive strength, hydrated products and water absorption of SDTSMs with different PLA dosages were tested to investigate the influences of PLA on the properties of SDTSM. After immersing 200 °C-heated samples in water for different times, the degradation of the samples was observed by a polarizing microscope and scanning electron microscopy (SEM). The compressive strengths were further determined to assess the level of degradation.

2. Experimental Procedures

2.1. Materials

The slag was obtained from Longang Trading Co. Ltd. (Tangshan, China). The Class C fly ash was supplied by Luyuan Power Resource Development Groups Co. Ltd. (Dongying, China). Sodium silicate was supplied by Qingdao Yousuo Chemical Technologies, Inc. (Qingdao, China). CMC was supplied by Yanxing Chemical Industry, Inc. (Renqiu, China). PLA was obtained from Changsheng New Materials Technologies, Inc. (Guangzhou, China) and typical values of its physical properties are listed in Table 1.
The SDTSM formula, referencing the study of Sugama [4,5] and Li [6], had slag/Class C fly ash ratio of 80/20 by weight, 6% sodium silicate and 1% CMC by total weight of the dry pozzolana cement. Water was added at a water/dry pozzolana cement ratio of 0.6 to prepare cement. The SDTSM without CMC, i.e., the sodium silicate-activated slag/Class C fly ash cementitious material, was considered the control sample. To study the rheological behavior of SDTSM with different PLA dosages, 1%, 2%, 3%, 4%, 5%, 6%, 7%, 8%, 9% and 10% PLA by the total weight of pozzolana cement were added into SDTSM. 2%, 4%, 6%, 8% and 10% PLA were added to examine the effects of PLA on the compressive strength, hydrate products, water absorption and self-degradation of SDTSM. The polymers and the dry pozzolana cements were blended thoroughly and uniformly prior to adding into water. These slurries were placed in air at room temperature for 72 h, afterwards, all set cements were cured at 85 °C for 24 h (85 °C-cured), and some of these specimens were further heated for 24 h in an oven at 200 °C (200 °C-heated).
To evaluate the thermal decomposition of PLA in cement, PLA powder (4 g) was immersed into filtrate (50 mL) obtained by a API filter tester from the SDTSM slurry without PLA. The pH of the filtrate was 13.16. The filtrate with PLA was cured at room temperature for 72 h and at 85 °C for 24 h, and then filtered, washed, and dried for further testing.

2.2. Measurements

A Thermo Gravimetric Analyser (TGA) (TA instruments, New Castle, DE, USA) was used to test the decomposition of the non- and filtrate-treated PLAs. Tests were carried out in nitrogen atmosphere and air atmosphere with a heating rate of 10 °C/min.
Py-GC/MS carried out on a pyrolyzer (Frontier Lab, Fukushima, Japan) and a gas chromatograph-mass spectrometer (Agilent, Santa Clara, CA, USA) was used to identify and quantify the volatile derivatives emitted by the decomposition of PLA. The chromatographic peaks were identified by referencing them to the NIST MS library and data in the literatures, by comparing their chromatographic retention times to those of the available reference chemical compounds.
Fluidity was measured according to Chinese national standard GB/T 8077-2012 [21]. A cone frustum (60 mm high with diameters of 36 mm in the top and 60 mm in the base), a glass plate, a stopwatch and a steel ruler were used to test the fluidity. The moist cone without water stains was placed on the clean glass plate. Then the cone was fully filled with cement slurry, lifted up vertically. Two maximal diameters in vertical direction of the slurry were measured after 30 s. The shear stress ( τ ) of the samples at different shear rates ( γ ) (5.11, 10.21, 170 and 340 s−1) were tested by a six-speed rotating viscometer (Haitongda, Qingdao, China) according to API Recommended Practice 10B-2 [22]. The accuracy of dial reading is 1.0°.
Compressive strength was tested according to Chinese National Standard GB 10238-2005 [23] and Chinese Petroleum and Natural Gas Industry Standard SY/T 6544-2010 [24] by using a YAW-300B servo universal testing machine (Chandler, Chengdu, China) with a loading rate of 17.1 kN/min. The cube samples with the size of 50.8 × 50.8 × 50.8 mm (2 in × 2 in × 2 in) were cast. Three cubic specimens of each composition were prepared to measure the compressive strength.
Powder X-ray diffraction (XRD) carried out on a diffractometer (Rigaku, Tokyo, Japan) was employed to identify the crystalline phases of the 85 °C-cured sample. The samples were crushed, ground and passed through a 325 mesh screen. The scanning regions were between 2 θ values of 3° and 70°, at a resolution of 0.02°/step.
For the water absorption test, the specimens were weighed ( W 0 ) after 200 °C-heating, then the specimens were immersed in water at room temperature for 30 min. After the immersion period, the specimens were taken out and wiped quickly with wet cloth, and then the mass was weighed ( W 1 ) [25]. The water absorption ( W A ) was calculated according to the formula:
W A = W 1 W 0 W 0
To observe the self-degradation, the 200 °C-heated specimens were placed into water at room temperature for 2 h (immersed in water for 2 h) and 24 h (immersed in water for 24 h). The compressive strength of samples immersed in water for different times was measured to assess the level of self-degradation.
The pieces of SDTSM with 2% PLA (after 85 °C-curing, 200 °C-heating, immersing in water for 2 h and for 24 h) were stored in absolute alcohol to extract free water, and then dried at 60 °C for 6 h. Then the pieces were examined by a scanning electron microscope (SEM, with an acceleration voltage of 15 kV; FEI, Hillsboro, OR, USA). In particular, the pieces of the samples after immersed in water for 2 h and 24 h were selected from the fractured surfaces of the degraded cement.

3. Results and Discussion

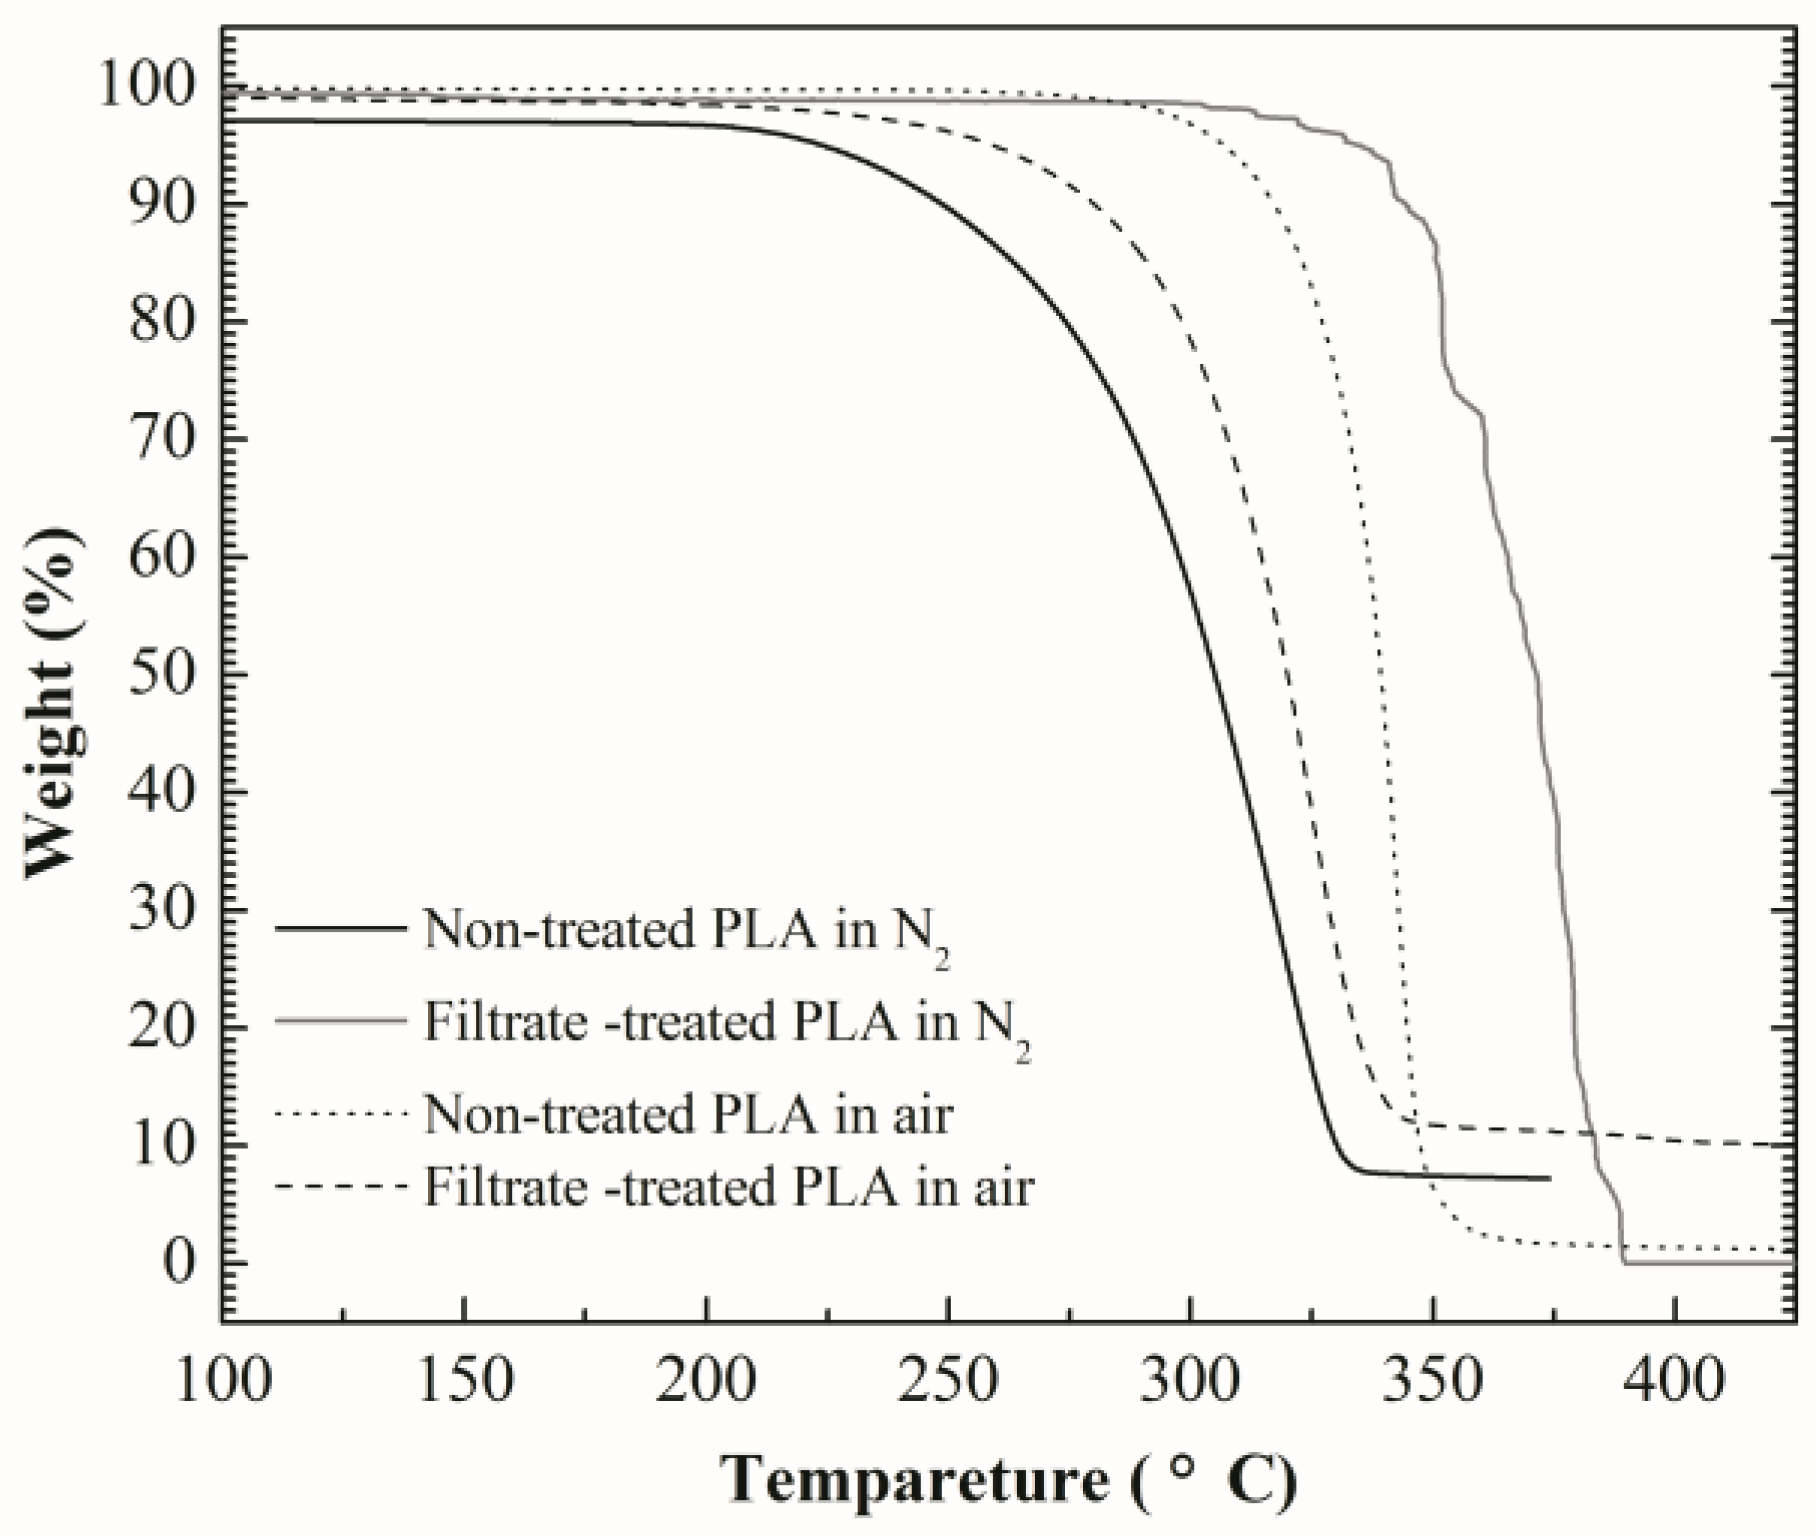
3.1. Thermogravimetric Analysis (TGA)

As the thermal properties of additives are important to the temporary sealing materials applied to geothermal wells, TGA and Py-GC/MS were employed to investigate the thermal properties of PLA. TGA curves tested in different atmospheres for non- and filtrate-treated PLA are shown in Figure 1. All of the TGA curves present only one stage of decomposition. The decomposition stage of original PLA in N2 is between 300 °C and 390 °C, and PLA decomposes completely in this stage. Similarly, original PLA decomposes in the one decomposition stage at between 260 °C and 360 °C. The decomposition stage of the filtrate-treated PLA is between 200 °C and 335 °C with the weight loss of 88.8%, and 200~350 °C with the weight loss of 87.9%, in N2 and in air, respectively. After being treated with the filtrate of SDTSM at room temperature for 72 h and at 85 °C for 24 h, the thermal decomposition temperature declined both in N2 and in air. The decomposition temperature drops from 300 °C to 200 °C in N2, and drops from 260 °C to 200 °C in air. The similar phenomenon was also reported by literature [26], which showed that with increasing time of the hydrolysis experiment, thermal stability of PLA decreased, as reflected by the changes in TGA curves. PLA hydrolyzes in acidic and basic solutions, especially at elevated temperature [26,27,28]. The pH value of filtrate of SDTSM without PLA is 13.16, alkalescence. The filtrate containing PLA powders was cured at 85 °C to simulate the curing conditions of cement, resulting in the hydrolysis of PLA. The hydrolytic decomposition leads to a decrease in molecular weight [26,27,29]. The thermal stability of PLA is closely related to the molecular weight. Cam et al. [30] reported that the thermal decomposition temperature rose with the increase in the molecular weight. Therefore, PLA hydrolyzed in the pH 13.16 filtrate at 85 °C, leading to a decrease in molecular weight, and thus the thermal decomposition temperature declined.

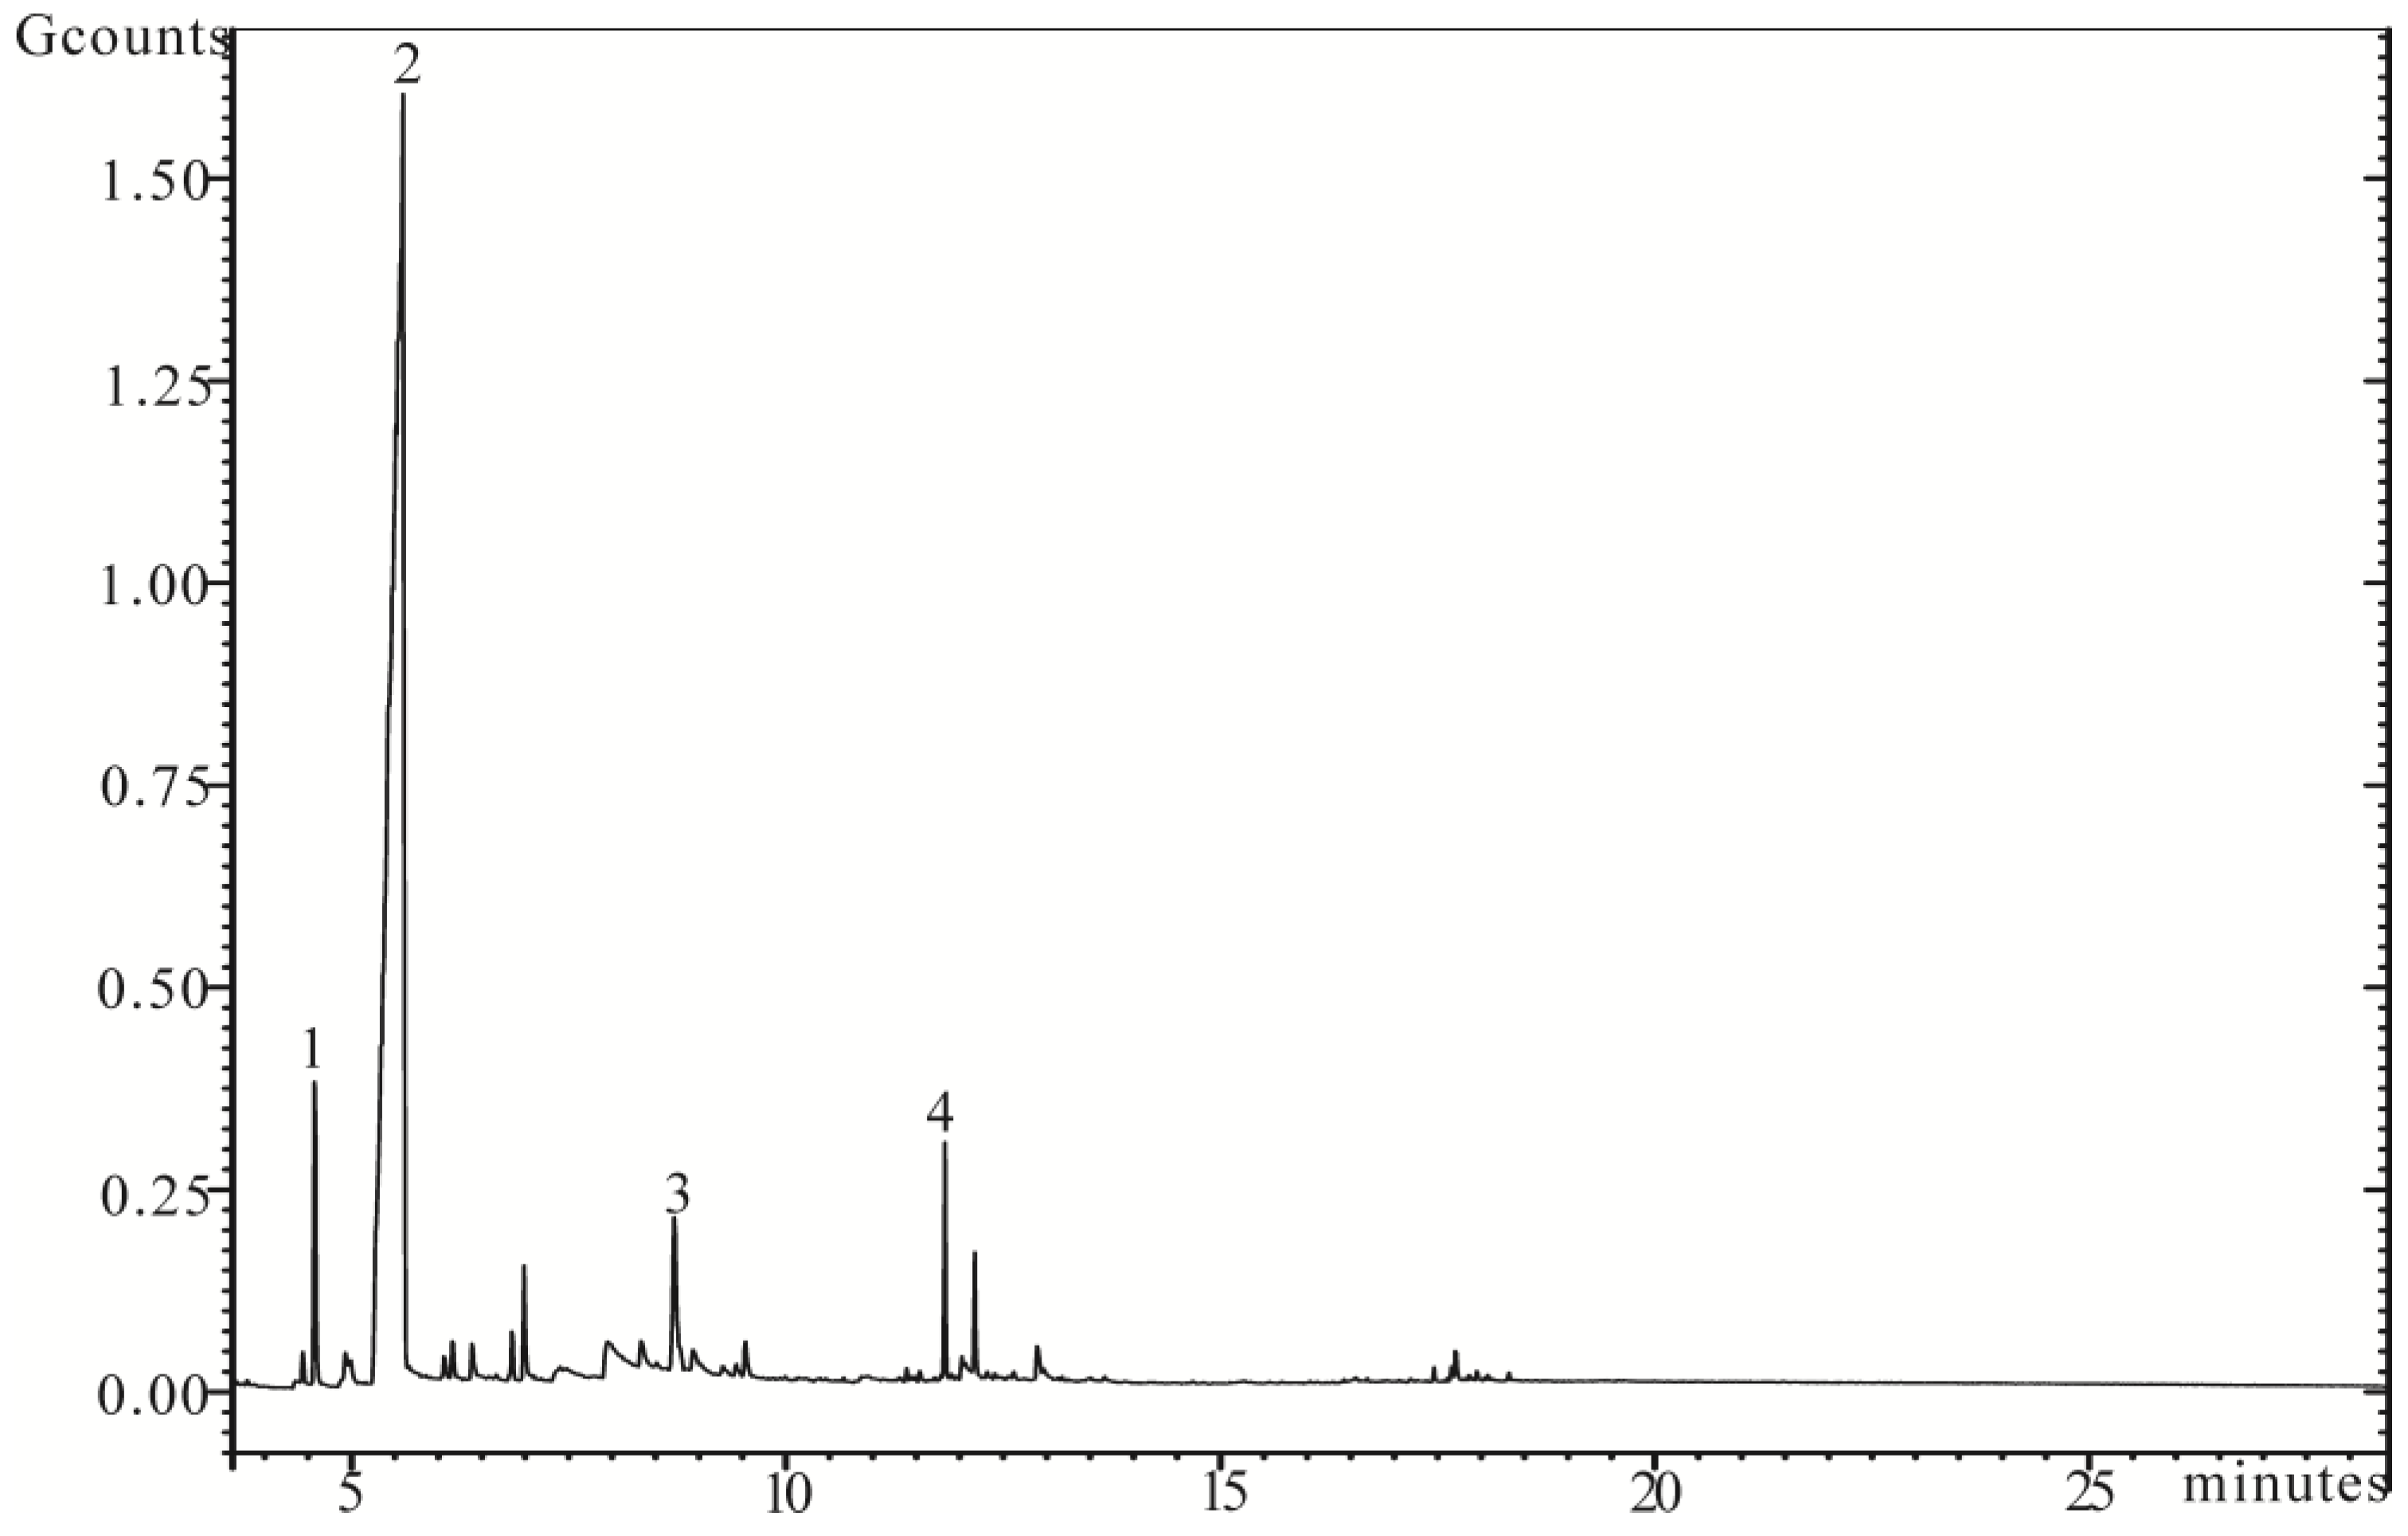
3.2. Pyrolysis-Gas Chromatography/Mass Spectroscopy (Py-GC/MS)

Figure 2 shows the Py-GC/MS abundance-retention time curve of non-treated PLA. Table 2 shows the main pyrolysis derivatives, of which peak area accounts for more than 1.5% of the total, along with their peak area % of the total obtained from Py-GC/MS for non-treated PLA. The main pyrolysis derivatives are γ-butyrolactone, o-xylene, hexyl alcohol and 3-methylpent-1-en-3-ol. The boiling points of o-xylene, hexyl alcohol and 3-methylpent-1-en-3-ol are 144.4 °C, 157.0 °C, and 115.9 °C, respectively. Although the boiling point of γ-butyrolactone is 204 °C, it evaporates together with water vapor [31]. When the environment temperature was above 100 °C, water in cement turned into water vapor. When the cement was heated at 200 °C, γ-butyrolactone evaporated with water vapor. Thus all of the main products (90.83% of the total) were in gaseous state when the cement was heated at above 200 °C. The large release of volatile derivatives emanated would enhance the magnitude of self-degradation of cement [4].

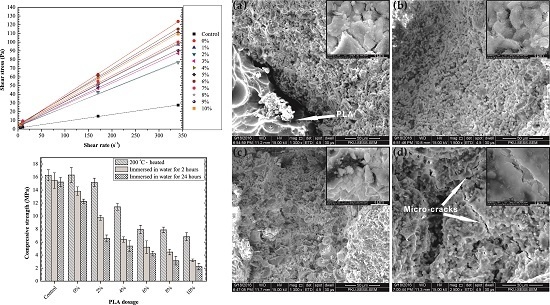
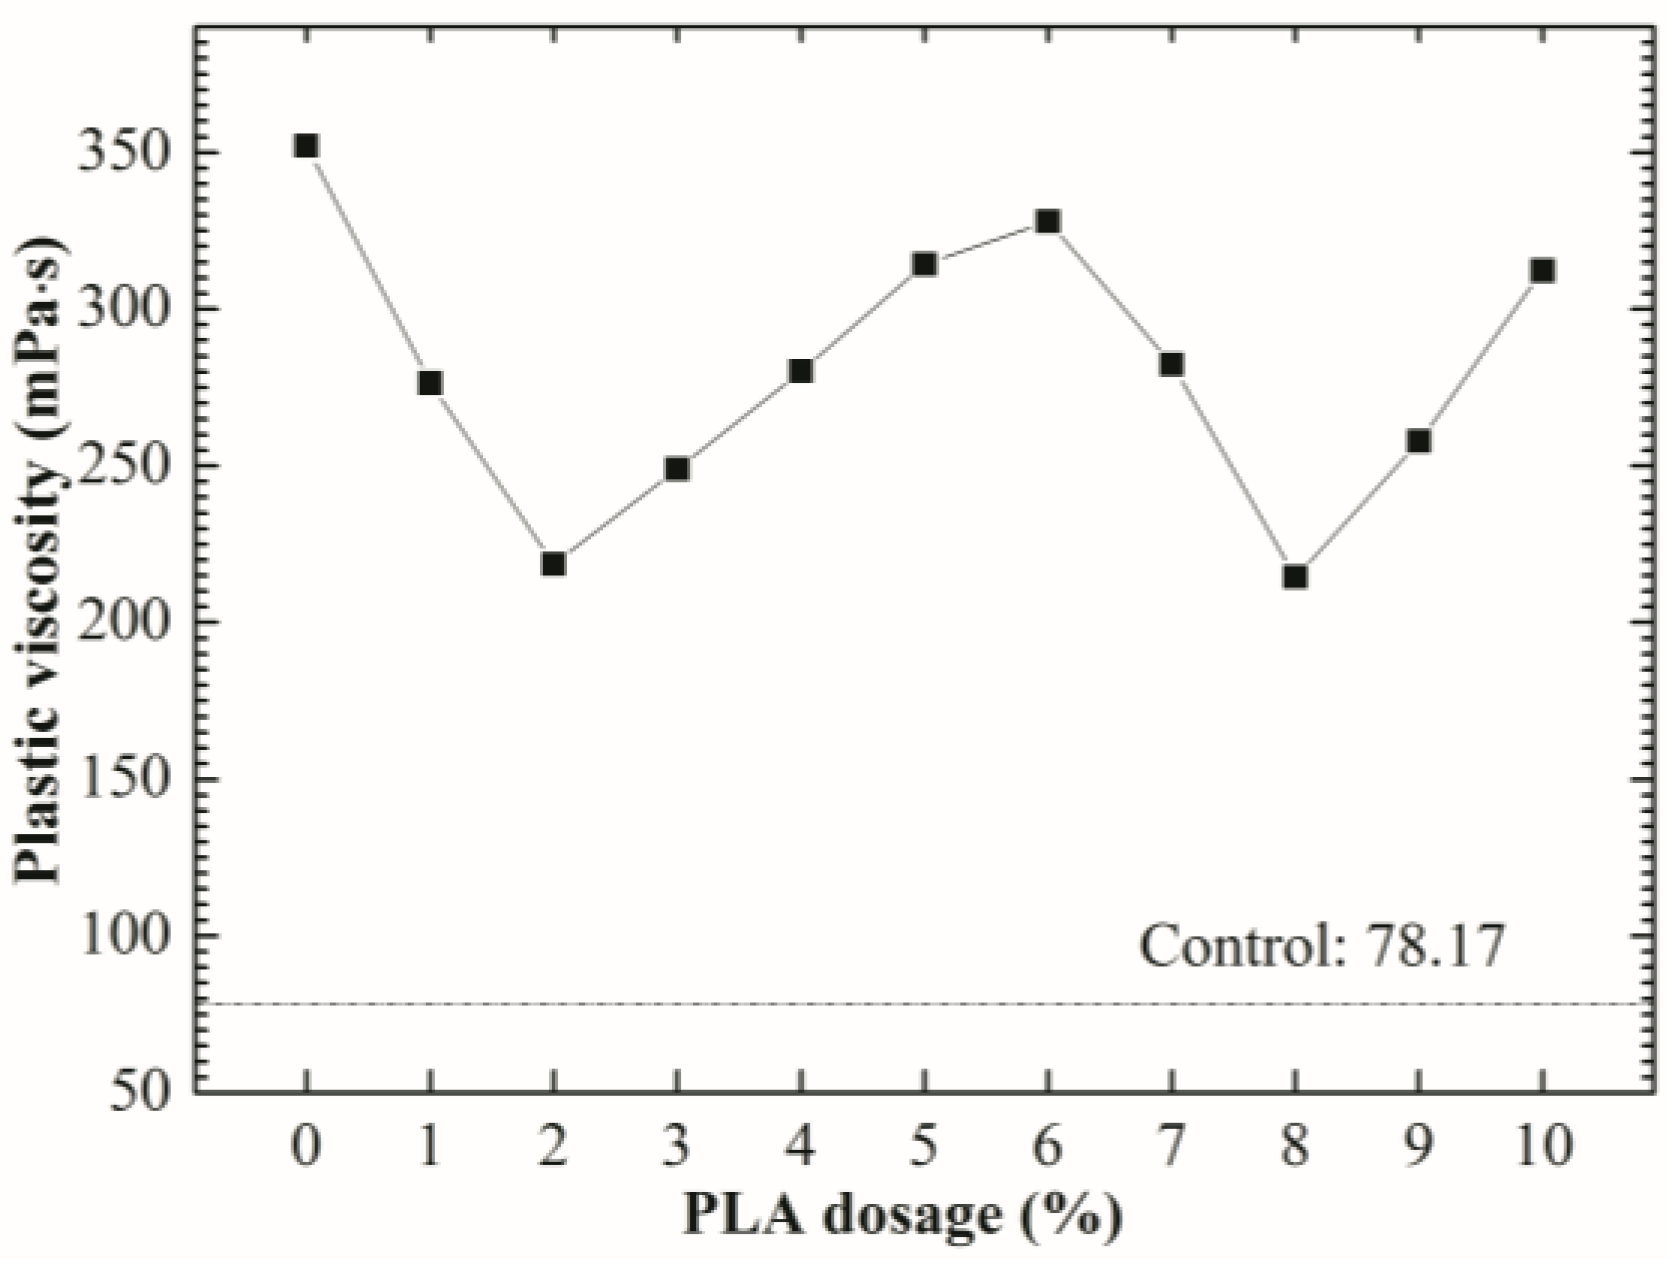
3.3. Rheological Properties

Fluidity, viscosity and shear stress can be used to describe the flow of cement pastes. As shown in Figure 3, the fluidities of the control and SDTSM without PLA are 17.7 cm and 16.2 cm, indicating that CMC decreased the fluidity of cement. The enhancement in fluidity is 14.8% with the addition of 2% PLA, compared to SDTSM without PLA. The effect of PLA dosage on fluidity of SDTSM presents a fluctuation tendency. The additions of 2% and 8% PLA reach two different peak values of 18.6 cm and 18.3 cm, respectively. Despite the fact that SDTSMs with 6% and 10% PLA present lower fluidity, the values are higher than SDTSM without PLA, suggesting that PLA enhanced the fluidity. As shown in Table 3, the shear stress of all samples increases with the increasing shear rate. Shear stress–shear rate relationships were described according to Bingham plastic model [32]:
τ = τ 0 + μ p γ
where τ is the shear stress (Pa), μ p is the plastic viscosity (mPa·s), γ is the shear rate (s−1) (also referred to as the shear strain rate) and τ 0 is the yield stress (Pa) (also referred to as the yield point). Linear fitting of rheological curves of the control and SDTSMs with 0%, 1%, 2%, 3%, 4%, 5%, 6%, 7%, 8%, 9% and 10% PLA was performed by using a computer software named ‘Origin’, as shown in Figure 4, to determine a slope (plastic viscosity) and an intercept (yield stress). The quality of the fitting of the experimental data to the Bingham plastic model was evaluated using error function assessments, namely, the coefficient of determination ( R 2 ) and residual root-mean-square errors (RMSE) tests. The values R 2 and RMSE are given by Equations (3) and (4), respectively:
R M S E = 1 n p i = 1 n ( q e i q c i ) 2
R 2 = ( i = 1 n ( q e i q e ¯ ) ( q c i q c ¯ ) i = 1 n ( q e i q e ¯ ) 2 i = 1 n ( q c i q c ¯ ) 2 ) 2
where q e i and q c i are the experimental and calculated shear stress, respectively; q e ¯ and q c ¯ are the mean of experimental and calculated shear stress values; n is the number of experimental data points; and p is the number of parameters in the model equation. The experimental data obeyed one model well when the R 2 value was close to 1, and the RMSE value was close to zero.
The values of μ p , τ 0 , the coefficient of determination ( R 2 ) and the residual root mean square error (RMSE) values are shown in Table 4. All of the values of R 2 are between 0.99 and 1, and all of the RMSEs are smaller than 2.7 with the mean value of 1.4694, indicating that the relationship between shear stress and shear rate of all the cement pastes can be described by the Bingham plastic model. The plastic viscosity curve of SDTSMs with different PLA dosage is shown in Figure 5. Similar to the fluidity curve, the plastic viscosity curve also presents a fluctuation tendency as the PLA dosage increases. However, contrast to fluidity curve, two different minimum plastic viscosity values, 218.16 mPa·s and 214.57 mPa·s are obtained by adding 2% and 8% PLA, which decrease by 38.04% and 39.07% compared to that of SDTSM without PLA. Although the fluidity and plastic viscosity curves present fluctuation tendency, the addition of PLA increased the fluidity and reduced the plastic viscosity and yield stress compared to SDTSM without PLA, and thus improved the rheological properties of the CMC-modified cement. The fluidity is related to rheological parameters, viscosity and yield stress [33]. In general, the increment of rheological parameters is accompanied by a reduction of fluidity, and vice versa, as reported in literatures [34,35,36]. Assaad [34] reported that the extraction of water decreased the fluidity and increased the viscosity of inject cementitious grouts. Celik et al. [35] reported that increasing the replacement level of rice husk ash increased plastic and apparent viscosity, and the yield stress, but also decreased fluidity. Shang et al. [36] reported the addition of graphene oxide into the cement caused a noticeable reduction in fluidity and increased rheological parameters.
The powders of PLA, slag and fly ash were screened by sieves with different pore diameters to investigate the influences of PLA powders on the rheological properties of cement slurries. The weight percentages of powders between different pore diameters sieves are provided in Table 5, from which we can learn that the PLA particles are larger than those of slag and fly ash. The increased dosage of the large particle PLA powders changed the particle size distribution, and thus changed the specific surface area and particle number density, both of which have effects on the rheological behavior of cementitious slurries, as reported in [37,38]. Bentz et al. [37] reported that, as the fly ash particles were larger than the cement particles, the replacement of fly ash decreased the particle number density of cement-fly ash pastes and produced significantly lower yield stress values. Vance et al. [38] reported that the yield stress and plastic viscosity of the cement pastes containing limestone powder were found to increase with the specific surface area. Besides, as the cement was prepared through adding water by the water/dry pozzolana cement ratio of constant 0.6, the addition of PLA enhanced solid content in the cement slurry. The increased solid content increases the viscosity and yield stress and decreases the fluidity. Therefore, the fluidity and plastic viscosity curves present a fluctuation tendency resulting from the combined influences of particle size distribution and the solid content change as the PLA dosage is increased.

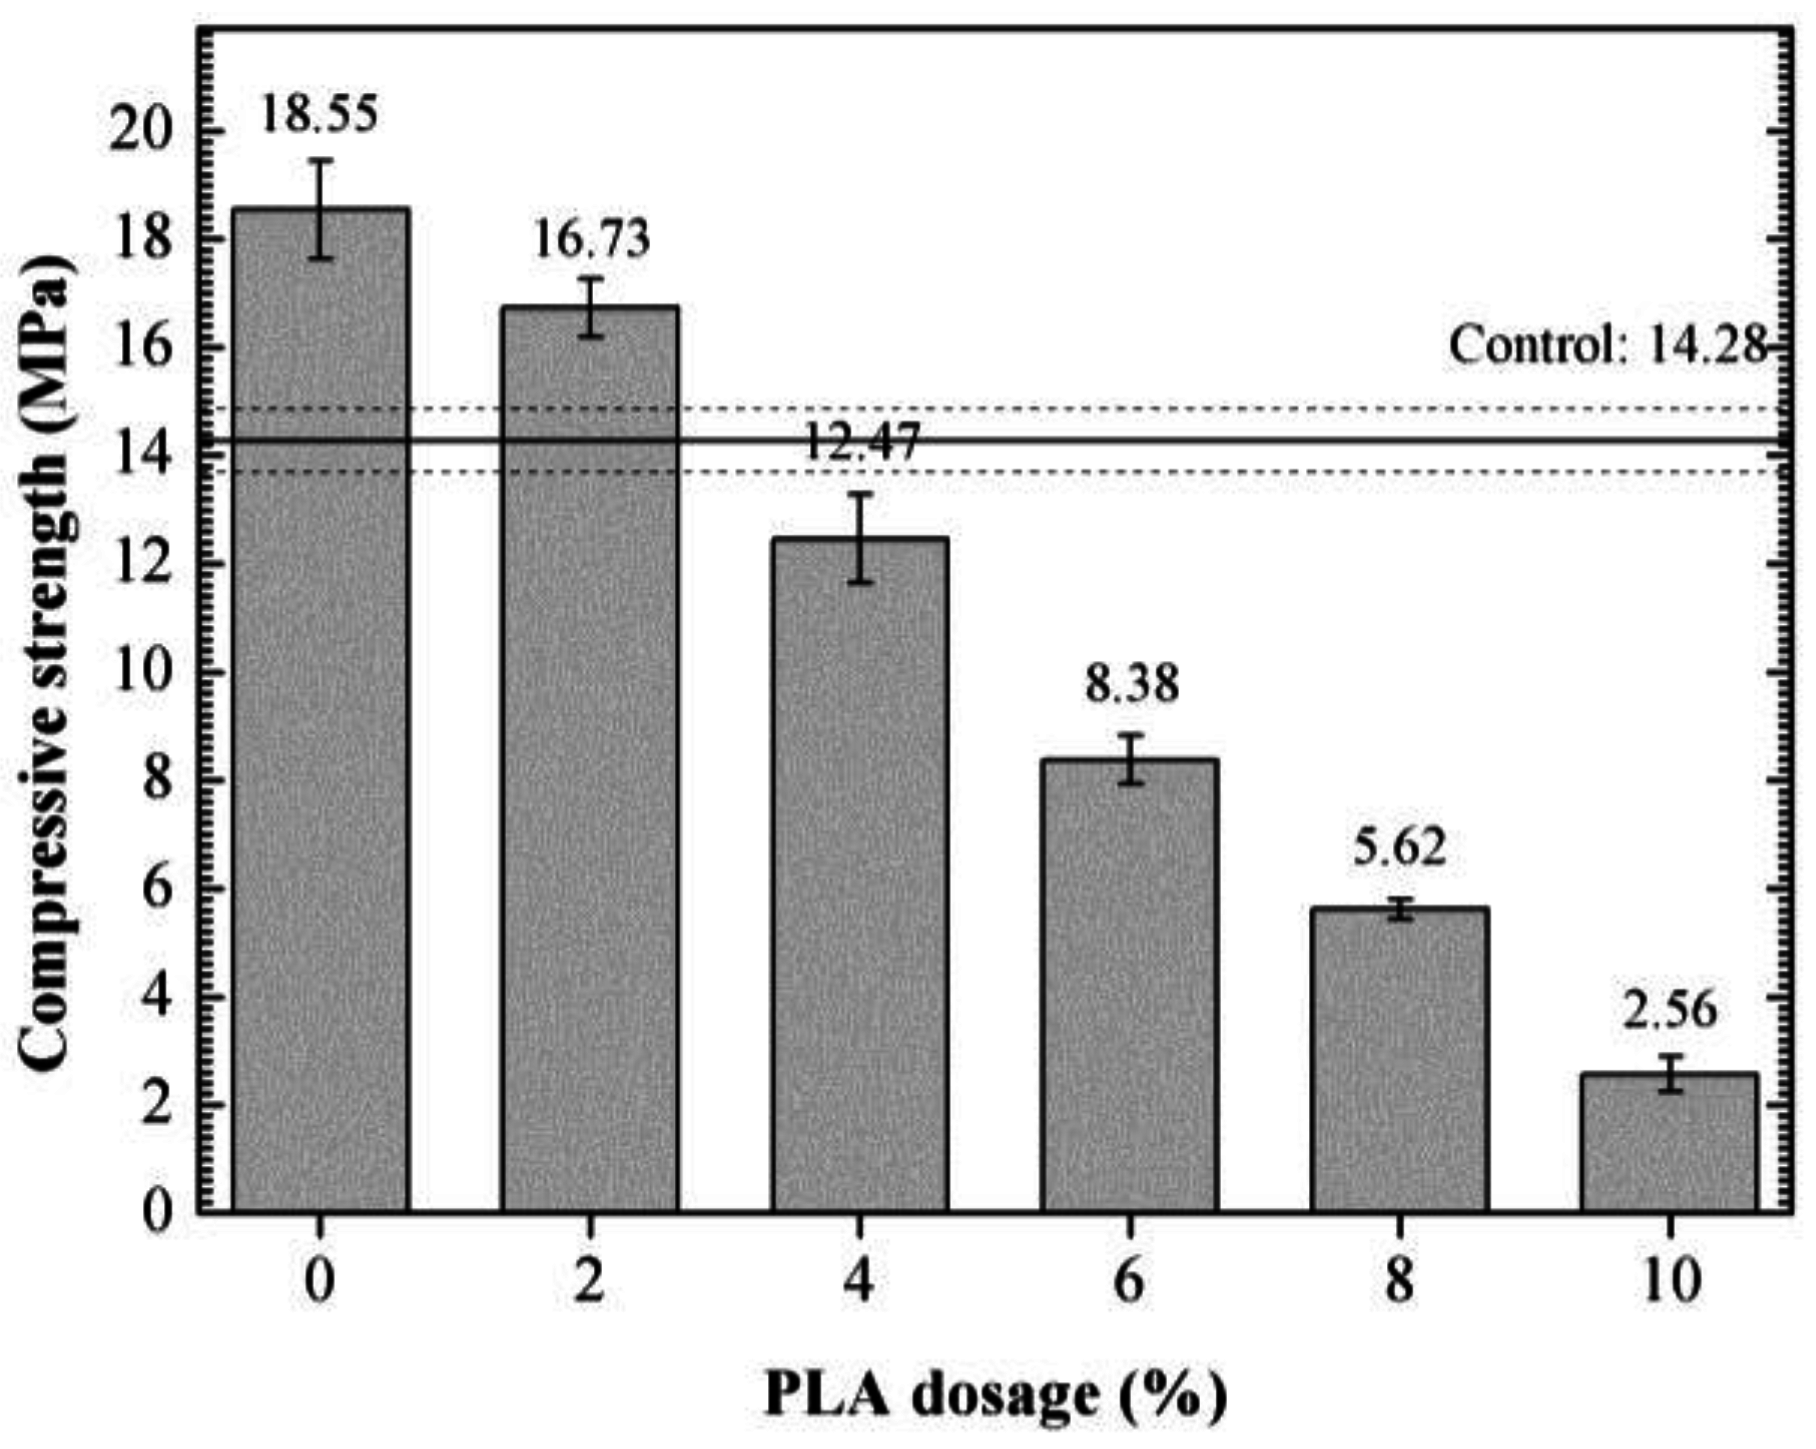
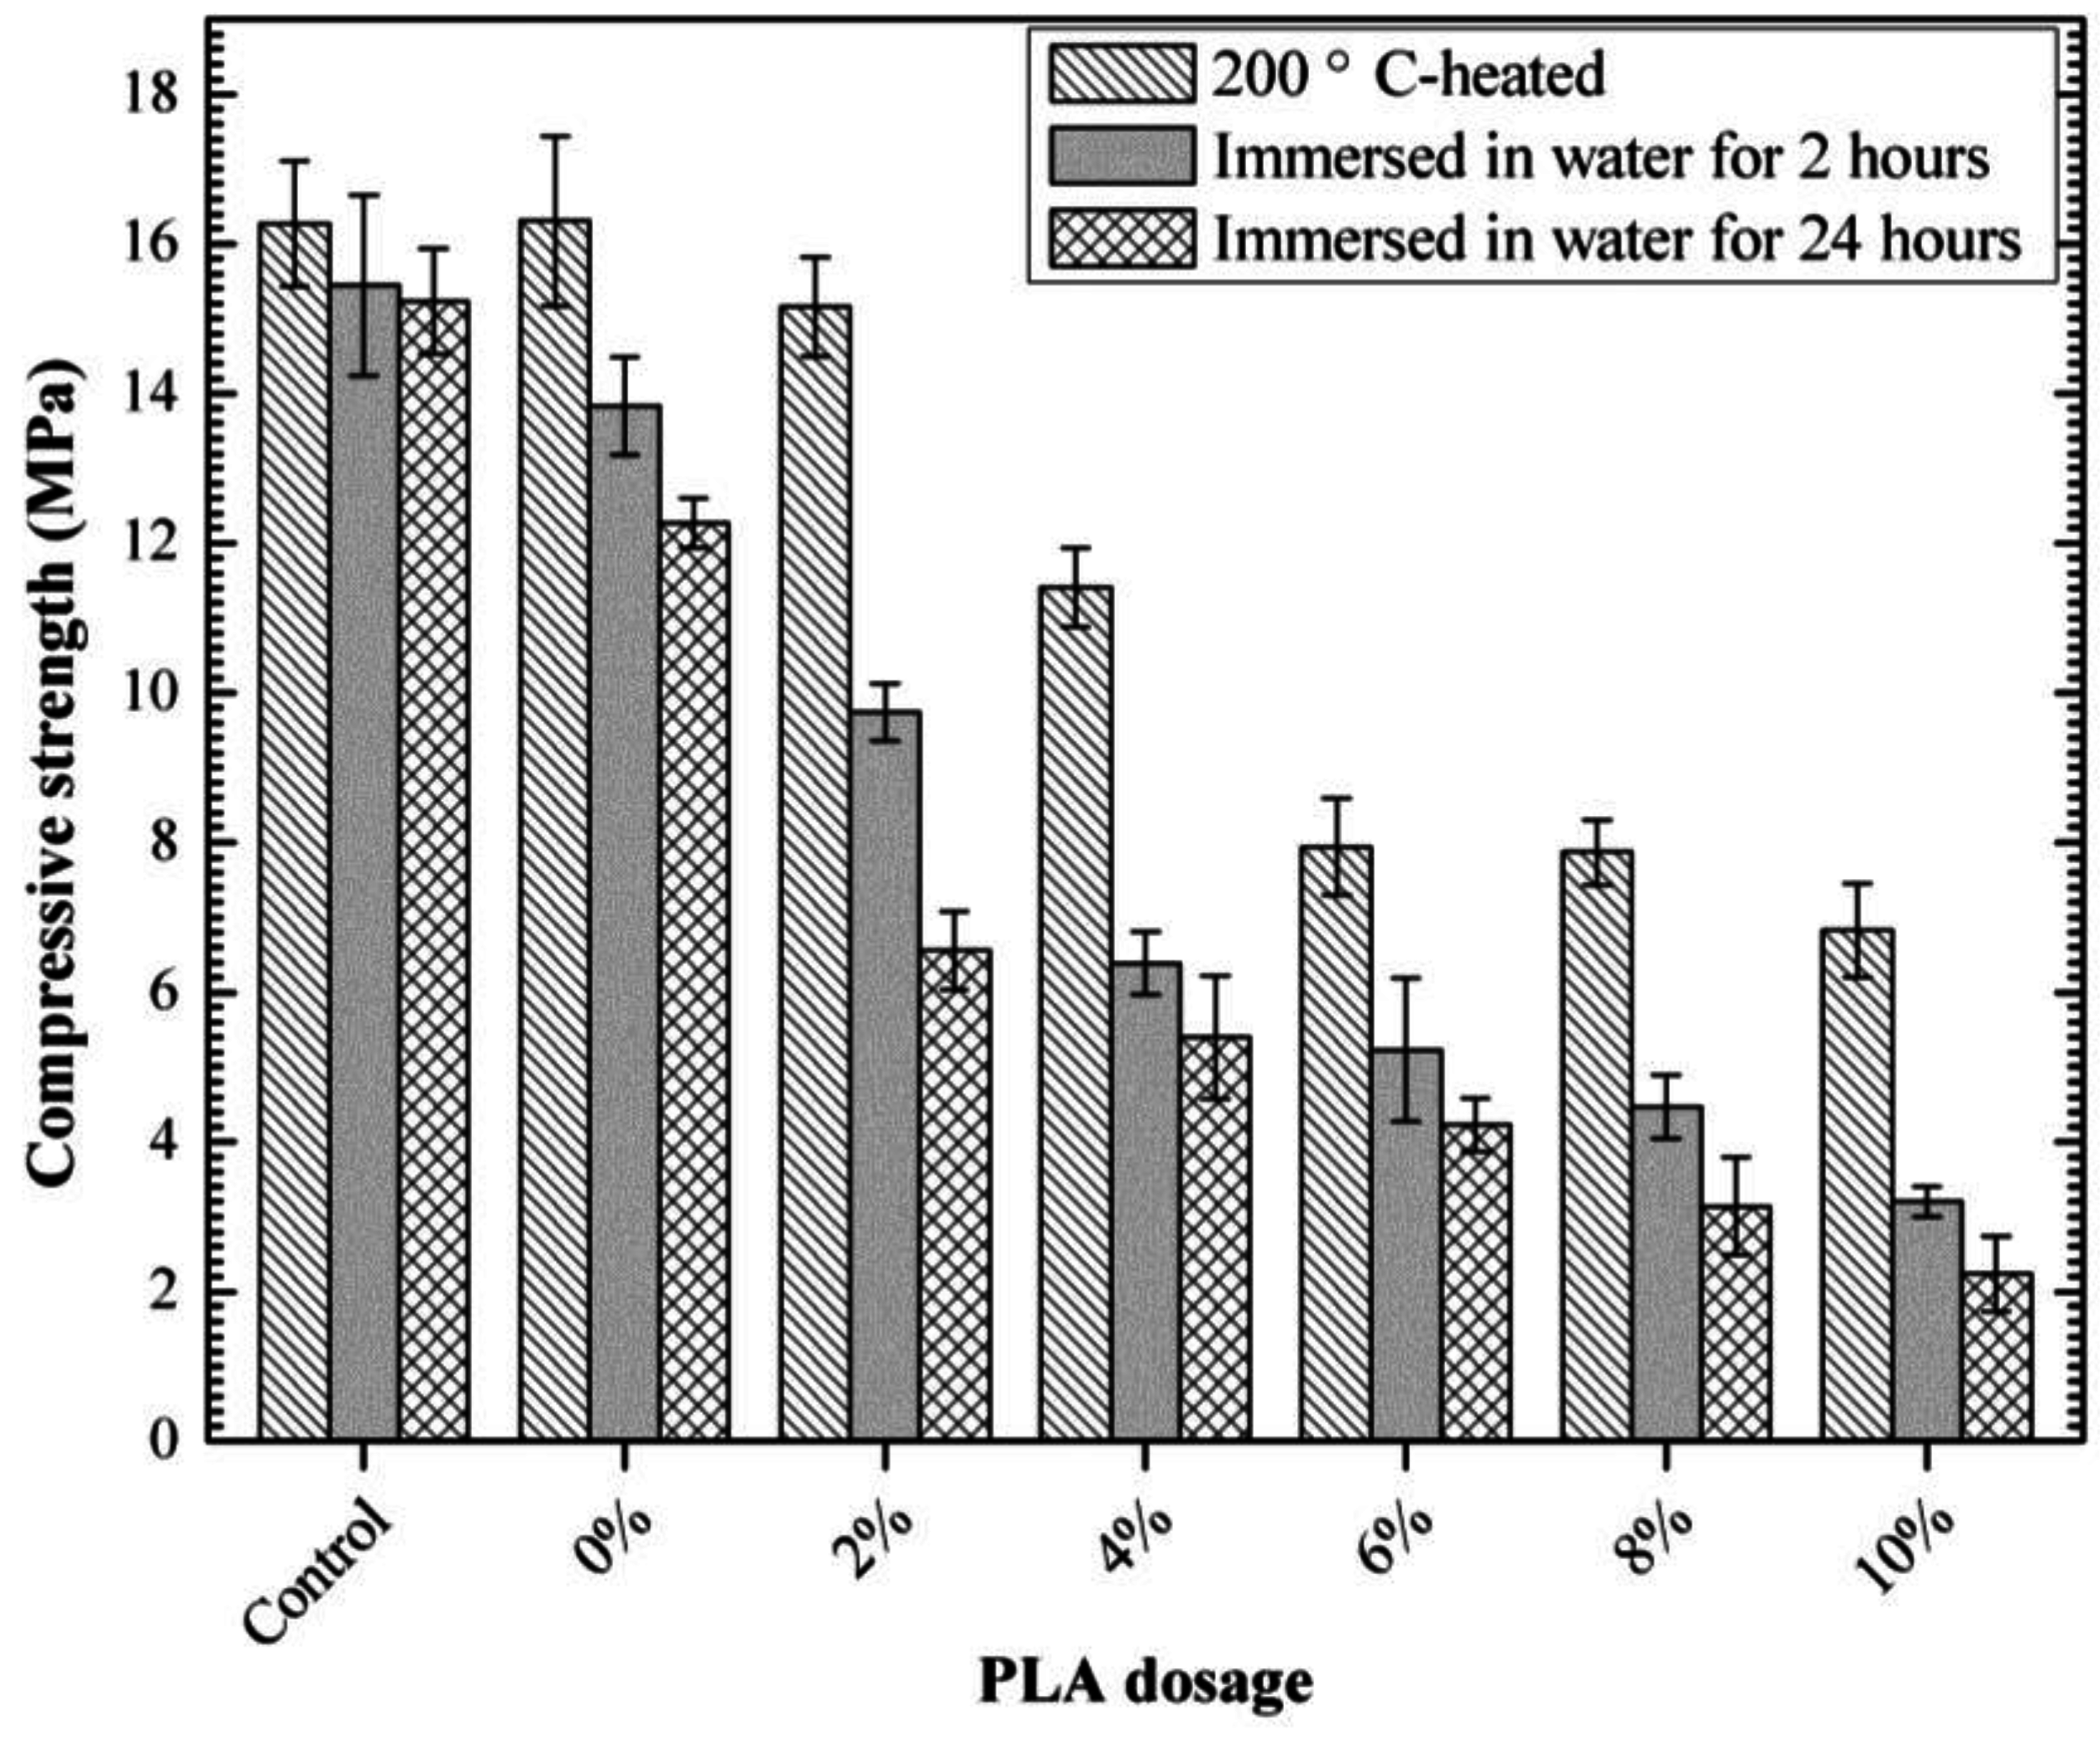
3.4. Compressive Strength of 85 °C-Cured Specimens

Figure 6 shows the compressive strength of the 85 °C-cured samples of the control and SDTSMs with different PLA dosages. The compressive strength of SDTSMs without PLA exhibits an enhancement of 29.90% compared to the control, indicating that CMC has an ability to increase the compressive strength of the alkali-activated slag/Class C fly ash cement. The reduction in compressive strength is 9.8%, 32.8% and 54.8% with the addition 2%, 4% and 6% PLA compared to SDTSM without PLA, respectively, revealing that PLA decreased the compressive strength of 85 °C-cured SDTSM. However, SDTSM with 2% PLA exhibits an enhancement in compressive strength compared to the control, indicating that 1% CMC with a lesser PLA dosage could still reinforce the compressive strength of the sodium silicate-activated slag/Class C fly ash cement. The compressive strength of SDTSM decreased as the PLA dosage increased, may result from the hydrolysis of ester bonds in PLA yielding—COOH groups, which reacted with OH, leading to a decrease in alkali content. The dosage of the alkali activator has notable influence on the strengths of cement. Abdalqader et al. [39] reported that increasing the activator dosage led to an increase in the strengths of sodium carbonate activated slag/fly ash cement at all ages. Therefore, the SDTSM containing a larger PLA dosage presented a lower 85 °C-cured compressive strength. The accepted compressive strength for the drilling operations to resume after curing circulation losses is 3.5 MPa [4], so even the compressive strength of SDTSM with 8% PLA is more than sufficient for plugging fractures and resuming drilling.

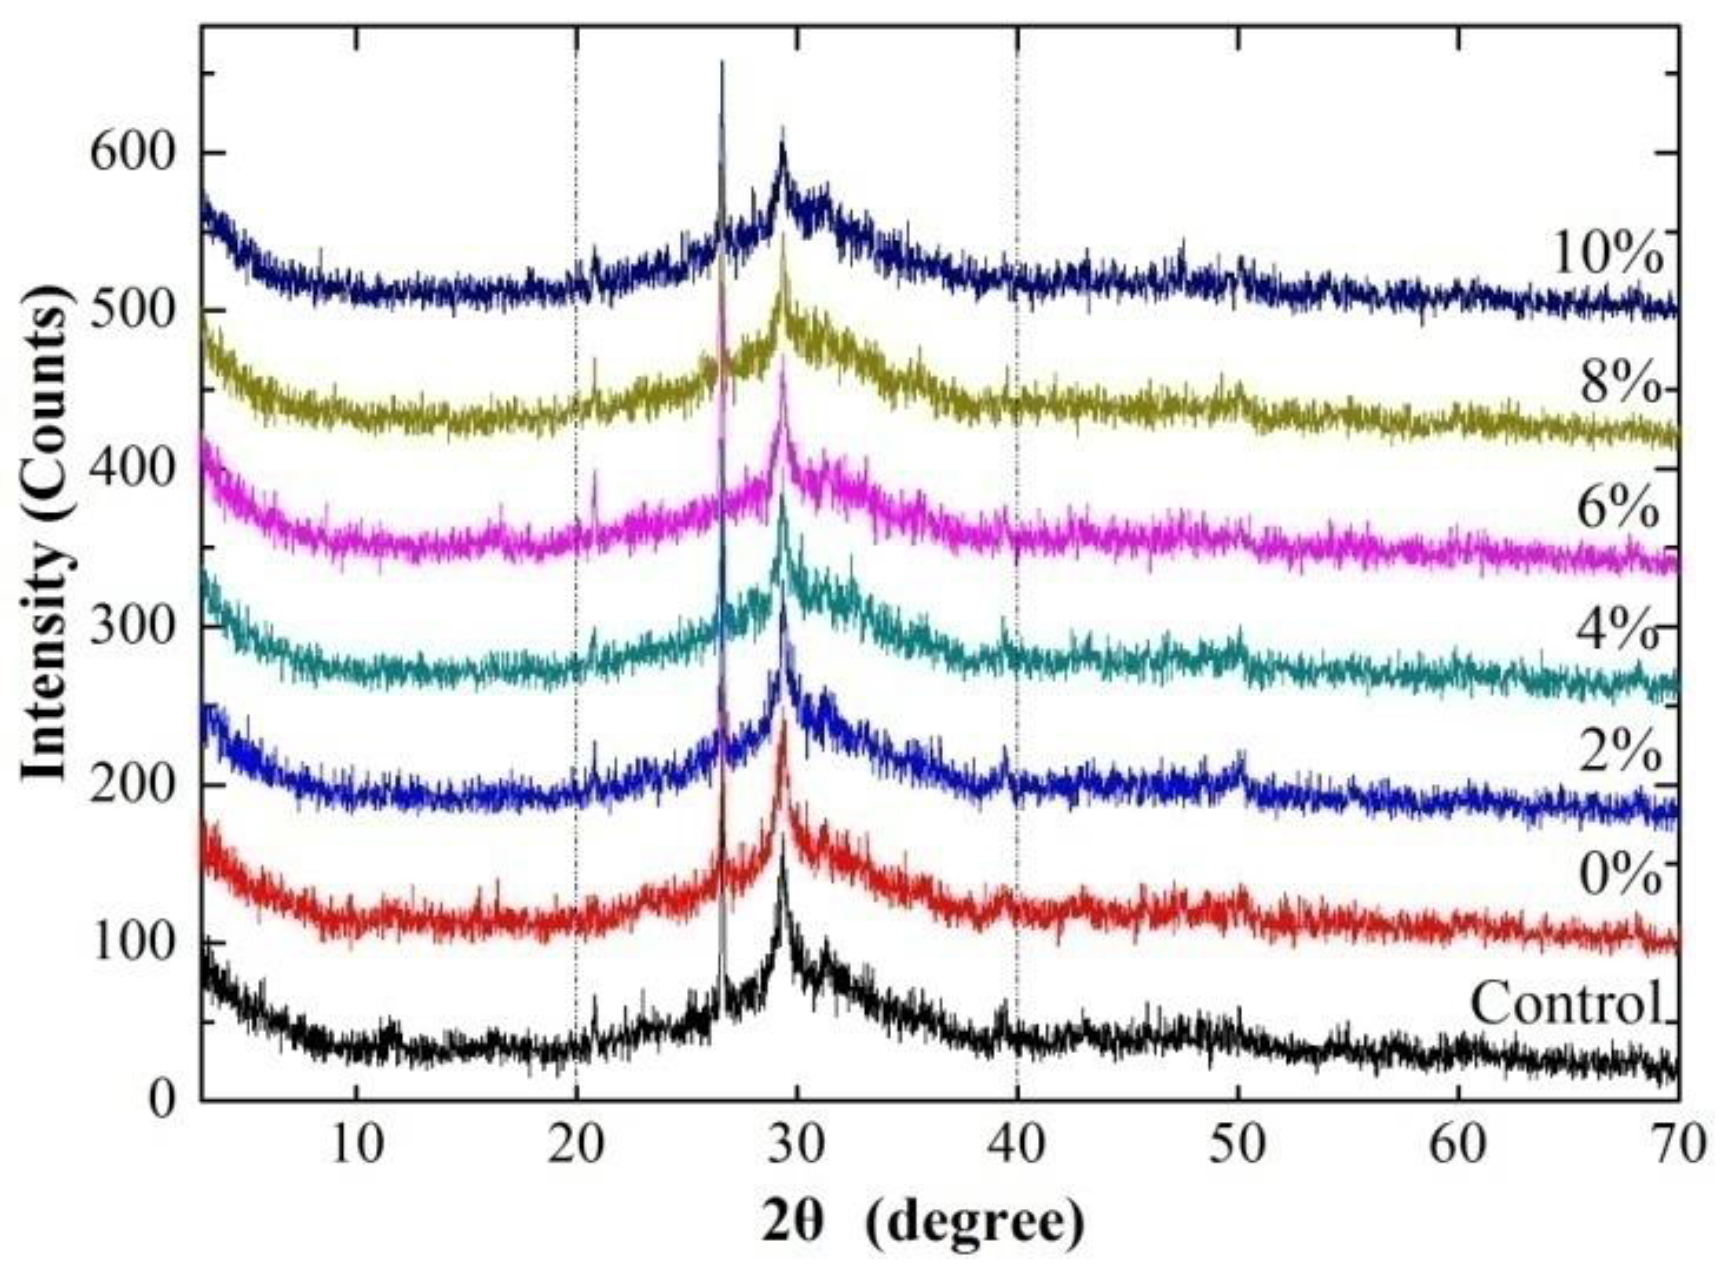
3.5. Powder X-ray Diffraction (XRD)

All of the XRD patterns of the 85 °C-cured samples (shown in Figure 7) exhibit a crystalline phase at about 2 θ value of 26.6°, which indicates the presence of quartz attributed to the Class C fly ash residue. Besides, each XRD pattern exhibits an amorphous hump between 2 θ values of 20° and 40° due to the non-hydrated slag. The diffuse peak at about 2 θ value of 29.5° is assigned to calcium-silicate-hydrate (C-S-H) phase or calcite [40,41]. The XRD patterns of the 85 °C-cured samples seem to be similar to each other, the diffraction peaks are in the same positions, revealing that the effect of PLA or CMC on the types of hydrate products of the alkali activated slag/Class C fly ash cement is less pronounced. However, the intensity value of the peak at 29.5° of the control and SDTSM with 0%, 2%, 4%, 6%, 8% and 10% PLA is 170, 170, 170, 161, 153, 150 and 137, in sequence. The intensity is closely associated with crystalline phases, as reported in literatures [42,43,44]. Literature [42] reported that the intensity of quartz and mullite peaks was decreased related to the higher reactivity of fly ash which resulted into consumption of quartz and mullite phase. Literature [43] reported that the increasing intensity of cementitious product peak indicated the increase in the cementitious compounds. Literature [44] reported that the intensity of calcium hydroxide peak decreased due to a rapid consumption of Ca(OH)2. In addition, the peak area is 3103, 2564, 2457, 2342, 2024, 1371 and 1300, respectively; and the sharpness of the peak weakens with the increasing PLA dosage, compared to SDTSM without PLA. To some extent, a sharper peak means a better crystallinity, and a larger peak area reflects a larger amount of the crystalline phase. Literature [45] reported that the broad crystallization peak indicated surface crystallization whereas the sharp peak signified bulk crystallization. Therefore, the intensity, peak area and sharpness of peak at 29.5° decrease as the increasing PLA dosage suggesting that the hydrate products decreases with the increasing PLA dosage. Furthermore, the decrease of hydrate products attributed to the compressive strength decrease of the 85 °C-cured cement.

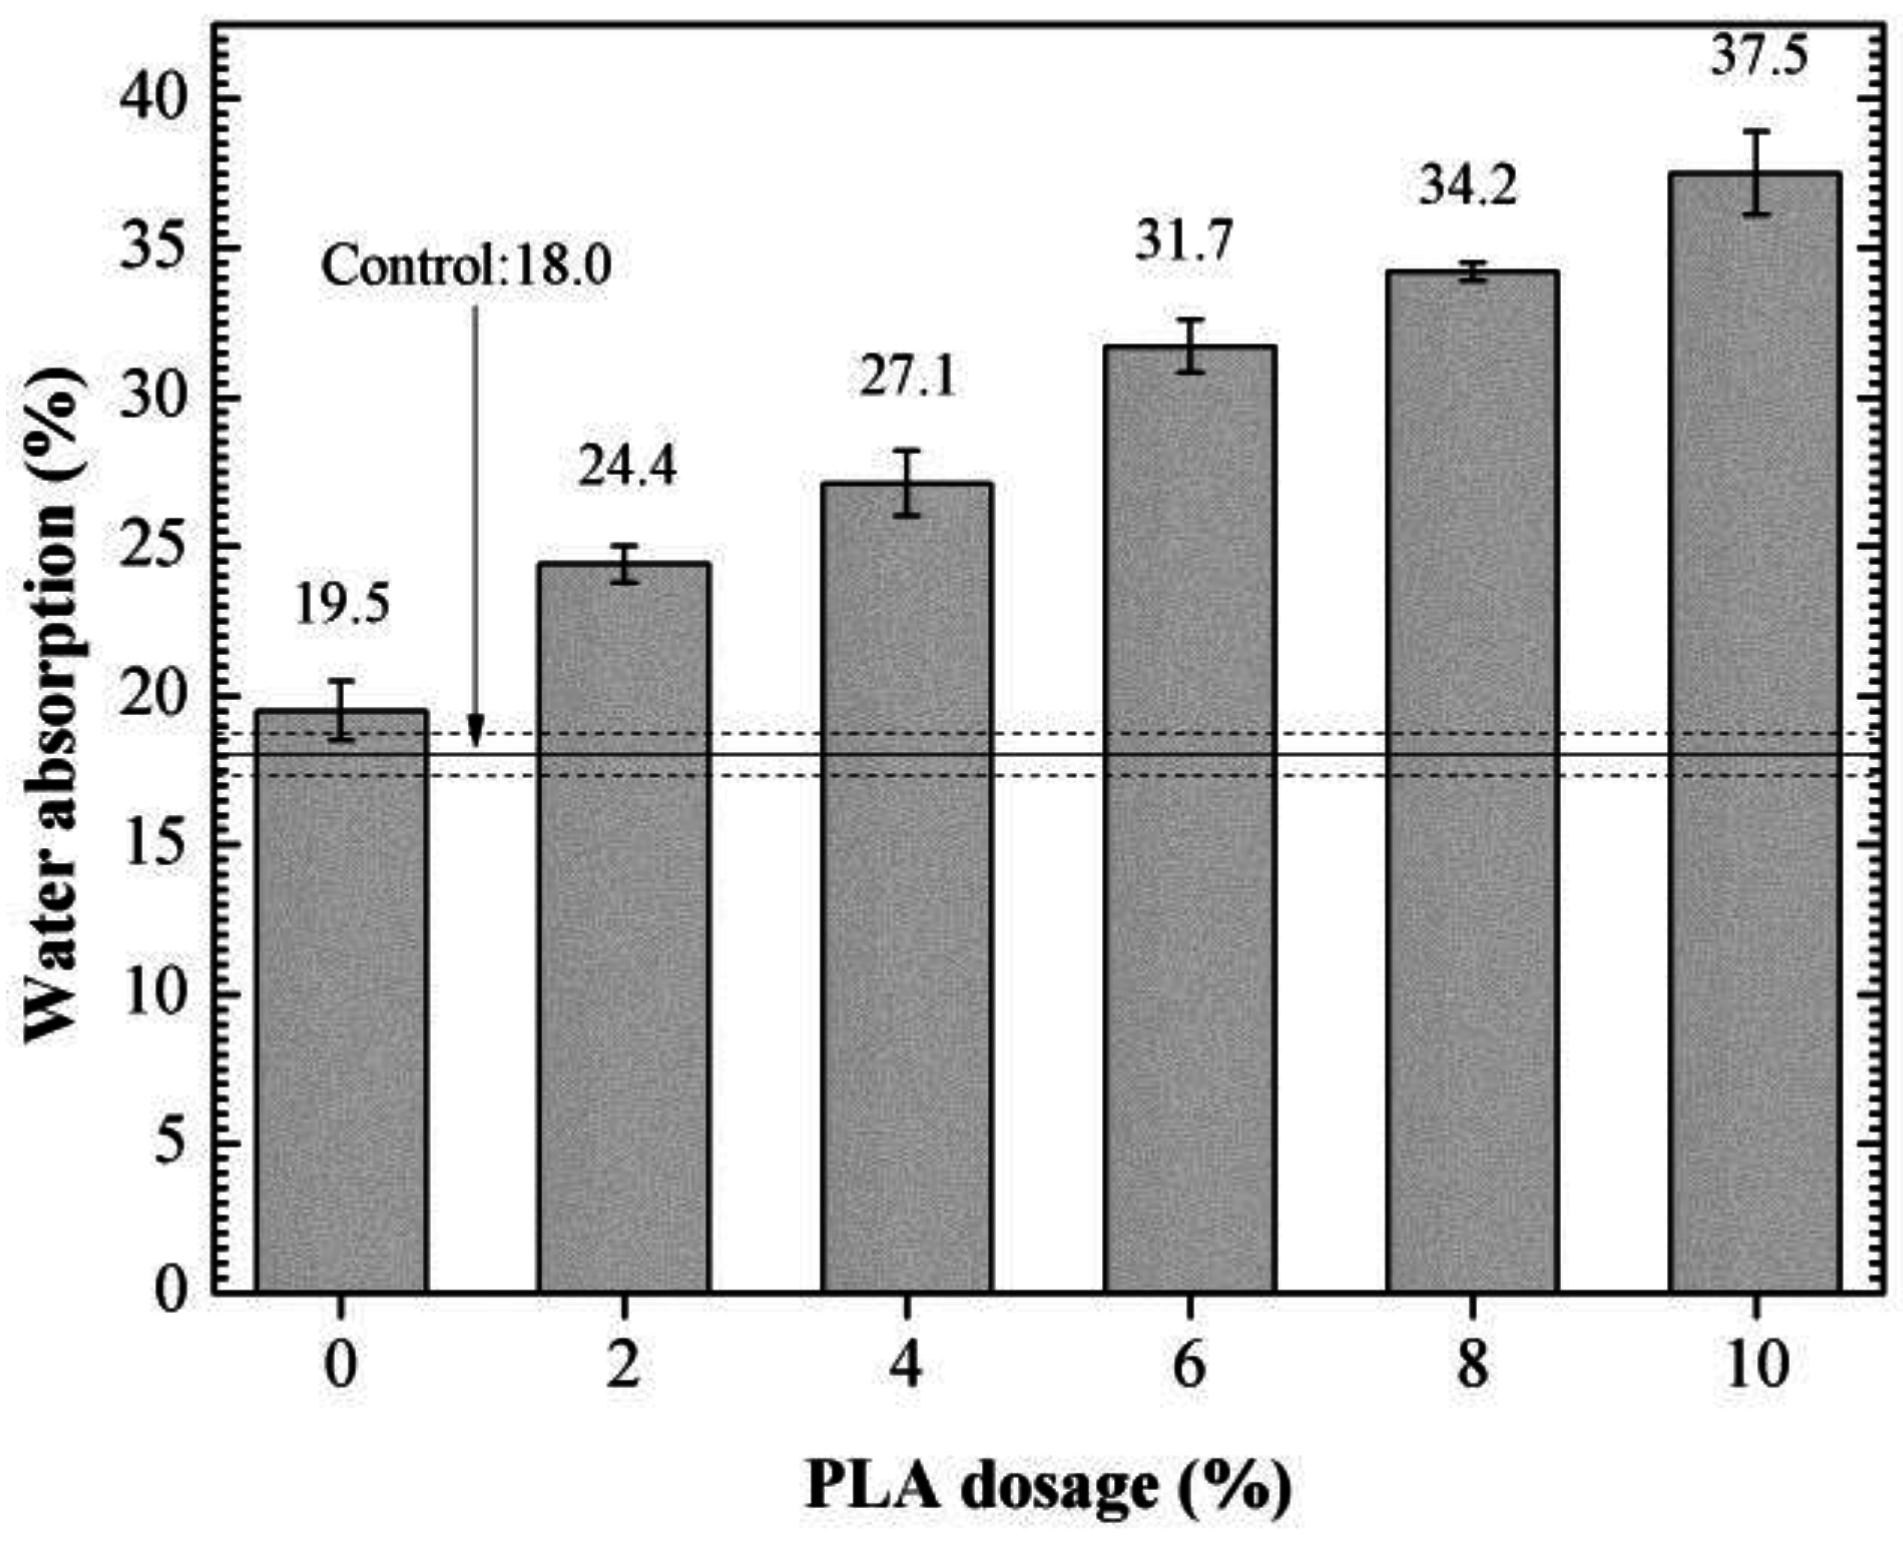
3.6. Water Absorption

Figure 8 shows the water absorption of the 200 °C-heated specimens of the control and SDTSMs with different PLA dosages. The value of SDTSM with 0%, 2%, 4%, 6%, 8% and 10% PLA is 19.5%, 24.4%, 27.1%, 31.7%, 34.2% and 37.5%. The water absorption increased by 92.49% due to the addition of 10% PLA. The water absorption was increased with the increasing PLA dosage, suggesting that the addition of PLA contributed to the rapid entering of water into the specimens in a short time. Additionally, larger water absorption is usually accompanied by a larger porosity and a looser structure. Aprianti et al. [46] reported that a denser cement mortar microstructure achieved a higher compressive strength with lower water absorption. Hossain et al. [47] reported that the incorporation of soluble silicates into alkali-activated blast furnace slag paste led to a denser and more homogeneous microstructure with lower water absorption and apparent porosity. Therefore, the enhancement in water absorption due to the addition of PLA, points to a larger porosity and a looser structure, to some extent.

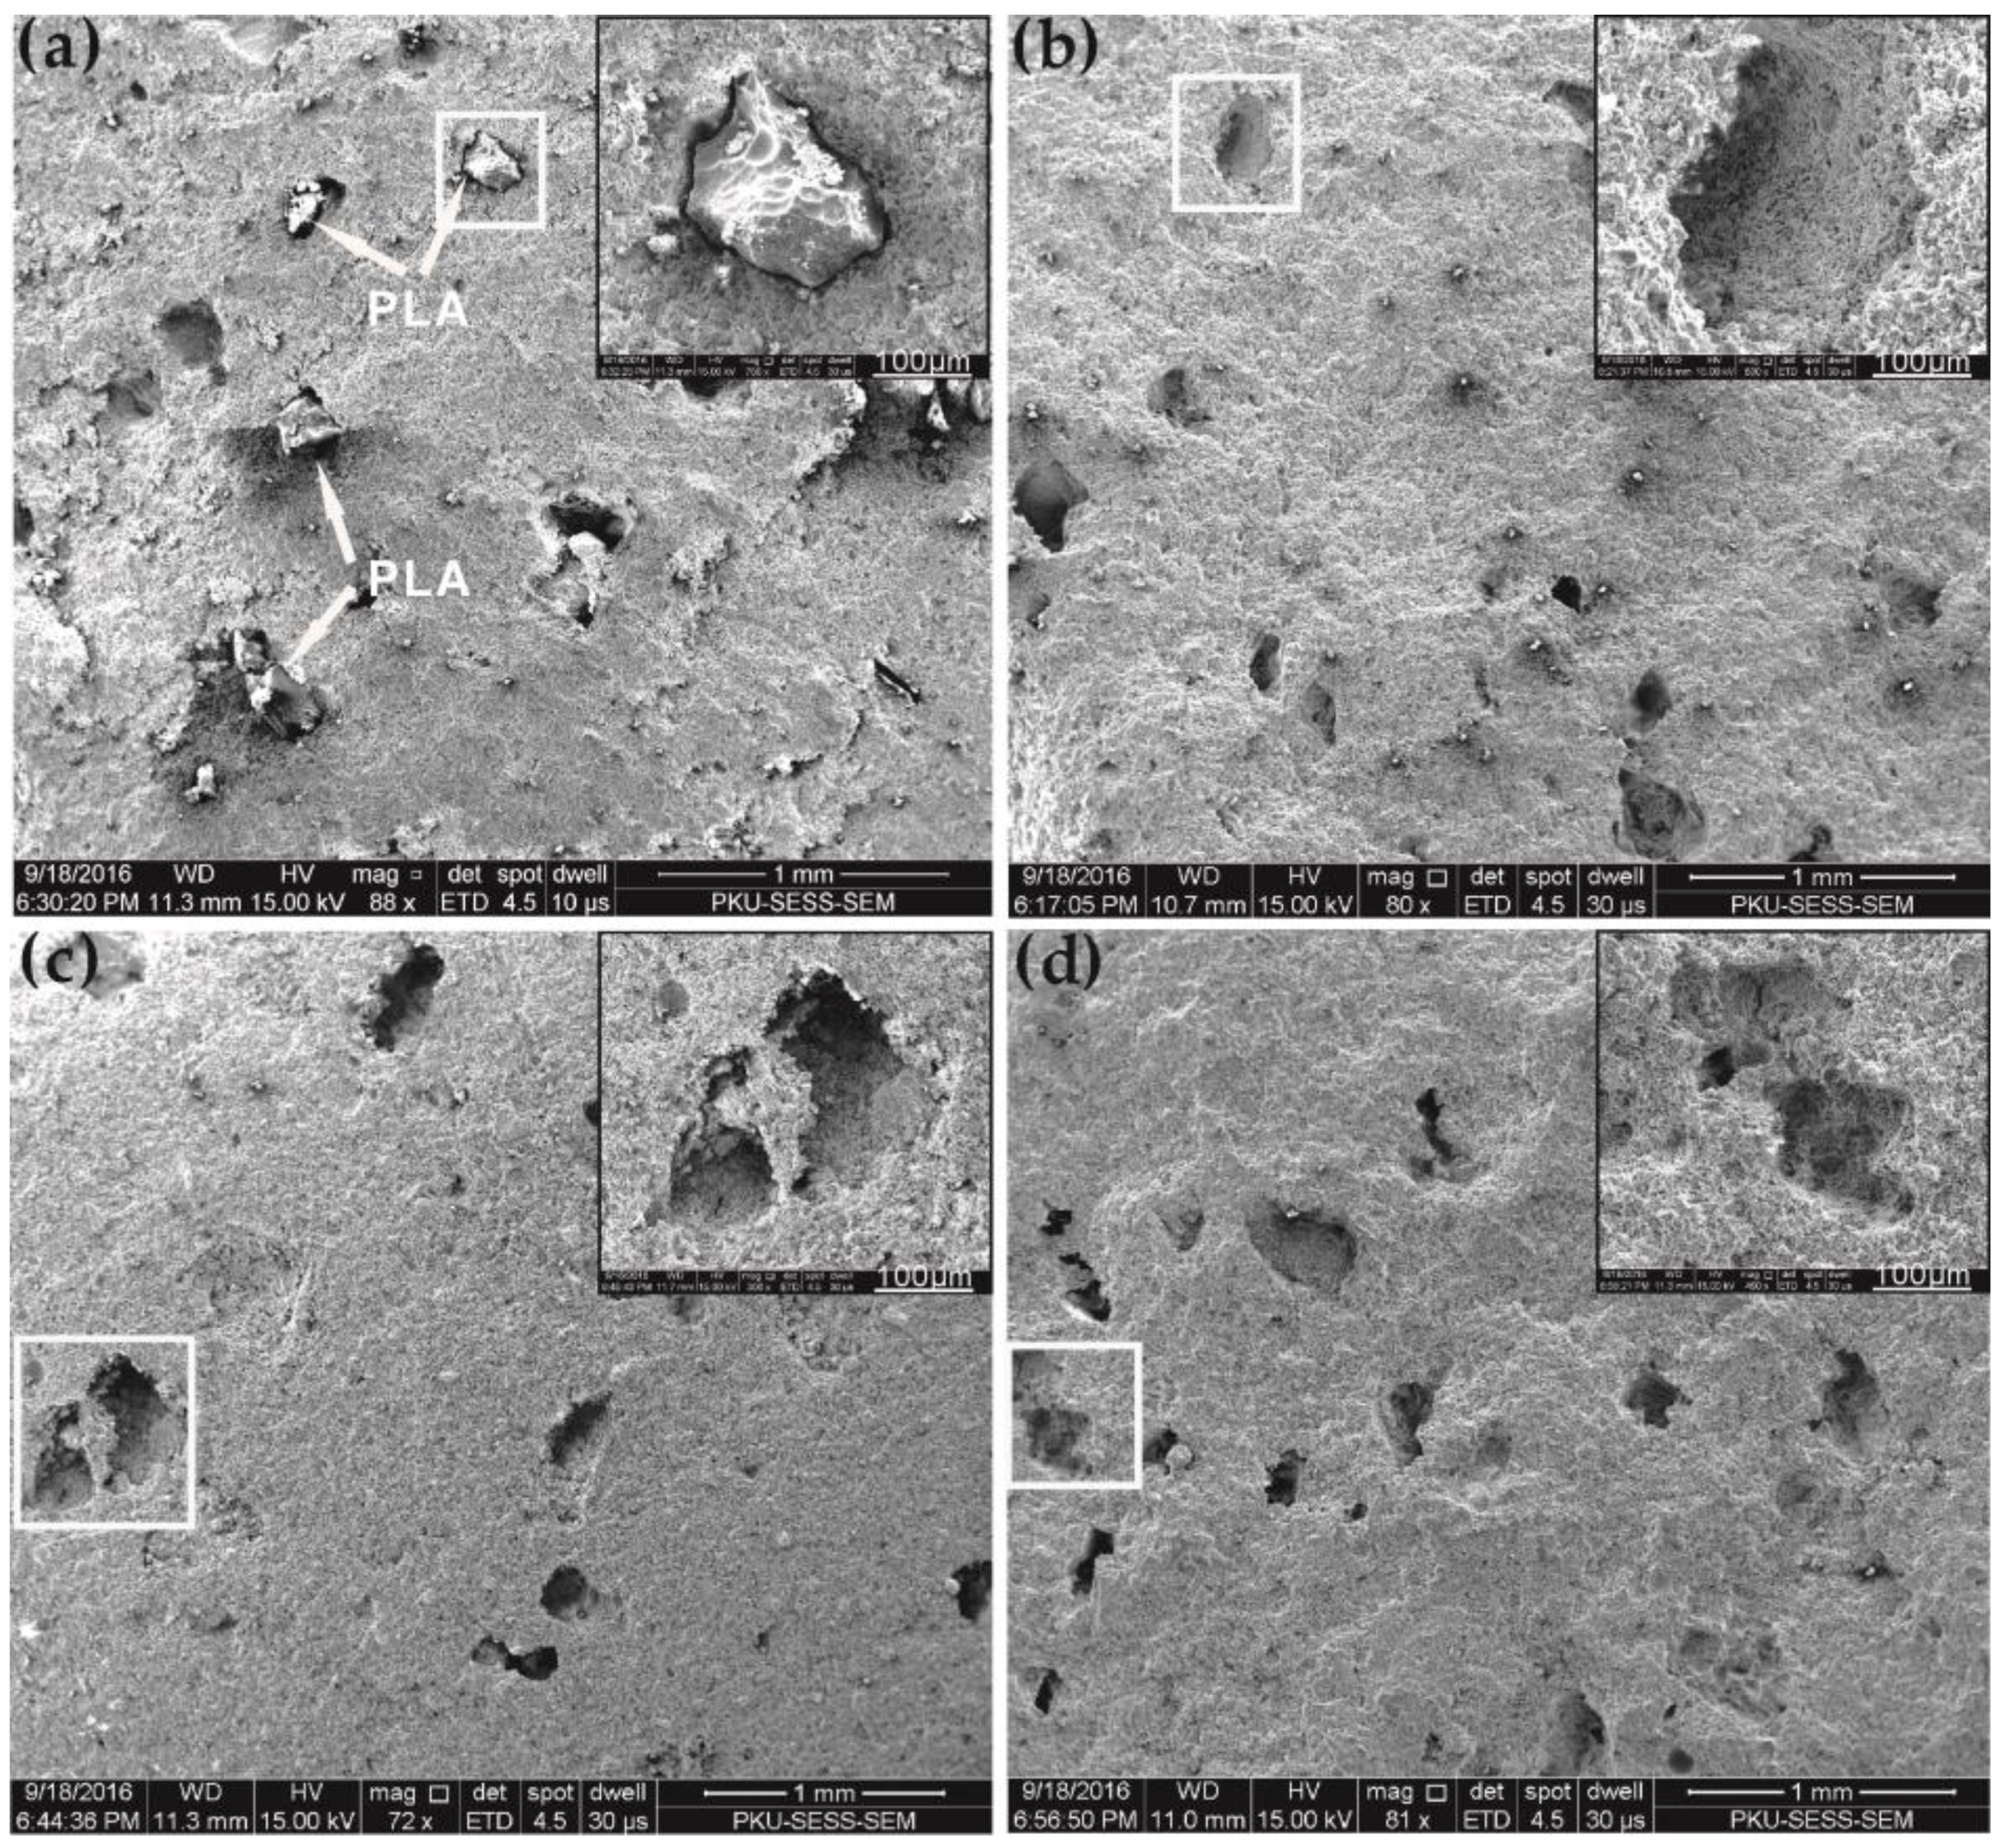
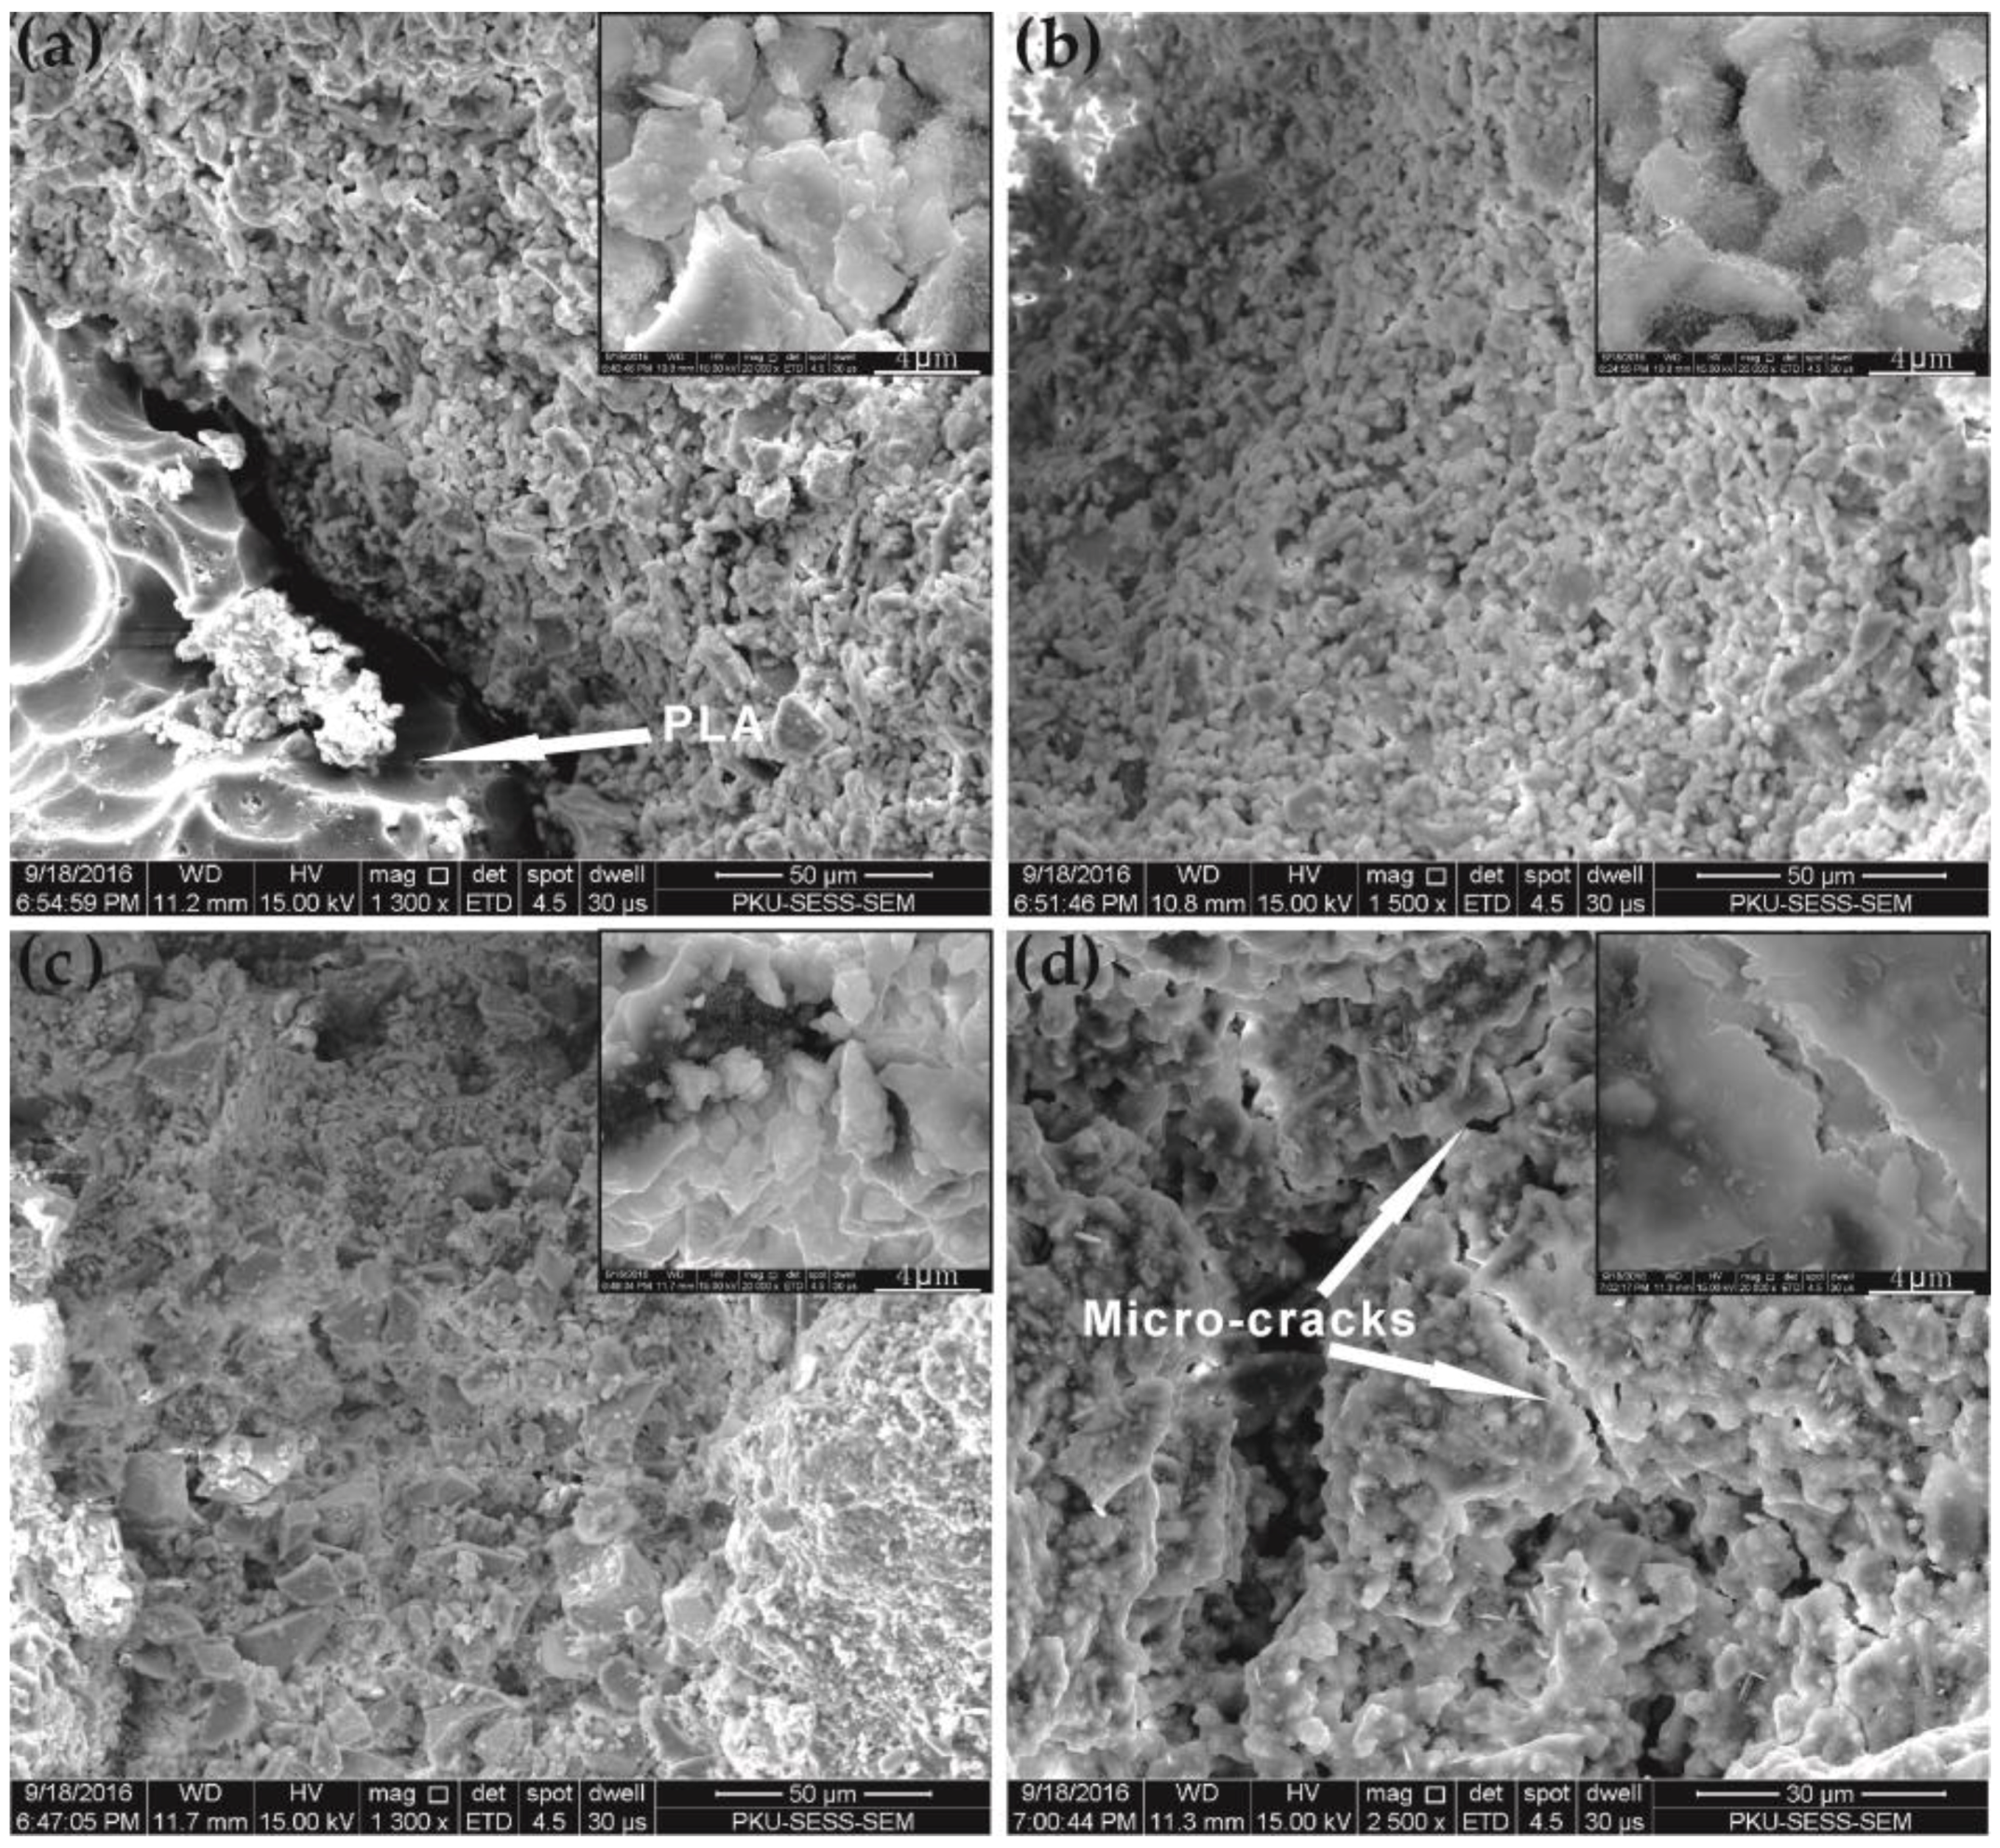
3.7. Self-Degradation

To observe the self-degradation, the 200 °C-heated samples of SDTSM were immersed in water for 2 h and 24 h. Then the water-immersed specimens were cut into pieces and observed under a polarizing microscope and SEM. The compressive strength of the samples immersed in water for different times was measured to assess the level of degradation.
Figure 9 shows the images of section of 200 °C-heated samples after immersed in water for 2 h. The amount of pores in SDTSM increases with the increasing PLA dosage. Figure 10 shows the images of the section of the 200 °C-heated samples after immersed in water for 24 h. The images illustrate that after the immersing period for 24 h, cracks appeared in SDTSM specimens, compared to the specimens immersed for 2 h, indicating that the self-degradation level of cement increased with the extension of immersing-time. However, contrary to SDTSMs with PLA, the specimens of the control are dense, no matter immersed in water for 2 h or for 24 h.
Figure 11 shows the compressive strength of the control and SDTSMs with different PLA dosages after 200 °C-heated, immersed in water for 2 h and 24 h. All of the samples show declines in compressive strength after different immersing periods compared to the 200 °C-heated. SDTSM without PLA presents a reduction in compressive strength of 15.14% and 24.77% compared to the 200 °C-heated specimens, after immersed in water for 2 h and 24 h, respectively. The reduction of SDTSMs with 2% PLA is 35.75% and 56.73%, respectively. The reduction extent of cement immersed in water for 2 h and 24 h increased as the addition of PLA, revealing that PLA promoted the self-degradation of SDTSM.
With the addition of 2% and 8% PLA, SDTSM showed lower viscosity and larger fluidity. However, increasing the PLA dosage decreased the compressive strength of the 85 °C-cured cement. The compressive strength of 85 °C-cured cement should be kept high enough to plug fractures and resume drilling operation. In addition, the compressive strength of 200 °C-heated SDTSM with 2% PLA immersed in water for 24 h decreased by 56.73%, when compared to the 200 °C-heated specimen, suggesting the significant effect of 2% PLA on the self-degradation of SDTSM. Therefore the optimum dosage of PLA is 2%, which can make the cement self-degrade to disintegrate for production, and obtain a larger 85 °C-cured compressive strength to resume drilling.

3.8. Self-Degradation Mechanism

As shown in Figure 12a, the PLA particles distribute in the cement, after 85 °C-curing, besides, there are some pores as the particles were peeled off the SEM samples during the preparation. However, these particles can’t be observed in Figure 12b–d, after the 200 °C-heating. As the melting temperature of PLA is 155~165 °C (as shown in Table 1), it melted during the period of 200 °C-heating. Meanwhile, the thermal decomposition of PLA produced γ-butyrolactone, o-xylene, hexyl alcohol and 3-methylpent-1-en-3-ol, all of which are in gaseous states, when the temperature was above 200 °C, thus created a large amount of pores in cement. The amount of the pores increases as the increase of PLA dosage, as shown in Figure 9 and Figure 10. Since the volume of water added in to cement was constant when preparing the samples, the pores attributed to the evaporation of the water is constant. The significant increase of the amount of the pores resulted from the PLA dosage increased.
High strength is related to a compact microstructure, therefore, a loose microstructure results in decreasing mechanical properties. The fact that porosity has significant effects on the cement strength has been reported in many references. Habib et al. [48] found that increasing dosages of melamine formaldehyde sulfanilate and cyclohexanone formaldehyde sulfonate led to a decrease in the total porosity of the resulting cement pastes, and consequently the compressive strength value increased. Zhang et al. [49] reported that the compressive strength of alkali-activated cement decrease was almost linear with the increasing total porosity at the studied range. Huang et al. [50] reported that the strength loss of limestone powder-incorporated mortar increased in comparison with Portland cement mortar, as a result of an increase in porosity. Norambuena-Contreras et al. [51] reported that the carbon powder waste increased the effective macroporosity of the cement paste, and weakened the microstructure, thus presented a lower strength resistance. The phenomenon that the compressive strength of 200 °C-heated SDTSM decreases as the PLA dosage increases, since PLA created a large amount of pores when compared with the SDTSM without PLA, supporting the point that porosity makes significant effects on the cement strength.
The greater magnification SEM images of the border of PLA particles and cementitious material (a), the surfaces of the pores in the samples after heated (b) and immersed in water (c), (d), are shown in Figure 13. The microstructures of the cementitious material in (a) and (b) are observed more compact than in (c) and (d), especially than in (d) which has internal micro-cracks. The microstructures of samples which were immersed in water are looser than those non-immersed. Sugama [4] pointed out that the dissolution of abundant CMC and sodium silicate reaction products generated in situ heat in CMC modified sodium silicate-activated slag/Class C fly ash cement, when contacted with water. The high heat release was considered to play a pivotal role in the self-degradation performance of alkali-activated slag/Class C fly ash blend cement.
Besides, some other components in cement are dissolved in water when the cement is in contact with water after 200 °C-heating. We believe that this dissolution process itself should also contribute to the cement degradation. The dissolution process may lead to a chemical deterioration, which destroys the microstructures of the cement. References [52,53,54] reported that pure water or ion solutions leads to leaching of calcium from cement-based materials. Calcium leaching has a strong impact on their microstructure because of the dissolution of hydrated phases, and reduces the cement strength by perforating a highly eroded microstructure.
In addition, the many more pores generated by PLA made the water impregnate into cement more easily (shown in Figure 8), which made the dissolution progress faster, and then destroyed the cement microstructure, thus facilitating cement degradation. The dissolution continued as the time was extended, with the destruction of cement microstructure, as reflected by the continuous decrease of the compressive strength.

4. Conclusions

This paper was aimed at studying the potential of PLA for improving the fluidity and further promoting the self-degradation of SDTSM for geothermal wells, and the effect of PLA on the SDTSM performance. The conclusions obtained in this paper are as follows:
(1)
The thermal decomposition temperature of PLA declined after treatment with filtrate of SDTSM. The main pyrolysis products of PLA are γ-butyrolactone, o-xylene, hexyl alcohol and 3-methylpent-1-en-3-ol.
(2)
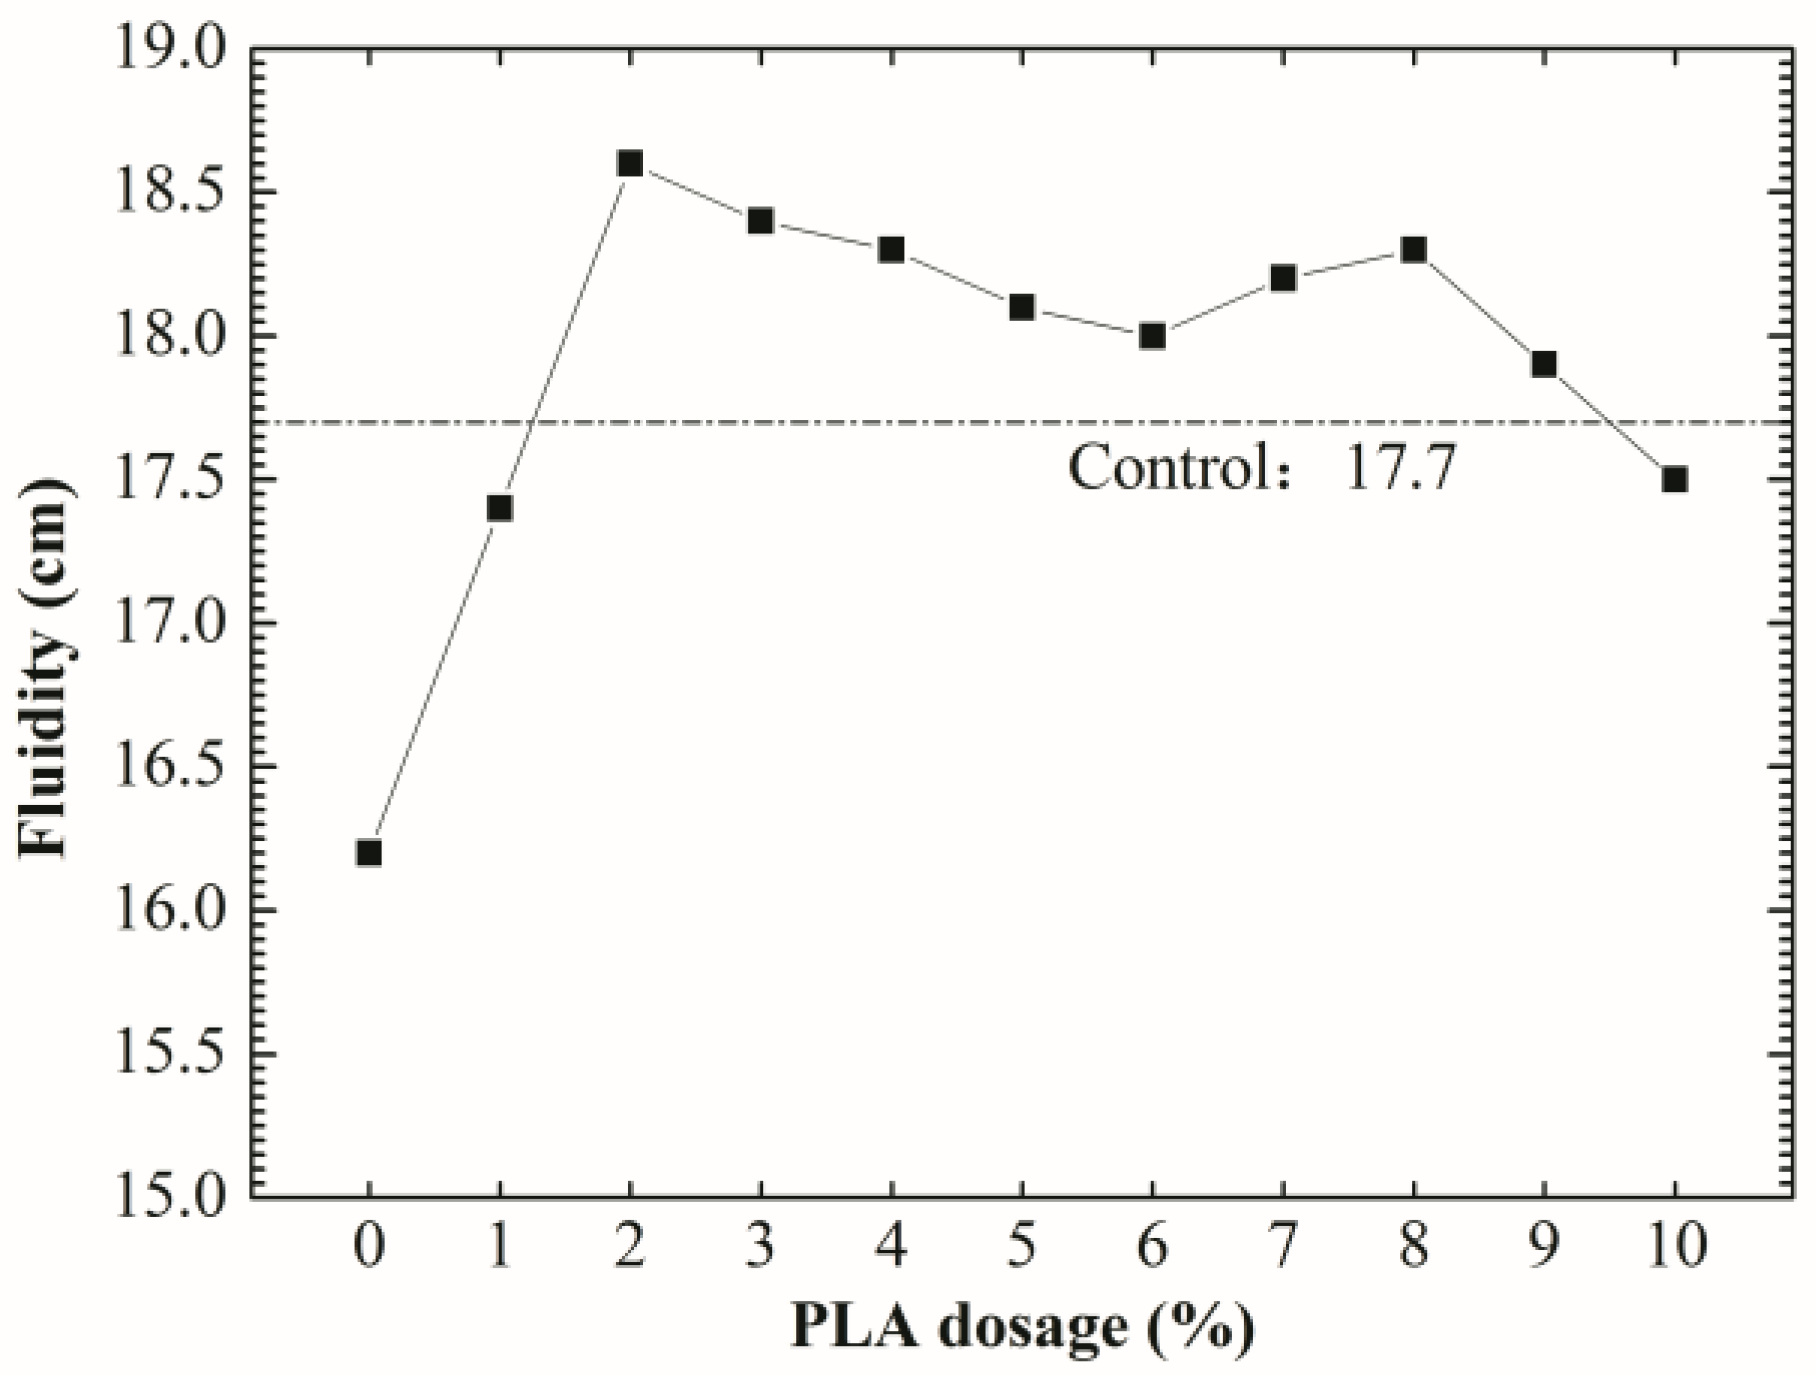
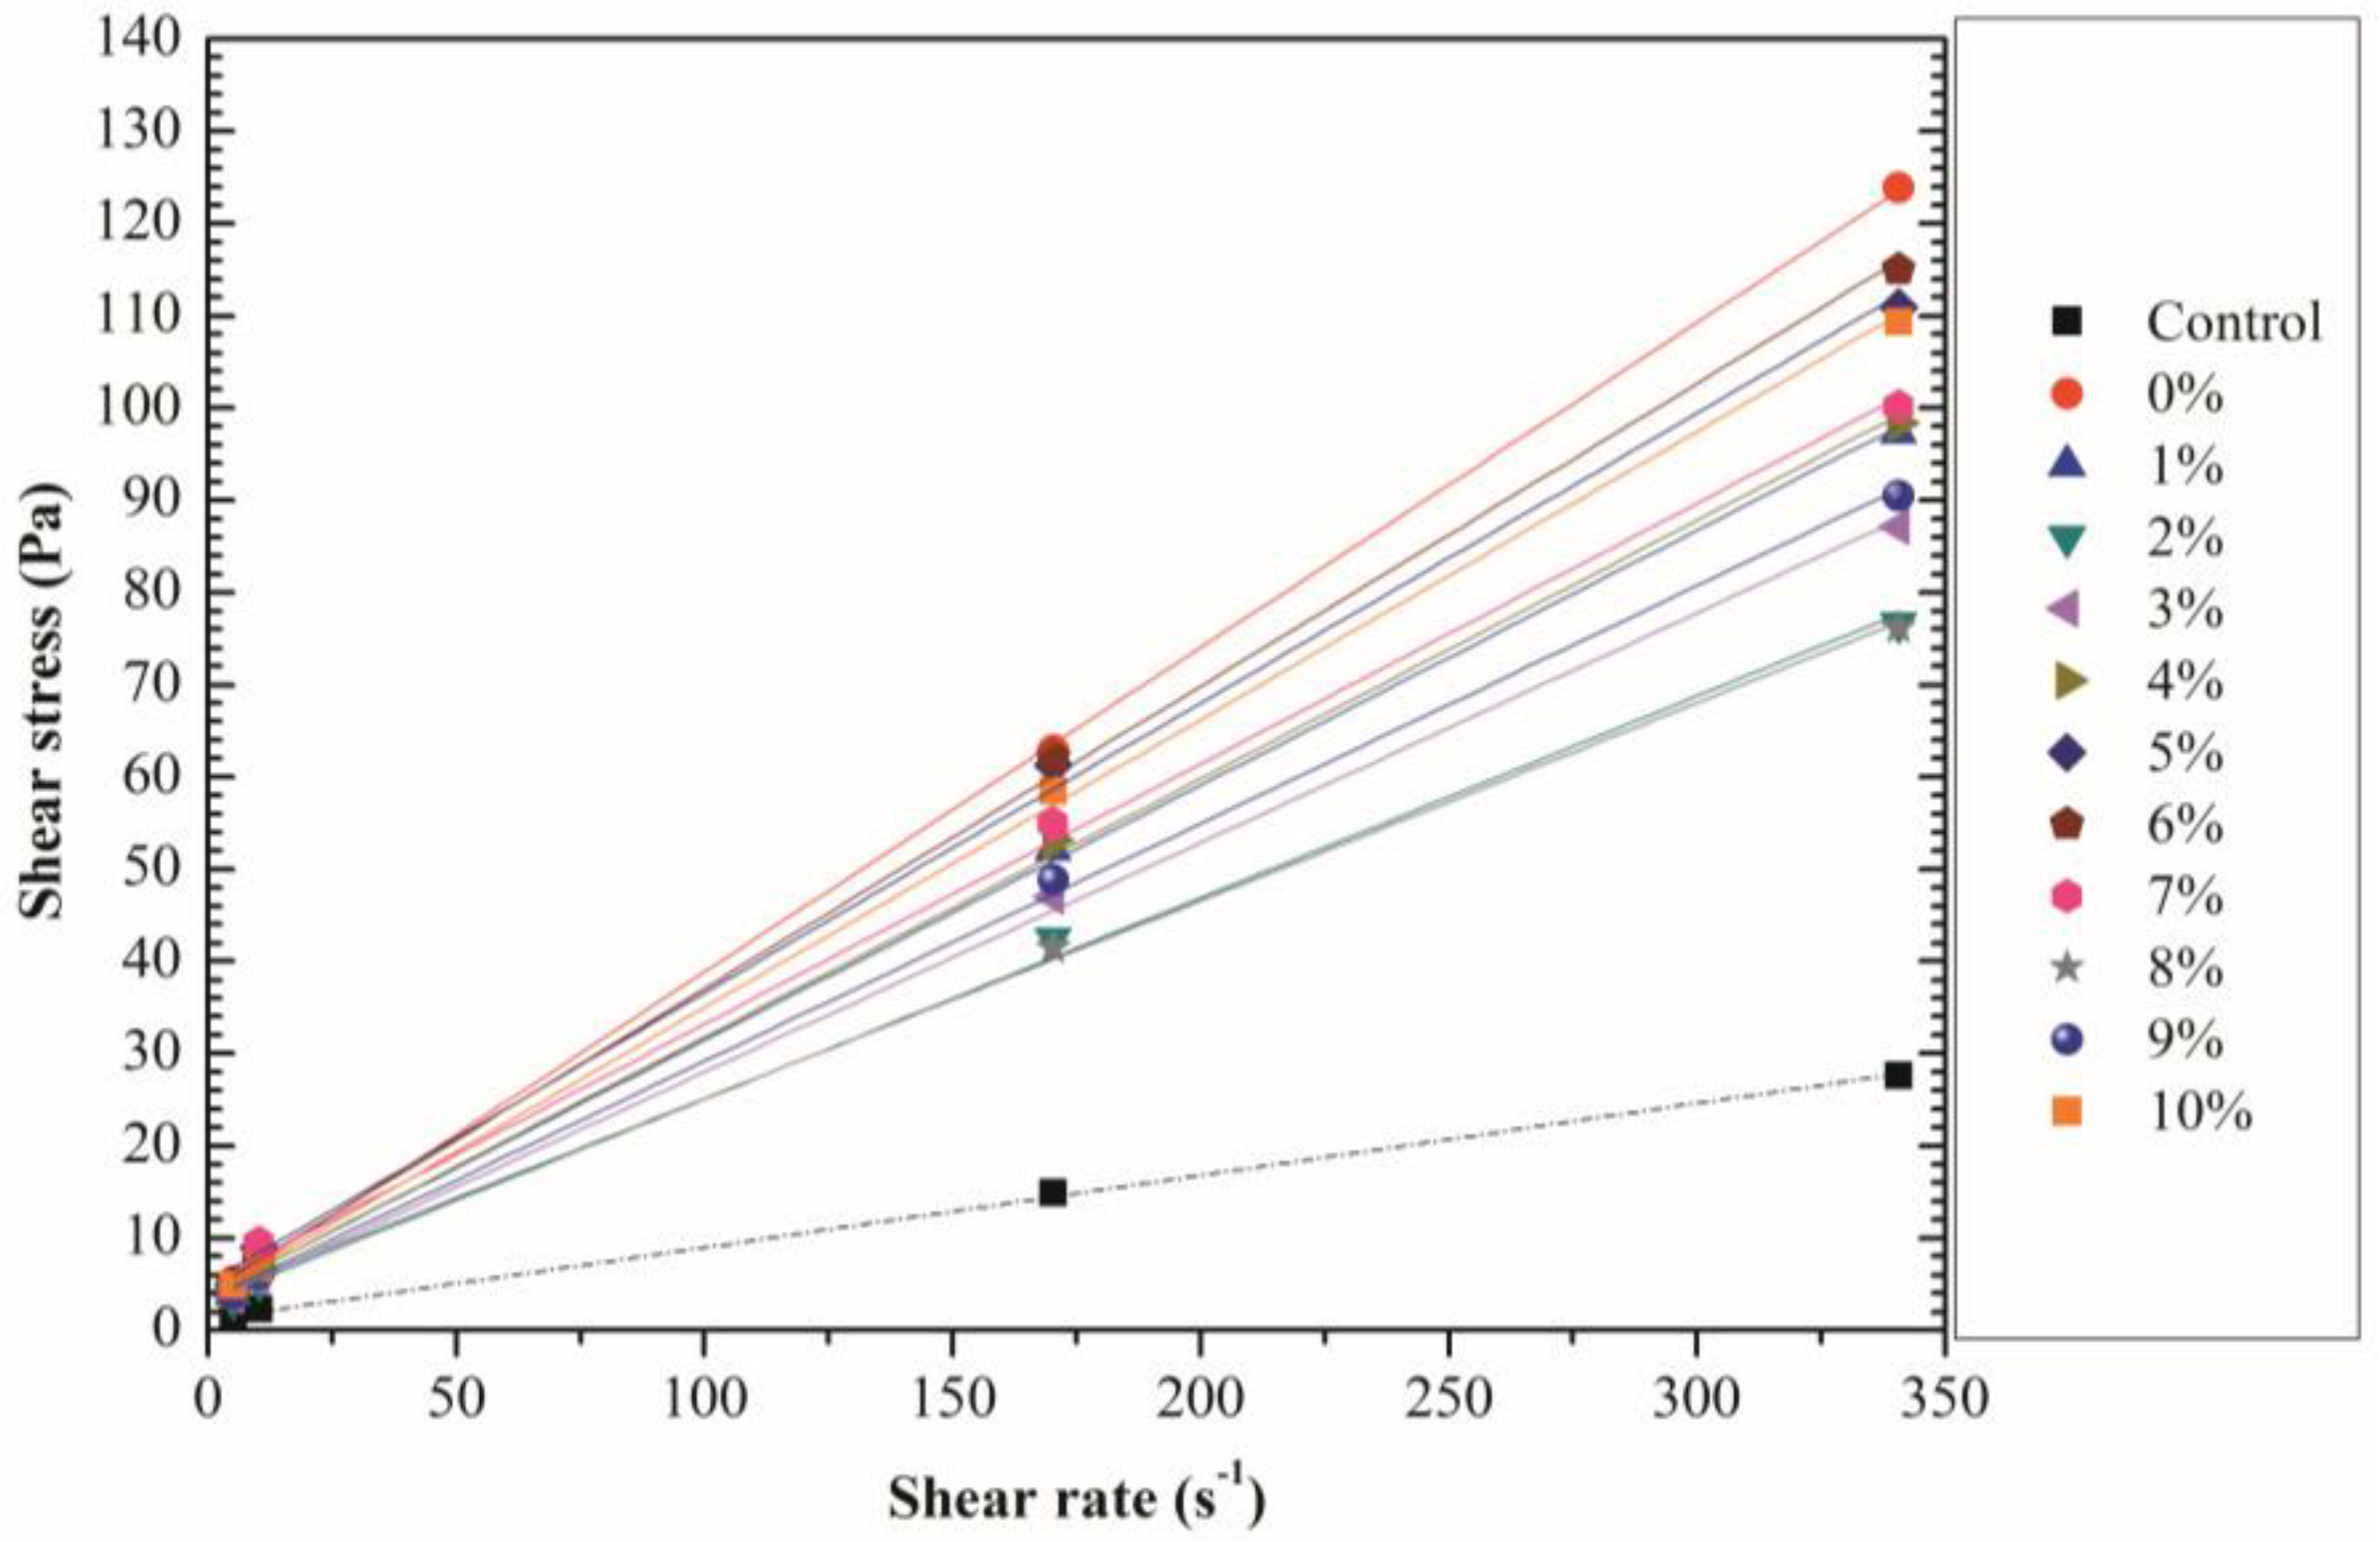
The optimum PLA dosage is 2%. The addition of PLA increased the fluidity and reduced the viscosity of SDTSM, thus improving its rheological and pumping properties. 2% PLA enhanced the level of self-degradation, and ensured the SDTSM obtain a relatively larger 85 °C compressive strength to resume drilling.
(3)
PLA or CMC have a small effect on the types of hydrated products of the 85 °C-cured alkali activated slag/Class C fly ash cement, however, the hydrated products decrease as the dosage of PLA increases.
(4)
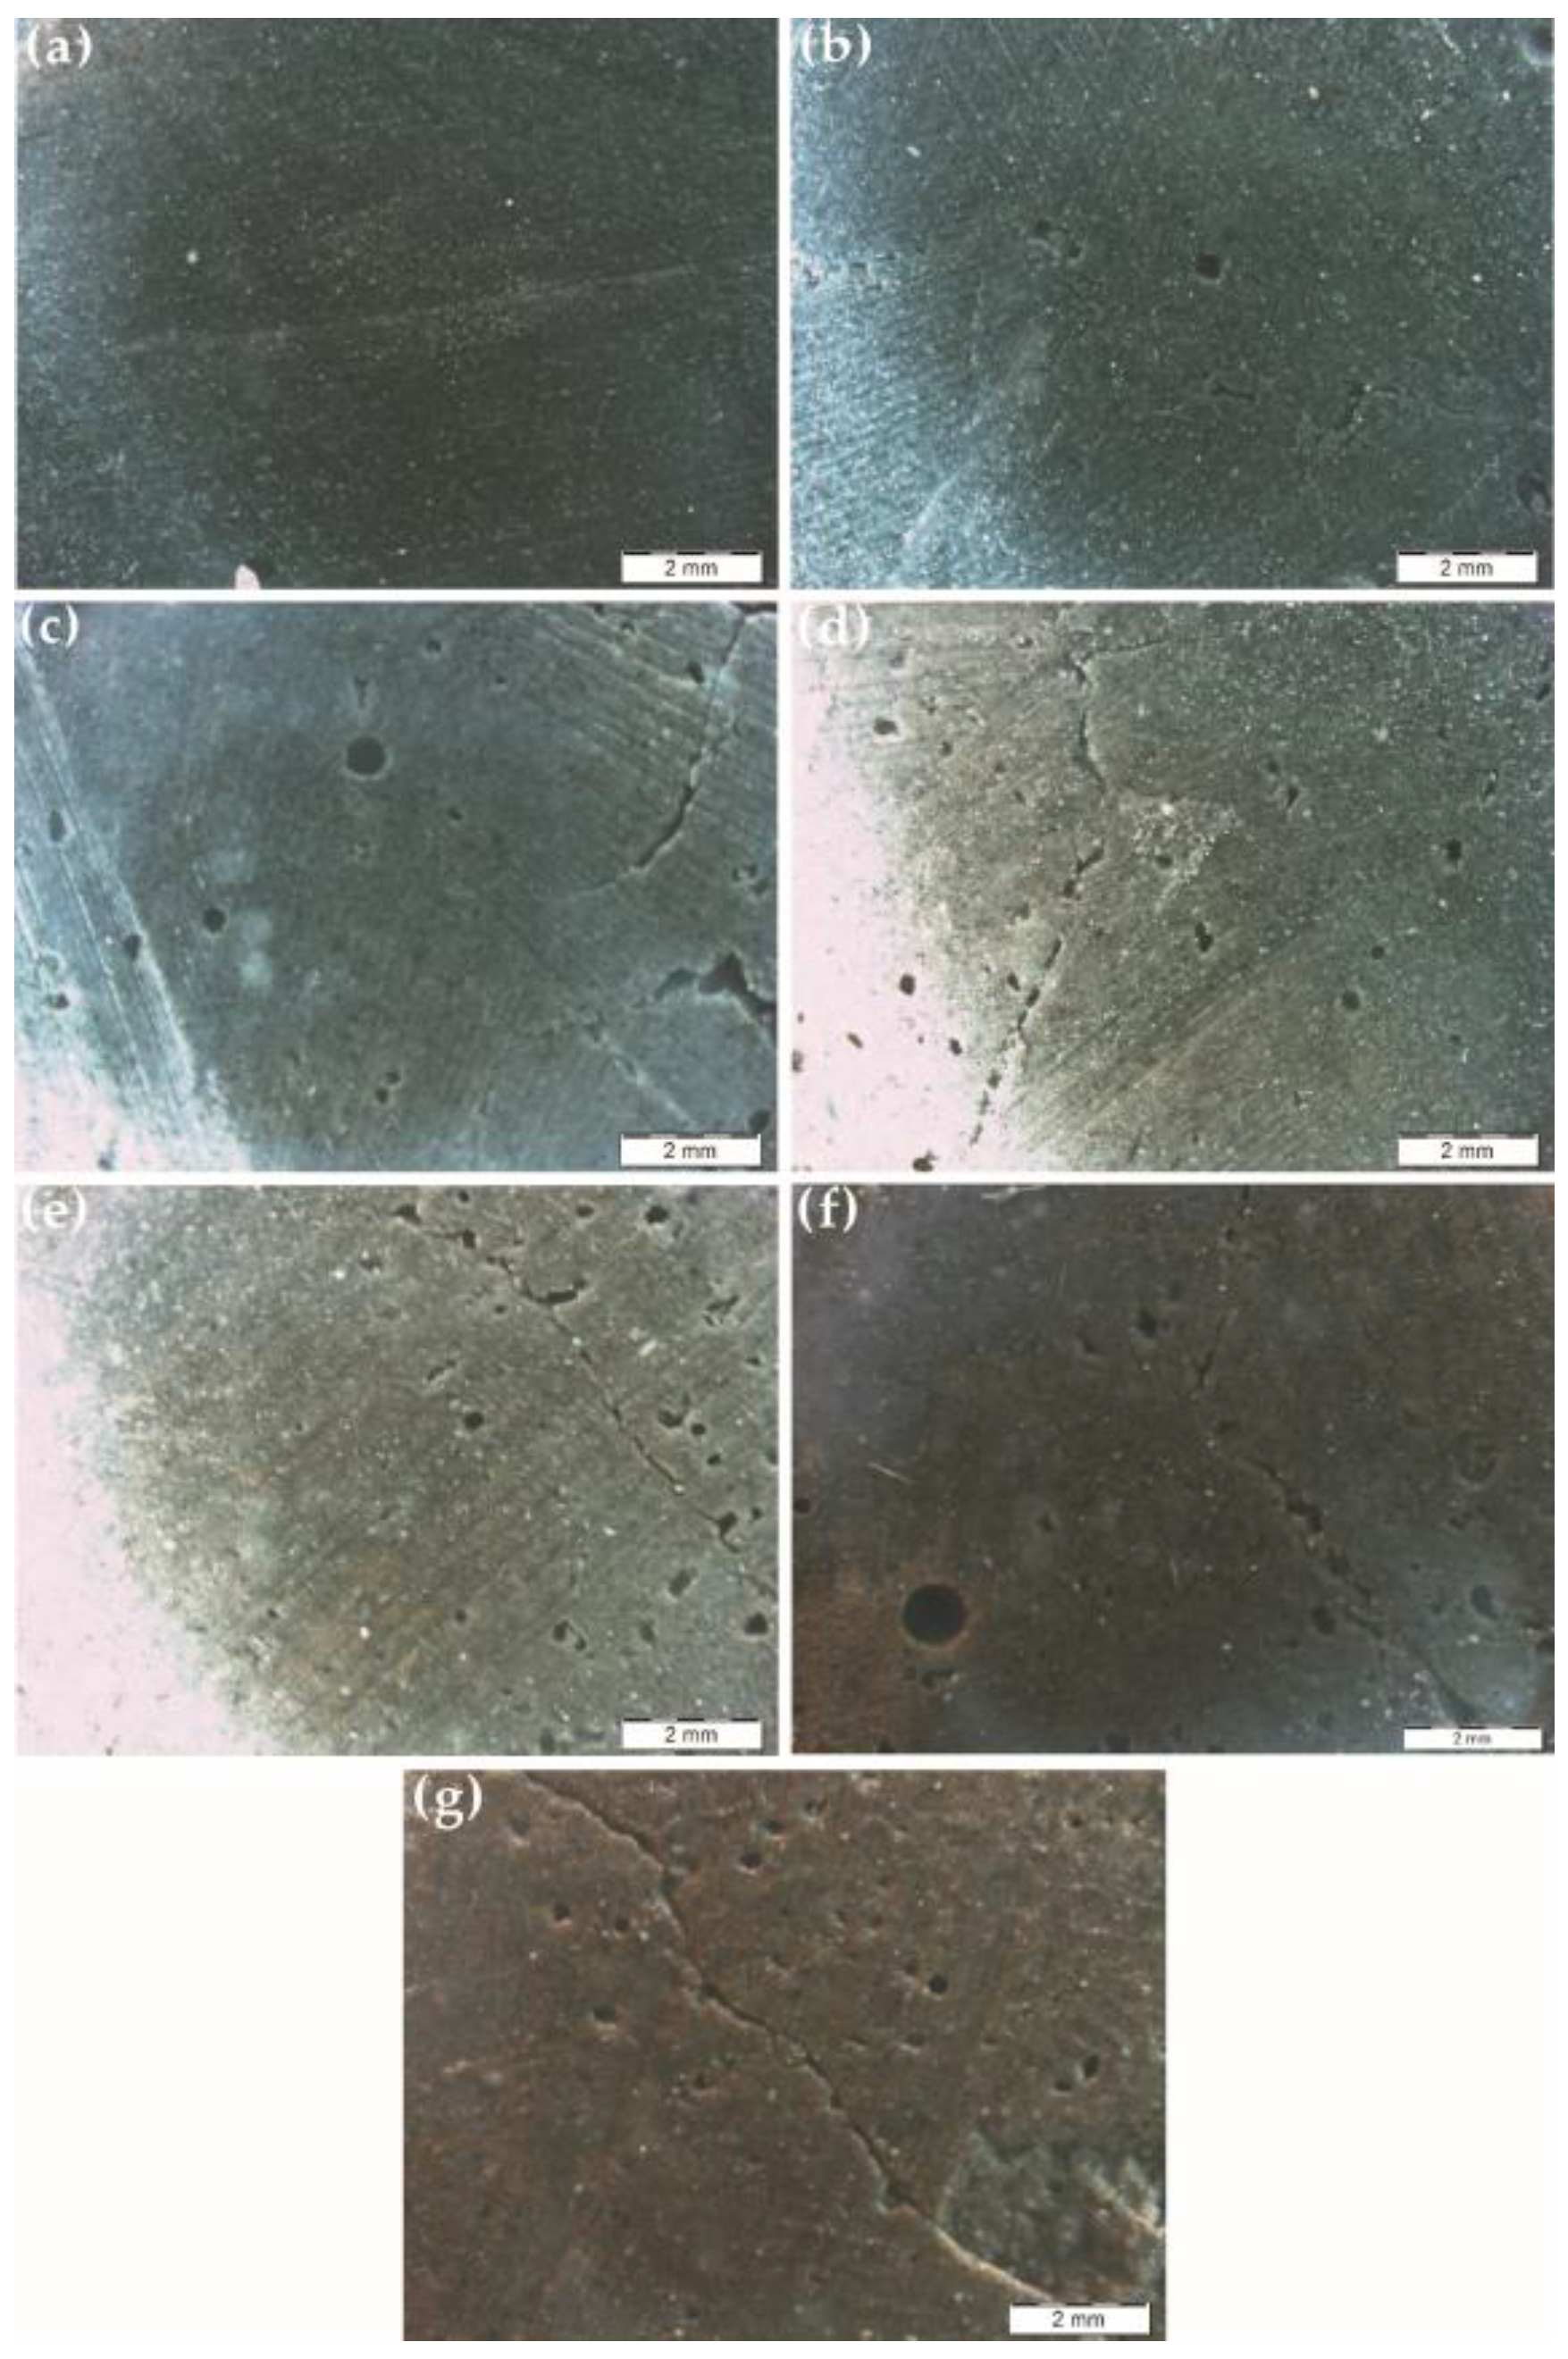
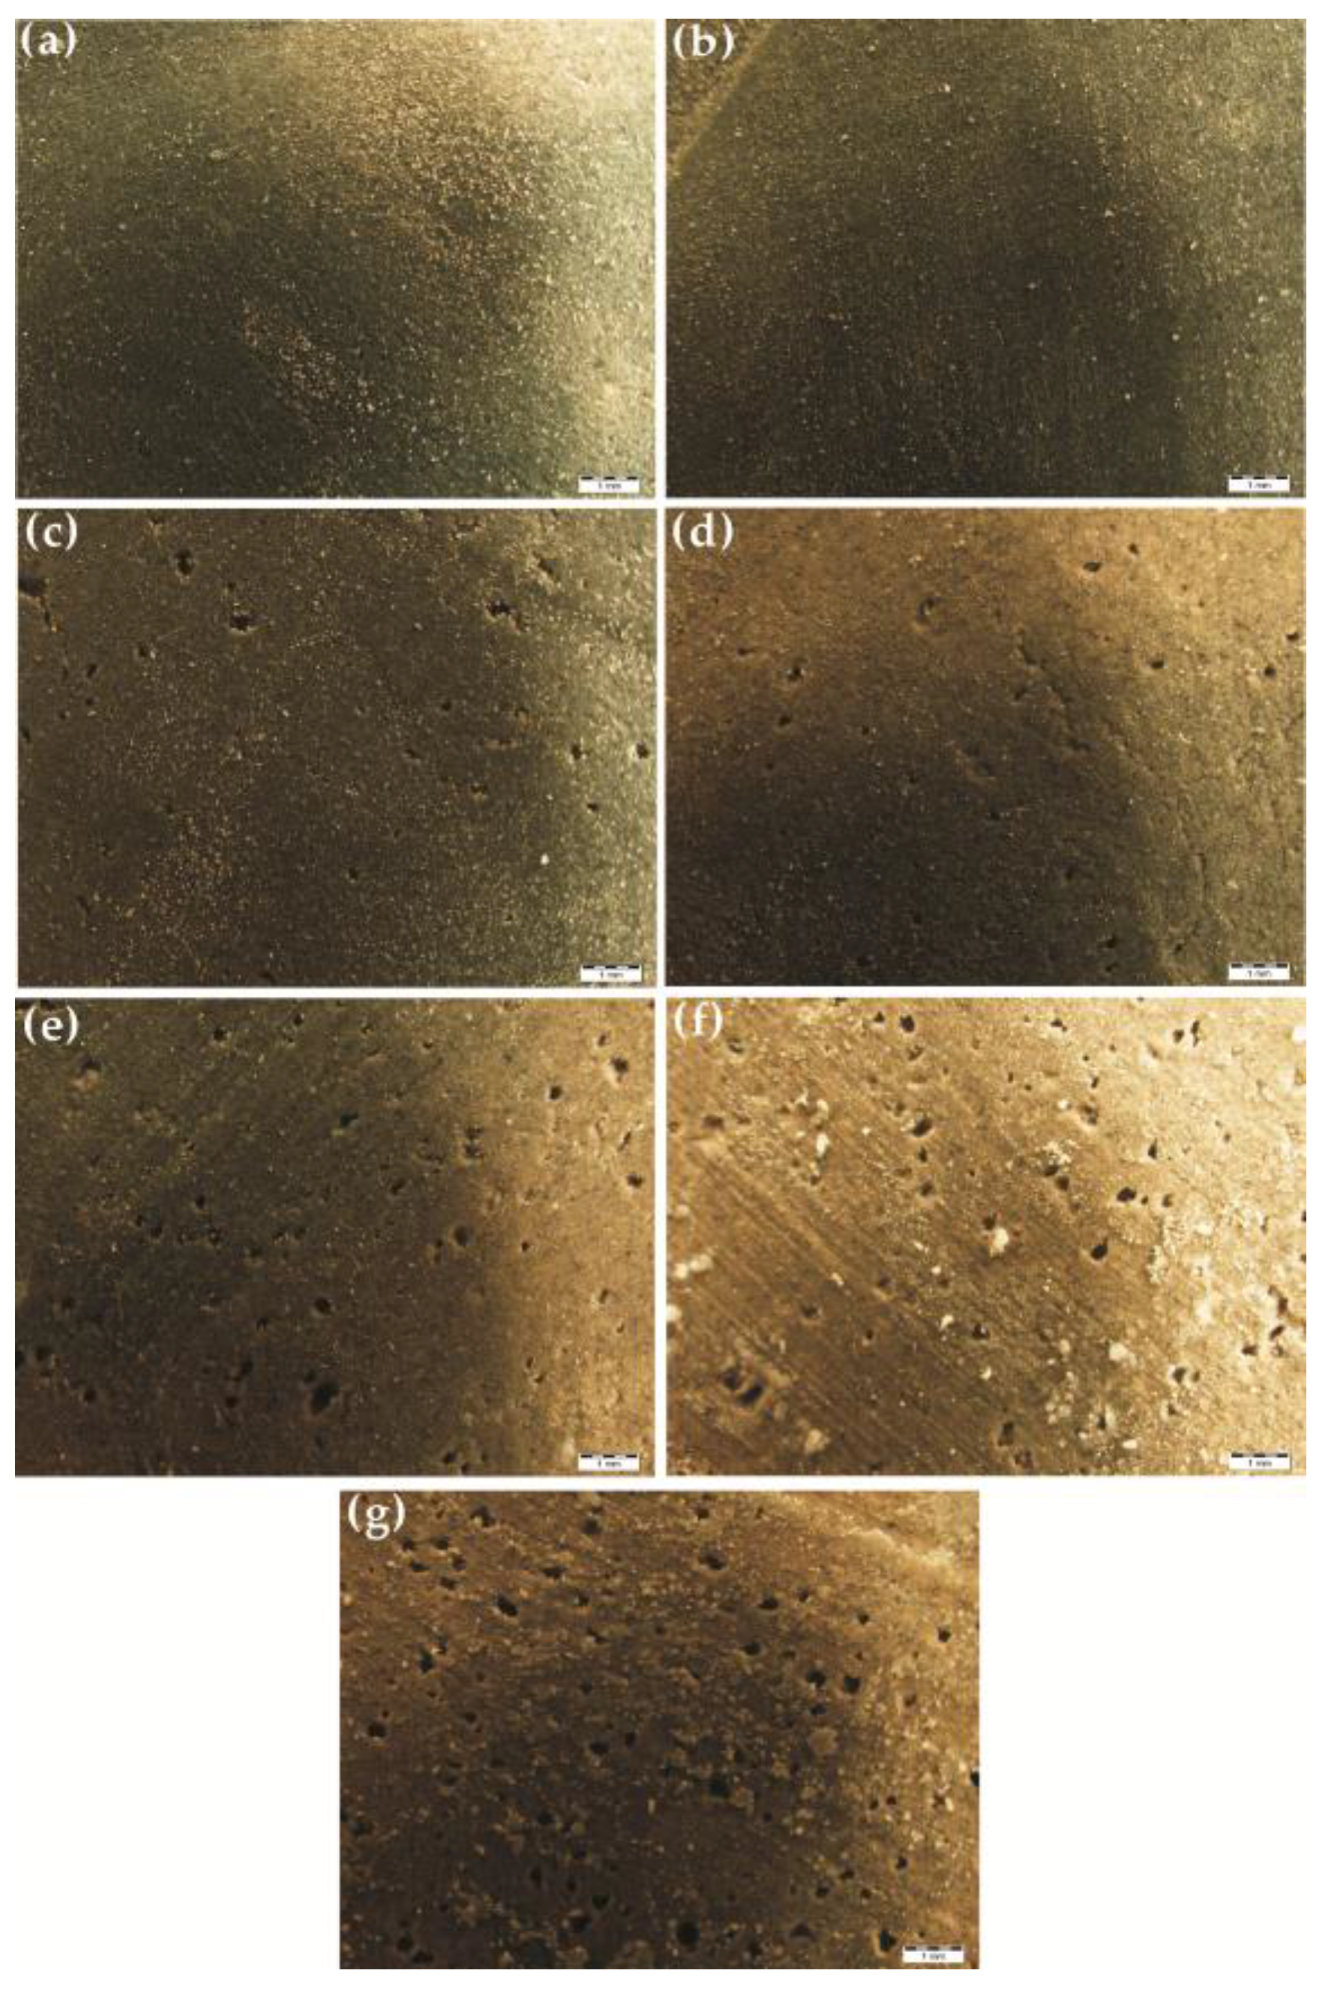
The existence of the large amount of pores generated by melting and thermal decomposition is the major reason for PLA enhancement of the self-degradation level of SDTSM. This works in two ways: first, the large amount of pores leads to a looser microstructure which results in lower strength; second, these pores make the water impregnate the cement more easily, and this made the dissolution progress faster to generate heat and destroy the microstructure of the cement, ultimately, facilitating the self-degradation.
As future work, considering that PLA decreased the compressive strength of 85 °C-cured SDTSM, we will try to enhance the strength by replacing PLA powders with fiber or increasing the dosage of sodium silicate. Besides, the rheological behaviors of SDTSMs should be investigated more deeply.

Acknowledgments

The presented data are the result of the project supported by National Natural Science Foundation of China (Grant No. 41572361) of “Design and Preparation of Green Environmental Friendly of Self-degradable Foamed Temporary Cementitious Sealing Materials for Geothermal Reservoir”.

Author Contributions

The contributions of each author are as follows: Huijing Tan performed the main experiments, analyzed the experimental results and wrote the manuscript. Xiuhua Zheng conceived and designed the experiments, provided guidance and reviewed the manuscript. Chenyang Duan analyzed partial experimental results. Bairu Xia supervised the research throughout the whole process, reviewed the paper and gave advices about this manuscript. All authors have read and approved the final manuscript.

Conflicts of Interest

The authors declare no conflict of interest.

References

  1. Olasolo, P.; Juarez, M.C.; Morales, M.P.; D’Amico, S.; Liarte, I.A. Enhanced geothermal systems (EGS): A review. Renew. Sustain. Energy Rev. 2016, 56, 133–144. [Google Scholar] [CrossRef]
  2. Preisig, G.; Eberhardt, E.; Gischig, V.; Roche, V.; Van der Baan, M.; Valley, B.; Kaiser, P.K.; Duff, D.; Lowther, R. Development of connected permeability in massive crystalline rocks through hydraulic fracture propagation and shearing accompanying fluid injection. Geofluids 2015, 15, 321–337. [Google Scholar] [CrossRef]
  3. Zhang, Y.; Guo, L.; Li, Z.; Yu, Z.; Xu, T.; Lan, C. Electricity generation and heating potential from enhanced geothermal system in Songliao Basin, China: Different reservoir stimulation strategies for tight rock and naturally fractured formations. Energy 2015, 93, 1860–1885. [Google Scholar] [CrossRef]
  4. Sugama, T.; Pyatina, T. Effect of sodium carboxymethyl celluloses on water-catalyzed self-degradation of 200 °C-heated alkali-activated cement. Cem. Concr. Compos. 2015, 55, 281–289. [Google Scholar] [CrossRef]
  5. Sugama, T.; Butcher, T.; Brothers, L. Temporary Cementitious Sealing Materials. In Proceedings of the Geothermal Resources Council 2011 Annual Meeting, San Diego, CA, USA, 23–26 October 2011.
  6. Li, F.Y. Experiments Research on Self-Degradable Slag/Fly Ash Cement for EGS Geothermal Wells. Master’s Thesis, China University of Geosciences (Beijing), Beijing, China, 2015. [Google Scholar]
  7. Gao, X.; Xu, Q.L.; Brouwers, H.J.H. Characterization of alkali activated slag-fly ash blends containing nano-silica. Constr. Build. Mater. 2015, 98, 397–406. [Google Scholar] [CrossRef]
  8. Puertas, F.; Fernández-Jiménez, A. Mineralogical and microstructural characterisation of alkali-activated fly ash/slag pastes. Cem. Concr. Compos. 2003, 25, 287–292. [Google Scholar] [CrossRef]
  9. Kastner, U.; Hoffmann, H.; Donges, R.; Hilbig, J. Structure and solution properties of sodium carboxymethyl cellulose. Colloids Surf. 1997, 123, 307–328. [Google Scholar] [CrossRef]
  10. Akther, S.; Hwang, J.; Lee, H. Sedimentation characteristics of two commercial bentonites in aqueous suspensions. Clay Miner. 2008, 43, 449–457. [Google Scholar] [CrossRef]
  11. Vipulanandan, C.; Mohammed, A. Smart cement rheological and piezoresistive behavior for oil well applications. J. Petrol. Sci. Eng. 2015, 135, 50–58. [Google Scholar] [CrossRef]
  12. Feng, S.Q.; Zhang, N.W.; Ren, J. Thermal Degradation and Stability of Poly Lactic Acid. Plastics 2011, 40, 59–62. [Google Scholar]
  13. Habraken, W.J.E.M.; Liao, H.B.; Zhang, Z.; Wolke, J.G.C.; Grijpma, D.W.; Mikos, A.G.; Feijen, J.; Jansen, J.A. In vivo degradation of calcium phosphate cement incorporated into biodegradable microspheres. Acta Biomater. 2010, 6, 2200–2211. [Google Scholar] [CrossRef] [PubMed]
  14. Zuo, Y.; Yang, F.; Wolke, J.G.C.; Li, Y.; Jansen, J.A. Incorporation of biodegradable electrospun fibers into calcium phosphate cement for bone regeneration. Acta Biomater. 2010, 6, 1238–1247. [Google Scholar] [CrossRef] [PubMed]
  15. Krueger, R.; Seitz, J.; Ewald, A.; Bach, F.; Groll, J. Strong and tough magnesium wire reinforced phosphate cement composites for load-bearing bone replacement. J. Mech. Behav. Biomed. Mater. 2013, 20, 36–44. [Google Scholar] [CrossRef] [PubMed]
  16. Dharmalingam, S.; Hayes, D.G.; Wadsworth, L.C.; Dunlap, R.N.; DeBruyn, J.M.; Lee, J.; Wszelaki, A.L. Soil Degradation of Polylactic Acid/Polyhydroxyalkanoate-Based Nonwoven Mulches. J. Polym. Environ. 2015, 23, 302–315. [Google Scholar] [CrossRef]
  17. Ingrao, C.; Tricase, C.; Cholewa-Wojcik, A.; Kawecka, A.; Rana, R.; Siracusa, V. Polylactic acid trays for fresh-food packaging: A Carbon Footprint assessment. Sci. Total Environ. 2015, 537, 385–398. [Google Scholar] [CrossRef] [PubMed]
  18. Halliburton Energy Services Inc. Re-Fracturing a Fracture Stimulated Subterranean Formation. Patent WO2,015,105,488 (A1), 9 January 2014. [Google Scholar]
  19. Liang, F.; Reddy, B.R.; Nguyen, P.D. Tailoring Thermal, Mechanical, and Physical Properties of Degradable Polymers for Downhole Applications. In Proceedings of the 2014 AADE Fluids Technical Conference and Exhibition, Houston, TX, USA, 15–16 April 2014.
  20. Halliburton Energy Services Inc. Wellbore Servicing Materials and Methods of Making and Using Same. Patent US8714249B1, 6 May 2014. [Google Scholar]
  21. General Administration of Quality Supervision; Inspection and Quarantine of the People’s Republic of China; Standardization Administration of the People’s Republic of China. Method for Testing Uniformity of Concrete Admixture, 2nd ed.Standards Press of China: Beijing, China, 2012; pp. 15–16.
  22. American Petroleum Institute. Recommended Practice for Testing Well Cements, 2nd ed.; API Publishing Services: Washington, DC, USA, 2013; pp. 59–65. [Google Scholar]
  23. General Administration of Quality Supervision; Inspection and Quarantine of the People’s Republic of China. Standardization Administration of the People’s Republic of China, Oil Well Cement, 3rd ed.Standards Press of China: Beijing, China, 2005; pp. 13–16.
  24. National Energy Administration. Performance Requirements for Oil Well Cement Slurries, 2nd ed.Petroleum Industry Press: Beijing, China, 2010; pp. 1–3.
  25. Hakamy, A.; Shaikh, F.U.A.; Low, I.M. Characteristics of nanoclay and calcined nanoclay-cement nanocomposites. Comp. B Eng. 2015, 78, 174–184. [Google Scholar] [CrossRef]
  26. Olewnik-Kruszkowska, E. Influence of the type of buffer solution on thermal and structural properties of polylactide-based composites. Polym. Degrad. Stab. 2016, 129, 87–95. [Google Scholar] [CrossRef]
  27. Stloukal, P.; Kalendova, A.; Mattausch, H.; Laske, S.; Holzer, C.; Koutny, M. The influence of a hydrolysis-inhibiting additive on the degradation and biodegradation of PLA and its nanocomposites. Polym. Test. 2015, 41, 124–132. [Google Scholar] [CrossRef]
  28. Zhang, M.; Cui, C.N.; Song, J.; Qiu, J.H. Analysis of the Factors Influencing Degradability and Degradation Mechanism of Polylactic Acid. Pack Eng. 2008, 29, 16–19. [Google Scholar]
  29. Zhang, X.; Espiritu, M.; Bilyk, A.; Kurniawan, L. Morphological behavior of poly (lactic acid) during hydrolytic degradation. Polym. Degrad. Stab. 2008, 93, 1964–1970. [Google Scholar] [CrossRef]
  30. Cam, D.; Marucci, M. Influence of residual monomers and metals on poly (l-lactide) thermal stability. Polymer 1997, 38, 1879–1884. [Google Scholar] [CrossRef]
  31. Zhang, S.G. Handbook of the Practical Fine Chemicals, 2nd ed.; Chemical Industry Press: Beijing, China, 1996; p. 513. [Google Scholar]
  32. Zhang, Z.L.; Sui, T.B.; Chen, F.Y.; Wen, S.J.; Shi, H.X.; Wang, J.; Fan, L. Determined therheological properties of HBC cement paste slurry using rotational viscometer. Liaoning Build. Mater. 2005, 1, 18–20. [Google Scholar]
  33. Domone, P.; HsiWen, C. Testing of binders for high performance concrete. Cem. Concr. Res. 1997, 27, 1141–1147. [Google Scholar] [CrossRef]
  34. Assaad, J.J. Correlating water extraction to viscosity variations of injection grouts. Constr. Build. Mater. 2015, 77, 74–82. [Google Scholar] [CrossRef]
  35. Celik, F.; Canakci, H. An investigation of rheological properties of cement-based grout mixed with rice husk ash (RHA). Constr. Build. Mater. 2015, 91, 187–194. [Google Scholar] [CrossRef]
  36. Shang, Y.; Zhang, D.; Yang, C.; Liu, Y.Y.; Liu, Y. Effect of graphene oxide on the rheological properties of cement pastes. Constr. Build. Mater. 2015, 96, 20–28. [Google Scholar] [CrossRef]
  37. Bentz, D.P.; Ferraris, C.F.; Galler, M.A.; Hansen, A.S.; Guynn, J.M. Influence of particle size distributions on yield stress and viscosity of cement-fly ash pastes. Cem. Concr. Res. 2012, 42, 404–409. [Google Scholar] [CrossRef]
  38. Vance, K.; Kumar, A.; Sant, G.; Neithalath, N. The rheological properties of ternary binders containing Portland cement, limestone, and metakaolin or fly ash. Cem. Concr. Res. 2013, 52, 196–207. [Google Scholar] [CrossRef]
  39. Abdalqader, A.F.; Jin, F.; Al-Tabbaa, A. Development of greener alkali-activated cement: Utilisation of sodium carbonate for activating slag and fly ash mixtures. J. Clean. Prod. 2016, 113, 66–75. [Google Scholar] [CrossRef]
  40. Abdalqader, A.F.; Jin, F.; Al-Tabbaa, A. Characterisation of reactive magnesia and sodium carbonate-activated fly ash/slag paste blends. Constr. Build. Mater. 2015, 93, 506–513. [Google Scholar] [CrossRef]
  41. Shi, C.J.; Krivenko, P.V.; Roy, D. Alkali-Activated Cements and Concretes, 1st ed.; Chemical Industry Press: Beijing, China, 2008; pp. 70–74. [Google Scholar]
  42. Kumar, S.; Kumar, R. Mechanical activation of fly ash: Effect on reaction, structure and properties of resulting geopolymer. Ceram. Int. 2011, 37, 533–541. [Google Scholar] [CrossRef]
  43. Avirneni, D.; Peddinti, P.R.T.; Saride, S. Durability and long term performance of geopolymer stabilized reclaimed asphalt pavement base courses. Constr. Build. Mater. 2016, 121, 198–209. [Google Scholar] [CrossRef]
  44. Francis, A.A. Crystallization kinetics of magnetic glass-ceramics prepared by the processing of waste materials. Mater. Res. Bull. 2006, 41, 1146–1154. [Google Scholar] [CrossRef]
  45. Jeon, D.; Jun, Y.; Jeong, Y.; Oh, J.E. Microstructural and strength improvements through the useof Na2CO3 in a cementless Ca(OH)2-activated Class F fly ash system. Cem. Concr. Res. 2015, 67, 215–225. [Google Scholar] [CrossRef]
  46. Thokchom, S.; Ghosh, P.; Ghosh, S. Effect of water absorption, porosity and sorptivity on durability of geopolymer mortars. J. Eng. Appl. Sci. 2009, 4, 28–34. [Google Scholar]
  47. Hossain, M.M.; Karim, M.R.; Hossain, M.K.; Islam, M.N.; Zain, M.F.M. Durability of mortar and concrete containing alkali-activated binder with pozzolans: A review. Constr. Build. Mater. 2015, 93, 95–109. [Google Scholar] [CrossRef]
  48. Habib, A.O.; Aiad, I.; Youssef, T.A.; Abd El-Aziz, A.M. Effect of some chemical admixtures on the physico-chemical and rheological properties of oil well cement pastes. Constr. Build. Mater. 2016, 120, 80–88. [Google Scholar] [CrossRef]
  49. Zhang, Z.H.; Li, L.F.; Ma, X.; Wang, H. Compositional, microstructural and mechanical properties of ambient condition cured alkali-activated cement. Constr. Build. Mater. 2016, 113, 237–245. [Google Scholar] [CrossRef]
  50. Huang, Q.; Wang, C.; Zeng, Q.P.; Yang, C.H.; Luo, C.Q.; Yang, K. Deterioration of mortars exposed to sulfate attack under electrical field. Constr. Build. Mater. 2016, 117, 121–128. [Google Scholar] [CrossRef]
  51. Norambuena-Contreras, J.; Thomas, C.; Borinaga-Treviño, R.; Lombillo, I. Influence of recycled carbon powder waste addition on the physical and mechanical properties of cement pastes. Mater. Struct. 2016, 49, 5147–5159. [Google Scholar] [CrossRef]
  52. Stora, E.; Bary, B.; He, Q.C.; Deville, E.; Montarnal, P. Modelling and simulations of the chemo-mechanical behaviour of leached cement-based materials Leaching process and induced loss of stiffness. Cem. Concr. Res. 2009, 39, 763–772. [Google Scholar] [CrossRef]
  53. Heukamp, F.H.; Ulm, F.J.; Germaine, J.T. Mechanical properties of calcium-leached cement pastes: Triaxial stress states and the influence of the pore pressures. Cem. Concr. Res. 2001, 31, 767–774. [Google Scholar] [CrossRef]
  54. Kuhl, D.; Bangert, F.; Meschke, G. Coupled chemo-mechanical deterioration of cementitious materials—Part II: Numerical methods and simulations. Int. J. Solids Struct. 2004, 41, 41–67. [Google Scholar] [CrossRef]
Figure 1. TGA curves for the non- and filtrate-treated PLA.
Energies 09 00823 g001
Figure 2. Py-GC/MS abundance-retention time curve of non-treated PLA.
Energies 09 00823 g002
Figure 3. Fluidity of the slurries of the control and SDTSMs with different PLA dosages.
Energies 09 00823 g003
Figure 4. The rheological curves of the control and SDTSMs with different PLA dosages.
Energies 09 00823 g004
Figure 5. The plastic viscosity of the control and SDTSMs with different PLA dosages.
Energies 09 00823 g005
Figure 6. Compressive strength of 85 °C-cured specimens of the control and SDTSMs with different PLA dosages.
Energies 09 00823 g006
Figure 7. XRD patterns of 85 °C-cured specimens of the control and SDTSMs with different PLA dosages.
Energies 09 00823 g007
Figure 8. Water absorption of the 200 °C-heated specimens of control and SDTSMs with different PLA dosages.
Energies 09 00823 g008
Figure 9. Images of the section of 200 °C-heated samples of the control and SDTSMs with different PLA dosages after immersed in water for 2 h: (a) the control; (b) 0%; (c) 2%; (d) 4%; (e) 6%; (f) 8%; (g) 10%.
Energies 09 00823 g009
Figure 10. Images of the section of the 200 °C-heated samples after being immersed in water for 24 h: (a) the image of the control; (b) 0%; (c) 2%; (d) 4%; (e) 6%; (f) 8%; (g) 10%.
Energies 09 00823 g010
Figure 11. Compressive strength of control and SDTSM with different PLA dosages after being 200 °C-heated, immersed in water for 2 h and 24 h.
Energies 09 00823 g011
Figure 12. SEM images of smaller magnification of the SDTSM with 2% PLA after different periods: (a) 85 °C-cured; (b) 200 °C-heated; (c) immersed in water for 2 h and (d) immersed in water for 24 h.
Energies 09 00823 g012
Figure 13. SEM images of greater magnification of the SDTSM with 2% PLA after different periods: (a) 85 °C-cured; (b) 200 °C-heated; (c) immersed in water for 2 h and (d) immersed in water for 24 h.
Energies 09 00823 g013
Table 1. Typical values of PLA’s physical properties.
Physical PropertiesTypical Values
Density (g/cm3)1.25 ± 0.05
Melting temperature (°C)155~165
Glass transition temperature (°C)56~60
Tensile strength (MPa) ≥5
Elongation at break (%) ≥3.0
Impact strength (kJ/m3, Izod)1~3
Table 2. Main pyrolysis derivatives along with their peak area % of total obtained from Py-GC/MS for non-treated PLA.
NumberRetention Time (min)CompoundsPeak Area % of Total
14.577o-Xylene3.29
25.514γ-Butyrolactone82.91
38.717Hexyl alcohol2.95
411.8293-Methylpent-1-en-3-ol1.68
Table 3. The values of shear stress (Pa) of slurries of the control and SDTSMs with different PLA dosages at different shear rates.
PLA Dosage (%)Shear Rates (s−1)
5.1110.21170340
Control1.022.3014.8227.59
05.377.6762.85123.92
13.837.4152.1297.35
23.325.3742.4176.65
33.585.6247.0187.13
44.346.6453.1498.37
54.858.9461.32110.89
65.117.4162.09114.98
73.839.4554.93100.16
84.345.6241.3976.14
93.836.1348.8090.45
104.856.6458.51109.35
Table 4. The values of τ 0 (Pa), μ p (mPa·s), R 2 and RMSE of the control and SDTSMs with different PLA dosages.
PLA Dosage (%) τ 0 μ p R 2 RMSE
Control1.1495478.170.998780.53179
03.62560352.130.999910.66444
13.80992276.440.999241.4894
23.17759218.160.998371.7229
33.07989248.970.999261.3228
43.76898280.150.999301.4440
55.15655314.270.998312.5178
64.25199327.940.999311.6738
74.94911282.350.997742.6160
83.64514214.570.999431.0007
93.38908257.790.998931.3432
103.75633312.990.999311.3058
Table 5. The weight percent of powders between different pore diameters sieves of PLA, slag and fly ash.
Pore Diameter (μm)PLASlagFly Ash
>5500.090300
550~32525.6767600
325~25060.1170300
250~12012.7006553.765770.56842
120~1061.0433211.694486.977688
<1060.37194234.5397692.45389

