
Optimal Sizing of a Stand-Alone Hybrid Power System Based on Battery/Hydrogen with an Improved Ant Colony Optimization


Abstract
:1. Introduction
- (a)
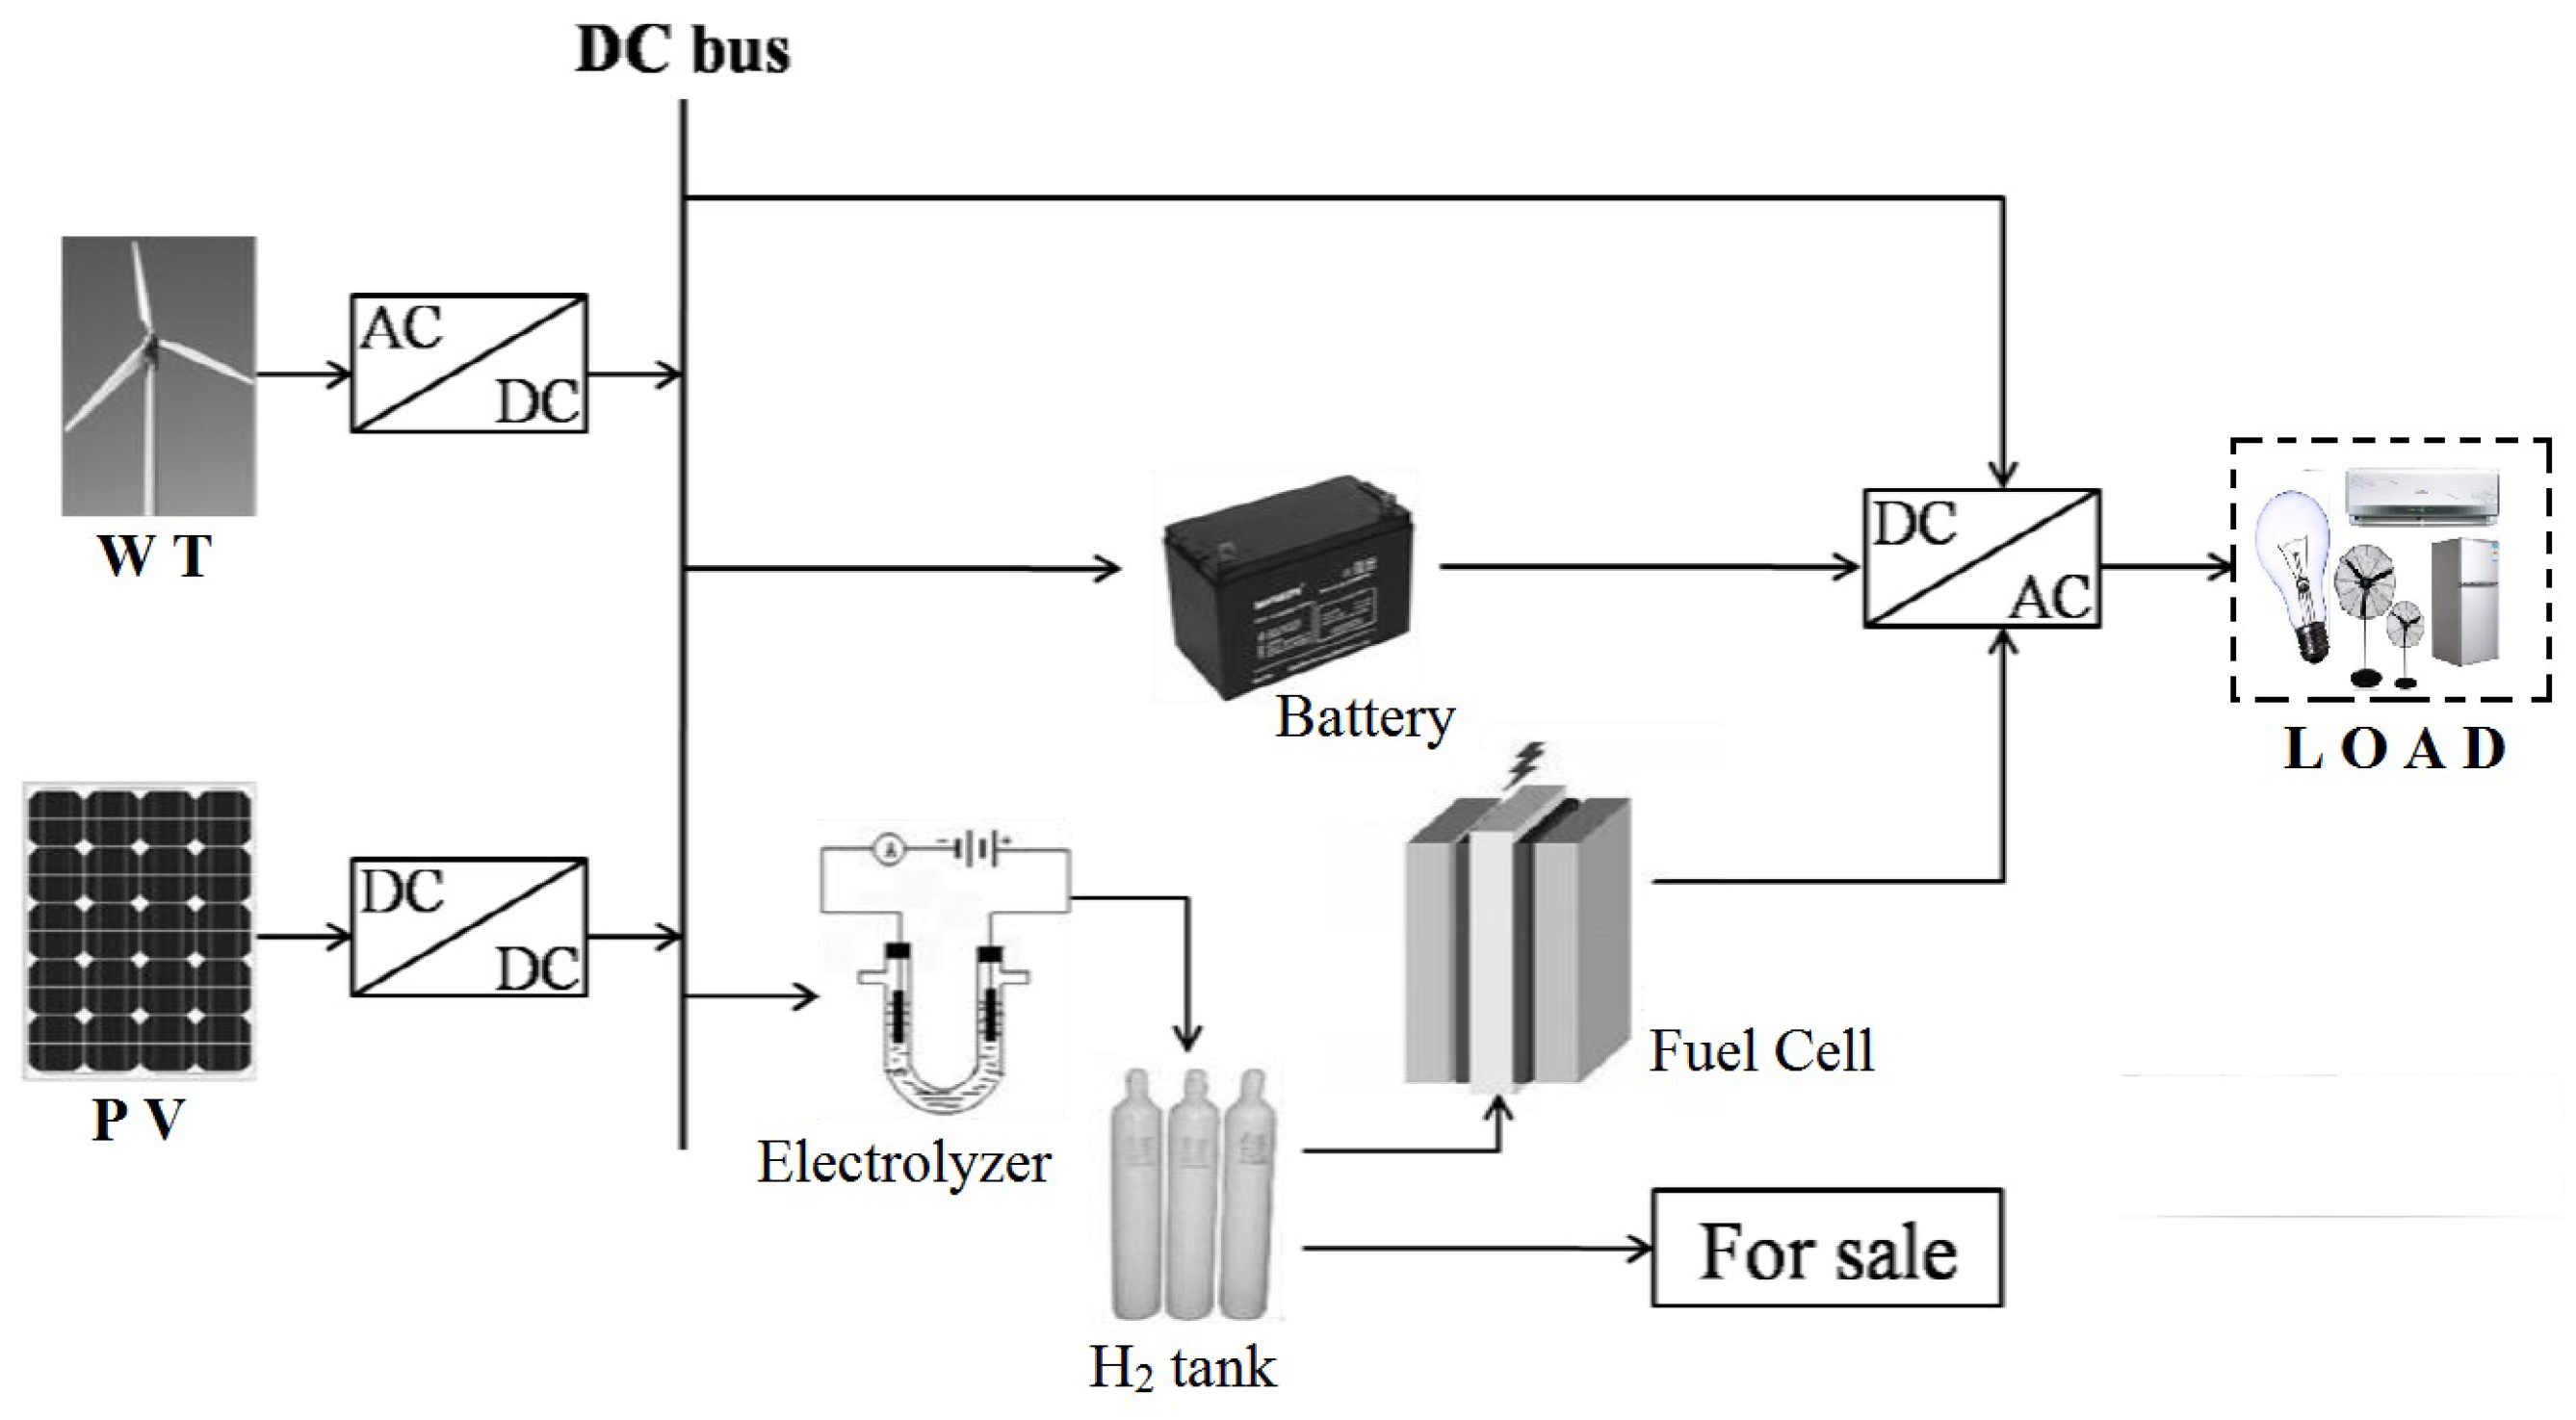
- System description: In the past few years, there has been growing interest/concern about the sizing of hybrid power systems [7,8,9,10,11]. In [7,8], the authors have addressed the optimal sizing and scheduling of an isolated wind/photovoltaic (PV) system with battery storage and have presented the results of investigations for meeting the annual load and minimizing the total annual cost to the customer. In [9], Akella and Sharma have studied the sizing of an integrated renewable energy system (IRES) consisting of micro hydrogen power, PV panels and a wind turbine and have reported the results of the optimization of IRES models of the study area of Zone 4 of Jaunpur block of Uttaranchal state. In [10], Elbaset has constructed a PV/fuel cell (FC) hybrid power generation system and presented a computer program to size the system components in order to match the load, for high operational reliability with respect to the objective-loss of power supply probability (LPSP). In [11], Vafaei and Mehdi have developed a microgrid for a remote community in northern Ontario (Canada) that combines wind, as a renewable source of energy, and a hydrogen-based energy storage system was developed with the goal of meeting the demand, while minimizing the cost of energy and adverse effect on the environment. However, most of these studies only contain a single storage unit or a single renewable energy source. A single storage device is easy to dispose of, but it has disadvantages. For example, the battery is efficient to release and store electrical energy, but it is expensive and has an innate leakage characteristic. The efficiency of a hydrogen subsystem consisting of FC, hydrogen tanks and electrical is lower than a battery; but, the subsystem is somehow less expensive, and hydrogen could be left for a long time [12].
- (b)
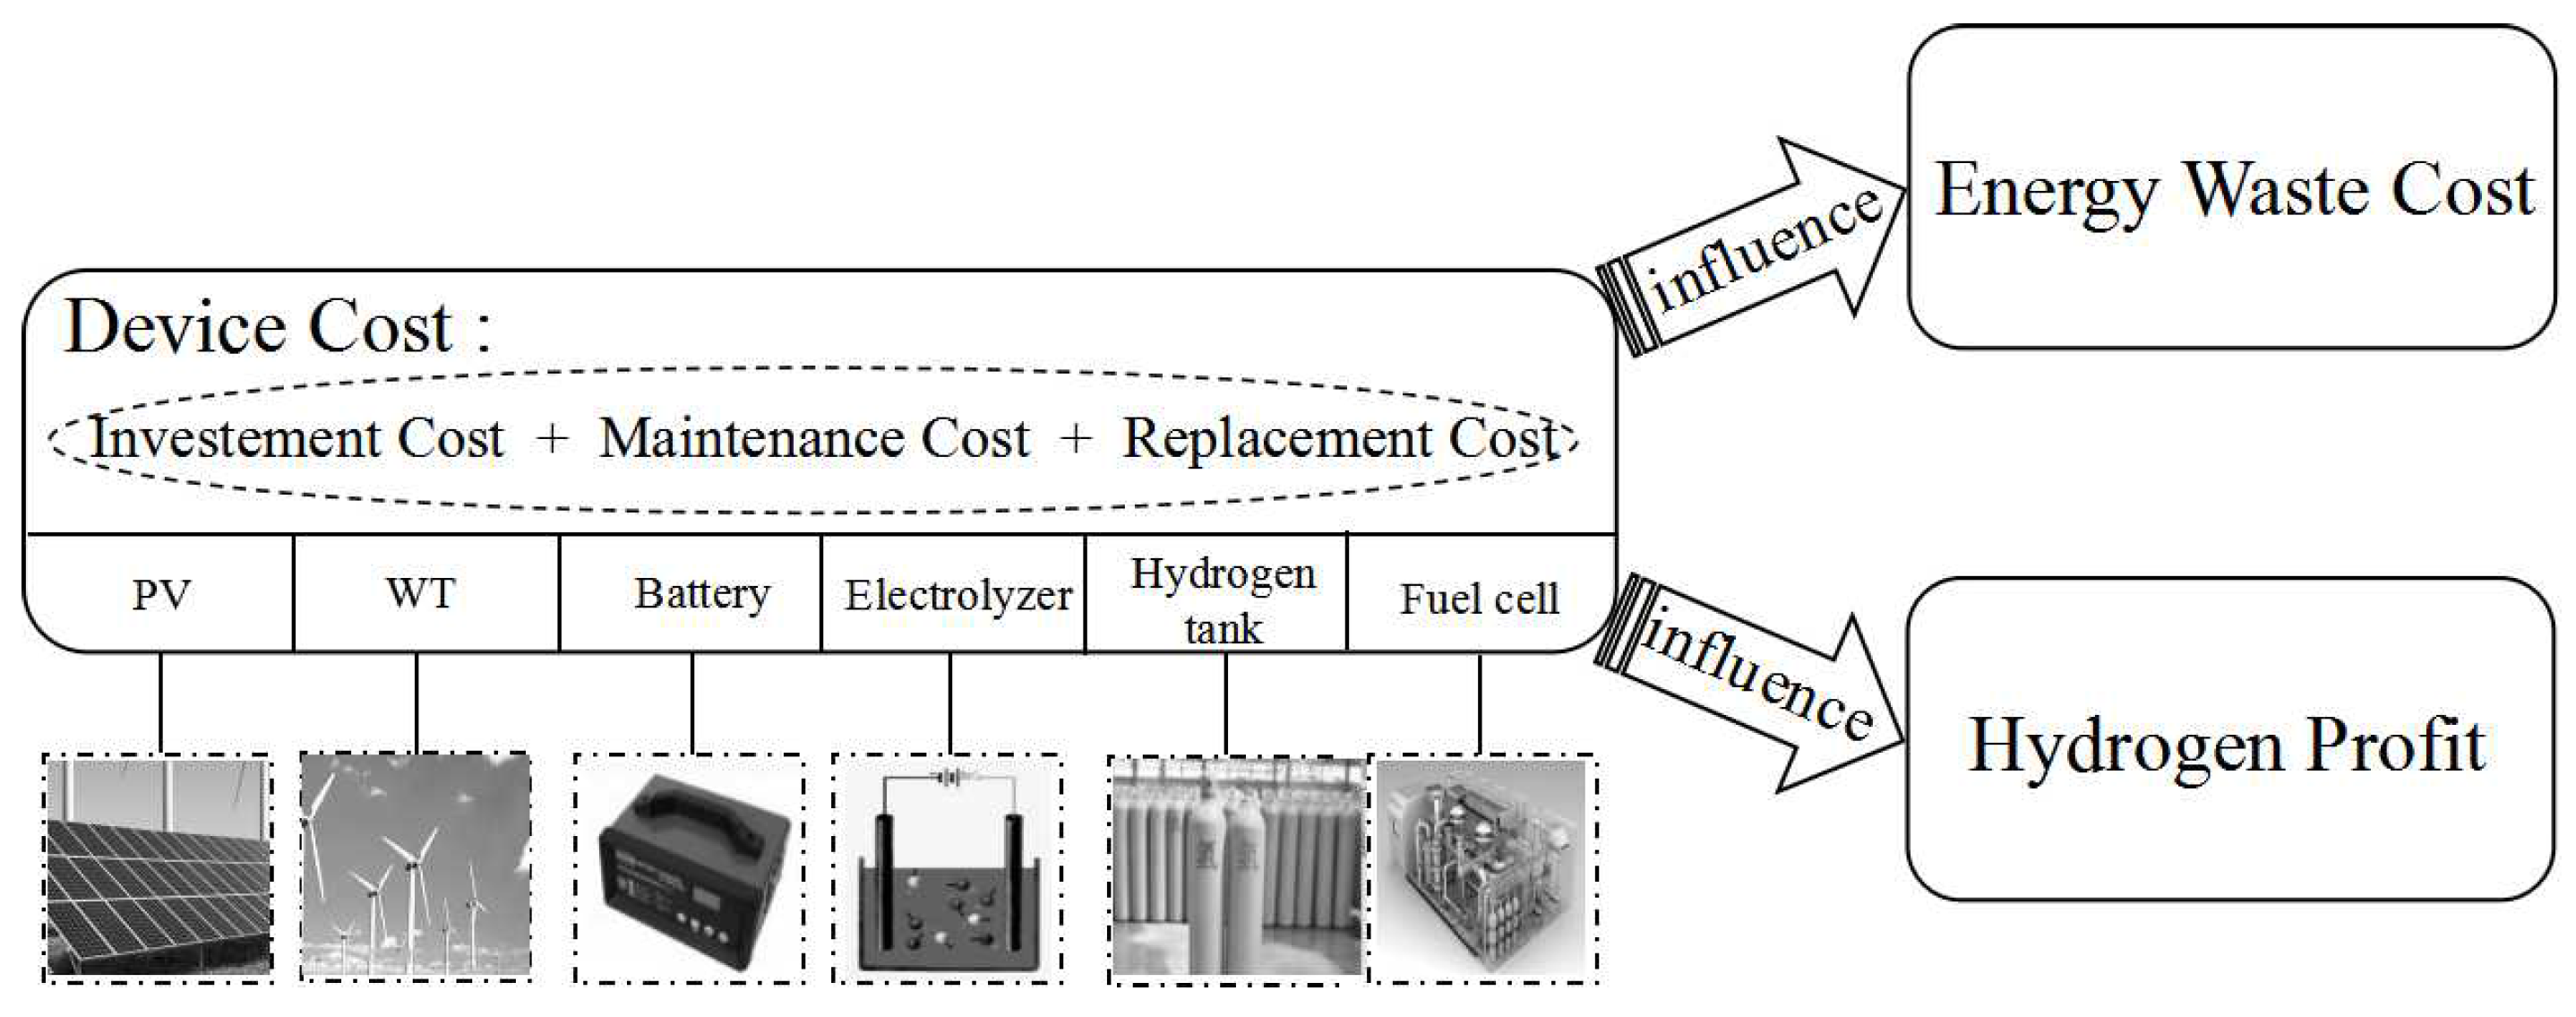
- Objectives design: When sizing for such hybrid power systems, system cost and energy supply reliability are the focus [14,15,16,17]. Kashefi et al. have proposed that the most important challenge in the design of a hybrid power system is reliable supply for load demand under various weather situations, considering investment, maintenance and replacement cost. These costs they considered were just caused by the usage of devices, while other costs were ignored.
- (c)
- Solving algorithm: Many authors have investigated some classical algorithms for sizing stand-alone hybrid systems based on renewable sources and storage devices [8,18,19,20]. In [18], a nonlinear programming has been used to find the optimal sizing and location of grid-connected wind turbines based on the simulation of various scenarios. Akella [9], Kellogg and Nehrir [7] and Kuznia et al. [19] have adopted different linear programming models to optimize the design of a hybrid system. In [20], Malheiro and Castro have addressed the sizing and scheduling of hybrid isolated systems via a mixed-integer linear programming. However, classical algorithms could not obtain the global optimal solution within a reasonable amount of time for NP problems. In the last few decades, new generation artificial algorithms, like genetic algorithm (GA) and particle swarm optimization (PSO), were widely used because they required less computation time and had better accuracy [21]. In [22,23,24], GA has been used for optimal sizing of a hybrid wind/PV/battery power system, which is subject to the reliability index of LPSP. PSO has been successfully implemented for optimal sizing of hybrid stand-alone power systems [25,26,27]. Furthermore, in [28], a novel approach consisting of a ε-constraint method and PSO has been applied to minimize simultaneously the total cost of the system, unmet load and fuel emission. Besides, a building algorithm that is easily programmable and can be accomplished by a simple search technique has been proposed in [29].
2. Sizing Formulation
2.1. Problem Description
2.2. Modeling the System Components
2.2.1. Photovoltaic System
2.2.2. Wind Turbine Generator
2.2.3. Battery
2.2.4. Hydrogen Subsystem
2.2.5. Direct Current/Alternating Current Converter
3. Objectives and Operation Strategy
3.1. Objective Modelings
3.1.1. Annual System Cost
- Investment cost:where , , , , , and are the price of the PV, wind turbine, battery, electrolyzer, FC, hydrogen tank and inverter, respectively. is the number of component x.
- O&M cost:where α is a coefficient. Additionally, we defined the operating time of the hybrid system () as 20 years, because the PV panel has the longest lifetime (about 20 years) among all of the components.
- Replacement cost:where i is the interest rate and (two years), (five years) and (five years) are the lifetime of the battery, electrolyzer and FC, respectively. This means that in this hybrid system, the battery, electrolyzer and FC should be replaced according to the schedule.
3.1.2. Reliability
3.2. Constraints
3.3. Operation Strategy
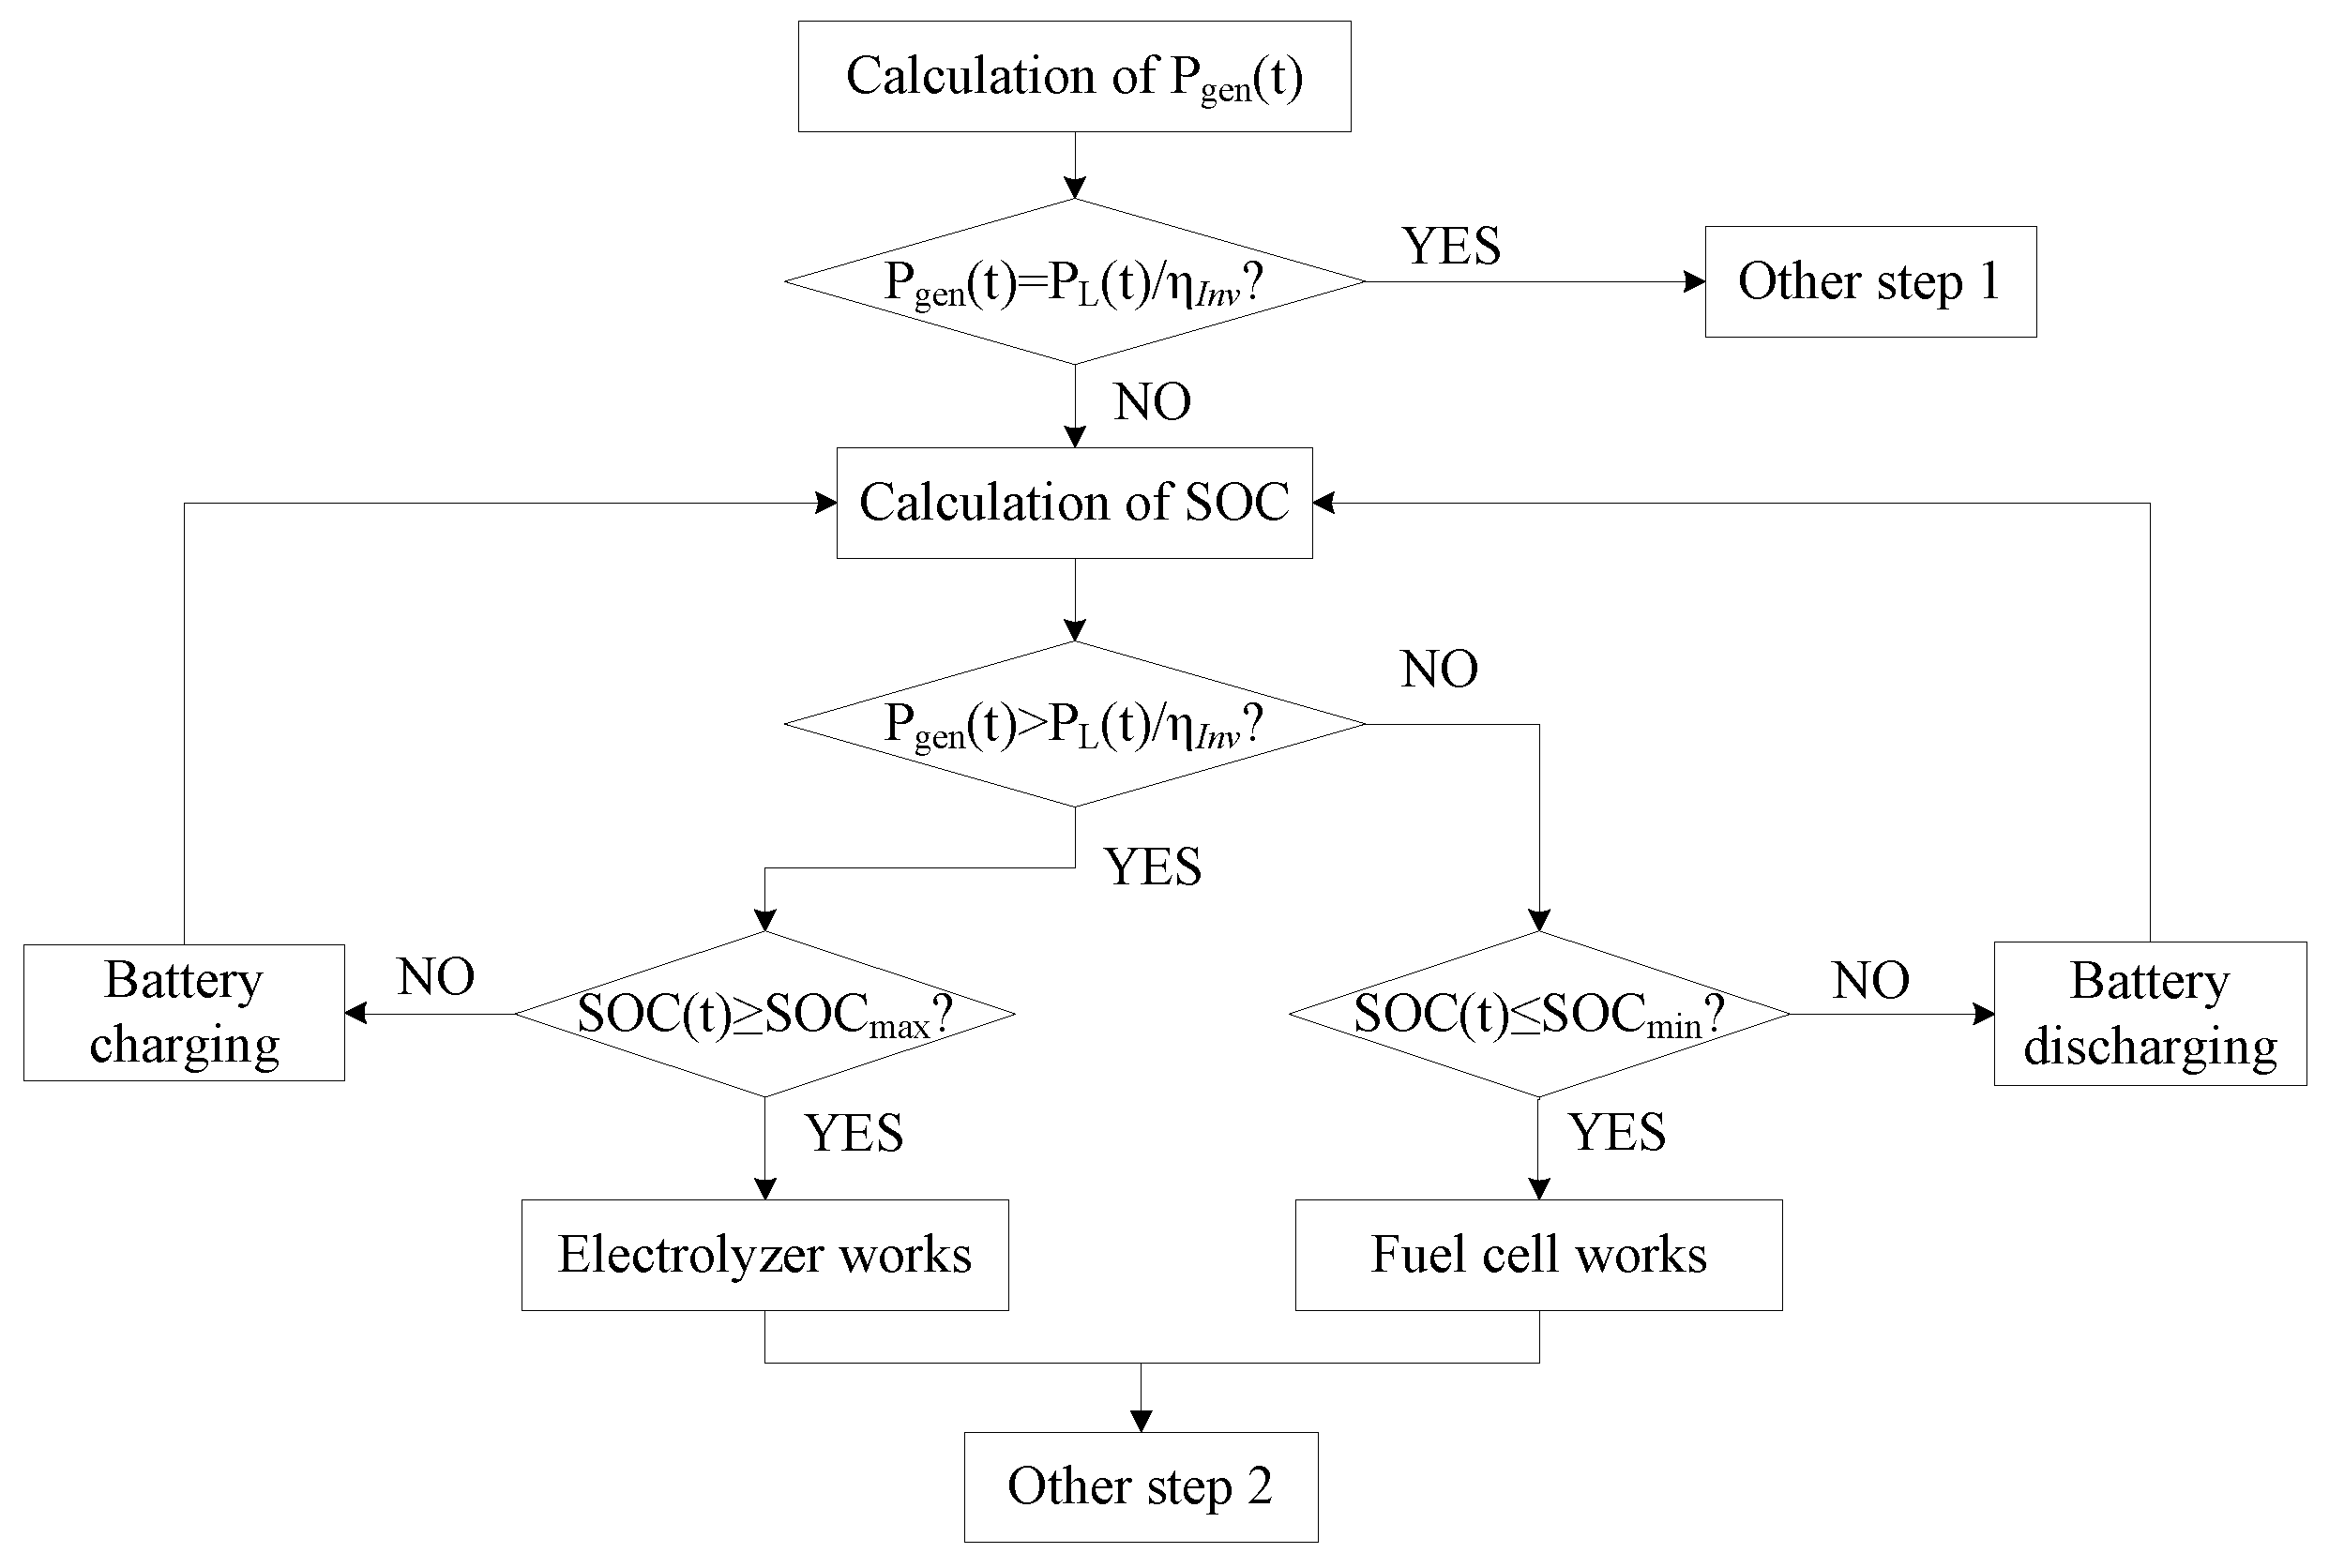
- If , this means that the whole power generated by renewable sources (solar and wind) is injected to the load through the inverter (like the other Step 1 in Figure 4).
- If , this means that there will be some remaining electrical energy, which would not be injected. In this case, will be judged, so as to decide where the remaining energy goes.If , the surplus power is transferred to batteries till the SOC equals or there is no surplus power. If , the electrolyzer should work for transferring the surplus power to hydrogen till there is no surplus power and then goes to the other Step 2 in Figure 4.
- If , this means that the energy generated is not enough to supply the load demand. In this case, the storage system (battery and hydrogen subsystem) will work so as to achieve a balance. Furthermore, will be judged so as to decide the procedure between the two storage subsystems.If , the shortage power will be supplied by batteries till the SOC equals .If , the batteries could not discharge any more. The fuel cells will be started to supply the load and then goes to the other Step 2 in Figure 4. Additionally, if the shortage power exceeds the fuel cell’s rated power or stored hydrogen cannot afford the shortage, some fraction of the load must be shed. This fact leads to a loss of load.
4. Improved Ant Colony Optimization Algorithm
4.1. Ant Colony Optimization Basics
4.2. Improved Ant Colony OptimizationAlgorithm
5. Result and Analysis
5.1. Simulation Result
- (1)
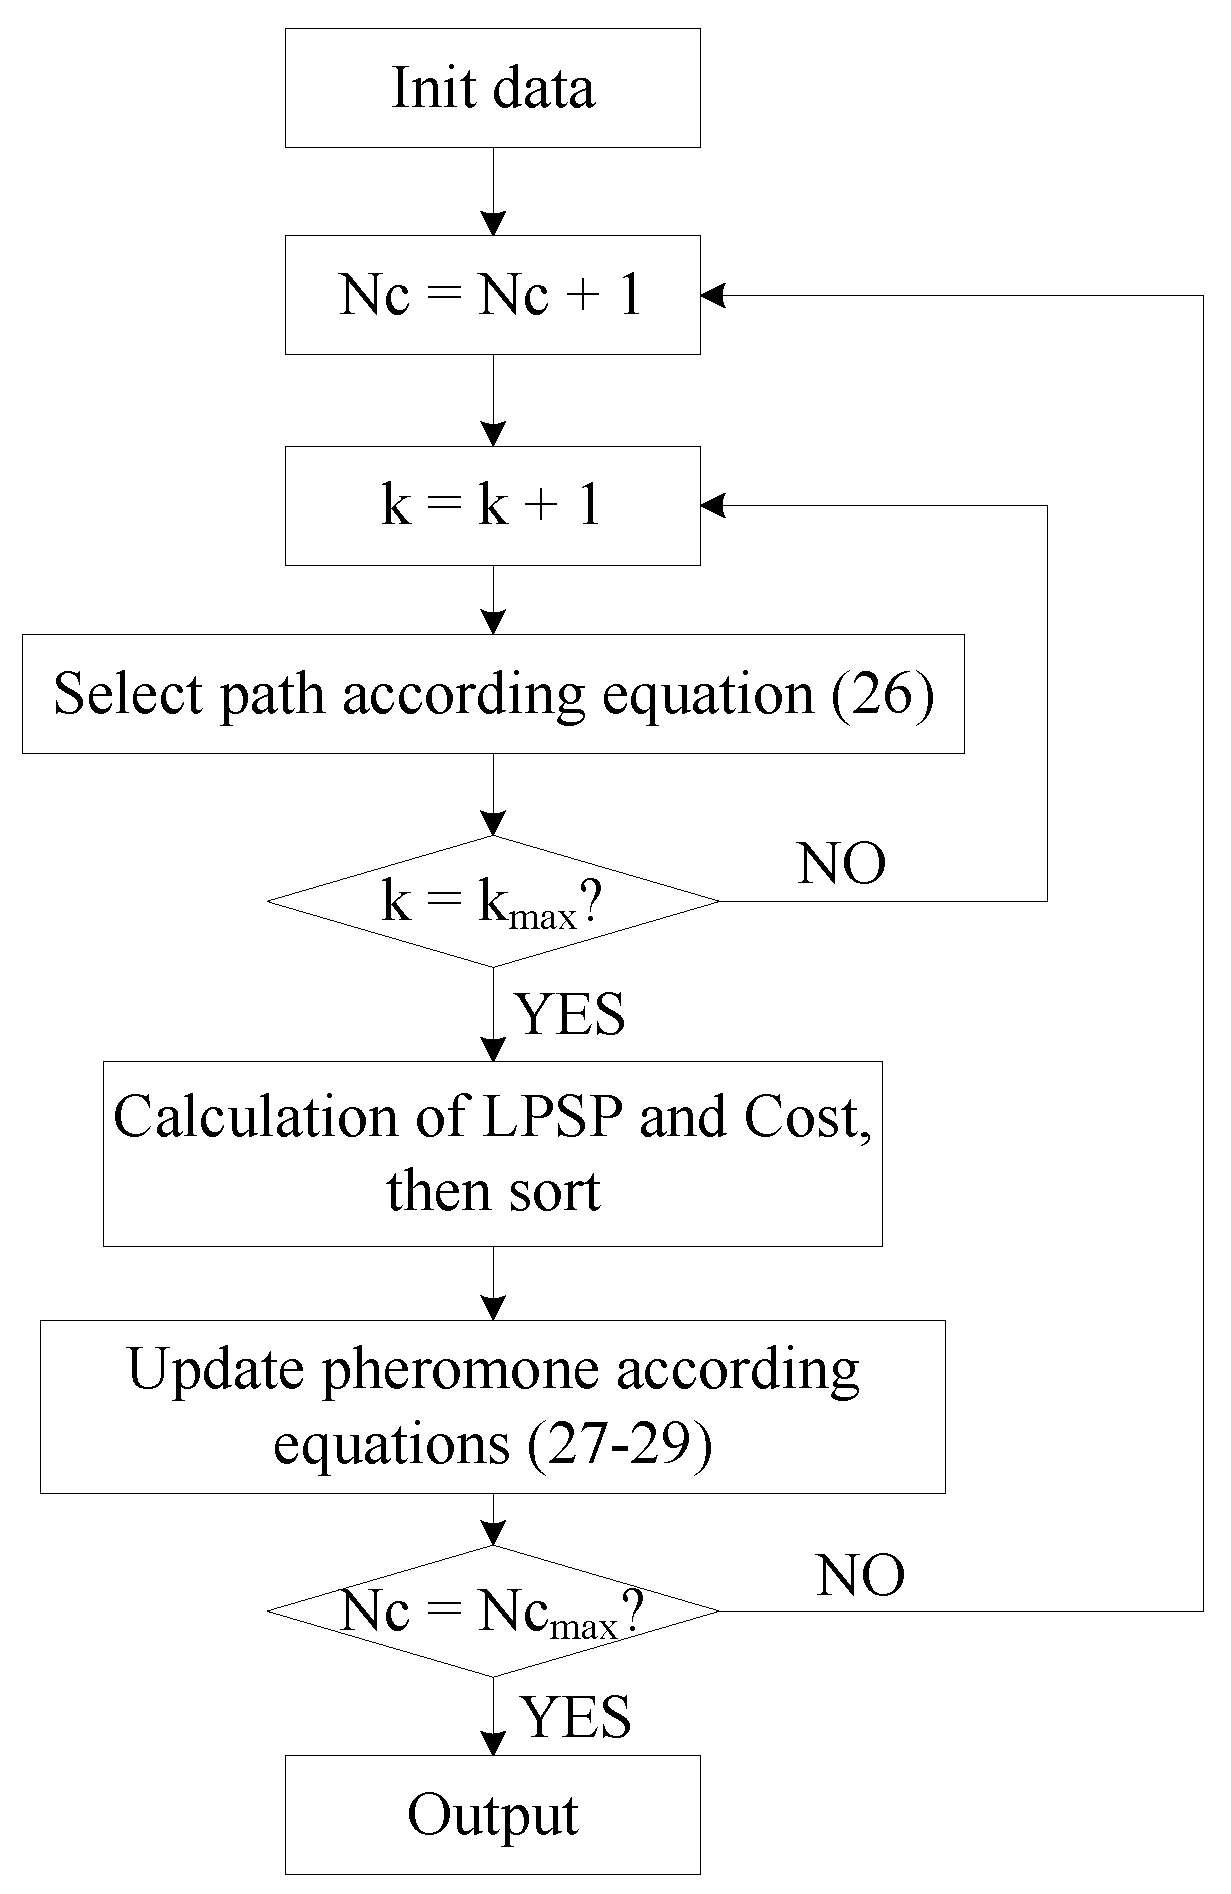
- Initialize the amount of pheromone between every two bits, and set the iterations , the maximum number of ants , the number of ants needed to be sorted m, the constant Q and other important parameters.
- (2)
- Increase the current iteration = + 1.
- (3)
- Count the ant . In each iteration, all of the ants will search routes one by one.
- (4)
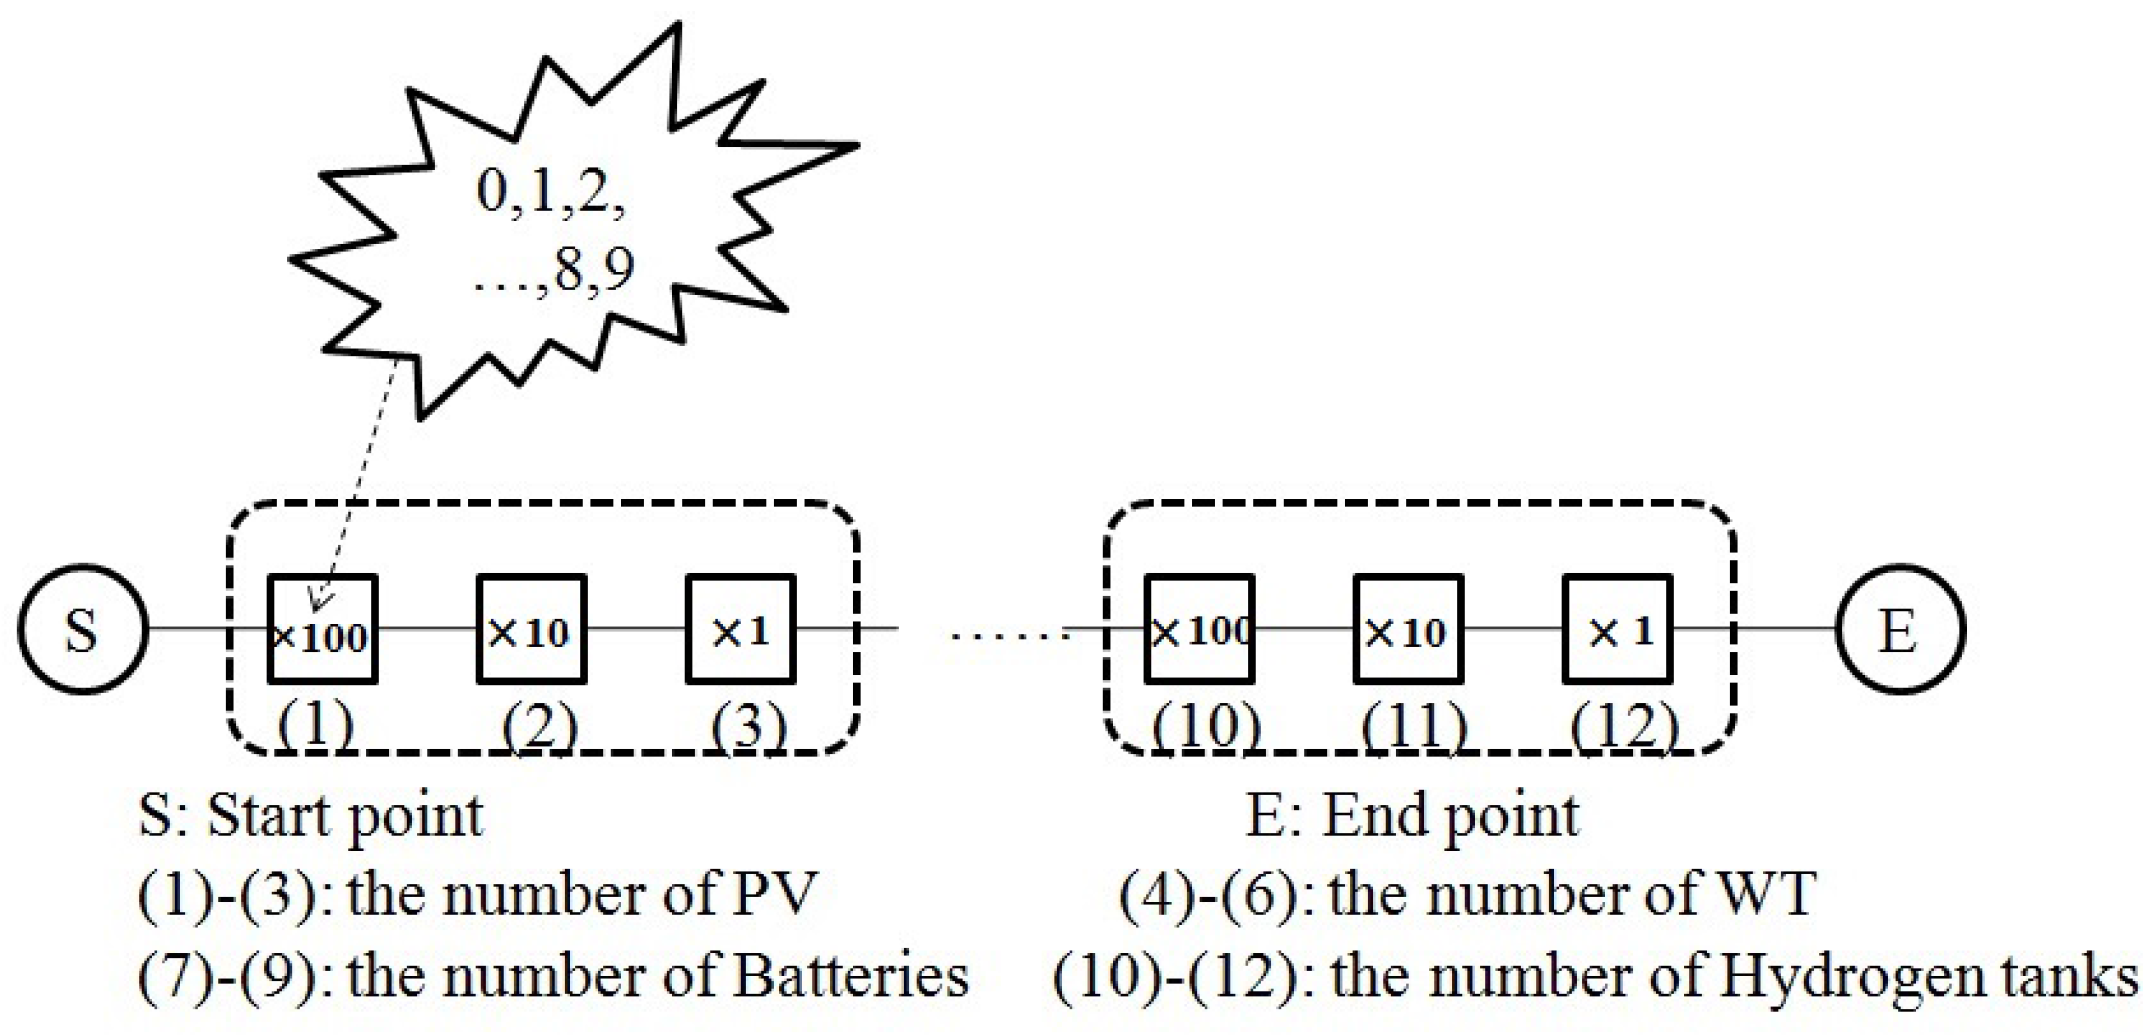
- Each ant selects a path among 10 available paths so as to get the next bit according to the probability described as Equation (26) till achieving the end point.
- (5)
- Judge the relation between the current k and . If , turn to Step (3) or turn to Step (6).
- (6)
- Calculate the system cost and LPSP of ant k. Additionally, find the ants whose LPSP is not more than the given LPSP; sort them according to the system cost; then select the m ants (here, m is 10) we needed.
- (7)
- Update the pheromone as described in Equation (27).
- (8)
- Judge the relation between the current N and . If , turn to Step (2) or turn to Step (9).
- (9)
- Output the data demanded and draw the figures.
| the Improved ACO |
| 1 ▷ Initialization for several parameters such as , etc. |
| 2 |
| 3 |
| 4 while |
| 5 do |
| 6 while |
| 7 do |
| 8 while |
| 9 do |
| 10 while |
| 11 do ▷ this is Equation (26) |
| 12 select the node d whose probability (p) is maximum |
| 13 get the route of ant k according the selected nodes above |
| 14 ▷ calculate the LPSP and total cost of the route |
| 15 ▷ this is Equation (19) |
| 16 ▷ this is Equation (18) |
| 17 select the routes based on the demand of LPSP and sort them based on the |
| 18 select m routes |
| 19 ▷ this is Equation (27) |
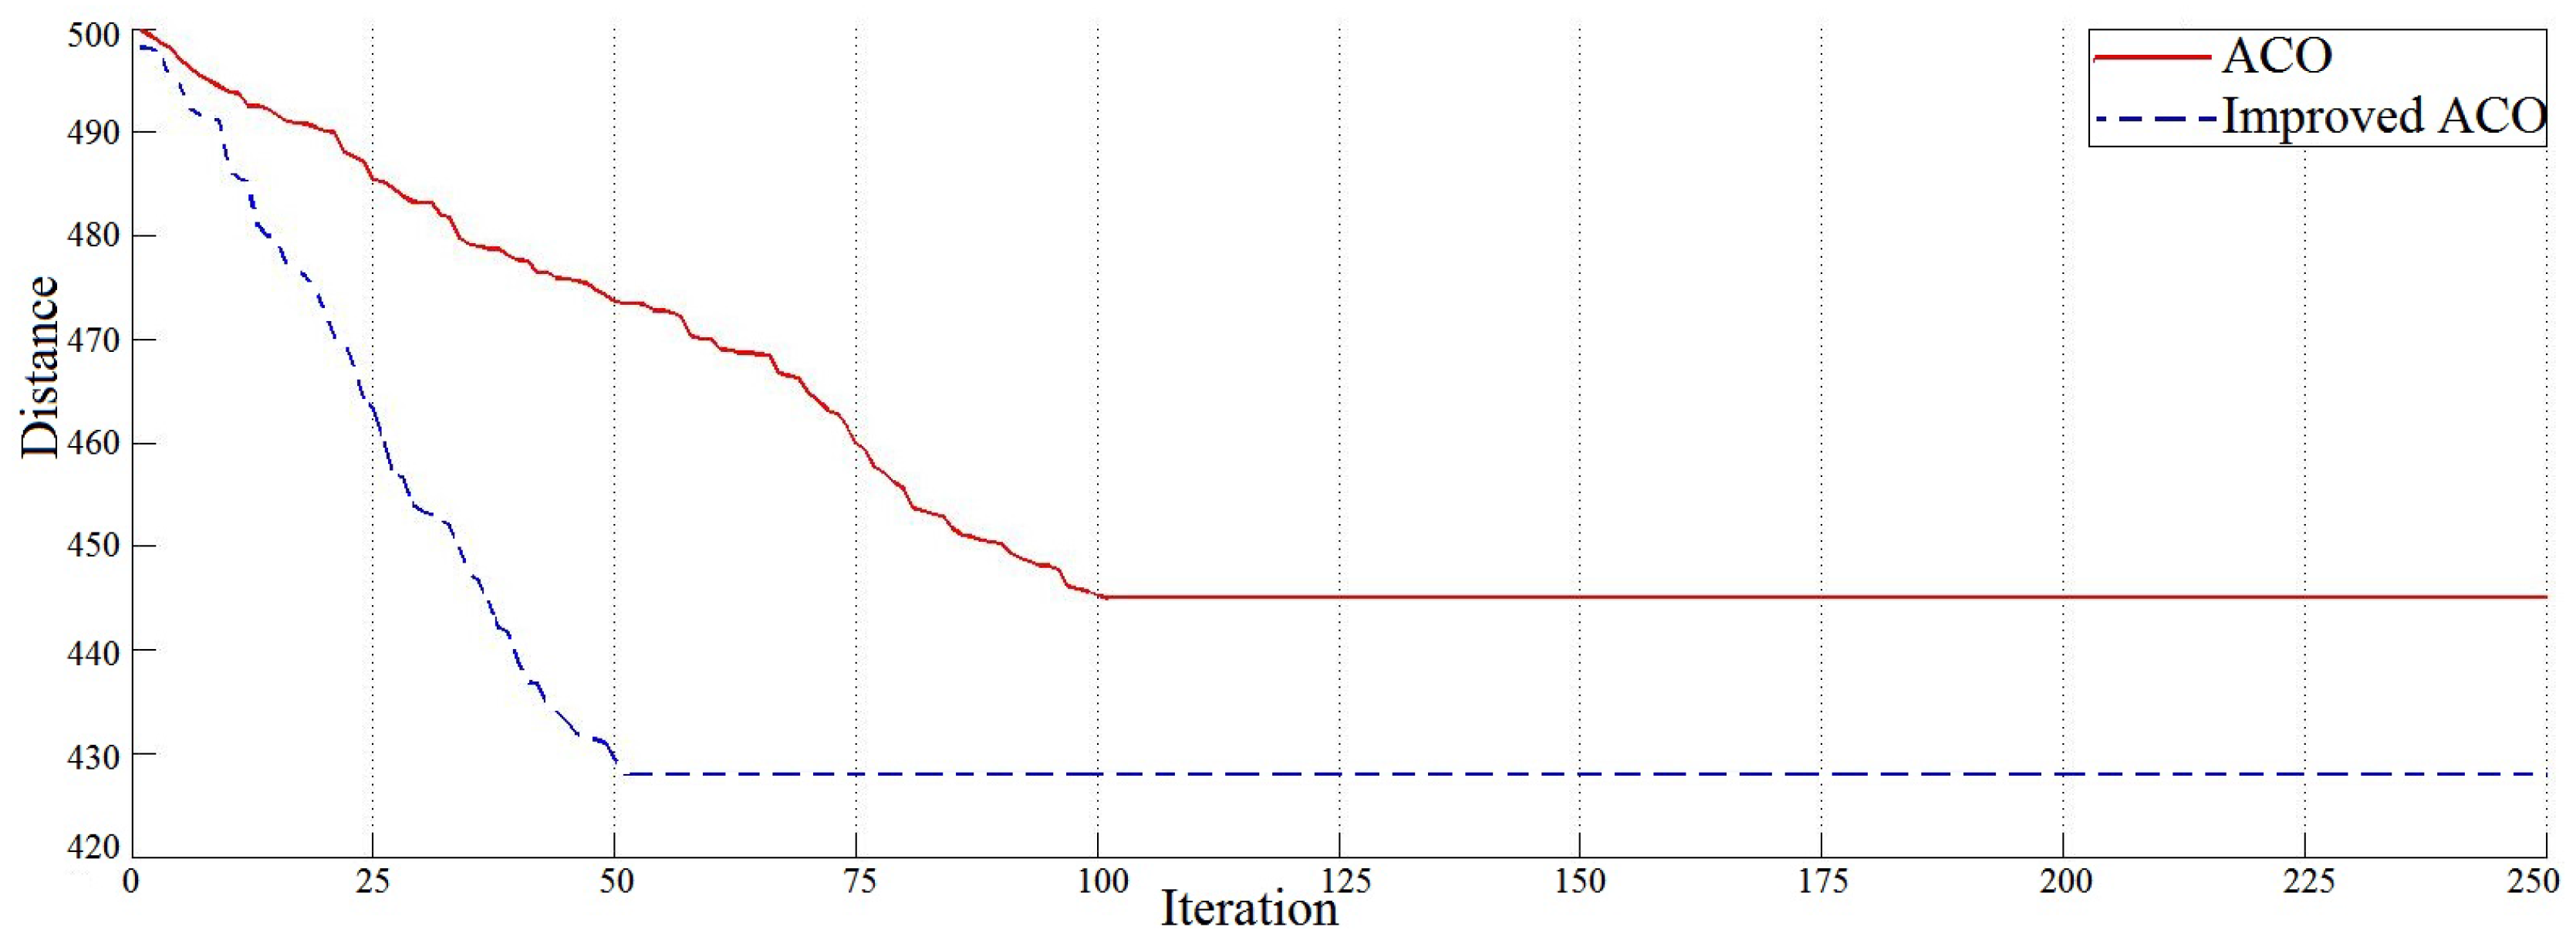
5.2. Analysis
6. Conclusions and Outlook
Acknowledgments
Author Contributions
Conflicts of Interest
References
- Wu, K.; Zhou, H.; An, S.; Huang, T. Optimal coordinate operation control for wind photovoltaic battery storage power-generation units. Energy Convers. Manag. 2015, 90, 466–475. [Google Scholar] [CrossRef]
- Mahesh, A.; Sandhu, K.S. Hybrid wind/photovoltaic energy system developments: Critical review and findings. Renew. Sustain. Energy Rev. 2015, 52, 1135–1147. [Google Scholar] [CrossRef]
- Lin, W.M.; Lu, K.H.; Ou, T.C. Design of a novel intelligent damping controller for unified power flow controller in power system connected offshore power applications. IET Gener. Transm. Distrib. 2015, 9, 1708–1717. [Google Scholar] [CrossRef]
- Ou, T.C. A novel unsymmetrical faults analysis for microgrid distribution systems. Int. J. Electr. Power Energy Syst. 2012, 43, 1017–1024. [Google Scholar] [CrossRef]
- Ou, T.C. Ground fault current analysis with a direct building algorithm for microgrid distribution. Int. J. Electr. Power Energy Syst. 2013, 53, 867–875. [Google Scholar] [CrossRef]
- Belfkira, R.; Zhang, L. Optimal sizing study of hybrid wind/PV/diesel power generation unit. Sol. Energy 2011, 85, 100–110. [Google Scholar] [CrossRef]
- Kellogg, W.D.; Nehrir, M.H. Generation unit sizing and cost analysis for stand-alone wind, photovoltaic, and hybrid wind/PV systems. IEEE Trans. Energy Convers. 1998, 13, 70–75. [Google Scholar] [CrossRef]
- Li, J.; Wei, W.; Xiang, J. A Simple Sizing Algorithm for Stand-Alone PV/Wind/Battery Hybrid Microgrids. Energies 2012, 5, 5307–5323. [Google Scholar] [CrossRef]
- Akella, A.K.; Sharma, M.P. Optimum utilization of renewable energy sources in a remote area. Renew. Sustain. Energy Rev. 2007, 11, 894–908. [Google Scholar] [CrossRef]
- Elbaset, A.A. Design, Modeling and Control Strategy of PV/FC Hybrid Power System. Electr. Syst. 2011, 7, 270–286. [Google Scholar]
- Vafaei, M. Optimally-Sized Design of a Wind/diesel/fuel Cell Hybrid System for Remote Community. Master’s Thesis, University of Waterloo, Waterloo, ON, Canada, 2011. [Google Scholar]
- Herrera, V.; Milo, A. Adaptive energy management strategy and optimal sizing applied on a battery-supercapacitor based tramway. Appl. Energy 2016, 169, 831–845. [Google Scholar] [CrossRef]
- Abdin, Z.; Webb, C.J. Solar hydrogen hybrid energy systems for off-grid electricity supply: A critical review. Renew. Sustain. Energy Rev. 2015, 52, 1791–1808. [Google Scholar] [CrossRef]
- Kaviani, A.K.; Baghaee, H.R. Optimal sizing of a stand-alone Wind/Photovoltaic generation unit using particle swarm optimization. Simulation 2009, 85, 89–99. [Google Scholar] [CrossRef]
- Kaviani, A.K.; Riahy, G.H. Optimal design of a reliable hydrogen-based stand-alone wind/PV generation system, considering component outages. In Proceedings of the 11th International Conference on Optimization of Electrical and Electronic Equipment, Brasov, Romania, 22–24 May 2008; pp. 413–418.
- Torreglosa, J.P.; Garcia, P. Energy dispatching based on predictive controller of an off-grid wind turbine/photovoltaic/hydrogen/battery hybrid system. Renew. Energy 2015, 74, 326–336. [Google Scholar] [CrossRef]
- Gong, Q.; Lei, J. Optimal siting and sizing of distributed generators in distribution systems considering cost of operation risk. Energies 2016, 9, 61. [Google Scholar] [CrossRef]
- Kara, O. Optimization of a wind/PV hybrid power generation system. Int. J. Green Energy 2005, 2, 57–63. [Google Scholar]
- Kuznia, L.; Bo, Z.; Centeno, G.; Miao, Z. Stochastic optimization for power system configuration with renewable energy in remote areas. Ann. Oper. Res. 2013, 210, 411–432. [Google Scholar] [CrossRef]
- Malheiro, A.; Castro, P.M. Integrated sizing and scheduling of wind/PV/diesel/battery isolated systems. Renew. Energy 2015, 83, 646–657. [Google Scholar] [CrossRef]
- Sunanda, S.; Chandel, S.S. Review of recent trends in optimizaion techniques for solar photovoltaic-wind based energy systems. Renew. Sustain. Energy Rev. 2015, 50, 755–769. [Google Scholar]
- Koutroulis, E.; Kolokotsa, D. Mehtodology for optimal sizing of stand-alone PV/wind-generator systems using genertic algorithms. Sol. Energy 2006, 80, 1072–1088. [Google Scholar] [CrossRef]
- Shahirinia, A.H.; Moghaddas-Tafreshi, S.M.; Gastaj, A.H.; Moghaddomjoo, A.R. Optimal sizing of hybrid power system using genetic algorithm. In Proceedings of the 2005 International Conference on Future Power Systems, Amsterdam, The Netherlands, 16–18 November 2005.
- Xu, D.; Kang, L.; Chang, L.; Cao, B. Optimal sizing of stand-alone hybrid wind/PV power systems using genetic algorithm. In Proceedings of the Canadian Conference on Electrical and Computer Engineering, Saskatoon, SK, Canada, 1–4 May 2005; pp. 1722–1725.
- Bai, Q. Analysis of particle swarm optimization algorithm. Comput. Inf. Sci. 2010, 3, 180–184. [Google Scholar] [CrossRef]
- Biswas, I.; Dash, V.; Bajpai, P. Sizing optimization of PV-FC-Battery system with hybrid PSO-EO algorithm. In Proceedings of the 2012 Annual IEEE India Conference, Kochi, India, 7–9 December 2012; pp. 869–874.
- Ou, T.C.; Hong, C.M. Dynamic operation and control of microgrid hybrid power systems. Energy 2014, 66, 314–323. [Google Scholar] [CrossRef]
- Sharafi, M.; Elmekkawy, T.Y. Multi-objective optimal design of hybrid renewable energy systems using PSO-simulation based approach. Renew. Energy 2014, 68, 67–79. [Google Scholar] [CrossRef]
- Ou, T.C.; Chuang, S.J.; Hong, C.M.; Wu, R.C.; Tsao, T.P.; Chen, C.Y. Self-regulation ground faults model for microgrid distribution. ICIC Express Lett. Part B Appl. 2015, 6, 3225–3230. [Google Scholar]
- Wang, W.Y. Routing selection algorithm under multiple link state limited. J. Comput. Appl. 2007, 27, 2395–2397. [Google Scholar]
- Luo, D.L.; Wu, S.-X. Ant colony optimization with potential field heuristic for roboot path planning. Syst. Eng. Electron. 2010, 32, 1277–1280. [Google Scholar]
- Carpaneto, E.; Chicco, G. Ant-colony search-based minimum losses reconfiguration of distribution systems. In Proceedings of the 2004 12th IEEE Mediterranean Electrotechnical Conference, Dubrovnik, Croatia, 12–15 May 2004; pp. 971–974.
- Dufo-Lopez, R.; Bernal-Agustin, J.L. Optimaization of control straregies for stand-alone renewable energy syatems with hydrogen storage. Renew. Energy 2007, 32, 1102–1126. [Google Scholar] [CrossRef]
- Maleki, A.; Pourfayaz, F. Optimal sizing of autonomous hybrid photovoltaic/wind/battery power system with LPSP technology by using evolutionary algorithms. Sol. Energy 2015, 115, 471–483. [Google Scholar] [CrossRef]
- Aryani, D.R.; Song, H. Coordination Control Strategy for AC/DC Hybrid Microgrids in Stand-Alone Mode. Energies 2016, 9, 469. [Google Scholar] [CrossRef]
- Garcia, R.S.; Weisser, D. A wind-diesel system with hydrogen storage: Joint optimisation of design and dispatch. Renew. Energy 2006, 31, 2296–2320. [Google Scholar] [CrossRef]
- Hong, C.M.; Ou, T.C.; Lu, K.H. Development of intelligent MPPT (maximum power point tracking) control for a grid-connected hybrid power generation system. Energy 2013, 50, 270–279. [Google Scholar] [CrossRef]
- Kriston, A.; Szabó, T.; Inzelt, G. The marriage of car sharing and hydrogen economy: A possible solution to the main problems of urban living. Int. J. Hydrog. Energy 2010, 35, 12697–12708. [Google Scholar] [CrossRef]
- Iglesias, F.; Palensky, P.; Cantos, S.; Kupzog, F. Demand Side Management for Stand-Alone Hybrid Power Systems Based on Load Identification. Energies 2012, 5, 4517–4532. [Google Scholar] [CrossRef]
- Dorigo, M.; Maniezzo, V. Ant system: Optimization by a colony of cooperating agents. IEEE Trans. Syst. 1996, 26, 29–41. [Google Scholar] [CrossRef] [PubMed]
- Han, P. The Theory and Application of Intelligent Control; China Electric Power Press: Beijing, China, 2012; pp. 39–73. [Google Scholar]
- Aziz, O.; Belaid, A. Discrete cuckoo search algorithm for the traveling salesman problem. Neural Comput. Appl. 2014, 24, 1659–1669. [Google Scholar]
- Li, C.H.; Zhu, X.J. Dynamic modeling and sizing optimization of stand-alone photovoltaic power systems using hybrid energy storage technology. Renew. Energy 2009, 34, 825–826. [Google Scholar] [CrossRef]


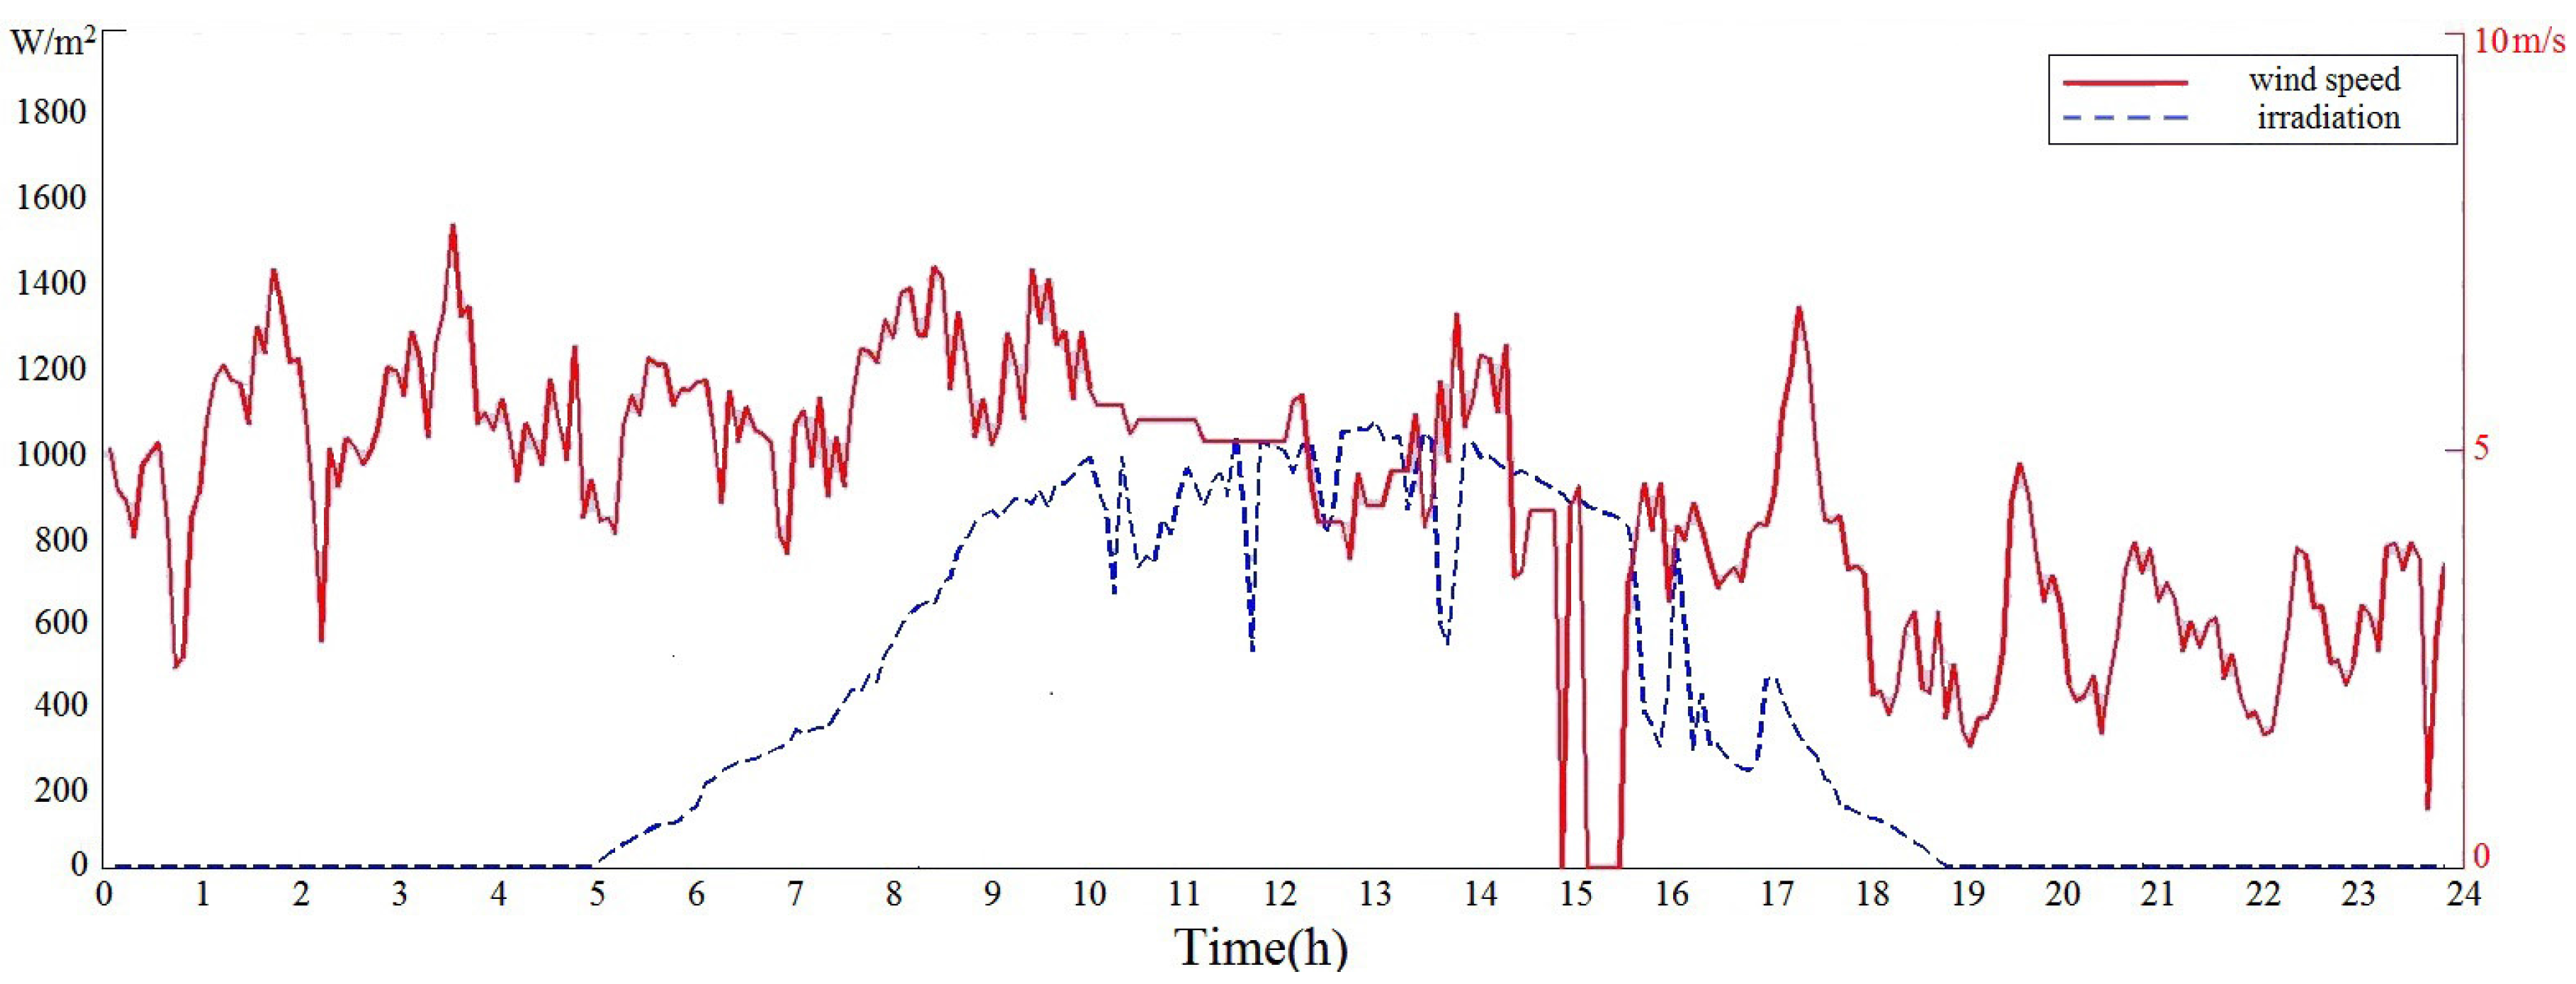
| Month | Wind Speed (m/s) | Irradiation (kW/m2) |
|---|---|---|
| January | 7.41 | 15 |
| February | 7.28 | 18 |
| March | 5.85 | 20 |
| April | 5.20 | 30 |
| May | 4.81 | 45 |
| June | 4.94 | 53 |
| July | 4.55 | 50 |
| August | 4.42 | 51 |
| September | 5.85 | 50 |
| October | 6.76 | 43 |
| November | 7.54 | 38 |
| December | 8.19 | 20 |
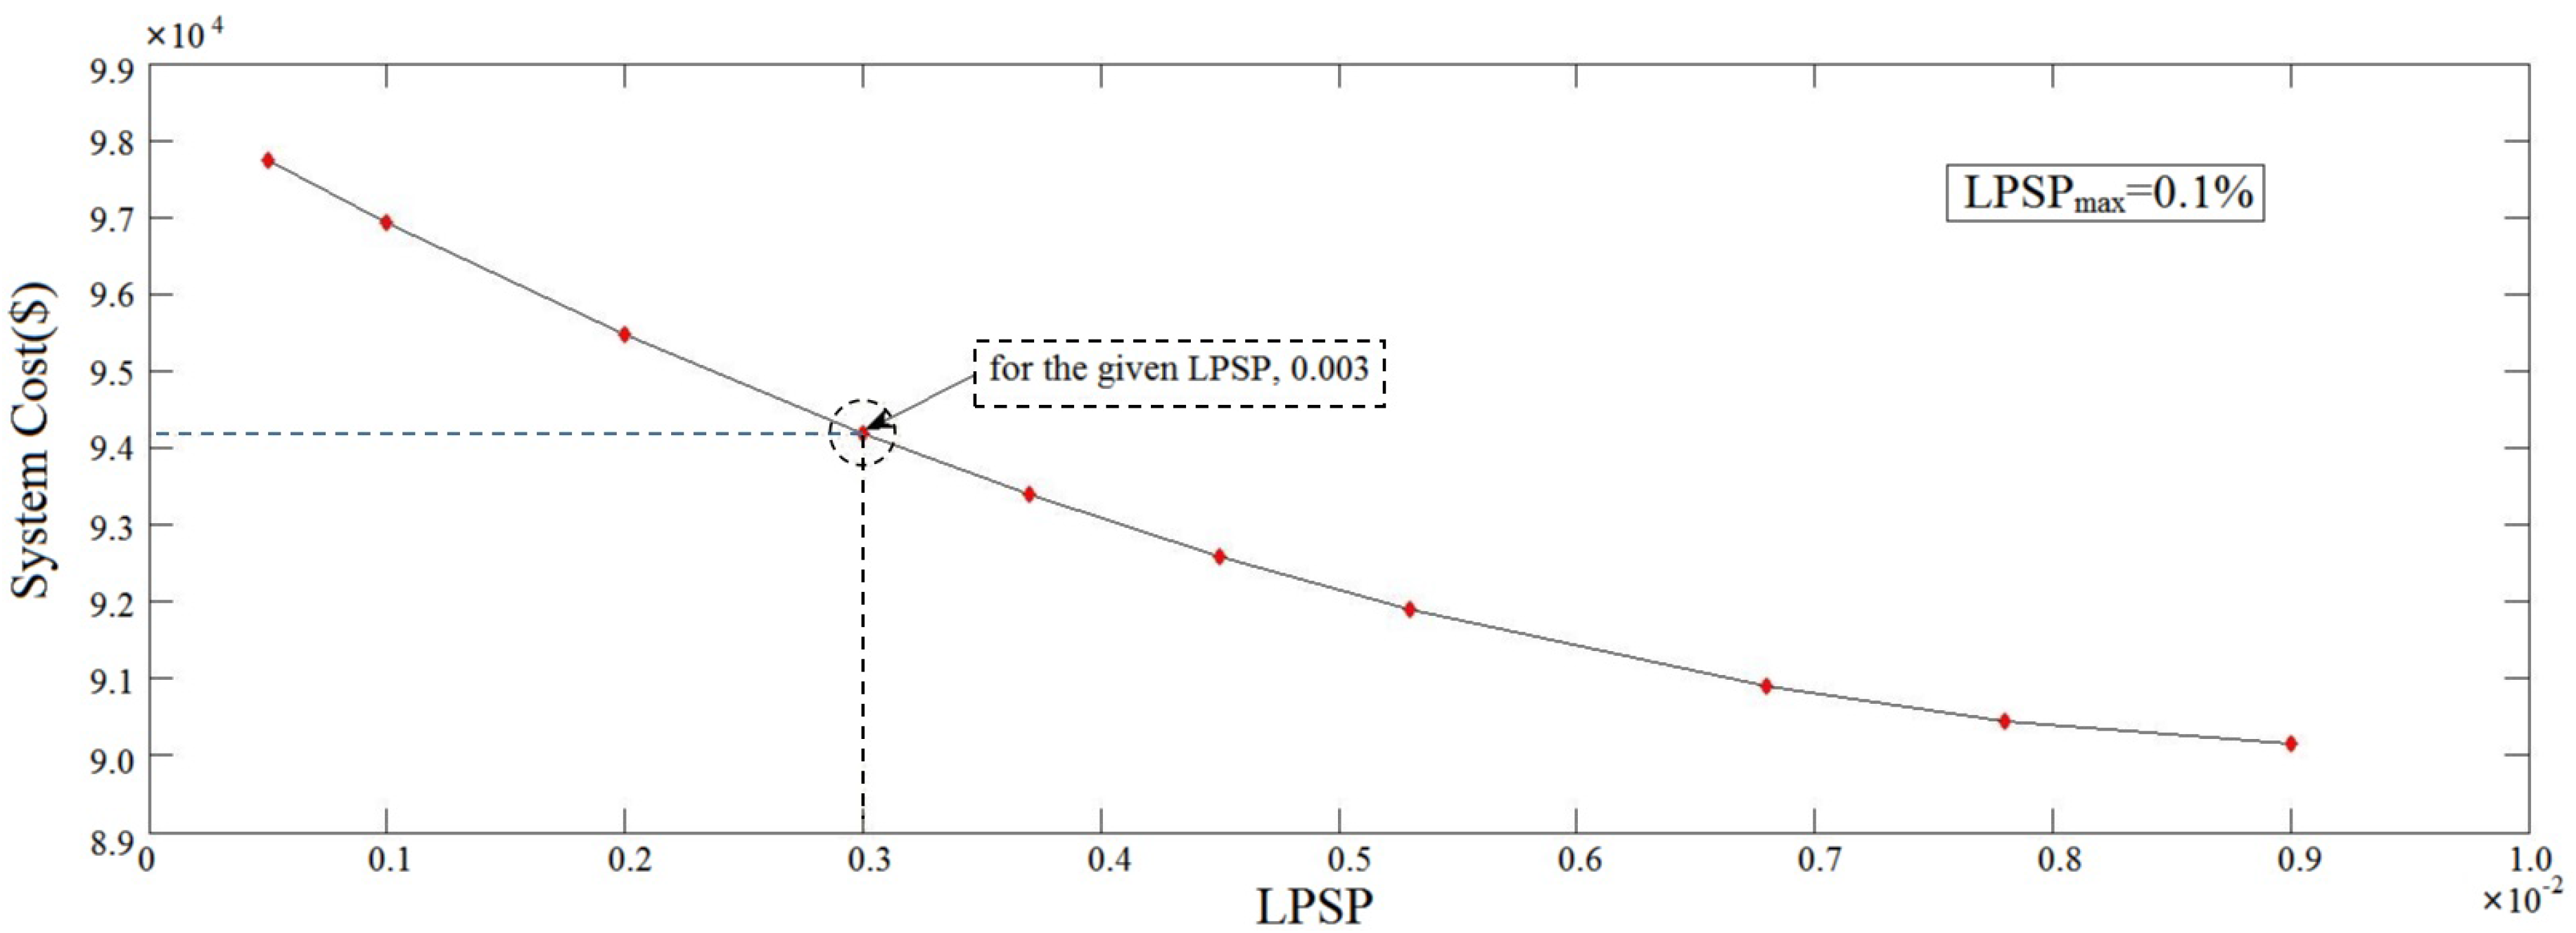
| Cost (×104) | LPSP (×10-2) | ||||
|---|---|---|---|---|---|
| 8.99 | 0.90 | 90 | 9 | 232 | 307 |
| 9.06 | 0.78 | 92 | 11 | 240 | 307 |
| 9.13 | 0.68 | 95 | 11 | 243 | 309 |
| 9.18 | 0.53 | 99 | 12 | 253 | 311 |
| 9.21 | 0.45 | 107 | 13 | 267 | 313 |
| 9.39 | 0.37 | 113 | 15 | 271 | 313 |
| 9.41 | 0.30 | 120 | 14 | 272 | 315 |
| 9.53 | 0.20 | 130 | 16 | 283 | 327 |
| 9.64 | 0.10 | 143 | 16 | 287 | 329 |
| 9.83 | 0.05 | 147 | 17 | 292 | 331 |
© 2016 by the authors; licensee MDPI, Basel, Switzerland. This article is an open access article distributed under the terms and conditions of the Creative Commons Attribution (CC-BY) license (http://creativecommons.org/licenses/by/4.0/).
Share and Cite
Dong, W.; Li, Y.; Xiang, J. Optimal Sizing of a Stand-Alone Hybrid Power System Based on Battery/Hydrogen with an Improved Ant Colony Optimization. Energies 2016, 9, 785. https://doi.org/10.3390/en9100785
Dong W, Li Y, Xiang J. Optimal Sizing of a Stand-Alone Hybrid Power System Based on Battery/Hydrogen with an Improved Ant Colony Optimization. Energies. 2016; 9(10):785. https://doi.org/10.3390/en9100785
Chicago/Turabian StyleDong, Weiqiang, Yanjun Li, and Ji Xiang. 2016. "Optimal Sizing of a Stand-Alone Hybrid Power System Based on Battery/Hydrogen with an Improved Ant Colony Optimization" Energies 9, no. 10: 785. https://doi.org/10.3390/en9100785
APA StyleDong, W., Li, Y., & Xiang, J. (2016). Optimal Sizing of a Stand-Alone Hybrid Power System Based on Battery/Hydrogen with an Improved Ant Colony Optimization. Energies, 9(10), 785. https://doi.org/10.3390/en9100785