Article

Geomechanical, Hydraulic and Thermal Characteristics of Deep Oceanic Sandy Sediments Recovered during the Second Ulleung Basin Gas Hydrate Expedition

1
Department of Civil and Environmental Engineering, Korea Advanced Institute of Science and Technology (KAIST), Daejeon 305-701, Korea
2
Department of Civil and Environmental Engineering, Yonsei University, Seoul 120-749, Korea
3
Division of Petroleum and Marine Resources, Korea Institute of Geoscience and Mineral Resources (KIGAM), Daejeon 305-350, Korea
*
Author to whom correspondence should be addressed.
Energies 2016, 9(10), 775; https://doi.org/10.3390/en9100775
Submission received: 10 June 2016 / Revised: 9 September 2016 / Accepted: 14 September 2016 / Published: 27 September 2016

Abstract

:
This study investigates the geomechanical, hydraulic and thermal characteristics of natural sandy sediments collected during the Ulleung Basin gas hydrate expedition 2, East Sea, offshore Korea. The studied sediment formation is considered as a potential target reservoir for natural gas production. The sediments contained silt, clay and sand fractions of 21%, 1.3% and 77.7%, respectively, as well as diatomaceous minerals with internal pores. The peak friction angle and critical state (or residual state) friction angle under drained conditions were ~26° and ~22°, respectively. There was minimal or no apparent cohesion intercept. Stress- and strain-dependent elastic moduli, such as tangential modulus and secant modulus, were identified. The sediment stiffness increased with increasing confining stress, but degraded with increasing strain regime. Variations in water permeability with water saturation were obtained by fitting experimental matric suction-water saturation data to the Maulem-van Genuchen model. A significant reduction in thermal conductivity (from ~1.4–1.6 to ~0.5–0.7 W·m−1·K−1) was observed when water saturation decreased from 100% to ~10%–20%. In addition, the electrical resistance increased quasi-linearly with decreasing water saturation. The geomechanical, hydraulic and thermal properties of the hydrate-free sediments reported herein can be used as the baseline when predicting properties and behavior of the sediments containing hydrates, and when the hydrates dissociate during gas production. The variations in thermal and hydraulic properties with changing water and gas saturation can be used to assess gas production rates from hydrate-bearing deposits. In addition, while depressurization of hydrate-bearing sediments inevitably causes deformation of sediments under drained conditions, the obtained strength and stiffness properties and stress-strain responses of the sedimentary formation under drained loading conditions can be effectively used to assess sediment responses to depressurization to ensure safe gas production operations in this potential target reservoir.

Graphical Abstract

1. Introduction

Gas hydrates are ice-like solid compounds that encapsulate gas molecules in hydrogen-bonded water cages. Natural gas hydrates are found in both permafrost and oceanic sediments, where temperature and pressure satisfy the thermodynamic conditions required for gas hydrates, and where an abundant gas flux is supplied. The abundance of natural gas hydrates has garnered interest as a potential energy resource. Moreover, the characterization of the geomechanical, transport, and thermal properties of the sediments hosting the gas hydrates is essential to our fundamental understanding of natural gas hydrate formation, as well as for the safe and effective production of gas from hydrate deposits.
Natural gas hydrates were identified in the Ulleung Basin, East Sea, during the Ulleung Basin gas hydrate expeditions 1 and 2 (UBGH1 and UBGH2) in 2007 [1,2] and 2010 [3,4]. The physical, geotechnical, and thermal properties of the sediment cores recovered were obtained via various on-board and on-shore laboratory experiments. A majority of the studies on the characterization of Ulleung Basin sediments have focused on silty or clayey sediments [5,6,7,8]; however, few studies have characterized the properties of sandy sediments, except for Reference [9]. Given that sandy sediment layers provide feasible conditions for safe and productive gas production (e.g., low compressibility and high permeability), their characterization is critical.
There are four categories of properties required to assess gas production from hydrate deposits:
(a)
physical properties (e.g., density, hydrate saturation, porosity, and particle size distribution);
(b)
thermal properties (e.g., thermal conductivity and heat capacity);
(c)
transport properties (e.g., absolute permeability and relative permeability for gas and water phases); and
(d)
mechanical properties (e.g., stiffness and strength).
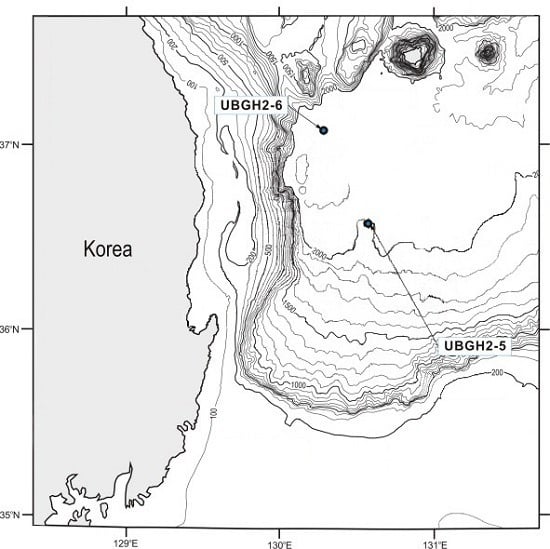
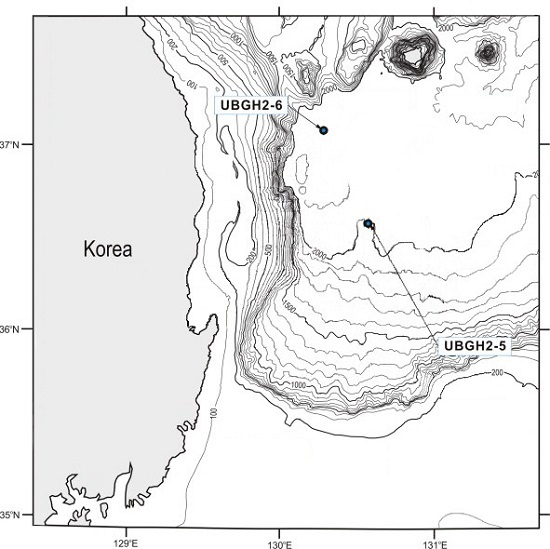
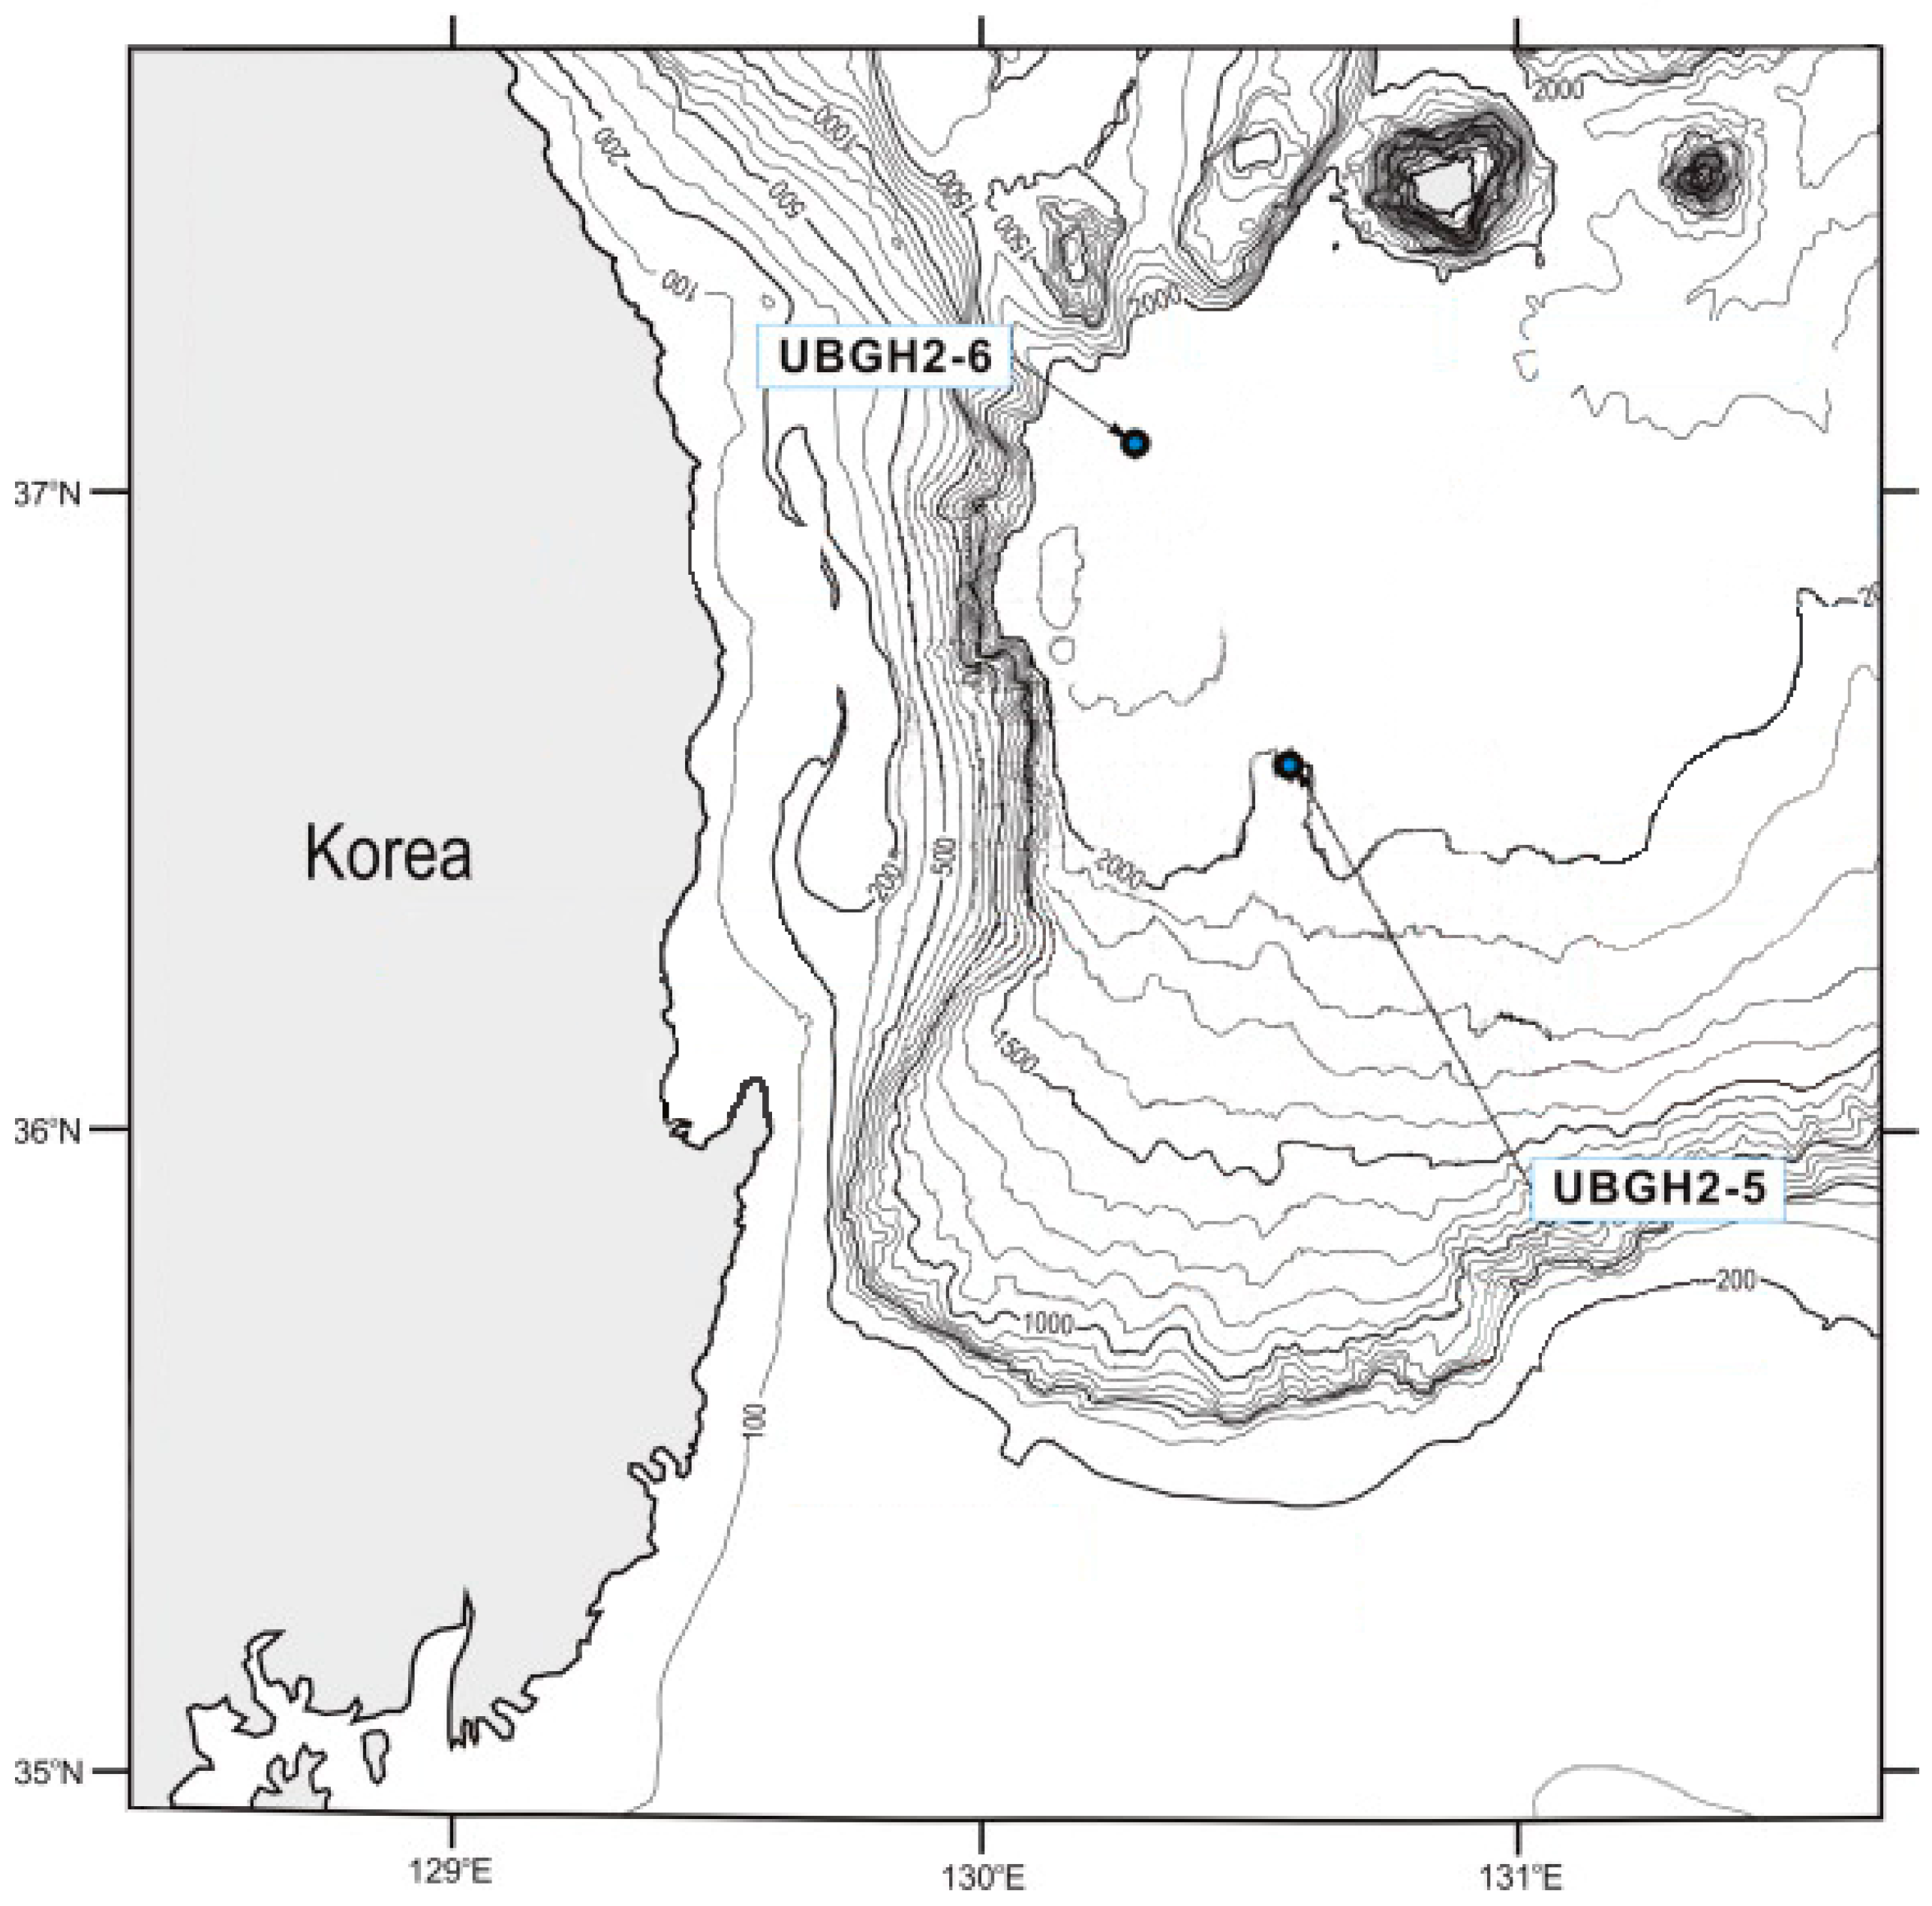
The compilation of data on these properties provides a baseline for assessing hydrocarbon production rates and the geomechanical stability of reservoirs. However, while previous studies have attempted to obtain various sediment properties by conducting laboratory tests, several properties are often missed. Noting that the previous field production tests (e.g., Malilik 5L-38, Canada [10]; ConocoPhillips gas hydrate production test in Alaska [11]; offshore methane hydrate production test in the eastern Nankai Trough [12,13]) could not continue for an extended period of time as a result of fines migration and sand production, it is critical to identify a shear failure zone that is likely to generate the most fines migration and sand production. Thus, understanding of the interplays among physical, transport, and mechanical properties, such as fines content and pore size, will provide baseline knowledge to predict such fines migration and sand production.
In this study, we experimentally investigated the geomechanical, hydraulic, and thermal characteristics of natural sandy sediments, recovered from a sand layer with high gas hydrate saturation (i.e., Sh > 40%, estimated from the ring resistivity logging results). This is considered to be a prospective player for hydrate production. Using various laboratory tests and analyses, we determined the physical and basic index properties. The mechanical stiffness and strength of the remolded sediment were obtained from triaxial compression tests. The thermal conductivity of the remolded sample and the relative permeability of the water phase through the medium were extracted from the water retention tests. Then, models that predict the sediment properties when containing gas hydrates, based on the obtained baseline properties of the hydrate-free sediment samples, are discussed.

2. Study Area

2.1. Site of Interest

The Ulleung Basin is a deep, bowl-shaped back-arc basin located in the southwestern part of the East Sea, Korea [14,15]. The water depth in the basin is 1500–2300 m and gradually deepens toward the northeast (to a maximum depth of 2400–3200 m) [16]. The majority of the sediments in the Ulleung Basin were transported from the continental shelf and slope, although terrigenous materials were contributed by small rivers [15]. Gas hydrates were first identified in the center of the Ulleung Basin by using shallow gravity corers [17]. Following this, UBGH1 logged five sites and cored three sites in 2007 [1,2], whereas UBGH2, conducted in 2010, logged 13 sites and cored 10 sites, in order to locate potential sites for offshore production testing [3,4,18].
Among the cored sites of the UBGH2 expedition, UBGH2-6 (located at 37°00′N, 130°53′E) was the most northerly (Figure 1) [8,18]. At this location, the water depth was 2154 m, and the total depth of the drilled hole was 229 m below the seafloor (mbsf). The base of the gas hydrate stability zone (BGHSZ) was estimated at 167 mbsf [3]. Figure 2 shows the results of logging-while-drilling (LWD) and on-board core tests for UBGH2-6. Gas hydrate occurrences were identified at 110–155 mbsf, as can be seen from the P-wave velocity, electrical resistivity, and chlorinity (Figure 2). Within this interval, the presence of numerous thin to thick gas hydrate-bearing sand layers with high gas hydrate saturation was confirmed [3]. Thus, it is considered as a potential production test site. In this study, one of these prospective sand layers, located at ~145 mbsf, was chosen to be investigated for its physical, geomechanical, transport and thermal properties.

2.2. Sampling Location

The sediment sample was cored using a Fugro rotary corer (FRC) at a depth of ~145 mbsf, situated within the gas hydrate occurrence zone of Site UBGH2-6B. The retrieved core (UBGH2-6B-22R or 6B-22R) was ~80 cm in length, extending from top to bottom through 145.15–145.95 mbsf. Core section UBGH2-6-22R contains three layers: sand layers at the top and bottom, and a clay layer in the middle. The sandy sediments found in the Ulleung Basin (i.e., massive and bioturbated sands in the shelf) have been reported to frequently contain laminated and bioturbated clayey layers [14,16,19]. Figure 3 shows the bottom half of the retrieved core. The sediment in the bottom 13 cm of the core (90–103 cm) was selected for analysis (representing 145.81–145.95 mbsf). While determining the exact value is a daunting task, the in situ gas hydrate saturation (Sh) is approximated to be more than ~40% based on the ring resistivity logging results (Figure 2). The main objective of this study is to present the compilation of physical, geomechanical, transport, and thermal properties of the hydrate-free sediment sample (bottom 13 cm of the core UBGH2-6B-22R) as baseline properties for assessing hydrocarbon production rates and the geomechanical stability of reservoirs. For comparison, the thermal and transport properties of the sediment sample UBGH2-5B-22H (or 5B-22H), which has a different particle size range, were additionally obtained to explore the effect of particle size on thermal and transport properties.
Basic information and the physical characteristics of the studied sediment samples are described in Table 1. Further details regarding sample 5B-22H are described by Kim and Yun [9] and Ryu et al. [4]. Following basic on-board tests [18], the sediment samples were preserved in a plastic bag, delivered to the laboratory, and stored in a refrigerator at 4 °C and at atmospheric pressure prior to testing. The properties of samples 6B-22R and 5B-22H presented herein were obtained from disturbed, and thus remolded, samples following rinsing and oven drying, so as to achieve consistent initial sample conditions for all tests.

3. Materials and Methods

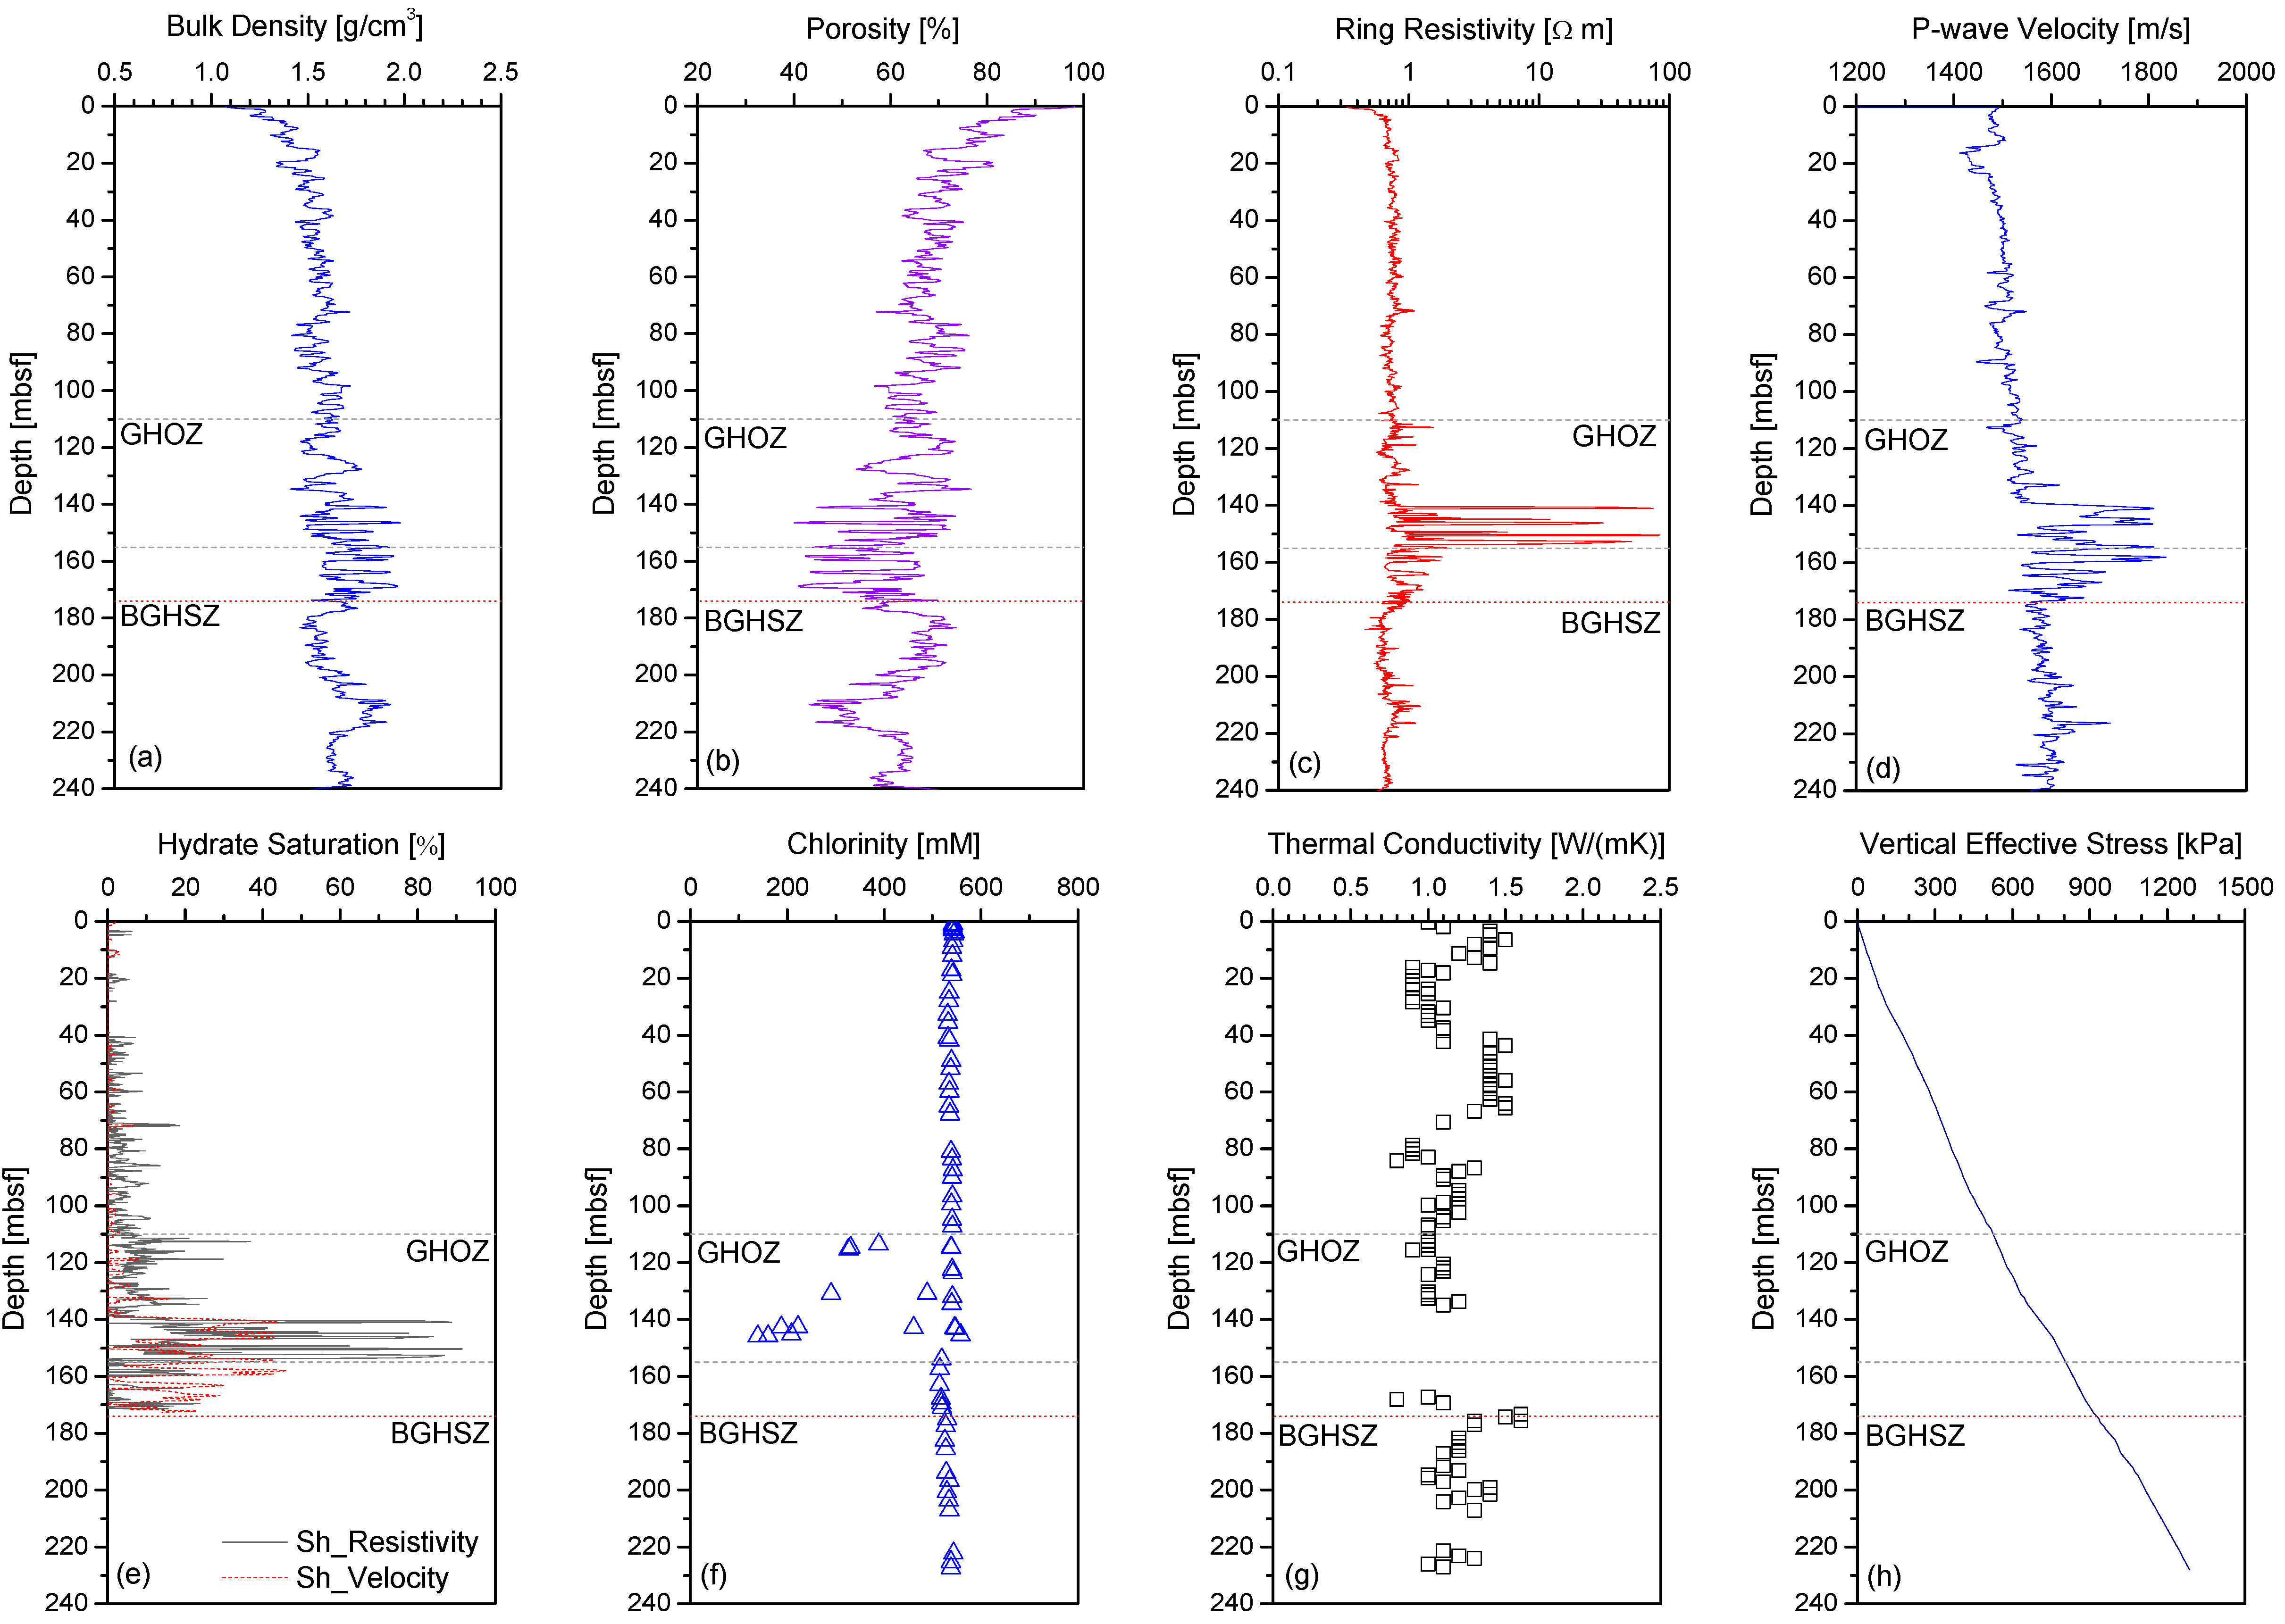
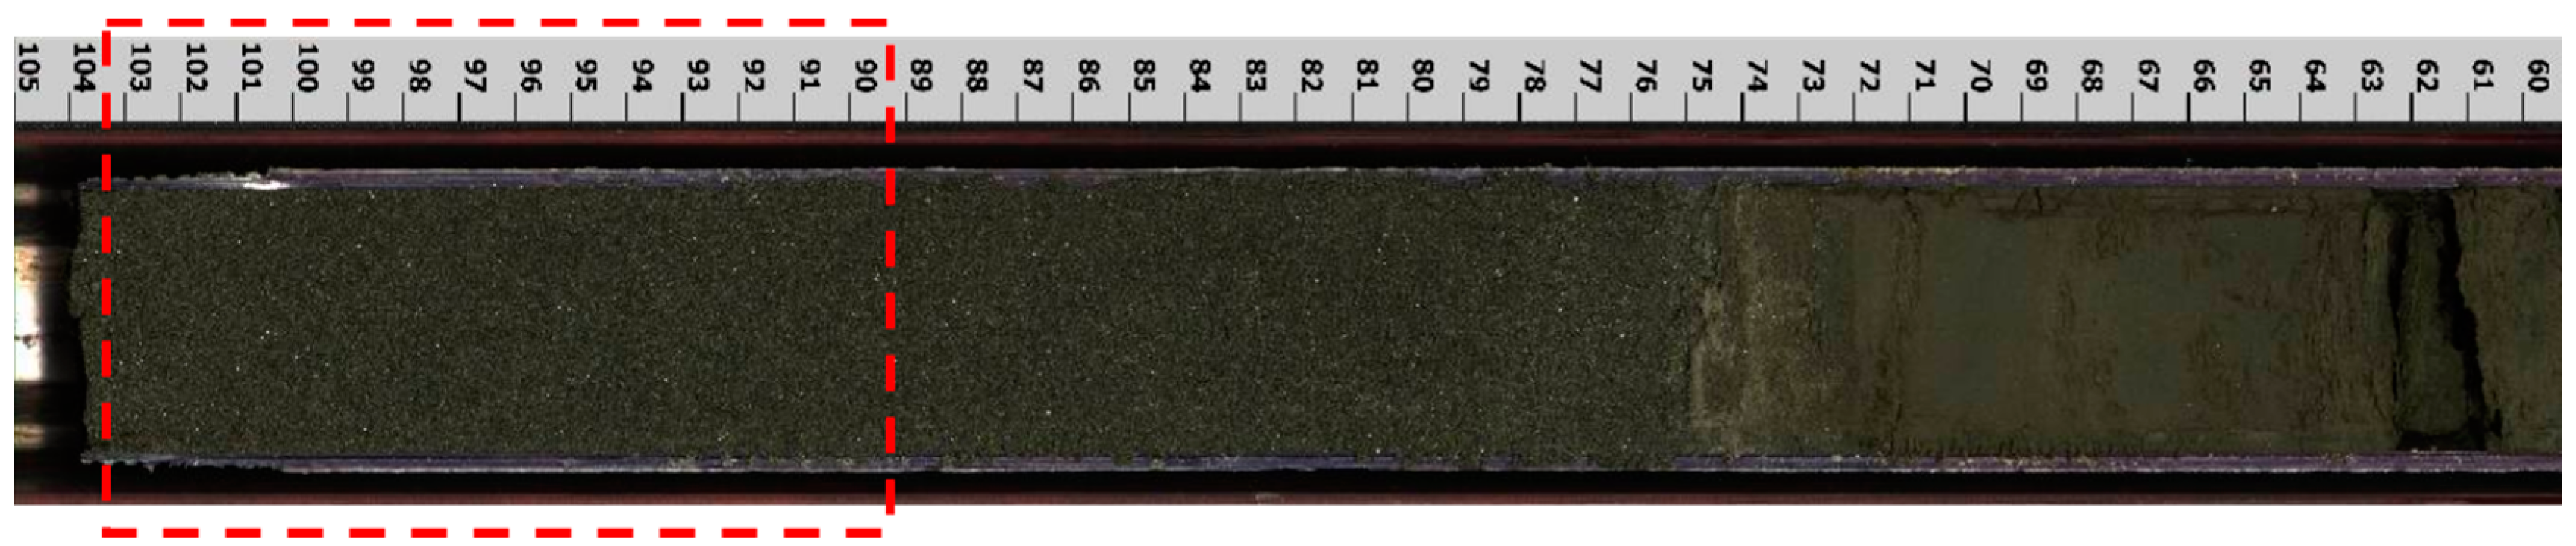
3.1. Description of Sediment Core Samples: Physical and Index Properties

The physical and index properties of sediments, such as porosity, grain size distribution, mean grain size, grain shapes, and mineralogy, are known to play a role in determining the morphology, extent, and growth characteristics of natural gas hydrates [20]. Thus, these properties are baseline parameters for estimating the geomechanical, transport, and thermal properties of hydrate-free, hydrate-containing, and post-dissociation sediments [21]. Furthermore, they can provide valuable information for predicting hydrate occurrence in sediments. In this section, we present the physical and index properties of sediment sample 6B-22R, including grain size distribution, fines content, mean grain size, scanning electron microscope (SEM) images of grain shapes, and mineralogy obtained through X-ray diffraction (XRD) analysis.

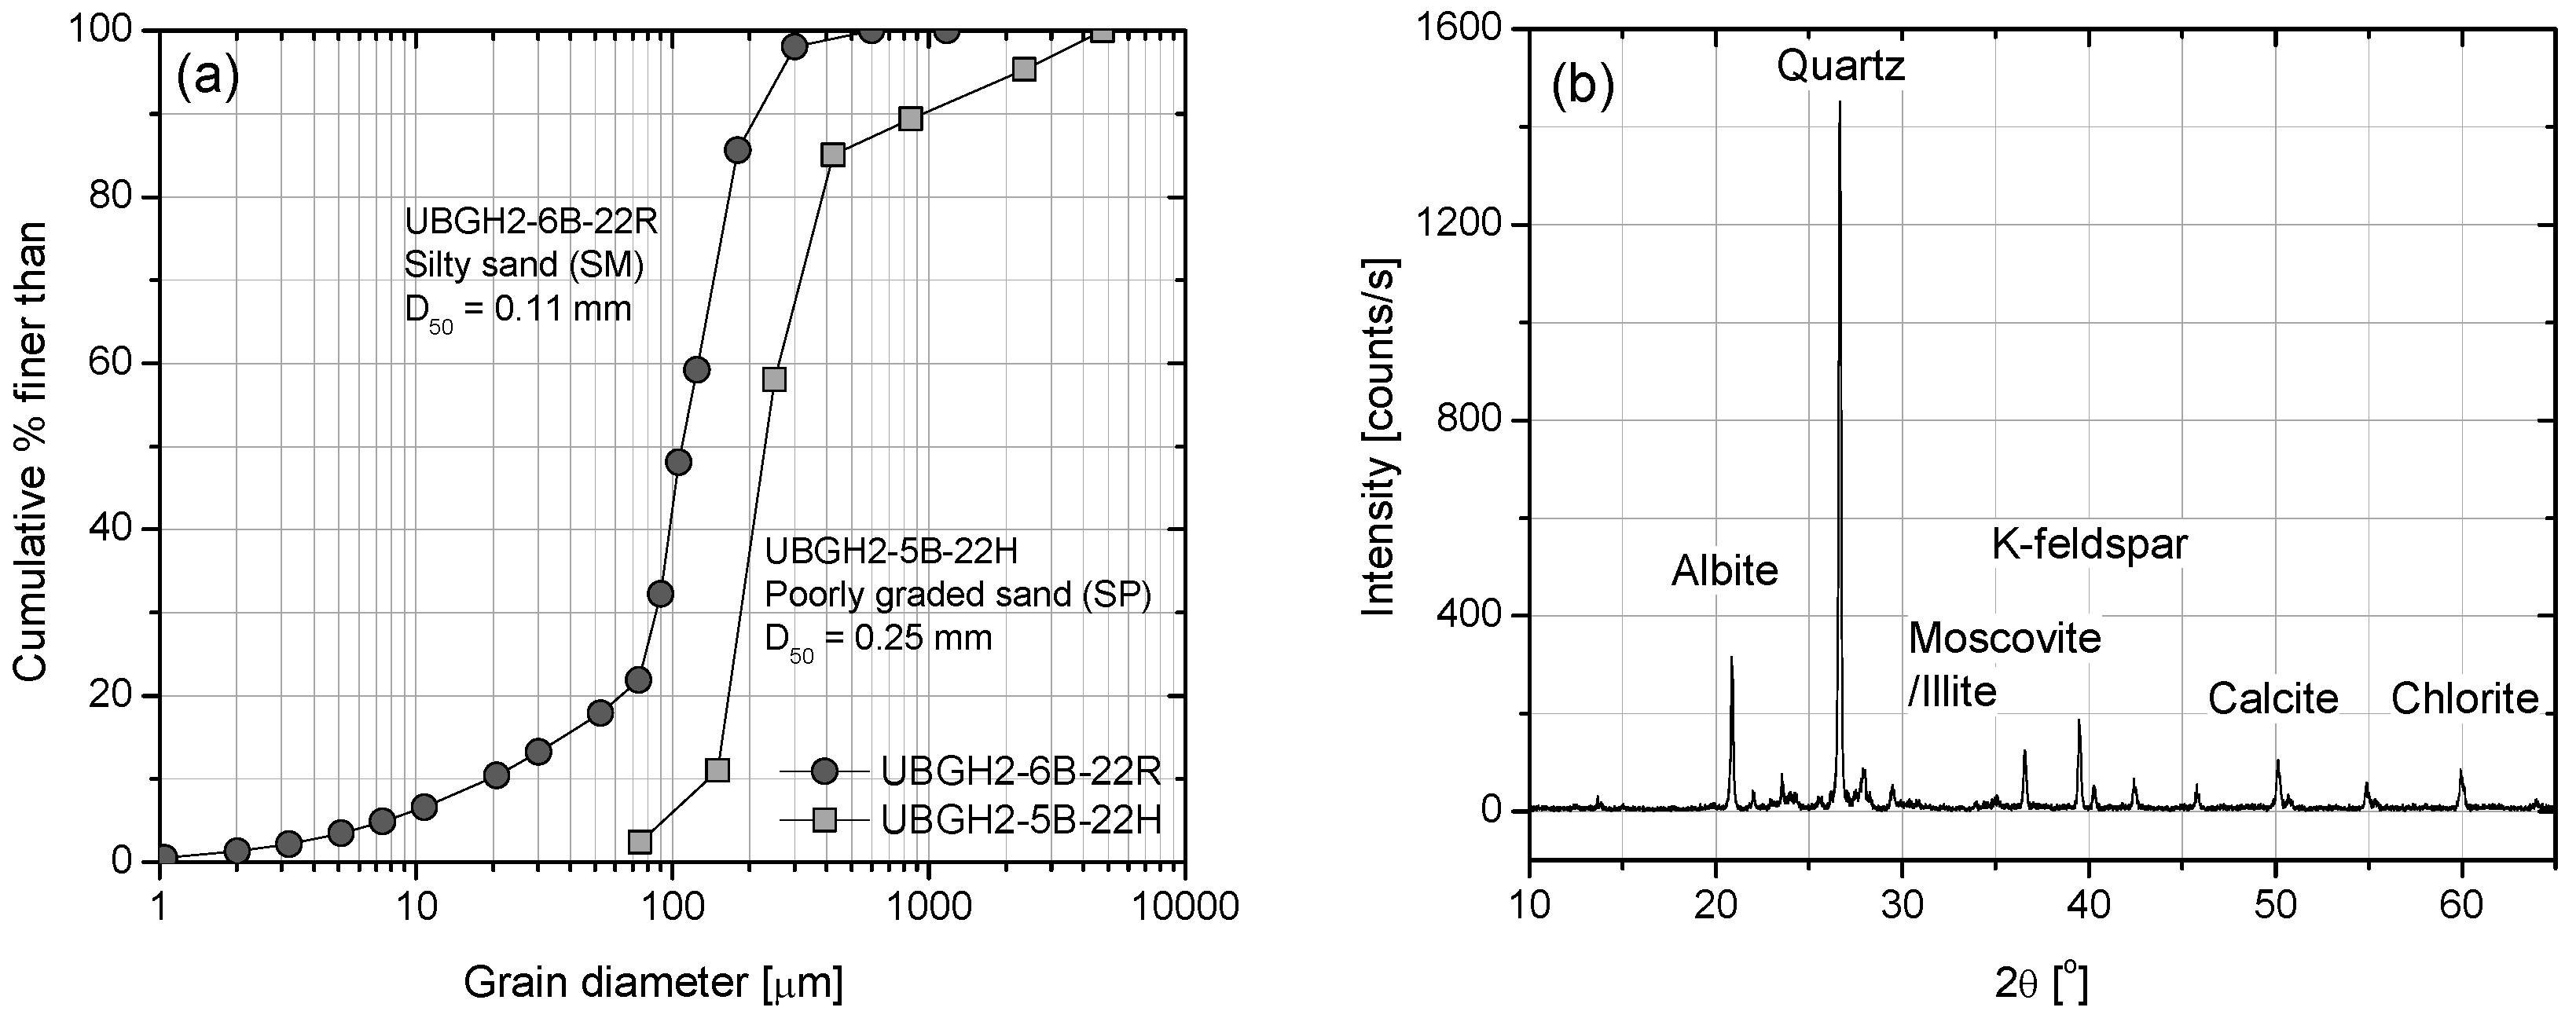
3.1.1. Particle Size Distribution and Soil Classification

Figure 4a shows the particle size distributions of sediment samples 6B-22R and 5B-22H, obtained by sieve analysis and laser diffraction particle size analysis (LS230, Beckman Coulter, West Sacramento, CA, USA) of both coarse and fine particles. For sample 6B-22R, the mean particle diameter (D50) is ~110 μm, while the majority of the sediment particles range from 1 μm to 1000 μm. For sample 6B-22R, the fractions of clay (<2 μm) and sand (>75 μm) are ~1.3% and ~78.1%, respectively, while the remainder (~21% of the sediment) is silt (>2 μm and <75 μm). Due to the low clay fraction, the sample exhibits no or minimal plasticity. The coefficient of uniformity (i.e., Cu = D60/D10) is 6.3, and the coefficient of curvature (i.e., Cc = (D30)2/[D60·D10]) is 2.9. Thus, the sediment (6B-22R) is characterized as well-graded silty sand (SM), according to unified soil classification system (USCS).
For sample 5B-22H, the mean particle diameter (D50) is ~250 μm, while the sediment particles mostly range from 50 μm to 4750 μm. The particle size of sample 5B-22H is greater than that of sample 2-6B-22R. The sand fraction is ~97.6% with a fines content (<75 μm) of ~2.4%. The clay content is non-measurable. The Cu is 1.7, and the Cc is 0.96. Thus, the sediment (5B-22H) is characterized as poorly graded sand (SP), according to USCS.

3.1.2. Mineralogy from X-Ray Diffraction Analysis

The mineralogy of air-dried sediment sample 6B-22R was evaluated by XRD analysis, conducted using a Phillips Xpert Material Powder Diffractormeter (MPD) (Figure 4b). The sample is comprised of ~64% quartz, 15% albite, and ~4.4% calcite, as well as various accessory clay minerals, including muscovite, illite and chlorite (Table 2).
The calcite signature is presumed from calcareous microfossils and shell fragments, as previously reported by Tanaka and Locat [22] and Lee et al. [7]. The XRD results highlight the absence of pyrite, kaolinite, and montmorillonite in this sandy sediment sample. This is in contrast to the clay-dominant fine-grained sediments from the Ulleung Basin, which contain kaolinite, siliceous/calcareous microfossils, framboidal pyrite (FeS), and occasional montmorillonite [6,7,9], whereas the main mineralogy of sediment sample 5B-22H is reported as silicate minerals with some calcareous fragments [9].

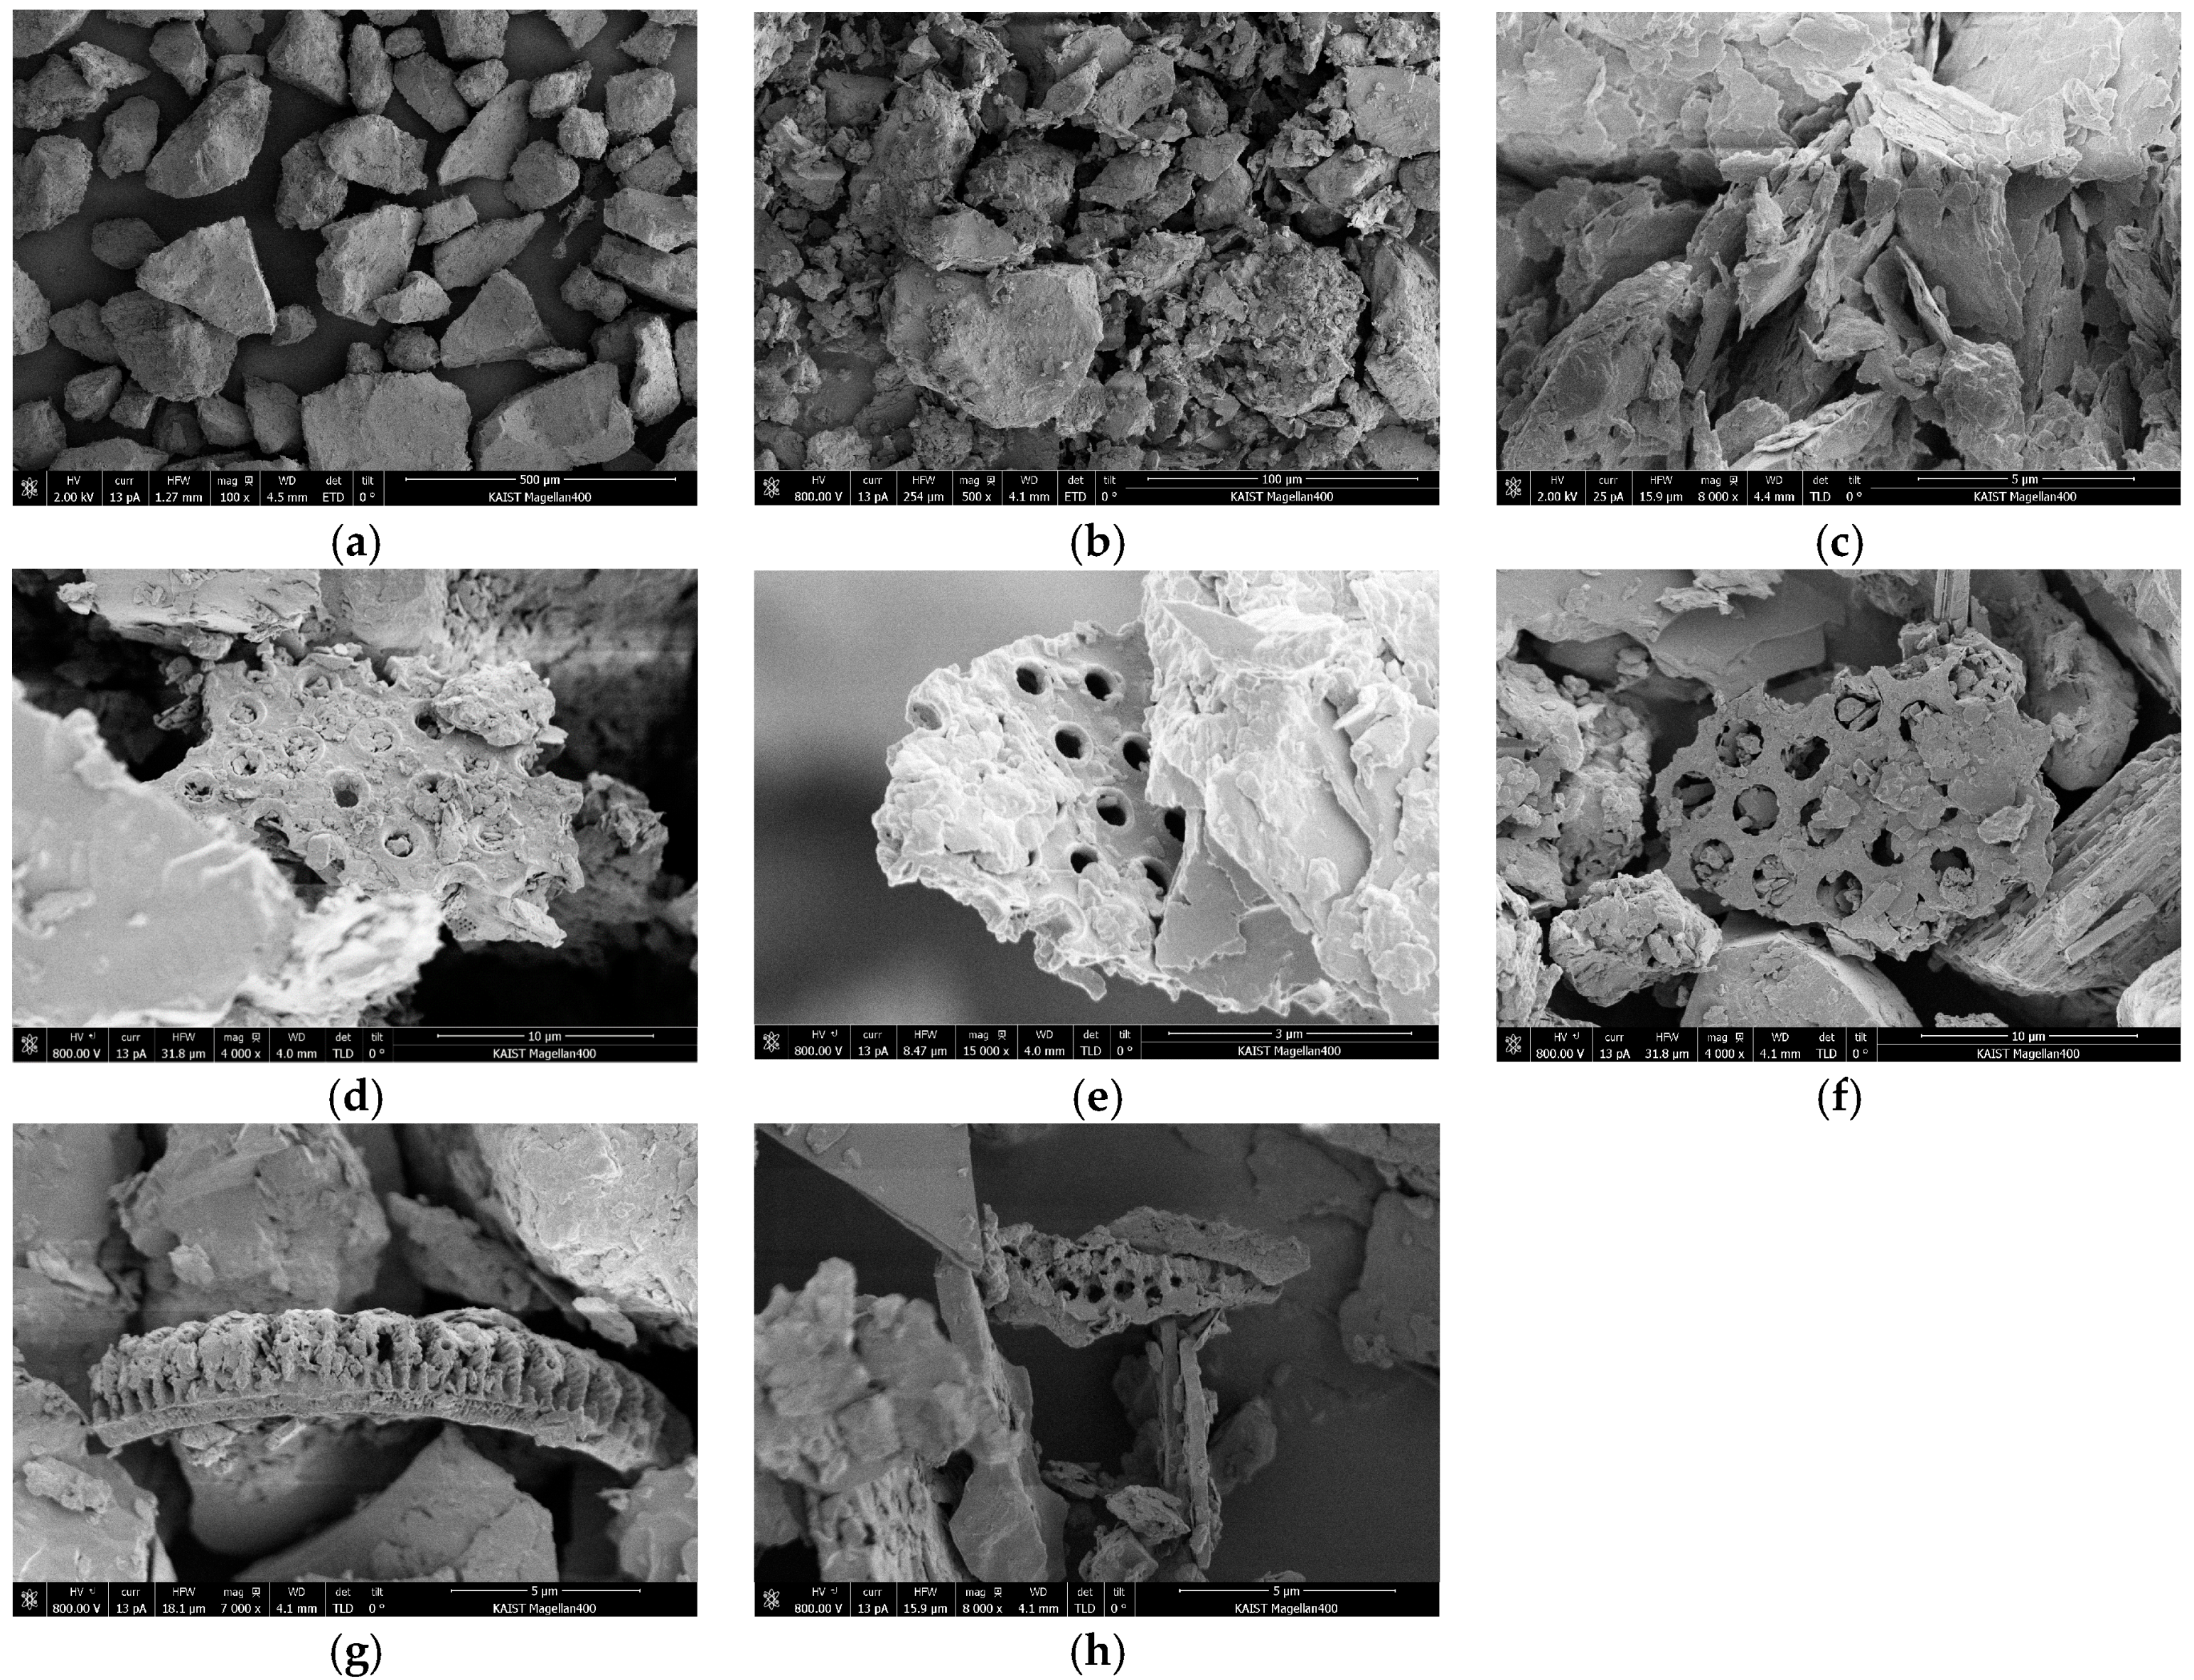
3.1.3. Particle-Scale Observations in Scanning Electron Microscope Images

The particle shape and surface texture of sample 6B-22R were investigated using SEM images (Figure 5). The dominant grains are sand particles with high angularity (Figure 5a), corroborating the particle size distribution and XRD results. Sand particles are covered by platy fine minerals (i.e., clay and silt), which are ~1–5 μm in size (Figure 5b,c). A number of the fine minerals were found to have sub-microscale pores on their surface (Figure 5d–h). Such porous minerals, with nano- to micro-pores, possibly represent fragments of diatomaceous silicate minerals, so thought because microfossils of siliceous planktonic algae (or diatoms) typically show porous silica skeletons [23]. Although the presence of diatoms is predominantly limited to the clay and silt particles, the sample should exhibit a relatively high specific surface area compared with other sandy sediments with similar fines fractions. This is due to the internal pores on diatoms. Thus, such internal pores may play an important role in determining the physical properties of natural sediments, leading to a high natural water content and high plasticity [6,7,22,24].

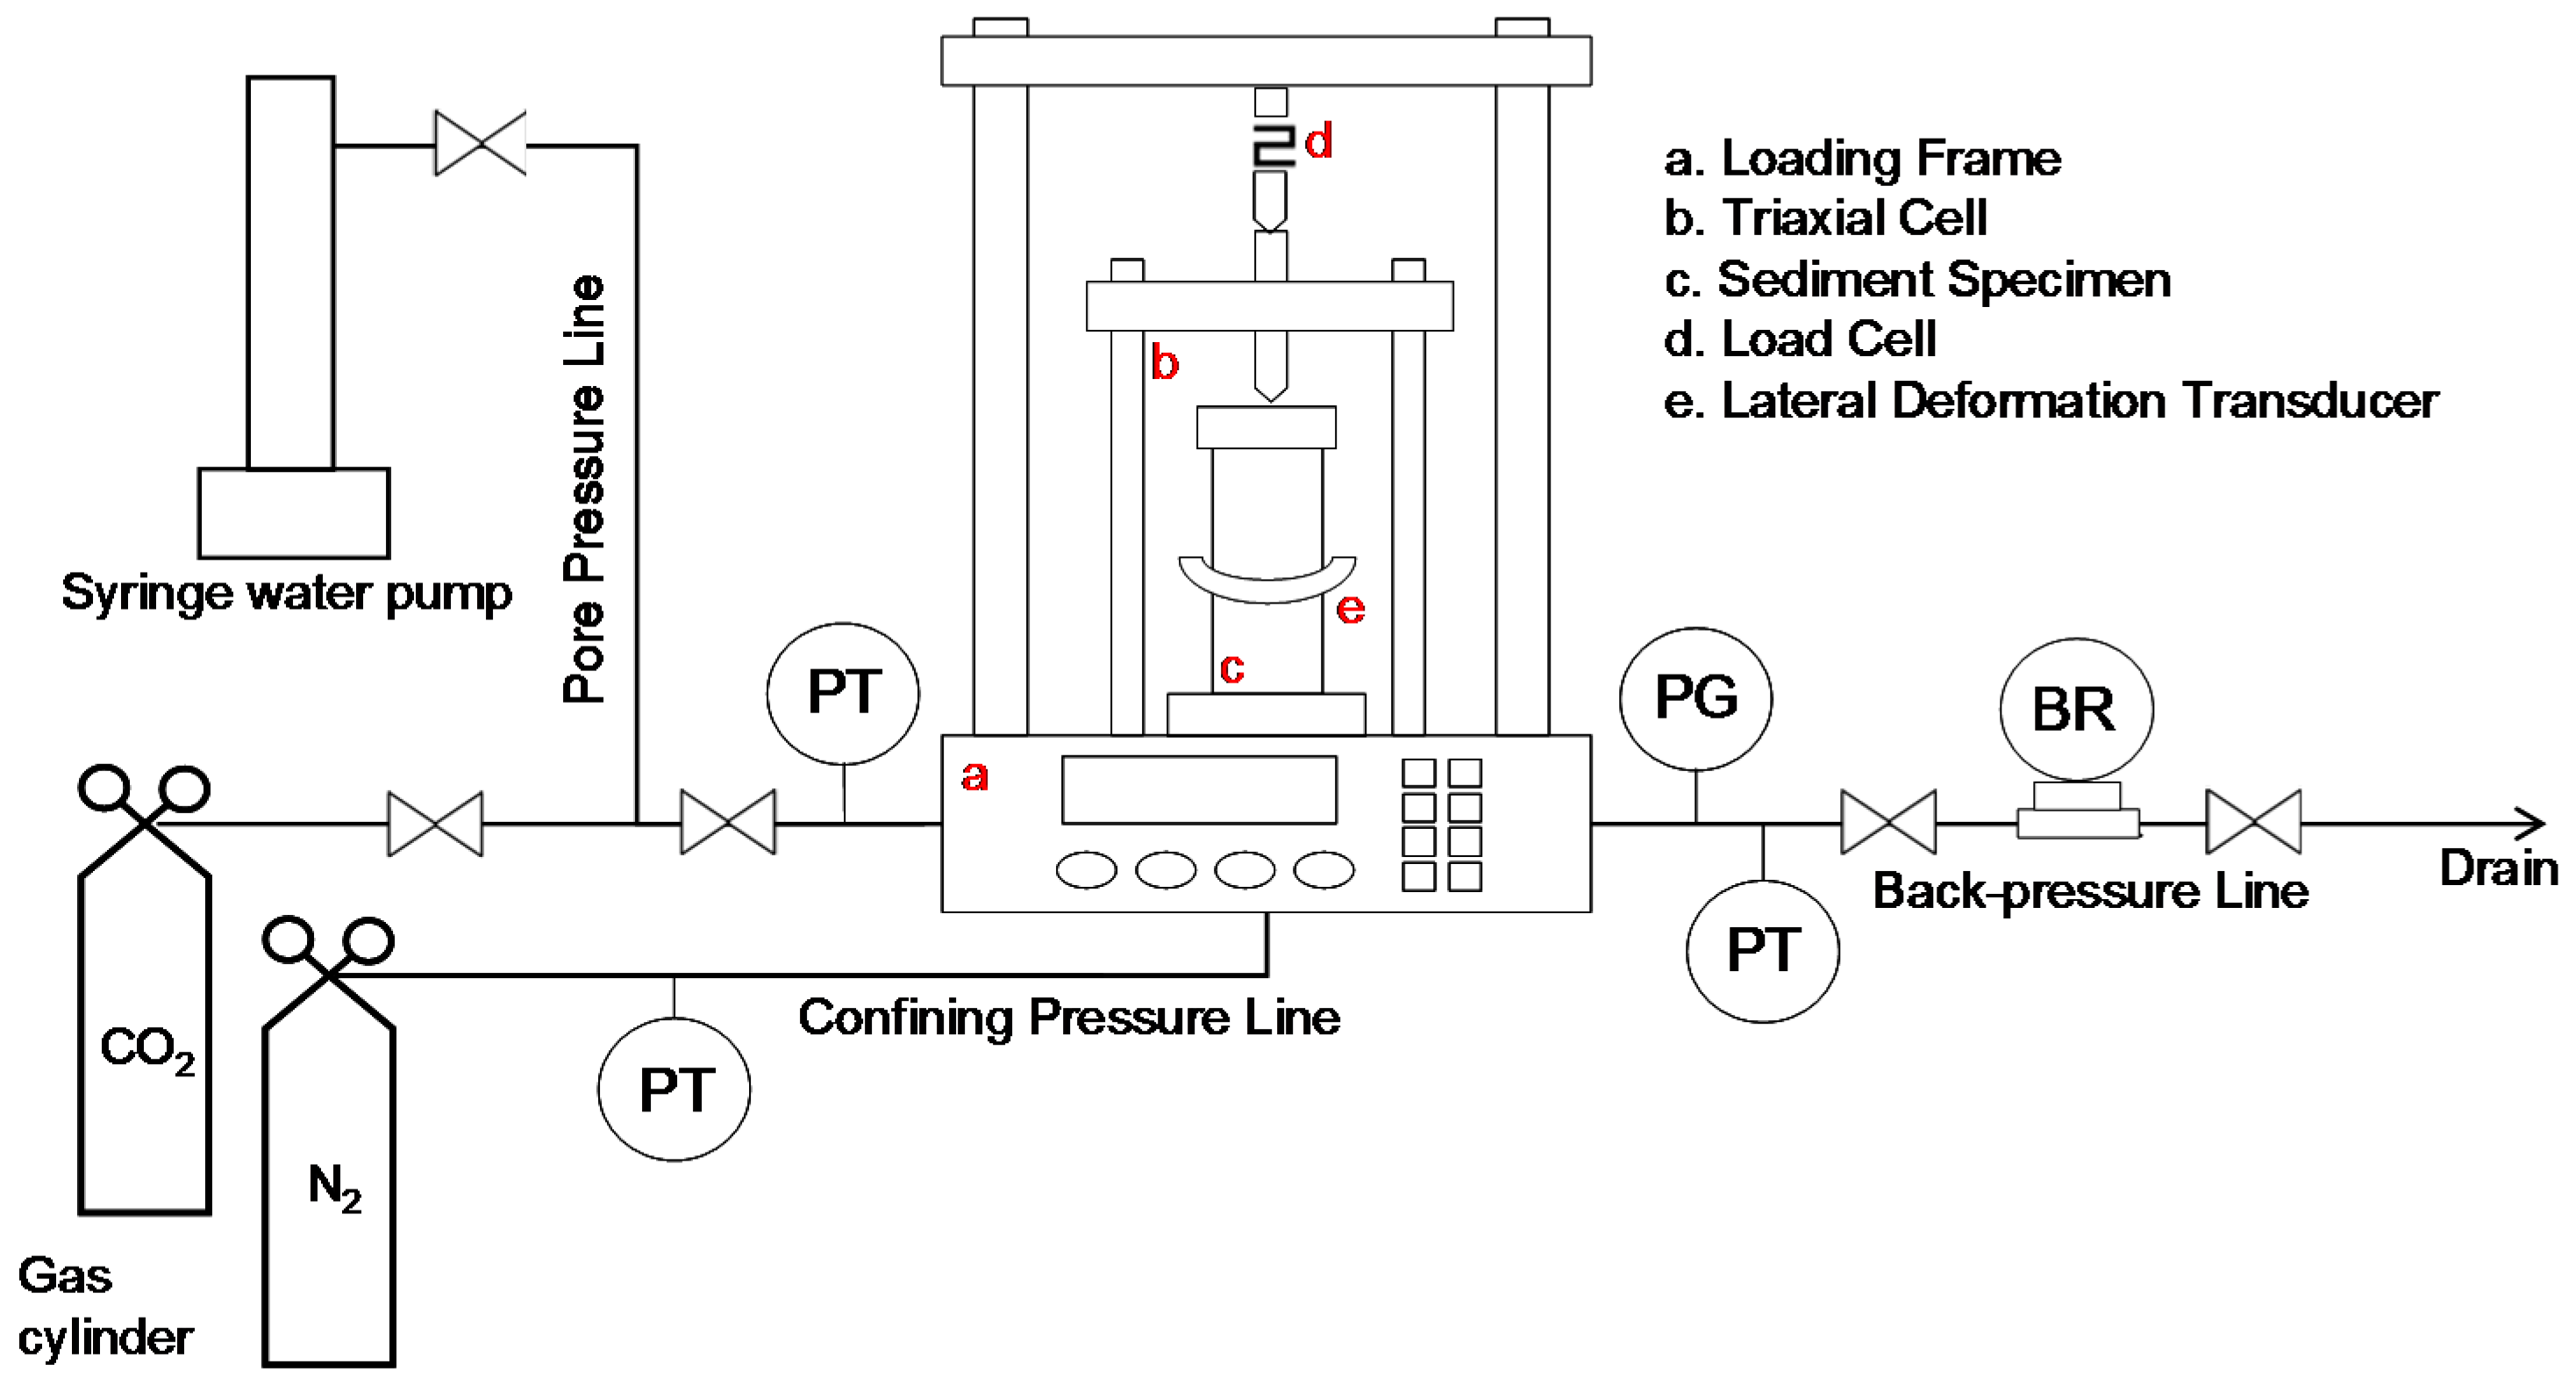
3.2. Setup and Procedure for Triaxial Compression Test

Figure 6 shows the setup for the triaxial compression tests used to obtain the geomechanical responses and parameters of the sediment. Core sample 6B-22R was oven-dried and remolded for the triaxial compression tests. For remolding, every specimen with a height of 76 mm and a diameter of 38 mm was prepared using a dry hand-tamping method. Thereby, the initial dry densities were kept consistent at 1.42–1.49 g/cm3, corresponding to a porosity of ~44%–46% (or void ratio of ~0.8–0.85) throughout the tests. While the in situ porosity of the sample was logged as ~35.4% (Table 1), the remolded samples showed higher porosity values, possibly owing to the presence of fines and the limitation of the hand-tamping method for re-creating the field condition. Meanwhile, it is difficult to rule out the possibility of inaccuracy in the logging result.
Similarly, SM samples from Eastern Nakai Trough showed a porosity of 39.1%–54.1% under confined conditions; in particular, the porosity of the majority of the remolded samples was higher than that of the original samples from the pressure cores [25]. The initial packing conditions of our SM core samples are comparable to previous studies; hence, the obtained strength results are presumed to be valid and are readily expandable. At least, they may serve as a lower bound as a result of the high initial packing porosities. After assembling the triaxial cell, the targeted confining stress (σc) was achieved by injecting nitrogen gas (Figure 6). Then, the specimen was fully saturated with water as follows: Carbon dioxide was injected into and circulated through the specimen at a low pressure (~0.2 MPa) in order to remove air; a vacuum of −80 kPa was then applied to remove the carbon dioxide from the specimen. After repeating this process three times, de-aired water was introduced at the bottom using a syringe pump (500HP, Teledyne ISCO, Lincoln, NE, USA). While maintaining the confining pressure greater than the pore pressure, a back pressure (or pore pressure) of ~0.33–1.13 MPa was applied to achieve 100% water saturation. While maintaining this back pressure, the water injection rate was monitored, and the specimen was seated for more than 6 h until there was no inflow into the specimen. In all tests, B-values of >0.9 were achieved. Thereafter, the confining stress (σc) was adjusted to achieve the targeted effective confining stress; herein, five isotropic effective confining stresses (σ′c) of 0.32, 0.63, 1.47, 2.58 and 5.25 MPa were applied to the fully water-saturated specimens prior to shearing, i.e., at the consolidation stage. Note that these specimens were prepared from the same sand. This stress range was chosen to cover the in situ vertical effective stress of the sand layer from which the sediment core was retrieved, i.e., ~0.75 MPa (Figure 2h and Table 1). This stress value (~0.75 MPa) was estimated from the logging results of bulk density and porosity (Figure 2a,b). The initial conditions of effective confining stress and pore pressure for all of the tested specimens are summarized in Table 3. In this study, we were not able to measure the changes in void ratio during the consolidation stage owing to the difficulty in the saturation processes in that back pressure was applied. Instead, the initial packing void ratio prior to consolidation was used to estimate the volume change behaviors during shearing. If the change in void ratio during the consolidation stages was measured, it would have rendered a more precise measurement of volumetric strain. Nevertheless, the tendency of the measured volume change behavior remains valid owing to the low fraction of clay (~1.3%) in the tested sample.
Once each water-saturated specimen was prepared under a given isotropic effective confining stress condition, the specimen was subjected to shear under a drained condition. Shear stress started to increase as additional vertical stress (deviatoric stress, σd) was applied at a constant axial strain rate. For the five tested specimens, the rate of axial strain (or shearing rate) was kept constant at 0.1% per min (0.076 mm/min; ASTM D7181-11) [26]. The shearing continued to an axial strain (εa) of 25%, with the exception of the case under the lowest confining stress. Changes in specimen volume were logged using the syringe pump that maintained the back pressure. For the two cases with effective confining stresses of 0.32 MPa and 0.63 MPa, the lateral deformation of each specimen, or the change in the central diameter of the specimen during shear, was measured using a local displacement transducer (LDT) mounted at the middle height of the specimen [27,28]. This lateral deformation measurement allowed for the estimation of the Poisson’s ratio of the sample.

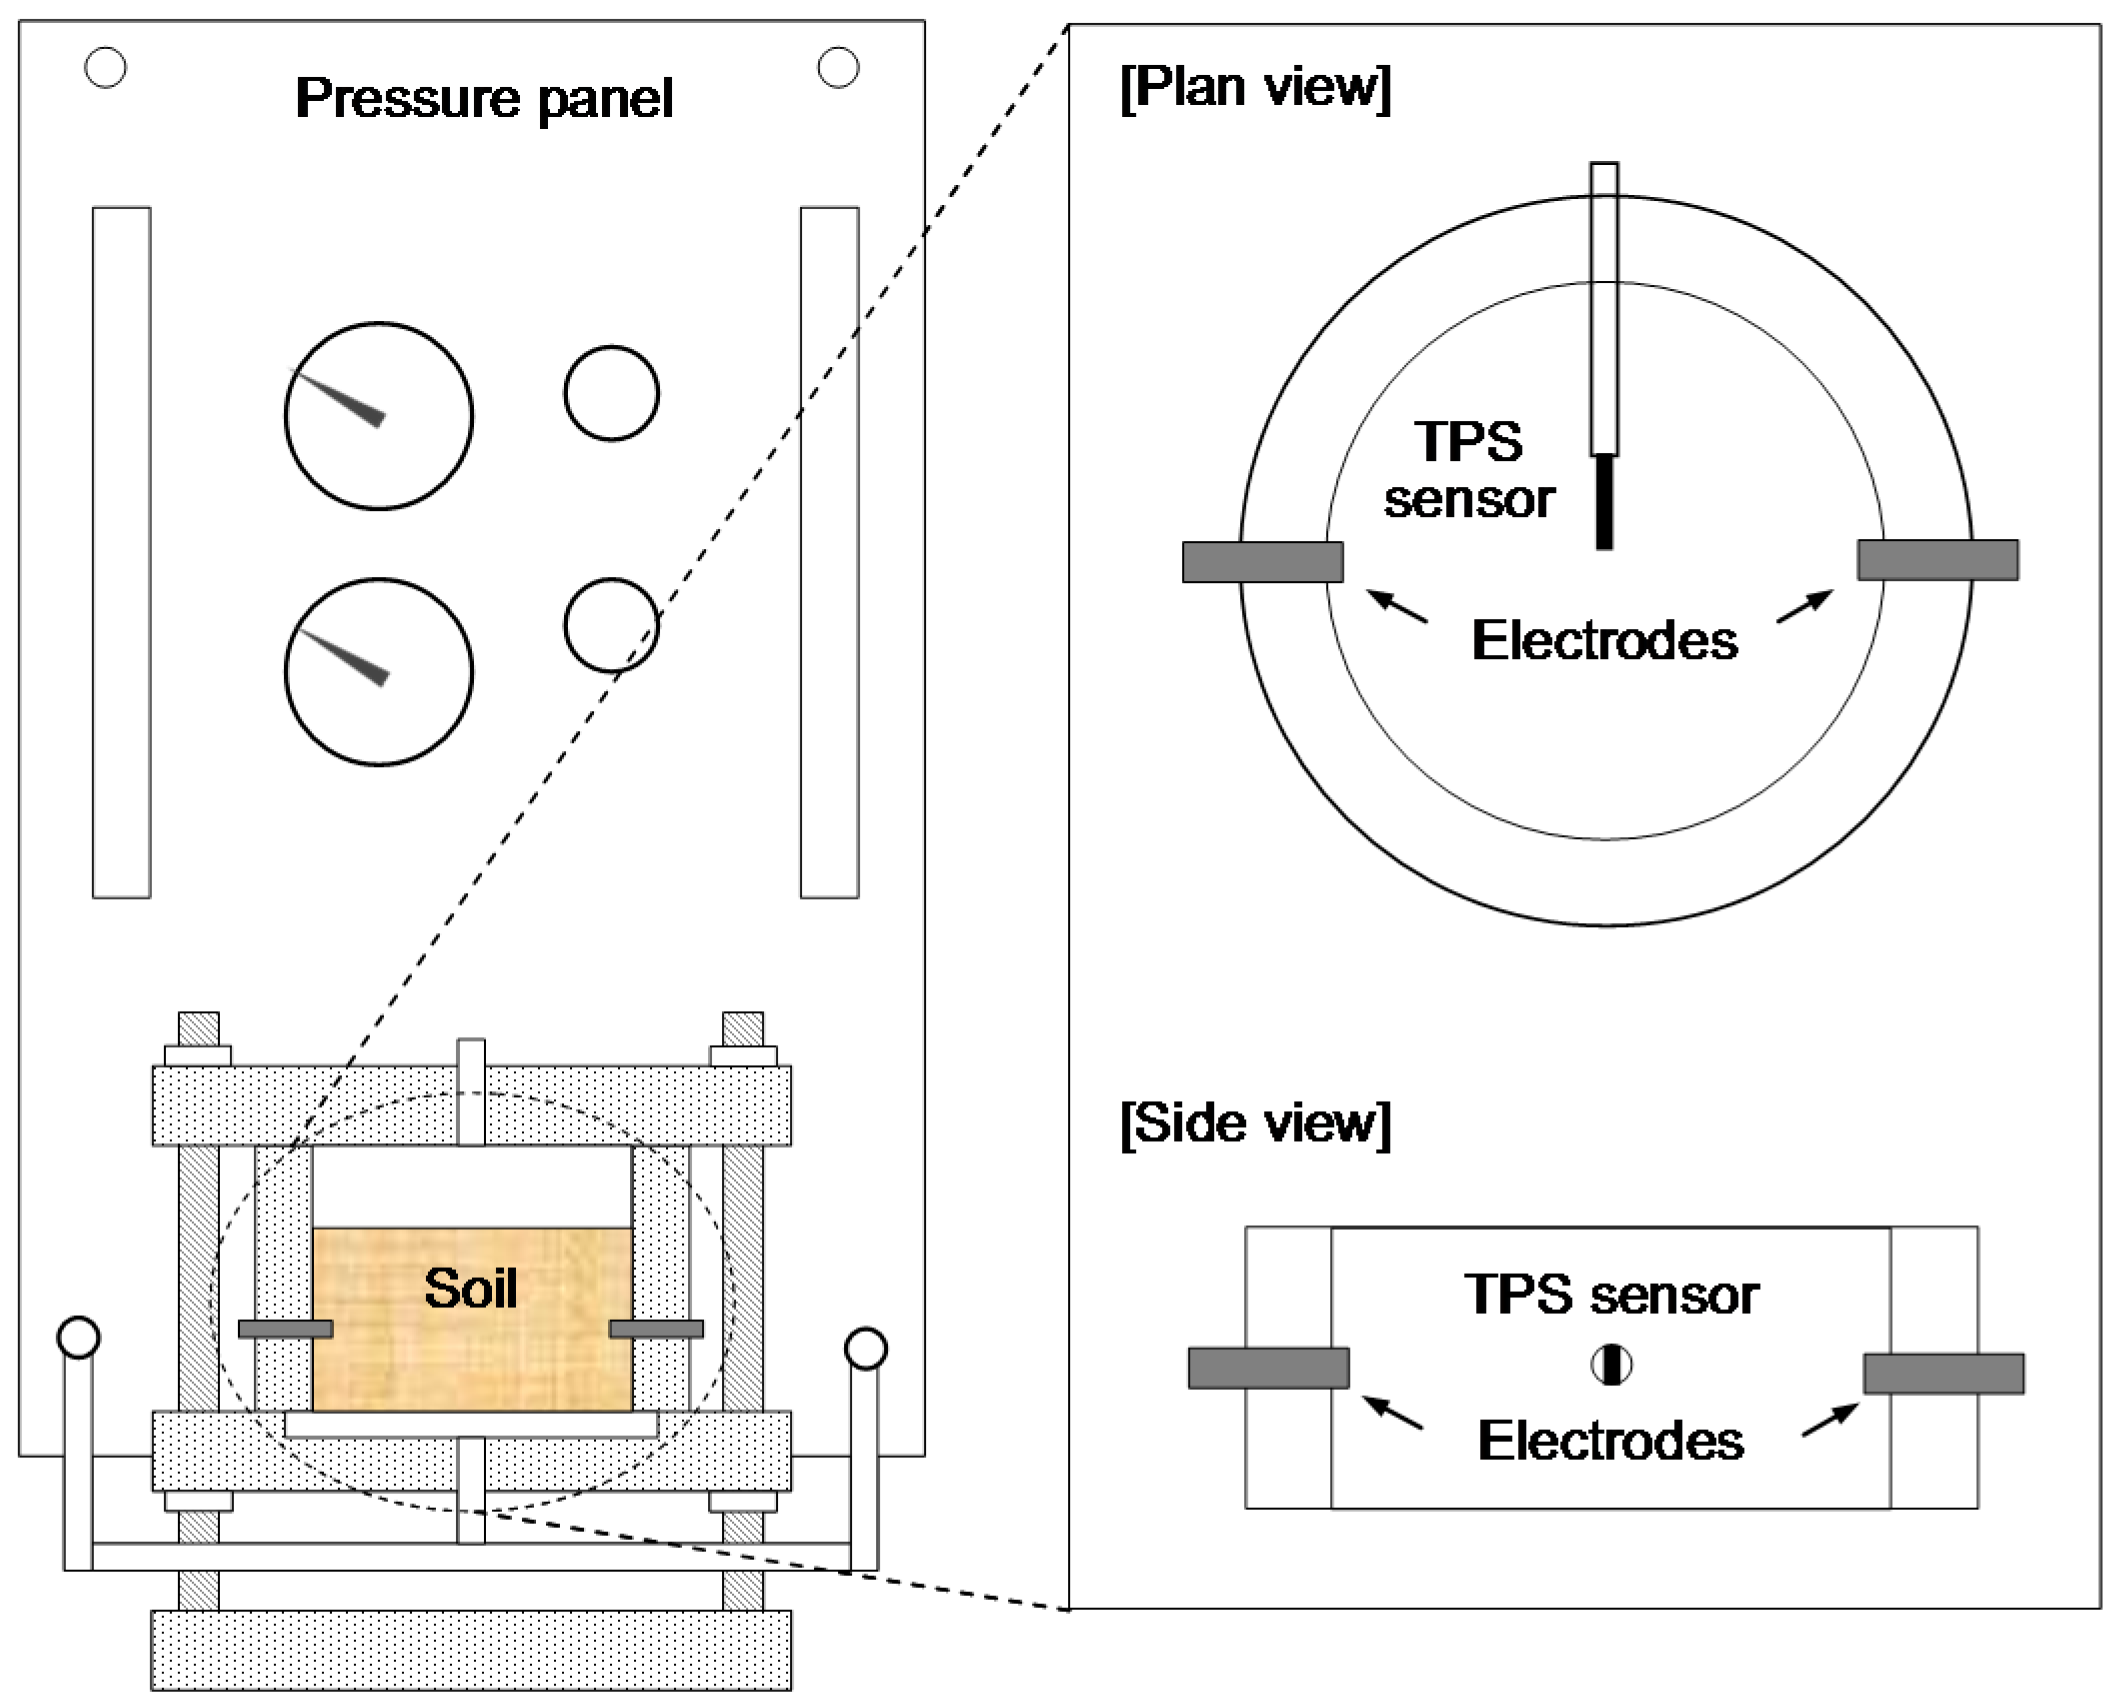
3.3. Setup and Procedure for Thermal Water Retention Test

Construction of the water retention curve requires the time-dependent measurement of changes in the water volume driven by the applied pressure. The pressure control panel includes the secondary pressure regulator for accurate pressure control in the low-pressure regime. Figure 7 illustrates the overall experimental configuration.
The cylindrical cell, made of acryl with a height of 50 mm and an inner diameter of 65 mm, housed a transient plane source (TPS) for measuring thermal conductivity and two electrodes for measuring electrical resistance at the middle height. The TPS method was implemented for thermal conductivity measurement [29,30]. A pair of resistance temperature detectors (RTD) not only provided a heat source, but also simultaneously measured the temperature evolution. The potential drop was logged at 0.5-s intervals and calibrated according to temperature change in order to calculate the thermal conductivity of the sediment samples for given pressure conditions. In terms of electrical resistance, a constant AC current was supplied, and the potential change across the sample was directly measured to obtain the resistance. The sine wave of 1 V and 100 kHz was generated using the arbitrary waveform generator (33220A, Agilent Technologies, Santa Clara, CA, USA), and the potential changes at the reference resistor and sample were gathered (34972A, Agilent). Details of the electrical and thermal conductivity measurement are described by Kim et al. [30] and Santamarina et al. [31].
The sediment sample was compacted on the porous stone in the cell by gentle hand-tamping, and then submerged in water, which naturally wetted and saturated the sample. The water-saturated sediment sample was left for 12 h before computing the initial porosity. The initial porosity of the remolded samples 6B-22R and 5B-22H for this thermal water retention test were ~46% and ~43%, respectively. The volumetric water content (θ) was logged with simultaneous measurements of the electrical and thermal conductivity values, taken at an equilibrium condition for a given air pressure. The temperature in the laboratory was maintained at a constant temperature of 23–25 °C, because the ambient temperature significantly affects the capillary pressure in unsaturated porous media [32,33]. We used de-ionized water over the course of the test.
The sigmoidal model of the Maulem-van Genuchten equation was adopted to fit the water retention curve and to obtain the model parameters using Equation (1) [34,35]:
θ θ r θ s θ r = [ 1 1 + ( α × Ψ ) n ] m
where θ is the volumetric water content corresponding to the applied matric suction (Ψ), θr is the residual water content, θs is the saturated water content, and α, n and m (= 1 − 1/n) are the fitting parameters. Then, the relative permeability was expressed in terms of obtained parameters as follows:
k R = K Ψ K S = [ 1 ( α × Ψ ) n 1 × [ 1 + ( α × Ψ ) n ] m ] 2 [ 1 + ( α × Ψ ) 2 ]
where KΨ and KS are the suction-dependent and saturated permeability, respectively.

4. Results

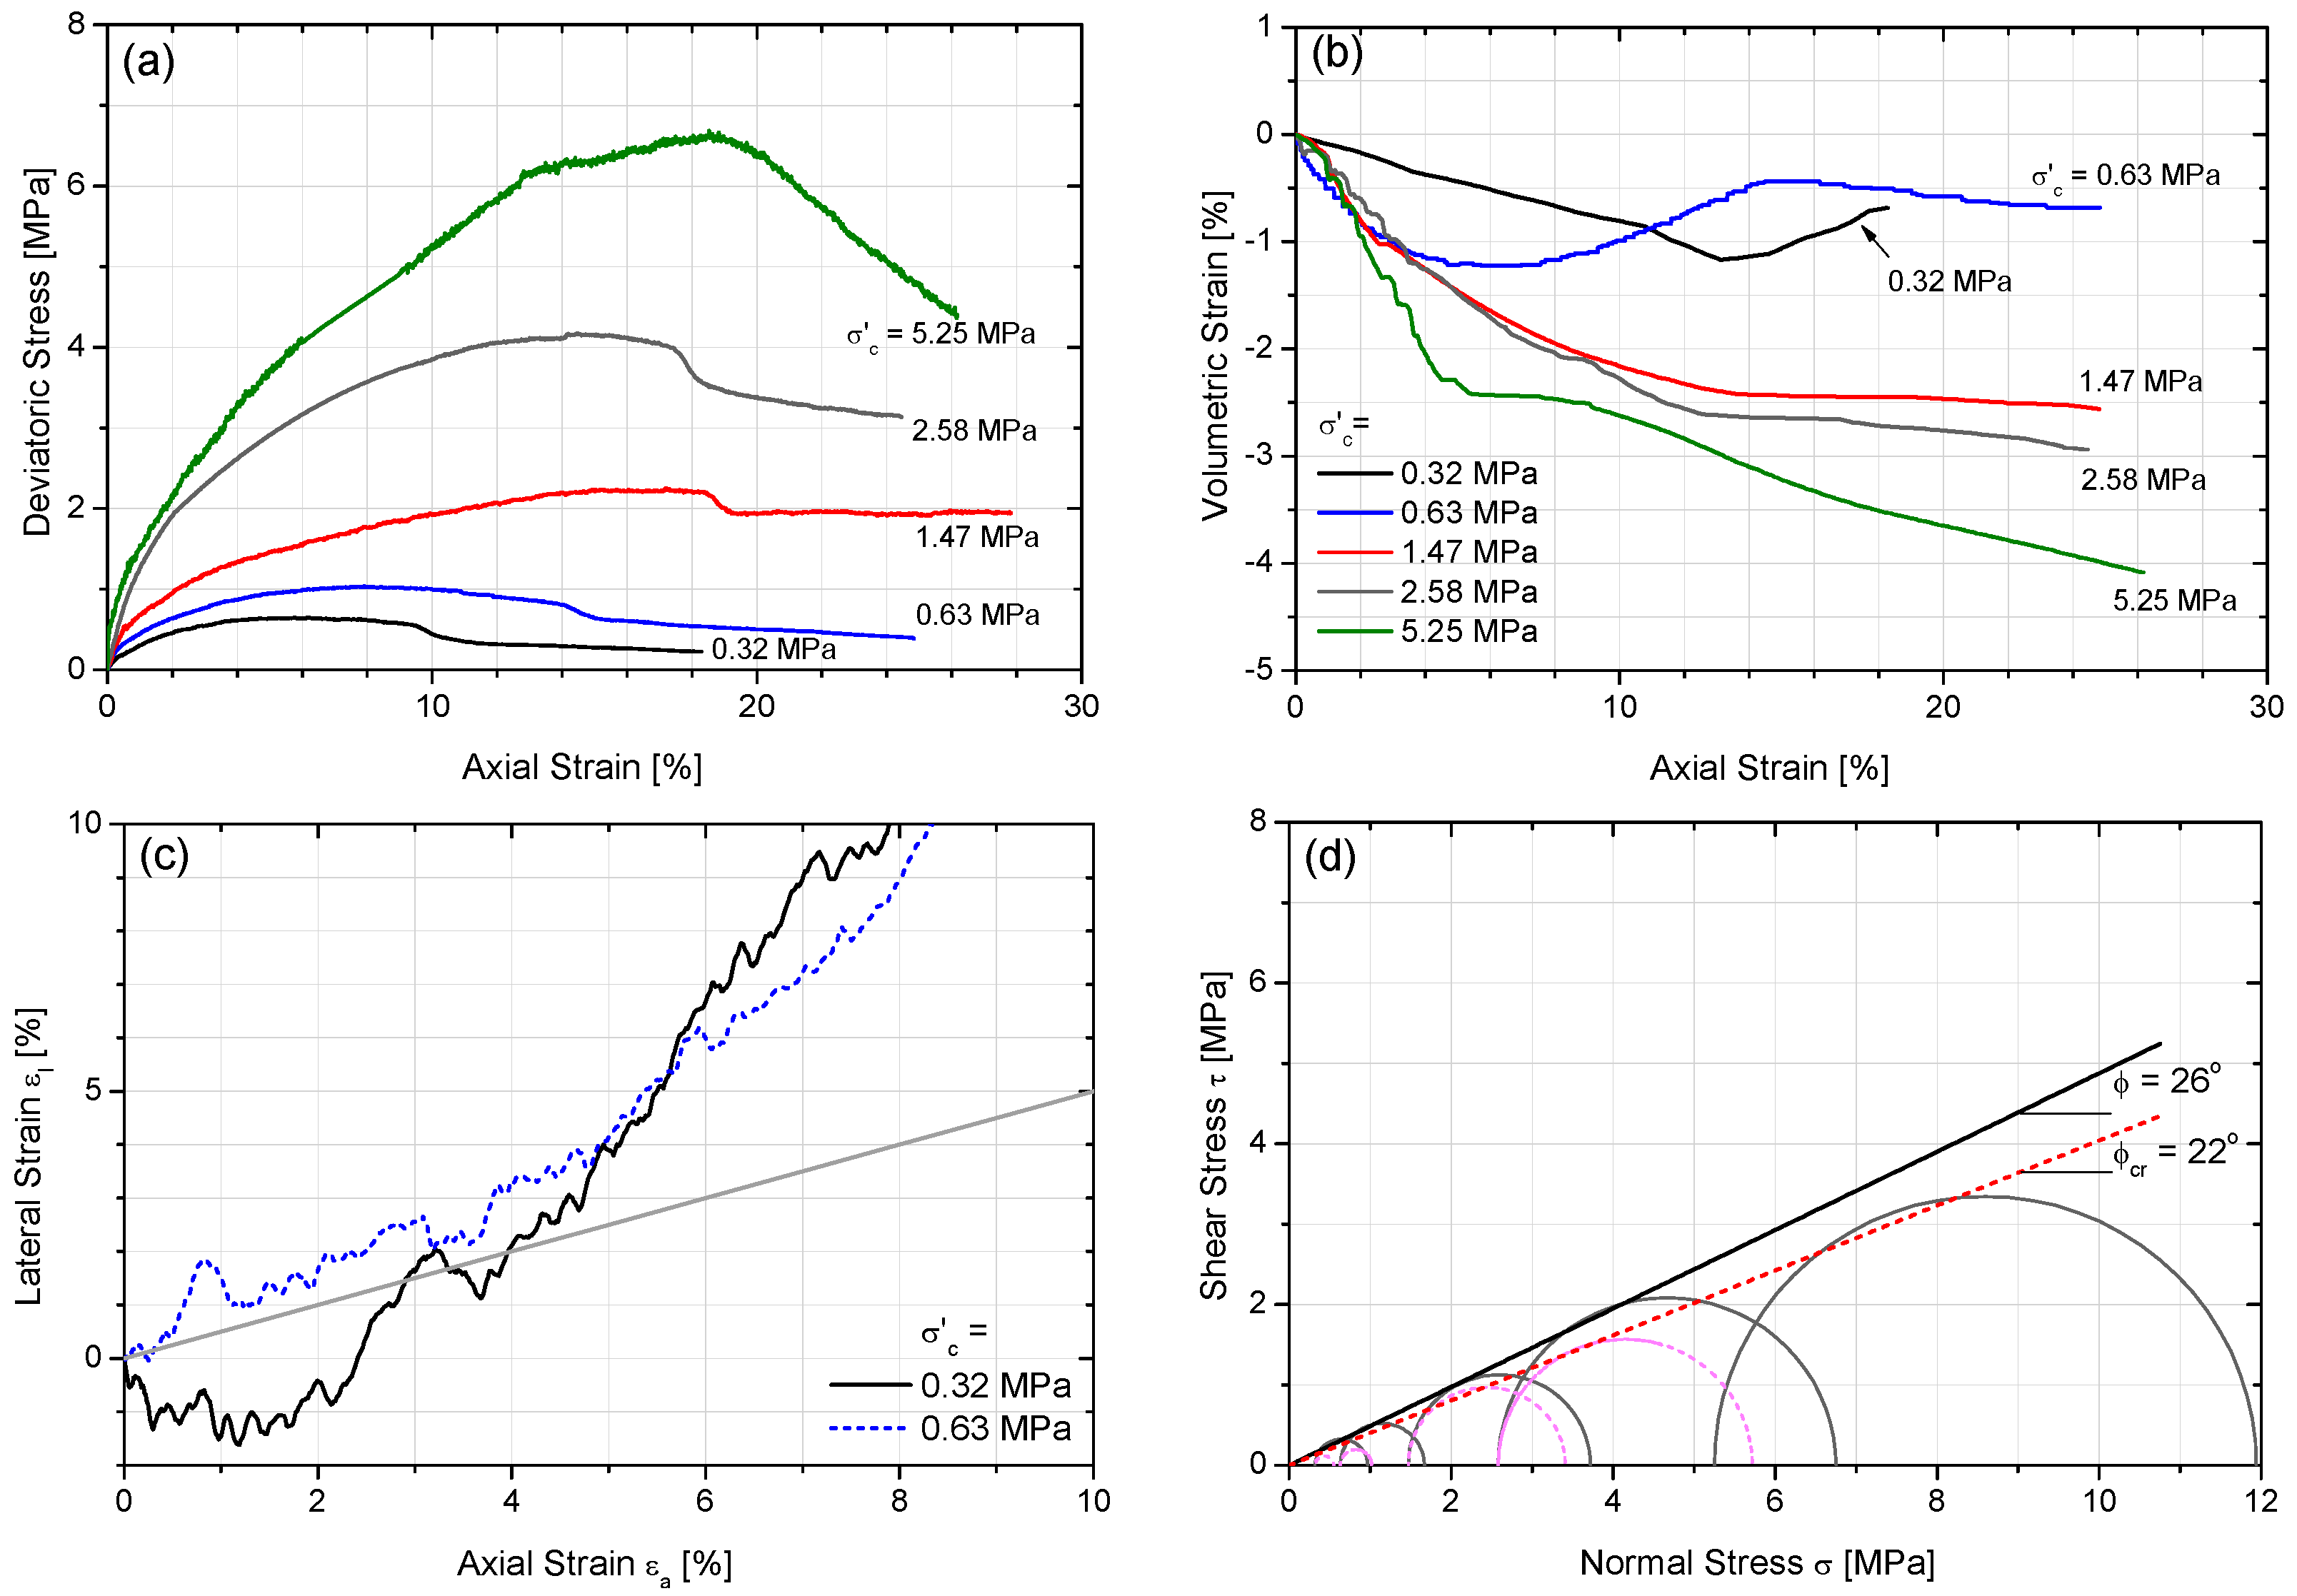
4.1. Stress-Strain Responses and Mohr-Coulomb Strength Parameters

Depressurization of gas hydrates in sediments, which causes a reduction in hydrostatic pressure, is considered a promising process for producing natural gas from gas hydrate deposits. However, the reduction in hydrostatic pressure induces an increase in effective stress and thus inevitably causes a change in the volume of sediments under drained conditions (i.e., drained loading). Therefore, an understanding of the geomechanical properties and stress-strain responses of the sediments under drained conditions is required to assess sediment responses to depressurization to ensure safe gas production operations in deep oceanic formations. We performed triaxial compression tests on sediment core 6B-22R to obtain the geomechanical characteristics, including strength parameters and stress- and strain-dependent stiffnesses. The results are described in this section.
Figure 8 presents the deviatoric stress (σd = σ1 − σ3) as a function of the axial strain (εa) response to monotonic loading under the five different effective confining stresses (σ′c = 0.32, 0.63, 1.47, 2.58 and 5.25 MPa). The results show that the peak strength of the specimens increases with increasing effective confining stress, and that all specimens exhibit post-peak behavior with clear peak deviatoric stresses (Figure 8a). When visually inspected after tests, clear localized failure zones, referred to as shear bands, were observed in all specimens. Contractive behavior was generally observed during the initial stage of shear (Figure 8b). After the peak stress, the deviatoric stress dropped and then leveled off at a residual state. In particular, a critical state is reached when the specimen volume becomes constant during shear. With the exception of the specimen under the effective confining stress of 5.25 MPa, the specimens all reached a critical state. Table 3 summarizes the test results.
Figure 8c shows the evolution of the lateral strain (εl) at the midplane as a function of the axial strain (εa) during shear. The slopes of the curves represents the Poisson’s ratio, and the dotted reference line εla = 0.5. A Poisson’s ratio of 0.5 (i.e., cylindrical deformation at constant volume) is superimposed on Figure 8c. Large lateral expansion, which is plotted above this reference line, occurred at the midplane as the axial strain increased, possibly because of end plate friction, the bulging of specimens (or barreling-type deformation), shear band formation, or a combination of these. This has been observed in previous studies on clean sands [28]. For σ′c = 0.32 MPa, the lateral strain showed negative values in a small strain regime of <3%, which indicates volume contraction during the initial stage of shear.
The Mohr-Coulomb strength criterion is commonly adopted for geomechanical analyses, where a linear failure envelope with two strength parameters approximates the shear strength of the sediments, the apparent cohesion intercept (c), and the internal friction angle (φ). Following the triaxial compression tests, the peak and critical state friction angles under drained loading conditions are identified as ~26° and ~22°, respectively, assuming no or minimal cohesion intercept (Figure 8d). The assumption of no or minimal cohesion intercept is presumed reasonable because the sediment is categorized as sand-dominant with no plasticity. Table 4 summarizes the strength parameters of natural sediments recovered from hydrate-occurring layers around the world. Due to a higher sand fraction, the sediment sample in this study, classified as SM, has a higher peak friction angle than other clay- or silt-dominant sediments (i.e., fine-grained sediments) from the Ulleung Basin, Krishna-Godavari Basin, and Mahanadi Basin. The peak friction angles of coarse-grained sediments from hydrate-occurring layers are predominantly in the range of 27°–31° for oceanic sediments [8,36,37], 34°–44° for permafrost sediments [37], and 30°–37° for the sandy sediments of the eastern Nankai Trough [25]. In comparison, it appears that the studied sediment has a relatively low peak friction angle (26°). It is presumed to be attributed to the presence of diatoms, which leads to a large specific surface area, water content, and porosity.
Since specimens were prepared using the same sand for different confining stresses, the change in particle size distribution before and after the triaxial compression tests were also examined. It was found that the mass fractions passing Sieves No. 50–170 (corresponding to an opening size of 0.09–0.3 mm) increased by a maximum of ~2.5%. This indicates that the large particles were crushed as a result of the high stresses applied during triaxial tests. However, the increases in the fines fractions (e.g., passing Sieves No. 230–635) were practically undetectable owing to the loss of fines during soil collection after the triaxial compression tests. Because the sediment sample originally contained a fairly high fines fraction of 24.3% (Figure 4a), the particle crushing due to the applied stress caused a relatively small increase in fines fractions of a maximum of 2.5%. Accordingly, it can be assumed that the effect of particle crushing on the geomechanical properties was insignificant in this study.

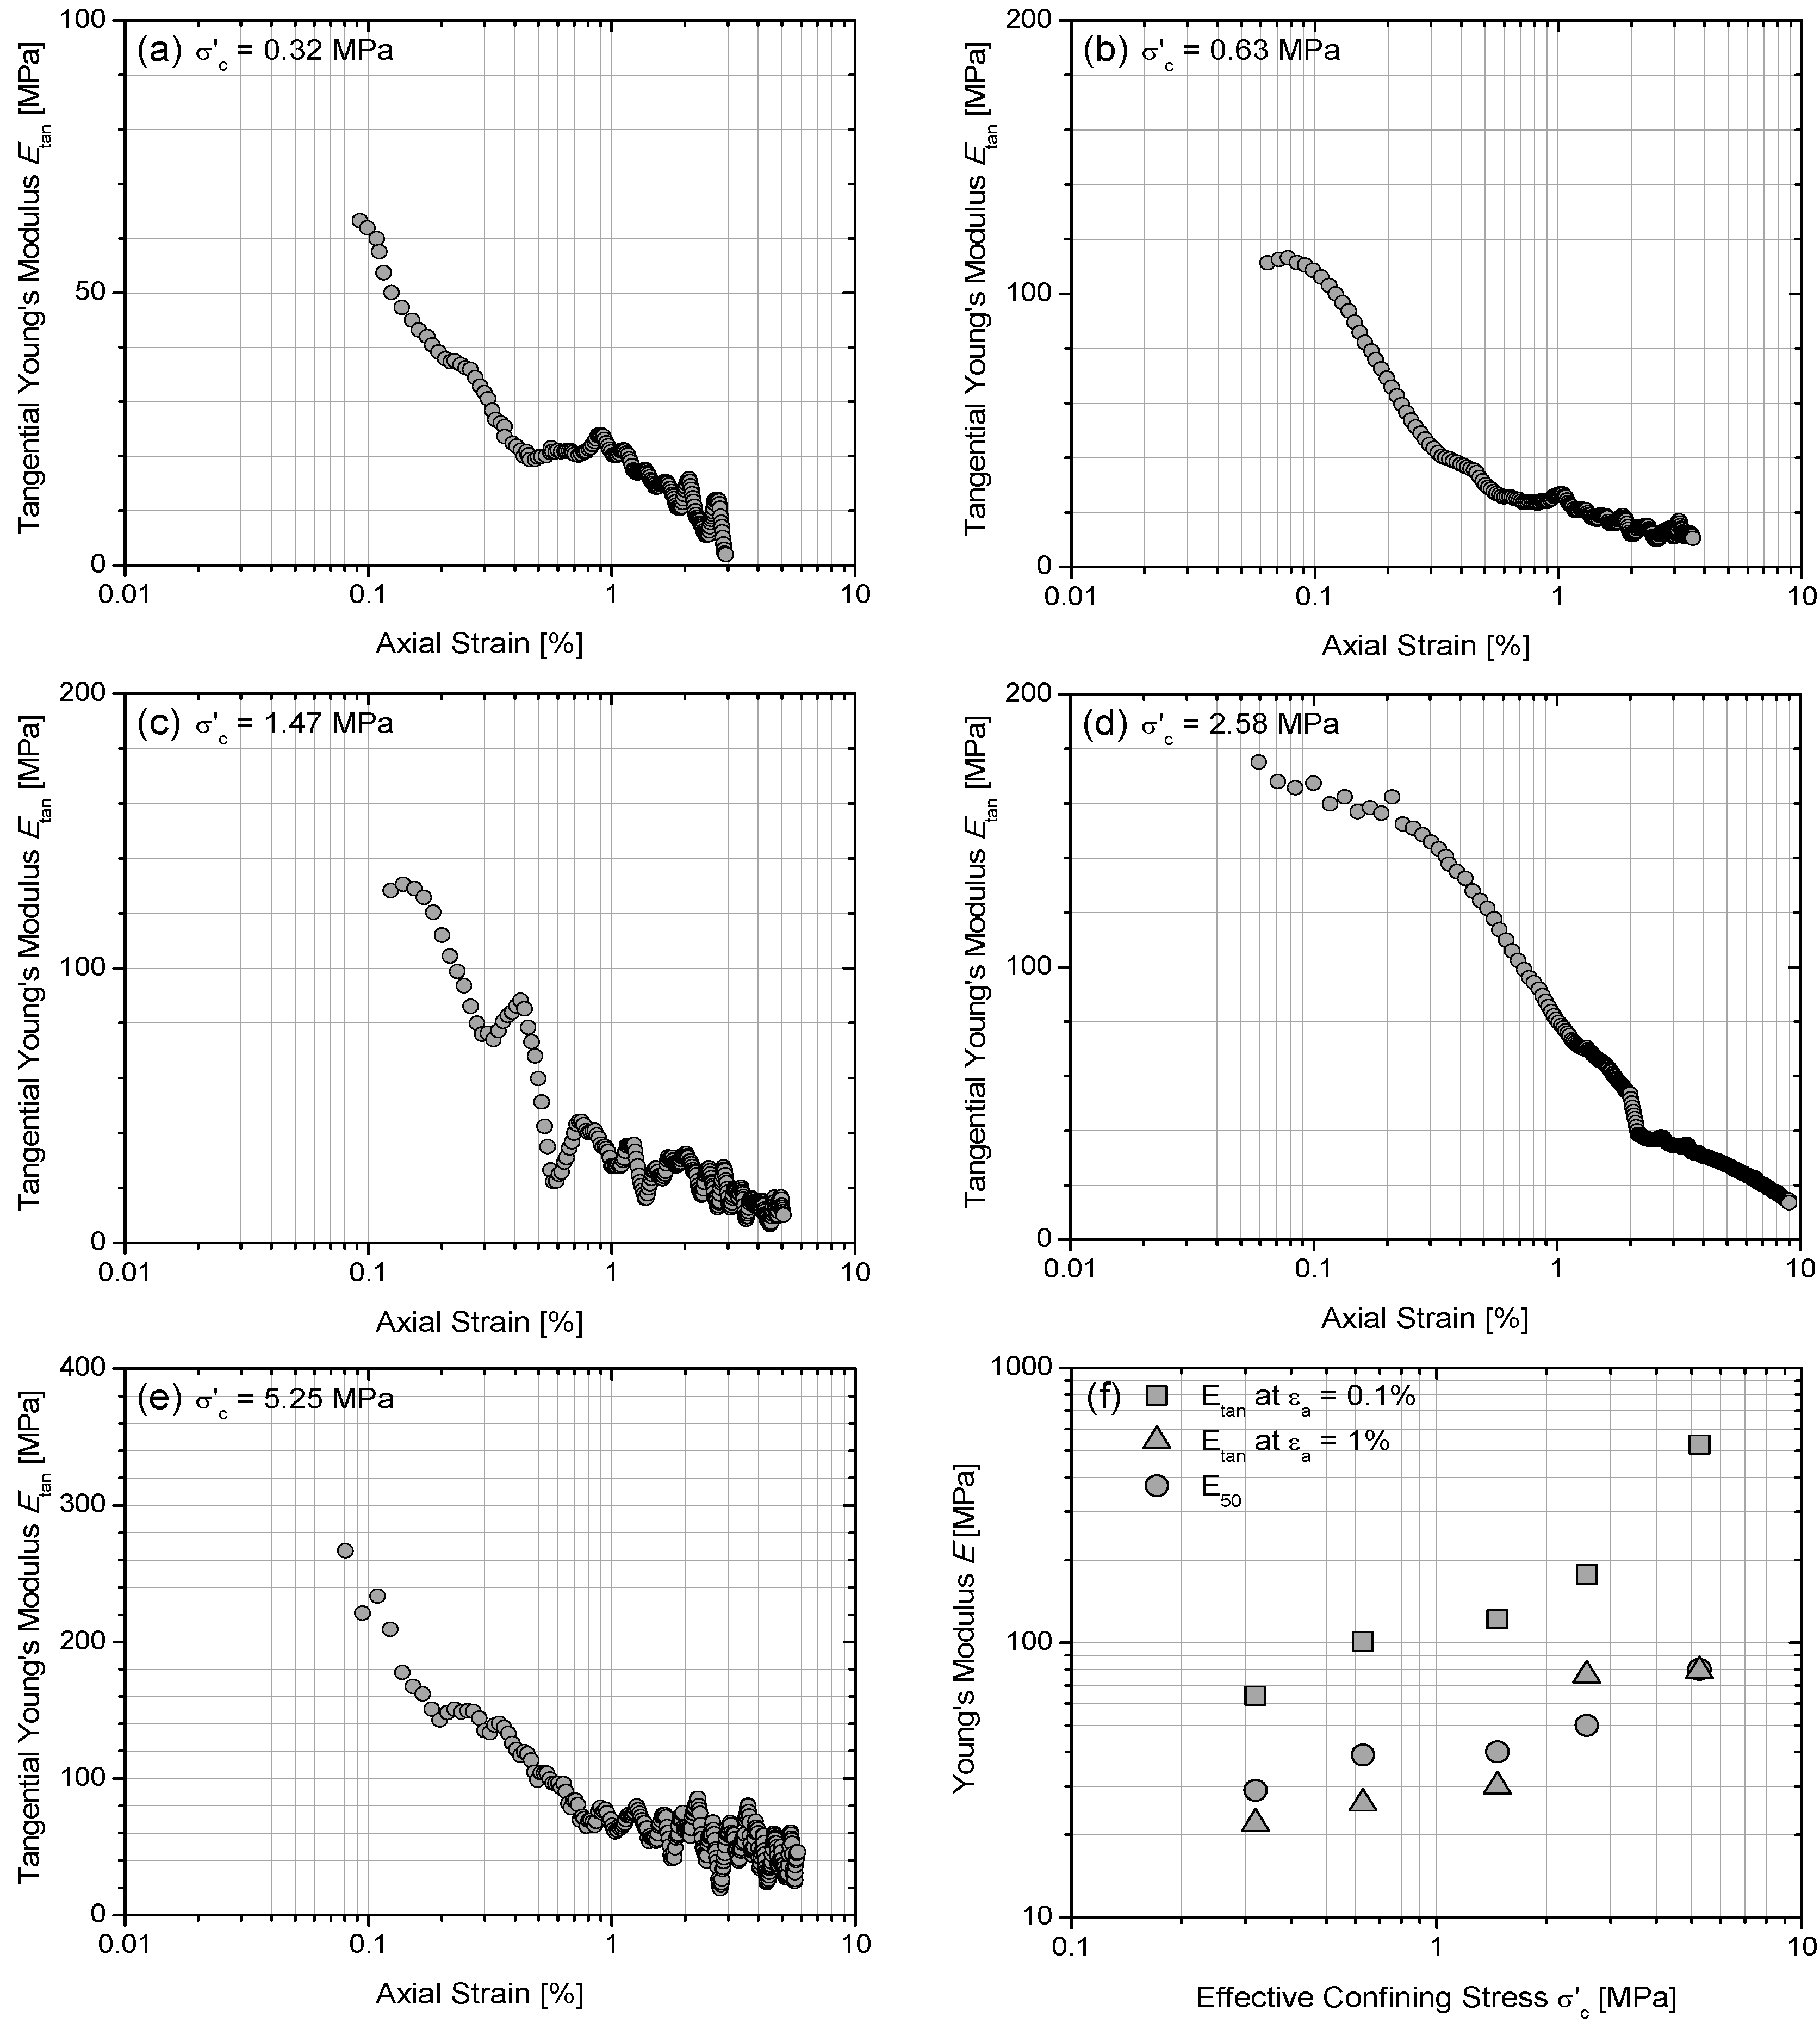
4.2. Stress- and Strain-Dependent Young’s Modulus

Stiffness of sediments can be described by the tangential slope of the stress-strain curve (i.e., Δσdev/Δεa; Figure 8a), and is referred to as the tangential Young’s modulus (Etan). This tangential modulus can be determined at any point along the stress-strain curve, and degrades as the axial strain increases, as shown in Figure 9. The secant modulus (E50) can be also determined from the slope of a straight line that connects half the peak deviatoric stress through the origin of the stress-strain curve. Figure 8 and Table 3 show the variations in the tangential (Etan) and secant (E50) moduli with confining stress and axial strain for the sediment sample investigated. The gradual degradation of the tangential moduli with increasing axial strain is clearly observed (Figure 9a–e). The initial quasi-elastic high stiffness region extends to an axial strain of ~0.1%. Figure 9f clearly demonstrates that the stiffness of the sediment, including the tangential and secant moduli, increases with increasing confining stress, indicating a strong strain dependency. This is because increasing confining stress leads to increasing inter-particle coordination, contact area, and frictional resistance, which consequently increase skeletal stiffness.
Depressurization for gas hydrate production and the consequential reduction of hydrostatic pressure are likely to cause an increase in effective stresses in sediments. This additional loading will accompany additional contractive deformation (i.e., depressurization-induced subsidence). In contrast, excess pore pressure is likely to develop when sediments are effectively impermeable and thermal stimulation is applied for gas hydrate production [38,39]. In this case, an unloading condition is expected because the excess pore fluid pressure reduces the confining effective stress, resulting in the volume expansion of the sediments. This class of deformation, which is caused by changes in stress states, whether volume contraction or expansion, can be assessed based on the material stiffness. Many of reservoir-scale geomechanics simulators, including those presented by the Lawrence Berkeley National Laboratory (LBNL) group [40,41,42], by the Korea Advanced Institute of Science and Technology (KAIST) group [39,43], and by the Cambridge University group [44,45,46], adopt elastoplasticity to model sediment deformation behaviors. Thereby, one of the elastic moduli (typically Young’s modulus or bulk modulus), Poisson’s ratio ν, and strength parameters (cohesion and friction angle, if Mohr-Coulomb yield criterion used) for material yielding are typically used as input parameters for describing elasto-plastic behavior. In particular, the secant modulus E50 is widely chosen for such inputs because it is determined from fairly wide and representative strain regimes prior to material yield or failure.

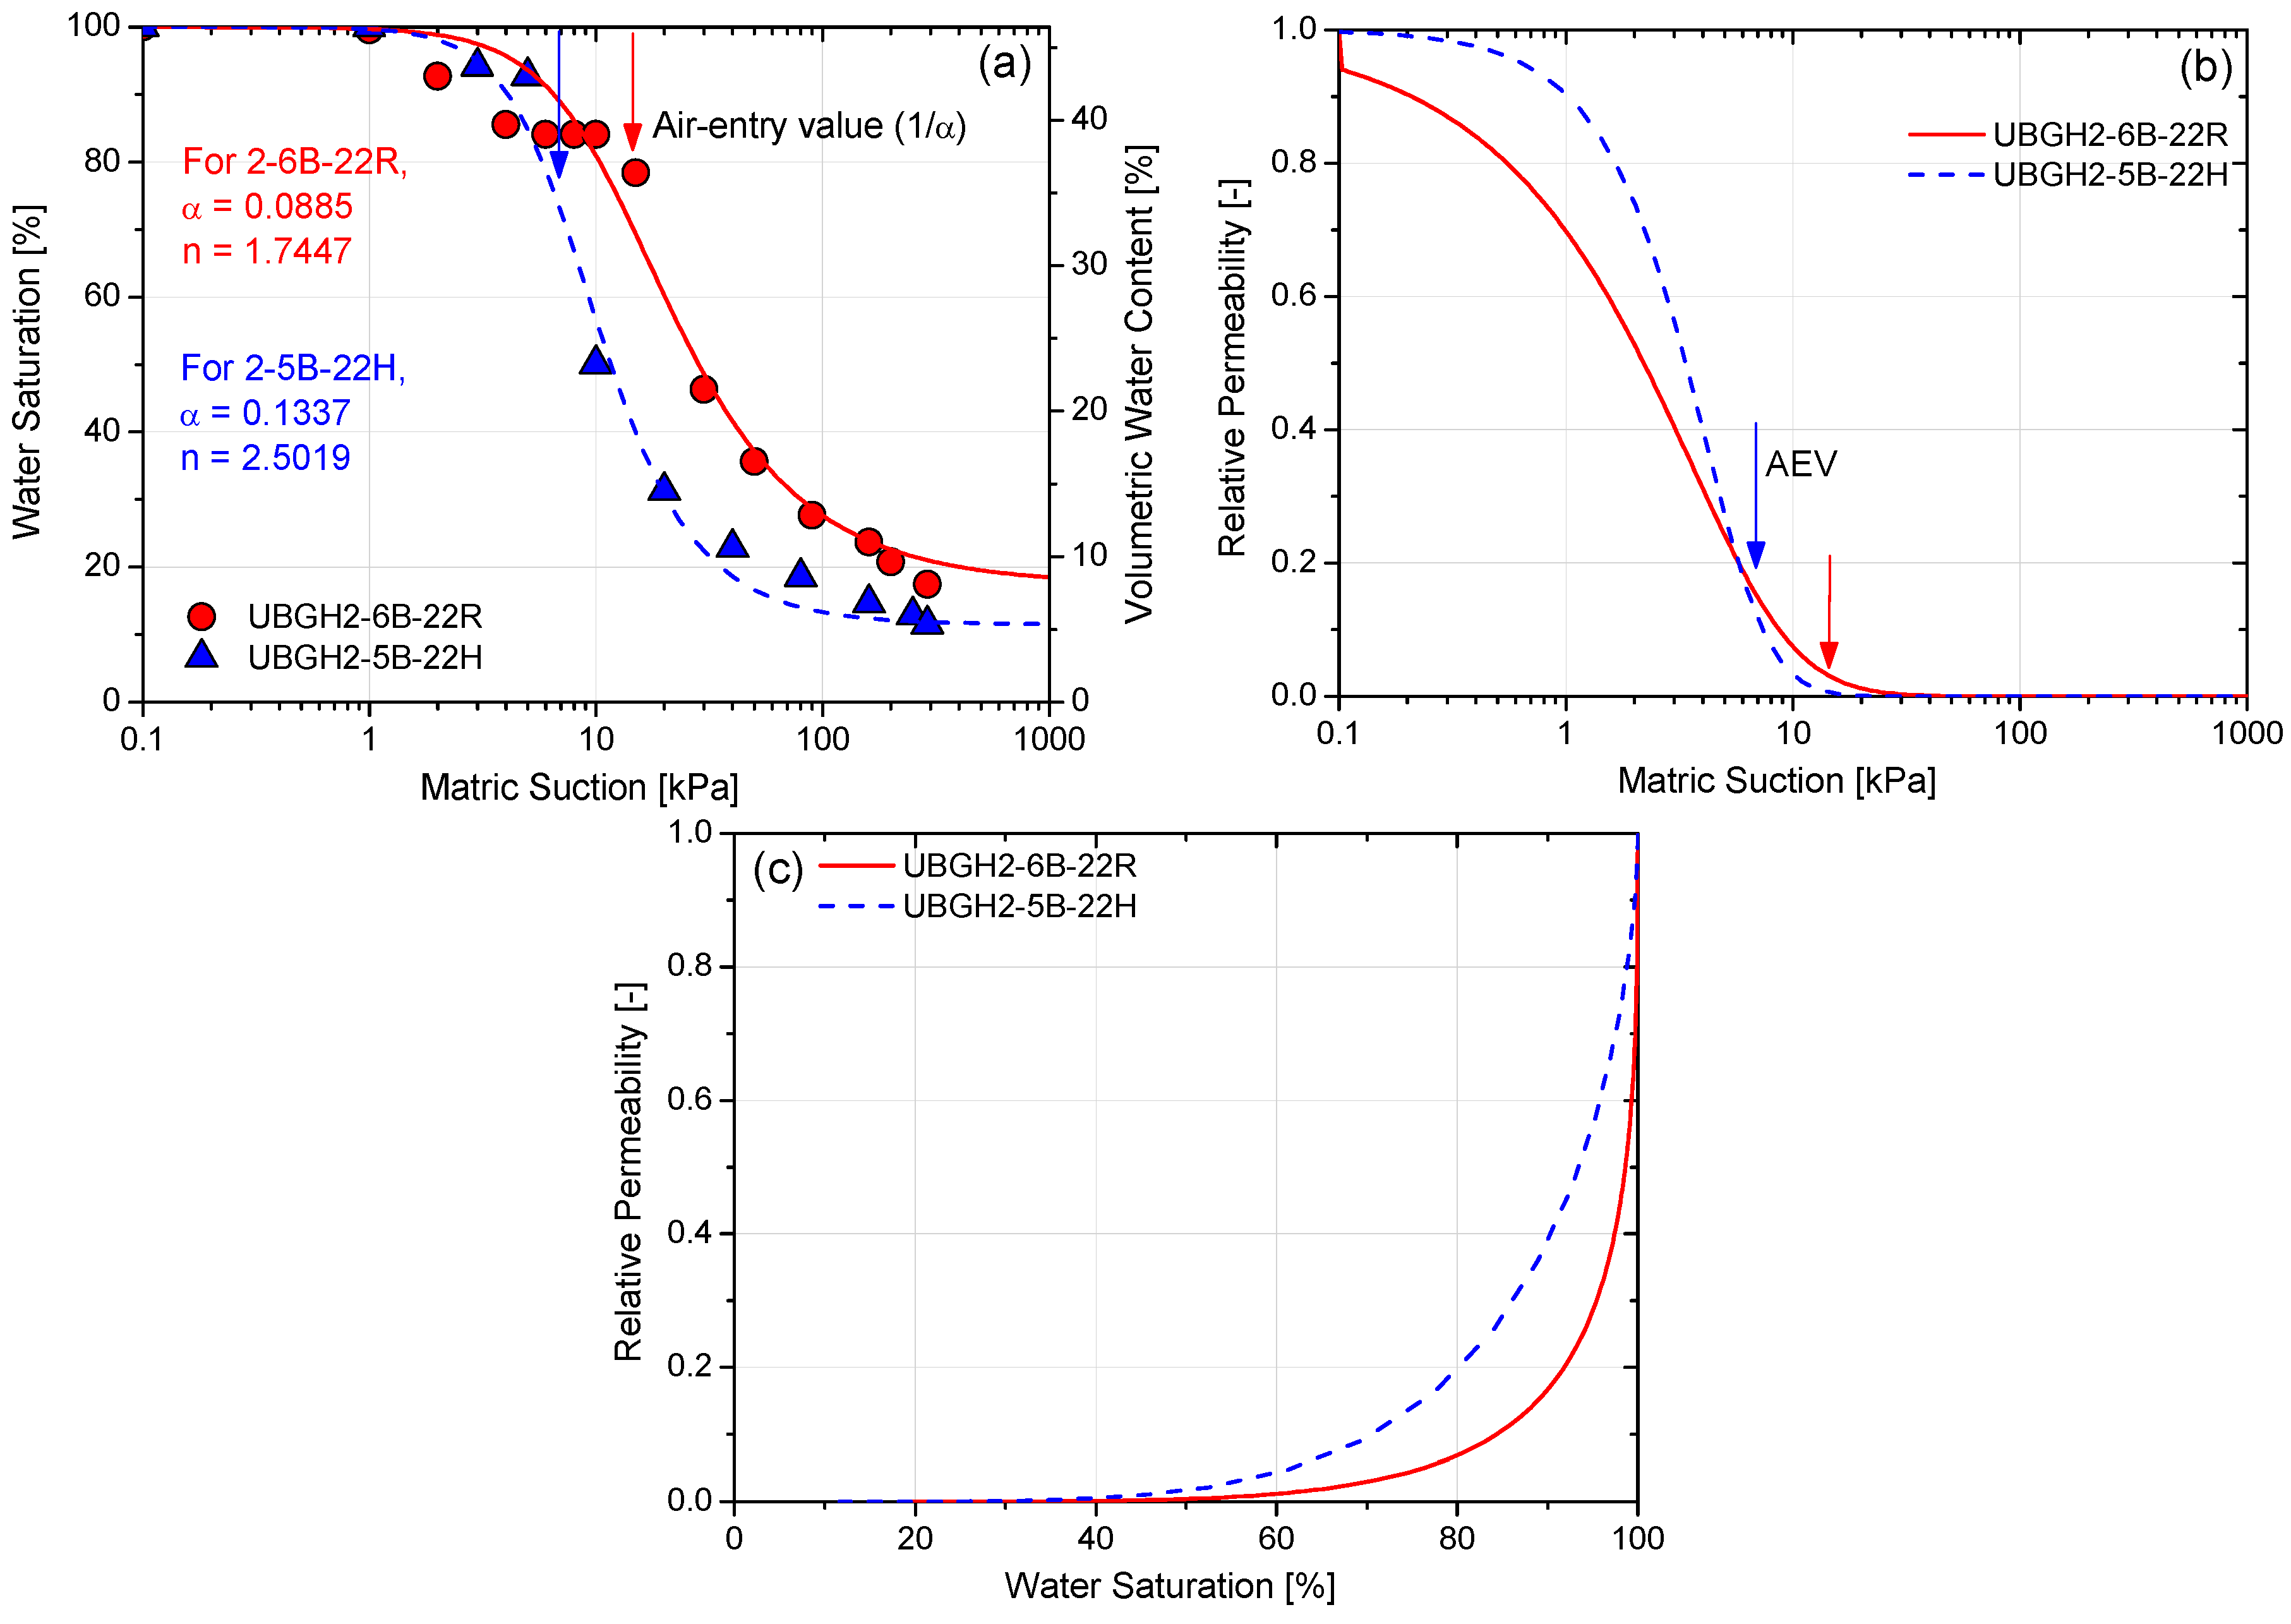
4.3. Water Retention Curves and Parameters for Water Permeability

Figure 10a presents the changes in the volumetric water contents experimentally gathered with increasing matric suction for samples 6B-22R and 5B-22H. These experiment results were fitted using Equation (1), resulting in the water retention curves for the tested sediment samples. The air entry value (AEV) of 1/α was determined as 11.3 kPa and 7.5 kPa for 6B-22R and 5B-22H, respectively. As sample 6B-22R has lower particle sizes and a higher fraction of fines (Figure 4a), it exhibited a higher AEV and a lower slope. However, the values of residual water saturation for both samples are similar (~10%–20%).
Figure 10b,c shows the estimated relative permeability plotted with the matric suction and water saturation. At very low matric suctions, the relative permeability started at unity (i.e., the water permeability was equivalent to that of a fully water-saturated condition). As the matric suction increased and became close to the AEV, the relative permeability sharply decreased to ~0.1. In other words, unsaturated conditions cause a significant reduction in water permeability for SM sediments.
The in situ pressure and temperature of the two sample locations are ~21–23 MPa and ~14–17 °C, corresponding to a water depth of 2300 m and 2100 m for 6B-22R and 5B-22H, respectively. The methane gas pressure at in situ is expected to be in the range of several MPa when a depressurization method is applied for gas hydrate production from hydrate deposits. However, the water retention curves were obtained under atmospheric pressure conditions and a temperature of 23–25 °C. When the pressure increases from 1 MPa to 10 MPa, it is reported that the interfacial tension between methane and water decreases from ~73 mN/m to ~64 mN/m at 298.15 K, varying by ~12% [47,48,49]. To date, there is no contact angle measurement data available for the methane-water system on hydrophilic surfaces. Adopting gaseous carbon dioxide (CO2) as an analogue, when the pressure increases from 0.1 MPa to 7.0 MPa, the contact angle of gaseous CO2-water on hydrophilic surfaces (silica or quartz) is reported to stay fairly constant, varying by less than 2° [50,51]. Accordingly, it is justifiable to assume that the contact angle of methane-water on hydrophilic sand grains varies minimally as long as methane stays in the gas phase. Hence, it is worth noting that the reduction in the interfacial tension due to the elevated pore fluid pressure will cause some variation in the water retention curves, although the relative contributions of the in situ pressure and temperature should be further examined for a particular field condition of interest. For practical use, the effect of the reduced interfacial tension at elevated pore pressures needs to be calibrated based on the obtained results of the residual saturation and relative permeability at atmospheric pressure.

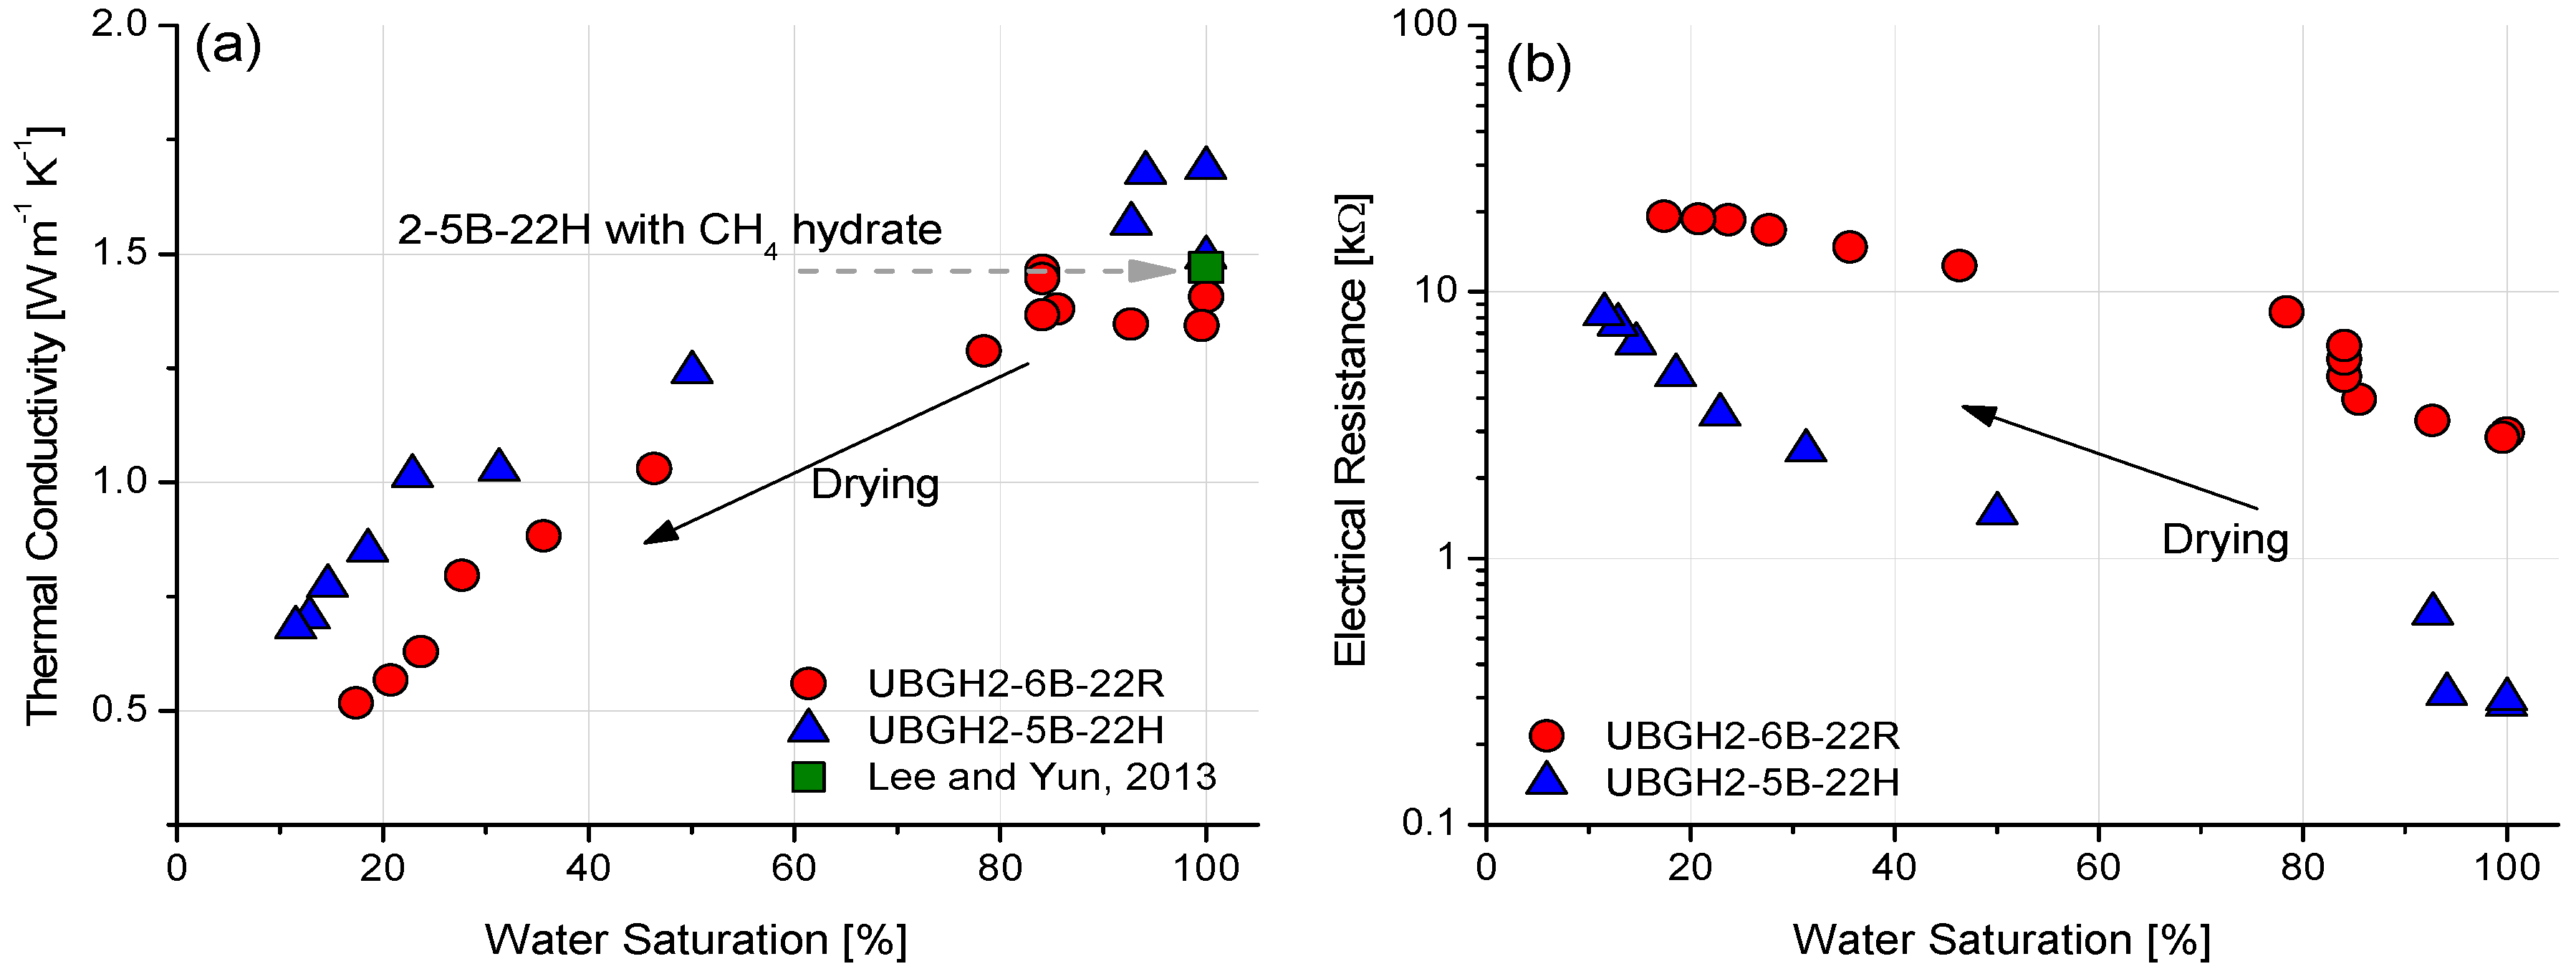
4.4. Variations in Thermal Conductivity and Electrical Resistance with Water Saturation

The volumetric fractions of phases within a sediment (e.g., sediment grains, water, gas, and hydrates) affect the thermal conductivity. Of the pore fluid constituents, methane hydrate, and water are reported to have similar thermal conductivities (~0.6 W·m−1·K−1 and ~0.58 W·m−1·K−1, respectively; [20,52,53]). The thermal conductivity of gas-bearing sediments is known to decrease linearly with decreasing water saturation because the thermal conductivity of a gas phase is the lowest among the constituents (e.g., ~0.026–0.038 W·m−1·K−1 for air at 27 °C and 0.1–20 MPa [53,54]). Figure 11a shows the variation in sediment thermal conductivity with decreasing water-saturation (Sw), which was measured during the drying process using the thermal water retention testing device (Figure 7).
A fully water-saturated condition with de-ionized water (Sw = 100%) was prepared as the initial condition for both 6B-22R and 5B-22H. The thermal conductivity at Sw = 100% was measured as ~1.4 W·m−1·K−1 for 6B-22R and ~1.6 W·m−1·K−1 for 5B-22H, with the nominal difference between the two samples reflecting the initial porosity (~46% for 6B-22R and ~43% for 5B-22H) and the quartz-dominant mineralogy in 5B-22H. As shown in Table 2, the 6B-22R sample contained a considerable fraction of non-quartz minerals (~36%), such as albite, feldspar, illite, and muscovite, whereas 5B-22H mostly consisted of quartz-dominant silicate sand with some calcareous fragments. Over the range of water saturation, as can be seen in Figure 11a, the thermal conductivity of 6B-22R was consistently lower than that of 5B-22H because of the higher non-quartz fraction in 6B-22R, as quartz is known to have higher thermal conductivity value (e.g., ~6–8 W·m−1·K−1) than other minerals [55]. The results confirm that the measured thermal conductivity of 5B-22H at Sw = 100% is within a similar range to that of the same sediment sample containing methane hydrate under a brine-saturated condition (i.e., 1.47 W·m−1·K−1 [9]) due to the similar thermal conductivity of water and methane hydrate. The measured thermal conductivities of the Ulleung Basin sandy sediments are unique and unlike those of the hydrate-bearing sediments of other provinces. As the water saturation of the tested samples gradually decreased to their residual water saturation levels (~10%–20%), thermal conductivity was reduced by more than 60% (e.g., from ~1.4–1.6 W·m−1·K−1 to ~0.5–0.7 W·m−1·K−1; Figure 11a). These results suggest that the fraction of the gas phase plays a significant role in the overall thermal conductivity of sediments. As the dissociation of gas hydrate inevitably produces free gas in the sediments, the obtained curves of thermal conductivity versus water saturation can be effectively used for estimating the dynamic change in thermal conductivity during hydrate production.
Figure 11b shows the variation in electrical resistance with decreasing water saturation. The 6B-22R sediment sample showed higher electrical resistance at SW = 100% than the 5B-22H sediment sample, which is likely due to the smaller particle size (Figure 4) and the corresponding narrower pore network. In other words, the 5B-22H sediment sample constructed a well-defined long-range connectivity of the water film or channel. As the water saturation decreased, the increment in electrical resistance was observed with a quasi-linear tendency. However, as the water saturation approached the residual state, the electrical resistance of the two samples converged to a value of ~10–20 kΩ across two orders of magnitude, despite the initial electrical resistance at SW = 100% being significantly different (~4 kΩ and ~0.3 kΩ). This result indicates that the electrical resistance is a good indicator of water saturation. It is worth noting that the observed electrical resistance variations (~one order of magnitude) are fairly large because de-ionized water was used as pore water. If the high salinity pore water is used, its variation with water saturation will decline. On the other hand, as the electrical resistance is sensitive to pore water salinity, release of fresh water during methane hydrate dissociation also causes the dilution of the salinity and hence the reduction in the electrical resistance. Therefore, as the electrical resistance captures the changes in pore water salinity and pore water saturation (or gas saturation), the monitoring of such evolution in electrical resistance is expected to provide information for the assessment of the dynamic state of the water phase in sediments during methane production.

5. Discussion: Implications for Hydrate-Bearing Sediments

The geomechanical, hydraulic, and thermal properties of the hydrate-free sediments reported herein can be used as the baseline when predicting properties and behavior of the sediments containing hydrates, and when the hydrates dissociate during gas production. The logging results indicate that the 6B-22R sample was estimated to contain more than 40% hydrate saturation, and the 5B-22H sample contained no hydrate (Table 1). Using the obtained properties of the hydrate-free 6B-22R sample, the effect of gas hydrate presence on such properties is inferred. A model that can predict its properties is described in this section.

5.1. Thermal Conductivity

As mentioned, the thermal conductivity is heavily affected by the thermal conductivity of each phase and its volumetric fraction. Because of the similar thermal conductivities of methane hydrate and water (~0.6 W·m−1·K−1 and ~0.58 W·m−1·K−1, respectively) and the lowest thermal conductivity of a gas phase (e.g., <~0.04 W·m−1·K−1), it is known that the bulk thermal conductivity of a sediment is not significantly affected by the presence of hydrate and hydrate saturation. This is further supported by our thermal conductivity results of the brine-saturated hydrate-free and hydrate-bearing sediment (i.e., ~1.6 W·m−1·K−1 and ~1.47 W·m−1·K−1, respectively, for sample 5B-22H) [15]. Therefore, the variation of thermal conductivity with gas saturation is presumed valid for hydrate-free and hydrate-bearing sediments.

5.2. Bulk Permeability

The presence of hydrate reduces the sediment permeability, and the morphological growth habits in pores have a pronounced effect on the permeability reduction by hydrate formation. The capillary tube models, presented by Kleinberg et al. [56], can be used to estimate the permeability reduction with increasing hydrate saturation. Thereafter, Dai and Seol [57] extended the work by Kleinberg et al. [56] by adopting the Kozeny-Carman equation, as shown in Table 5: K/Ko = (1 − Sh)3/(1 + 2Sh)2, where K and Ko are the permeability with and without hydrate, respectively, and Sh is the hydrate saturation.

5.3. Relative Permeability

The higher hydrate saturation renders the smaller pore size and the greater capillary pressure. Therefore, it is presumed that the presence of hydrate causes increases in the air-entry value and the residual water saturation. To date, few reservoir-scale simulation studies have considered the effect of hydrate saturation on relative permeability; Klar et al. [45,46] and Konno et al. [58] incorporated the effect of hydrate saturation on the relative permeability of water and gas phases, as shown in Table 5. Therefore, the semi-empirical parameters describing sediment pore structures, such as relative permeability index Ni, van Genuchten parameters a, b and c, and irreducible water and gas saturation, can be estimated using the water retention curve that was experimentally obtained for hydrate-free sediments. Thereby, it becomes feasible to model the effect of hydrate saturation on the relative permeability of hydrate-bearing sediments by using the determined parameters.
However, it remains still a challenging task to obtain the water retention curves of hydrate-bearing sediments by means of experimentation because the excess water can readily react with methane gas and form hydrate during typical imbibition and drying processes, thereby changing the hydrate saturation. In addition, because the pore morphology also changes as hydrate is removed from pores, estimating the water saturation and capillary pressure during hydrate dissociation from typical water retention curves requires further research [21].

5.4. Geomechanical Properties

An increase in hydrate saturation increased sediment strength and stiffness. The presence of hydrate has little effect on the critical state friction angle, but causes the more pronounced shear dilation behavior [59,60]. Therefore, the friction angle obtained in this study can be used when predicting the geomechanical failure of the particular class of sediment. Table 5 summarizes the previously suggested models, correlating strength parameters and elastic moduli with hydrate saturation. These models can be used to infer the cohesion, dilation angle, and Young’s modulus of sediments containing gas hydrate. The presence of hydrate has a pronounced effect on cohesion, where cohesion can be linearly or non-linearly correlated with hydrate saturation (Table 5). For sediment stiffness, Kim [43] presented an empirical relation for Young’s modulus of Ulleung Basin sediments based on previous data [28,59,60,61] as follows:
E h b s = E o ( 1 + 13.25 S h )
where Ehbs and Eo are the Young’s modulus of hydrate-bearing sediments and of hydrate-free sediments, respectively. Accordingly, Young’s modulus of hydrate-bearing sediments is assumed based on linear interpolation between the values at two different hydrate saturations—typically, one for hydrate-free sediment and the other for a certain hydrate saturation (e.g., [40,41,42,43,44,45,46,62]). On the other hand, a logarithmic increase of the secant Young’s modulus of hydrate-bearing sediments has been also observed with increasing hydrate saturation by Yoneda et al. [25].
As a matter of fact, there are increasing concerns of extrapolating the mechanical properties of hydrate-bearing sediments from those of reconstituted hydrate-free sediments because the two can exhibit considerably different behaviors, such as brittle versus plastic behaviors. Therefore, using such correlations, predicting mechanical properties of hydrate-bearing sediments based on that of hydrate-free sediments should be done with caution; if possible, this should be limited to the same or a very particular class of sediments. Noting that the properties presented in this study are obtained from natural but reconstituted hydrate-free sediments, we acknowledge that the tests with natural or synthesized hydrate-bearing sediment core samples are needed for reliable correlation between hydrate saturation and thermal, mechanical, and hydraulic properties of Ulleung Basin sediments.

6. Conclusions

This study investigated the geomechanical, hydraulic, and thermal properties of natural coarse-grained sediments (UBGH2-6B-22R) cored from the hydrate occurrence region in the Ulleung Basin, East Sea, Korea. The sediment sample was classified as well-graded SM with a clay fraction of 1.3% and a silt fraction of 21%. The mean grain diameter was 110 μm, whereas the majority of the sediment grains were in the range of 1 μm to 1000 μm. XRD analysis showed that the sample was comprised of ~64% quartz, 15% albite, ~4.4% calcite, and accessory clay minerals that predominantly include muscovite, illite, and chlorite. Diatomaceous minerals with internal pores, albeit in limited quantities, were observed in the SEM images, implying a relatively high specific surface area compared with other sandy sediments with similar fine fractions.
The geomechanical strength and stiffness of the sediment were obtained using a series of triaxial compression tests under a consolidated-drained (CD) condition, covering in situ vertical effective stress at the depth from which the sediment core was retrieved (~0.75 MPa). While all of the specimens exhibited post-peak behavior with clear peak deviatoric stresses and clear shear bands, the peak and critical state friction angle under drained loading conditions were ~26° and ~22°, respectively, assuming no or minimal cohesion intercept. The stiffness of the sediment, including the tangential modulus (Etan) and secant modulus (E50), increased with increasing confining stress because this increasing stress caused increases in inter-particle coordination, contact area, frictional resistance, and consequently skeletal stiffness. The tangential moduli gradually reduced as the strain increased, and the initial quasi-elastic high stiffness region extended to an axial strain of ~0.1%. The obtained strength and stiffness parameters can be effectively used to assess sediment deformation and stability during depressurization and thermal dissociation of gas hydrates in sediments, which are highly likely to cause changes in stress conditions.
A change in water permeability with decreasing water saturation was observed in samples UBGH2-6B-22R and UBGH2-5B-22H. The thermal conductivity and electrical resistance were measured using a thermal water retention testing device. The water retention curve was fitted to the Maulem-van Genuchen equation, and the fitting parameters were extracted. For both sediments, water permeability was observed to decrease sharply as water saturation decreased. The 6B-22R sediments showed a higher AEV and a lower slope than those of 5B-22H due to the small particle size and high fraction of fines. However, residual water saturation was ~10%–20% in both sediment samples. As the gas phase fraction increased to ~80%–90%, the thermal conductivities of both samples decreased by ~60% (from ~1.4–1.6 W·m−1·K−1 to ~0.5–0.7 W·m−1·K−1). The opposite trend of increasing electrical resistance with increasing gas fraction was observed for electrical resistance with a quasi-linear tendency. Such a reduction in water saturation will likely occur when the dissociation of gas hydrate inevitably produces free gas in sediments.

Acknowledgments

The authors would like to thank two anonymous reviewers for providing valuable comments and suggestions. This research was supported by a grant (13SCIPS04) from Smart Civil Infrastructure Research Program funded by the Ministry of Land, Infrastructure and Transport of Korean government and Korea Agency for Infrastructure Technology Advancement (KAIA), by the Korea Institute of Energy Technology Evaluation & Planning (KETEP) and the Ministry of Trade, Industry and Energy (MOTIE) of the Republic of Korea (No. 20152520100760), and by the National Research Foundation of Korea (NRF) grant funded by the Korea Government (MSIP) (2011-0030040).

Author Contributions

Yohan Cha and Young Jin Kim designed and performed the experiments; Yohan Cha, Tae Sup Yun and Tae-Hyuk Kwon analyzed the data; Joo Yong Lee contributed the soil samples; authors made equal contribution and efforts on writing the manuscript.

Conflicts of Interest

The authors declare no conflict of interest.

References

  1. Park, K.P.; Bahk, J.J.; Kwon, Y.; Kim, G.Y.; Riedel, M.; Holland, M.; Schultheiss, P.; Rose, K. Korean National Program Expedition Confirms Rich Gas Hydrate Deposit in the Ulleung Basin, East Sea. 2008. Available online: https://www.netl.doe.gov/File%20Library/Research/Oil-as/methane%20hydrates/HMNewsSpring08.pdf (accessed on 23 September 2016). [Google Scholar]
  2. Kim, G.Y.; Yi, B.Y.; Yoo, D.G.; Ryu, B.J.; Riedel, M. Evidence of gas hydrate from downhole logging data in the Ulleung Basin, East Sea. Mar. Petrol. Geol. 2011, 28, 1979–1985. [Google Scholar] [CrossRef]
  3. Ryu, B.J.; Collett, T.S.; Riedel, M.; Kim, G.Y.; Chun, J.H.; Bahk, J.J.; Lee, J.Y.; Kim, J.H.; Yoo, D.G. Scientific results of the Second Gas Hydrate Drilling Expedition in the Ulleung Basin (UBGH2). Mar. Pet. Geol. 2013, 47, 1–20. [Google Scholar] [CrossRef]
  4. Ryu, B.J.; Kim, G.Y.; Chun, J.H.; Bahk, J.J.; Lee, J.Y.; Kim, J.H.; Yoo, D.G.; Collett, T.S.; Riedel, M.; Torres, M.E.; et al. The Second Ulleung Basin Gas Hydrate Drilling Expedition (UBGH2) Expedition Report; Korea Institute of Geosciences and Mineral Resources (KIGAM): Daejeon, Korea, 2012. [Google Scholar]
  5. Kim, H.S.; Cho, G.C.; Lee, J.Y.; Kim, S.J. Geotechnical and geophysical properties of deep marine fine-grained sediments recovered during the second Ulleung Basin Gas Hydrate expedition, East Sea, Korea. Mar. Pet. Geol. 2013, 47, 56–65. [Google Scholar] [CrossRef]
  6. Kwon, T.H.; Lee, K.R.; Cho, G.C.; Lee, J.Y. Geotechnical properties of deep oceanic sediments recovered from the hydrate occurrence region in the Ulleung Basin, East Sea, offshore Korea. Mar. Pet. Geol. 2011, 28, 1870–1883. [Google Scholar] [CrossRef]
  7. Lee, C.; Yun, T.S.; Lee, J.S.; Bahk, J.J.; Santamarina, J.C. Geotechnical characterization of marine sediments in the Ulleung Basin, East Sea. Eng. Geol. 2011, 117, 151–158. [Google Scholar] [CrossRef]
  8. Lee, J.S.; Lee, J.Y.; Kim, Y.M.; Lee, C. Stress-dependent and strength properties of gas hydrate-bearing marine sediments from the Ulleung Basin, East Sea, Korea. Mar. Pet. Geol. 2013, 47, 66–76. [Google Scholar] [CrossRef]
  9. Kim, Y.J.; Yun, T.S. Thermal conductivity of methane hydrate-bearing Ulleung Basin marine sediments: Laboratory testing and numerical evaluation. Mar. Pet. Geol. 2013, 47, 77–84. [Google Scholar] [CrossRef]
  10. Hancock, S.H.; Dallimore, S.R.; Collett, T.S.; Carle, D.; Weatherill, B.; Satoh, T.; Inoue, T. Overview of Pressure-Drawdown Production-Test Results for the JAPEX/JNOC/GSC et al. Mallik 5L-38 Gas Hydrate Production Research Well; Geological Survey of Canada Bulletin: Dartmouth, NS, Canada, 2005. [Google Scholar]
  11. Schoderbek, D.; Farrell, H.; Hester, K.; Howard, J.; Raterman, K.; Silpngarmlert, S.; Martin, K.L.; Smith, B.; Klein, P. ConocoPhillips Gas Hydrate Production Test Final Technical Report. 2013. Available online: http://www.netl.doe.gov/File%20Library/Research/Oil-Gas/methane%20hydrates/nt0006553-final-report-hydrates.pdf (accessed on 20 July 2013). [Google Scholar]
  12. Yamamoto, K. 2013 Methane hydrate offshore production test in the eastern Nankai Trough: a milestone on the path to real energy resource. In Proceedings of the 8th International Conference on Gas Hydrates (ICGH8-2014), Beijing, China, 28 July–1 August 2014.
  13. Oyama, H.; Abe, S.; Sato, T. Experimental study of mud erosion phenomena at sand mud alternate layer. In Proceedings of the 25th International Ocean and Polar Engineering Conference, Kona, Big Island, HI, USA, 21–26 June 2015.
  14. Bahk, J.J.; Chough, S.K.; Han, S.J. Origins and paleoceanographic significance of laminated muds from the Ulleung Basin, East Sea (Sea of Japan). Mar. Geol. 2000, 162, 459–477. [Google Scholar] [CrossRef]
  15. Chough, S.K.; Lee, H.J.; Yoon, S.H. Marine Geology of Korean Seas, 2nd ed.; Elsvier: Amsterdam, The Netherlands, 2000. [Google Scholar]
  16. Lee, G.H.; Kim, B. Infill history of the Ulleung Basin, East Sea (Sea of Japan) and implications on source rocks and hydrocarbons. Mar. Pet. Geol. 2002, 19, 829–845. [Google Scholar] [CrossRef]
  17. Bahk, J.J.; Kim, J.H.; Kong, G.S.; Park, Y.; Lee, H.; Park, Y.J.; Park, K.P. Occurrence of near-seafloor gas hydrates and associated cold vents in the Ulleung Basin, East Sea. Geosci. J. 2009, 13, 371–385. [Google Scholar] [CrossRef]
  18. Lee, J.Y.; Kim, G.Y.; Kang, N.K.; Yi, B.Y.; Jung, J.W.; Im, J.H.; Son, B.K.; Bahk, J.J.; Chun, J.H.; Ryu, B.J.; et al. Physical properties of sediments from the Ulleung Basin, East Sea: Results from Second Ulleung Basin Gas Hydrate Drilling Expedition, East Sea, Korea. Mar. Pet. Geol. 2013, 47, 43–55. [Google Scholar] [CrossRef]
  19. Lee, H.J.; Chun, S.S.; Yoon, S.H.; Kim, S.R. Slope stability and geotechnical properties of sediment of the southern margin of Ulleung Basin, East Sea (Sea of Japan). Mar. Geol. 1993, 110, 31–45. [Google Scholar] [CrossRef]
  20. Waite, W.F.; Stern, L.A.; Kirby, S.H.; Winters, W.J.; Mason, D.H. Simultaneous determination of thermal conductivity, thermal diffusivity and specific heat in sI methane hydrate. Geophys. J. Int. 2007, 169, 767–774. [Google Scholar] [CrossRef]
  21. Waite, W.F.; Santamarina, J.C.; Cortes, D.D.; Dugan, B.; Espinoza, D.N.; Germaine, J.; Jang, J.; Jung, J.W.; Kneafsey, T.J.; Shin, H.; et al. Physical properties of hydrate-bearing sediments. Rev. Geophys. 2009, 47. [Google Scholar] [CrossRef]
  22. Tanaka, H.; Locat, J. A microstructural investigation of Osaka Bay clay: The impact of microfossils on its mechanical behaviour. Can. Geotech. J. 1999, 36, 493–508. [Google Scholar] [CrossRef]
  23. Tréguer, P.; Nelson, D.M.; Van Bennekorn, A.J.; De Master, D.J.; Leynaert, A.; Quéguiner, B. The silica balance in the world ocean: A reestimate. Science 1995, 268, 375–379. [Google Scholar] [CrossRef] [PubMed]
  24. Shiwakoti, D.R.; Tanaka, H.; Tanaka, M.; Locat, J. Influences of diatom microfossils on engineering properties of soils. Soils Found. 2002, 42, 1–17. [Google Scholar] [CrossRef]
  25. Yoneda, J.; Masui, A.; Konno, Y.; Jin, Y.; Egawa, K.; Kida, M.; Ito, T.; Nagao, J.; Tenma, N. Mechanical properties of hydrate-bearing turbidite reservoir in the first gas production test site of the Eastern Nakai Trough. Mar. Pet. Geol. 2015, 66, 471–486. [Google Scholar] [CrossRef]
  26. Method for Consolidated Drained Triaxial Compression Test for Soils; ASTM D7181-11; American Society for Testing and Materials (ASTM) International: West Conshohocken, PA, USA, 2011.
  27. Goto, S.; Tatsuoka, F.; Shibuya, S.; Kim, Y.S.; Sato, T. A simple gauge for local small strain measurements in the laboratory. Soils Found. 1991, 31, 169–180. [Google Scholar] [CrossRef]
  28. Yun, T.S.; Santamarina, J.C.; Ruppel, C. Mechanical properties of sand, silt, and clay containing tetrahydrofuran hydrate. J. Geophys. Res. 2007, 112. [Google Scholar] [CrossRef]
  29. Gustafsson, S.E. Transient plane source techniques for thermal conductivity and thermal diffusivity measurements of solid materials. Rev. Sci. Instrum. 1991, 62, 797–804. [Google Scholar] [CrossRef]
  30. Kim, D.H.; Kim, Y.J.; Lee, J.-S.; Yun, T.S. Thermal and electrical response of unsaturated hydrophilic and hydrophobic granular materials. Geotech. Test. J. 2011, 34, 562–570. [Google Scholar]
  31. Santamarina, J.C.; Klein, K.A.; Fam, M.A. Soils and Waves; John Wiley & Sons: New York, NY, USA, 2001. [Google Scholar]
  32. Bachmann, J.; Horton, R.; Grant, S.A.; Van der Ploeg, R.R. Temperature dependence of water retention curves for wettable and water repellent soils. Soil Sci. Soc. Am. J. 2002, 66, 44–52. [Google Scholar] [CrossRef]
  33. Bachmann, J.; van der Ploeg, R.R. A review on recent developments in soil water retention theory: Interfacial tension and temperature effects. J. Plant Nutr. Soil Sci. 2002, 165, 468–478. [Google Scholar] [CrossRef]
  34. Mualem, Y. A new model for predicting hydraulic conductivity of unsaturated porous media. Water Resour. Res. 1976, 12, 513–522. [Google Scholar] [CrossRef]
  35. Van Genuchten, M.T. A closed form equation for predicting the hydraulic conductivity of unsaturated soils. Soil Sci. Soc. Am. J. 1980, 44, 892–898. [Google Scholar] [CrossRef]
  36. Santamarina, J.C.; Dai, S.; Terzariol, M.; Jang, J.; Waite, W.F.; Winters, W.J.; Nagao, J.; Yoneda, J.; Konno, Y.; Fujii, T.; et al. Hydro-bio-geomechanical properties of hydrate-bearing sediments from Nakai Trough. Mar. Pet. Geol. 2015, 66, 434–450. [Google Scholar] [CrossRef]
  37. Winters, W.J. Physical and geotechnical properties of gas-hydrate-bearing sediment from offshore India and the northern Cascadia Margin compared to other hydrate reservoirs. In Proceedings of the 7th International Conference on Gas Hydrates (ICGH 2011), Edinburgh, UK, 17–21 July 2011.
  38. Kwon, T.H.; Cho, G.C.; Santamarina, J.C. Gas hydrate dissociation in sediments: Pressure-temperature evolution. Geochem. Geophy. Geosy. 2008, 9. [Google Scholar] [CrossRef]
  39. Kwon, T.H.; Song, K.I.; Cho, G.C. Destabilization of marine gas hydrate-bearing sediments induced by a hot wellbore: A numerical approach. Energy Fuels 2010, 24, 5493–5507. [Google Scholar] [CrossRef]
  40. Rutqvist, J.; Moridis, G.J. Numerical studies on the geomechanical stability of hydrate-bearing sediments. SPE J. 2009, 14, 267–282. [Google Scholar] [CrossRef]
  41. Rutqvist, J.; Moridis, G.J.; Grover, T.; Collet, T. Geomechanical response of permafrost-associated hydrate deposits to depressurization-induced gas production. J. Pet. Sci. Eng. 2009, 67, 1–12. [Google Scholar] [CrossRef]
  42. Kim, J.; Yang, D.; Moridis, G.J.; Rutqvist, J. Numerical studies on two-way coupled fluid flow and geomechanics in hydrate deposits. In Proceedings of the 2011 Reservoir Simulation Symposium, Woodlands, TX, USA, 21–23 February 2011.
  43. Kim, A.R. T-H-M Coupled Numerical Analysis of Gas Production from Methane Hydrate Deposits in the Ulleung Basin in Korea. Ph.D. Thesis, Korea Advanced Institute of Science and Technology (KAIST), Daejeon, Korea, 2016. [Google Scholar]
  44. Ng, M.Y.A.; Klar, A.; Soga, K. Coupled soil deformation-flow-thermal analysis of methane production in layered methane hydrate soils. In Proceedings of the Offshore Technology Conference, Houston, TX, USA, 5–8 May 2008.
  45. Klar, A.; Soga, K.; Ng, M.Y.A. Coupled deformation-flow analysis for methane hydrate extraction. Geotechnique 2010, 60, 765–776. [Google Scholar] [CrossRef]
  46. Klar, A.; Uchida, S.; Soga, K.; Yamamoto, K. Explicitly coupled thermal flow mechanical formulation for gas-hydrate sediments. SPE J. 2013, 18, 196–206. [Google Scholar] [CrossRef]
  47. Sachs, W.; Meyn, V. Surface tension in the system methane/waters—A glance at numeric and precision of the experimental method (pendent drop) and precise experimental results in comparison with literature. Erdol Erdgas Kohle 1995, 111, 119–121. (In German) [Google Scholar]
  48. Ren, Q.Y.; Chen, G.J.; Yan, W.; Guo, T.M. Interfacial tension of (CO2 + CH4) + water from 298 K to 373 K and pressures up to 30 MPa. J. Chem. Eng. Data 2000, 45, 610–612. [Google Scholar] [CrossRef]
  49. Sun, C.Y.; Chen, G.J.; Yang, L.Y. Interfacial tension of methane + water with surfactant near the hydrate formation conditions. J. Chem. Eng. Data 2004, 49, 1023–1025. [Google Scholar] [CrossRef]
  50. Espinoza, D.N.; Santamarina, J.C. Water-CO2-mineral systems: Interfacial tension, contact angle, and diffusion—Implications to CO2 geological storage. Water Resour. Res. 2010, 46. [Google Scholar] [CrossRef]
  51. Jung, J.W.; Wan, J. Supercritical CO2 and ionic strength effects on wettability of silica surfaces: Equilibrium contact angle measurements. Energy Fuels 2012, 26, 6053–6059. [Google Scholar] [CrossRef]
  52. Huang, D.; Fan, S. Measuring and modeling thermal conductivity of gas hydrate-bearing sand. J. Geophys. Res. 2005, 110. [Google Scholar] [CrossRef]
  53. Kaye, G.W.C.; Laby, T.H. Table of Physical and Chemical Constant, 16th ed.; National Physical Laboratory: Middlesex, UK, 2007. [Google Scholar]
  54. Stephan, K.; Laesecke, A. The thermal conductivity of fluid air. J. Phys. Chem. Ref. Data 1985, 14, 227–234. [Google Scholar] [CrossRef]
  55. Horai, K.I.; Simmons, G. Thermal conductivity of rock forming minerals. Earth Planet. Sci. Lett. 1969, 6, 359–368. [Google Scholar] [CrossRef]
  56. Kleinberg, R.; Flaum, C.; Griffin, D.; Brewer, P.; Malby, G.; Peltzer, E.; Yesinowski, J. Deep sea NMR: Methane hydrate growth habit in porous media and its relationship to hydraulic permeability, deposit accumulation, and submarine slope stability. J. Geophys. Res 2003, 108. [Google Scholar] [CrossRef]
  57. Dai, S.; Seol, Y. Water permeability in hydrate-bearing sediments: A pore-scale study. Geophys. Res. Lett. 2014, 41, 4176–4184. [Google Scholar] [CrossRef]
  58. Konno, Y.; Masuda, Y.; Hariguchi, Y.; Kurihara, M.; Ouchi, H. Key factors for depressurization-induced gas production from oceanic methane hydrates. Energy Fuels 2010, 24, 1736–1744. [Google Scholar] [CrossRef]
  59. Uchida, S.; Soga, K.; Yamamoto, K. Critical state soil constitutive model for methane hydrate soil. J. Geophys. Res. 2012, 117. [Google Scholar] [CrossRef]
  60. Masui, A.; Haneda, H.; Ogata, Y.; Aoki, K. The effect of saturation degree of methane hydrate on the shear strength of synthetic methane hydrate sediments. In Proceedings of the 5th International Conference on Gas Hydrates, Trondheim, Norway, 13–16 June 2005; pp. 657–663.
  61. Miyazaki, K.; Masui, A.; Sakamoto, Y.; Aoki, K.; Tenma, N.; Yamaguchi, T. Triaxial compressive properties of artificial methane-hydrate-bearing sediment. J. Geophys. Res. 2011, 116. [Google Scholar] [CrossRef]
  62. Sultan, N.; Garziglia, S. Geomechanical constitutive modelling of gas-hydrate-bearing sediments. In Proceedings of the 7th International Conference on Gas Hydrates (ICGH7), Edinburgh, UK, 17–21 July 2011.
Figure 1. Locations of the study sites in the Ulleung Basin, East Sea, Korea.
Energies 09 00775 g001
Figure 2. Logging-while-drilling (LWD) and core test results at Site UBGH2-6: (a) bulk density; (b) porosity; (c) chlorinity; (d) thermal conductivity; (e) ring resistivity; (f) P-wave velocity; (g) hydrate saturation; and (h) vertical effective stress. Thermal conductivity and chlorinity results were obtained from core tests. The base of gas hydrate stability zone (BGHSZ) at this site was estimated to occur at 174 mbsf (as denoted with a red dotted line), and the gas hydrate occurrence zone (GHOZ) was found to be from 110 mbsf to 155 mbsf (as denoted with a gray dashed line). All the data was gathered from Lee et al. [18] and Ryu et al. [3,4].
Energies 09 00775 g002
Figure 3. The texture of the core section studied. The digital photo of the half-cut core section 2-6B-22R has been obtained from UBGH2 Scientific Report (Ryu et al. [4], courtesy of Drs. J. J. Park and J. Y. Lee, KIGAM).
Energies 09 00775 g003
Figure 4. (a) Particle size distribution; and (b) X-ray diffraction (XRD) analysis results of the sediment samples.
Energies 09 00775 g004
Figure 5. The scanning electron microscopy images of the 2-6B-22R sediment particles: (a) angular sand particles; (b) a wide range of particle sizes with sands, silts, and clays; (c) platy clay particles; (d) a broken centric diatom with internal pores and covered with clays; (e) a fragment of centric diatom; (f) a centric diatom with internal pores filled with clays; (g) pennate diatoms; and (h) pennate diatoms.
Energies 09 00775 g005
Figure 6. A set-up for triaxial compression tests.
Energies 09 00775 g006
Figure 7. The thermal water retention testing device used to obtain water retention curve, thermal conductivity and electrical resistance.
Energies 09 00775 g007
Figure 8. Responses to drained monotonic loading and the resulting Mohr-Coulomb failure envelop: (a) deviatoric stress; (b) void ratio; (c) lateral strain versus axial strain; and (d) the Mohr circles at failure (solid lines) and critical state (dotted lines) and the failure envelopes.
Energies 09 00775 g008
Figure 9. Variation of tangential Young’s moduli as a function of axial strain at different effective confining stresses (σ′c): (a) 0.32 MPa; (b) 0.63 MPa; (c) 1.47 MPa; (d) 2.57 MPa; (e) 5.25 MPa; and (f) variation of Young’s moduli as a function of effective confining stresses.
Energies 09 00775 g009
Figure 10. (a) The water retention curves; (b) relative permeability versus matric suction; and (c) relative permeability versus water saturation.
Energies 09 00775 g010
Figure 11. (a) Thermal conductivity; and (b) electrical resistance versus water saturation.
Energies 09 00775 g011
Table 1. Physical and index properties of the sample core. Cu: coefficient of uniformity; Cc: coefficient of curvature; USCS: unified soil classification system; SM: silty sand; SP: poorly graded sand.
Hole-Core-Section2-6B-22R2-5B-22H
Depth (mbsf) 1145.9–147139.5–147.5
Water depth (m)21541969
Temperature (°C) 1~17~14–15
Pressure (MPa) 1~23~21
Bulk density (kg/m3) 11604~1600
In situ porosity (%) 135.450
Remolded porosity (%) 2~44–46~43
Gs (-) 12.72.6
Water content (%) 120.3Not available
D50 (mm) 2110220
Cu (-) 26.31.7
Cc (-) 22.90.96
Sand fraction (%) 278.197.6
Silt fraction (%) 220.62.4
Clay fraction (%) 21.3Non-measurable
USCS 2Well-graded SMSP
Effective stress (kPa) 1755~700
Hydrate saturation (%) 1>400 (No infrared anomaly)
1 The parameters were estimated from LWD results (Ryu et al. [3,4]) and on-board core test results (Lee et al. [18]); 2 the values were obtained from this study.
Table 2. XRD analysis results of the sample 2-6B-22R.
Mineral%
Quartz63.7
Albite15
Orthoclase K-feldspar6.9
Muscovite/Illite5.7
Calcite4.4
Chlorite2.5
Biotite1.8
Table 3. Conditions and results of triaxial compression tests and Young’s moduli.
Effective Confining Stress (MPa)Deviatoric Stress at Failure (MPa)Deviatoric Stress at Critical State (MPa)Pore Water Pressure (MPa)Etan at 0.1% εa (MPa)Etan at 1% εa (MPa)E50 (MPa)
0.320.650.230.33642229
0.631.040.390.631012639
1.472.251.940.511223040
2.584.173.141.131777650
5.256.69-1.135277980
Table 4. Strength parameters of natural sediments from hydrate-occurring layers.
LocationSite-HoleTest ConditionsCohesion or Undrained StrengthInternal Friction Angle 1Sediment DescriptionReference
Ulleung Basin, KoreaUBGH2-6B-22RDrained triaxial testsNo cohesion intercept26° (Peak friction angle)
22° (Critical State friction angle)
SMThis study
Ulleung Basin, KoreaUBGH2-10D-8H
UBGH2-6B-8H/27H
UBGH2-10C-11H
Undrained triaxial tests18–30 kPa17.6°–24.6°Clay- and silt-dominant sedimentsLee et al. [8]
Ulleung Basin, KoreaUBGH2-6C-10HUndrained triaxial testsNot available27°Sediment with a high sand fractionLee et al. [8]
Krishna-Godavari Basins, IndiaNGHP-01
KG Basin
21A-2Y
Undrained triaxial testsNot available30°–31°Maximum friction angleWinters et al. [37]
Krishna-Godavari Basin, IndiaNGHP-01
KG Basin
10D-10X
Undrained triaxial tests7.2 kPa21.3°Fine-grained sediments Composite friction angleWinters et al. [37]
Mahanadi Basin, IndiaNGHP-01, Mahanadi Basin 18A-5HUndrained triaxial tests9.7 kPa24.5°Fine-grained sediments Composite friction angleWinters et al. [37]
Cascadia, Hydrate RidgeODP Leg 204 1249-4HUndrained triaxial testsNot available29Fine-grained sedimentsWinters et al. [37]
Mckenzie Delta, CanadaMallik-2LUndrained triaxial testsNot available34°–44°Coarse-grained sedimentWinters et al. [37]
Nakai Trough, JapanAT1-C-20PDirect shear testsNot available27° (Peak friction angle)
25° (Residual friction angle)
Sand-silt mixed sediments, using Pressure core characterization toolsSantamarina et al. [36]
Nakai Trough, JapanAT1-CDrained and undrained triaxial tests for sandy sediments and for clayey-silty sedimentsNo or minimal cohesion intercept, but increases with hydrate saturation30°–37° (Effective friction angle)Sandy sediments and clayey-silty sedimentsYoneda et al. [25]
Note: 1 the internal friction angles collected herein are peak friction angles unless denoted.
Table 5. Models for correlation between sediment properties and hydrate saturation.
PropertyCorrelationReference
Permeability K h b s = K o ( 1 S h ) 3 ( 1 + 2 S h ) 2 Dai et al. [57]
Relative permeability k r w = k r w 0 ( S e ) N w and k r g = k r g 0 ( 1 S e ) N g , where
S e = S w m S i w 1 S i g S i w = S w / ( 1 S h ) S i w 1 S i g S i w
kri0 : Relative permeability of end point to the phase i
Ni: Relative permeability index of the phase i
Se: Normalized water saturation
Swm: Effective water saturation
Sii: Irreducible saturation of the phase i
Konno et al. [58]
Note: Nw = 3, Ng = 2, krw0 = 1, krg0 = 1, Siw = 0.1, and Sig = 0.1 were used in Kanno et al. (2010)
k r w = S w m b [ 1 ( 1 S w m 1 / a ) a ] 2 and k r g = ( 1 S w m ) c ( 1 S w m 1 / a ) 2 a , where
S w m = S w S w + S g = S w 1 S h
a, b, c: van Genuchten parameters for soil pore structures
Swm: Effective water saturation
Klar et al. [45,46]
Note: a = 0.92, b = 0.5, c = 0.5 were used in Klar et al. [45,46]
Cohesion c h b s = 0.5 MPa + 1.5 MPa × S h Rutqvist and Moridis [40]
Rutqvist et al. [41]
c h b s = 3.3 MPa × S h Klar et al. [45,46]
c h b s = 2.5 MPa × S h Ng et al. [44]
c h b s = 0.15 MPa + 10 MPa × S h 3 Uchida et al. [59]
c h b s = c h f s + 1 sin ϕ 2 cos ϕ × α × ( S h % ) β ,
chfs: Cohesion of hydrate-free sediments
Yoneda et al. [25]
Note: α = 1.1 × 10⁻³, β = 1.8
Dilation angle sin ψ h b s = 0.45 × S h Klar et al. [45,46]
sin ψ h b s = 0.05 + 0.5 × S h Ng et al. [44]
ψ h b s = 24 ° × S h 0.6 Uchida et al. [59]
Young’s modulus E h b s = 500 MPa + 1300 MPa × S h Rutqvist et al. [41]
E h b s = 300 MPa + 1350 MPa × S h Klar et al. [45,46]
E h b s = 125 MPa + 1000 MPa × S h Ng et al. [44]
E h b s = E o ( 1 + 13.25 S h ) Kim [43]

