Article

Low Voltage Ride-Through Capability Solutions for Permanent Magnet Synchronous Wind Generators

by
Victor F. Mendes
1,*,
Frederico F. Matos
2,3,
Silas Y. Liu
2,
Allan F. Cupertino
2,4,
Heverton A. Pereira
2,5 and
Clodualdo V. De Sousa
3
1
Department of Electrical Engineering, Federal University of Minas Gerais, Belo Horizonte, Minas Gerais 31270-010, Brazil
2
Graduate Program in Electrical Engineering, Federal University of Minas Gerais, Belo Horizonte, Minas Gerais 31270-901, Brazil
3
Department of Electrical Engineering, Federal University of Itajubá, Itabira, Minas Gerais 35903-087, Brazil
4
Department of Materials Engineering, Federal Center for Technological Education of Minas Gerais, Belo Horizonte, Minas Gerais 30421-169, Brazil
5
Department of Electrical Engineering, Federal University of Viçosa, Viçosa, Minas Gerais 36570-900, Brazil
*
Author to whom correspondence should be addressed.
Energies 2016, 9(1), 59; https://doi.org/10.3390/en9010059
Submission received: 10 October 2015 / Revised: 14 December 2015 / Accepted: 30 December 2015 / Published: 20 January 2016
(This article belongs to the Special Issue Wind Turbine 2015)

Abstract

:
Due to the increasing number of wind power plants, several countries have modified their grid codes to include specific requirements for the connection of this technology to the power system. One of the requirements is the ride-through fault capability (RTFC), i.e., the system capability to sustain operation during voltage sags. In this sense, the present paper intends to investigate the behavior of a full-converter wind generator with a permanent magnet synchronous machine during symmetrical and asymmetrical voltage sags. Two solutions to improve the low voltage ride-through capability (LVRT) of this technology are analyzed: discharging resistors (brake chopper) and resonant controllers (RCs). The design and limitations of these solutions and the others proposed in the literature are discussed. Experimental results in a 34 kW test bench, which represents a scaled prototype of a real 2 MW wind conversion system, are presented.

Graphical Abstract

1. Introduction

Modern grid codes around the world require that wind energy conversion systems (WECS) remain connected to the grid during voltage sags [1]. Furthermore, some grid codes specify reactive current infeed during voltage sags in order to contribute to the power system stability [2]. Figure 1 shows the ride-through fault capability curve (RTFC) required by the Brazilian grid code [3], where the hatched area denotes the voltage sag amplitude and time characteristics which the system is not allowed to be disconnected from the grid.
There are several different topologies of WECS. Nowadays, the gear-drive doubly-fed induction generator (DFIG) based wind turbine is dominating the market [4]. The DFIG technology has the advantage of using partial scale converters, decreasing the system costs, but it has two main drawbacks: the use of a gearbox, which is a weak point in the structure with high maintenance costs, and due to the direct stator connection to the grid, this technology is greatly affected by grid disturbances [5,6,7,8].
The direct-drive permanent magnet synchronous generators (PMSG) with full scale converters, as depicted in Figure 2, is one of the technologies with the highest growth rates worldwide, especially because of the increasing number of offshore power plants. It has been proven to be more robust compared to DFIG systems, because of the absence of the gear-box, and the decoupling between generator and grid which permits enhanced low voltage ride-through capability (LVRT) [4].
Figure 1. Ride-through fault capability (RTFC) required by Brazilian grid code [3].
Energies 09 00059 g001
Figure 2. Wind conversion system using the permanent magnet synchronous generator (PMSG) with full scale converter.
Energies 09 00059 g002
In this context, several papers in the literature address the behavior of WECS during voltage sags and propose strategies to improve the system RTFC. The issue of the LVRT in DFIG-based technology is a topic extensively discussed in the literature, and several strategies are proposed to improve the system response, as presented in papers [5,6,7,8,9,10]. The RTFC of PMSG-based technology is simpler, since the use of a full scale back-to-back converter decouples the grid and generator sides [4,11]. Nevertheless, during voltage sags, the capability of the converter to supply active power to the grid is reduced, and then the power that is converted by turbines/generators may increase the DC-link voltage. Therefore, several works propose solutions to improve the RTFC of PMSG WECS [12,13,14,15,16,17,18,19,20,21].
The most employed strategy to guarantee the LVRT of PMSG-based technology is the braking resistor (braking chopper) which dissipates the surplus energy that cannot be supplied to the grid during voltage sags, as presented in [12]. References [13,14] propose the use of energy storage systems to store the surplus energy. Although the stored energy can be used for other purposes, this solution has a higher cost compared to the braking chopper.
Control strategies are also employed to reduce the use of the braking resistor. For this purpose, Yang et al. [15] proposes the reduction of the generator active power reference during the voltage sag. The drawback of this strategy is the generator/turbine speed increase, since the surplus energy is stored as kinetic energy in the turbine. Another control solution is the shifting of functions between grid side converter (GSC) and machine side converter (MSC) [16,17,18,19,20]. Nevertheless, with this strategy, the generator speed also increases. Therefore, some works use the pitch control to avoid the speed increase [15,16,17]. The use of an auxiliary converter in conjunction with a coordinated control is presented in [21], but the use of extra equipment tends to be avoided by manufacturers, because of the costs.
Besides the surplus energy during all voltage sags, LVRT strategies must also deal with negative sequence components that arise during asymmetrical voltage sags. Huang et al. [14] employs an independent control of positive and negative sequence components of grid currents, a well-known strategy for grid connected voltage source converters (VSC). The feedforward of negative sequence grid voltage is used in [16,20]. Kim et al. [19] proposes a non-linear strategy to control the negative sequence current.
The present paper performs a complete analysis of the RTFC problem of PMSG wind conversion system using a full scale converter (FC-PMSG). It is addressed the behavior of the classical dq-axes current control using braking resistors during symmetrical and asymmetrical voltage sags. Resonant controllers (RCs) are employed in order to improve the system RTFC during asymmetrical voltage conditions. RCs are extensively employed for grid connected converters, but their use for FC-PMSG application is not reported in the literature reviewed. Furthermore, the analysis is carried out through experimental results in a 34 kW test bench, which is a higher power output than the experimental results presented in the researched works (below 5 kW). The feasibility of the strategies proposed in the literature is also discussed.
This work was conducted in partnership with a company that develops converters and control systems for FC-PMSG wind turbines; therefore, its main objectives are to point out the system weaknesses and to propose feasible solutions for them. The results were evaluated according to the curve presented in Figure 1, since this company is developing solutions for the Brazilian market.
The paper is divided as follows: Section 2 describes the WECS using FC-PMSG, as well as the test bench. Section 3 and Section 4 present the experimental results for the classical control during symmetrical and asymmetrical voltage sags. The use of the RC strategy is discussed in Section 5 as well as its experimental results. Finally, the conclusions and future work are presented in the last section.

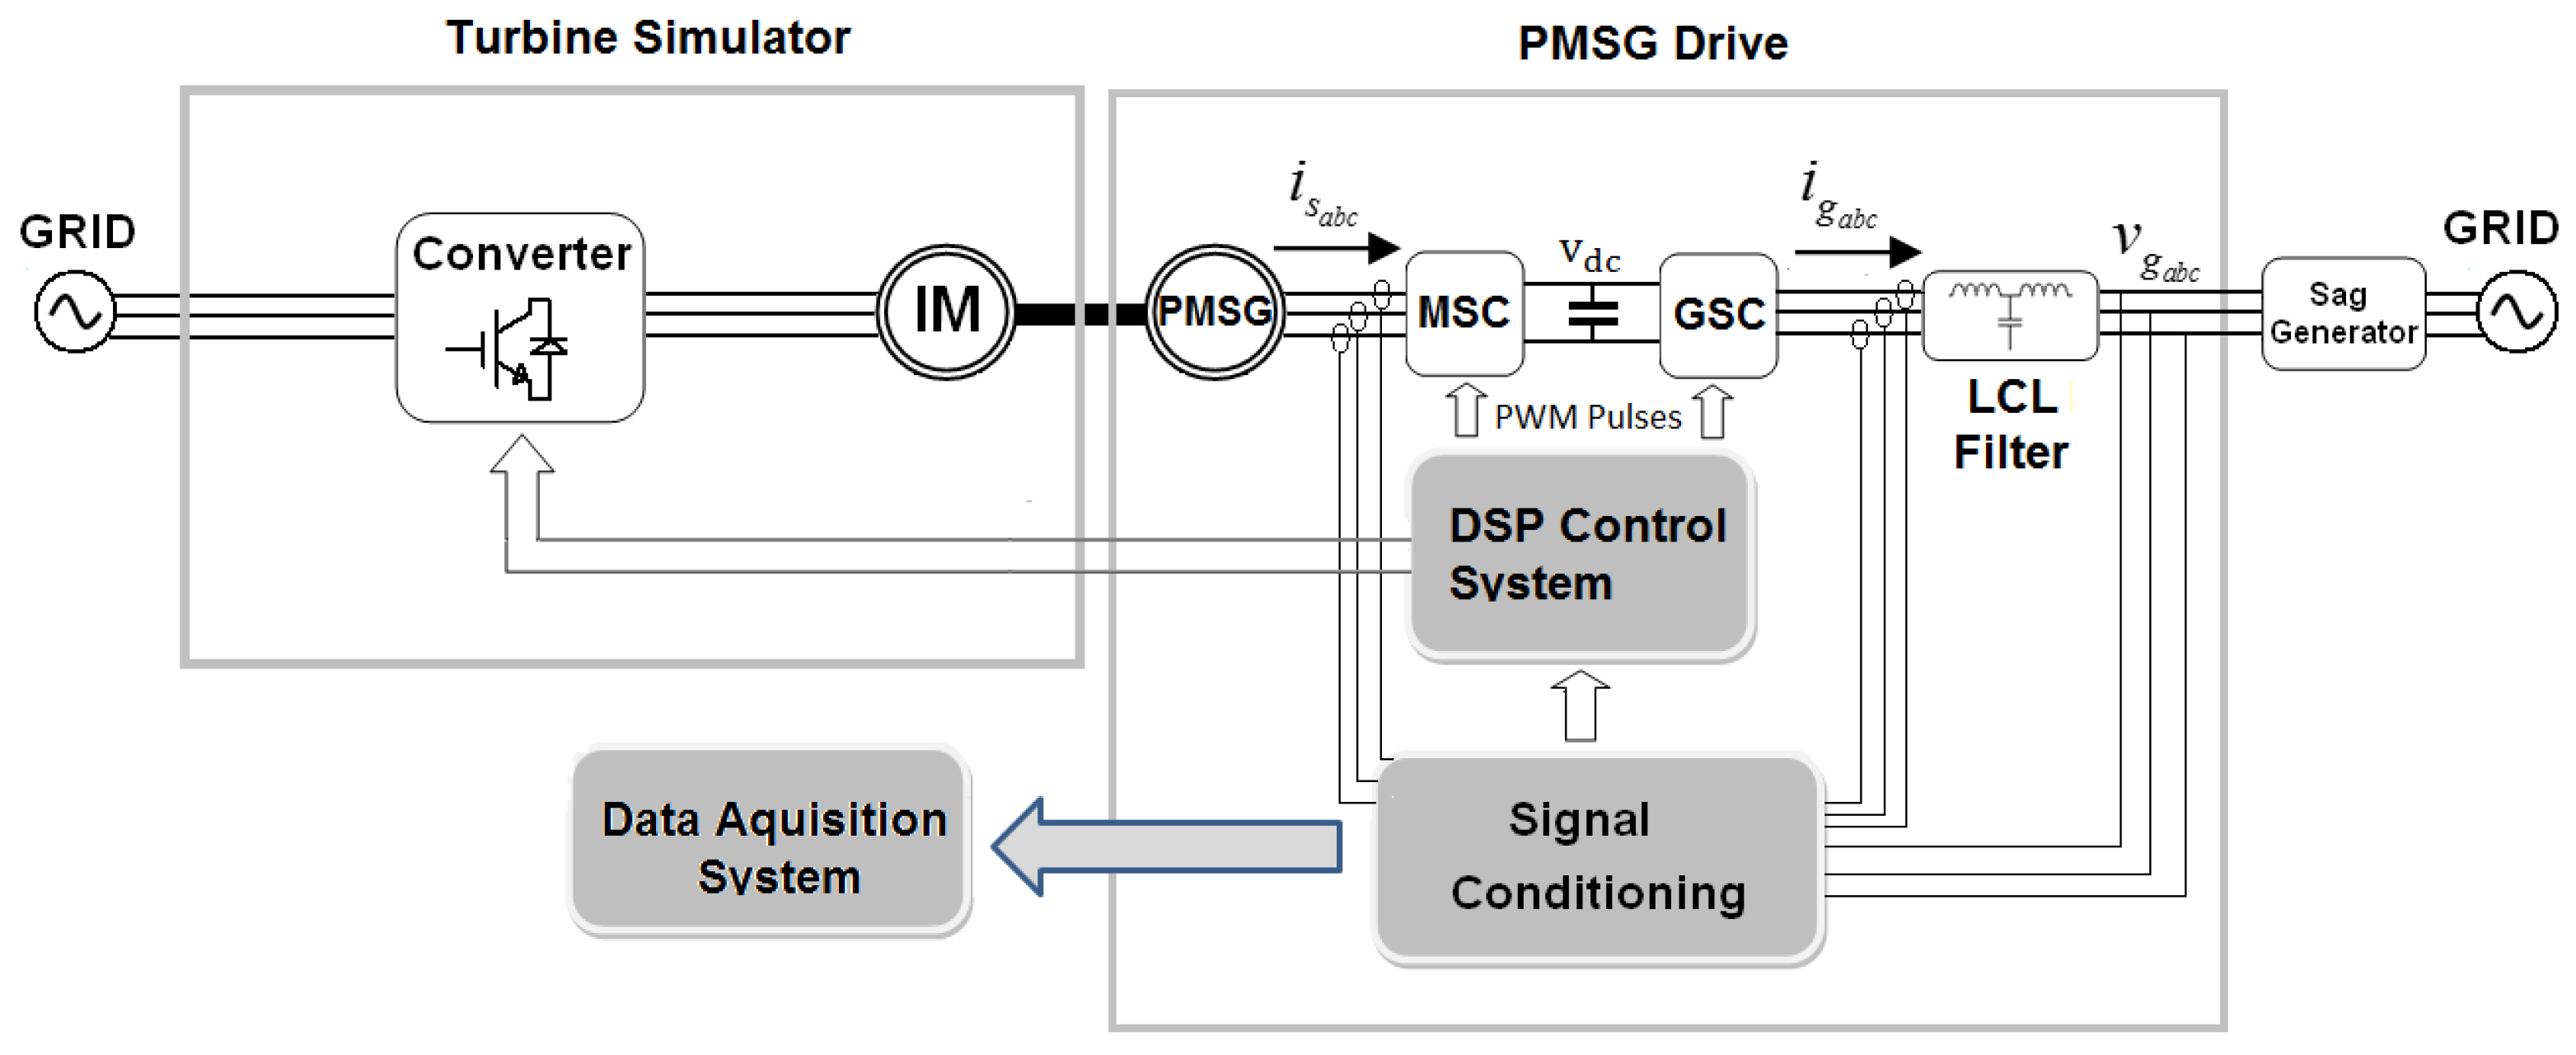
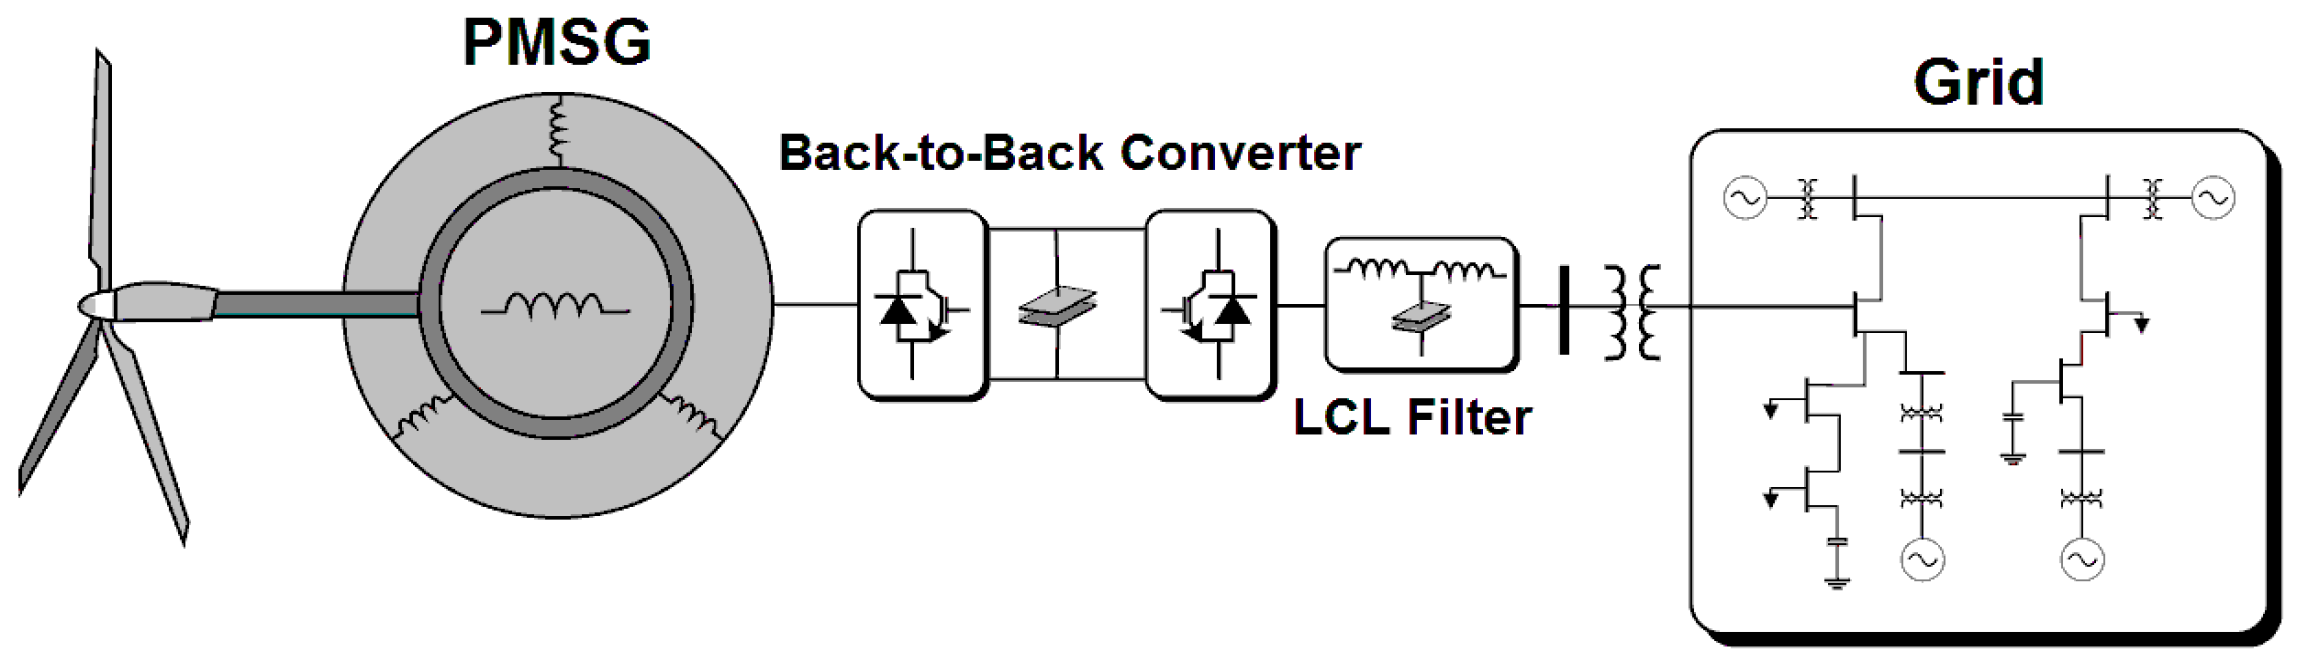
2. Full Converter Permanent Magnet Synchronous Generator Wind Energy Conversion System

The WECS with full scale converter and PMSG is depicted in Figure 2. The basic modeling of the main components and the classical control strategy are described in the following subsections, as well as the scaled test bench.

2.1. Permanent Magnet Synchronous Generator

The electrical and mechanical differential equations of the PMSG in the synchronous reference frame are [22]:
v s d = R s i s d L d d i s d d t + ω r L d i s q
v s q = R s i s q L q d i s q d t ω r L q i s d + ω r ψ r
T e = 3 2 P 2 [ ( L d L q ) i s d + ψ r ] i s q
T turb T e = ( J r d t + B ω r ) 2 P
where v s d and v s q are d and q-axes stator voltages, i s d and i s q are d and q-axes stator currents, Rs is the stator resistance, Ld and Lq are d and q-axes inductances, ω r is the electrical rotational speed, ψ r is the magnetic flux, P is the pole number, Te is the electromagnetic torque, Tturb is the torque of the turbine, J is the sum of turbine and generator inertia and B is the friction coefficient.
Equations (1)–(4) are represented in the positive synchronous reference frame. As the converter decouples the machine side and the grid side, it is unlikely that the generator can be submitted to negative sequence components.

2.2. Grid Side

Generally, the GSC is connected to the grid using a LCL filter. The simplified modeling of the grid side in the synchronous reference frame [23] is:
v c d = R f i g d + L f d i g d d t ω g L f i g q + v g d
v c q = R f i g q + L f d i g q d t + ω g L f i g d + v g q
where v g d and v g q are d and q-axes grid voltages, v c d and v g q are d and q-axes converter voltages, i g d and i g q are d and q-axes grid currents, Rf is the filter resistance, Lf is the filter inductance and ω g is the grid angular frequency. The active and reactive powers can be written as:
P = 3 2 ( v g d i g d + v g q i g q )
Q = 3 2 ( v g q i g d v g d i g q )
Equations (5)–(8) are represented in the synchronous positive reference frame, generally used for control purposes. During asymmetrical voltage sags, negative components also arise. Therefore, the dq-axes variables can be represented as [8]:
A dq + = A dq+ + + A dq + = A dq + + + A dq e j 2 ω g t
A” is the voltage or current, the superscript indicates the reference frame (positive + or negative −) and the subscript represents the component (d- or q-axes, positive or negative sequence). One can see that the negative sequence components appear as an oscillation with twice the grid frequency.
The negative sequence components of currents and voltages cause oscillations in the active and reactive power. Using Equation (9) to decompose Equations (7) and (8) in positive and negative sequence components, the active and reactive power can be rewritten as [24]:
P = P g 0 + P g cos cos ( 2 ω g t ) + P g sin sin ( 2 ω g t )
Q = Q g 0 + Q g cos cos ( 2 ω g t ) + Q g sin sin ( 2 ω g t )
where:
[ P g 0 P g cos P g sin Q g 0 Q g cos Q g sin ] = 3 2 [ V g d+ + V g q+ + V g d V g q V g d V g q V g d+ + V g q+ + V g q V g d V g q+ + V g d+ + V g q+ + V g d+ + V g q V g d V g q V g d V g q+ + V g d+ + V g d V g q V g d+ + V g q+ + ] [ I g d+ + I g q+ + I g d I g q ]
Through Equations (10)–(12), it is seen that the cross product between negative and positive sequence components of voltages and currents causes 2·ωg oscillations in the power (cos and sin terms). Furthermore, the direct product of negative sequence components of currents and voltages can modify the power transference mean value ( P g 0 and Q g 0 ).

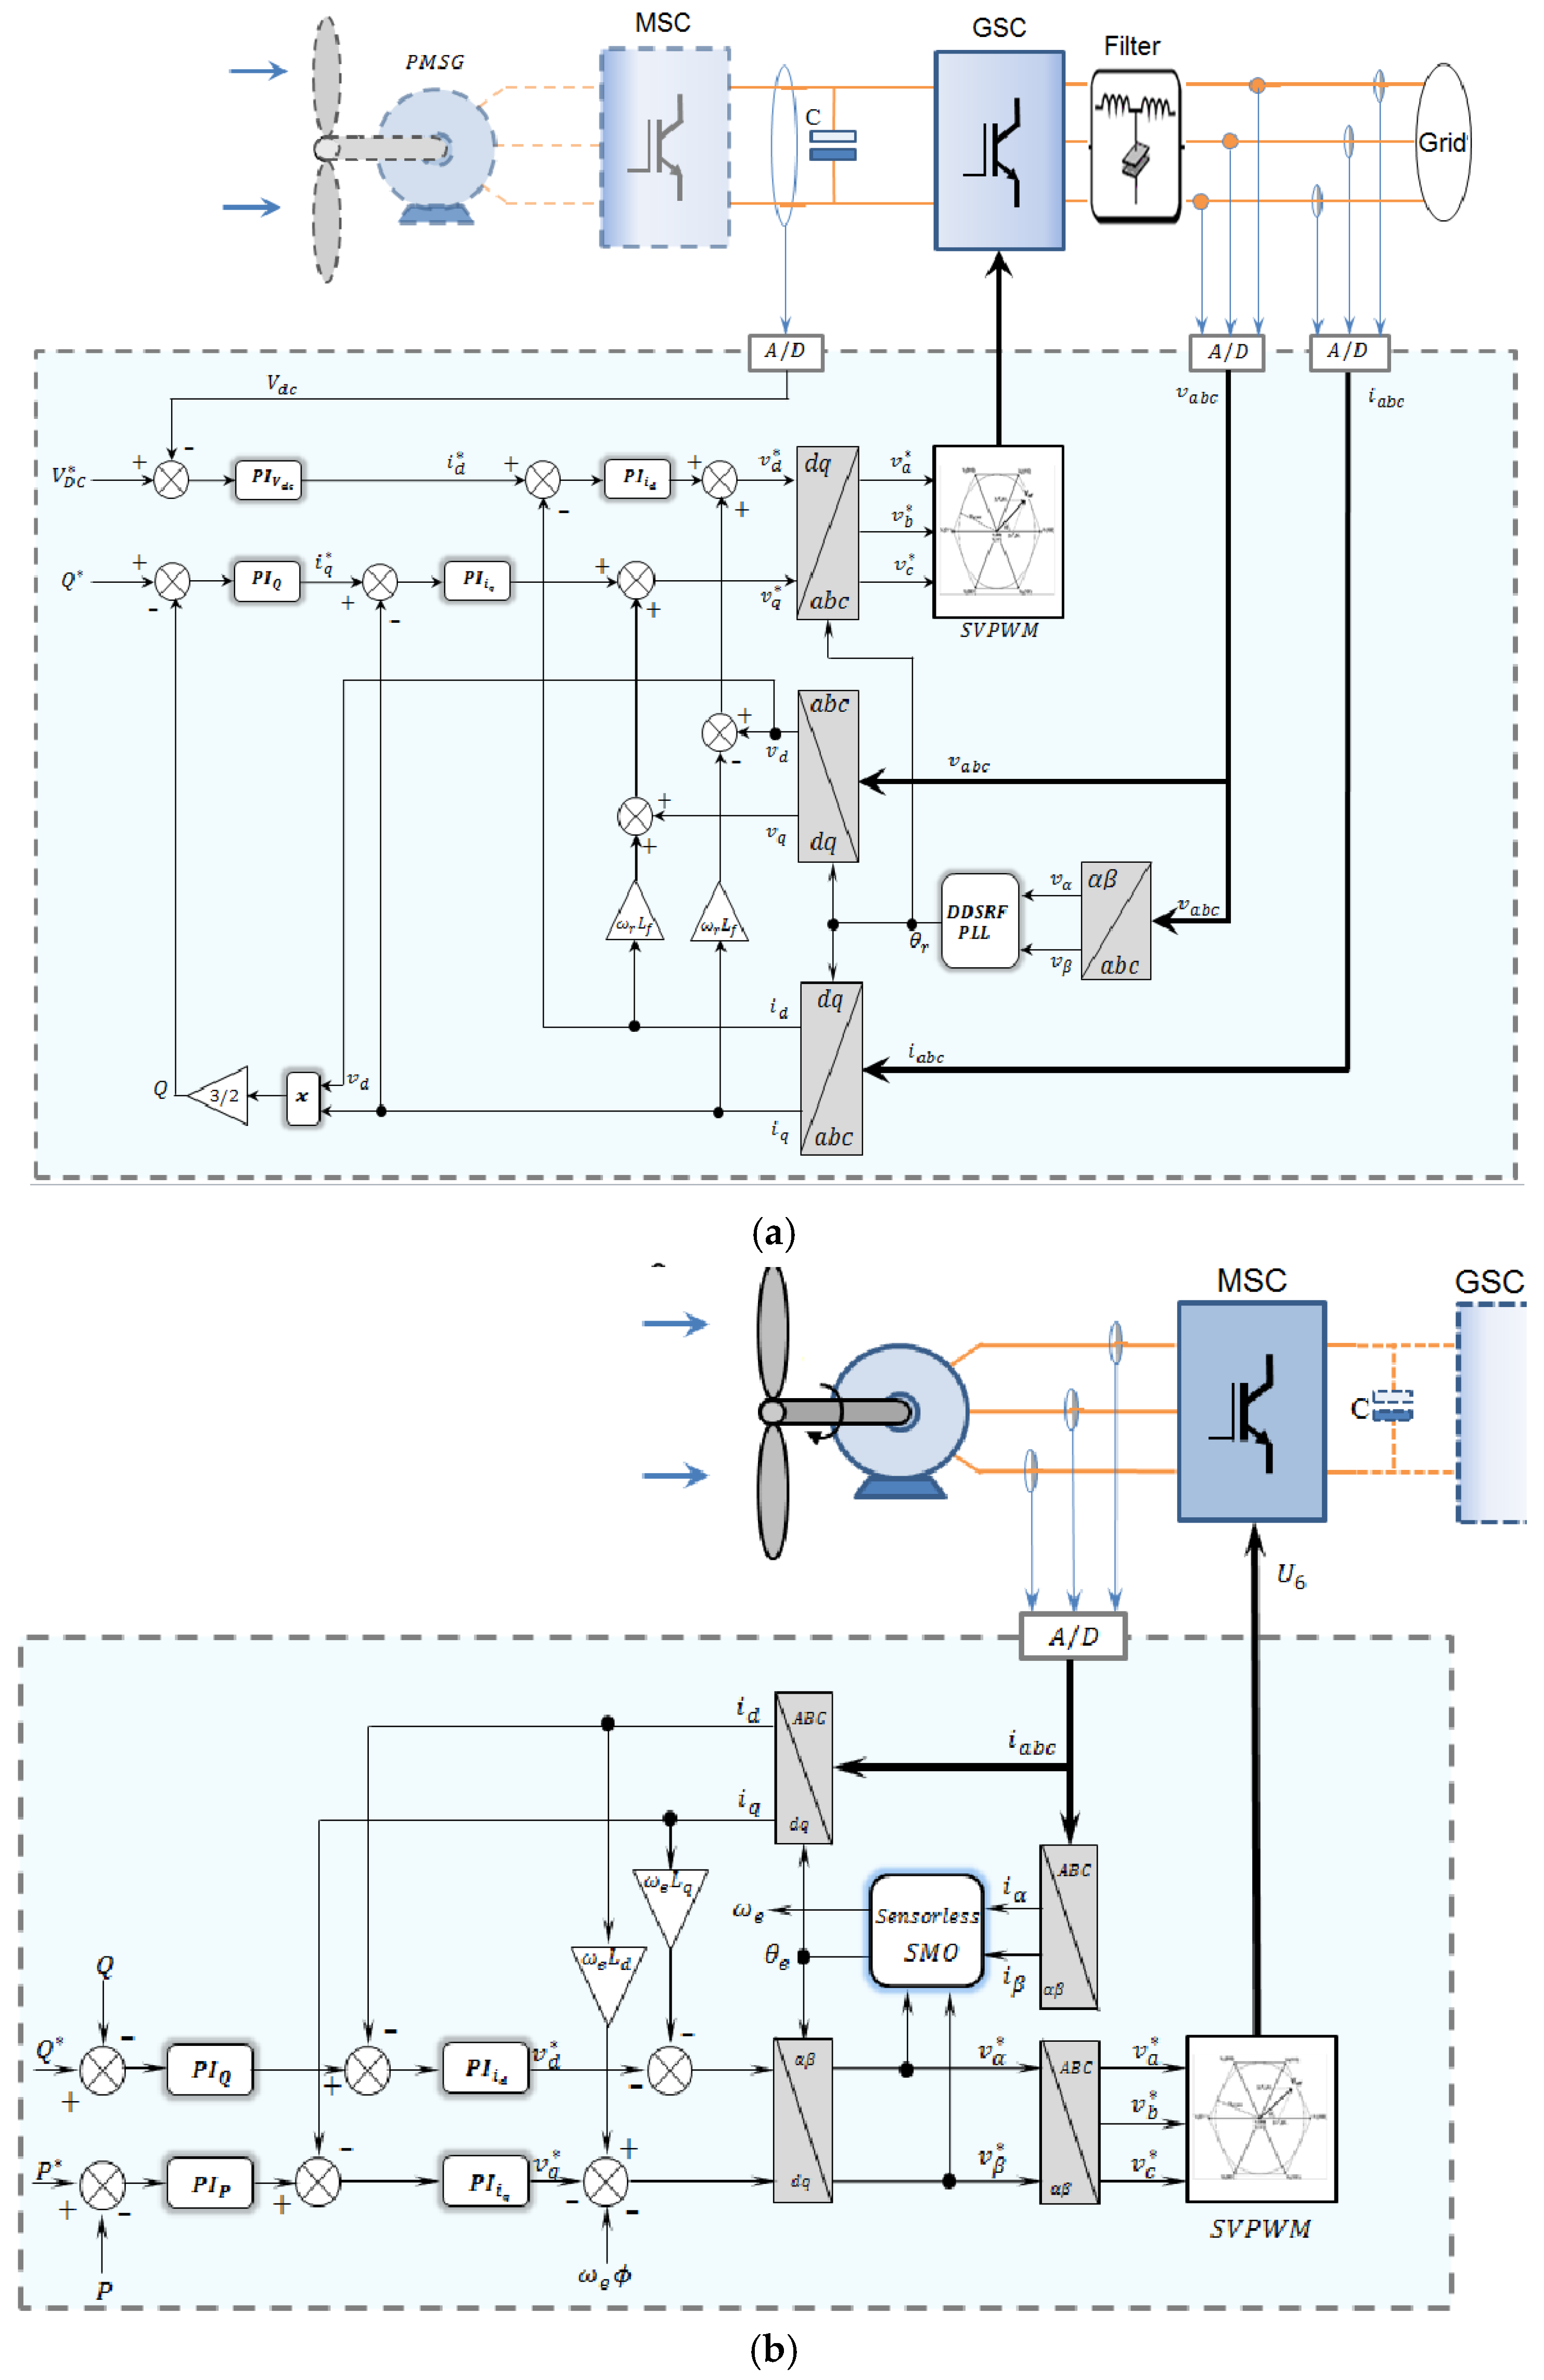
2.3. The Classic Control Structure
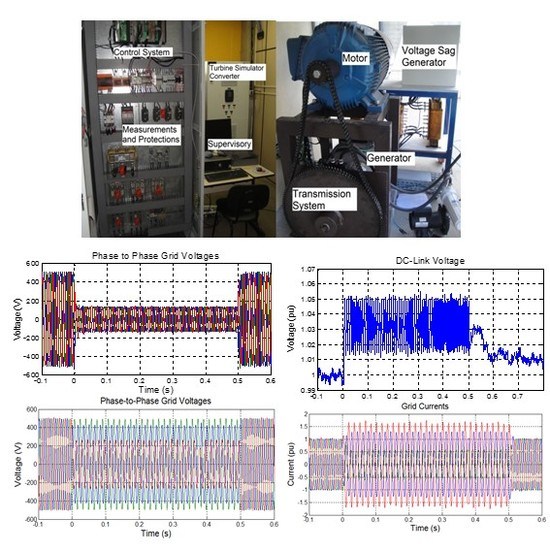
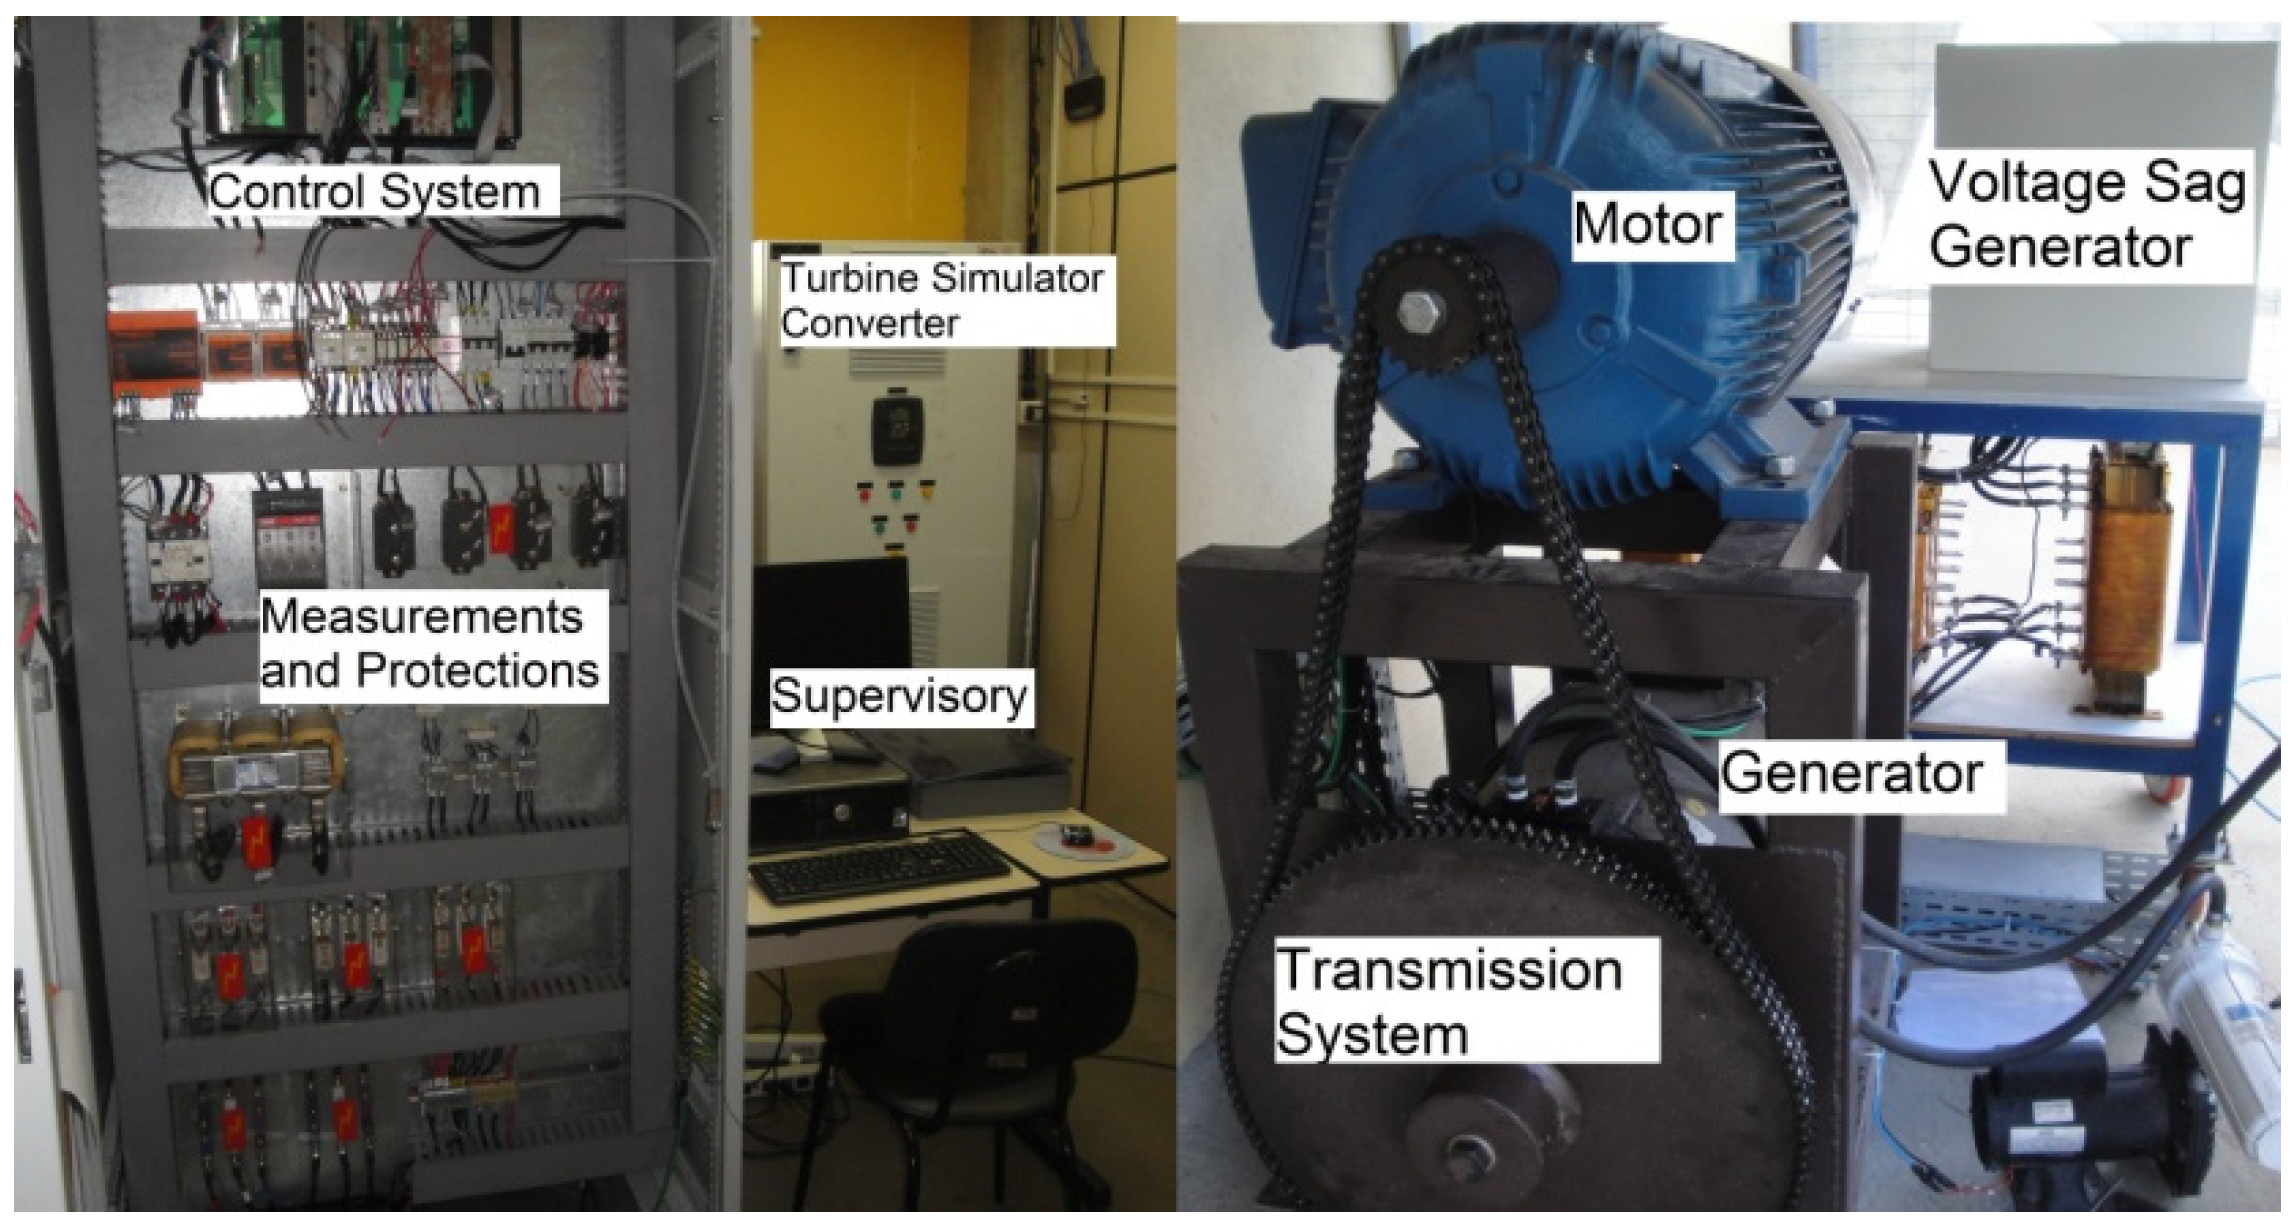
There are several different strategies to control the FC-PMSG wind conversion systems. In this work, the classic control in the positive synchronous reference is employed, with:
  • GSC controlling the DC-link voltage and reactive power flowing to the grid, depicted in Figure 3a;
  • MSC controlling the generator electromagnetic torque and magnetizing current, depicted in Figure 3b.
Figure 3. Control block diagram of the (a) grid side converter (GSC) and (b) machine side converter (MSC). Sliding mode observer: SMO.
Energies 09 00059 g003
The GSC control is oriented using the grid voltage phase angle. The d-axis current is responsible for the active power, thus, it controls the DC-link voltage, and the q-axis current controls the reactive power. Control of reactive power is not addressed in this paper, therefore, the q-axis current reference is kept at zero. Converter synchronization with the grid is attained using the “double decoupled synchronous reference frame phase-locked loop” (DDSRF-PLL) [25]. This PLL decouples the positive and negative sequence components of grid voltages, allowing estimation of the angle with good accuracy, even under unbalanced conditions.
The MSC control is flux oriented in such a way that the q-axis current controls the active power and the d-axis current controls the machine flux (reactive power). The active power reference is set following the maximum power point tracking (MPPT) of the emulated wind turbine. The quadrature current reference is kept at zero for generator speeds below the rated value and at overspeeds an algorithm for flux weakening is employed in order to avoid overvoltages [26]. A sensorless algorithm based on sliding mode observer (SMO) is used to estimate the rotor angle, permitting the control orientation [27].
Through differential Equations (1) and (2), neglecting the cross-coupling terms and the back electromotive force that can be considered as perturbations, the transfer function of the MSC inner (current) control loop is given by:
I s d,q ( s ) V s d ( s ) = 1 L d,q s + R s
Through Equations (3) and (4), considering the turbine torque as a perturbation and assuming that Ld = Lq, the transfer function of the MSC outer (power) control loop yields:
P e ( s ) i s q 2 ( s ) = ( 3 2 P 2 | ψ r | ) 2 1 J s + B
Considering Equations (5) and (6), neglecting the cross-coupling terms and the grid voltage, the transfer function of the GSC inner (current) control loop is:
I g d,q ( s ) V c d ( s ) = 1 L f s + R f
The transfer function of the GSC outer (DC-link) loop, based on the capacitor dynamics, can be given as:
V dc ( s ) I g d ( s ) = 1 C dc s
where Cdc is the DC-link capacitance. Equations (13)–(16) show that all transfer functions are first order, thus, proportional-integral (PI) controllers were employed. The gains of GSC and MSC were tuned using the modulus optimum and symmetrical optimum techniques [28] and the values are presented in the Table A1 in the Appendix. Both converters use a discontinuous PWM method in order to reduce switching losses [29].

2.4. Test Bench

The 34 kW test bench used in this work was designed in such a way that it represents a real 2 MW WECS with the FC-PMSG technology. The control is implemented in a proprietary system which uses a floating point Texas digital signal processor (DSP). All protection and control structures are scaled to the rated conditions, thus, it is possible to compare the results with that expected for the real turbine. Figure 4 depicts the test bench schematic diagram.
An induction motor controlled by a commercial inverter is used to emulate the torque and speed characteristics of the wind turbine. These characteristics are similar to the real 2 MW turbine, but scaled for the 34 kW rated power of the test bench. The connection between “turbine” and generator is made through a transmission chain system.
The generator is connected to a 42 kVA bidirectional converter which is purposely oversized in order to evaluate the RTFC without risks for the IGBTs. An LCL filter with passive damping is used for the grid connection [23]. In the DC-link, a discharge chopper is present for protection against overvoltage. Pictures of the test bench are presented in Figure 5 and the parameters can be found in the Table A2 in the Appendix.
Figure 4. Diagram of the test bench representing a wind energy conversion system (WECS) with full converter PMSG (FC-PMSG) technology.
Energies 09 00059 g004
Figure 5. Pictures of the scaled 34 kW test bench representing a FC-PMSG.
Energies 09 00059 g005
For the experimental tests, two pieces of equipment were used to simulate voltage sags in the test bench: the impedance sag generator (ISG) and the industrial power corruptor (IPC).
For the symmetrical voltage sag tests, the ISG recommended in the standard IEC 61400-21 [30] is used. This device is depicted in Figure 6. When the switch “S” is closed, the currents flowing through Z2 cause a voltage drop in Z1 which represents a voltage sag in the terminals of the system “WT”, calculated as:
sag(%)= Z 2 Z 1 + Z 2 × 100%
Two reactors of 1.2 mH and one of 0.3 mH were designed, permitting testing with different levels of voltage sags. These reactors also present a medium tap which allows different sag magnitude emulations.
Figure 6. Impedance voltage sag generator [30].
Energies 09 00059 g006
The IPC is used for the asymmetrical voltage sag tests. It is a commercial equipment that permits phase-phase and phase-neutral voltage sags with any levels following the standard IEC 61000 [31]. It is also possible to choose the duration and the point in time in the voltage curve when the voltage sag starts.
The tests carried out in the test bench followed the standard IEC 61400-21 [30]. Table 1 shows the magnitude and duration of the voltage sags that are recommended for testing the WECS operating with 20% and 100% of the rated power. In the next sections, some of these tests are presented.
Table 1. Specification of voltage drops recommended in the IEC 61400-21 [30].
CaseVoltage MagnitudePositive Sequence MagnitudeDuration (s)Shape
Three-phase90% ± 5%90%0.5 ± 0.05 Energies 09 00059 i001
Three-phase50% ± 5%50%0.5 ± 0.05 Energies 09 00059 i001
Three-phase20% ± 5%20%0.2 ± 0.05 Energies 09 00059 i001
Two-phase90% ± 5%95%0.5 ± 0.05 Energies 09 00059 i001
Two-phase50% ± 5%75%0.5 ± 0.05 Energies 09 00059 i001
Two-phase20% ± 5%60%0.2 ± 0.05 Energies 09 00059 i001

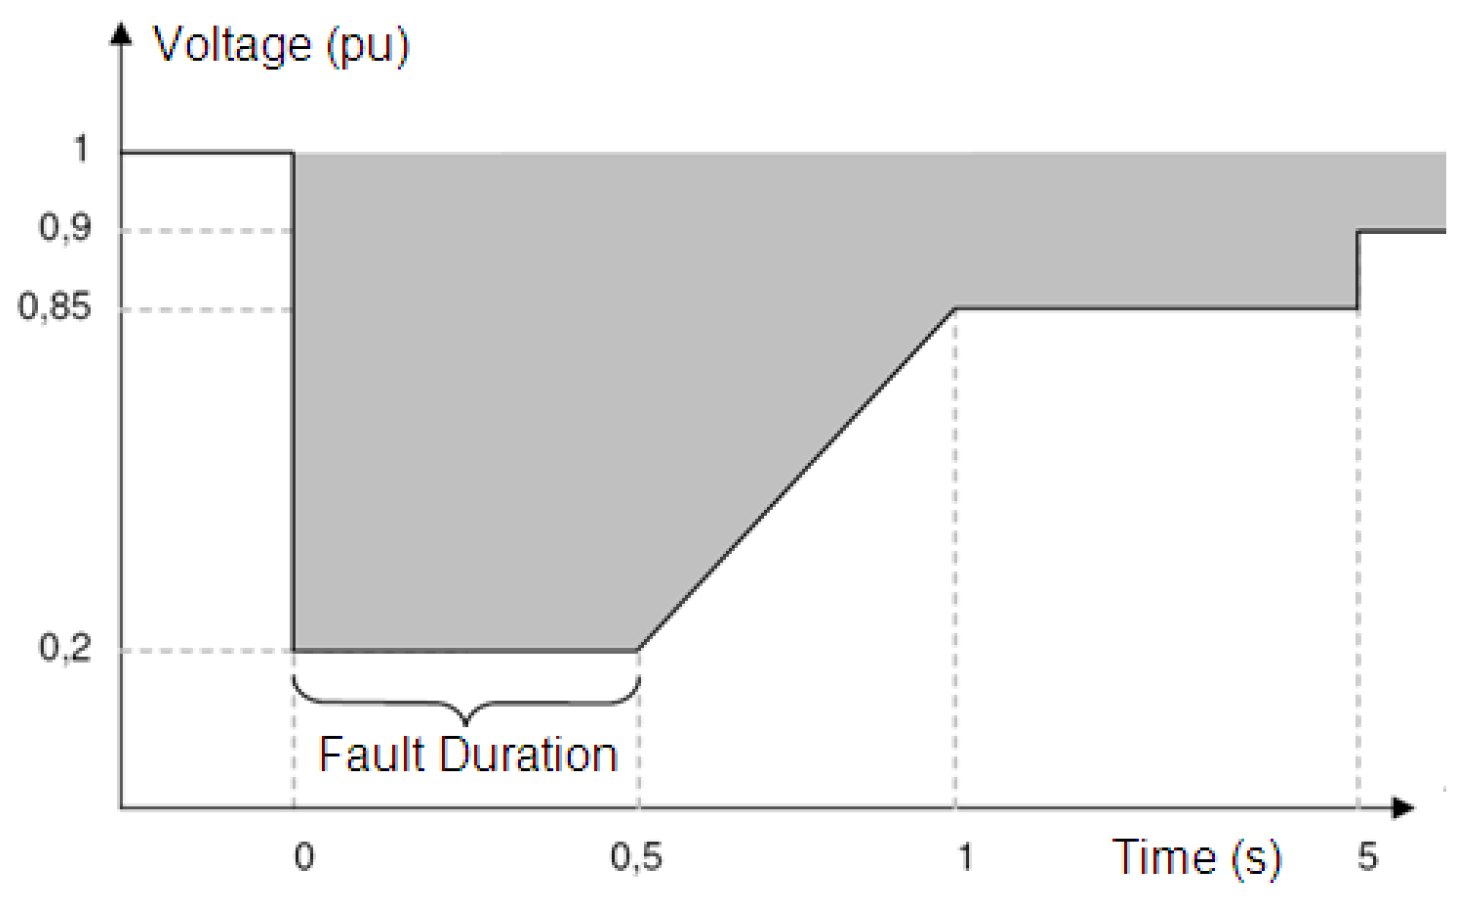
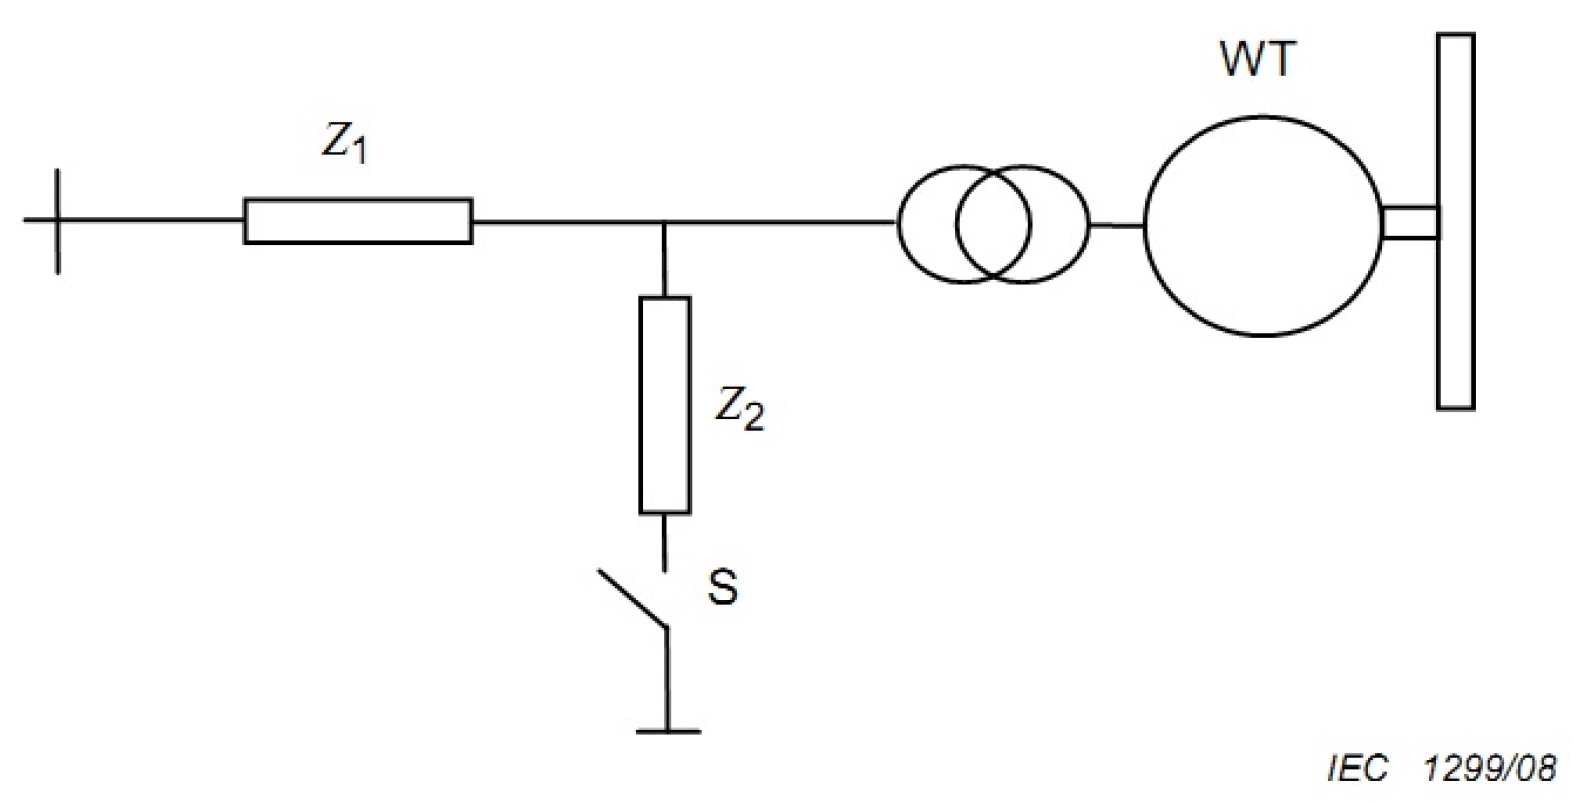
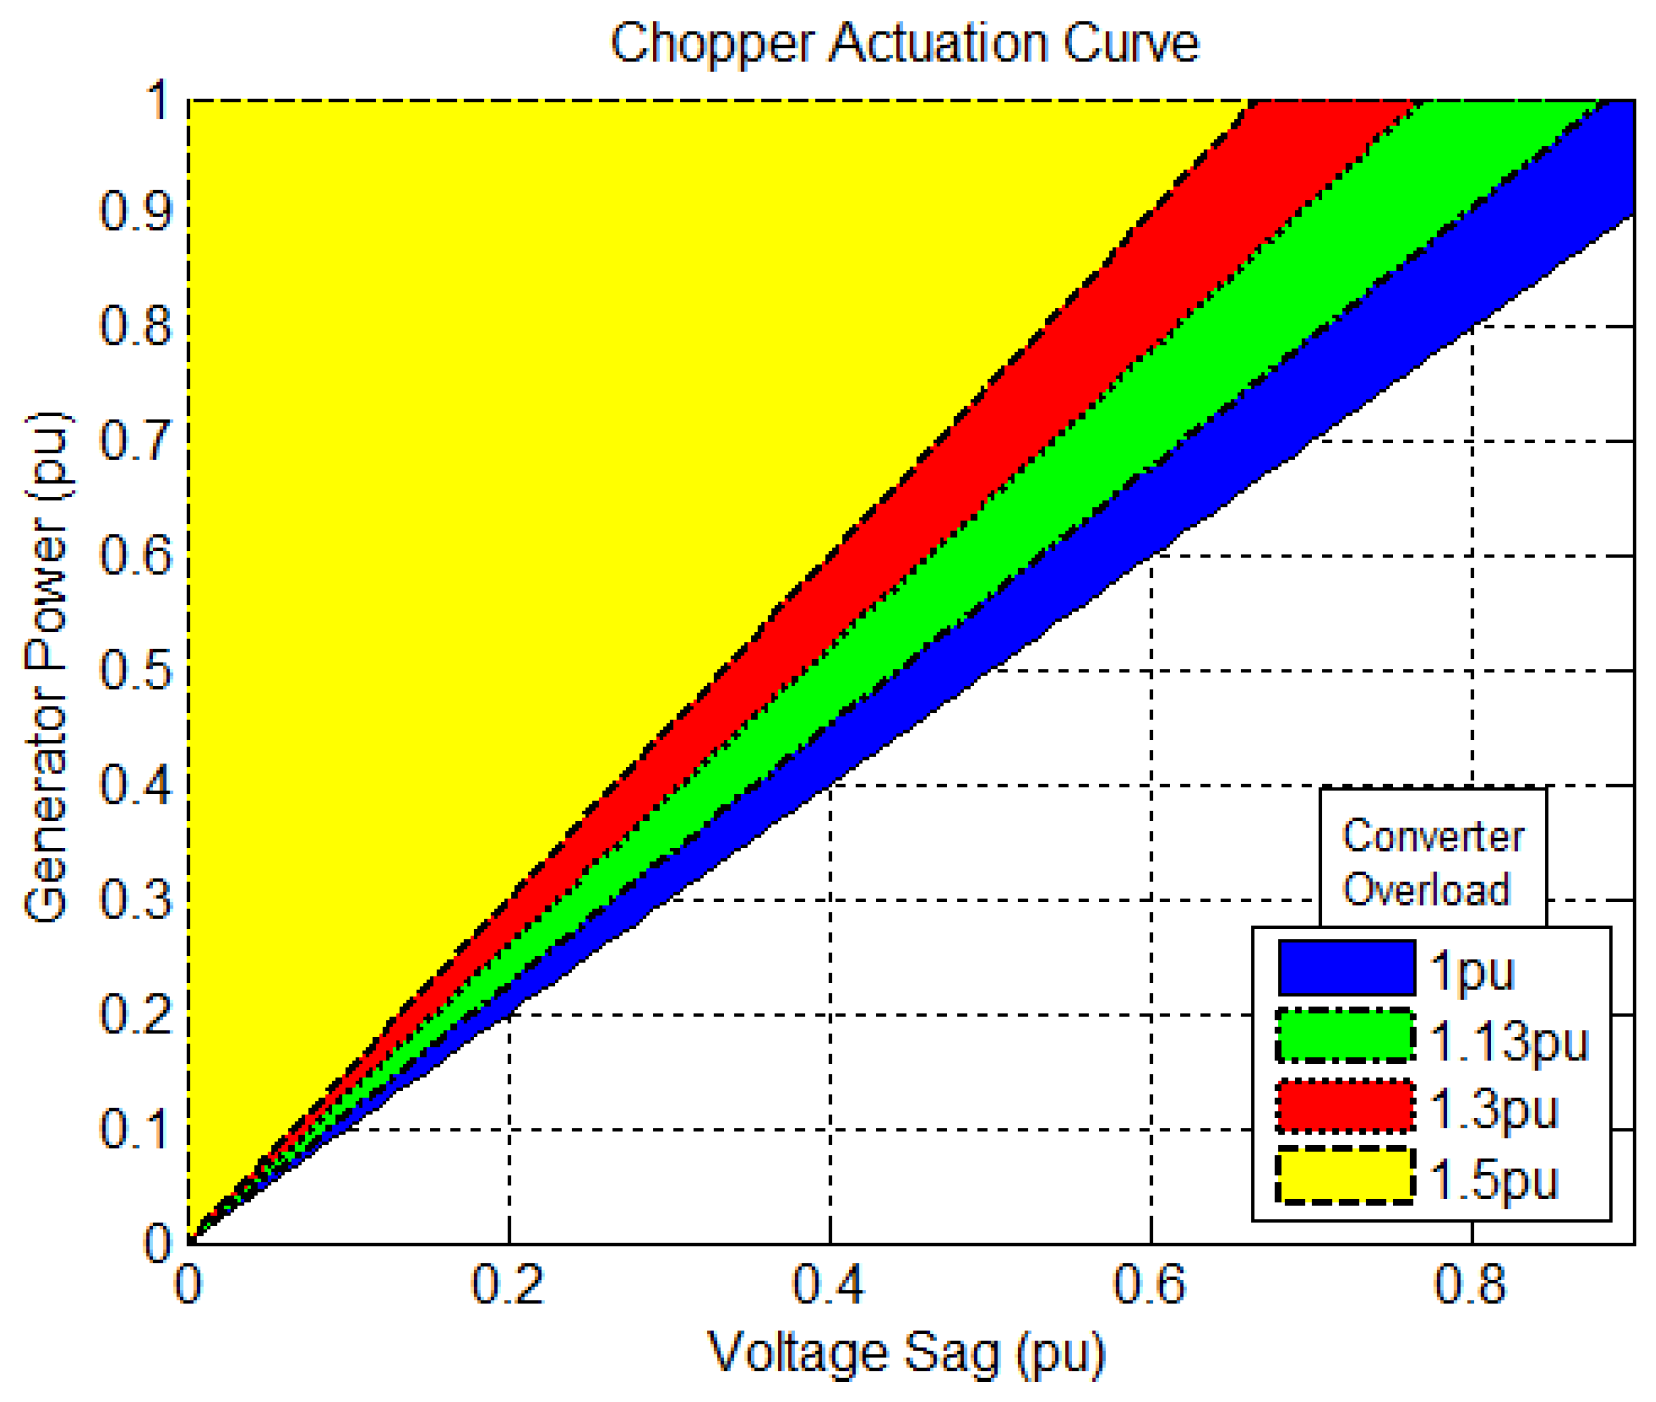
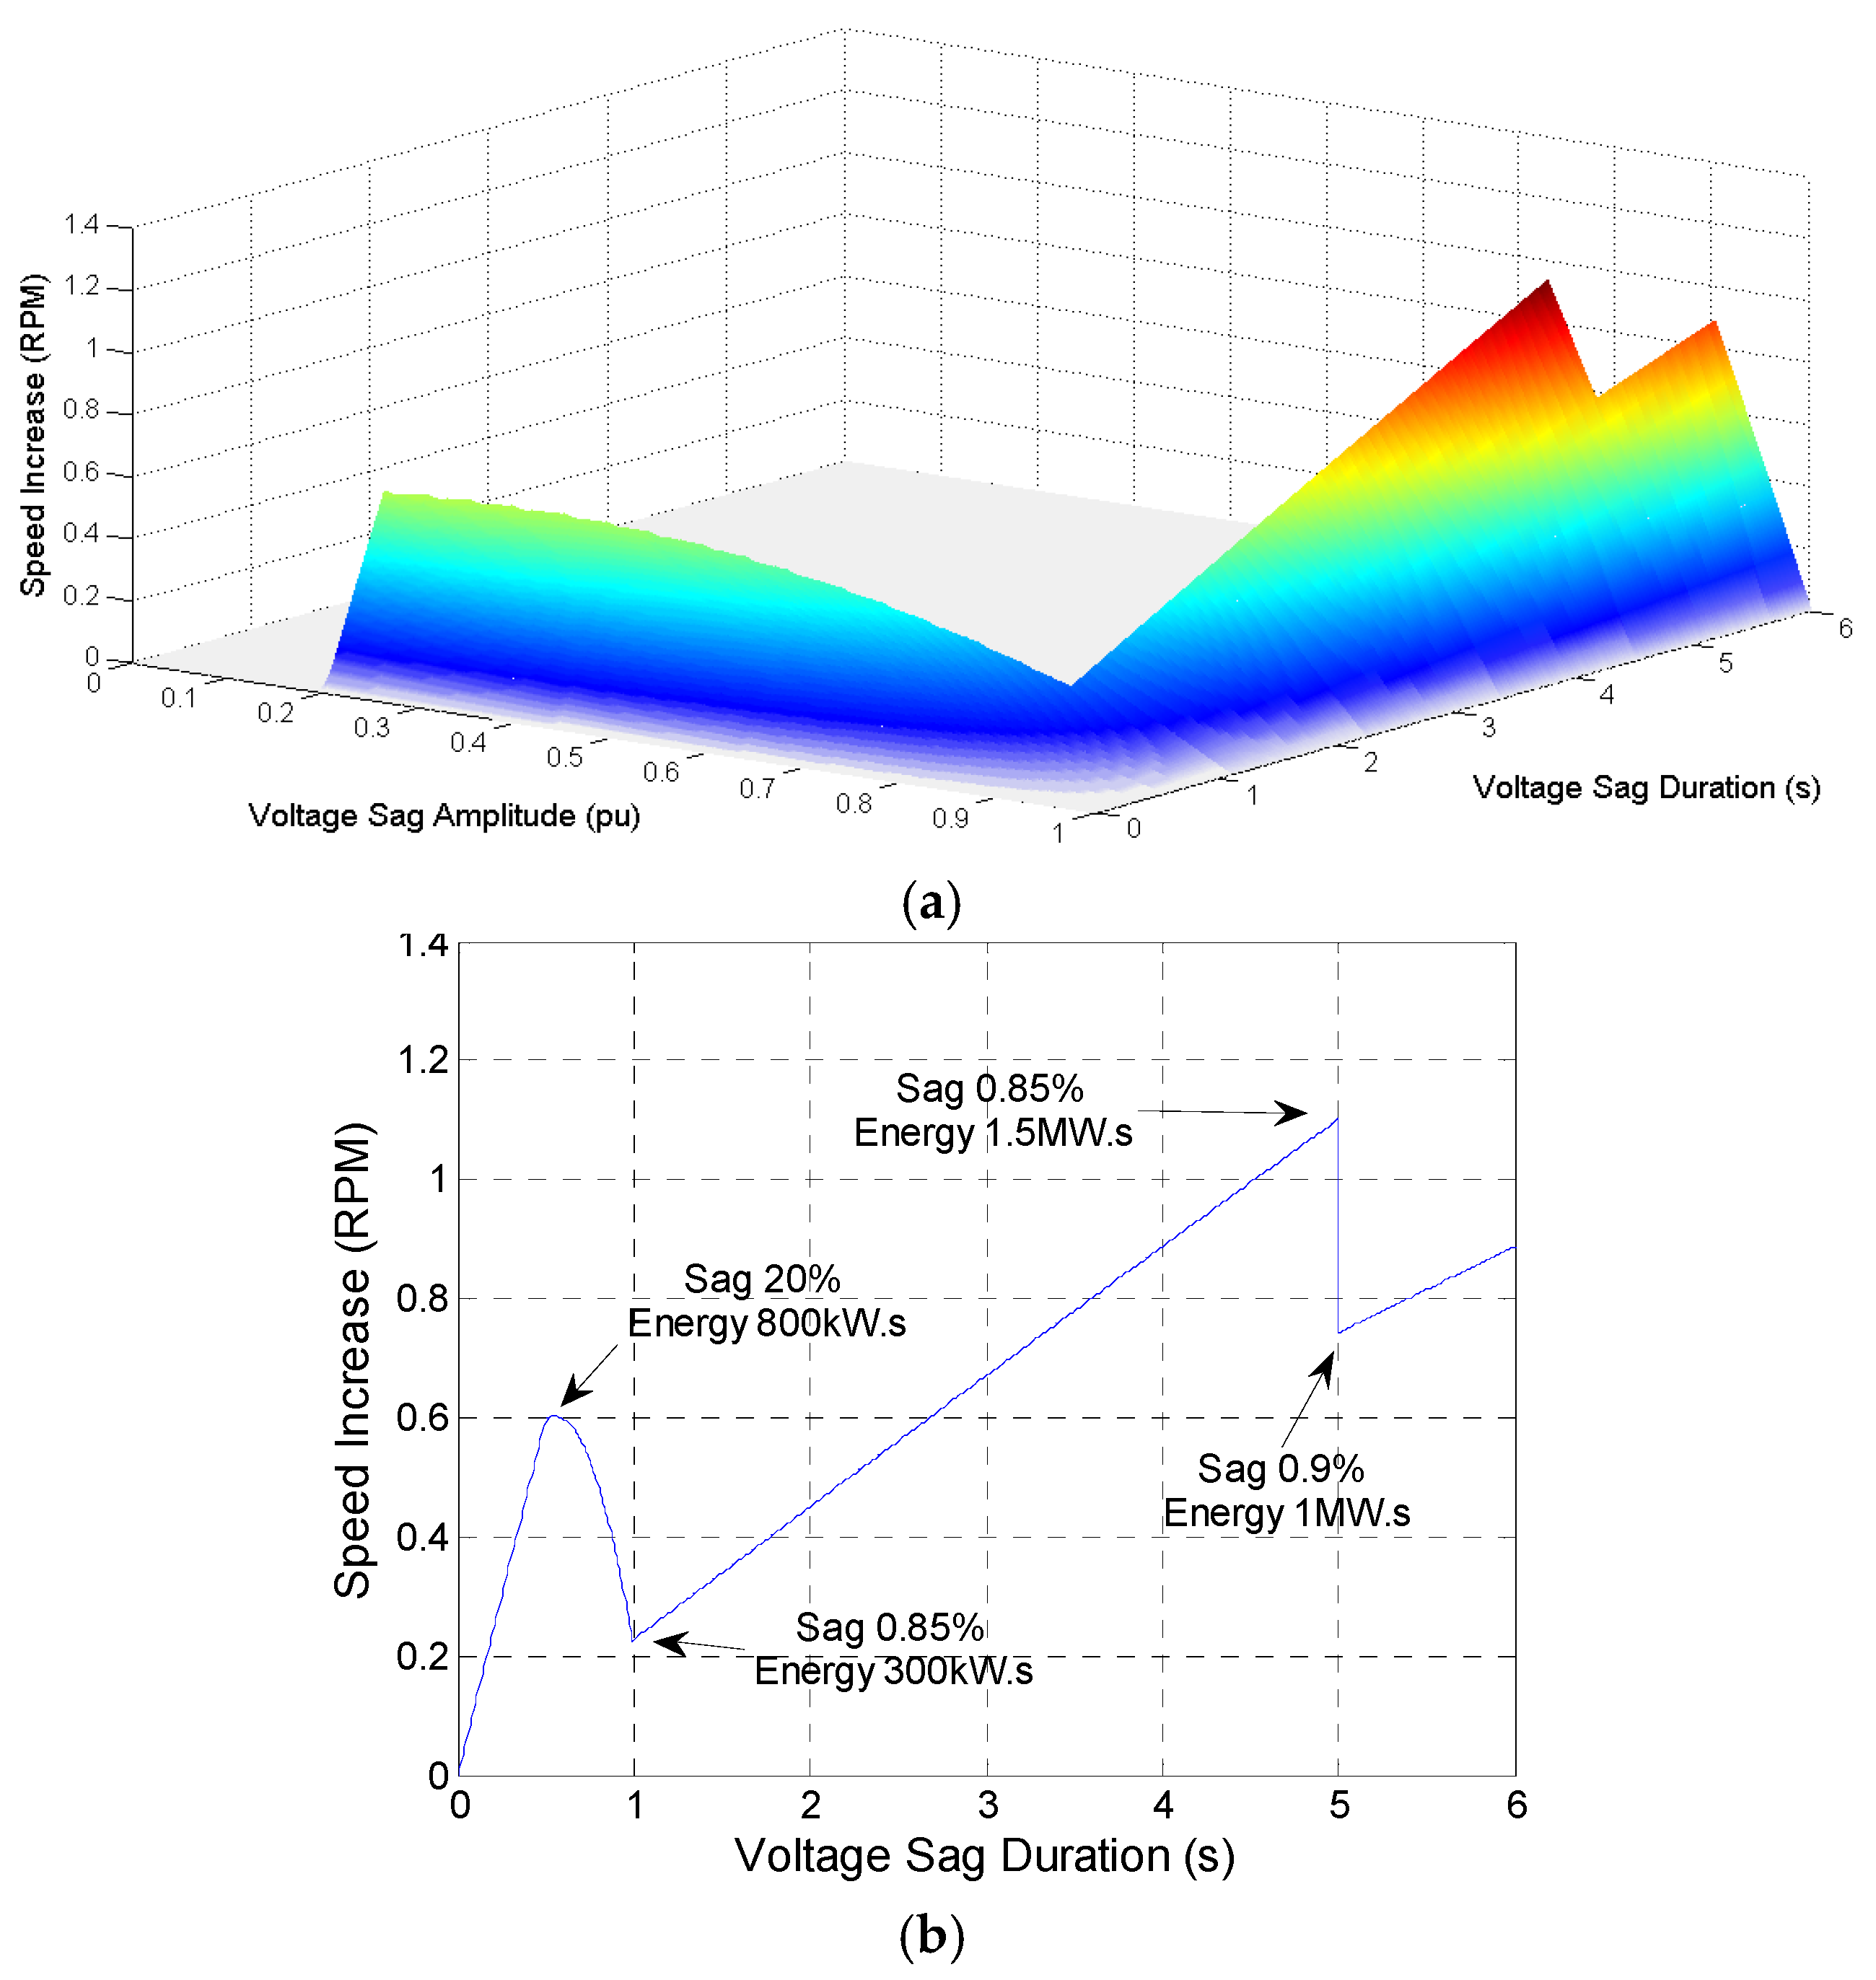
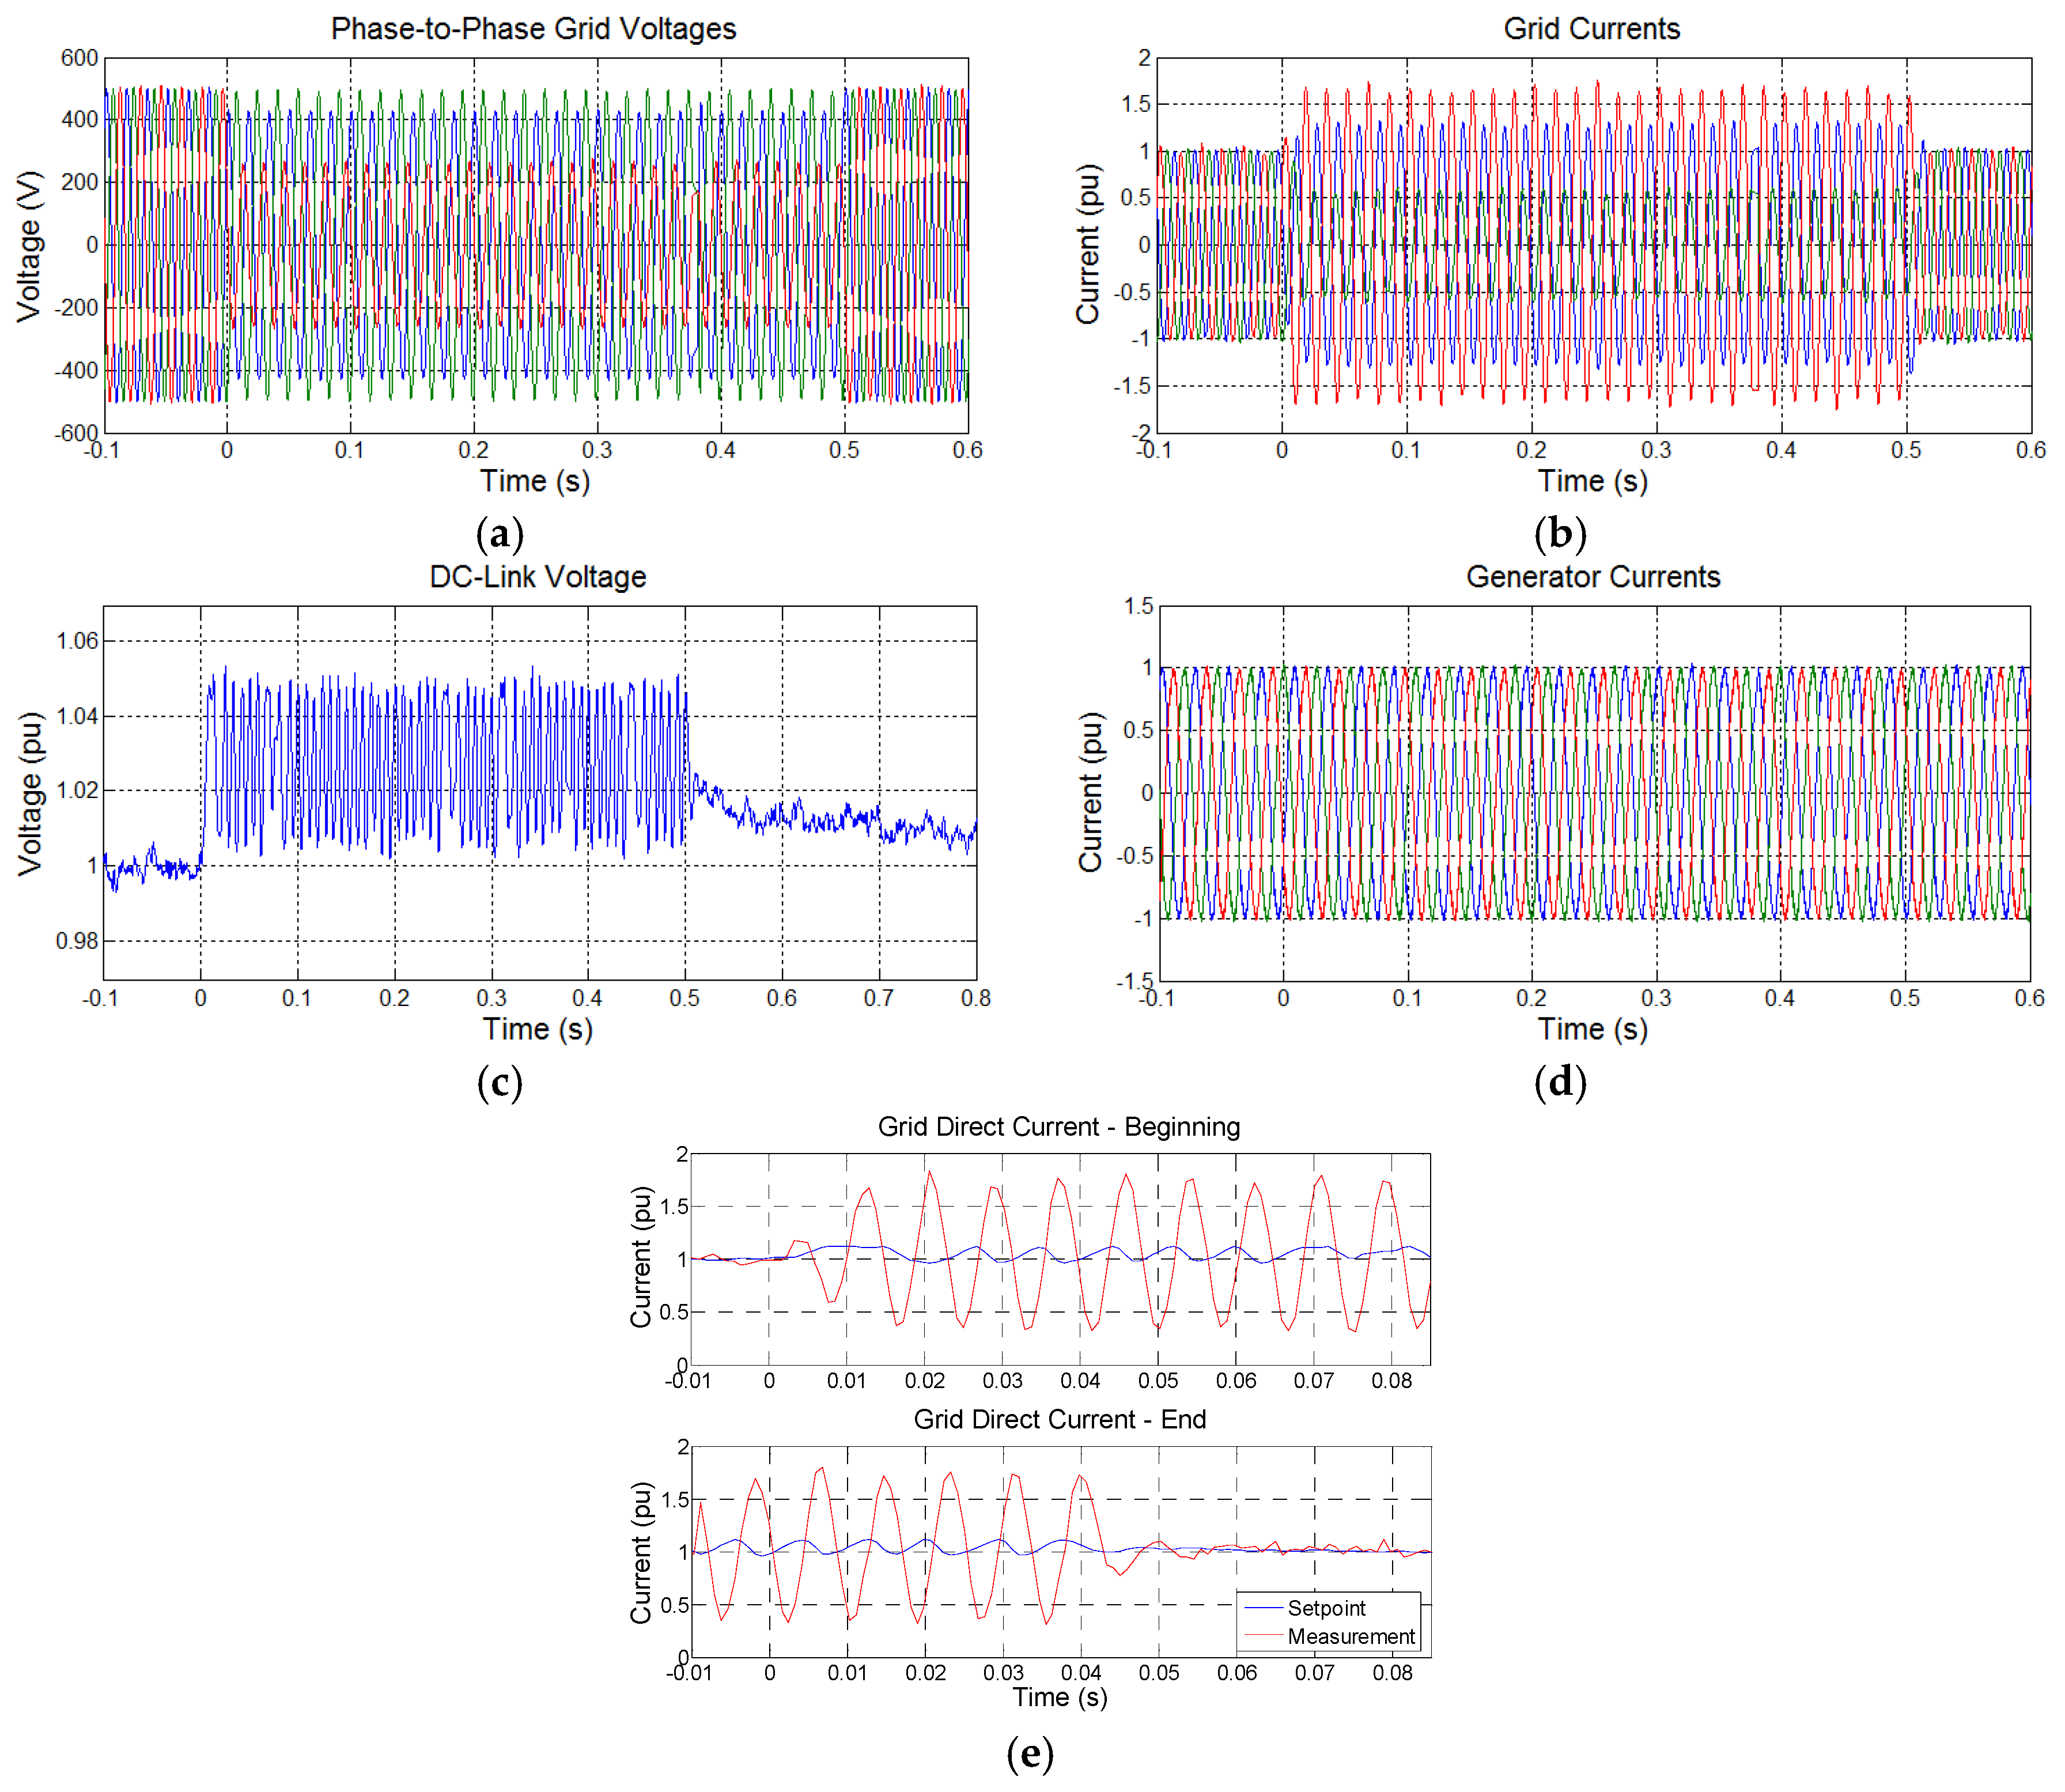
3. Symmetrical Voltage Sags

3.1. Experimental Results

In this section, the results of three-phase voltage sag using the classical control structure with braking resistors are presented. The ISG is used to emulate a three-phase voltage sag with 25% remaining voltage, as shown in Figure 7a.
Figure 7. Experimental results for 25% three-phase voltage sag with the system operating with 20% of rated power: (a) grid voltages; (b) grid currents; (c) DC-link voltage; and (d) generator currents.
Energies 09 00059 g007
Figure 7b depicts the grid currents during the voltage sag while the system is operating with 20% of the rated power. The currents in pu have as base value the rated peak current. It is seen an increase in the grid currents, because as the voltage drops, during a short time the power supplied to the grid decreases. Once the generator power control reference is only dependent on the machine speed (MPPT algorithm), it is, a priori, not modified during grid disturbances, and the amount of power delivered by the machine remains unchanged. The unbalance between the energy delivered to the DC-link by the MSC and the energy extracted from it by the GSC produces an increase of the DC-link voltage, as depicted in Figure 7c. The control then acts in order to reestablish the correct power transfer to the grid, increasing the currents and thus reducing the DC-link voltage back to its reference value. In this case, one can see in Figure 7c that the chopper actuates for a short time and, after the control is capable of keeping the voltage controlled.
The increase of the grid currents can be explained by the active power equation. According to Equation (7), considering the q-axis voltage null (voltage angle orientation), in order to maintain the power at 20%, it is necessary to increase the currents to approximately 0.8 pu (0.2/0.25). This value is not sufficient to saturate the control of the GSC whose limit is 1 pu.
Figure 7d shows the currents at the generator side, which is not affected by the voltage sag. The DC-link decouples the grid and the generator, representing an important advantage of this technology. It is important to mention that in the generator side the current is higher than 0.2 pu, value seen in the grid side. In this case, this current is approximately 0.33 pu, because the generator voltage is variable with the speed. For the system operating with 20% power, the speed is 90 rpm, i.e., 60% of the rated speed (150 rpm). As the voltage is proportional to the speed, the voltage is also 60% of the rated value. Therefore, in order to generate 20% power, the generator stator carries 0.33 pu of current (0.33 × 0.6 ≈ 0.2 pu).
Increasing the generated power at 100% for a similar voltage sag (Figure 8a), Figure 8b shows that the grid currents are slightly affected during the voltage sag, because the GSC control limits the current in 1 pu. The generator currents (Figure 8d), and consequently the power, are not affected. The surplus 0.75 pu of power, that is not supplied to the grid, is dissipated in the braking resistor in order to avoid the excessive increasing of the DC-link voltage. Figure 8c depicts this voltage, demonstrating the chopper actuation for voltages greater than 1.05 pu and turning off for voltages below 1.02 pu.
Figure 8. Experimental results for 25% three-phase voltage sag with the system operating with 100% rated power: (a) grid voltages; (b) grid currents; (c) DC-link voltage; and (d) generator currents.
Energies 09 00059 g008

3.2. Results Discussion

The experimental results for the symmetrical voltage sags show that the capability of the system to ride-through the event lies in the chopper capability of dissipating the power not supplied to the grid. This is the traditional LVRT strategy employed in FC-PMSG WECS.
In the test bench, where the current control limit was set to 1 pu, the chopper must be dimensioned to dissipate the surplus energy in order to attend the RTFC curve, depicted in Figure 1. A resistor to dissipate such power on a real 2 MW system may be very big and expensive. Actually, the 2 MW WECS emulated by the test bench has a current overload limit of 13% above the rated value during 15 s, thus the chopper can be smaller.
Based on Equation (7) and considering different overload capabilities for the converter, the colored area in Figure 9 shows the power and voltage depth conditions when the chopper is required to actuate. This curve in conjunction with the RTFC curves required by the grid codes can be used for the braking chopper dimensioning. For example, if the converter overload capability is 1.5 pu, considering the RTFC curve of Figure 1, in the worst situation (20% voltage sag, duration 0.5 s), the chopper will actuate for the system operating with active power above 0.3 pu (Figure 9). In this situation, the chopper must be dimensioned for 0.7 pu of power dissipation during 0.5 s, ensuring the system ride-through for all power levels.
Optimization of the costs involved in increasing the converter current limits and the chopper power should be pursued by design engineers, including the costs related to technical issues, e.g., resistor cooling.
Figure 9. Chopper actuation limits during balanced voltage sags according to the converter current limits.
Energies 09 00059 g009

3.3. Analysis of the Low Voltage Ride-Through Capability Control Strategies Proposed in the Literature

The use of discharge resistors to improve the RTFC of WECS is not the best choice mainly because of its costs. Therefore, some control solutions are proposed in the literature to avoid the braking resistor or reduce its use [15,16,17,18,19,20].
As discussed in the introduction, Yang et al. [15] proposes the decrease of the torque, while [16,17,18,19,20] use the MSC to control the DC-link voltage, whereas the GSC controls the generated power. In both solutions, the surplus energy, in spite of being dissipated in the braking resistor, is stored as kinetic energy in the turbine:
t 0 t f P G d t = 1 2 J ( ω f 2 ω 0 2 )
where ω0 is the speed in the sag beginning (instant t0) and ωf is the speed when the voltage is recovered (instant tf). For the 2 MW turbine under consideration, the rated speed range is 15 rpm and the inertia is 7.985 × 10⁶ Kg·m2 (generator + turbine). The worst situation is when the system is operating with rated power, i.e., rotational speed 15 rpm and the voltage sag occurs. Using Equation (18), the speed increase is plotted as a function of the voltage sag depth and duration, as presented in Figure 10a. This graph was plotted considering the conditions that the WECS must sustain operating according to the Brazilian RTFC curve (Figure 1). Figure 10b shows the worst conditions, i.e., maximum voltage sag depth and duration. This figure also indicates the total surplus energy during the voltage sag. It is important to mention that this curve does not consider the power decrease due to the speed increasing (operation below the maximum power); thus, this scenario is slightly worse than the real one.
Figure 10b shows that for a 20% voltage sag lasting for 500 ms, the surplus energy is 800 kW·s (2 MW × 0.8 pu × 0.5 s), thus, the variation of speed is 0.59 rpm, i.e., the generator will operate at approximately 4% above the rated speed. This is not the worst situation of speed increasing, since 1.1 rpm variation is seen for the 85% voltage sag, because it can last longer. In fact, Figure 1 shows that the system must sustain constant operation for 90% of the rated voltage, thus, the speed could become even higher. However, most of the converters used in WECS can support some level of long term current overload, permitting the supply of the surplus energy to the grid even under 90% of the rated voltage. For the studied system, this overload is 13% during 50 s, as mentioned previously.
Figure 10. Speed increase for different voltage sags, considering the Brazilian RTFC curve and the 2 MW WECS: (a) speed as a function of voltage sag amplitude and duration and (b) maximum speed considering the worst conditions (maximum sag depth and duration).
Energies 09 00059 g010
One can notice from Figure 10 that the speed increase is not so high, because the turbine inertia is large. Furthermore, a wind turbine speed increase around 10% is allowed during transients [32]. Therefore, the storing of energy as kinetic energy is preferable to using the braking resistor, because of the high amount of energy involved (surplus energy indicated in Figure 10b). Nevertheless, in order to maintain acceptable speed, the control must act fast to rapidly decrease power, which can cause mechanical stress. If the power is decreased rapidly, an abrupt torque change may be mechanically unacceptable. On the other hand, if the power is decreased slowly, the DC-link voltage will increase and the braking resistor must actuate.
The pitch control can be an alternative to diminish the speed increase, as proposed in [15,16,17]. This control is only effective for relatively long voltage sags, because its actuation is not so fast. In the multi-megawatt range WECS, the rate of the pitch change is normally around 5 °/s.
These control modifications were not implemented for now in the test bench, as the focus of this work was on the electrical part. The analysis of the mechanical stress involved is outside the scope of the present study. Nevertheless, the results point out that a balance is necessary between all strategies to improve the RTFC, attending the grid codes. The generated power should be reduced, associated with the pitch control to limit partially the speed, the use of the braking chopper to dissipate part of the surplus energy, and also a small increase in the GSC power limits should be considered.

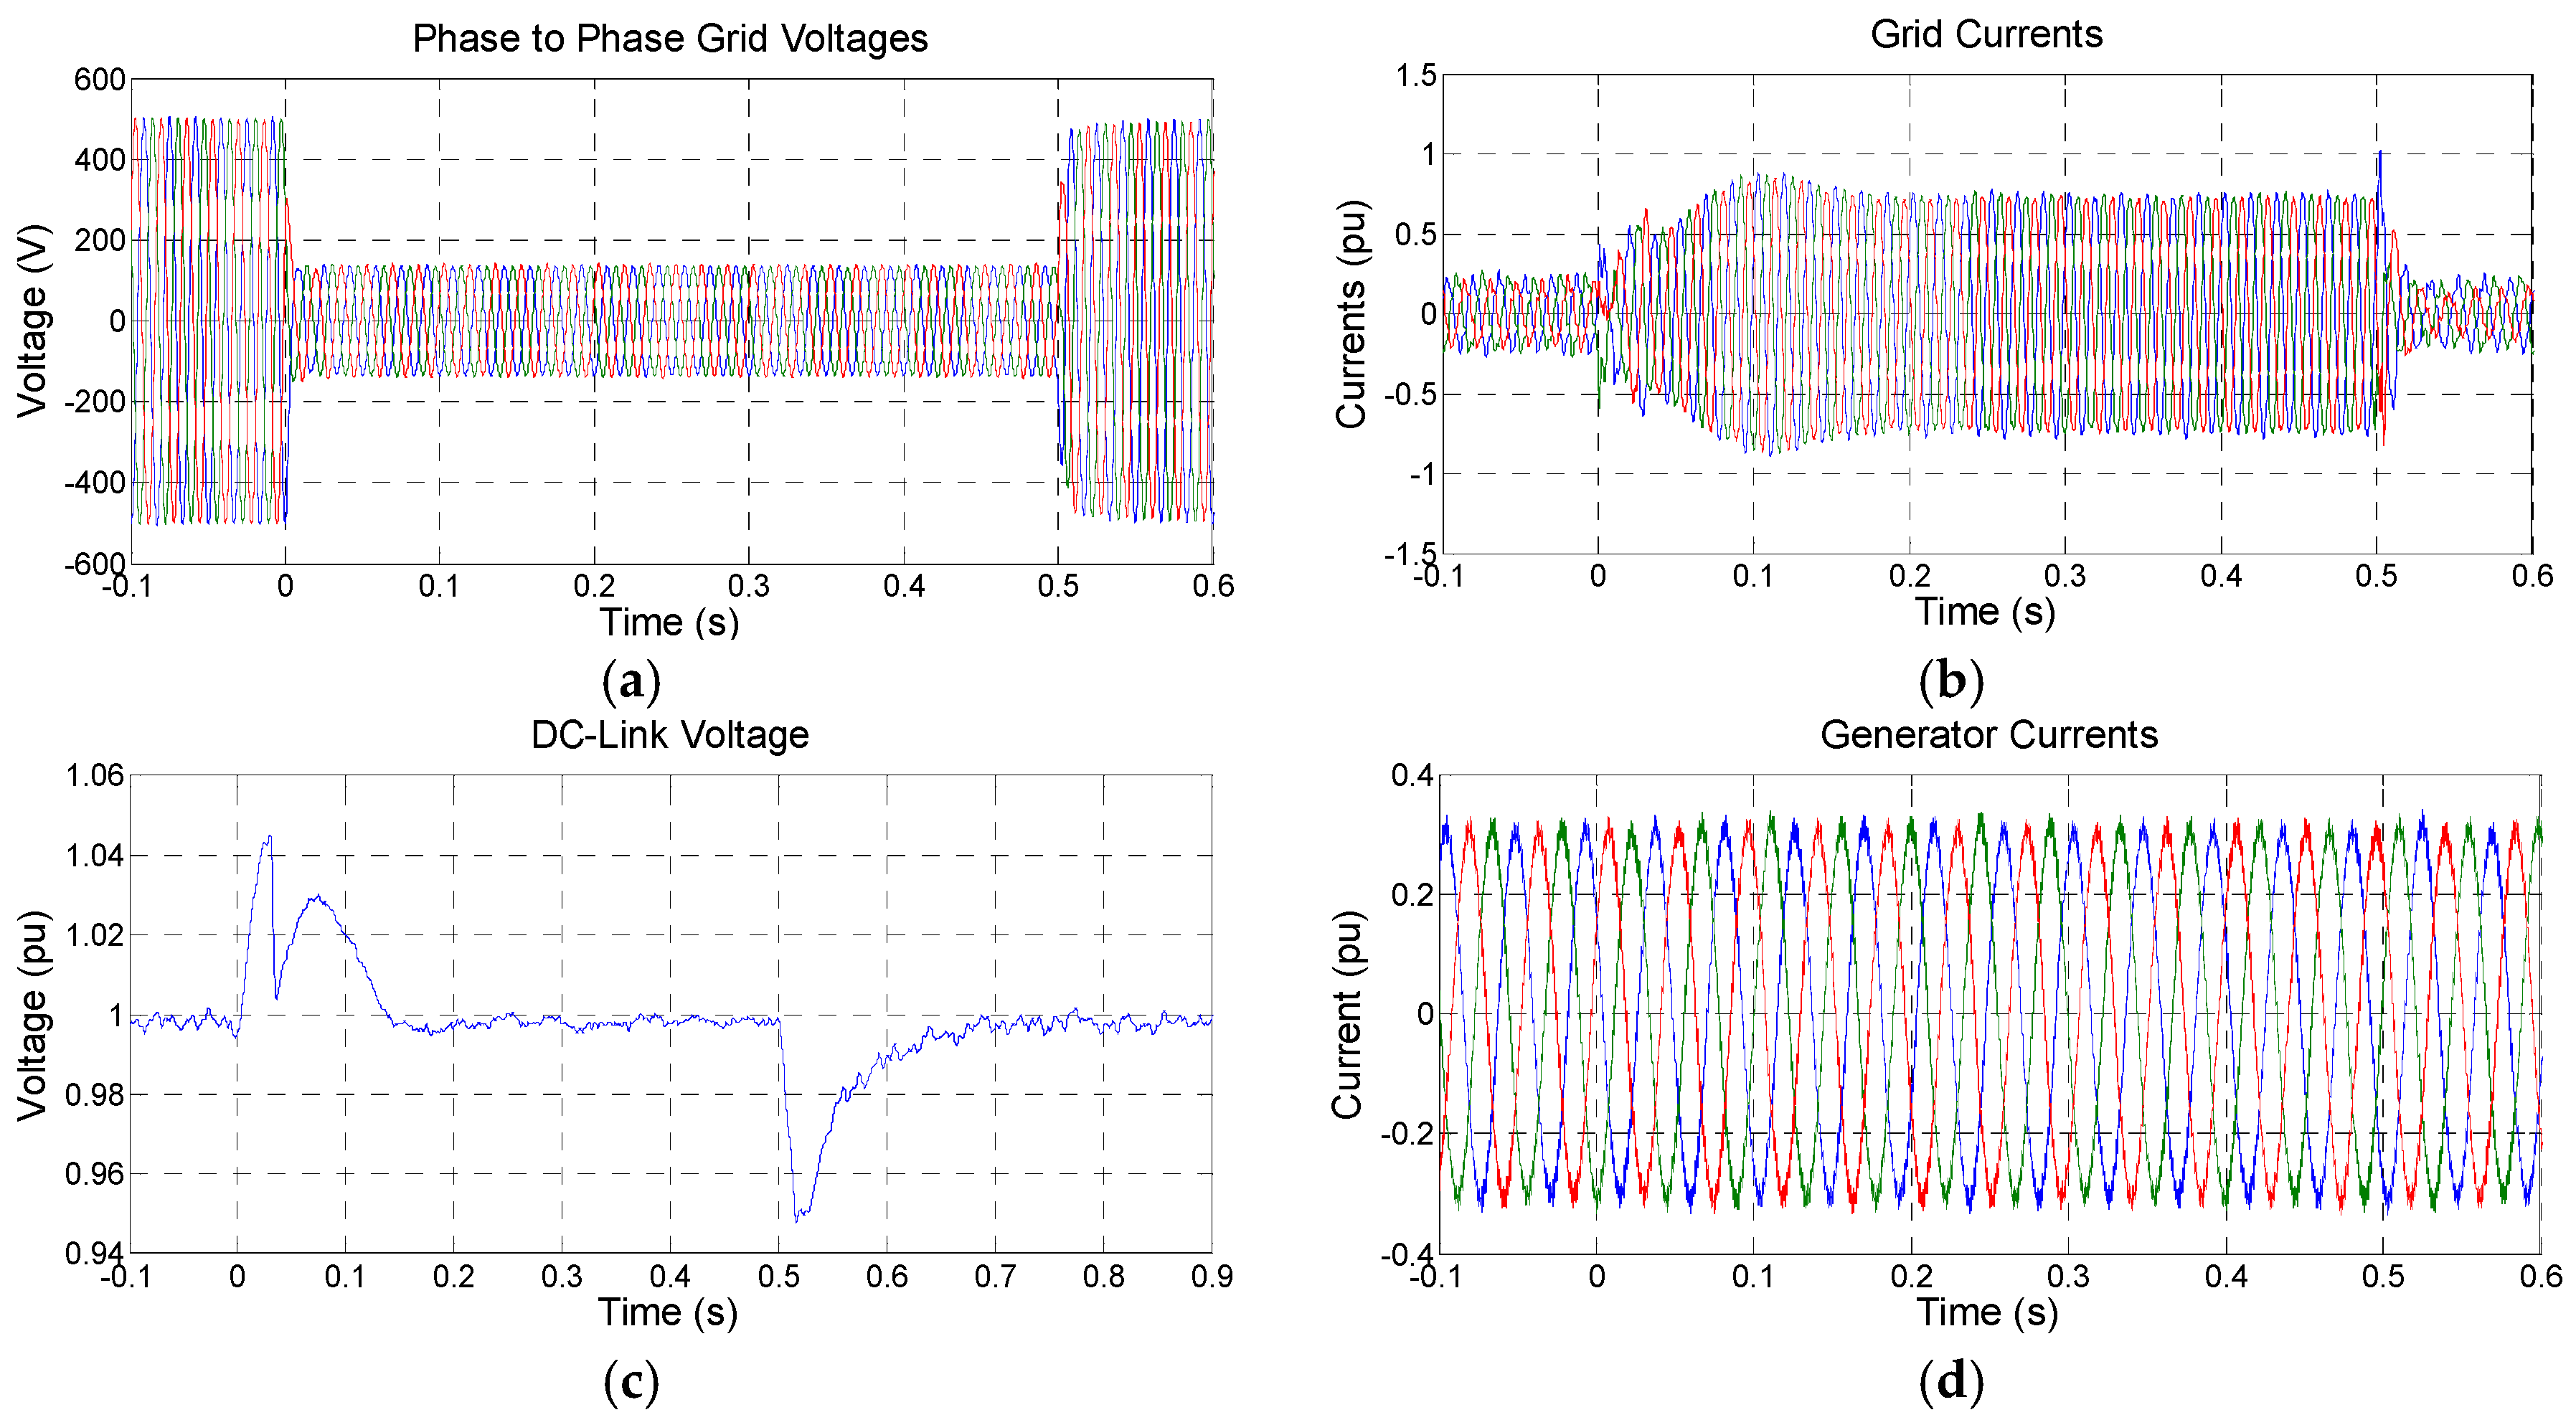
4. Asymmetric Voltage Sags

4.1. Experimental Results

The results of a 50% phase-to-phase voltage sag with the classical control are presented in Figure 11. The experimental results were obtained with the system operating at rated power. Figure 11a shows the grid voltage.
Figure 11. Experimental results for 50% phase-to-phase voltage sag with the system operating at 100% of rated power: (a) grid voltage; (b) grid currents; (c) DC-link voltage; (d) generator currents; and (e) direct grid current (sag beginning and recovery instants).
Energies 09 00059 g011
Figure 11b depicts the grid currents, showing that the current peak values exceed the control limit, set in 1 pu, and the currents are unbalanced. Since the converter is oversized, the GSC of the test bench can support the overcurrent level, but in the real system these values would be unacceptable.
The high currents take place because the classic control is implemented in the positive reference frame and during unbalanced voltage conditions, uncontrolled negative sequence components of grid currents arise. Figure 11e presents the d-axis grid current, highlighting two points of time: at the beginning of sag and voltage recovery. One can notice that the negative sequence components of currents appear as 120 Hz oscillations (twice grid frequency) at the positive sequence synchronous reference frame (Equation (9)). These oscillations are not controlled, because PI controllers have narrow bandwidth, being unable to mitigate the negative sequence of currents. In order to deal with this issue, the use of a resonant control is proposed in the next section.
During asymmetrical voltage sags, the GSC capability of supplying active power to the grid also decreases. Therefore, the surplus energy is also stored in the DC-link if no strategies are employed in the MSC. Figure 11c shows the DC-link voltage increase and the braking resistors’ actuation. Figure 11d depicts the generator currents that are not affected for asymmetric voltage sags.

4.2. Results Discussion and Low Voltage Ride-through Capability Control Strategies Proposed in the Literature
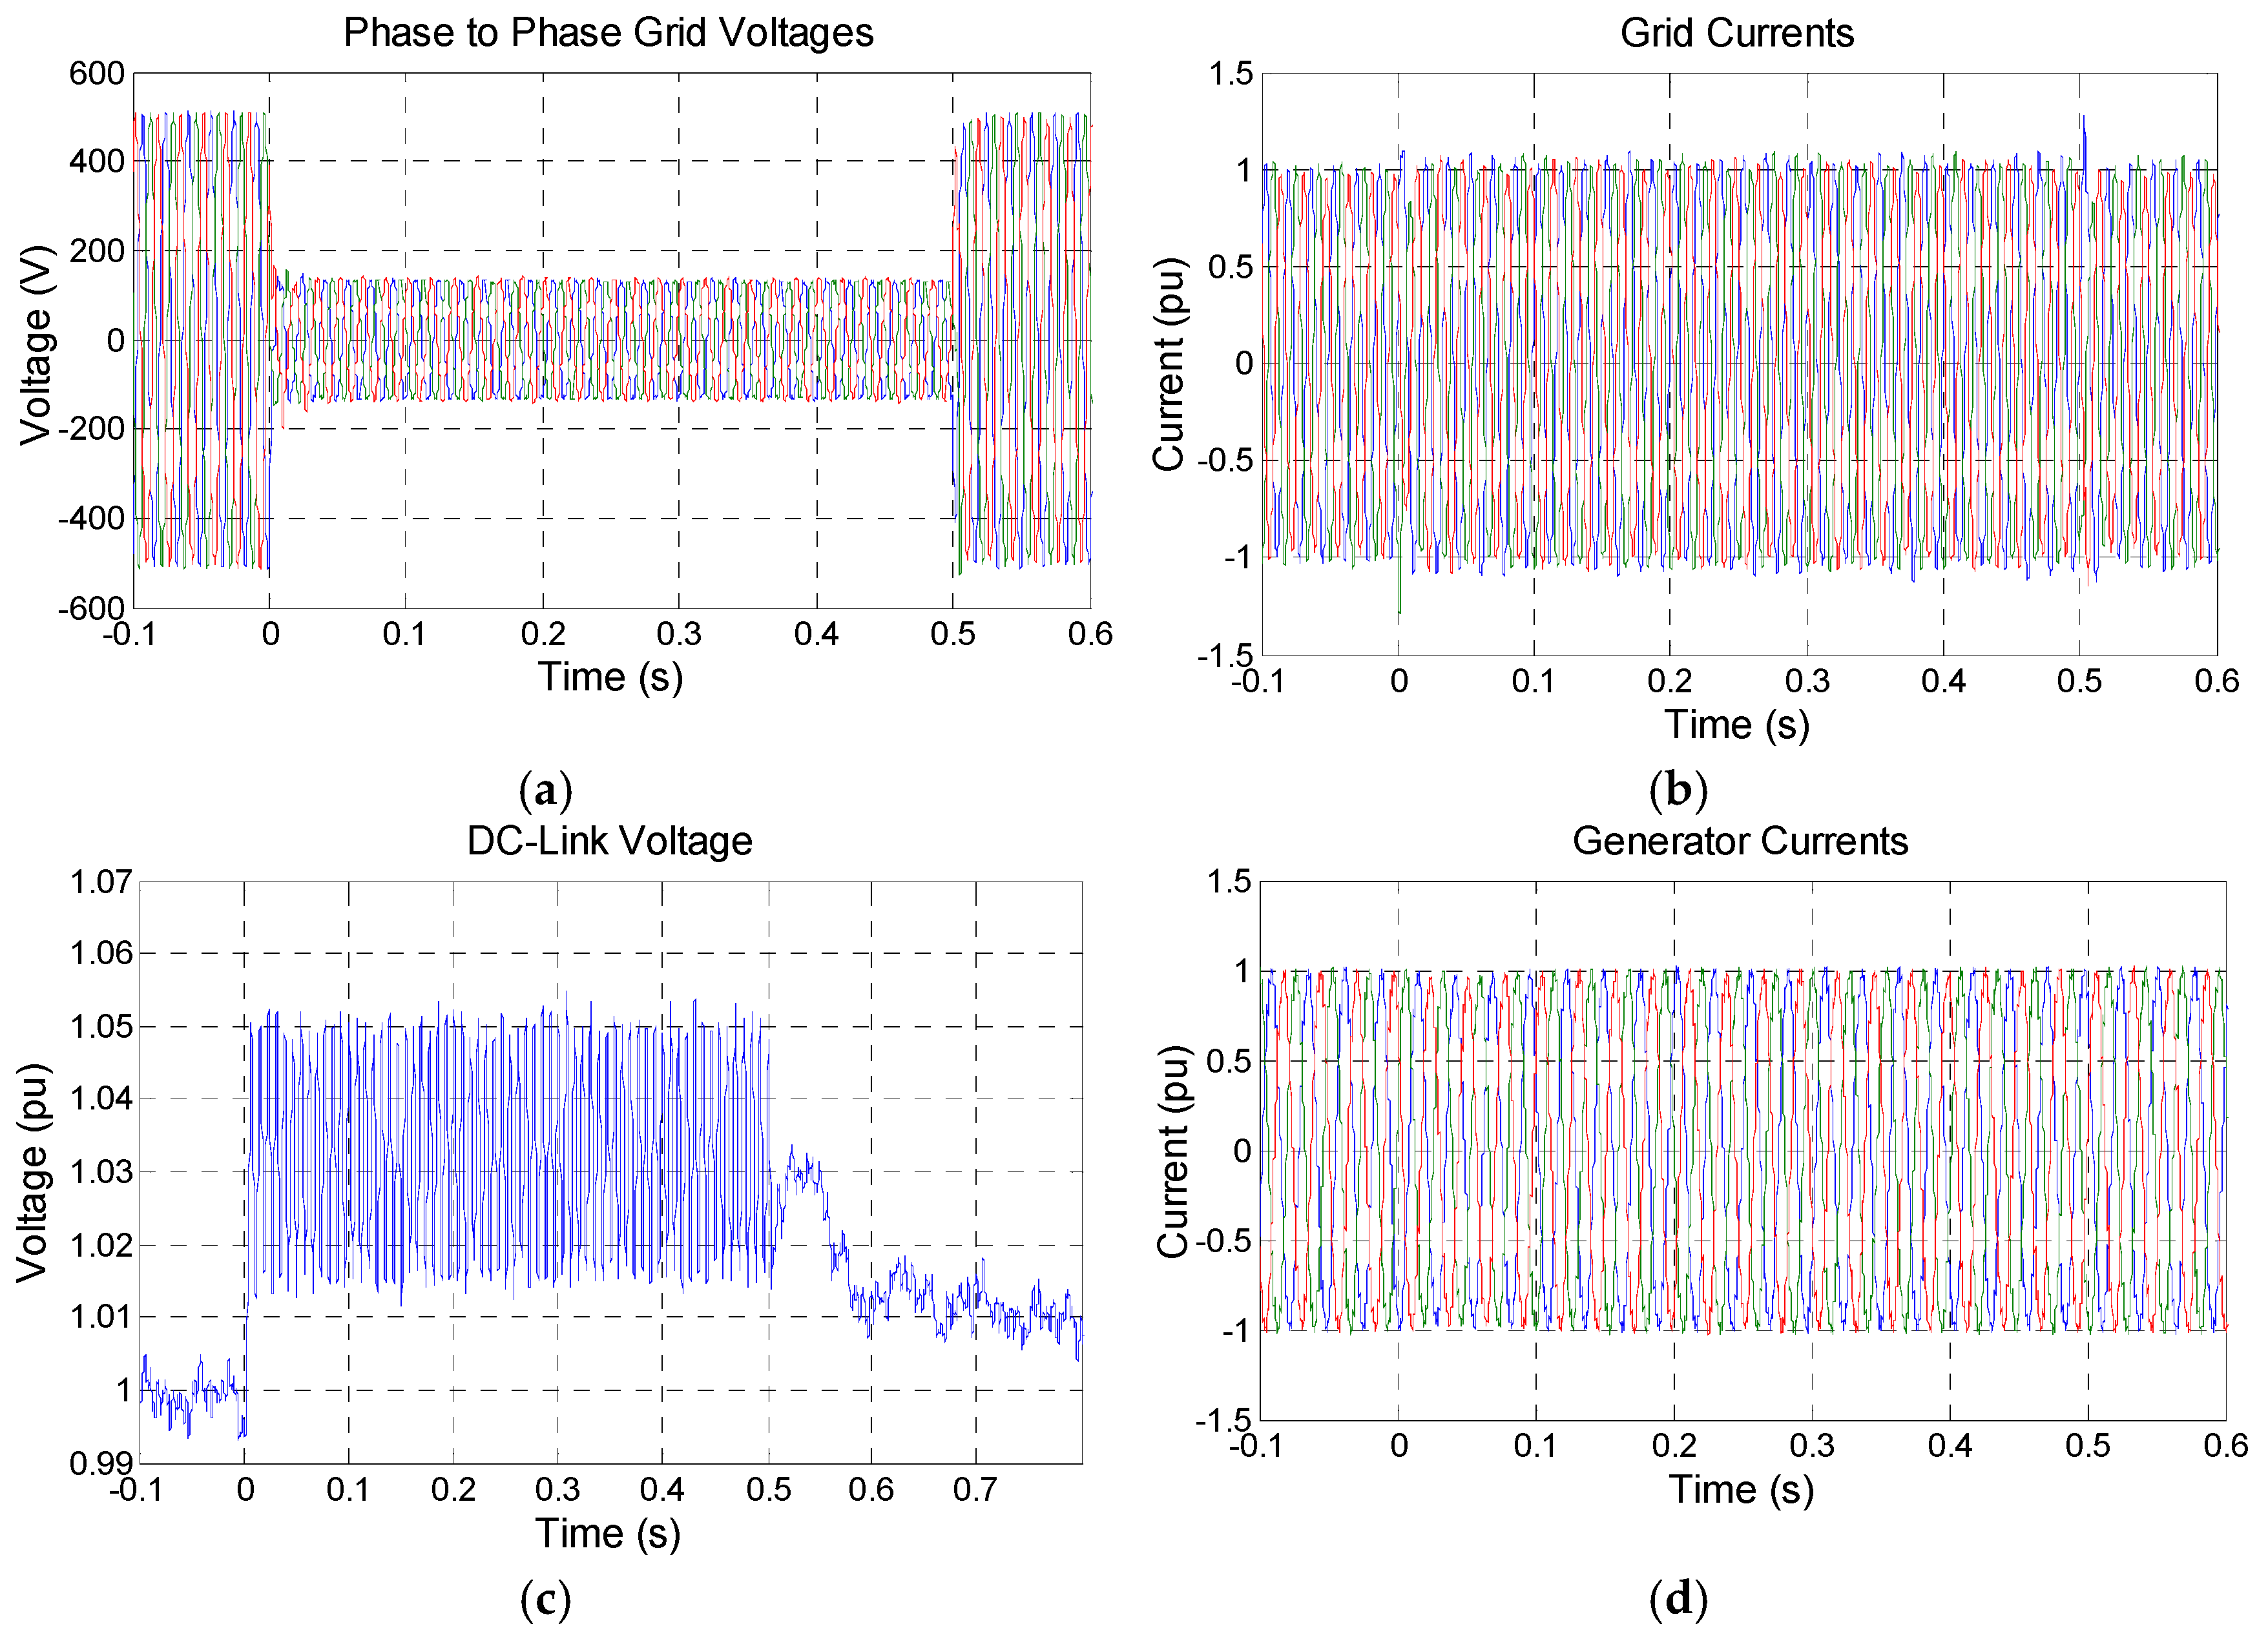
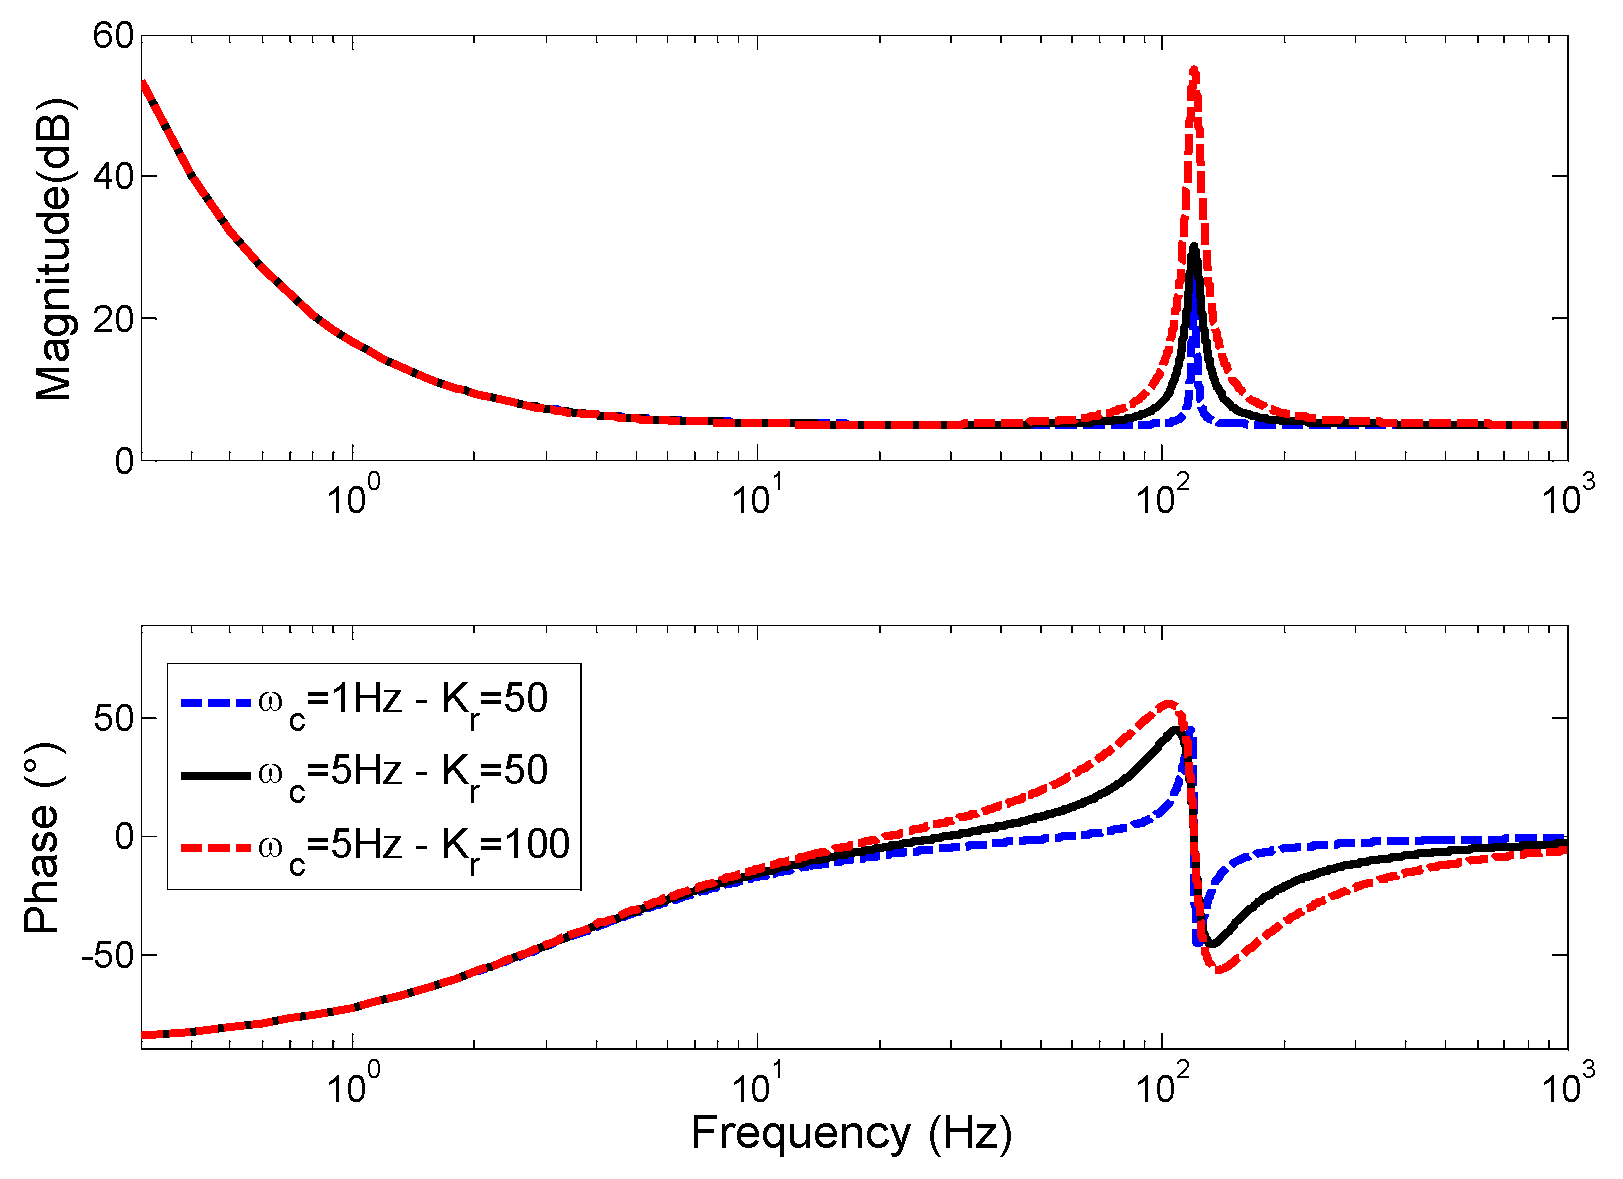
Equations (10)–(12) show that the cross products between voltage positive sequence components and current negative sequence components and between voltage negative sequence components and current positive sequence components cause active and reactive power oscillations. Using the classical control strategy, both negative sequence component of voltages and currents are present; thus, the injected power oscillation affects the grid power quality, already degraded by the voltage sag.
As the classic control acts only in the positive sequence components of currents, this component value has to increase in order to keep the power transfer during the voltage sag. Similar to the symmetrical case, positive sequence current components are limited by the control. When the limit is reached, the surplus energy is stored in the DC-link and the chopper acts, dissipating this energy. The curve representing the chopper actuation for the asymmetrical voltage sags is similar to the one shown in Figure 9, but in this case the horizontal axis represents the grid voltage positive sequence component.
The LVRT strategies discussed for the symmetrical voltage sags (Section 3.3) and their issues are similar for the asymmetrical voltage sags, but besides the imbalance between generator power and the power provided to the grid, for the asymmetrical case the negative sequence component of grid current is also an important issue. As shown previously (Figure 11b,e), if this component is not controlled, high currents take place, triggering protection or even damaging the GSC.
In order to deal with the current negative sequence components in power converters connected to the grid during unbalanced voltage conditions, several papers in literature propose different methods to control this component [14,16,20,33,34,35,36,37,38,39].
One of the most common methods applied to grid connected converters is the dual controller [24,33,34], also reported for the FC-PMSG technology [14]. This strategy employs two control structures, one controlling the positive sequence component oriented in the positive reference frame and other dealing with negative sequence component oriented in the negative sequence reference frame. The main drawback of this strategy is the necessity of using filters to decompose the positive and negative sequences of the currents to be controlled. These filters insert delays and transients in the control response.
The use of feedfoward terms with the negative sequence component of grid voltage, as presented in [16,20], is also a simple and efficient method. Nevertheless, this strategy does not permit the direct control of the negative sequence component, thus, the complete elimination of the component is not guaranteed, since this is an open loop strategy.
Another common strategy is the use of RC [8,35,36,37,38,39]. RC is widely used for VSC in order to control specific harmonics and it is also applied in the DFIG technology during asymmetrical voltage sags [8,35]. These controllers can be implemented in the synchronous reference frame (dq) [36,37] and also in the stationary frame (αβ) [38,39].
The RC applied for the FC-PMSG technology is not reported in the reviewed literature, thus, the present paper proposes the use of RC implemented in the synchronous reference frame, as presented in the next section.

5. Resonant Control

5.1. The Control Strategy

RC in the synchronous reference frame is a simple strategy to be implemented, because the control structure is similar to the classical one, depicted in Figure 3. The only modification is the inclusion of a resonant parcel in the PI controllers of GSC current control, resulting in the following controller equation:
G c = K p + K i s + K r 2 ω c s s 2 + 2 ω c s + ω 0 2
where Kp, Ki and Kr are respectively the proportional, integral and resonant gains, ωc is the controller bandwidth and ω0 is the resonant frequency. As seen previously, the negative sequence current components in the positive synchronous reference frame appear as oscillations with twice the grid frequency (120 Hz). Therefore, ω0 is set to 2×π×120 rad/s.
RC are designed analyzing the system frequency response [40]. Figure 12 depicts the Bode diagram of the PI + RC for various Kr and ωc. The Kr gain value is directly related with the resonant peak and the bandwidth around the selected frequency, ω0. An increase of the bandwidth ωc affects the controller selectivity which can be helpful for reducing sensitivity, for example, toward frequency deviations. The Kr and ωc adjustment is a balance between fast response and selectivity. The Kp and Ki are kept equal to the classical case, since generally its bandwidth is not affected by the resonant parcel.
Another important point in the use of RC is the discretization method used for digital implementation. The discretization method plays a major role in performance of these digital controllers, because different methods can affect the resonant frequency and closed loop gain [41]. In this work, the method Tustin with prewarping was employed.
With the RC strategy, the resonant parcel added to the classical current control structure acts in the 2ωg oscillation on the dq-axes grid current, i.e., the negative sequence component is canceled. It is also possible to set a reference for the negative sequence component in order to, for example, reduce the power oscillations [14,24]. In this work, this strategy is not used, since the main objective is to limit the grid current during the voltage sag.
Figure 12. Bode diagram of the PI + RC. Proportional-integral: PI; resonant controllers: RC.
Energies 09 00059 g012

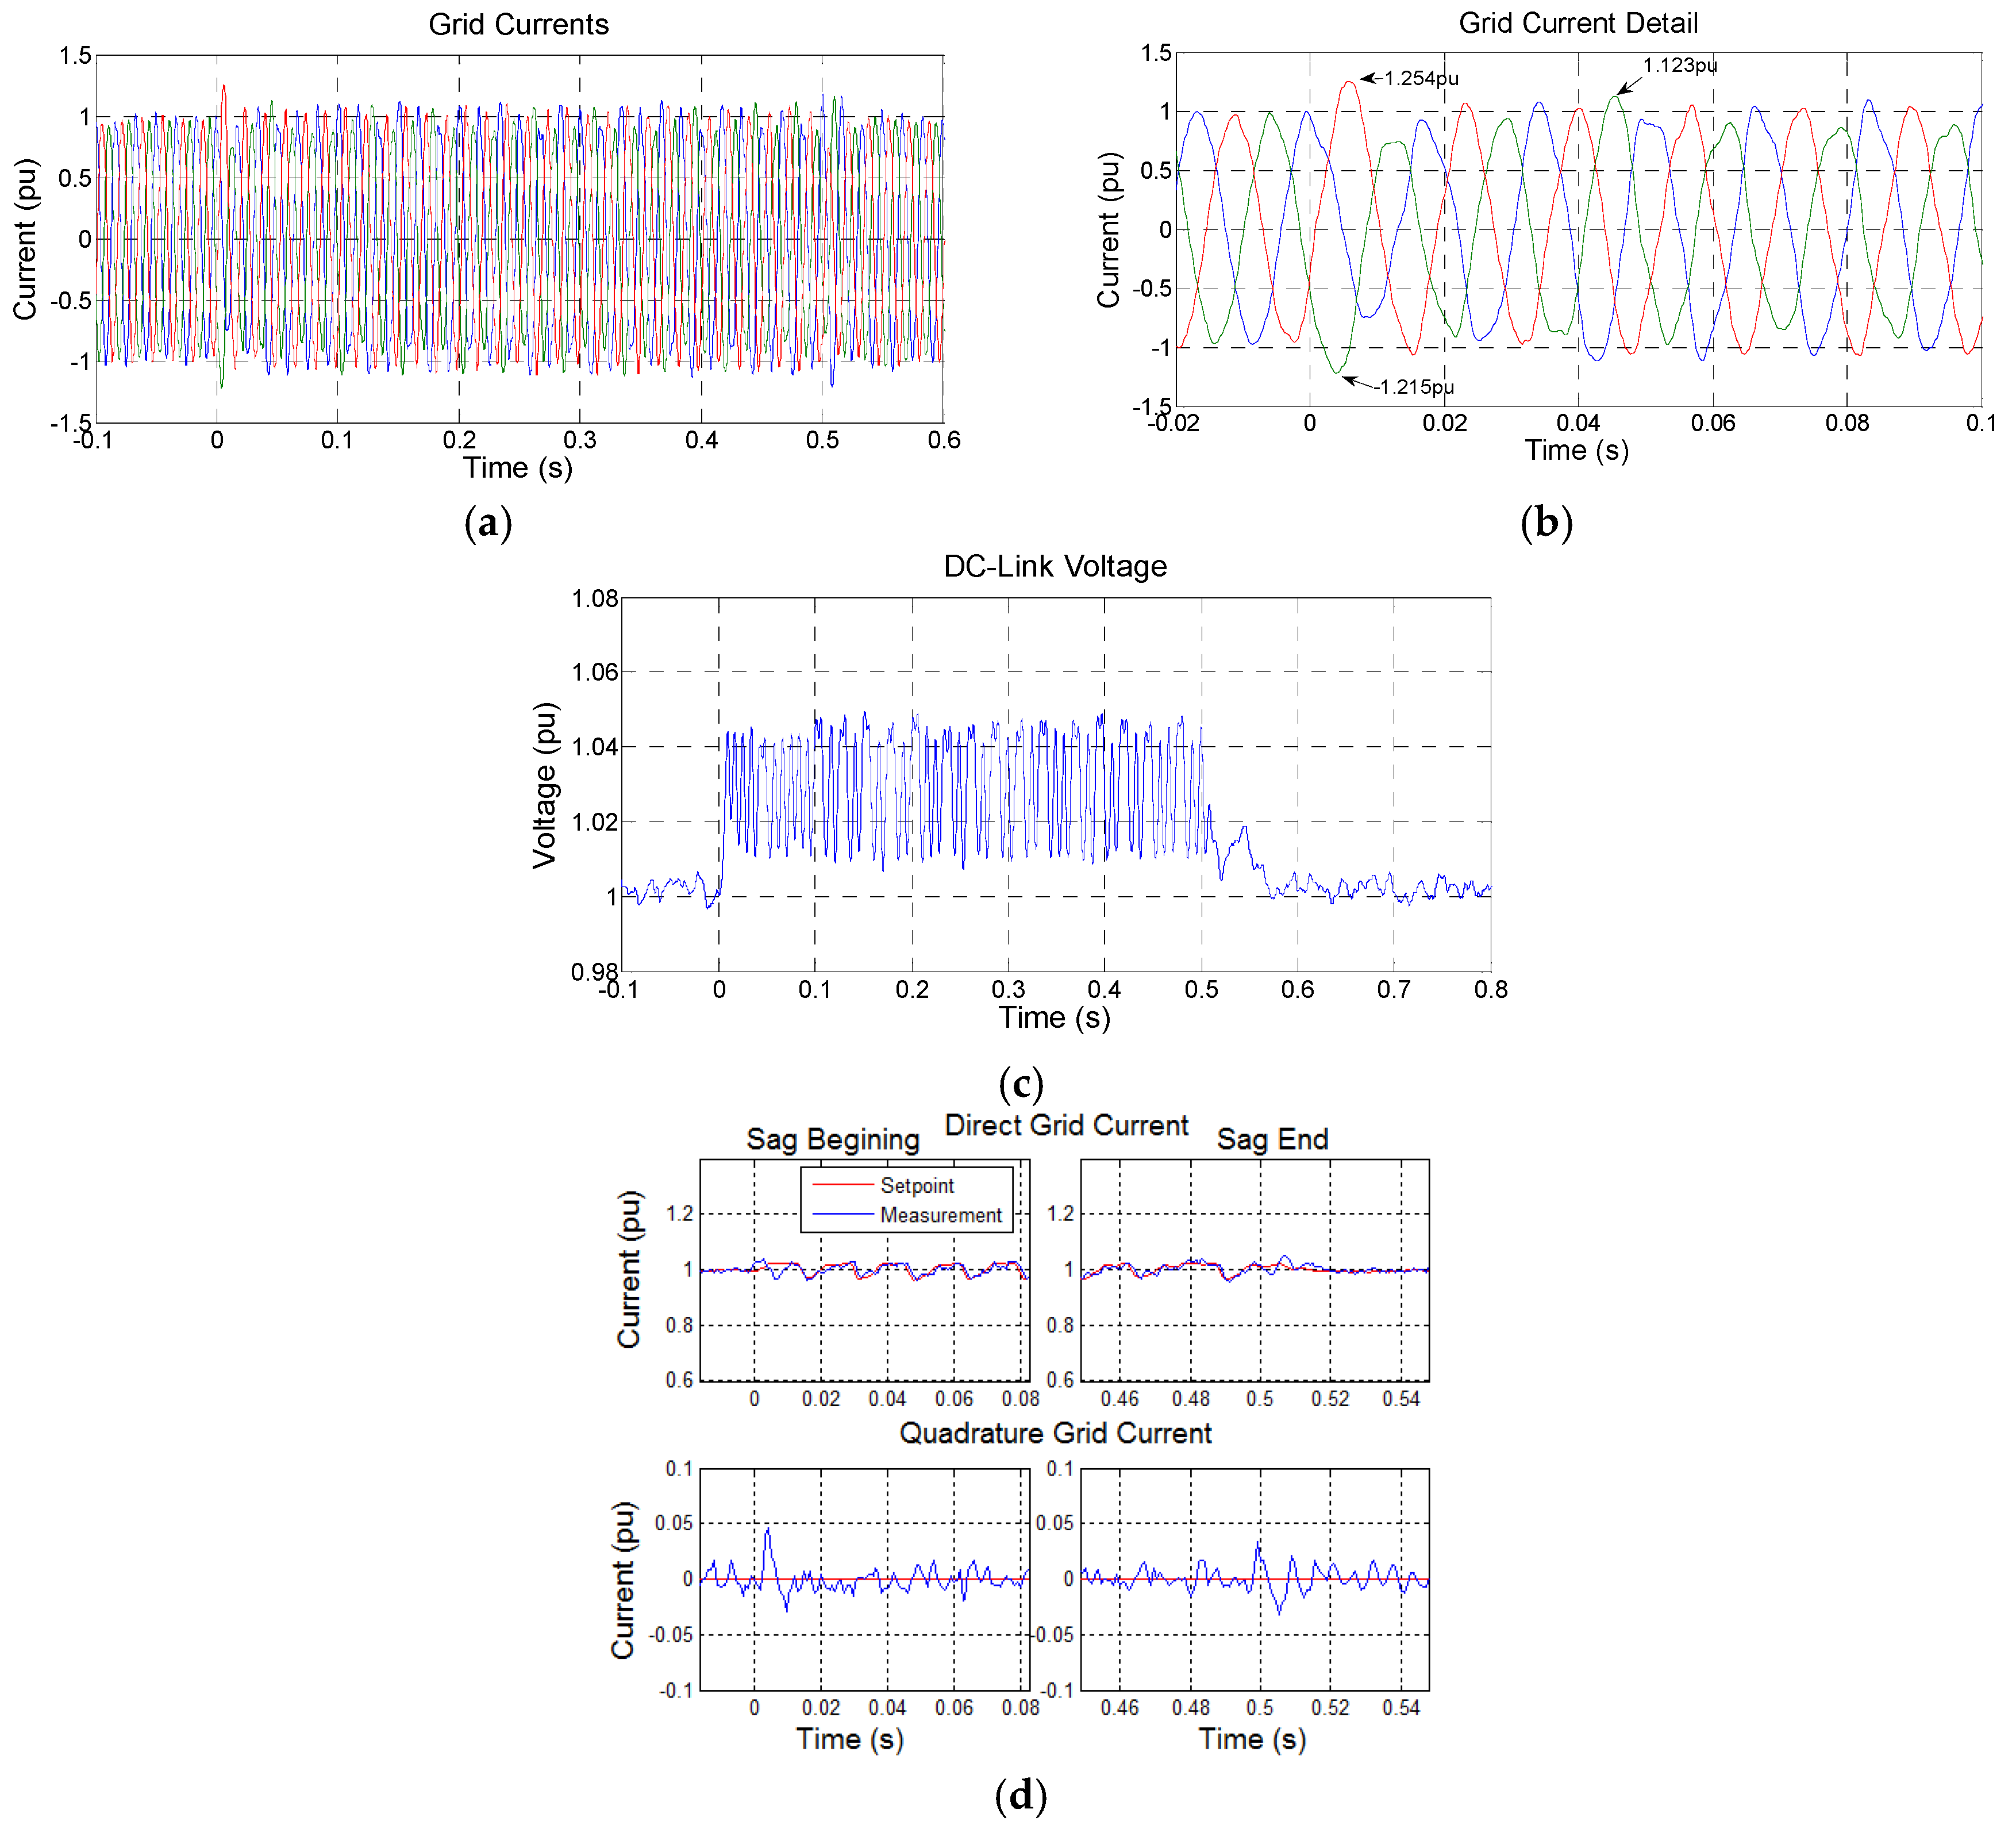
5.2. Experimental Results

Figure 13 shows the experimental results for a 20% phase-phase voltage sag for the system operating with rated power. One can see in Figure 13a that the currents’ imbalance (negative sequence components) is greatly reduced when compared with the case without the resonant control. The currents’ magnitudes are also reduced.
In order to better visualize the behavior of grid currents at the beginning of sag, Figure 13b shows a zoom of this instance. The current transient peak at the beginning at sag can be seen, which is fast; thus, it can be supported by the converter. During the voltage sag, the grid currents show a significant harmonic content which can affect the grid, but from the point of view of the converter ride-through, the reduction in the currents’ amplitude is more important.
Due to the reduction of the average power transferred to the grid, the chopper actuates to dissipate the surplus power, as depicted in Figure 13c. As the current negative sequence component is null, just the positive component transfers power to the grid. The use of this control strategy does not affect the generator side, similarly to the previous cases.
Figure 13d shows the direct and quadrature grid currents used for the control in the sag beginning and in the recovery of the voltage. The greater reduction of the negative sequence component (120 Hz oscillation), compared to the classical case (Figure 11e), can be seen. The oscillation in the reference, due to the chopper action, causes the pulsation seen in the currents’ amplitudes in Figure 13a.
Figure 13. Experimental results for 20% phase-to-phase voltage sag with the system operating at 100% of rated power using RC: (a) grid currents; (b) grid currents zoom; (c) DC-link voltage; and (d) direct and quadrature grid currents (sag beginning and recovery instants).
Energies 09 00059 g013
The voltage synthesized by the converter has to compensate the imbalance in the grid voltages to maintain balanced currents. As the grid voltages decrease during the sag, the required converter voltage is smaller than the voltage before the sag. Therefore, change in the hardware is not necessary to implement the RC, just a small modification in the control algorithm.

6. Conclusions

In this paper, the RTFC of permanent magnet wind generator using full scale converter (FC-PMSG) was discussed. Experimental results in a scaled 34 kW test bench were presented for the analysis carried out.
During symmetrical voltage sags, the main issue is the reduction of the capability of the converter to supply power to the grid. If the generator power is not reduced, it is necessary to use a discharge resistor to dissipate the surplus energy stored in the DC-link. This resistor must be dimensioned based on the ride-through curve required by the grid codes and the current limit of the converter.
In the asymmetrical voltage sags, besides the imbalance between generated power and power provided to the grid, voltage negative sequence components arise, causing highly uncontrolled currents that can trip the converter.
RC was employed to deal with the currents’ negative sequence components during asymmetrical voltage sags. The experimental results show that currents are reduced, improving the system ride-through fault capability. Nevertheless, in this case, the use of a discharge chopper to attend the grid codes is also necessary.
In this technology, reduction or even elimination of the chopper is the greatest challenge. In order to do so, it would be necessary to reduce the power generated during the sag and to use other strategies, such as pitch control, to avoid overspeeds. In this work, these strategies were not tested, because they directly affect the mechanical system, causing undesired stress. This would require more in-depth studies, from a mechanical point of view, and thus, is the focus of future work.

Acknowledgments

This work had financial support from FINEP (Brazilian Financing Agency for Studies and Projects), CAPES (Brazilian Agency for Higher Education Improvement), CNPQ (Brazilian National Council for Scientific and Technological Development) and FAPEMIG (Minas Gerais Research Foundation). The authors gratefully acknowledge the staff of ICSA do Brasil for the technical support in designing and assembling the test bench as well as Selênio Rocha Silva. He was the mentor of this work and met with an untimely death on 19 December 2014 at the age of 56, leaving several research projects under development.

Author Contributions

This is paper is the result of the hard work of all authors. Clodualdo V. de Sousa, Frederico F. Matos and Victor F. Mendes designed and constructed the test bench. They also implemented the control strategies and performed the experimental tests. Silas Y. Liu, Allan F. Cupertino and Heverton A. Pereira helped in the analysis of the results and the bibliographical research. All authors contributed to the text writing and results discussion.

Conflicts of Interest

The authors declare no conflict of interest.

Appendix

Table A1. Controller’s parameters.
Machine Side Converter
ControlProportional (Kp)Integral (Ki)
Current control loop220
Power loop0.051
Grid Side Converter
ControlProportional (Kp)Integral (Ki)Resonant (Kr)
Current control loop210050
DC-Link control loop0.610-
Table A2. Test bench parameters.
Generator
Rated power34 kW
Frequency60 Hz
Pole pair number24
Rated speed150 rpm
Rated current76 A
Rated voltage365 V
Motor (turbine simulator)
Rated power37 kW
Frequency60 Hz
Number of poles8
Rated current83 A
Rated voltage380 V
Converter
Rated power42 kVA
Grid voltage380 V
Switching frequency6 kHz
DC-link voltage640 V

References

  1. Tsili, M.; Papathanassiou, S. A review of grid code technical requirements for wind farms. IET Renew. Power Gener. 2009, 3, 308–332. [Google Scholar] [CrossRef]
  2. Grid Code High and Extra High Voltage; E.ON Netz GmbH: Bayreuth, Germany, 2006.
  3. Grid Codes Sub-module 3.6: Minimal Technical Requirements for the Grid Connection; National System Operator (ONS): Rio de Janeiro, Brazil, 2009. (In Portuguese)
  4. Zhu, Z.Q.; Hu, J. Electrical machines and power-electronic systems for high-power wind energy generation applications: Part I—market penetration, current technology and advanced machine systems. Int. J. Comput. Math. Electr. Electron. Eng. 2013, 32, 7–33. [Google Scholar]
  5. López, J.; Sanchis, P.; Roboam, X.; Marroyo, L. Dynamic behavior of the doubly fed induction generator during three-phase voltage dips. IEEE Trans. Energy Convers. 2007, 22, 709–717. [Google Scholar] [CrossRef]
  6. Yan, Y.; Wang, M.; Song, Z.-F.; Xia, C.-L. Proportional-Resonant Control of Doubly-Fed Induction Generator Wind Turbines for Low-Voltage Ride-Through Enhancement. Energies 2012, 5, 4758–4778. [Google Scholar] [CrossRef]
  7. Wu, Z.; Zhu, C.; Hu, M. Improved Control Strategy for DFIG Wind Turbines for Low Voltage Ride Through. Energies 2013, 6, 1181–1197. [Google Scholar] [CrossRef]
  8. Mendes, V.F.; Sousa, C.V.; Silva, S.R.; Rabelo, B.; Hofmann, W. Modeling and Ride-Through Control of Doubly Fed Induction Generators During Symmetrical Voltage Sags. IEEE Trans. Energy Convers. 2011, 26, 1161–1171. [Google Scholar] [CrossRef]
  9. Lima, F.K.A.; Luna, A.; Rodriguez, P.; Watanabe, E.H.; Blaabjerg, F. Rotor Voltage Dynamics in the Doubly Fed Induction Generator during Grid Faults. IEEE Trans. Power Electron. 2010, 25, 118–130. [Google Scholar] [CrossRef] [Green Version]
  10. Arribas, J.R.; Rodríguez, A.F.; Muñoz, Á.H.; Nicolás, C.V. Low Voltage Ride-through in DFIG Wind Generators by Controlling the Rotor Current without Crowbars. Energies 2014, 7, 498–519. [Google Scholar] [CrossRef]
  11. Ibrahim, R.A.; Hamad, M.S.; Dessouky, Y.G.; Williams, B.W. A review on recent low voltage ride-through solutions for PMSG wind turbine. In Proceedings of the 2012 International Symposium on Power Electronics, Electrical Drives, Automation and Motion (SPEEDAM), Sorrento, Italy, 20–22 June 2012.
  12. Conroy, J.F.; Watson, R. Low-voltage ride-through of a full converter wind turbine with permanent magnet generator. IET Renew. Power Gener. 2007, 1, 182–189. [Google Scholar] [CrossRef]
  13. Wang, W.; Ge, B.; Bi, D.; Qin, M.; Liu, W. Energy storage based LVRT and stabilizing power control for direct-drive wind power system. In Proceedings of the International Conference on Power System Technology (POWERCON), Hangzhou, China, 24–28 October 2010.
  14. Huang, H.; Mao, C.; Lu, J.; Wang, D. Electronic Power Transformer Control Strategy in Wind Energy Conversion Systems for Low Voltage Ride-through Capability Enhancement of Directly Driven Wind Turbines with Permanent Magnet Synchronous Generators (D-PMSGs). Energies 2014, 7, 7330–7347. [Google Scholar] [CrossRef]
  15. Yang, X.; Duan, X.; Feng, F.; Tian, L. Low Voltage Ride-Through of Directly Driven Wind Turbine with Permanent Magnet Synchronous Generator. In Proceedings of the Asia-Pacific Power and Energy Engineering Conference (APPEEC), Wuhan, China, 27–31 March 2009.
  16. Geng, H.; Yang, G.; Xu, D.; Wu, B. Unified Power Control for PMSG-Based WECS Operating Under Different Grid Conditions. IEEE Trans. Energy Convers. 2011, 26, 822–830. [Google Scholar] [CrossRef]
  17. Hansen, A.-D.; Michalke, G. Multi-pole permanent magnet synchronous generator wind turbines’ grid support capability in uninterrupted operation during grid faults. IET Renew. Power Gener. 2009, 3, 333–348. [Google Scholar] [CrossRef]
  18. Deng, F.; Chen, Z. Low-voltage ride-through of variable speed wind turbines with permanent magnet synchronous generator. In Proceedings of the 5th Annual Conference of IEEE Industrial Electronics (IECON’09), Porto, Portugal, 3–5 November 2009.
  19. Kim, K.H.; Jeung, Y.-C.; Lee, D.-C.; Kim, H-G. LVRT Scheme of PMSG Wind Power Systems Based on Feedback Linearization. IEEE Trans. Power Electron. 2012, 27, 2376–2384. [Google Scholar] [CrossRef]
  20. Alepuz, S.; Calle, A.; Busquets-Monge, S.; Kouro, S.; Wu, B. Use of Stored Energy in PMSG Rotor Inertia for Low-Voltage Ride-Through in Back-to-Back NPC Converter-Based Wind Power Systems. IEEE Trans. Ind. Electron. 2013, 60, 1787–1796. [Google Scholar] [CrossRef]
  21. Wu, Z.; Dou, X.; Chu, J.; Hu, M. Operation and Control of a Direct-Driven PMSG-Based Wind Turbine System with an Auxiliary Parallel Grid-Side Converter. Energies 2013, 6, 3405–3421. [Google Scholar] [CrossRef]
  22. Krause, P.; Wasynczuk, O.; Sudhoff, S.; Pekarek, S. Analysis of Electric Machinery and Drive Systems, 3rd ed.; IEEE Press, Wiley: Hoboken, NJ, USA, 2013. [Google Scholar]
  23. Liserre, M.; Blaabjerg, F.; Hansen, S. Design and control of an LCL-fillter-based three-phase active rectifier. IEEE Trans. Ind. Appl. 2005, 41, 1281–1291. [Google Scholar] [CrossRef]
  24. Xu, L.; Andersen, B.R.; Cartwright, P. VSC transmission operating under unbalanced AC conditions—analysis and control design. IEEE Trans. Power Deliv. 2005, 20, 427–434. [Google Scholar] [CrossRef]
  25. Rodriguez, P.; Pou, J.; Bergas, J.; Candela, J.I.; Burgos, R.P.; Boroyevich, D. Decoupled double synchronous reference frame PLL for power converters control. IEEE Trans. Ind. Appl. 2007, 22, 584–592. [Google Scholar] [CrossRef]
  26. Krishnan, R. Permanent Magnet Synchronous and Brushless DC Motor Drives; CRC Press: Blacksburg, VA, USA, 2010. [Google Scholar]
  27. Huang, K.; Zheng, L.; Huang, S.; Xiao, L.; Li, W. Sensorless control for direct-drive PMSG wind turbines based on sliding mode observer. In Proceedings of the International Conference on Electrical Machines and Systems (ICEMS), Beijing, China, 20–23 August 2011.
  28. Suul, J.A.; Molinas, M.; Norum, L.; Undeland, T. Tuning of control loops for grid connected voltage source converters. In Proceedings of the IEEE 2nd International Power and Energy Conference (PECon), Johor Bahru, Malaysia, 1–3 December 2008.
  29. Hava, A.M.; Kerkman, R.J.; Lipo, T.A. Simple analytical and graphical methods for carrier-based PWM-VSI drives. IEEE Trans. Power Electron. 1999, 14, 49–61. [Google Scholar] [CrossRef]
  30. Wind Turbine: Measurement and Assessment of Power Quality Characteristics of Grid Connected Wind Turbines, 2nd ed.; IEC61400-21; International Electrotechnical Commission (IEC): Geneva, Switzerland, 2008.
  31. Electromagnetic Compatibility (EMC)—Part 4-34: Testing and Measurement Techniques—Voltage Dips, Short Interruptions and Voltage Variations Immunity Tests for Equipment with Mains Current More than 16A per Phase; IEC61000; International Electrotechnical Commission (IEC): Geneva, Switzerland, 2009.
  32. Melicio, R.; Mendes, V.M.F.; Catalao, J.P.S. A pitch control malfunction analysis for wind turbines with permanent magnet synchronous generator and full-power converters: Proportional integral versus fractional-order controllers. Electr. Power Compon. Syst. 2010, 38, 387–406. [Google Scholar] [CrossRef]
  33. Yin, B.; Oruganti, R.; Panda, S.K.; Bhat, A.K.S. An Output-Power-Control Strategy for a Three-Phase PWM Rectifier under Unbalanced Supply Conditions. IEEE Trans. Ind. Electron. 2008, 55, 2140–2151. [Google Scholar] [CrossRef]
  34. Song, H.S.; Nam, K. Dual current control scheme for PWM converter under unbalanced input voltage conditions. IEEE Trans. Ind. Electron. 1999, 46, 953–959. [Google Scholar] [CrossRef]
  35. Hu, J.; He, Y.; Xu, L.; Williams, B.W. Improved control of DFIG systems during network unbalance using PI—R current regulators. IEEE Tran. Ind. Electron. 2009, 56, 439–451. [Google Scholar] [CrossRef]
  36. Teodorescu, R.; Blaabjerg, F.; Liserre, M.; Loh, P.C. Proportional-resonant controllers and filters for grid-connected voltage-source converters. IEE Proc. Electr. Power Appl. 2006, 153, 750–762. [Google Scholar] [CrossRef]
  37. Liserre, M.; Teodorescu, R.; Blaabjerg, F. Multiple harmonics control for three-phase grid converter systems with the use of PI-RES current controller in a rotating frame. IEEE Trans. Power Electron. 2006, 21, 836–841. [Google Scholar] [CrossRef]
  38. Luna, A.; Lima, K.; Corcoles, F.; Watanabe, E.; Rodriguez, P.; Teodorescu, R. Control of DFIG-WT under unbalanced grid voltage conditions. In Proceedings of the 2009 IEEE Energy Conversion Congress and Exposition (ECCE), San Jose, CA, USA, 20–24 September 2009.
  39. Zmood, D.N.; Holmes, D.G. Stationary frame current regulation of PWM inverters with zero steady state error. In Proceedings of the 30th Annual IEEE Power Electronics Specialists Conference, Charleston, SC, USA, 27 June–1 July 1999.
  40. Yepes, A.G.; Freijedo, F.D.; Lopez, O.; Doval-Gandoy, J. High-Performance Digital Resonant Controllers Implemented With Two Integrators. IEEE Trans. Power Electron. 2011, 26, 563–576. [Google Scholar] [CrossRef]
  41. Yepes, A.G.; Freijedo, F.D.; Doval-Gandoy, J.; López, O.; Malvar, J.; Fernandez-Comesaña, P. Effects of Discretization Methods on the Performance of Resonant Controllers. IEEE Trans. Power Electron. 2010, 25, 1692–1712. [Google Scholar] [CrossRef]

