1. Introduction
Energy sources are increasingly important for nanofluidic and microfluidic systems that are used in applications such as environmental monitoring with wireless sensor networks and implantable medical devices [
1]. Therefore, considerable effort over several decades has been devoted to the investigation of energy conversion devices for nanofluidic and microfluidic systems [
2,
3]. These devices were developed not only by miniaturization and improvement of conventional energy conversion machines, but also by the application of truly novel methods of energy conversion [
2]. Miniaturized conventional devices include miniaturized heat engines, micro fuel cells, microreactors, miniaturized gas turbines, and microbatteries. Whalen
et al. [
4] developed a micro heat engine in which a piezoelectric membrane extracts power from two-phase working fluids. Choban
et al. [
5] presented a microfluidic fuel cell that utilizes the occurrence of microscale multistream laminar flow to keep the fuel and oxidant streams separated but in diffusional contact. On the other hand, novel methods to convert energy using microscale fabrication include generation of streaming potential through a nanochannel and biologically inspired methods. Van der Heyden
et al. [
6] investigated power generation by a streaming potential produced by pressure-driven transport of ions in nanochannels. Tanaka
et al. [
7] developed a microspherical heart-like pump, which can convert chemical energy flowing into cells to mechanical energy of a fluid stream. Chang and Yang [
8] derived an exact expression for the figure of merit to calculate the electrokinetic energy conversion efficiency and power of an ion-selective nanopore. They found that the highest efficiency for a non-slip cation-selective nanopore is 9.7%. They also theoretically and numerically investigated the electrokinetic energy conversion in short-length nanofluidic channels, taking into account reservoir resistance and concentration polarization effects [
9]. These studies focused on conversion from hydrodynamic, chemical, and thermal energy to electrical energy.
The Gibbs free energy of mixing can be converted to electrical energy for nanofluidic and microfluidic systems using inorganic membranes. According to reference [
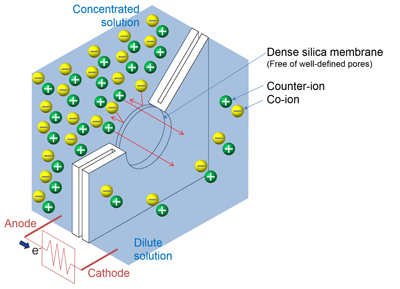
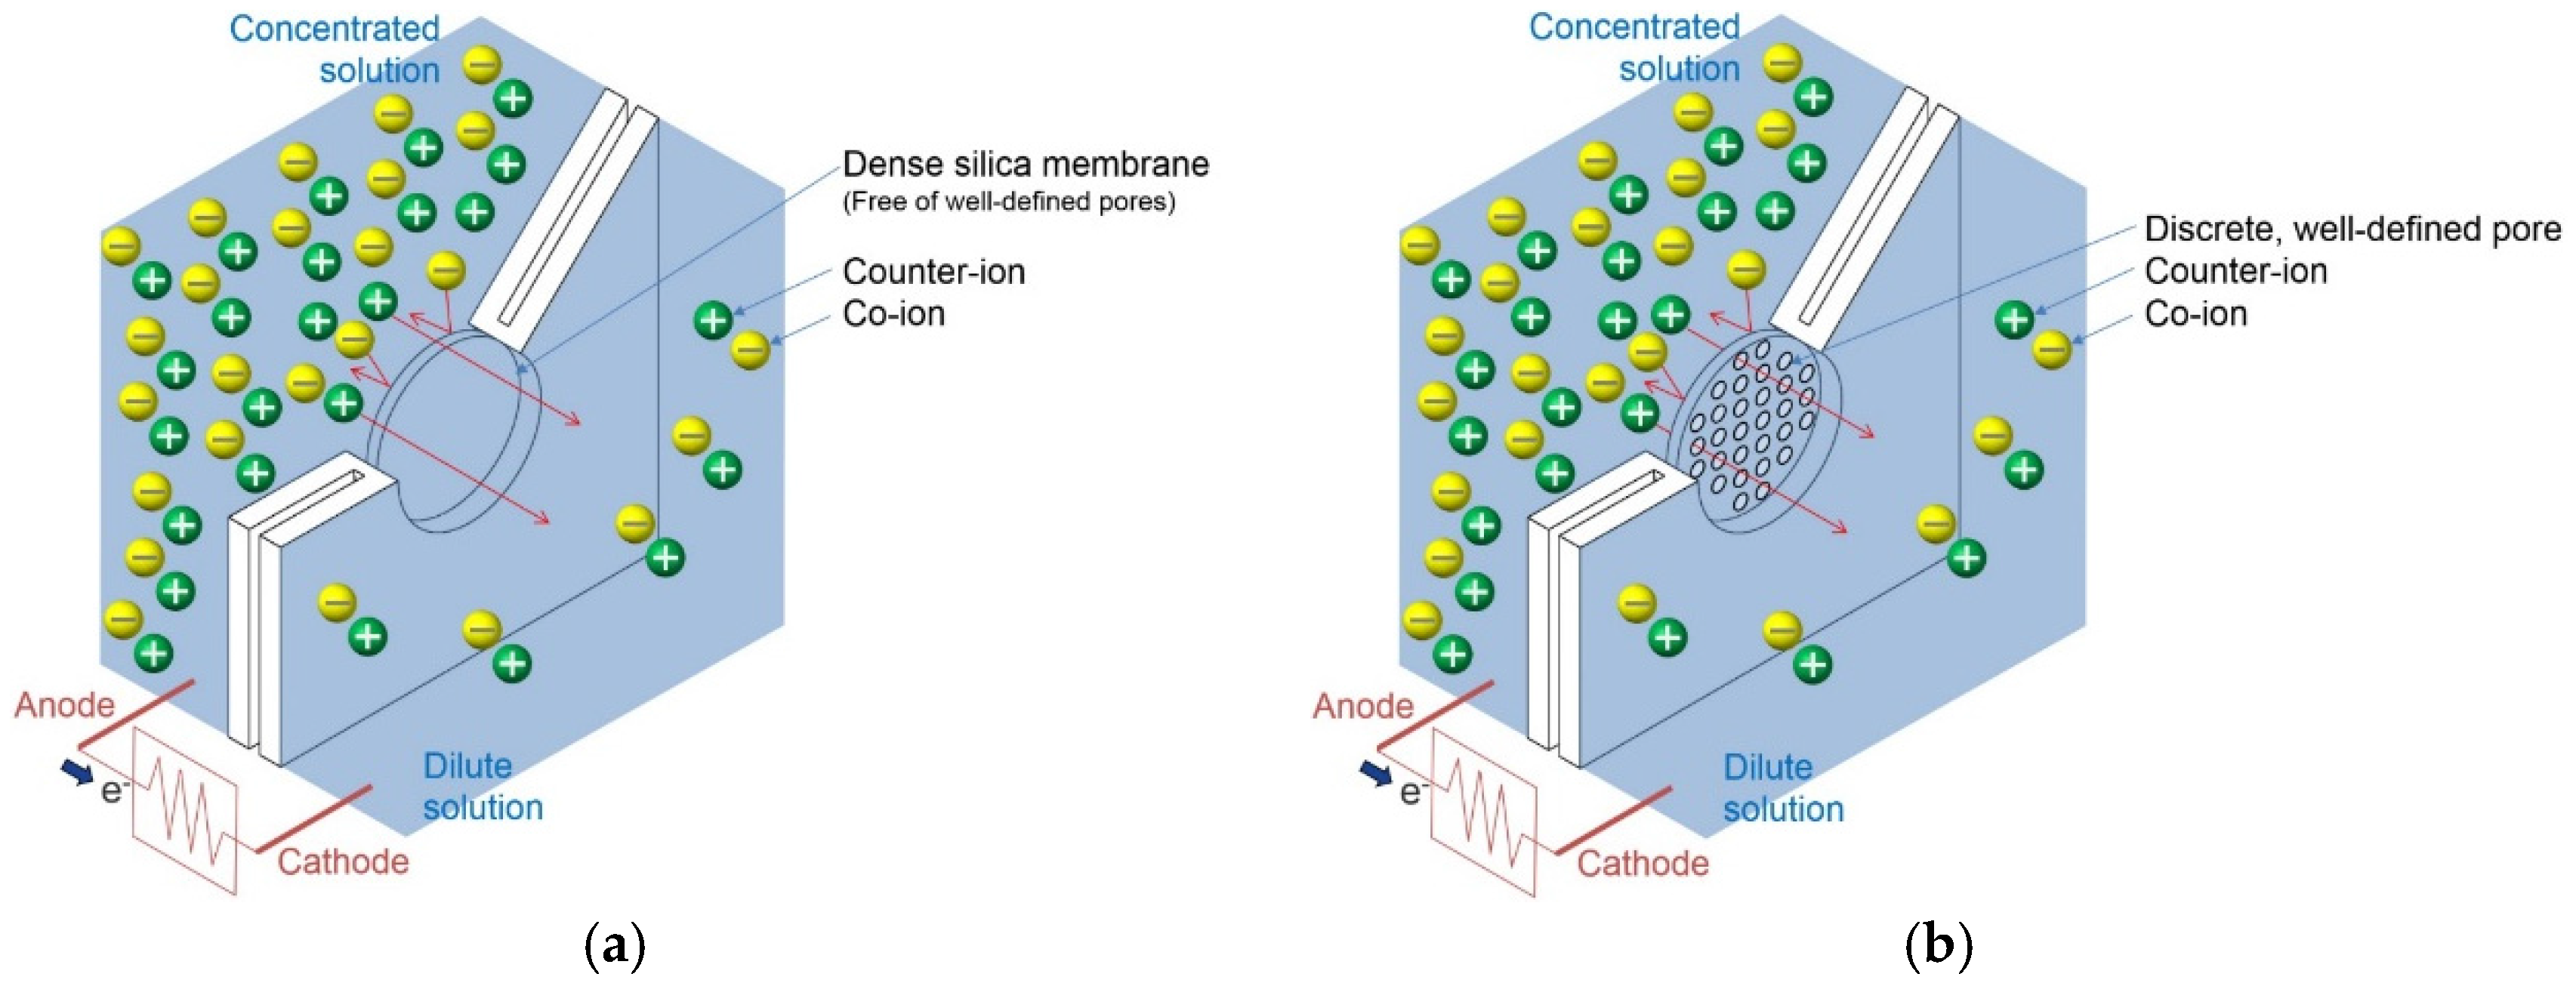
10], inorganic membranes can be divided into two structural categories, dense and porous inorganic membranes, which can have a significant impact on their performance as separators. Dense membranes are free of discrete, well-defined pores or voids, as shown in
Figure 1a. In contrast, porous membranes show well-defined straight or tortuous pores across the membrane thickness, as shown in
Figure 1b. In the porous inorganic membrane, an aqueous solution fills the nanopores throughout the membrane, and surface ionization, ion adsorption, and ion dissolution cause the surface of the nanopores to become charged [
11]. These surface charges draw counter ions toward the surface and repel co-ions (
Figure 1a). On the other hand, the dense inorganic membrane consists of an irregular atomic network with fixed anionic or cationic groups [
12]. These groups have an affinity for counter ions that can be adsorbed at ionic sites within the membrane [
13]. When an electrolyte concentration gradient is applied to either type of membrane, counter ions are transported through the layer much more easily than co-ions, resulting in a net charge migration of ions (
Figure 1b) [
14]. Therefore, the Gibbs free energy of mixing, which forces ion diffusion, can be converted into electrical energy. This energy conversion process is called reverse electrodialysis.
Figure 1.
Power generation from concentration gradient by reverse electrodialysis: (a) in a dense silica membrane; and (b) in a porous membrane.
Figure 1.
Power generation from concentration gradient by reverse electrodialysis: (a) in a dense silica membrane; and (b) in a porous membrane.
Recently, nanopores and nanofluidic channels have been widely investigated as porous inorganic membranes for use in reverse electrodialysis. Kim
et al. [
15] showed that silica nanochannels, fabricated by a standard semiconductor manufacturing process, can harvest energy by reverse electrodialysis. They experimentally investigated the power generated by 4 nm, 26 nm, and 80 nm high nanochannels that were between two KCl solutions with various combinations of concentrations. The highest power output measured was 2.89 pW. Ouyang
et al. [
16] conducted a proof-of-concept experiment using a nanofluidic crystal of packed silica nanoparticles. They achieved a power output of 1.18 nW with their prototype cell. Kim
et al. [
17] investigated the potential of alumina nanopores for reverse electrodialysis. Yeh
et al. [
18] performed numerical simulations based on the full Poisson–Nernst–Planck (PNP) equations to investigate reverse electrodialysis in negatively charged conical nanopores, and showed the maximum power conversion efficiency reaches 45%. On the other hand, reverse electrodialysis in dense inorganic membranes has not been investigated yet. These membranes are suitable for use in micro power generators and microbatteries where they can generate power more reliably because they do not shrink and swell in response to their environment [
19]. In addition, the performance of dense membranes is not as affected by biofouling as porous membranes [
20]. In particular, because dense silica membrane can be fabricated by the standard complementary metal-oxide-semiconductor (CMOS) process, it has the potential for use in nanofluidic and microfluidic devices. This led us to investigate the potential of dense silica membrane for the use in reverse electrodialysis systems. We can expect that a dense silica membrane can be used for reverse electrodialysis, because the ion-selective properties of glass/electrolyte interfaces were recognized early in the 20th century, and glass electrodes have been used since then for measurements of pH and the activities of alkali ions [
21]. However, the maximum power densities that can be achieved using a dense silica membrane, and the conditions under which these densities are achieved, are unclear. This lack of clarity is due to the fact that, to the best of our knowledge, there have been no previous studies focused on power generation by reverse electrodialysis in a dense silica membrane located between two solutions having different concentrations.
In this study, we investigated power generation using dense silica membranes by placing a silica membrane between two NaCl solutions with various combinations of concentrations. The silica membrane was fabricated by depositing a silica layer on a porous alumina substrate via chemical vapor deposition. We measured the potential-current (V-I) characteristics of the silica membrane from which we obtained the transference number, diffusion potential, and electrical resistance. In addition, we developed empirical correlations for the transference number and the area-specific resistance. Finally, we studied power generation by reverse electrodialysis using a silica membrane and developed a contour map of the power output density as a function of concentrations on the basis of the empirical correlations.
2. Materials and Methods
For the experiment, we used a porous alumina substrate (Anodisc 47, Whatman Inc., Marlborough, MA, USA), 47 mm in diameter and 60 μm thick.
Figure 2 shows the scanning electron microscope (SEM) images of the top and cross section of the alumina substrate that had a nominal pore radius of 100 nm and a nominal pore density of 1.2 × 10
9 cm
2. An undoped 1 μm thick silica layer was deposited on the substrate by plasma-enhanced chemical vapor deposition (LAPECVD, Plasma-Therm, Saint Petersburg, FL, USA) at a deposition rate of 10.2 Å/s and 150 °C, with SiH
4, He, and N
2O as the processing gases. The silica layer was deposited on the front side of the substrate only.
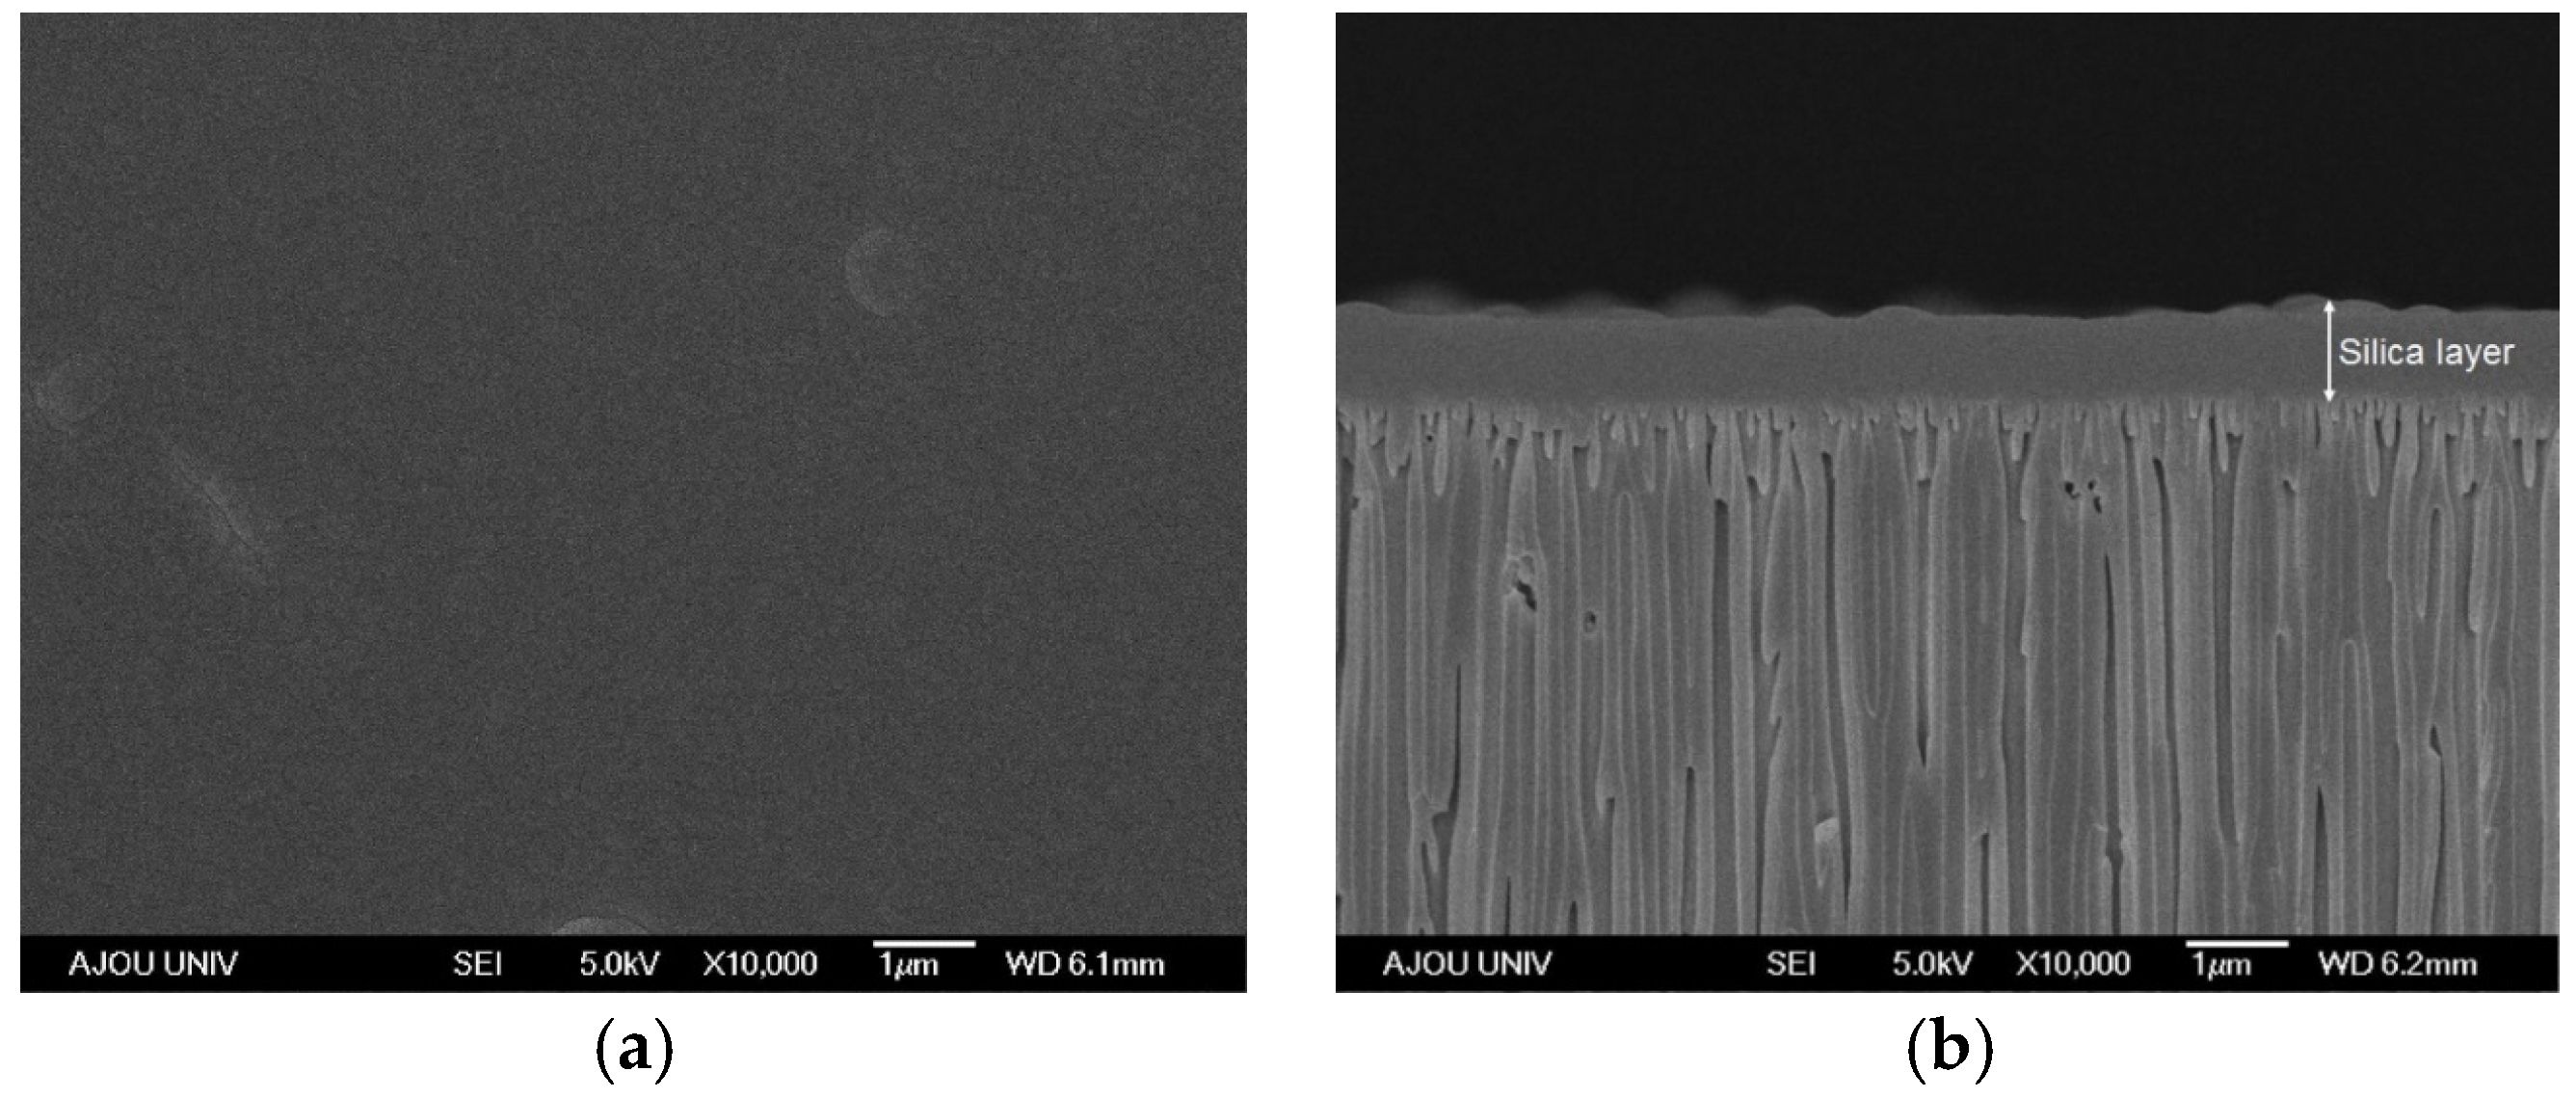
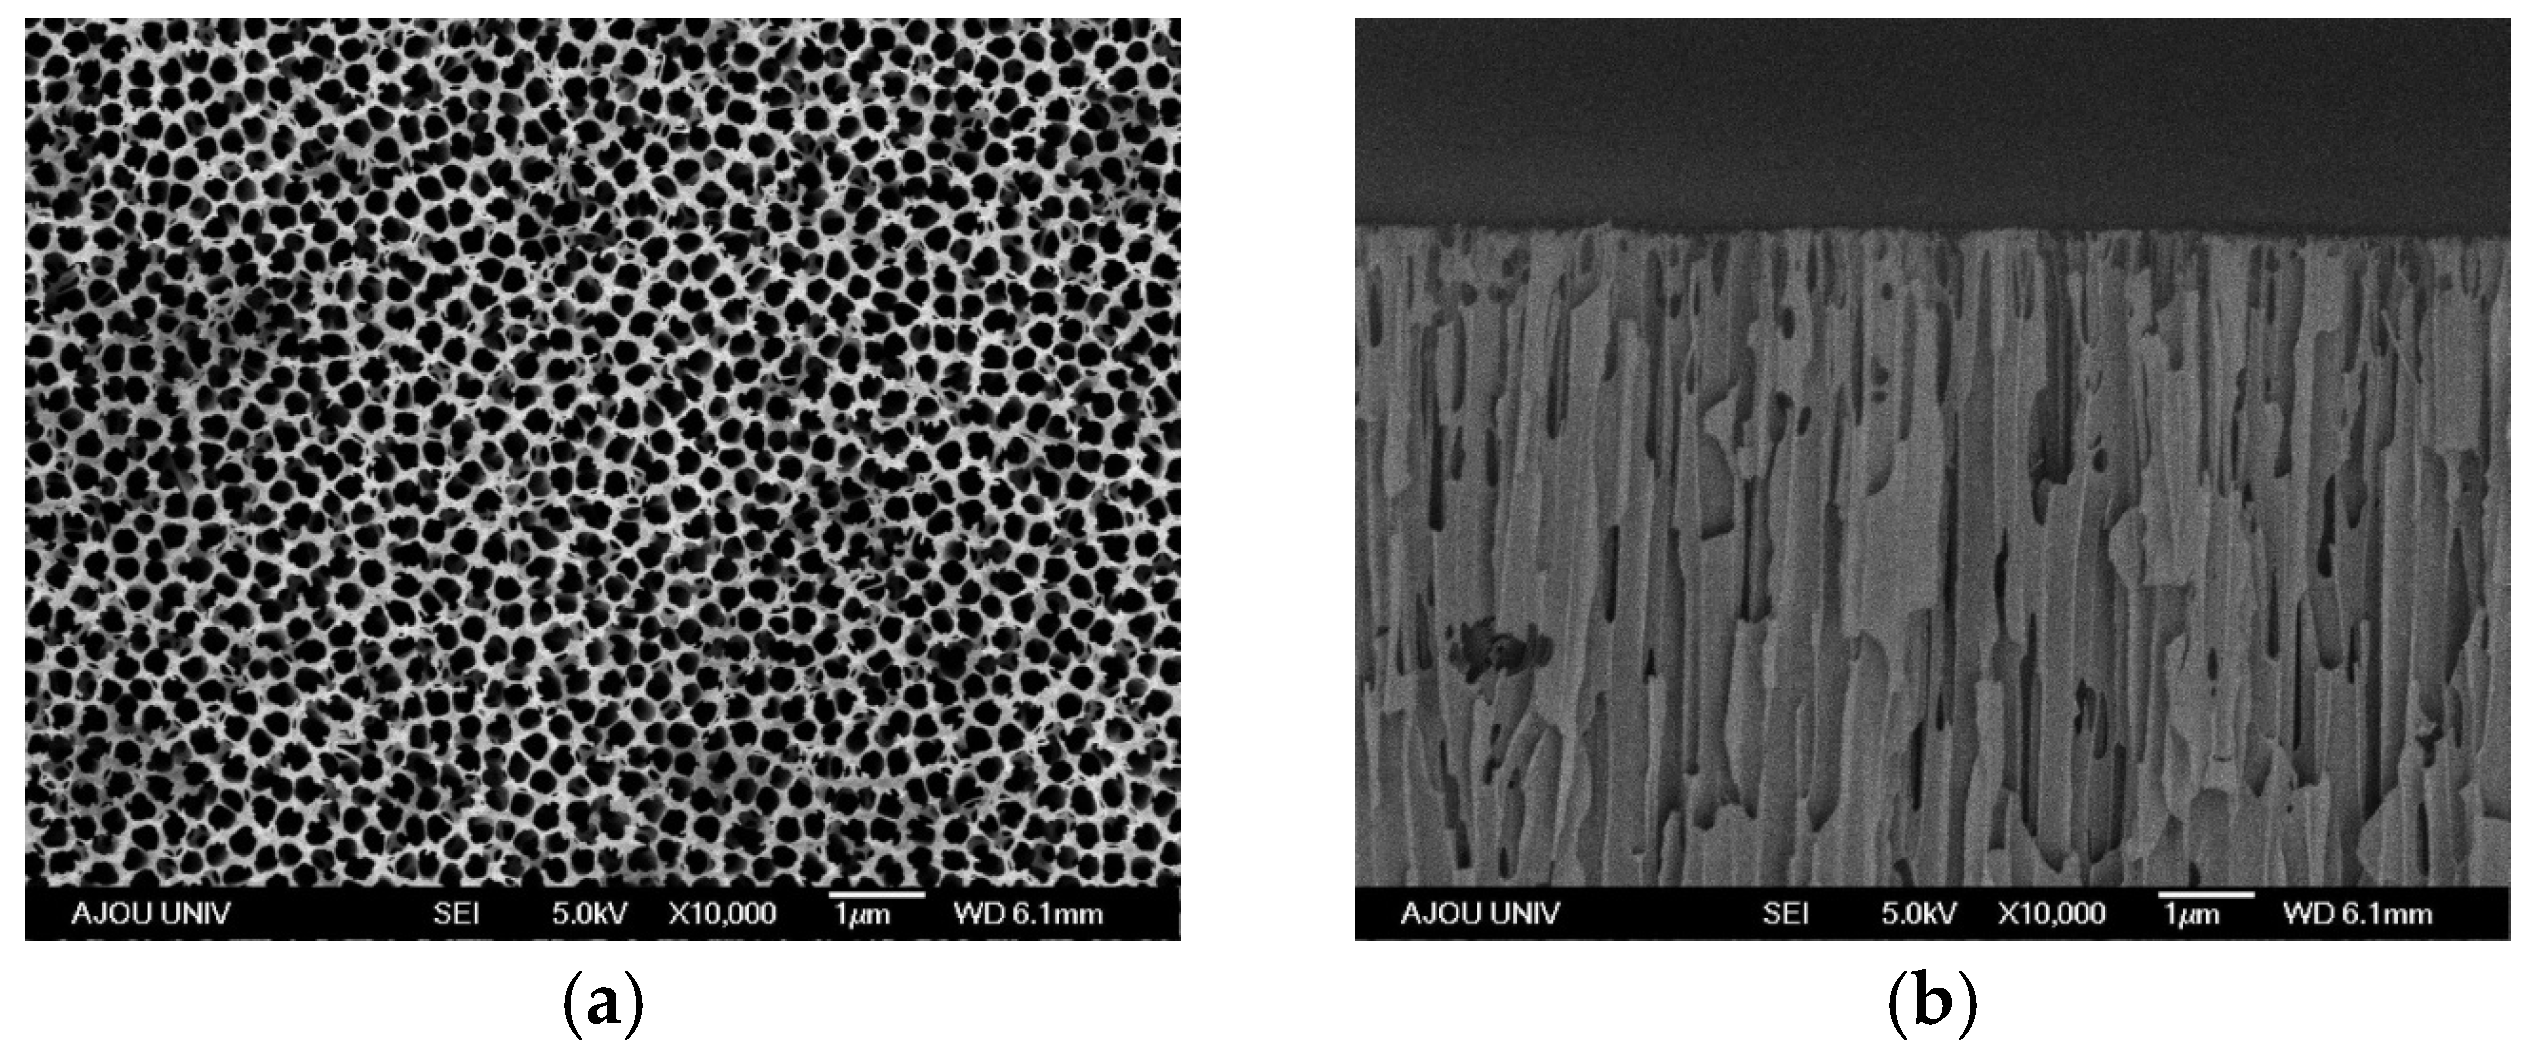
Figure 3 shows the SEM images of the top and cross section of the smooth and dense fabricated silica layer on top of the porous alumina substrate. In
Figure 3, the alumina substrate has a nominal pore radius of 100 nm. As shown in
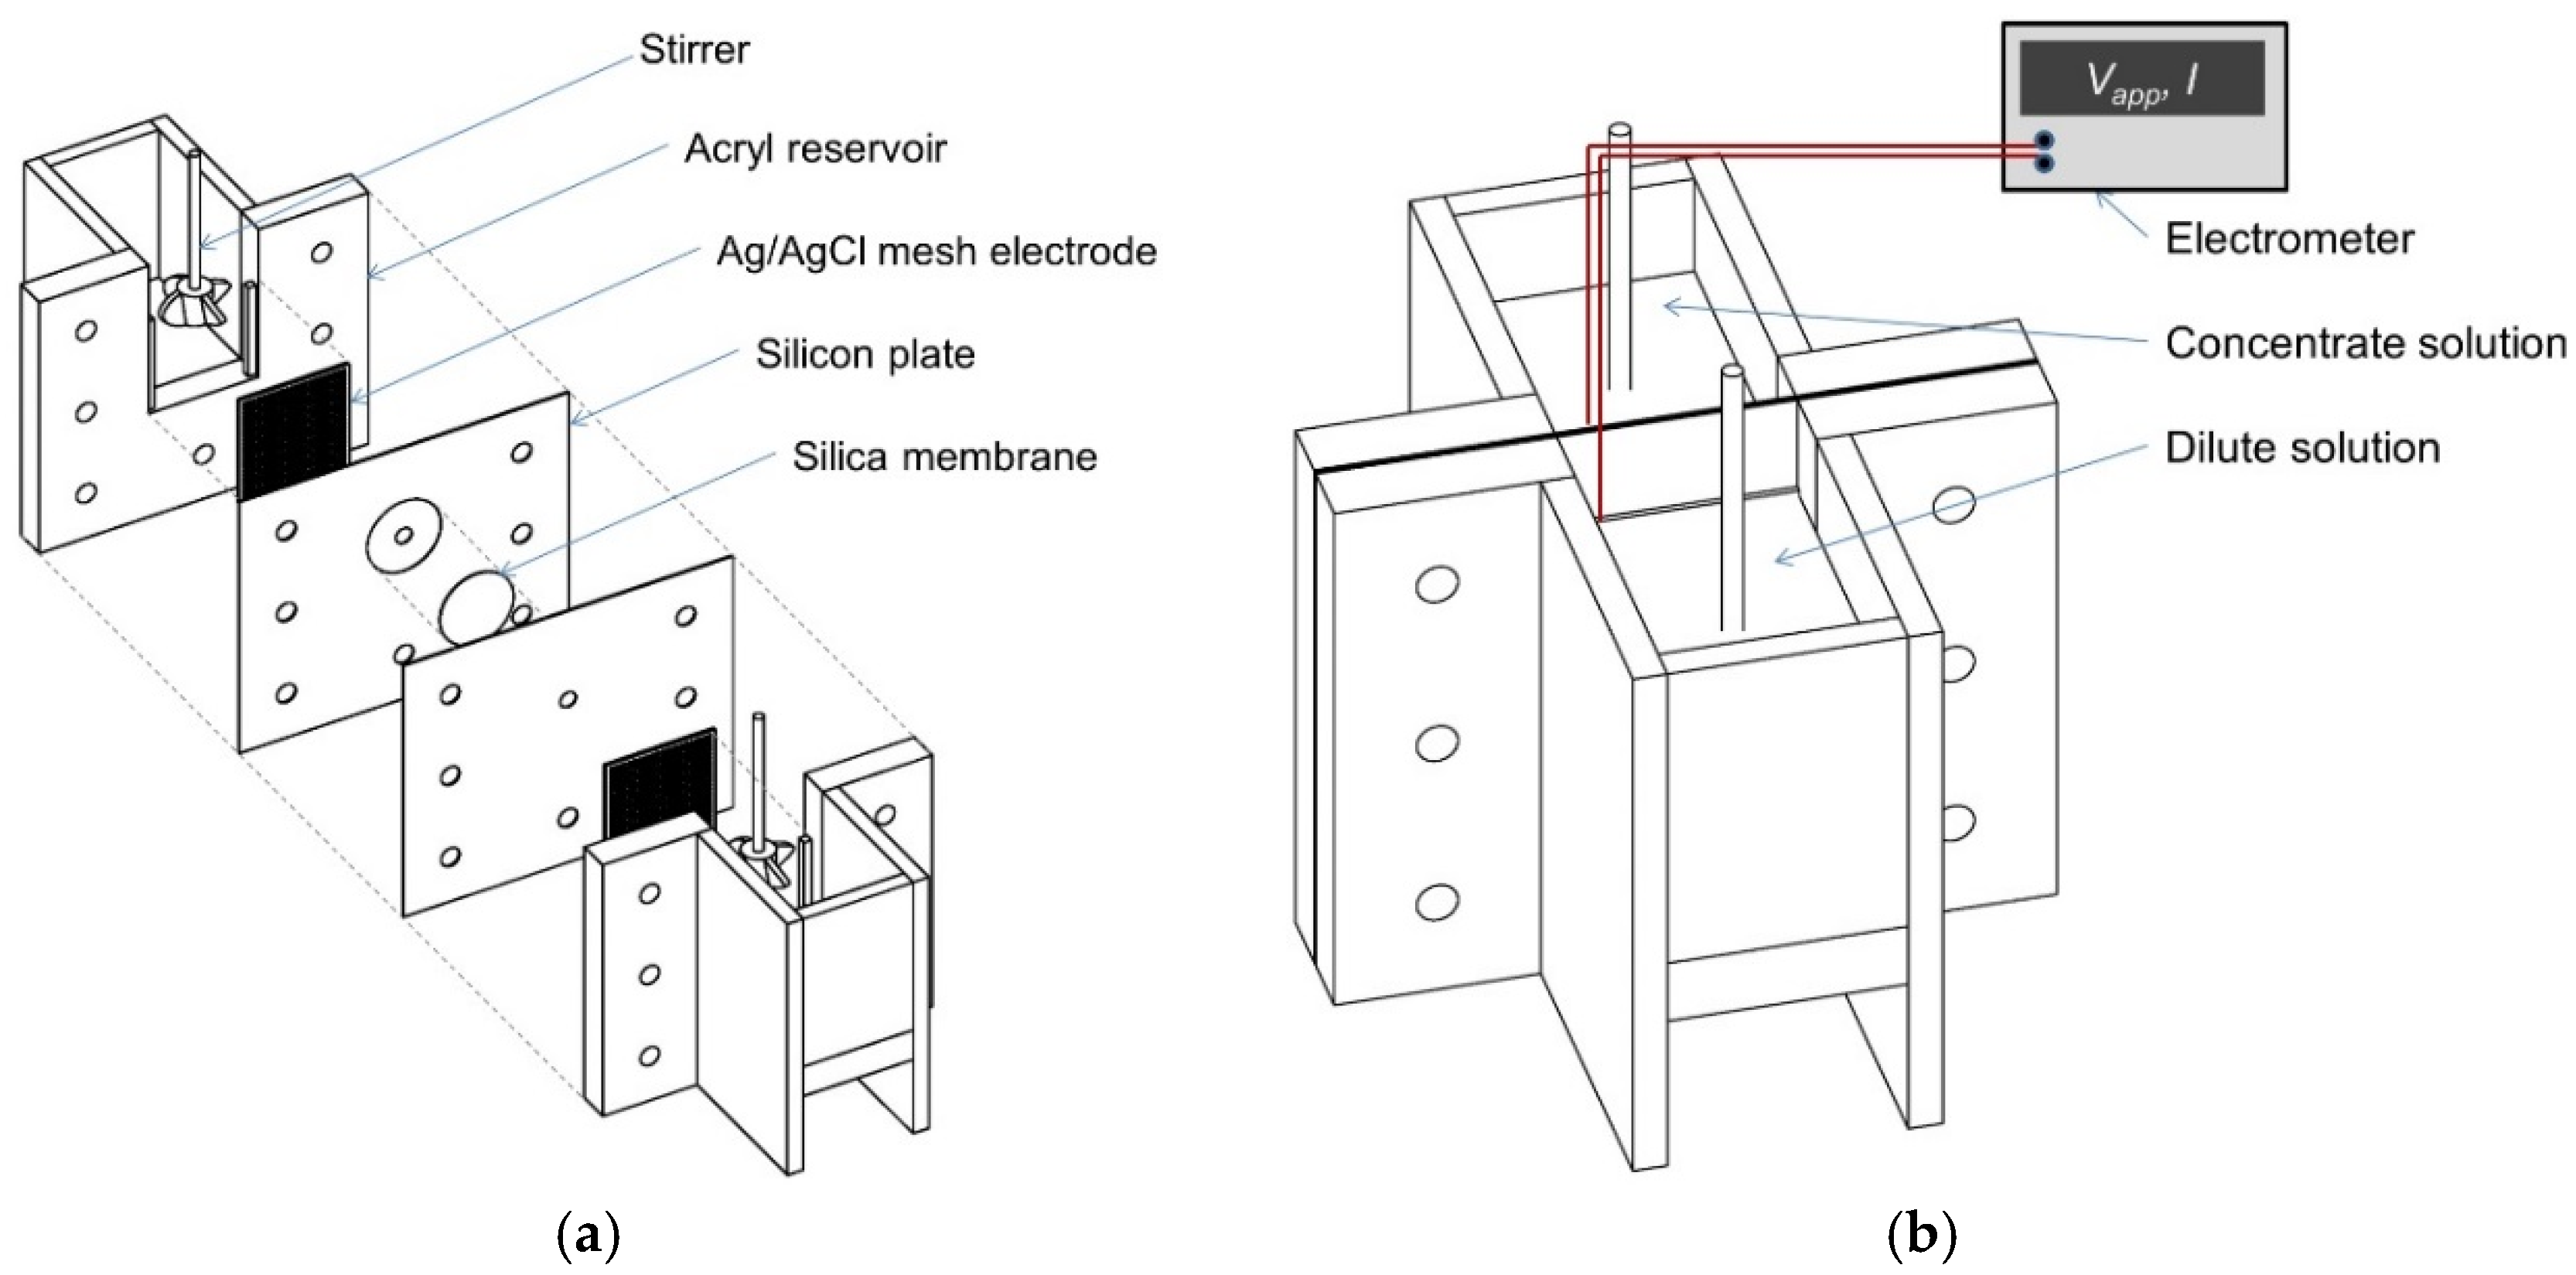
Figure 3a, a well-defined pore structure is not observed in the top view of the silica layer. Therefore, we can conclude that this layer is a dense silica membrane. The fabricated silica membrane was placed at the center of a two-cell apparatus, a schematic diagram of which is shown in
Figure 4 [
22,
23]. Two Ag/AgCl reference electrodes were fabricated by first coating silver mesh (05-1806-02, 40935, Nilaco Corp., Tokyo, Japan) with Ag/AgCl ink (011464, ALS Co. Ltd., Tokyo, Japan), washing the electrodes sufficiently with water, and leaving them overnight to dry. After placing the electrodes in the two cells, 0.5 L of a concentrated NaCl solution was placed into the desalting cell and 0.5 L of a dilute NaCl solution was placed into the concentrating cell. The pH of each solution was 5.4 ± 0.2.
Figure 2.
Scanning Electron Microscope (SEM) photos of the porous alumina substrate: (a) top view and (b) cross-sectional view.
Figure 2.
Scanning Electron Microscope (SEM) photos of the porous alumina substrate: (a) top view and (b) cross-sectional view.
Figure 3.
SEM photos of the silica layer on the porous alumina substrate: (a) top view and (b) cross-sectional view.
Figure 3.
SEM photos of the silica layer on the porous alumina substrate: (a) top view and (b) cross-sectional view.
Figure 4.
Experimental setup: (a) enlarged schematic and (b) normal schematic.
Figure 4.
Experimental setup: (a) enlarged schematic and (b) normal schematic.
An electrometer (2410 Source Meter, Keithley Instruments Inc., Solon, OH, USA) recorded the current (
I) from the silica layer for various applied voltages (
Vapp). The current was measured for 2 min in the steady state,
i.e., when the change in the current was less than ±1%. The
V-
I characteristics were measured for various combinations of the concentrations of the dilute solution (
cL) and the concentrated solution (
cH), as listed in
Table 1. We performed each experiment four times.
Table 1.
Transference number, diffusion potential, area-specific resistance, and maximum power density for various combinations of NaCl concentrations.
Table 1.
Transference number, diffusion potential, area-specific resistance, and maximum power density for various combinations of NaCl concentrations.
| cL (M) | cH (M) | t+ | Ediff (mV) | RA (Ω·cm2) | Pmax/A (mW/m2) |
|---|
| 0.0001 | 0.001 | 0.749 ± 0.001 | 29.2 ± 0.1 | 14,600 ± 100 | 0.145 ± 0.00001 |
| 0.0001 | 0.01 | 0.736 ± 0.001 | 54.7 ± 0.1 | 12,200 ± 100 | 0.611 ± 0.00001 |
| 0.0001 | 0.1 | 0.565 ± 0.001 | 22.2 ± 0.2 | 10,500 ± 100 | 0.117 ± 0.00001 |
| 0.0001 | 1 | 0.424 ± 0.001 | −34.1 ± 0.3 | 8100 ± 30 | 0.358 ± 0.00003 |
| 0.001 | 0.01 | 0.782 ± 0.004 | 32.4 ± 0.5 | 3300 ± 10 | 0.796 ± 0.00019 |
| 0.001 | 0.1 | 0.593 ± 0.001 | 20.9 ± 0.2 | 2250 ± 10 | 0.482 ± 0.00003 |
| 0.001 | 1 | 0.439 ± 0.004 | −20.2 ± 1.3 | 2140 ± 10 | 0.477 ± 0.002 |
| 0.01 | 0.1 | 0.619 ± 0.003 | 13.2 ± 0.4 | 443 ± 2 | 0.976 ± 0.00074 |
| 0.01 | 1 | 0.461 ± 0.001 | −8.3 ± 0.1 | 332 ± 3 | 0.521 ± 0.00002 |
| 0.1 | 1 | 0.465 ± 0.006 | −3.7 ± 0.6 | 57.6 ± 0.2 | 0.591 ± 0.01796 |
3. Results and Discussion
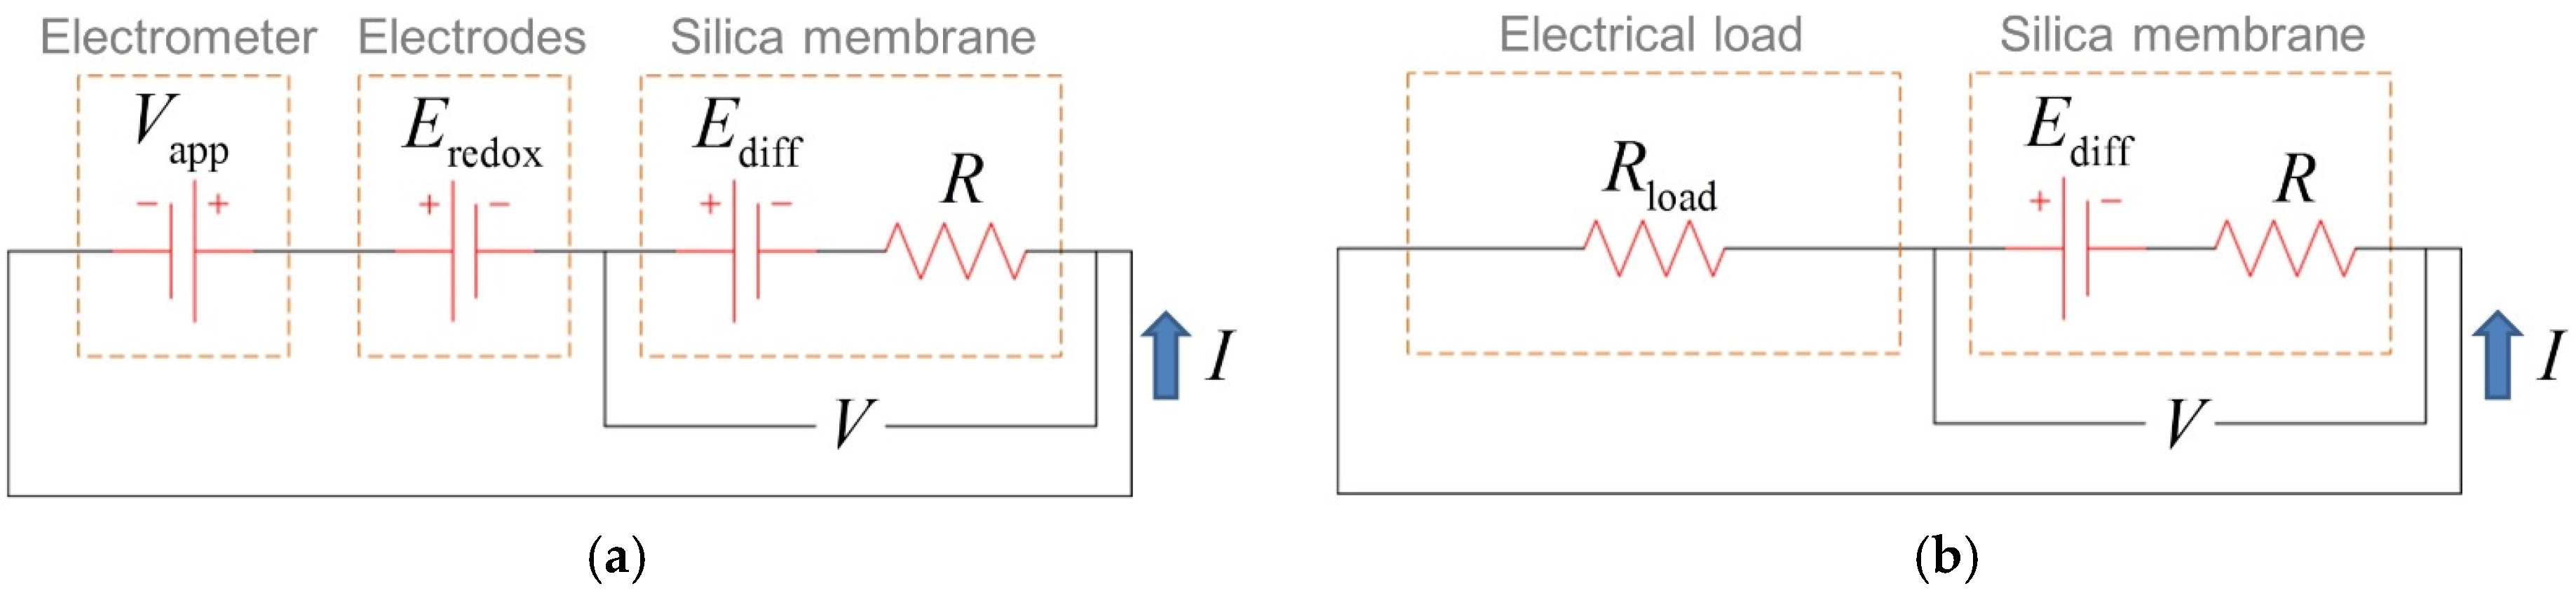
The setup for this experiment can be represented in terms of basic circuit elements, as shown in
Figure 5a.
Eredox,
Ediff, and
R are the potential generated from redox reactions on the electrodes, the diffusion potential of the silica membrane, and the electric resistance of the silica membrane, respectively. The electric potential generated in the silica membrane,
V, is defined as:
Figure 5.
(a) Basic circuit elements representing the experimental setup; and (b) equivalent circuit for this setup in which the source meter and the electrode are considered the electrical load Rload connected to the silica membrane.
Figure 5.
(a) Basic circuit elements representing the experimental setup; and (b) equivalent circuit for this setup in which the source meter and the electrode are considered the electrical load Rload connected to the silica membrane.
Eredox is produced by an unequal voltage drop at the electrode–solution interface in different electrolyte concentrations. The thermodynamic value of
Eredox is defined as [
21,
24]:
where
R,
T,
z,
F, and γ are the gas constant, temperature, charge number, Faraday constant, and mean activity coefficient, respectively. Another equivalent circuit for this setup is shown in
Figure 5b, in which the source meter and the electrode are considered the electrical load
Rload connected to the silica membrane.
Rload is defined as:
Eredox here is for the given concentrations of solutions. Therefore, by changing Vapp, we can change the Rload connected to the silica membrane.
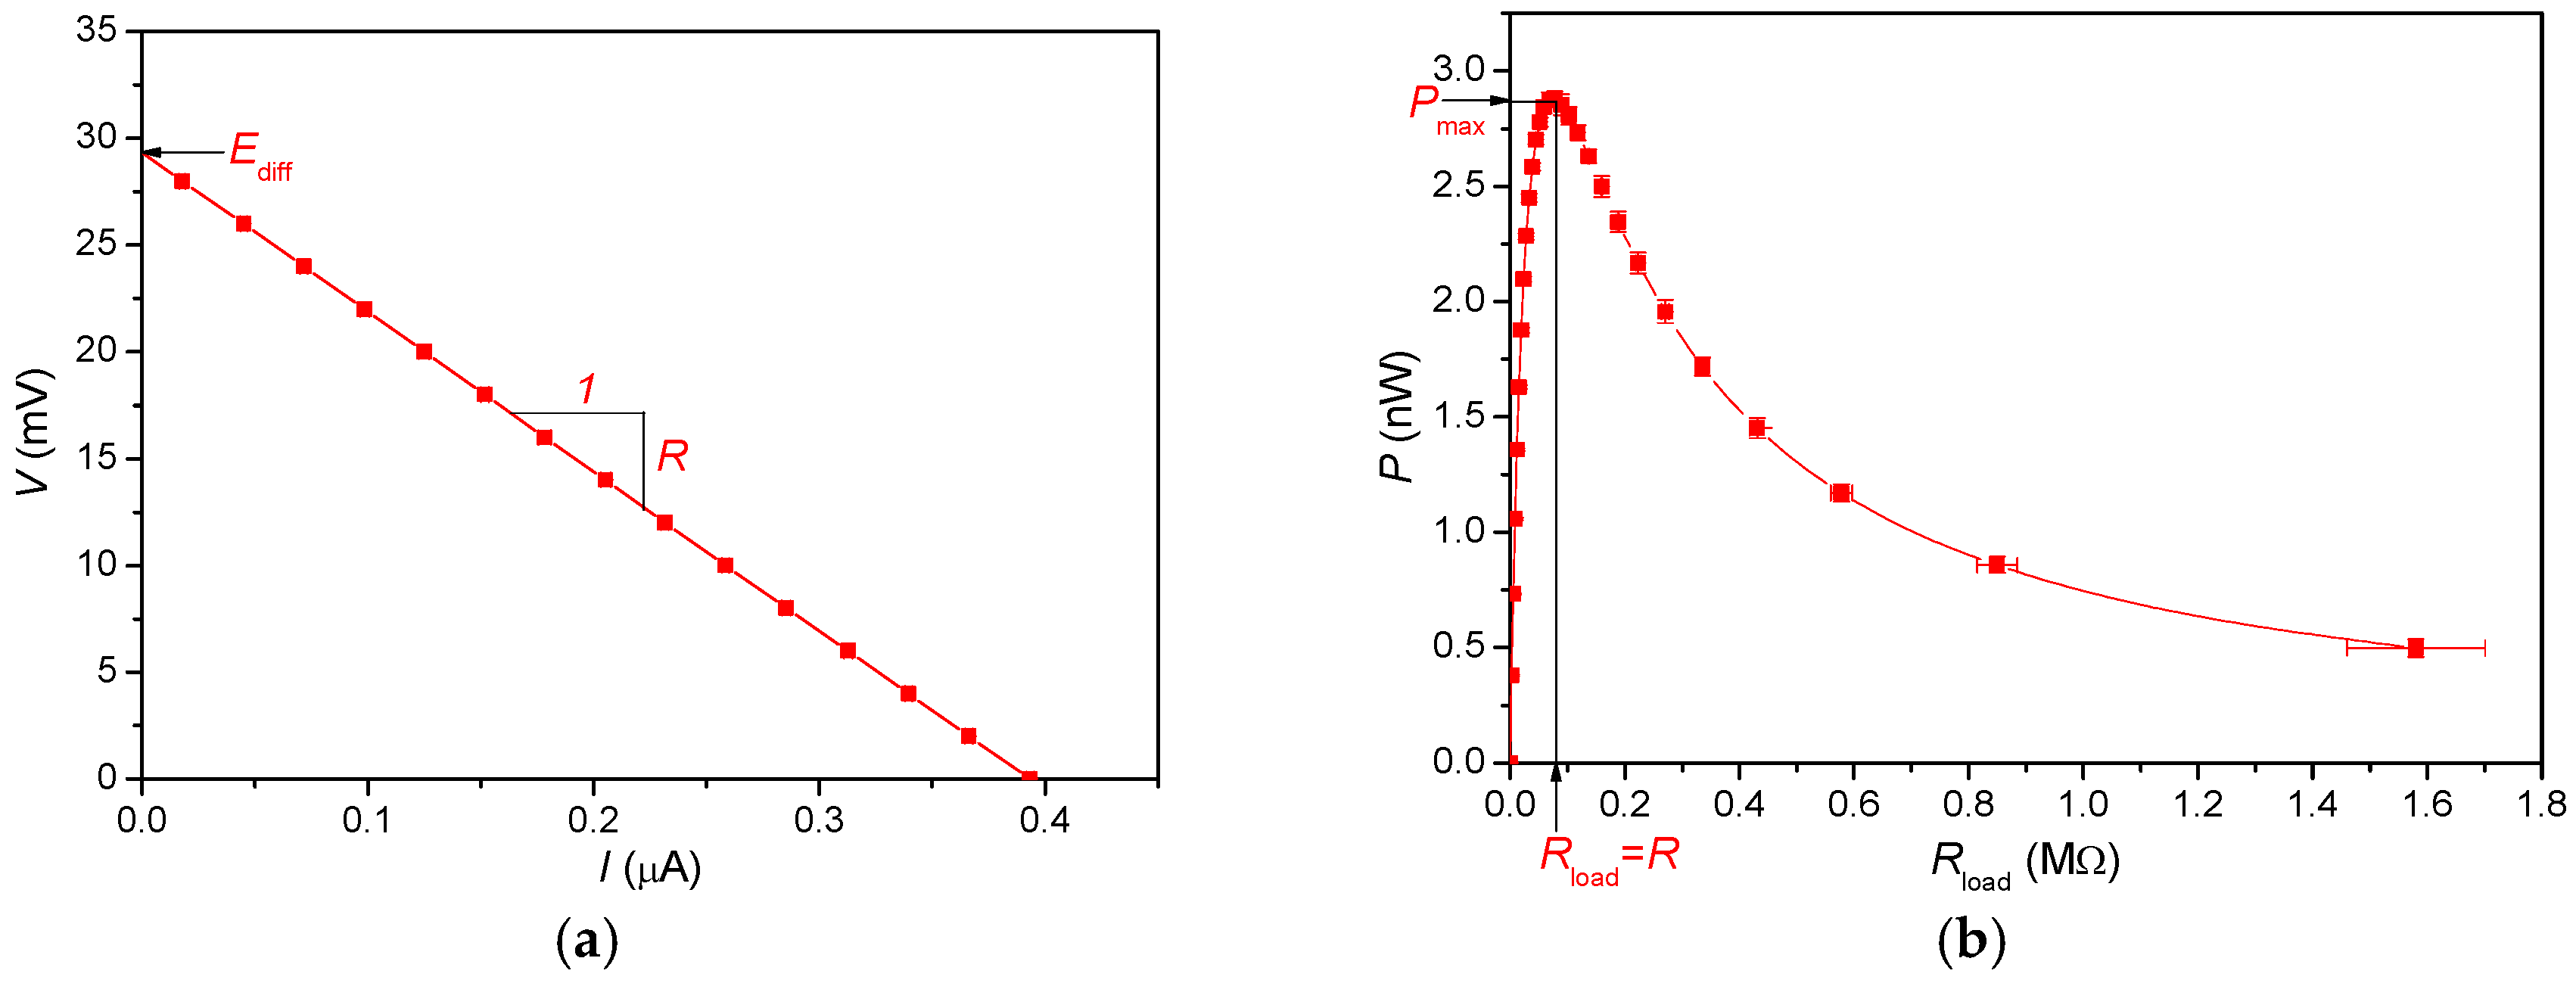
Figure 6a shows a typical potential-current (
V-
I) curve for the silica membrane. The electrical resistance
R of the silica membrane is calculated using the slope of the curve. The potential decreases linearly as the current increases, emphasizing the ohmic behavior of the silica layer in the conducting current. This behavior occurs because the concentration profile inside the silica layer is not highly dependent on the electrical potential and because there is no polarization effect at the surface of the silica layer under small electric fields [
25,
26]. The zero-current potential on the
V-
I curve is
Ediff and is determined by the difference between the diffusion fluxes of the positive and negative ions caused by the ion-selective property of the silica layer. Thus, the cations diffuse more rapidly than the anions when the concentrated solution diffuses into the dilute solution through the silica layer because of the ion-selective transport property of the silica layer. This rapid diffusion of cations into the dilute solution makes it positively charged and leaves the concentrated solution negatively charged. Thus, a double layer of positive and negative charges develops between the two solutions. This results in a difference in potential between the two solutions,
i.e.,
Ediff, which is defined as:
where
t+ is the transference number for the cations and is defined as the fraction of the electrical current carried by the cations under an applied voltage. It is an index of the ion selectivity of the silica membrane:
t+ = 1 for complete cation selectivity,
t+ = 0 for complete anion selectivity, and
t+ ≈ 0.4 for NaCl solutions when the membrane is not ion-selective [
27]. In
Figure 6a,
Ediff is positive,
i.e., the silica membrane is cation-selective.
Figure 6b shows a typical
P-
Rload curve of the silica layer. The generated power
P is defined as:
Combining Equations (1), (3) and (5) yields:
Maximum power is generated when
Rload =
R; thus:
Figure 6.
(a) V-I curve and (b) power generation vs. Rload for the silica membrane; cL = 0.1 mM and cH = 1 Mm.
Figure 6.
(a) V-I curve and (b) power generation vs. Rload for the silica membrane; cL = 0.1 mM and cH = 1 Mm.
We measured the
I-
V curves for various
cL and
cH and used them to calculate
t+,
R,
Ediff, and
Pmax of the silica membrane for those concentrations. The results are presented in
Figure 7,
Figure 8,
Figure 9 and
Figure 10, respectively, and each characteristic determined by the experimental results is discussed below:
(1)
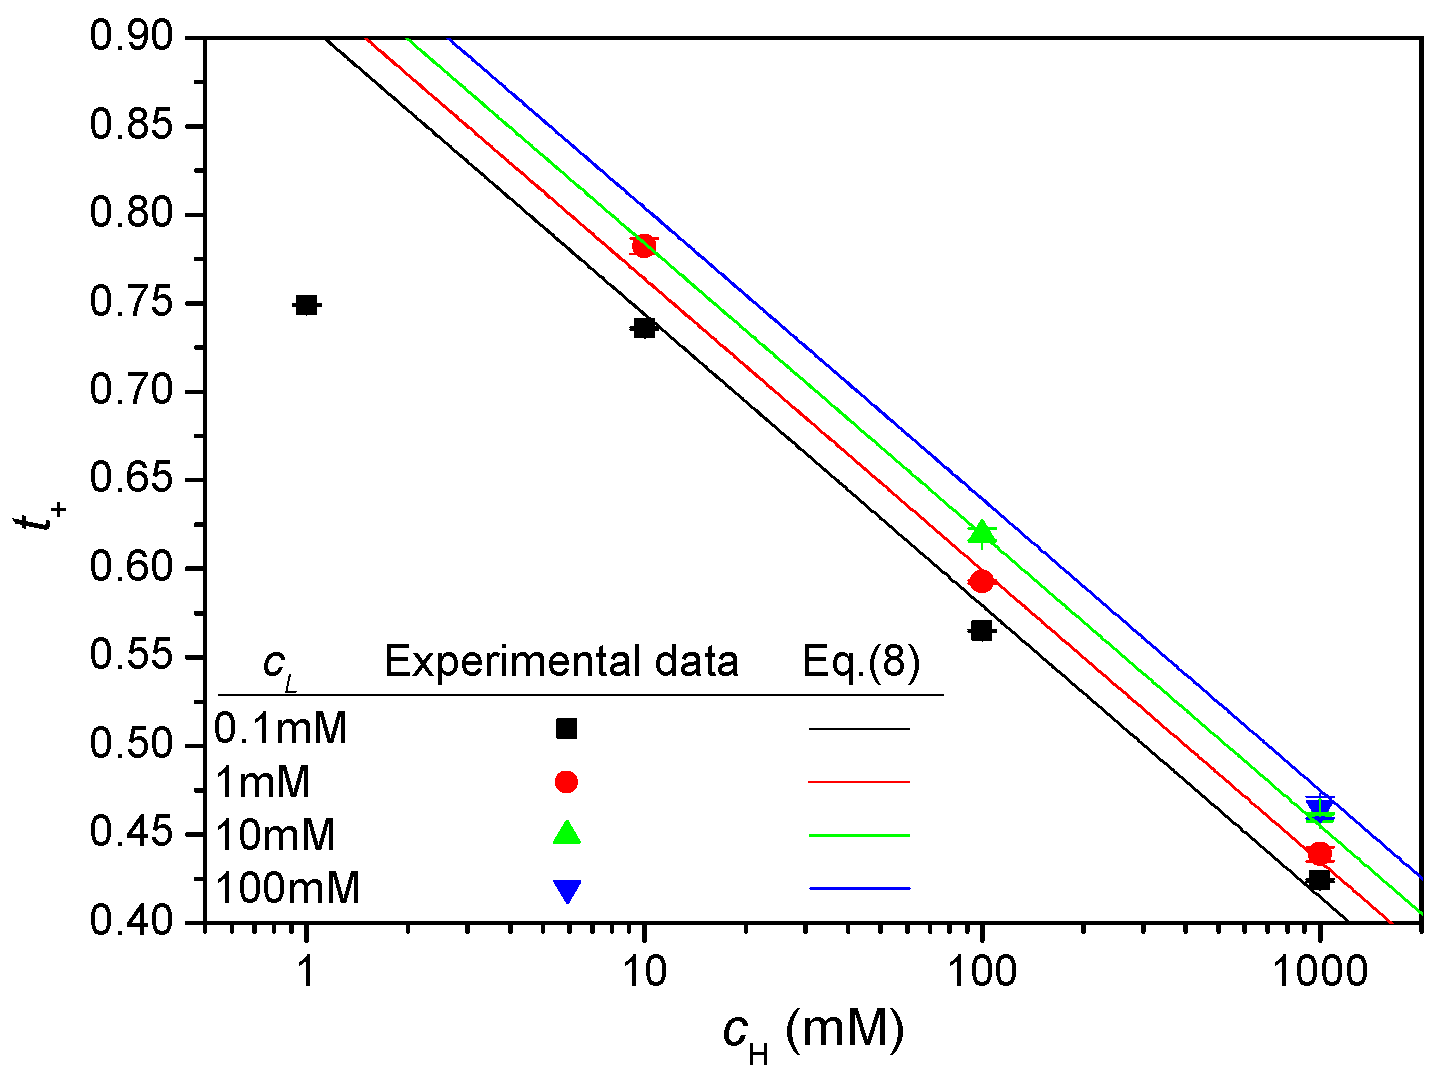
Figure 7 shows that
t+ strongly depends on
cH for various
cL. At the high-concentration limit (
cH ≈ 1),
t+ is almost equal to that of the bulk solution (
t+ ≈ 0.4). As
cH decreases,
t+ increases because the effect of the fixed anionic groups, which have an affinity for cations, increases as their density increases compared to the bulk ion concentration [
28,
29]. From the experimental data, we obtained an empirical correlation for
t+ using a least-squares fit:
Figure 7 also shows
t+ calculated using Equation (8). The calculated values agree well with the experimental data when
cH and
cL are >10 mM.
Figure 7.
Transference number for various concentrations of both NaCl solutions.
Figure 7.
Transference number for various concentrations of both NaCl solutions.
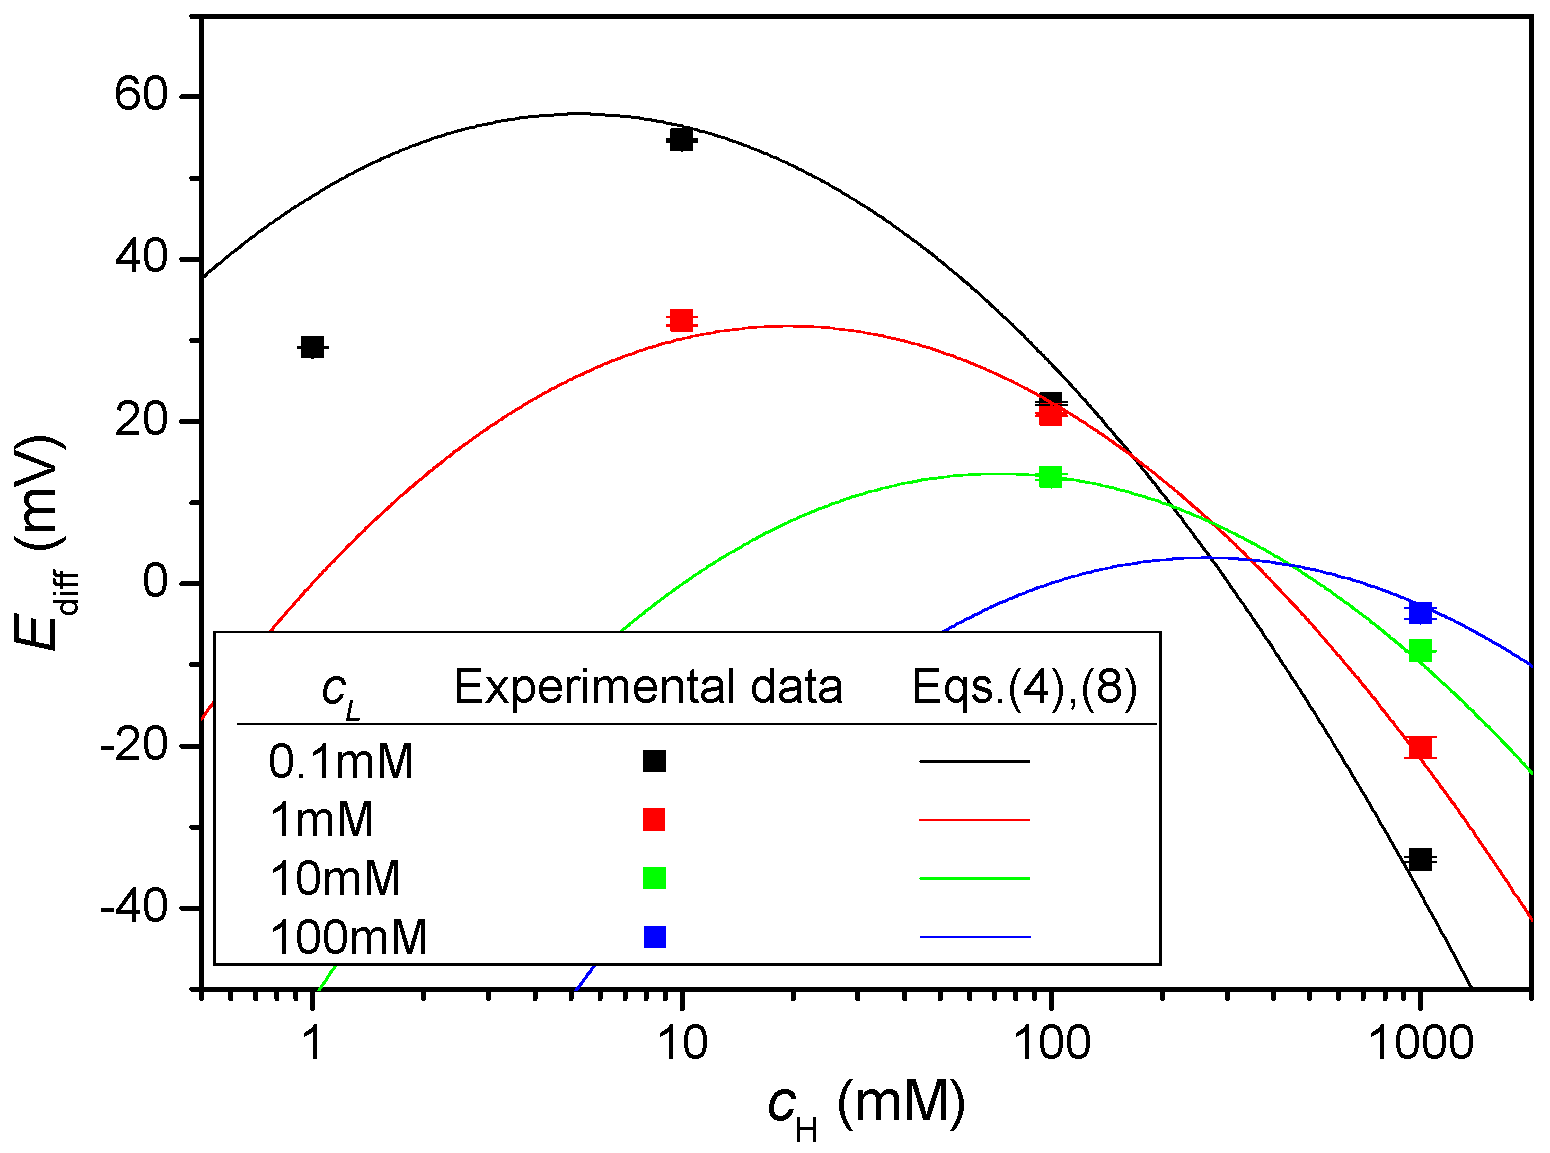
(2)
Figure 8 presents
Ediff as a function of
cH and
cL.
Figure 8 shows that
Ediff is maximized at a particular concentration of the concentrated solution (
cH). This effect is seen in Equation (4) where ln(γ
cHcH/γ
cLcL) increases as
cH increases while 2
t+ − 1 decreases.
Figure 8 also shows
Ediff calculated using Equations (4) and (8) and that those values match the experimental data well when
cH and
cL are >10 mM.
Figure 8.
Open circuit voltage for various concentrations of both NaCl solutions.
Figure 8.
Open circuit voltage for various concentrations of both NaCl solutions.
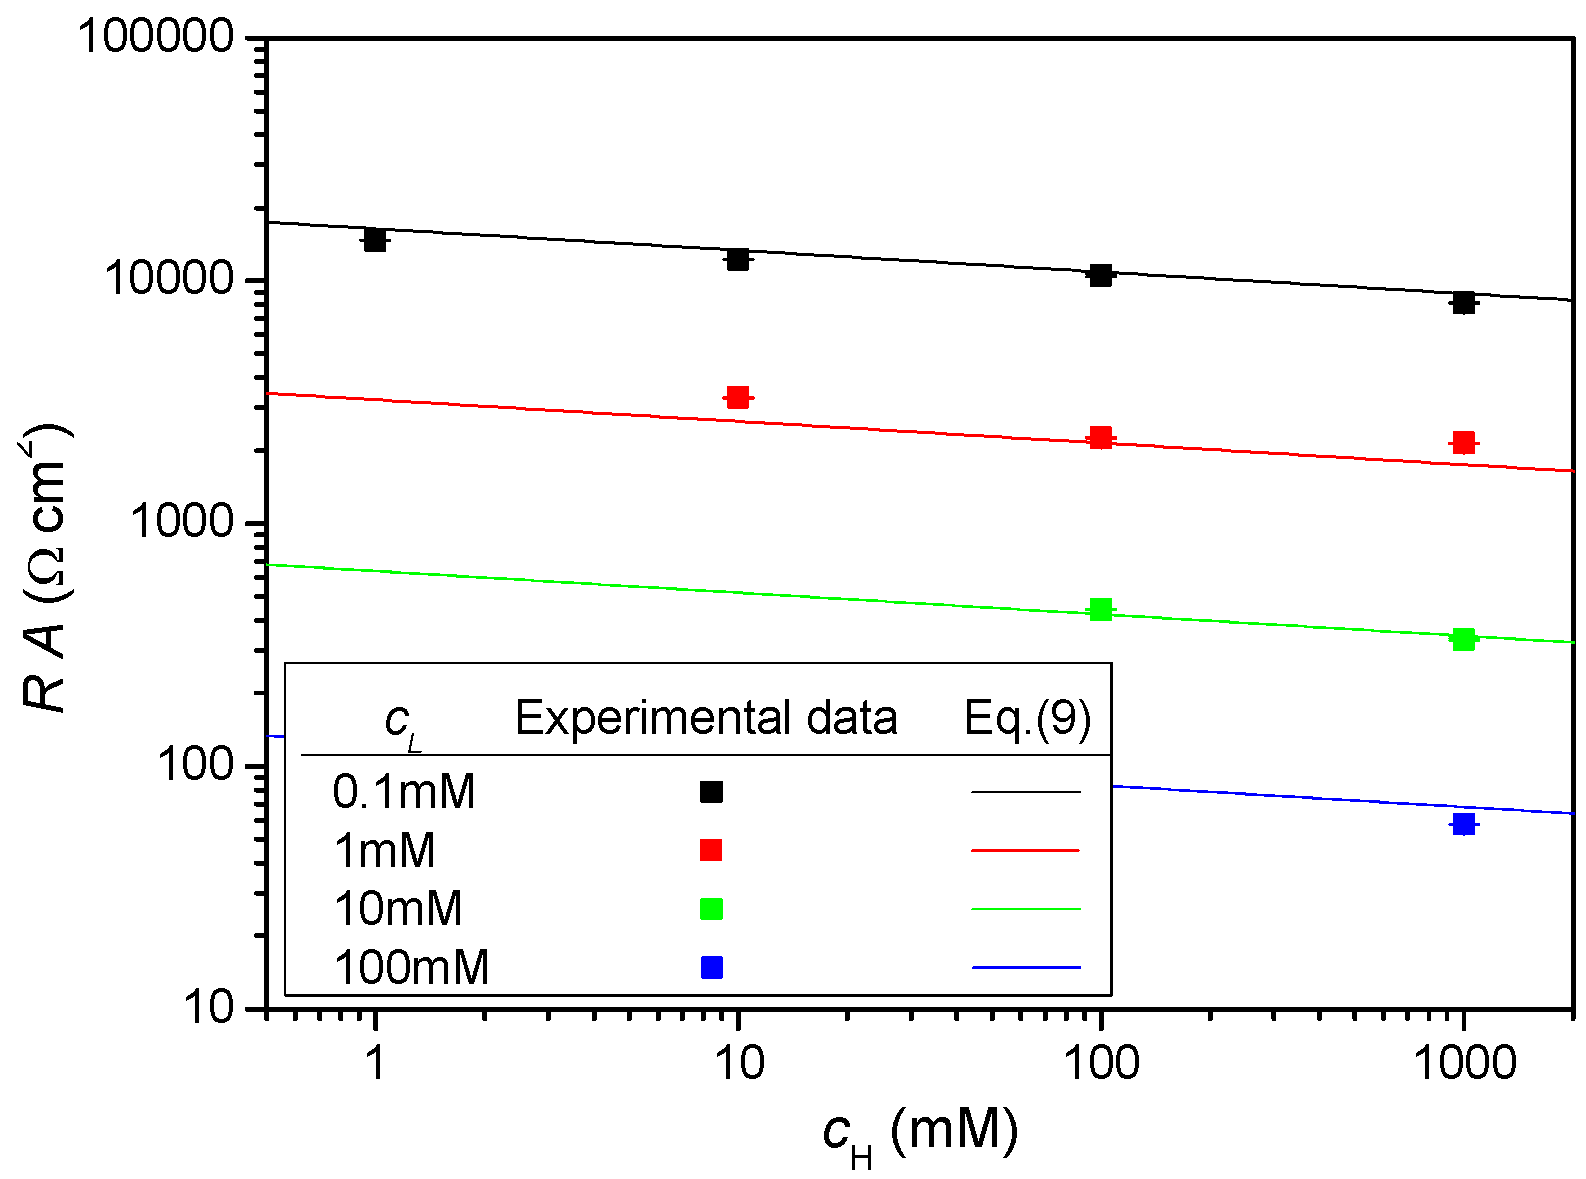
(3)
Figure 9 presents the resistance per unit cross-sectional area multiplied by the total cross-sectional area of the membrane,
RA, as a function of
cH for various
cL. As
cH and
cL increase, the bulk concentration of ions in the silica layer increases, which causes
R to decrease.
R has a strong dependence on
cL and a weak dependence on
cH. We obtained an empirical correlation for
RA by fitting the experimental data to the following equation:
Figure 9 also shows
RA calculated using Equation (9) and that the results agree well with the experimental data.
Figure 9.
Area-specific resistance for various concentrations of both NaCl solutions.
Figure 9.
Area-specific resistance for various concentrations of both NaCl solutions.
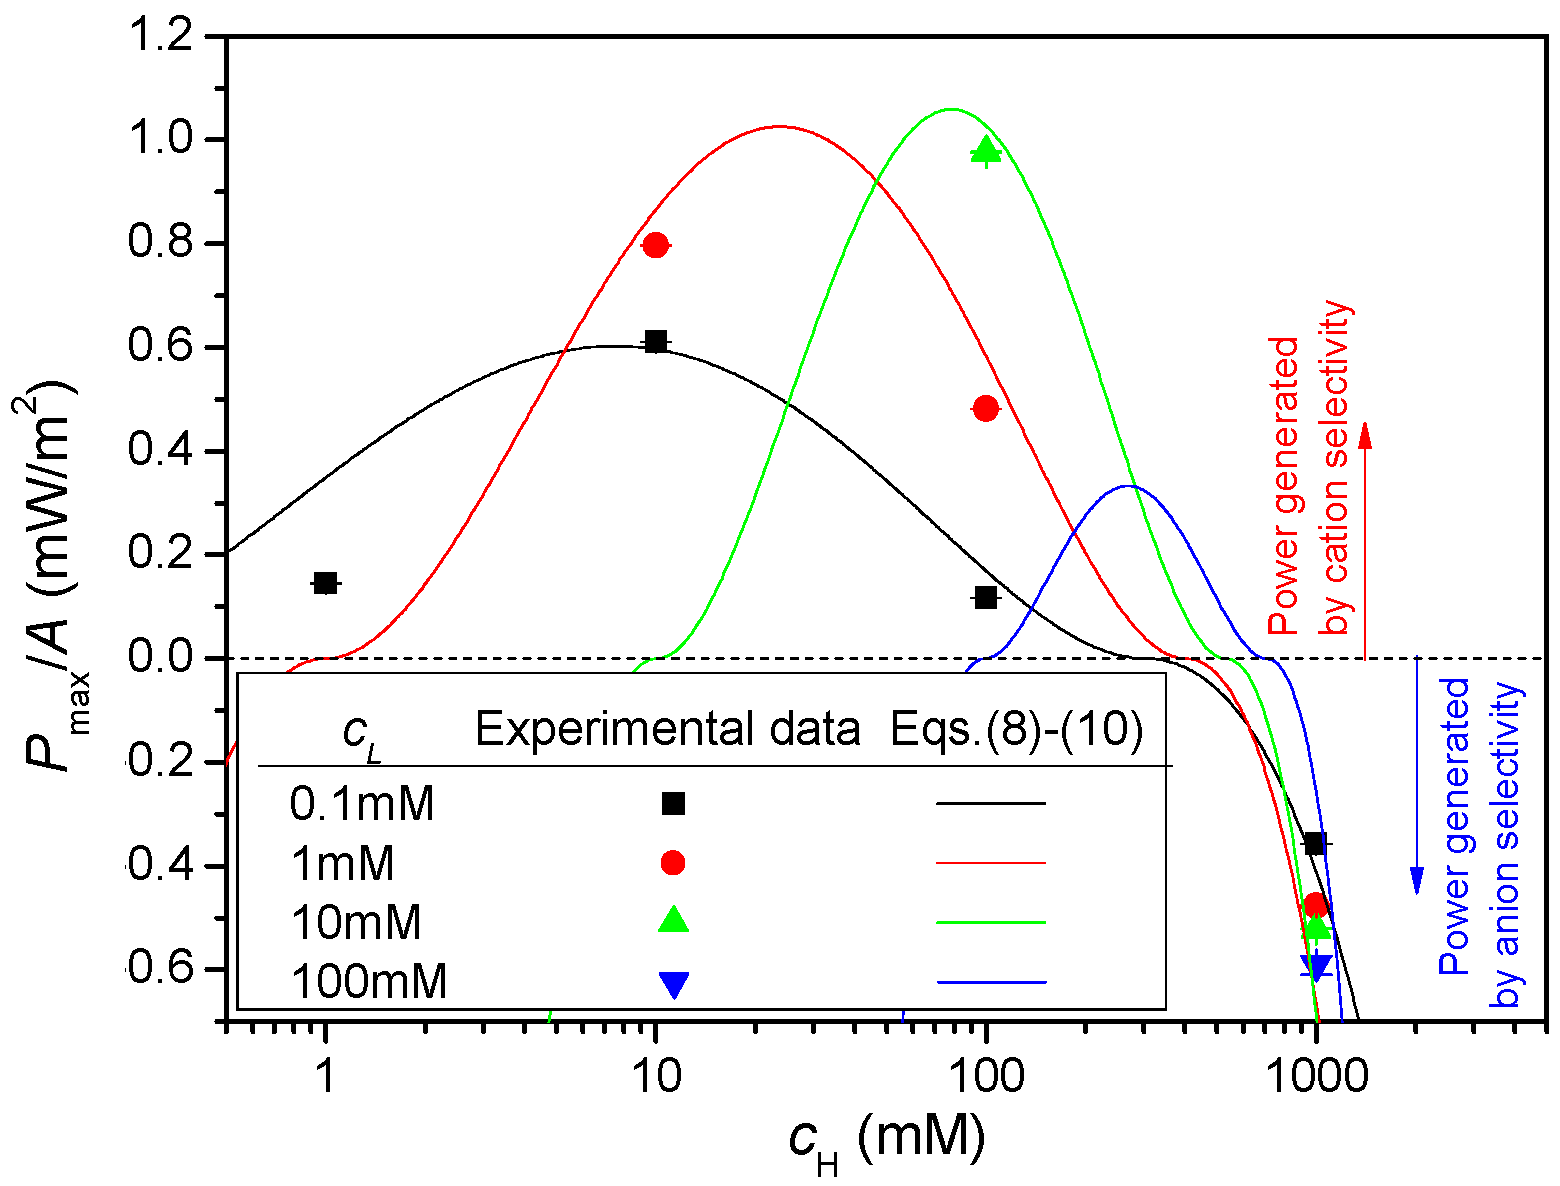
(4)
Figure 10 shows the maximum power output per unit cross-sectional area,
Pmax/
A, as a function of
cH for various
cL. The highest
Pmax/
A measured was 0.98 mW/m
2 when
cL = 0.1 mM and
cH = 10 mM. By combining Equations (4) and (7),
Pmax is expressed as:
Figure 10 also shows
Pmax/
A calculated using Equations (8)–(10) and that the values agree well with the experimental data. Power is generated at low concentrations because of the cation selectivity of the silica membrane. At high concentrations (
cH = 1 M), ion selectivity of the silica membrane is almost nonexistent, as shown in
Figure 7. However, even in this case, a small amount of power can be generated from the natural anion selectivity of bulk NaCl solutions (
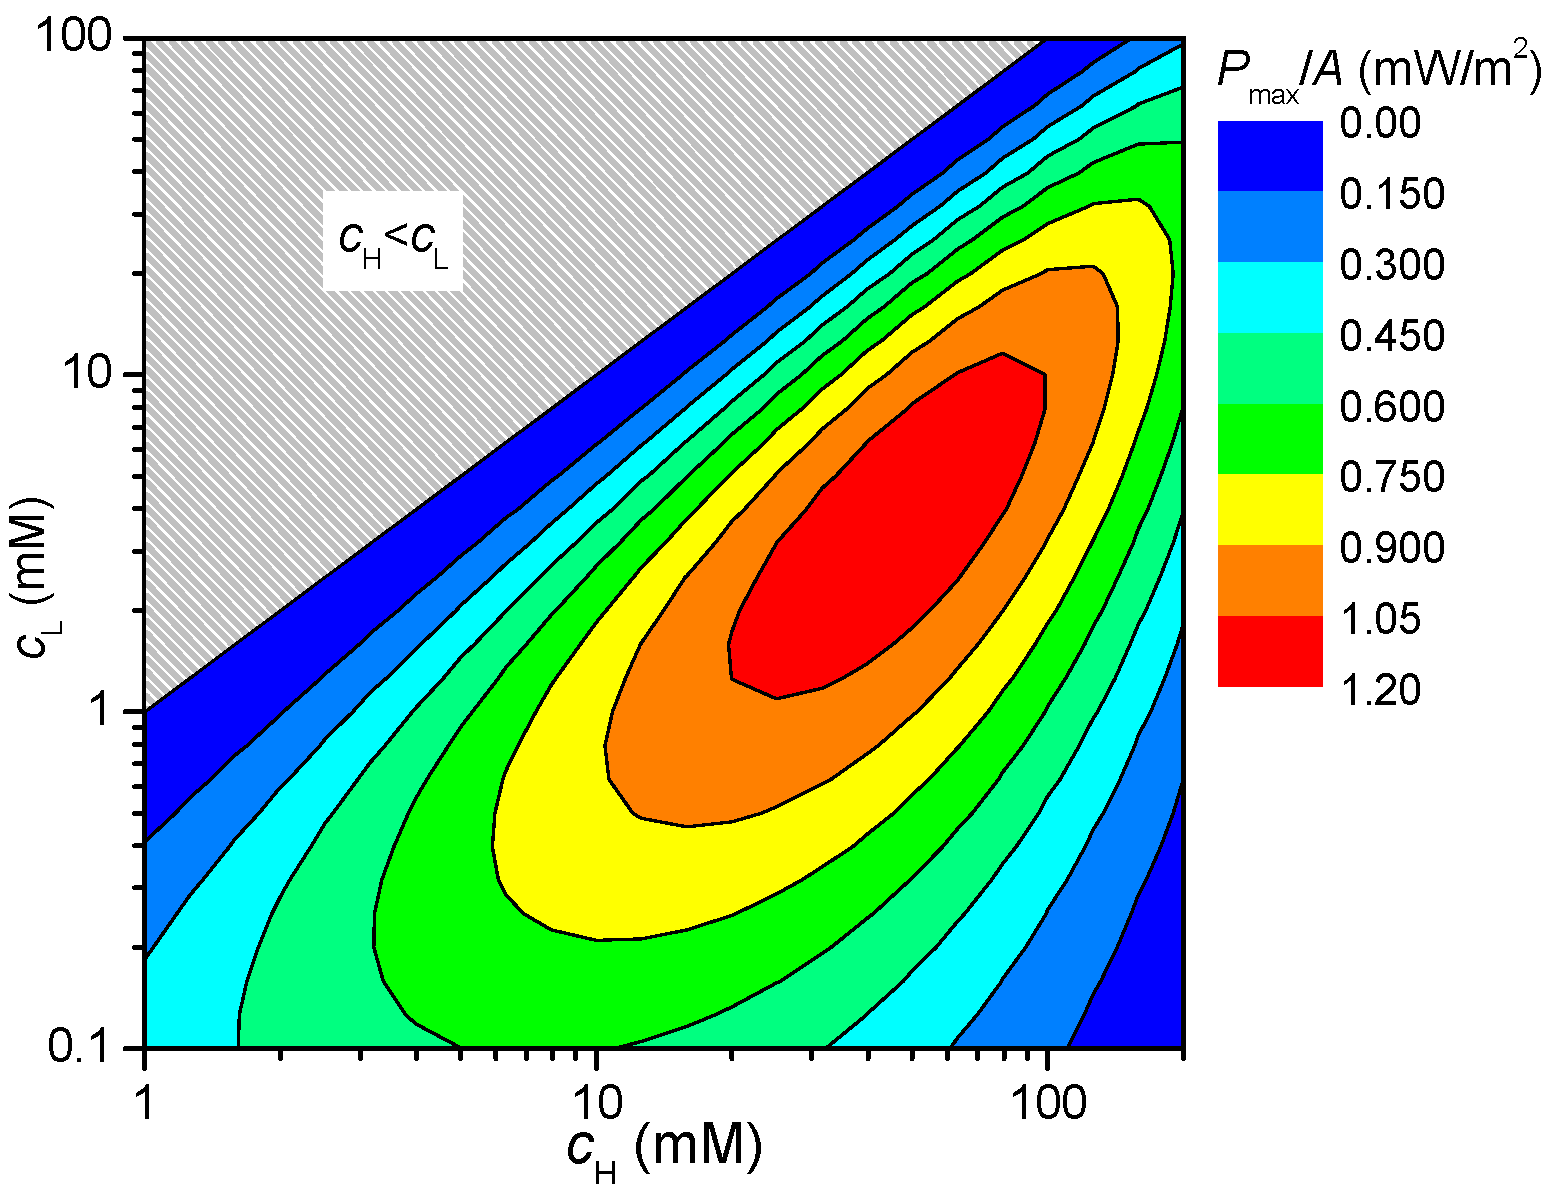
t+ ≈ 0.4). Finally,
Figure 11 shows the contour plots of
Pmax/
A, calculated using Equations (8)–(10), as a function of
cL and
cH. The figure shows that the optimal concentrations at which the power output density is maximum (1.2 mW/m
2) are
cL = 4 mM and
cH = 50 mM. That maximum
Pmax/
A value corresponds to a power output of 2.1 μW because the cross-sectional area of the membrane,
A, used in the present study was 17.3 cm
2. This power output is sufficient to drive low-power circuitry for wireless systems and to power biomedical implant devices [
30,
31]. Therefore, dense silica membranes have the potential for use in nanofluidic and microfluidic systems.
Figure 10.
Maximum power generation density for various concentrations of both NaCl solutions.
Figure 10.
Maximum power generation density for various concentrations of both NaCl solutions.
Figure 11.
Contour map of maximum power generation density as a function of cL and cH.
Figure 11.
Contour map of maximum power generation density as a function of cL and cH.
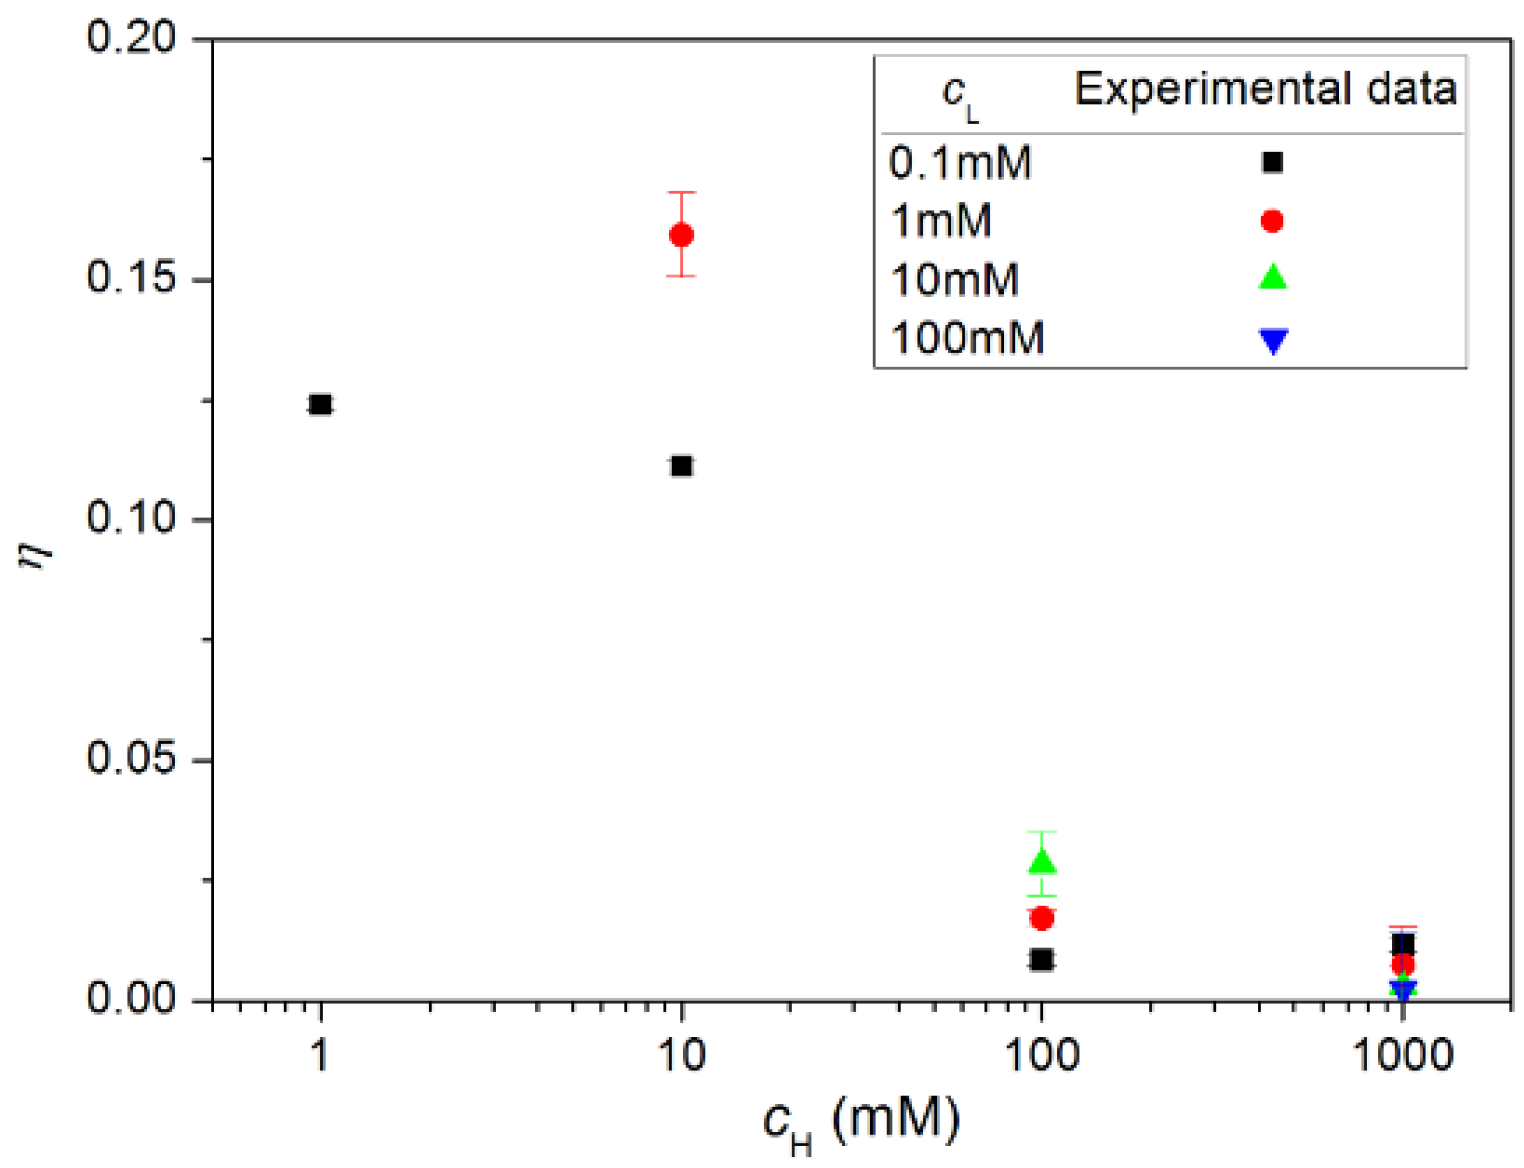
(5)
Figure 12 shows the energy conversion efficiency corresponding to the maximum power generation for various
cH and
cL values. As given in Reference [
32], energy conversion efficiency is defined as the ratio of the output energy (electrical energy) to the input energy (Gibbs free energy of mixing) [
14], as shown in Equation (11):
Here,
J+ and
J− are cation flux and anion flux through the membrane, respectively. The motion of cations and anions through the membrane gives rise to a current. The current is expressed by Equation (12):
The transference number for the cations is defined as the fraction of the electrical current carried by the cations under an applied voltage, according to Equation (13):
In
Figure 6b, we can see that the maximum power is generated when
Rload =
R. From Equations (1) and (3), and
Rload =
R, the voltage corresponding to the maximum power generation satisfies Equation (14):
Finally, by combining Equations (2) and (11)–(14), we obtain Equation (15), a formula for the energy conversion efficiency corresponding to the maximum power generation:
This equation was also used for calculating the efficiency in references [
15,
18]. As shown in
Figure 12 and Equation (15), the highest efficiency is achieved when the transference number is the greatest. The best efficiency obtained in the present study is 16%.
Figure 12.
Energy conversion efficiency for various concentrations of NaCl solutions.
Figure 12.
Energy conversion efficiency for various concentrations of NaCl solutions.


