Article

Research on Heat Recovery Technology for Reducing the Energy Consumption of Dedicated Ventilation Systems: An Application to the Operating Model of a Laboratory

1
School of Environmental Science and Engineering, Tianjin University, Tianjin 300072, China
2
School of Electrical and Energy, Tianjin Sino-German Vocational Technical College, Tianjin 300350, China
*
Author to whom correspondence should be addressed.
Energies 2016, 9(1), 24; https://doi.org/10.3390/en9010024
Submission received: 27 August 2015 / Revised: 25 October 2015 / Accepted: 9 November 2015 / Published: 4 January 2016
(This article belongs to the Special Issue Energy Efficient Building Design 2016)

Abstract

:
In this research, the application of heat pipes in the air handler dedicated to decoupling dehumidification from cooling to reduce energy consumption was simulated and investigated by simulations and experimental studies. The cooling load profiles and heat pipes with effectiveness of 0.45 and 0.6, respectively, were evaluated in achieving the desired space conditions and calculated hour by hour. The results demonstrated that for all examined cases, a heat pipe heat exchanger (HPHX) can be used to save over 80% of the energy during the hours of operation of air conditioning. The overall energy reduction rate was from 3.2% to 4.5% under air conditioning system conditions. It was found that the energy saving potential of a laboratory was higher than for other kinds of buildings. Therefore, the dedicated ventilation system combined with heat recovery technology can be efficiently applied to buildings, especially for laboratories in subtropical areas.

1. Introduction

Southern China is a subtropical region with long, hot and humid summers. A conventional air-conditioning system using cold-coils to handle sensible heat and latent heat must operate at extremely low effective coil temperatures to remove moisture by condensation on their surface. To achieve this, the supply air is typically run at a low temperature (10–12 °C dry-bulb) and close to saturation (90%–95% relative humidity (RH)) to consume additional energy for reheating. In subtropical and tropical regions, it is common to see that space temperatures are typically on the colder side, tending to about 23 °C and space RH is usually on the higher side, from 70% to 75% [1], which increases the risk of catching diseases. In a typical residential building, air conditioning accounts for 25% of the energy consumption [2]. The data obviously indicate that energy saving methods which can reduce energy consumption for air conditioning would be extremely valuable.
Air conditioning systems are commonly used for laboratories in Southern China and other places all around the world. This practice is particularly inefficient for the Southern China situation. Given that the electricity that air conditioning system needs to produce a known rate of cooling increases with the incoming temperature of the medium for condenser cooling, the high outdoor air temperature, about 35 °C in summer, is one of the reasons. At the same time, the high outdoor air humidity, about 95% in summer, is another reason. These two reasons lead to a decline in the coefficient of performance (COP) of most air cooled units to the range of 2.2–2.4 [3].
The operating principle of a heat pipe heat exchanger (HPHX) is simple, but it would be complicated to establish HPHX systems by combining them with the use of dedicated ventilation systems. There are numerous parameters affecting its performance. In this study, the combined use of a HPHX with a dedicated ventilation system is proposed. A heat pipe is a passive heat transfer device with no mechanical components [4,5,6,7]. Thus no energy input is required. A design incorporating a heat recovery device into a wind tower and an integrated system that uses a rotating thermal wheel for heat recovery at the base of the wind tower was proposed by O’Connor et al. [8]. The results showed that with the heat obtained from the exhaust part of the airstreams and shifted to the incoming airstream, raising the temperature 2 °C, this passive recovery system had the potential to reduce the demand for space heating systems. Riffat and Gan [9] carried out some tests on the performance of three types of heat-pipe heat recovery unit for naturally-ventilated buildings. Their results revealed that the effectiveness was affected by air velocity, the shape of fins and the pipe arrangement. Hughes et al. [10] investigated natural ventilation streams typically found in domestic buildings which used heat pipe technology to recover the energy from them. The results demonstrated the prospects for pre-cooling by 15.6 °C and a recovery of 3.3 °C using the proposed system could assist in reducing energy consumption loads from the heating, ventilating and cooling parts. The system also provided a significant energy reduction for domestic buildings. A heat recovery system utilizing a combination of heat pipes and a heat sink was incorporated into a multidirectional wind tower proposed by Calautit et al. [11]. This research showed that passive cooling with heat pipes can improve indoor air quality.
These applications are mostly for heat recovery and for enhancing the dehumidification capabilities to save cooling and reheating energy. This is to virtually decouple outdoor air dehumidification from space sensible cooling. Yau [12,13,14,15] carried out a series of experimental and simulation studies to estimate the performance of a vertical and an inclined combined heat pipe-chilled water coil system. On the basis of the control strategy, a dedicated outdoor air-chilled ceiling (DOAS-CC) system which can optimize the whole system performance was discussed by Ge et al. [16], and the optimal strategy obtained optimized control variables which can enhance the system energy performance and maintain indoor thermal comfort. In another study by Gendebien et al. [17], a model of an air-to-air heat exchanger dedicated to domestic mechanical heat recovery ventilation was designed, which revealed the influence of the humidity on the evolution of the latent and sensible heat transfer rates and strategies to avoid freezing in the heat exchanger.
In order to enhance the air quality of the space and gain energy saving potential, the feasible use of heat pipes for decoupling dehumidification from cooling was investigated by the authors [18]. Although the effectiveness of heat pipes was different, the results showed that an energy saving potential of more than 70% during the air-conditioning operating hours could be obtained; during which only 0.03% to 6.3% of the time the decoupling objective cannot be achieved (abbreviated as NHRS). A simplified model associating the NHRS with the effectiveness of heat pipes was created based on the results of that research. Another study by the authors [19] concerned the use of HPHX to obtain potential energy savings in cinemas. The results also showed that heat pipes could be used to save more than 60% of the energy during the air-conditioned hours. Thus, the reduction in overall energy is from 1.5% to 2.8% for the whole system in cinemas.
All the related literature provides a series of discussions about passive heat recovery in indoor spaces and the use of heat pipes for passive cooling or pre-cooling in indoor spaces which improves indoor air quality. Some different technologies with heat recovery were also presented. In comparison with the related literature and the two previous studies by the authors, the objective of this study was to demonstrate that the heat pipe combined with a dedicated ventilation system for air-conditioning of fresh air (FA) under the demand conditions could minimize additional dehumidification in an indoor air handler, so this method could avoid additional energy consumption for reheating and dehumidification for laboratories located in Southern China. On the basis of the thermal insulation performance of the laboratory model and the occupancy, the decoupling of dehumidification from cooling capacity was established and evaluated under various operating conditions, not only by simulation part but also in the experimental part in this paper. This paper also provides comparisons and discussions of the effects of heat pipes combined with a dedicated ventilation system for different buildings.

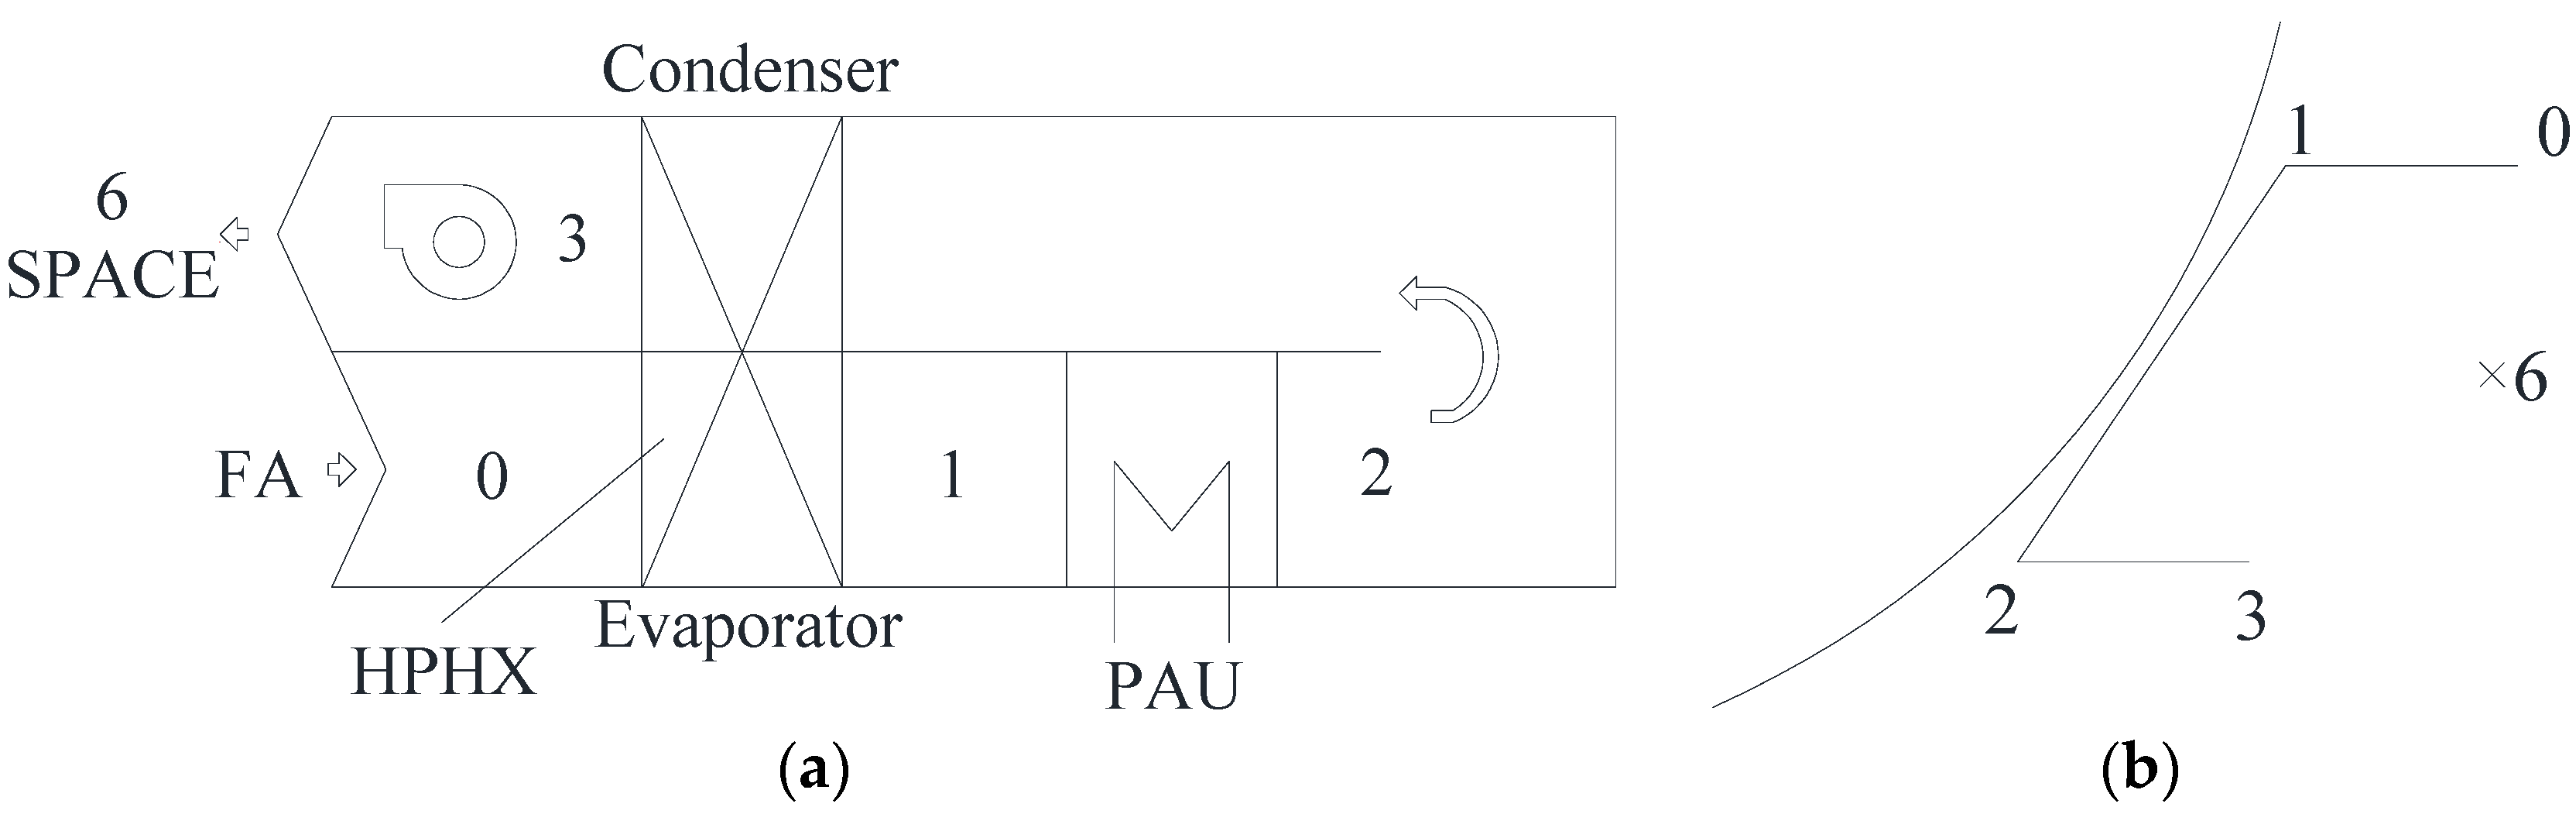
2. Dedicated Ventilation System Based on Heat Recovery Technology

The schematic diagram and the air treatment processes of the proposed system are shown in Figure 1. The conventional system adopts a direct-expansion (DX) method to cool and dehumidify the FA from state 0 to state 2, and subsequently reheat it to the desired conditions (state 3), though this additional reheater is often omitted in actual installations sacrificing the thermal comfort. For the proposed HPHX system, a HPHX will be adopted to pre-treat the FA. As shown in Figure 1, FA (state 0) will be pre-cooled by the evaporator side of the HPHX (state 1), then subsequently cooled and dehumidified to state 2 by DX. After being reheated at the condenser side of the HPHX (state 3), the dried and cooled FA will be supplied to the space (state 6) in the best conditions to satisfy all of the latent load and part of the sensible load of the space which can meet the design conditions.
Figure 1. (a) The schematic diagram of the fresh air (FA) treatment with heat pipe heat exchanger (HPHX); (b) the air treatment processes of the FA with HPHX in the psychrometric chart. 0: FA; 1: pre-cooled air; 2: cooled air; 3: re-heated air; 6: space air.
Energies 09 00024 g001
The pre-cooling process of the heat pipe must improve the cooling capability of the air conditioner, and the re-heating process must supply free reheat energy for the overcooled air. The moisture removal capability of the DX in the dedicated ventilation systems can be improved if the FA is pre-cooled before reaching it. The psychrometric processes comparison between the conventional and HPHX systems is shown in Figure 2.
Figure 2. The conventional and HPHX systems compared in the psychrometric chart. Conventional system: 0-2-3; HPHX system: 0-1-2-3; h0, 1, 2, 3 = air enthalpy, kJ/kg; w0, 1, 2, 3 = air moisture content at the various states, kg/kg; Cpa = air specific heat, kJ/kg·K; t0, t1 = air temperature, °C.
Energies 09 00024 g002

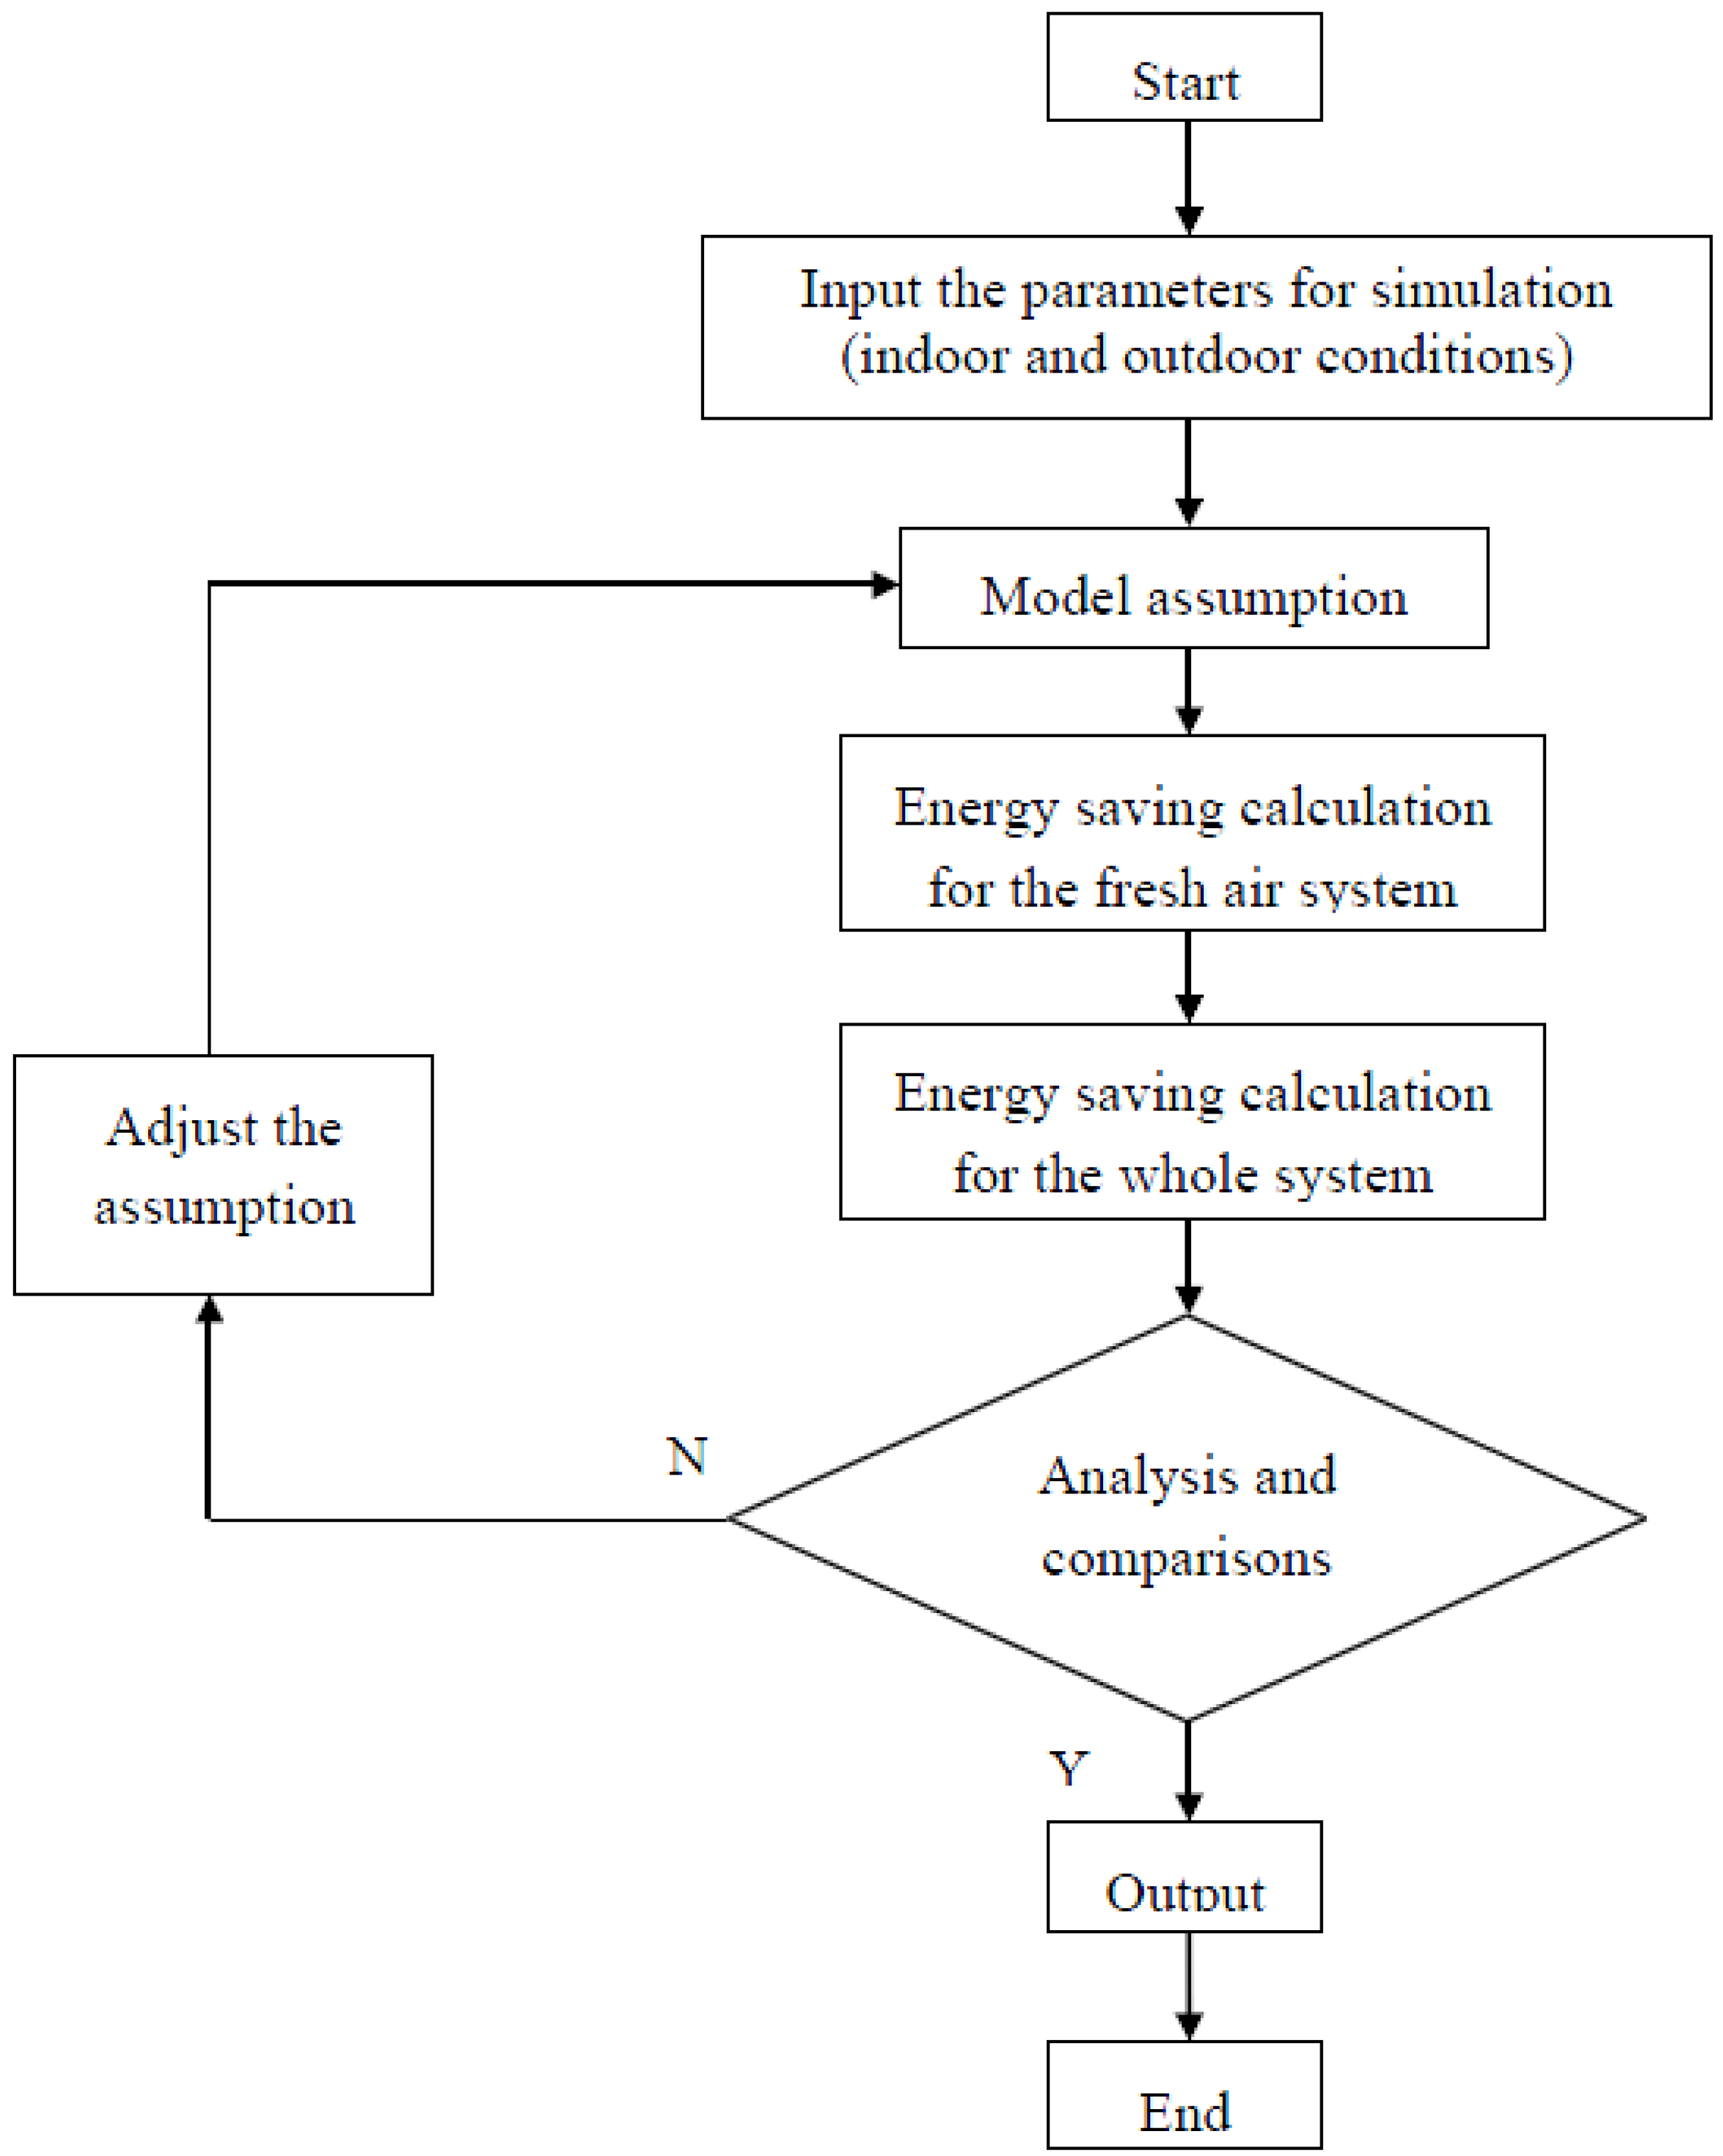
3. Simulations and Calculations

The availability of laboratories’ cooling load performance is significant for evaluating the feasibility and for calculating the energy saving potential with the use of the proposed system. Based on the latest survey of the design conditions which are obtained from typical laboratories, 10 laboratories can provide a representative picture about the design values used in Southern China, so the air conditioning system characteristics and the occupancy profiles of 10 laboratories have been identified as sample and representative parameters. All the parameters used for the simulation are listed in Table 1.
Table 1. The parameters used for the simulation.
ParametersLaboratory
12345678910
Indoor temperature (°C)22222222222222222222
Indoor relative humidity (RH) (%)50505050505050505050
Lighting load (W/m2)2345510551010
Small power load (W/m2)2013.81520171617172020
Occupancy (m2/person)88777.57.55444
Ventilation rate (L/s/person)13.5812.420191515151515
The complicated performances of laboratories 1 to 10 located in Southern China were respectively modeled using the HTB2 simulation software. HTB2, an energy consumption simulation software based on the system heat balance method, was developed by the Welsh School of Architecture at Cardiff University. It was developed for both modelling and monitoring the thermal environment of modern low energy buildings. It encompasses a general shift in emphasis from gross energy usage to the performance of the building environment and the operation of the building as an interacting system [20,21]. The simulation outputs include the hourly cooling profiles, the space sensible and latent loads, the ventilation sensible and latent loads, and the space thermal conditions. Together with the hourly outdoor air temperatures (t0) of Southern China, the performance of HP at different effectiveness when achieving the desired room conditions, and the potential energy benefits can be evaluated by the use of the equations from the Section 3.1 and Section 3.2 energy saving calculations. The simulation initial and set conditions namely indoor and outdoor conditions which have been listed in Table 2 must be in line with the experimental conditions.
Table 2. The thermal conditions. Fresh air: FA.
ConditionsParametersRange
Indoor conditions (design conditions)TR22 °C
RHR50%
Outdoor conditionsTo25 to 35 °C at 2.5 °C intervals
RHo50% to 80% at 10% intervals
Airflow rateVFA0.1 to 0.3 m3/s at 0.05 °C intervals
This paper chose the manufacturers’ performance data [22,23] in order to evaluate HPHX effectiveness. The details of the heat pipes used are summarized in Table 3. It is noted that the heat pipe with effectiveness values of 0.45 and 0.6 was selected for further evaluation as it was the most readily available in the project. The assumptions of the models applied to analyze the energy saving potential of the proposed system are as follows:
(a)
They have the same state point (0 to 6) in the two systems.
(b)
The DX, in the conventional system, carries out its normal cooling and dehumidifying functions (from 0 to 2), but with improved latent capacity because of the pre-cooling function of the HPHX.
(c)
Air transport occurs adiabatically between the DX and HPHX.
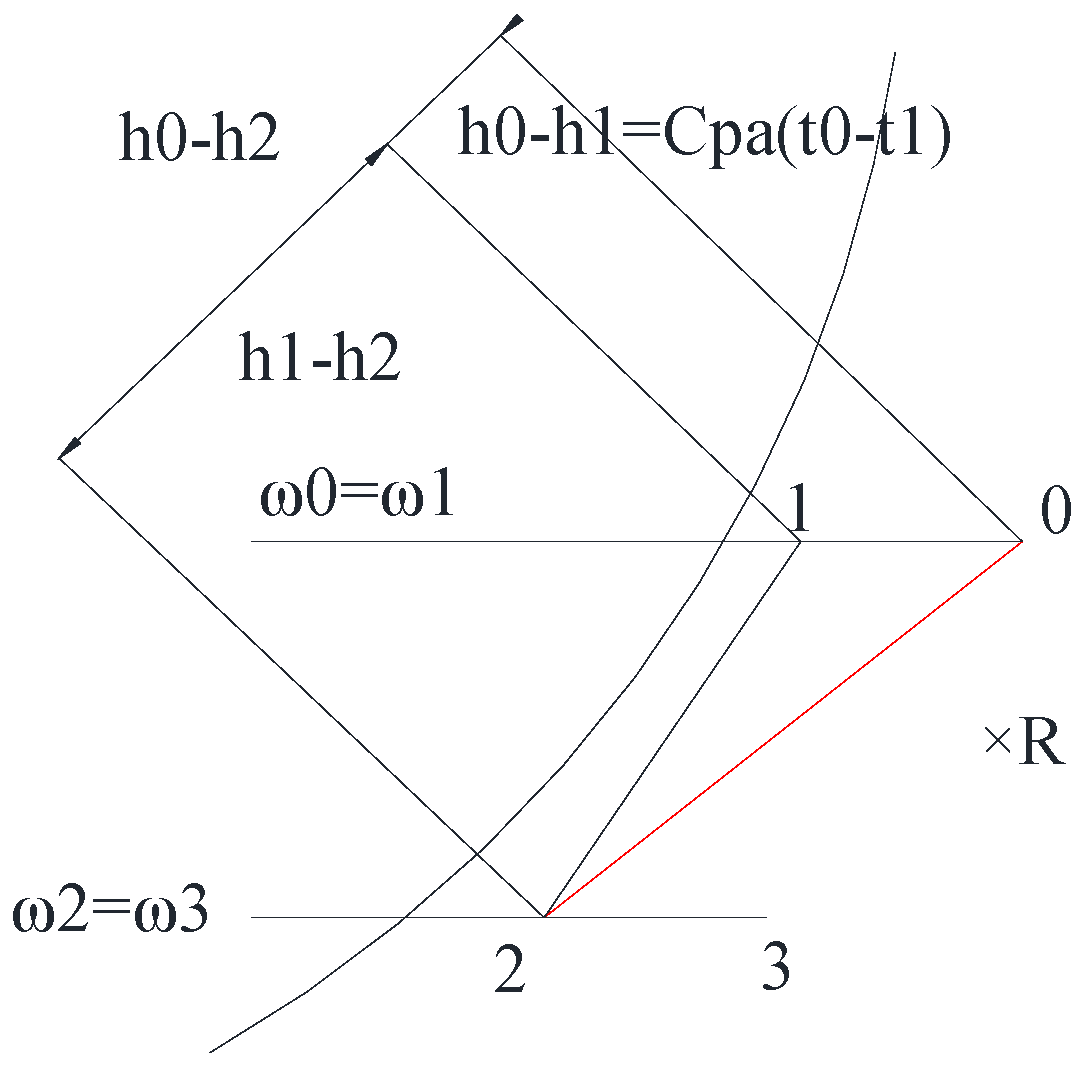
(d)
The energy transfer rates are equal and opposite {namely (h3-h2) = (h0-h1) because the air mass flow rates are equal} in the two parts of the HPHX.
(e)
The chamber has considerable latent loads which are essential to the reheating part of the traditional system.
(f)
Air properties including the specific heat and density are constant throughout.
Table 3. Details about the heat pipes used.
TypeHLSV—500—60
Basic dimensions (mm)W1000W1500W2500
H481
L300
Material of frameQ235Material of pipeCuMaterial of finAl-
Arrange of heat pipe11Row6Column--
Weight (kg)43
RefrigerantR134a
The modeling and simulation procedure is shown in Figure 3.
Figure 3. The flow diagram of the modeling and simulation procedure.
Energies 09 00024 g003

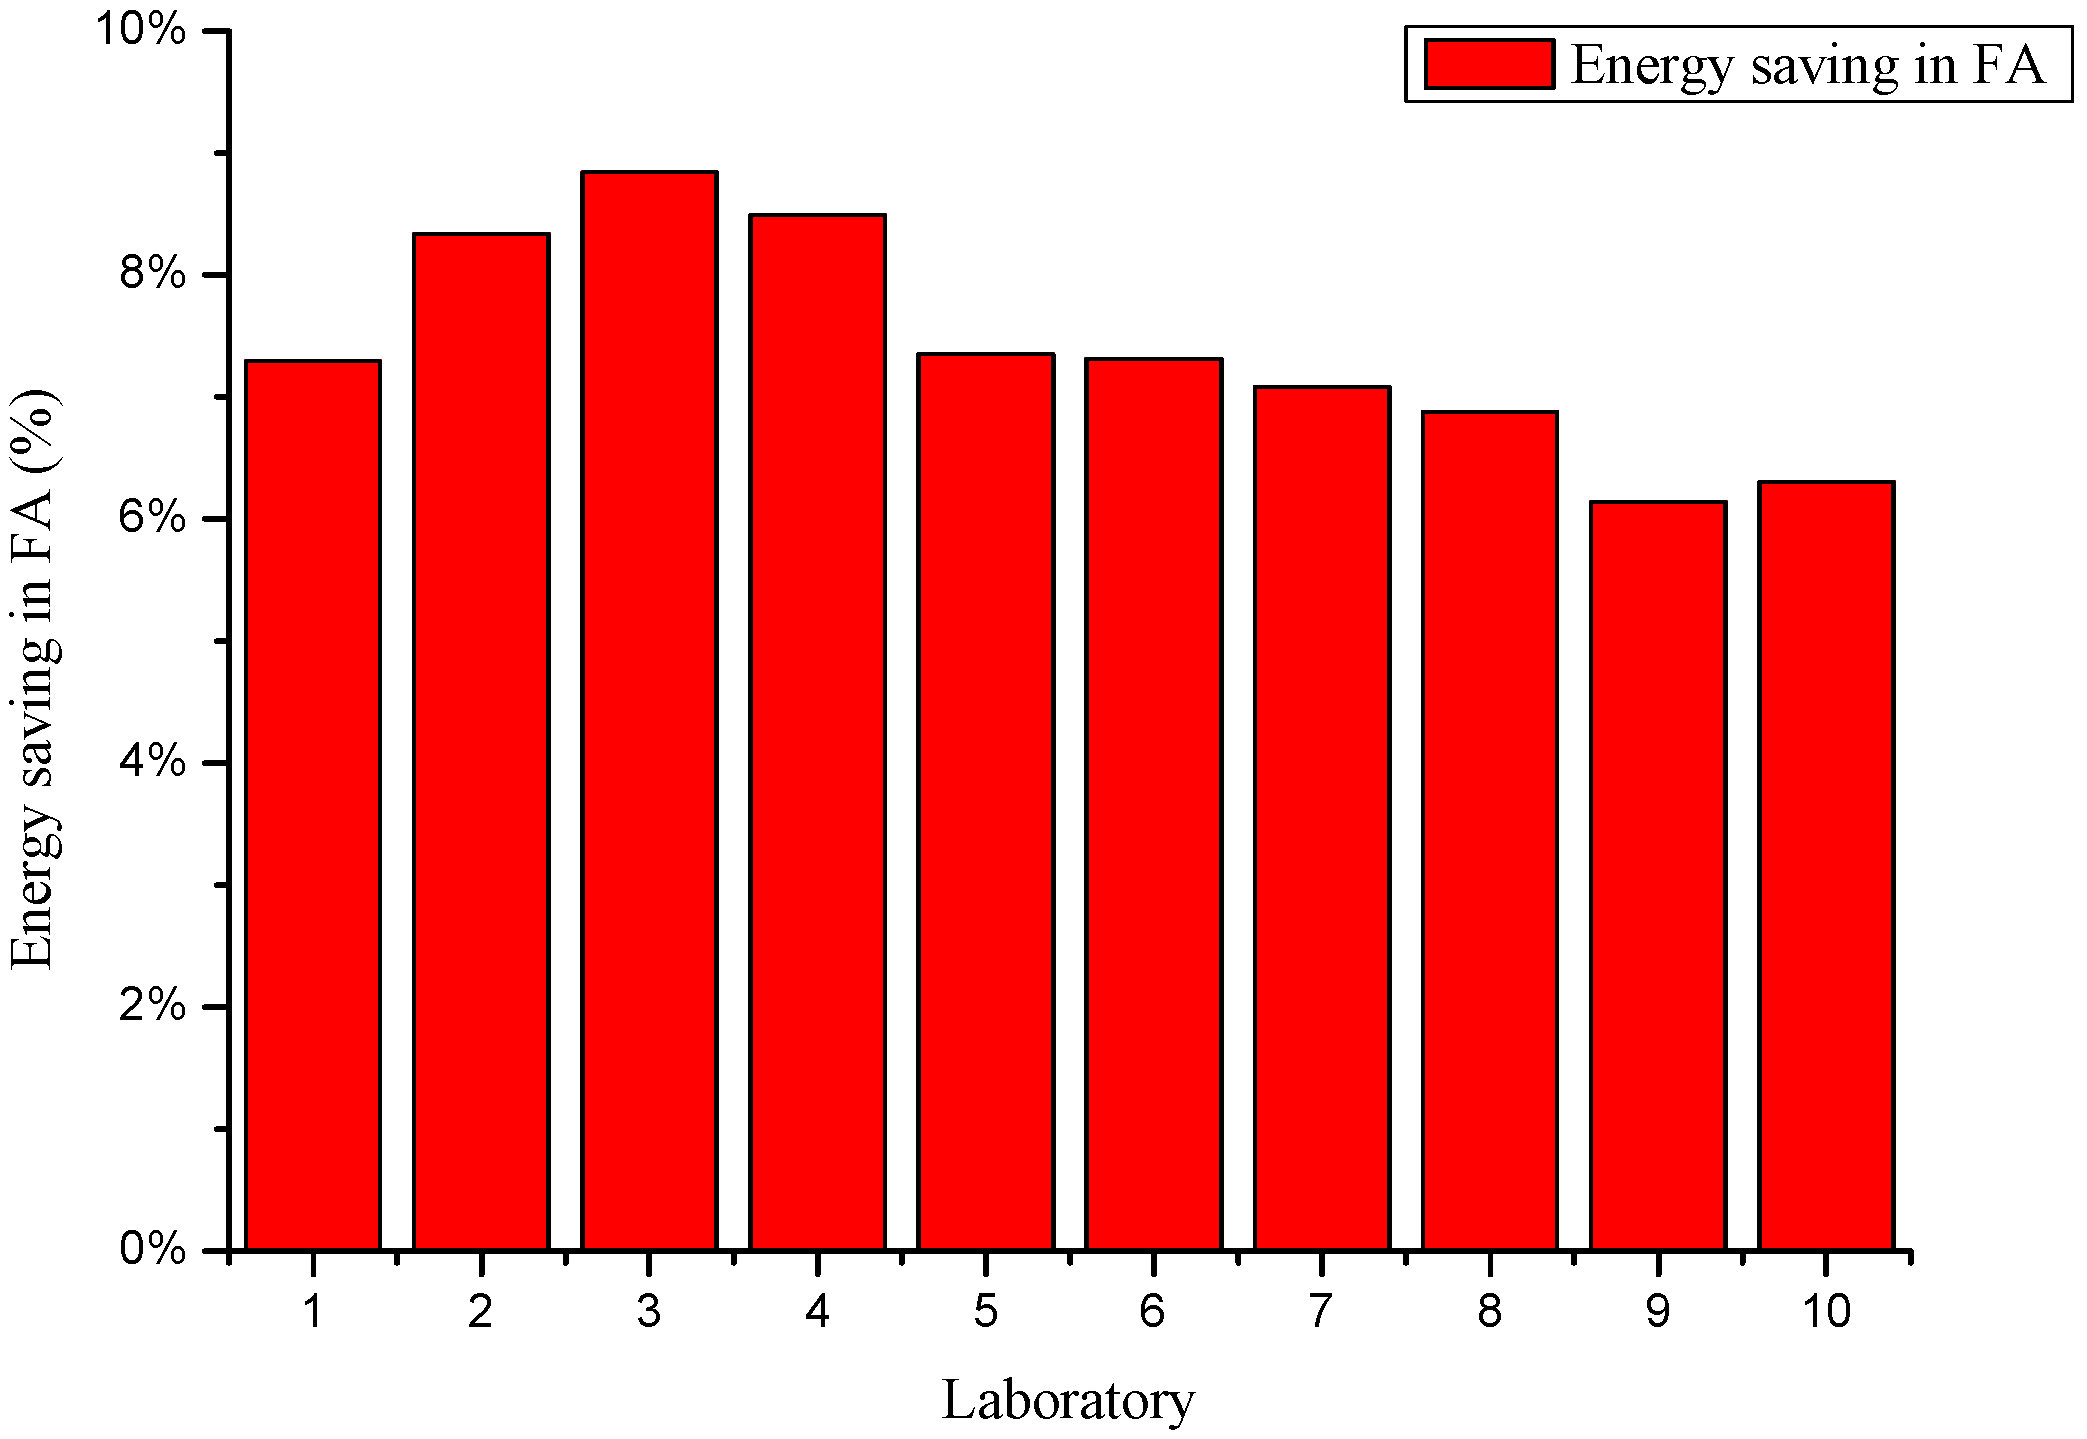
3.1. The Energy Saving Calculations for the Fresh Air (FA) System

Without the HPHX, the net total cooling and reheating load for FA treatment, QDXN,O and HDX,O, would be:
Q DXN,O ( τ ) = ρ V FA ( h 0 ( τ ) h 2 )
H DX,O ( τ ) = ρ V FA C pa ( t 3 ( τ ) t 2 )
where:
  • ρ = air density, kg/m3;
  • Cpa = air specific heat, kJ/kg·K;
  • VFA = FA supply flow rate, m3/s;
  • h0 = outdoor air enthalpy hourly, kJ/kg;
  • h2 = leaving cooling air enthalpy in DX, kJ/kg;
  • t2 = leaving cooling air temperature in DX, °C;
  • t3 = leaving heat pipe condenser section air temperature, °C;
  • τ= time, s.
With the HPHX, when the FA passes through the evaporator side of the heat pipe, the air will be cooled down from t0 to t1, but without any change in its moisture content. The air enthalpy also be changed from h0 to h1 by the evaporator side of HPHX, so the total cooling load in the DX, QDX, becomes:
Q DX = ρ V FA ( h 1 ( τ ) h 2 )
The FA will leave the DX at state 2, which will be reheated by the condenser side of the HPHX, with a temperature t3 (state 3). The air states at state points 0 to 3 are related by:
t 3 = t 2 + η HP ( t 0 ( τ ) t 2 )
t 1 = t 0 ( τ ) ( t 3 ( τ ) t 2 )
ω 0 ( τ ) = ω 1 ( τ )
ω 2 = ω 3
where:
  • t0 = outdoor air temperature, °C;
  • t1 = leaving heat pipe evaporator section air temperature, °C;
  • ηHP = effectiveness of the heat pipe (HP);
  • ωs = air moisture contents at the various states denoted by the subscript, kg/kg (s = 0, 1, 2, 3).
Therefore, once states 0 and 2 are defined, air states 1 and 3 are also defined through Equations (4)–(7). The sensible cooling load and latent cooling load of the net for FA process in the DX is:
Q DX = ρ V FA ( h 1 ( τ ) h 2 )
The reheat load:
HDX = 0
Therefore, the reduction in FA cooling load can be determined from Equations (1) and (8), i.e.,:
Δ Q DX = τ = 1 m Q DXN,O ( τ ) τ = 1 m Q DX = τ = 1 m ρ V FA ( h 0 ( τ ) h 2 ) τ = 1 m ρ V FA ( h 1 ( τ ) h 2 ) = τ = 1 m ρ V FA ( h 0 ( τ ) h 1 ( τ ) )
Equations (2) and (9) decide the energy reduction of the reheat load in FA system, i.e.,
Δ H DX = τ = 1 m H DX,O ( τ ) τ = 1 m H DX = τ = 1 m H DX,O ( τ ) = τ = 1 m ρ V FA C pa ( t 3 ( τ ) t 2 )
Therefore, the energy saving potential of the FA systems is:
Δ Q DX Q DXN,O = Q DXN,O Q DX Q DXN,O = τ = 1 m ρ V FA ( h 0 ( τ ) h 2 ) τ = 1 m ρ V FA ( h 1 ( τ ) h 2 ) τ = 1 m ρ V FA ( h 0 ( τ ) h 2 ) = τ = 1 m ( h 0 ( τ ) h 1 ( τ ) ) τ = 1 m ( h 0 ( τ ) h 2 )
All the FA system energy saving percentage is:
ε 1 = Δ Q DX COP + Δ H DX Q DXN,O COP + H DX,O = Q DXN,O Q DX + COP τ = 1 m ρ V FA C pa ( t 3 ( τ ) t 2 ) Q DXN,O + COP τ = 1 m ρ V FA C pa ( t 3 ( τ ) t 2 ) = τ = 1 m ρ V FA ( h 0 ( τ ) h 2 ) τ = 1 m ρ V FA ( h 1 ( τ ) h 2 ) + COP τ = 1 m ρ V FA C pa ( t 3 ( τ ) t 2 ) τ = 1 m ρ V FA ( h 0 ( τ ) h 2 ) + COP τ = 1 m ρ V FA C pa ( t 3 ( τ ) t 2 ) = τ = 1 m ( h 0 ( τ ) h 1 ( τ ) ) + COP i = 1 m C pa ( t 3 ( τ ) t 2 ) i = 1 m ( h 0 ( τ ) h 2 ) + COP i = 1 m C pa ( t 3 ( τ ) t 2 )
where:
  • COP = coefficient of performance of the FA system;
  • ε1 = energy saving potential of the FA system, %;
  • m = total running hours, h.

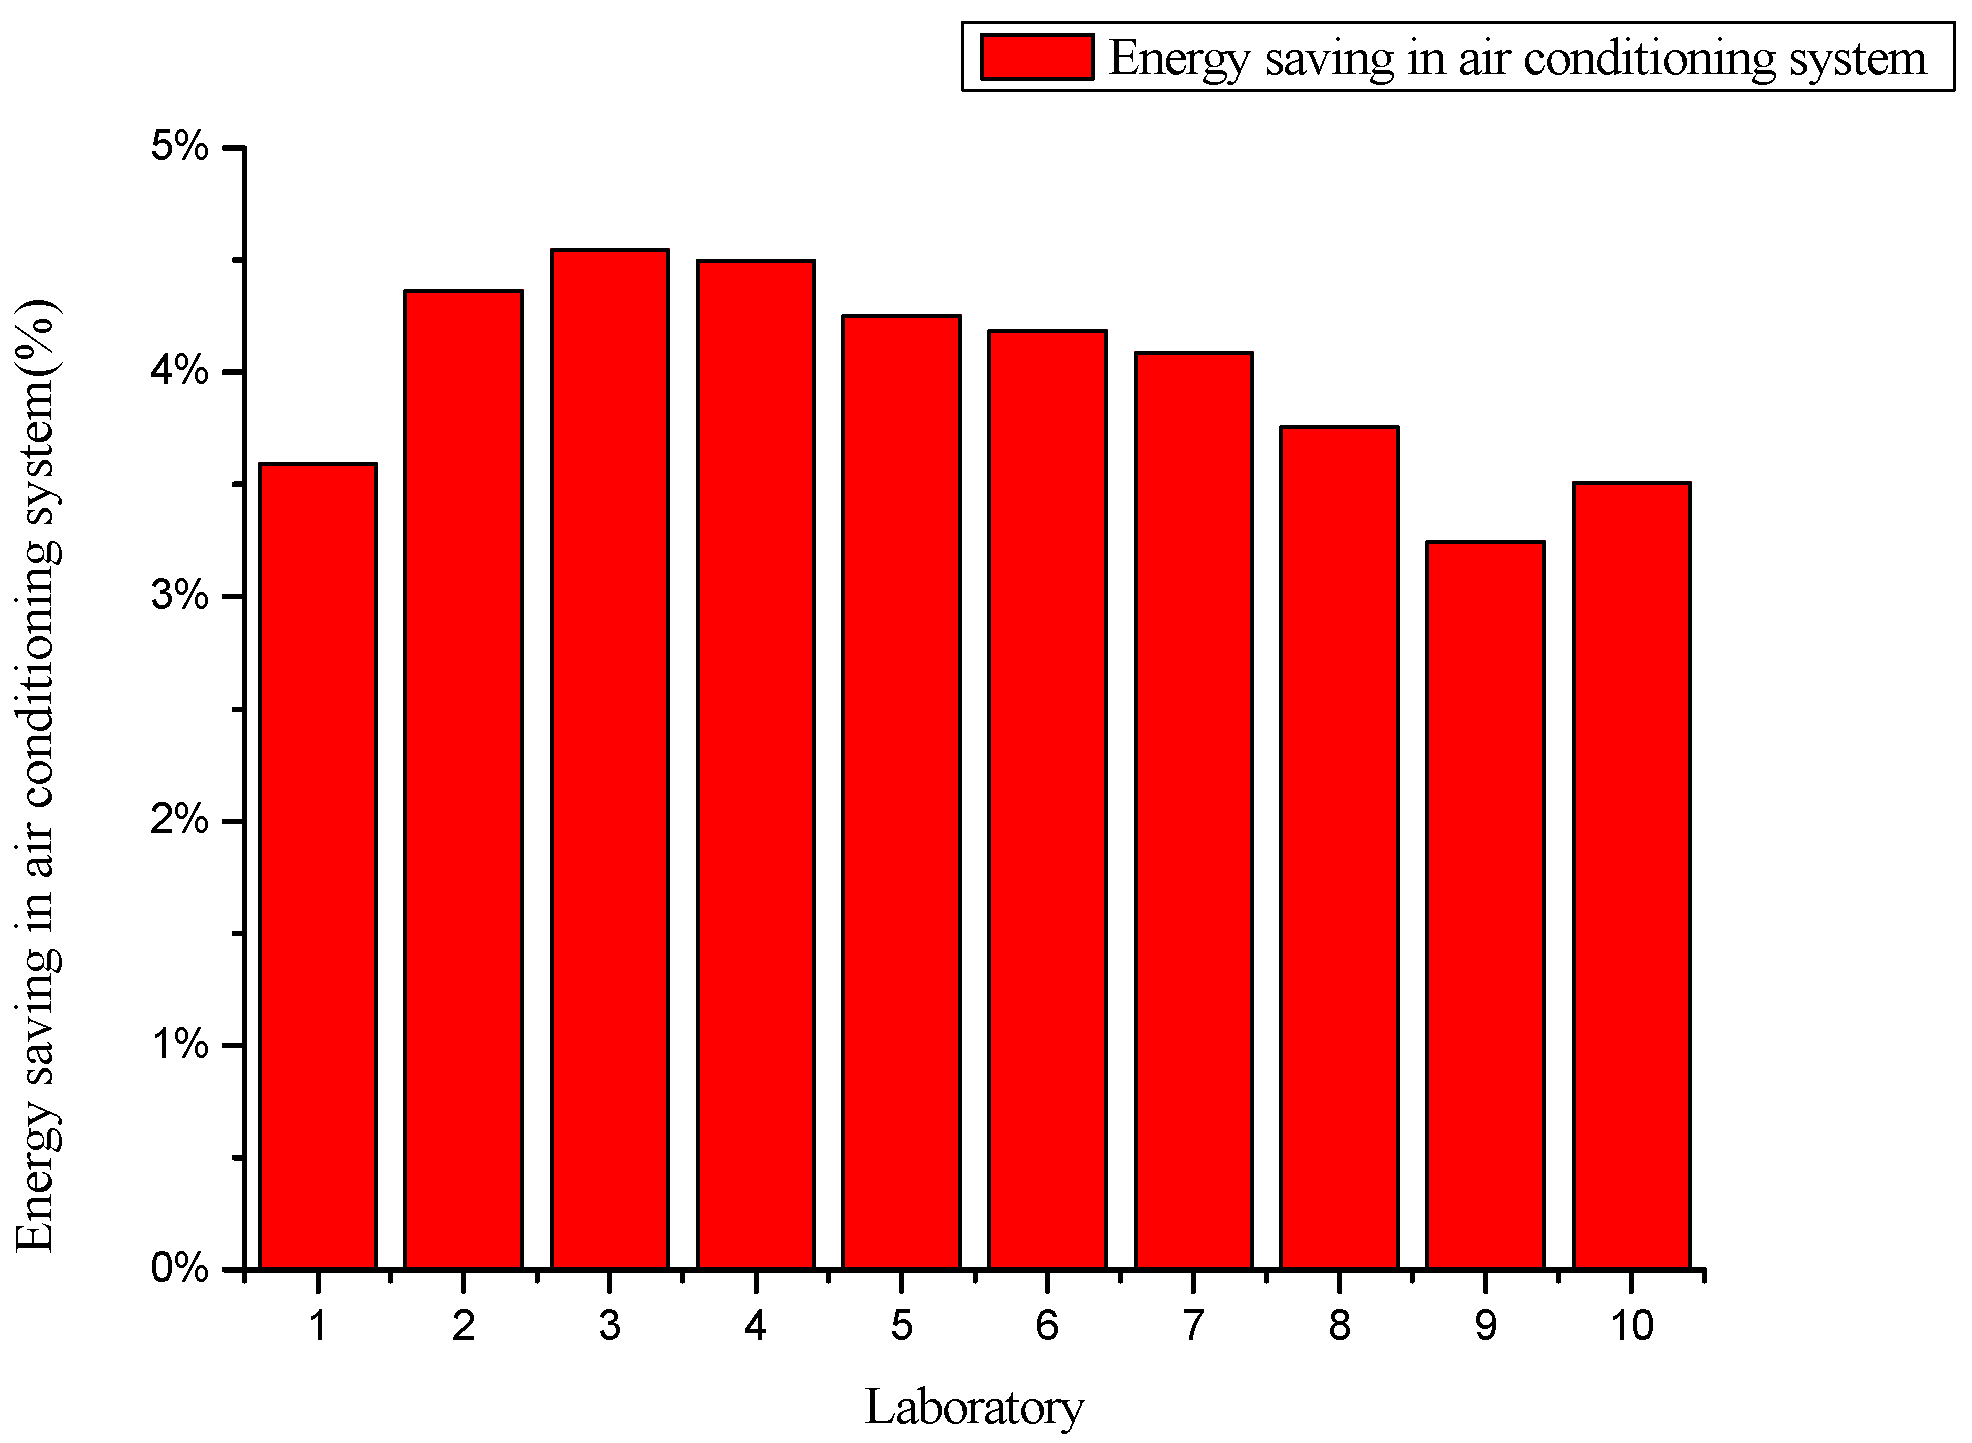
3.2. The Energy Saving Calculation for the Whole System

Without the HPHX, the net total cooling and reheating load for air treatment, QDXN,O, QFCN,O & HDXN,O, would be:
Q DXN,O ( τ ) = ρ V FA ( h 0 ( τ ) h 2 )
H DXN,O ( τ ) = ρ V S ( h 5 ( τ ) h 2 )
where:
  • ρ = air density, kg/m3;
  • VRA = return air supply flow rate, m3/s;
  • VFA = FA supply flow rate, m3/s;
  • VS = supply air supply flow rate, m3/s (VS = VRA + VFA);
  • h0 = outdoor air enthalpy hourly, kJ/kg;
  • h2 = leaving cooling air enthalpy in DX, kJ/kg;
  • h5 = supply air enthalpy hourly, kJ/kg;
  • h6 = space design air enthalpy hourly, kJ/kg.
With the HPHX, the air will be cooled down from t0 to t1 but without any change in its moisture content and the air enthalpy also be changed from h0 to h1 by the evaporator side of HPHX, the total cooling load in the DX, QDX, becomes:
Q DX = ρ V FA ( h 1 ( τ ) h 2 )
The sensible cooling load and latent cooling load of the net for FA process in the DX is:
Q DX = ρ V FA ( h 1 ( τ ) h 2 )
The reheat load:
HDX = 0
Therefore, the reduction in FA cooling load can be determined from Equations (14) and (18), i.e.,:
Δ Q DX = Q DXN,O Q DX = τ = 1 m ρ V FA ( h 0 ( τ ) h 2 ) τ = 1 m ρ V FA ( h 1 ( τ ) h 2 ) = τ = 1 m ρ V FA ( h 0 ( τ ) h 1 ( τ ) )
The reduction in air reheat load can likewise be determined from Equations (16) and (19), i.e.,:
Δ H DX = H DXN,O H DX = H DXN,O = τ = 1 m ρ V S ( h 5 ( τ ) h 2 )
All the system energy saving percentage is:
ε 2 = Δ Q DX COP + Δ H DX Q DXN,O COP + Δ H DX + Q FCN,O COP = τ = 1 m ρ V FA ( h 0 ( τ ) h 2 ) τ = 1 m ρ V FA ( h 1 ( τ ) h 2 ) + COP τ = 1 m ρ V S ( h 5 ( τ ) h 2 ) τ = 1 m ρ V FA ( h 0 ( τ ) h 2 ) + COP τ = 1 m ρ V S ( h 5 ( τ ) h 2 ) + τ = 1 m ρ V RA ( h 6 ( τ ) h 2 )
where ε2 = energy saving potential of the whole system, %.

4. Results and Analysis

4.1. The Energy Simulation Results of Dedicated Ventilation System with Heat Pipe Heat Exchanger (HPHX)

The evaluations satisfied the follow conditions:
(1)
The number of hours when the space is used in one year based on the use of the HPHX for FA treatment.
(2)
The number of hours when the HPHX is applicable.
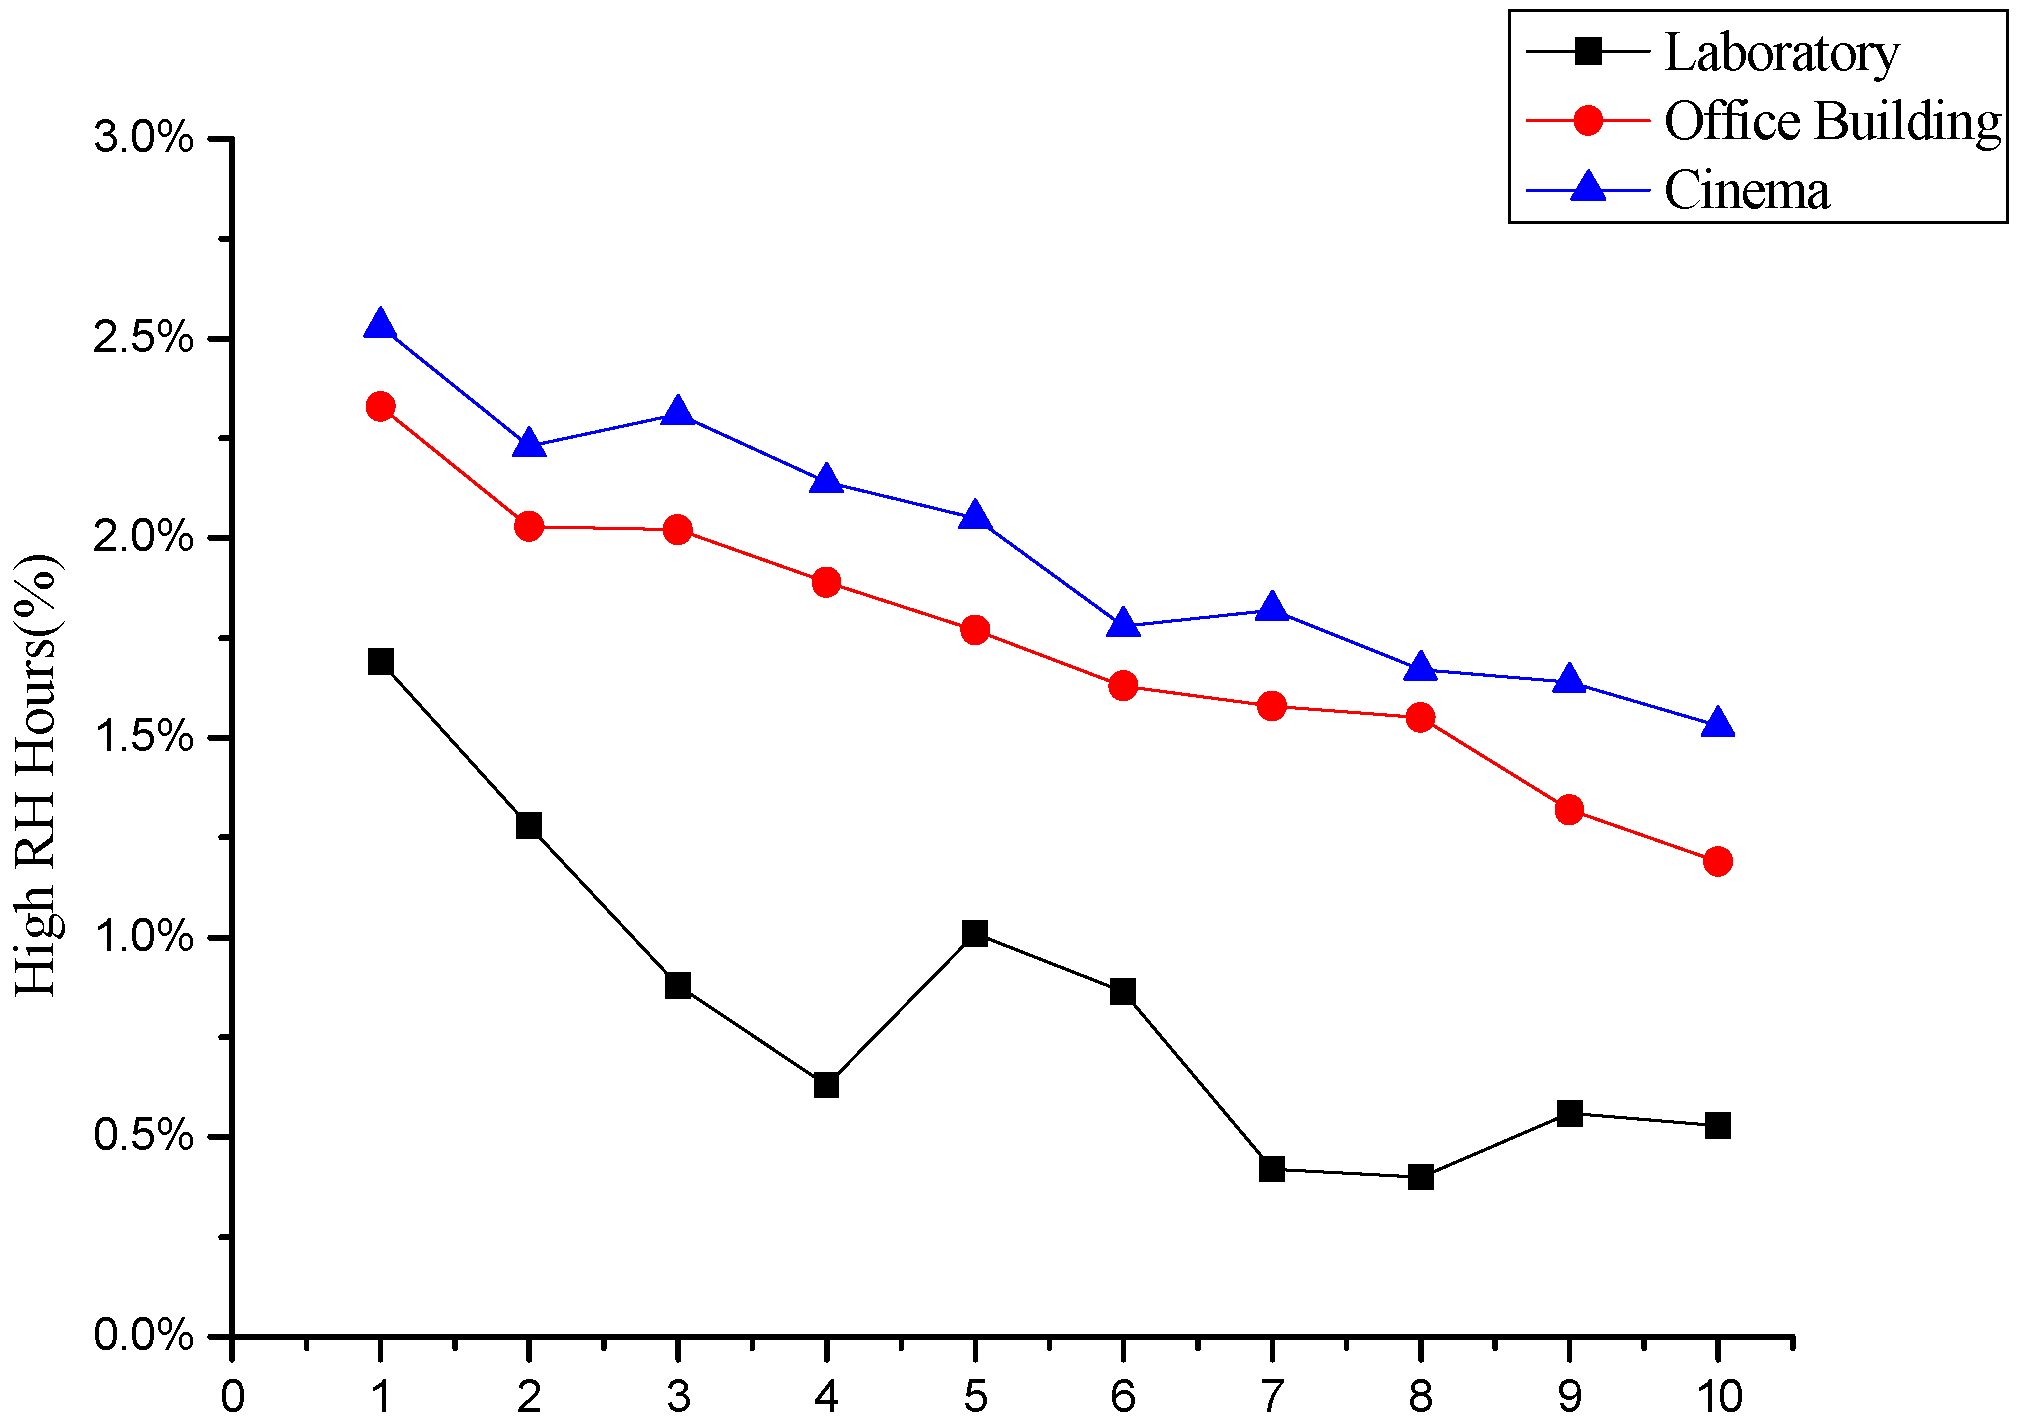
(3)
The indoor air conditions (state 6 in Figure 1b) which were determined by the space peak cooling load in the evaluations must be kept constant.
All the results are shown in Table 4. It can be seen that the characteristic heat pipe effectivenesses of 0.6 (η0.6) and 0.45 (η0.45) were comparable. The number of hours when the HPHX is applicable to save energy ranged from 2155 h to 2282 h (~80%) in 2880 operating hours of the air conditioning system, which corresponds to 0.31%–1.69% the number of hours that the design space conditions cannot be reached. The results demonstrate the feasible use of the HPHX combined with a dedicated ventilation system for laboratories to save energy and to achieve the thermal comfort of space conditions. The heat pipe of effectiveness 0.6 which is more suitable (~30% to 50%) and more compact than that of effectiveness 0.45 could be recommended. Along with some given design and calculation methods of the product manual of the heat pipe [22,23], in the subsequent simulation and experiment, heat pipe of effectiveness 0.6 was chosen.
Table 4. Heat pipe heat exchanger (HPHX) Performance.
LaboratoryLocationIndoor ConditionsApplicable HoursHigh RH Hours% of High RH Hours
Temperature (°C)RH (%)h0.45h0.6h0.45h0.6h0.45h0.6
1Guang Zhou2250%2248228038371.69%1.62%
2Hong Kong2250%2267226729271.28%1.19%
3Hong Kong2250%2282228820200.88%0.87%
4Shen Zhen2250%2209221014140.63%0.63%
5Dong Guan2250%2155215526211.01%0.97%
6Shen Zhen2250%2164226734340.86%1.50%
7Hong Kong2250%22712271990.42%0.40%
8Macau2250%22282232970.40%0.31%
9Zhu Hai2250%2161216125230.56%1.06%
10Hui Zhou2250%2255225712110.53%0.49%
Max-2250%2282228838371.69%1.62%
Min-2250%21552155970.40%0.31%
Mean-2250%22242238.821.620.30.83%0.91%

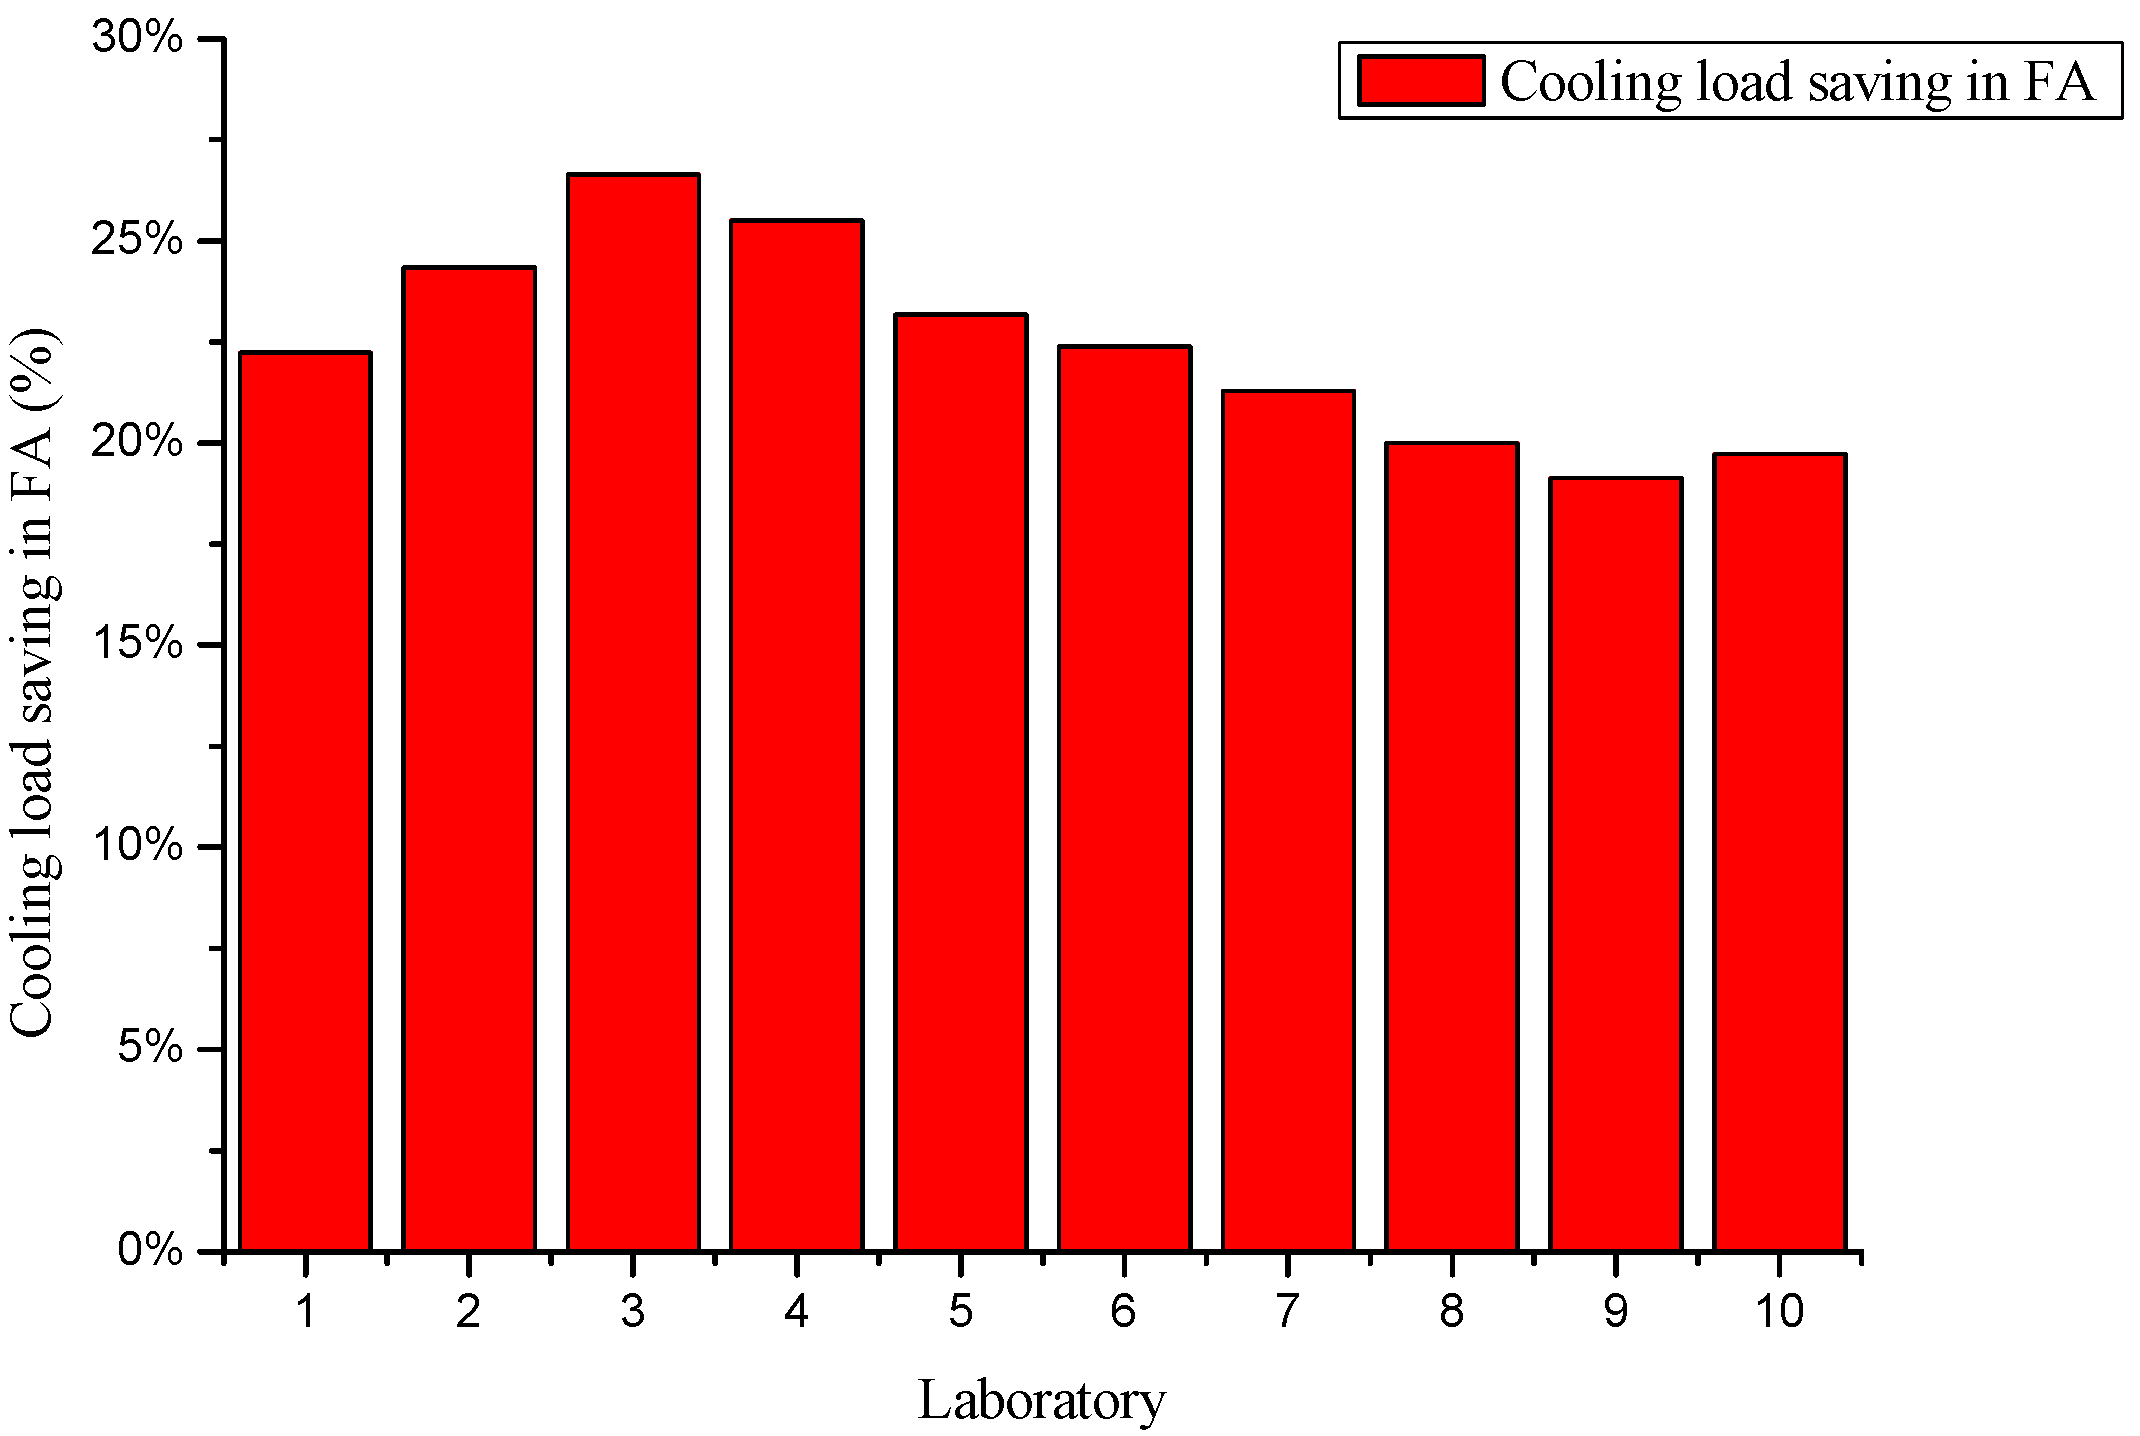
4.2. Energy Saving Potential

The conventional and proposed systems were calculated to achieve the energy saving potential. The use of HPHXs for FA systems can not only reduce the FA load but also the reheating load. The results could be calculated by the use of Equations (10)–(13).
Comparing the conventional and proposed systems, the system with the HPHX undoubtedly would save energy in the FA system portion. If the temperature and the RH satisfied the weather conditions, the HPHX combined with a dedicated ventilation system should reduce the cooling load and reheating load considerably. The reheating equipment would no longer be used because the system contains the HPHX.
The COP of the air conditioning system was assumed to be 2.7 and the efficiency of electric reheating was assumed to be 1. The energy saving (cooling and reheating savings) conversion to electricity savings can use the above assumption. The assumed COP was based on the minimum COP for an air-cooled chiller as specified in the Code of Practice for energy efficiency of air conditioning installations. Figure 4 shows the annual cooling load saving percentage in FA system per area achieved by the use of the HPHX, where the corresponding savings ranged from 20% to 27%. Considering that the FA system contributes to about 30% of the overall consumption for air conditioning in Southern China [24], the energy savings could lead to a reduction of approximately 6%–9% of the total energy use in FA systems which was shown in Figure 5.
Figure 4. FA system cooling load saving percentage.
Energies 09 00024 g004
The total energy saving potential of the air conditioning system was from 3.2% to 4.5%, and could be calculated using Equations (20)–(22). The results are summarized in Figure 6 and confirm the feasibility of using HPHXs in subtropical climates like Southern China for laboratories.
Figure 5. FA system energy saving percentage.
Energies 09 00024 g005
Figure 6. The air conditioning system overall energy saving percentage.
Energies 09 00024 g006

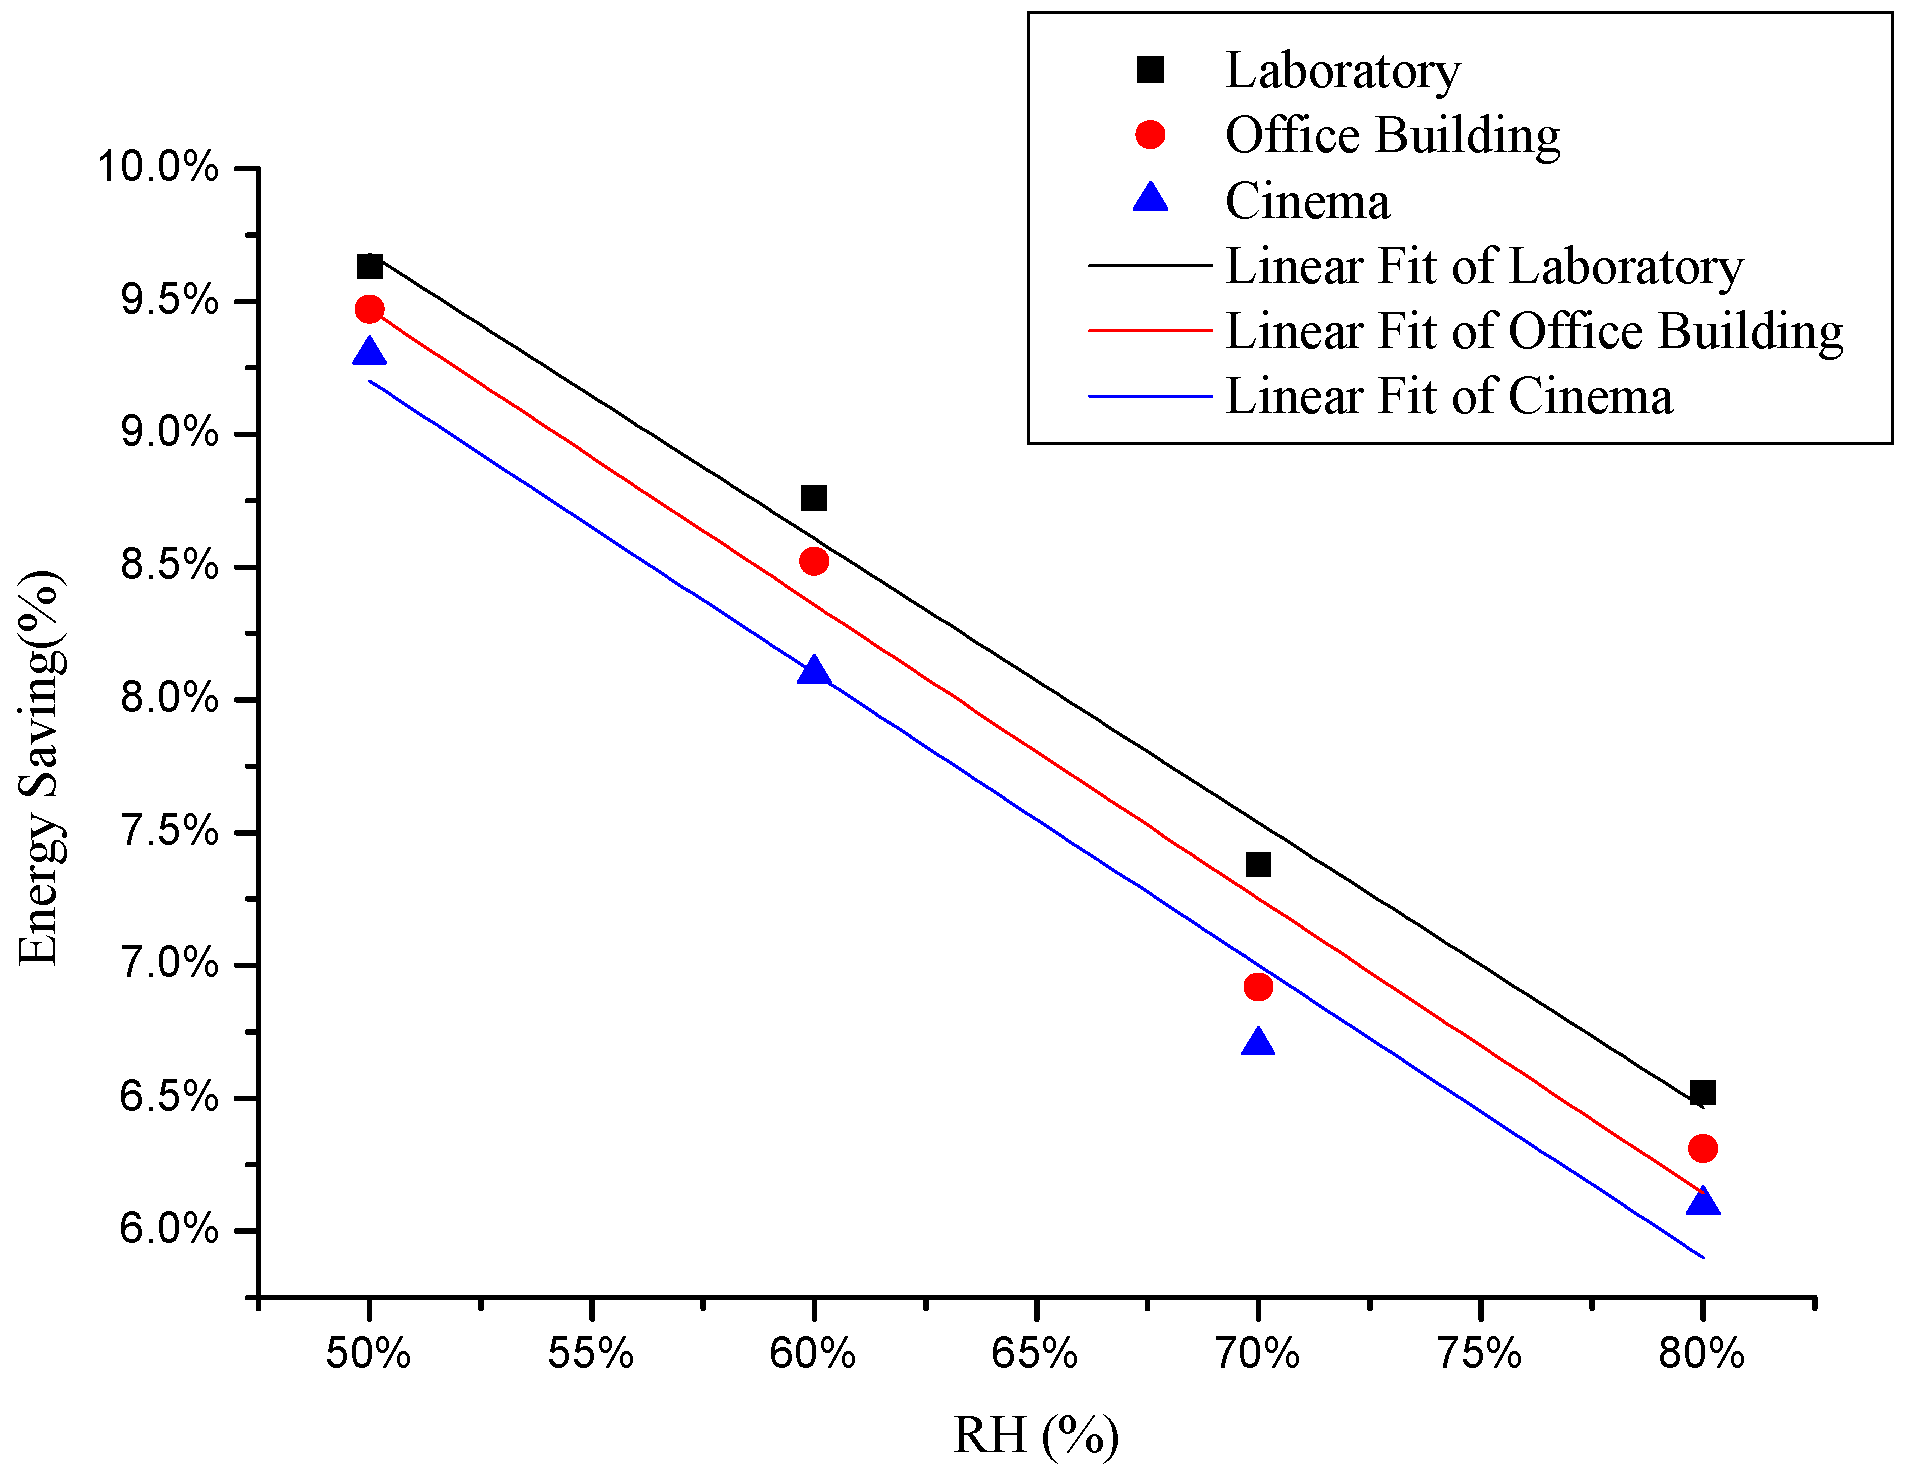
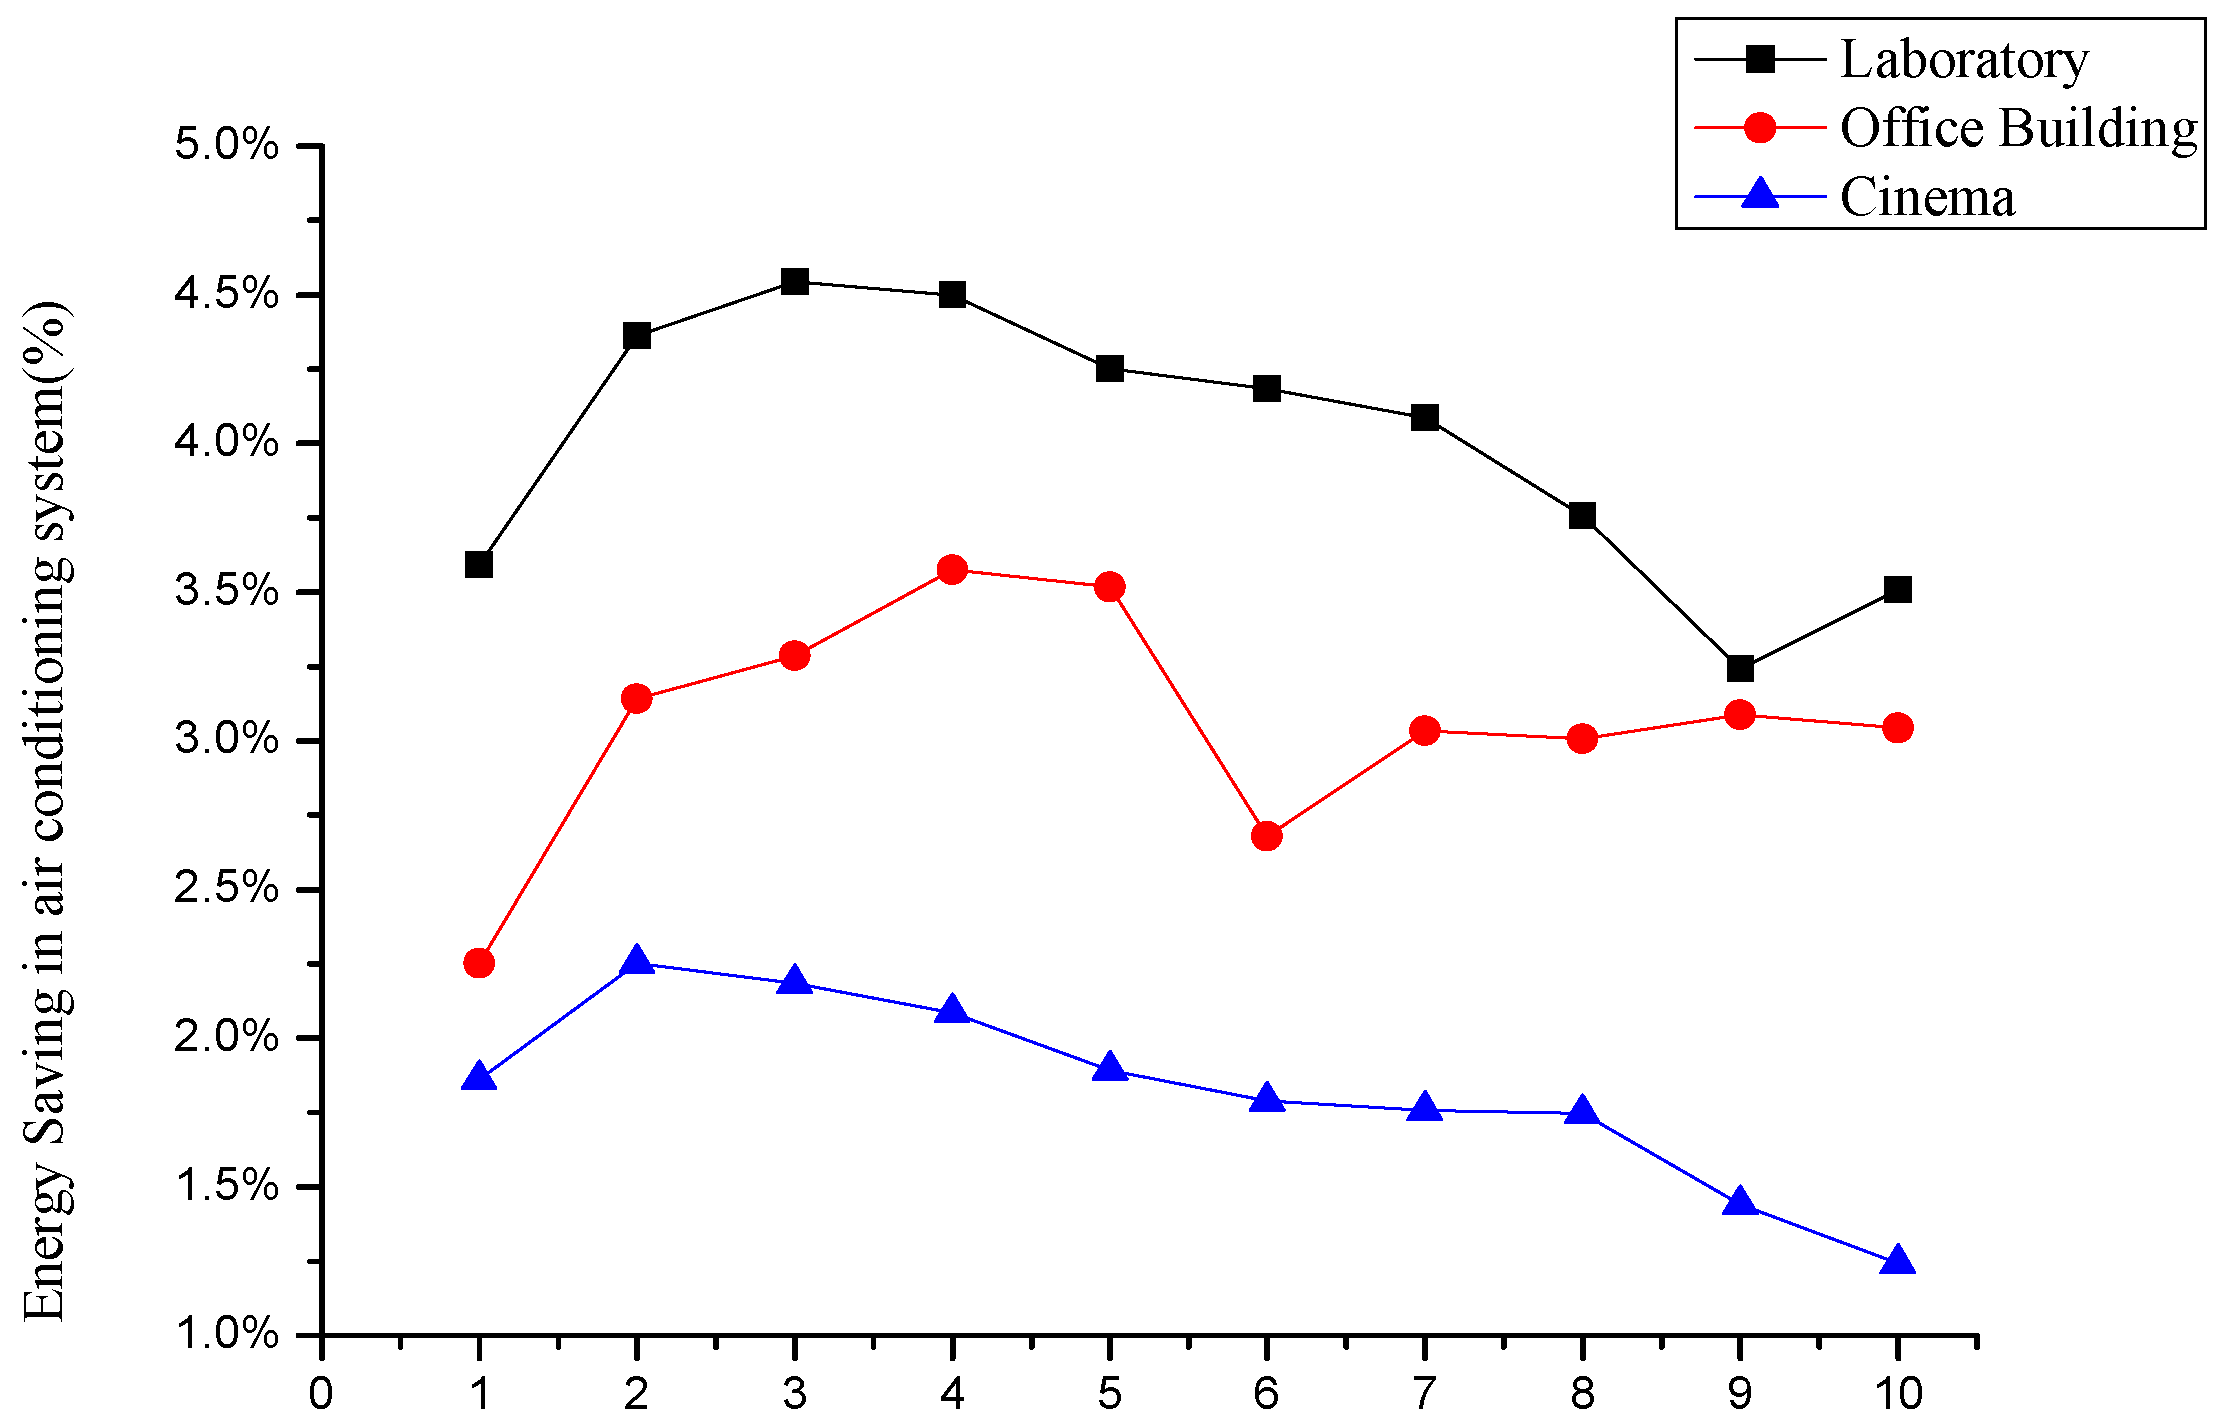
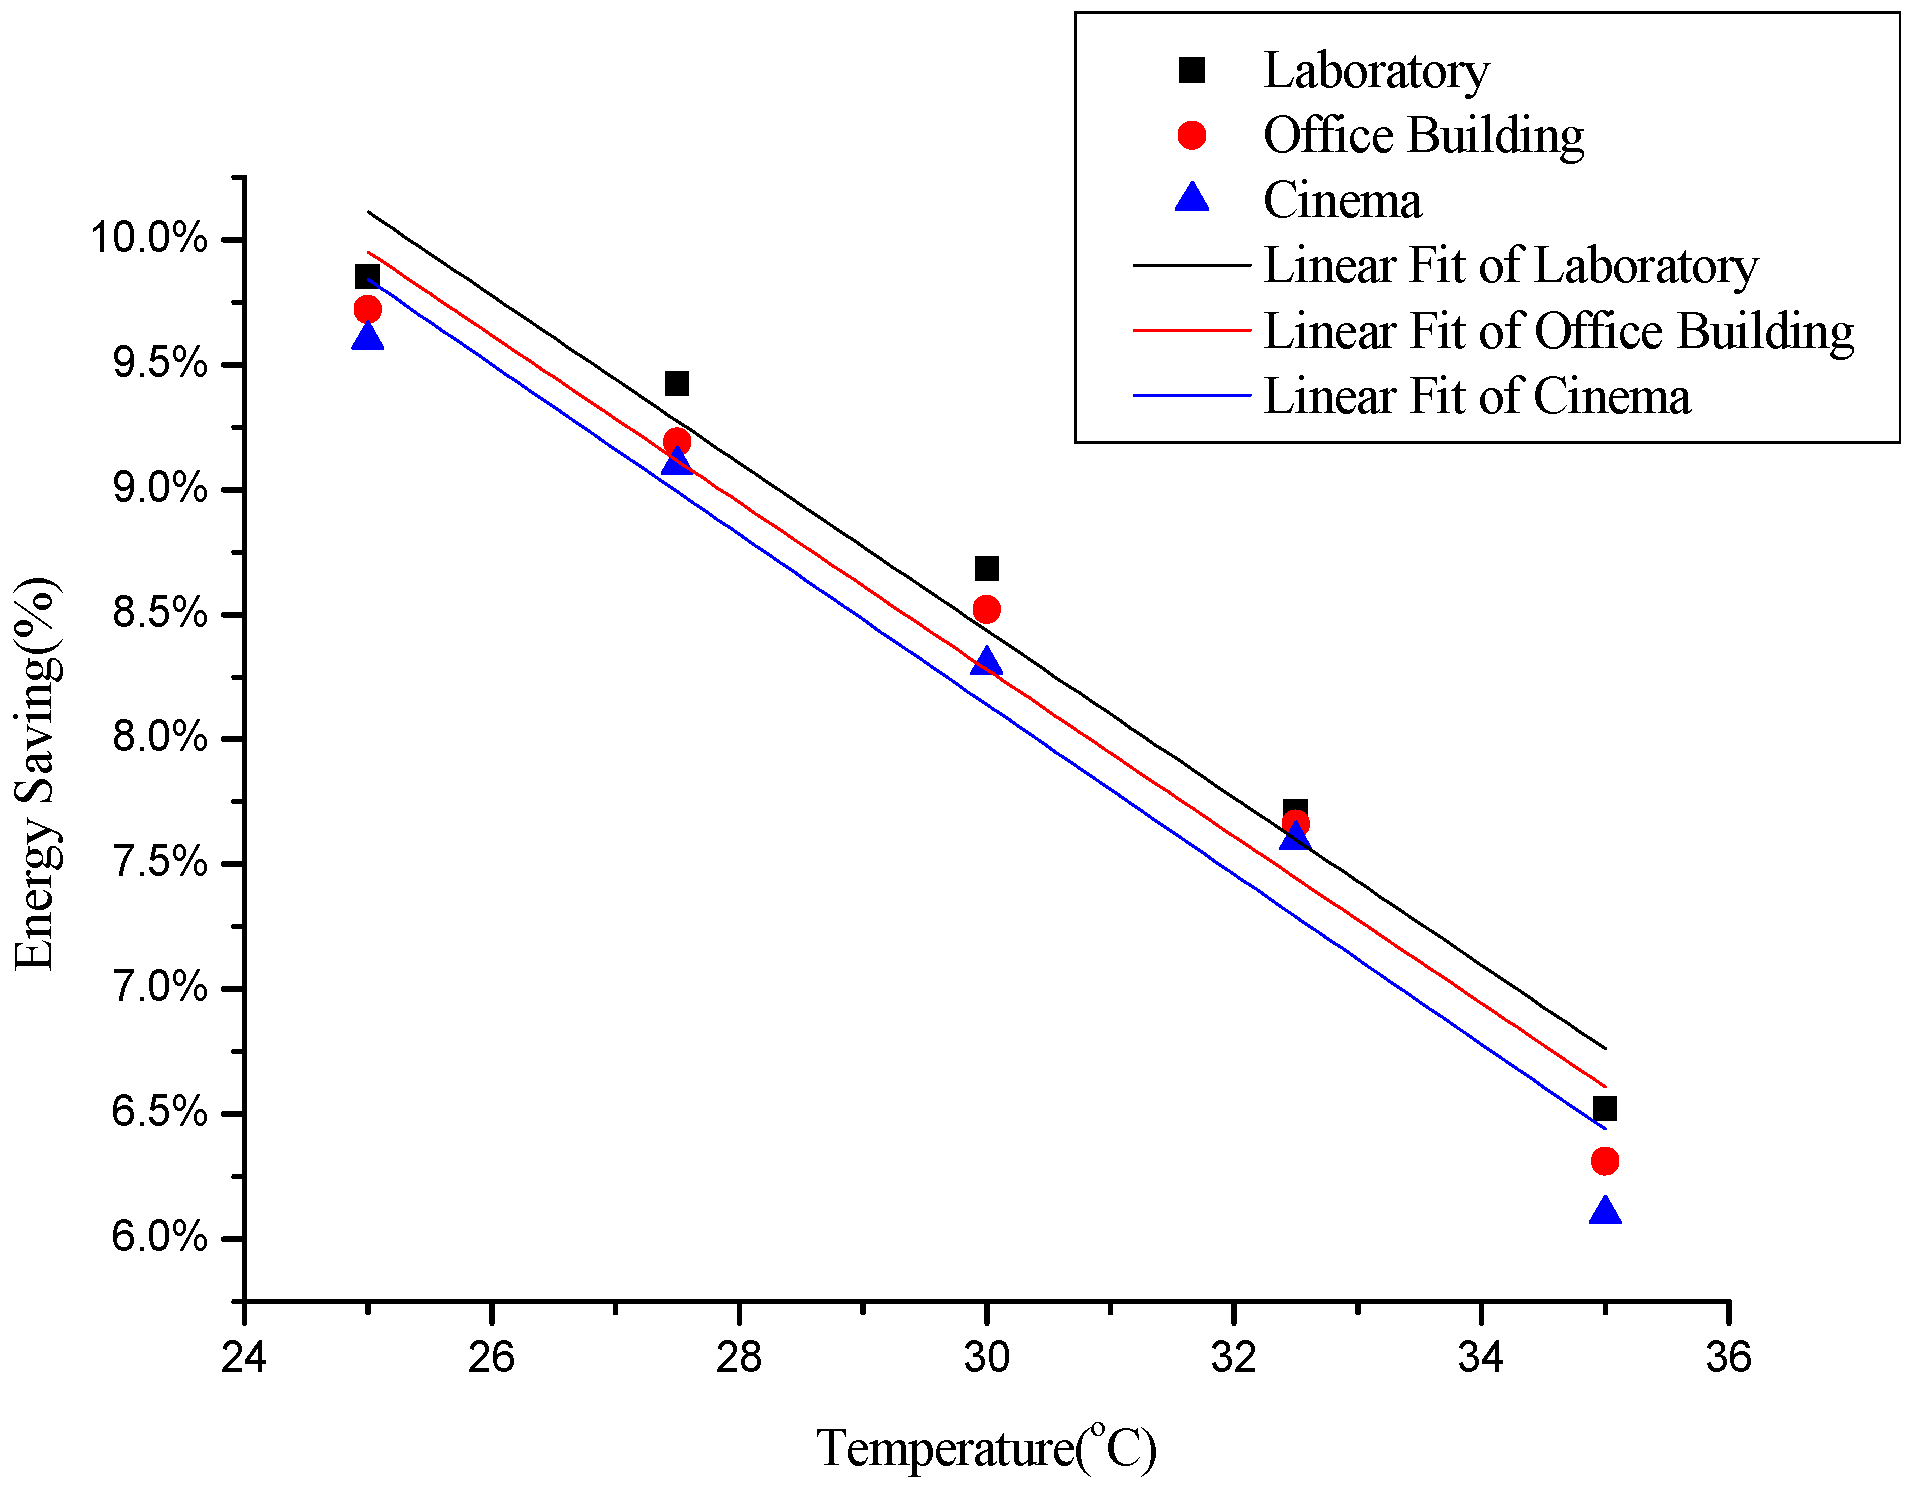
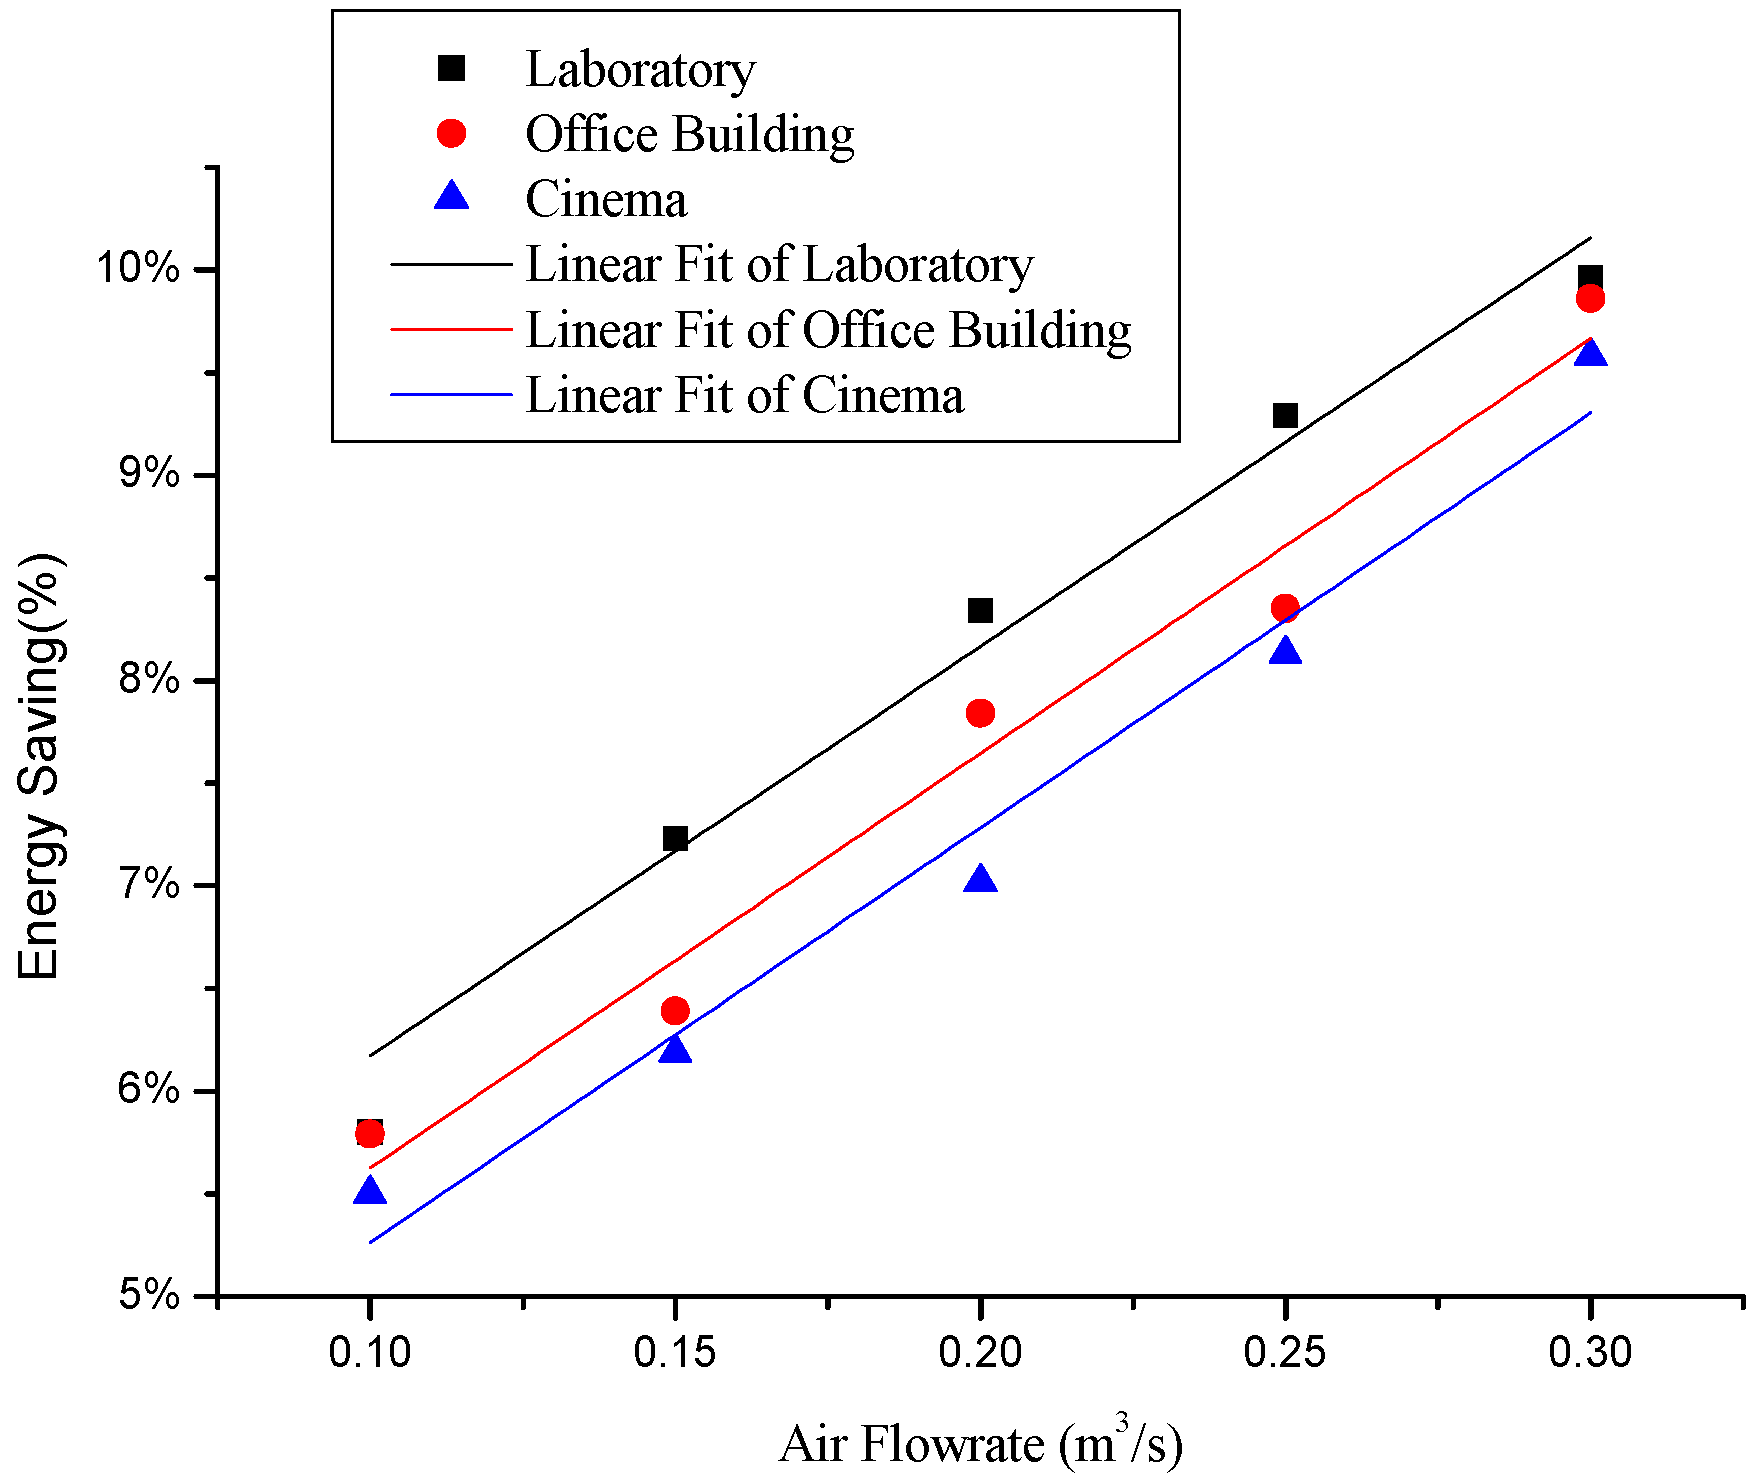
4.3. Comparison of the Dedicated System with Laboratory, Cinema and Office Building Systems
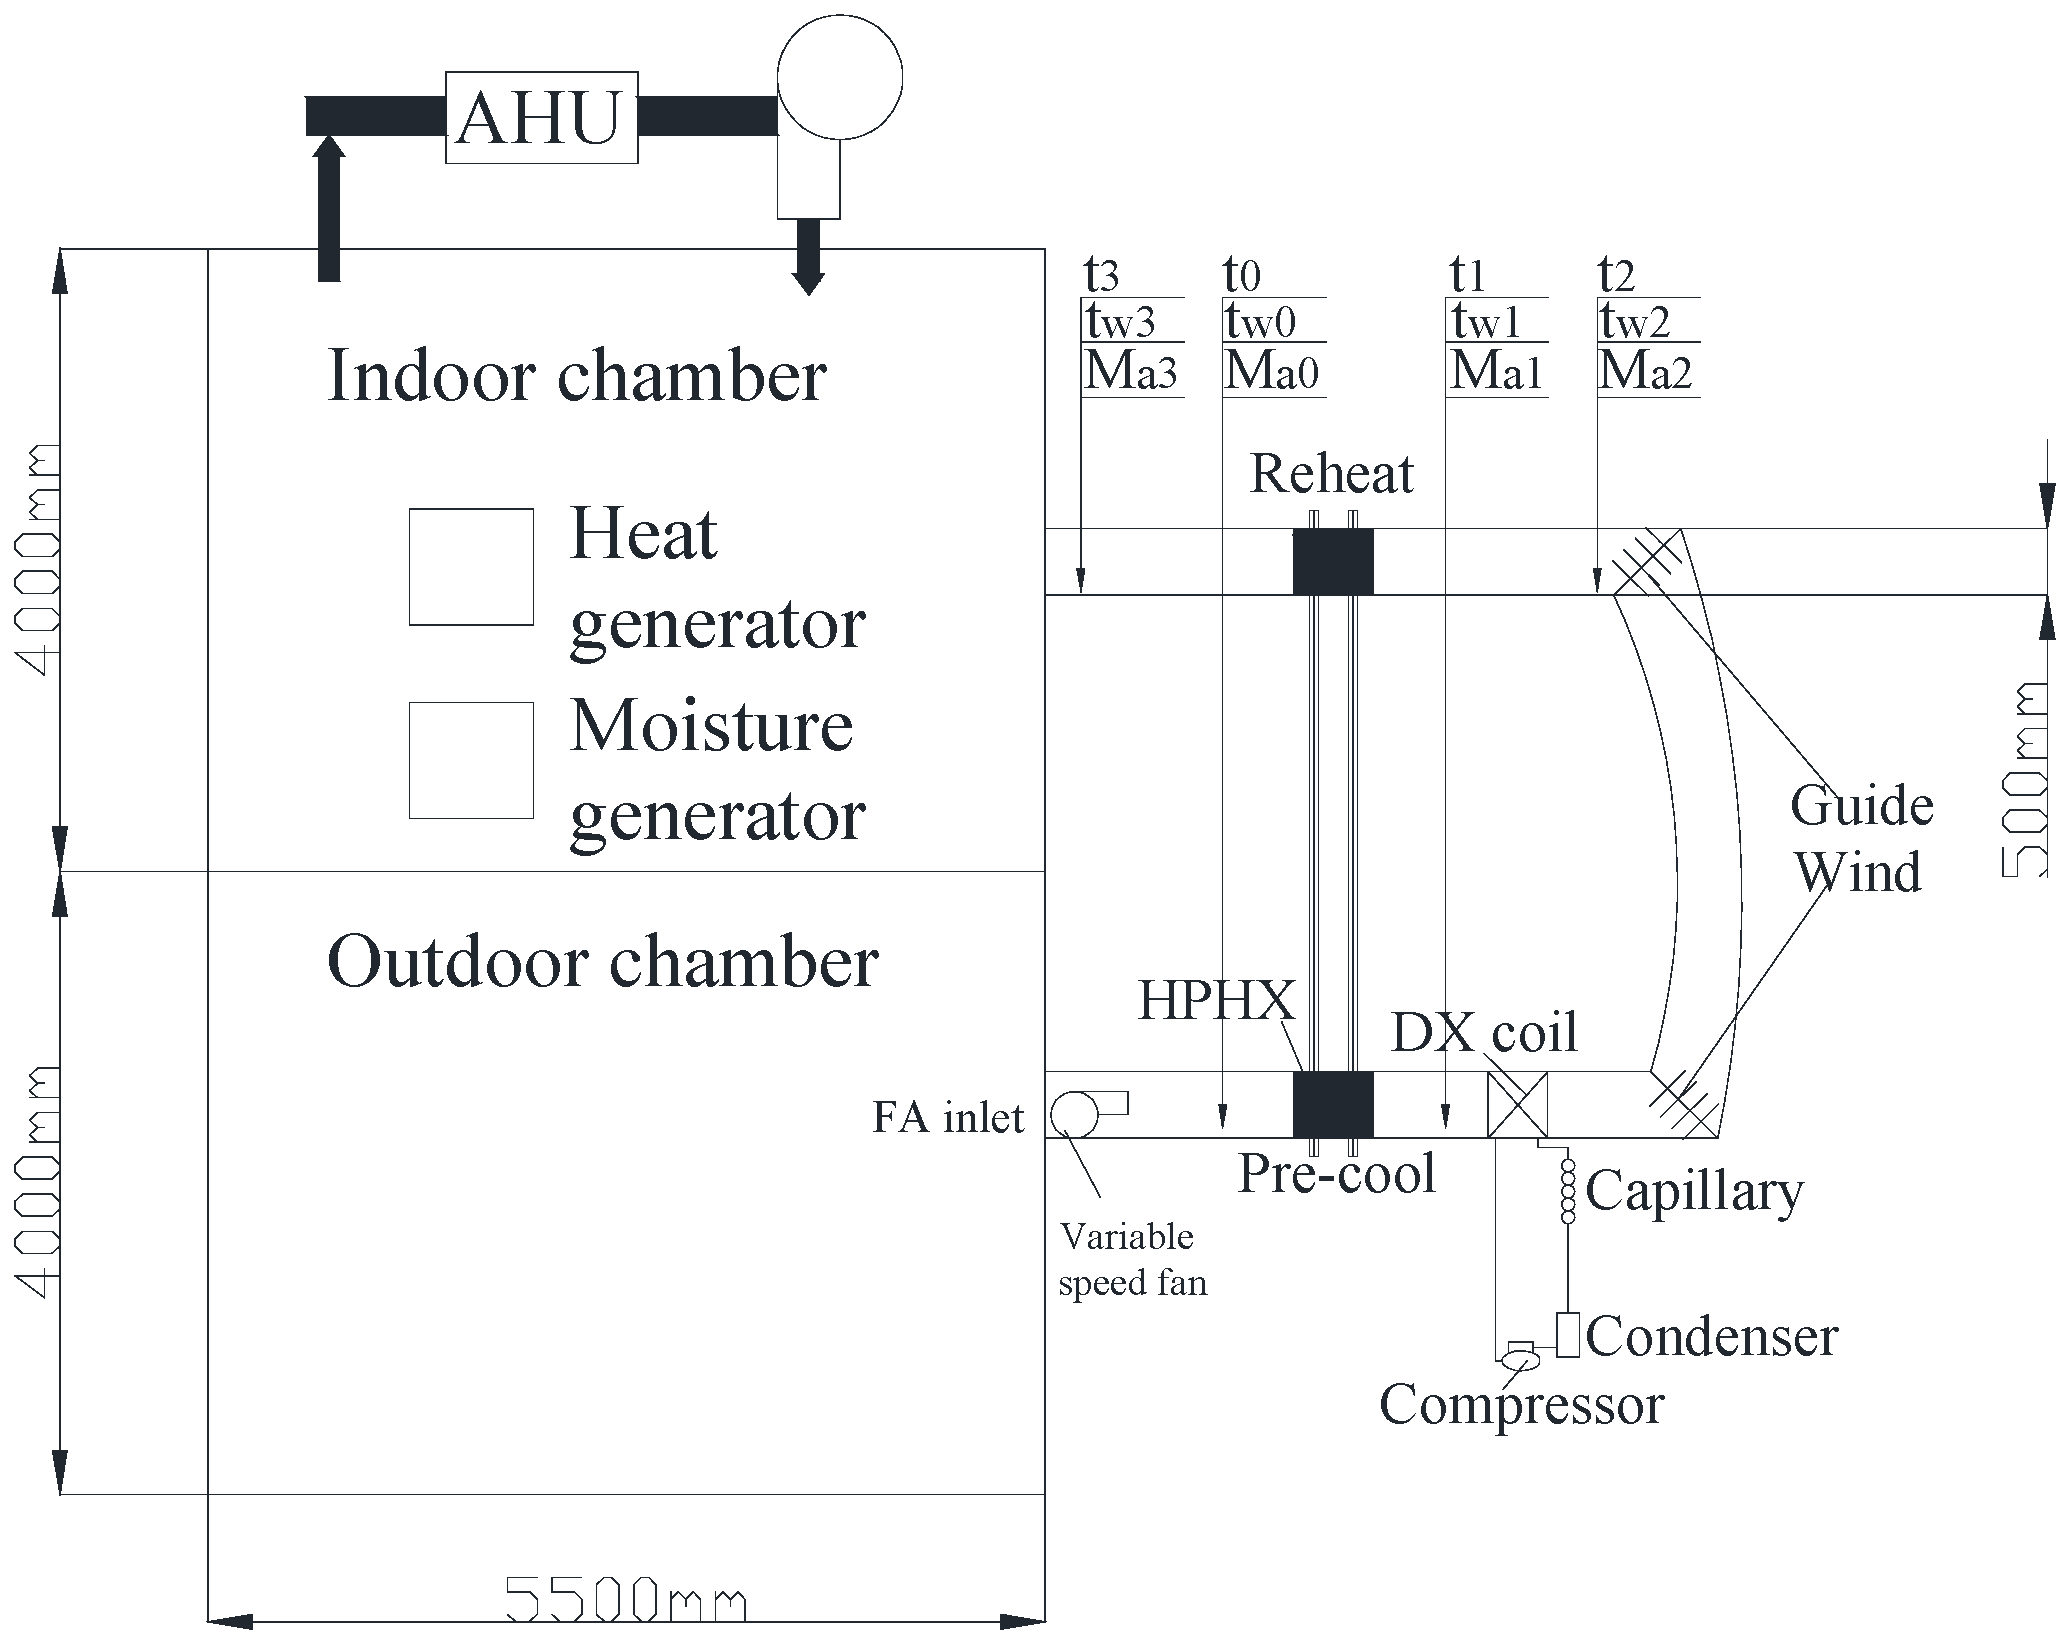
A feasibility study of the use of heat pipes for decoupling dehumidification from cooling to improve the energy saving potential and indoor air quality for office buildings has been conducted in previous research. The office building model has been simulated and evaluated to assess the performance and the energy saving potential of the proposed system. It has been indicated that heat pipes of different effectiveness can be used to save energy for over 70% of the air-conditioned running hours, which correspond to 0.03%–6.3% of the time the decoupling objective cannot be reached. According to these results, a regressed model relating NHRS with the effectiveness of heat pipe has been established [18].
Another previous study concerned the use of HPHXs combined with a dedicated ventilation system for cinemas to reduce the reheating and pre-cooling energy. The feasible use and the energy saving potential of the proposed system was investigated on a cinema model which was simulated, calculated, evaluated and tested under varying conditions. It was demonstrated that the HPHX can be used to save more than 60% of the energy during the air-conditioning running hours. Thus, the overall energy savings cinemas ranged from 1.5% to 2.8% for the whole system [19].
Considering the place of application of the two previous studies, the current work extends the research scope by establishing a laboratory model, which focuses on its thermal insulation performance, the occupancy and the decoupling of dehumidification from cooling capacity. After evaluating the energy saving potential of the FA system and the air conditioning system of then laboratory model, it is necessary to compare the different research results of the three models under the same conditions and clarify which one works most effectively and suitably in these three buildings.
Figure 7 and Figure 8 illustrate the differences of the three models. Figure 7 indicates that for the laboratory the time that the dried and cooled FA generated by the HPHX combined with a dedicated ventilation system, cannot be applied to totally remove the space latent load is shorter than for the other buildings. The energy saving potential is from 0.4% to 1.69% under the same design conditions. Besides the fact that the percent of high RH hours of a laboratory is lower than for a cinema and office building, Figure 8 shows that the energy saving potential of laboratories is higher than the others for the same design conditions.
Figure 7. The percentage of high relative humidity (RH) hours between laboratory, cinema and office building.
Energies 09 00024 g007
Figure 8. The energy saving in the air conditioning system between laboratory, cinema and office building.
Energies 09 00024 g008
The high RH hours and the energy saving potential must differ between various types of spaces under the same design conditions. The main reasons for the different results include the architectural characteristics, the load characteristics and the occupancy. The thermal insulation performance of a laboratory is better than that of the other two buildings and the occupancy of the laboratory has less changes, which results in a minimum FA load. These two conditions lead to the best high RH hours and energy saving potential of the laboratory. However, there are no windowless rooms in the office building. The occupancy of the office building changes more than the occupancy of the laboratory, which causes the office building's medium FA load. The maximum high RH hours and the minimum energy saving potential for the cinema could be mainly attributed to the larger windowless rooms of the cinema, as well as the fact the occupancy of the cinema changes frequently which leads to a maximum FA load.
Therefore, the proposed system for dehumidification improvement is more suitable for a laboratory than a cinema or office building in a subtropical area.

5. Experimental

An experimental prototype was designed and installed for experimental research to evaluate the overall performance. The prototype shown in Figure 9 consists a vertical HPHX, a variable speed fan, an insulated duct and a DX coil which will be the evaporator side of the air conditioner with 1.4 kW power consumption and 3.36 kW nominal cooling capacity. Besides, a DX evaporator with copper tubes and aluminum fins, and the air conditioner which will be comprised of a capillary tube and an air cooled condenser are connected to a hermetic rotary compressor. The test rig must be insulated to minimize the heat loss to the ambient. Polystyrene and fiber glass insulation will be applied to the ductwork and related components. The air flow rate is controlled by a variable speed fan which is installed in the ductwork. The cooling output has on/off control by the indoor set point conditions.
The characteristics of the prototype are tested in two completely isolated and insulated spaces one of which corresponds to outdoor conditions and the other one to indoor conditions, as shown in Figure 9. The moisture generator and heat generator will be used to simulate the varying space load conditions by adjusting the latent heat and the sensible outputs in the indoor space. The sensible heat ratio (SHR) could be applied to create an extensive scope of running conditions which due to the two generators are running separately. The air handling unit will be used to simulate varying outdoor conditions.
Figure 9. The experimental prototype set-up.
Energies 09 00024 g009
The test conditions of the indoor and outdoor spaces for the experiments are summarized in Table 2 and are in keeping with simulation conditions. In this experiment, four test points for getting dry-bulb and wet-bulb temperatures (point 0 to 3) are shown in the Figure 9 as well. This study gets the average temperature of every four points for the calculations. The indoor space has a thermal dynamic steady state during all the experiment, namely:
Q AHU ( τ ) + Q FA ( τ ) + Q H ( τ ) = 0
where:
  • QAHU(τ) = cooling load from AHU at time (τ), kW;
  • QFA(τ) = cooling load from FA at time (τ), kW;
  • QH(τ) = heating load from the heat and moisture generators at time (τ), kW; the heat generator is from 0 kW to 12 kW and the moisture generator is from 0 kW to 4.8 kW.
In the indoor space, the constant cooling output from the air handler and the outputs of the heat and moisture generators were controlled by proportional integration differentiation (PID) technology to maintain the space thermal conditions. The sensible load is varied by the dry-bulb temperatures and the latent load is varied by the wet-bulb temperatures.
Four test points for getting dry-bulb and wet-bulb temperatures are measured using type K thermocouples and the airflow rate is measured by a thermal anemometer for the cooling output. In addition, the compressor and fan power consumption are measured by a power meter. All the meters are connected to data loggers. The cooling and dehumidification capacity is decided by the energy balance using all the measured parameters. The details of the major instruments are summarized in Table 5.
Table 5. Details of major instruments.
ParameterAbbreviationInstrumentVaried RangeAccuracy
Temperaturetw and tType K thermocouples−50 to 100 °C±(0.05% rdg + 0.5 °C)
Air flow rateMaThermal anemometer0–5 m/s± 1.5%
PowerWPower meter0 to 1 × 10⁶ A (a.c.)± (0.25% rdg + 0.05% F.S.)
Because the common climatic conditions of subtropical areas are mostly very hot and humid with a dry-bulb temperature (DBT) from 20 °C to 35 °C and RH from 35% to 90%, it was essential to include a range of DBT and RH values suitable for a subtropical climate to obtain relevant characteristic data for the HPHX in this environment. It was necessary to cover a range of coil face velocities which represent the typical data occuring in practice at the same time. Thus, runs were performed under the thermal conditions summarized in Table 2 for this series of experiments.
There was some unavoidable run-to-run departure compared with the target values due to some difficulties in gaining accurate control of all the parameters listed above. However, runs were classified based on the above nominal values for simplicity in presentation and discussion of the data. The system must reach the steady-state equilibrium conditions after running about twenty minutes before data was collected for each experiment.

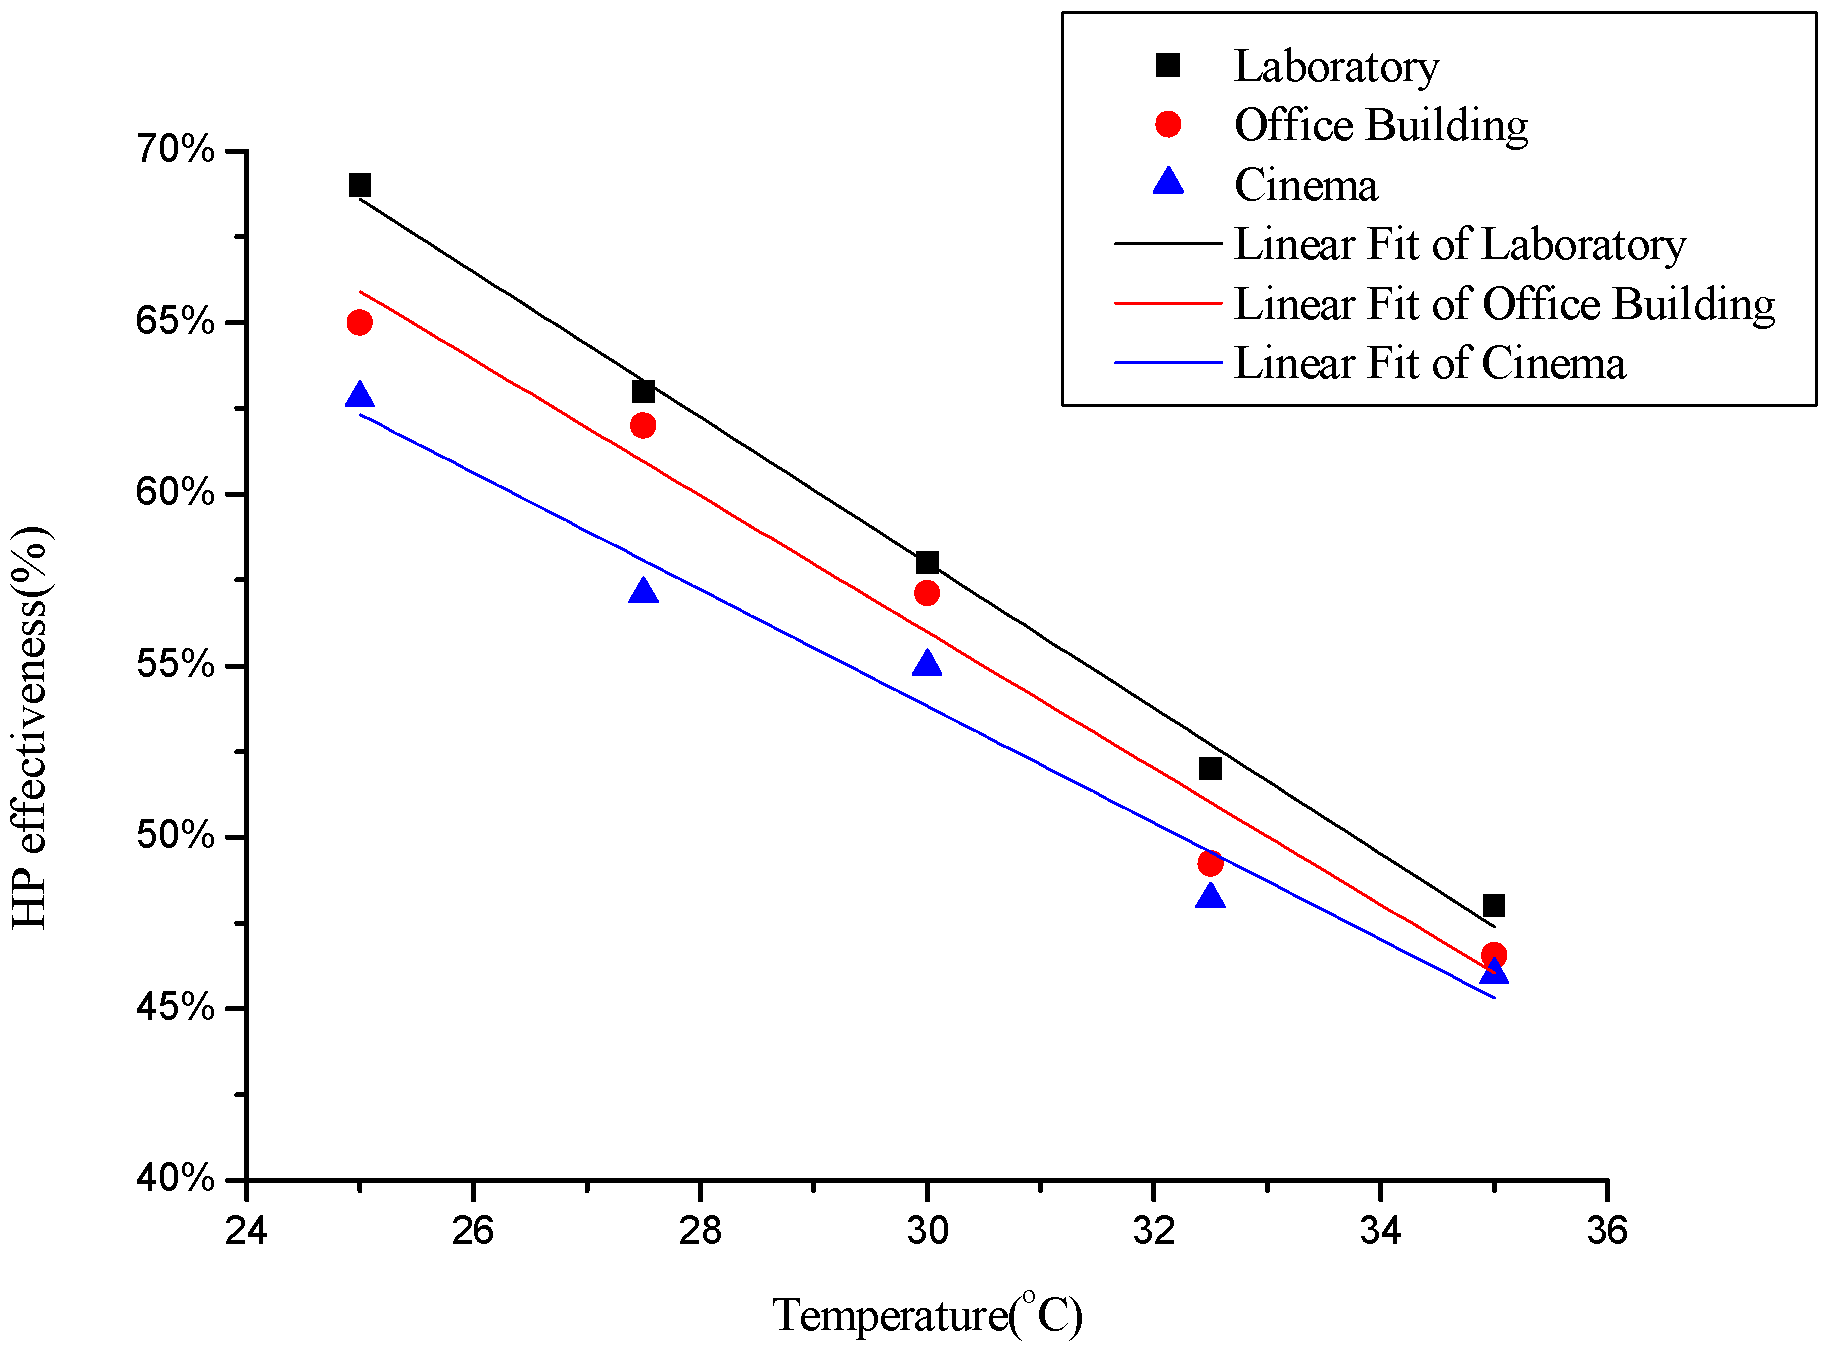
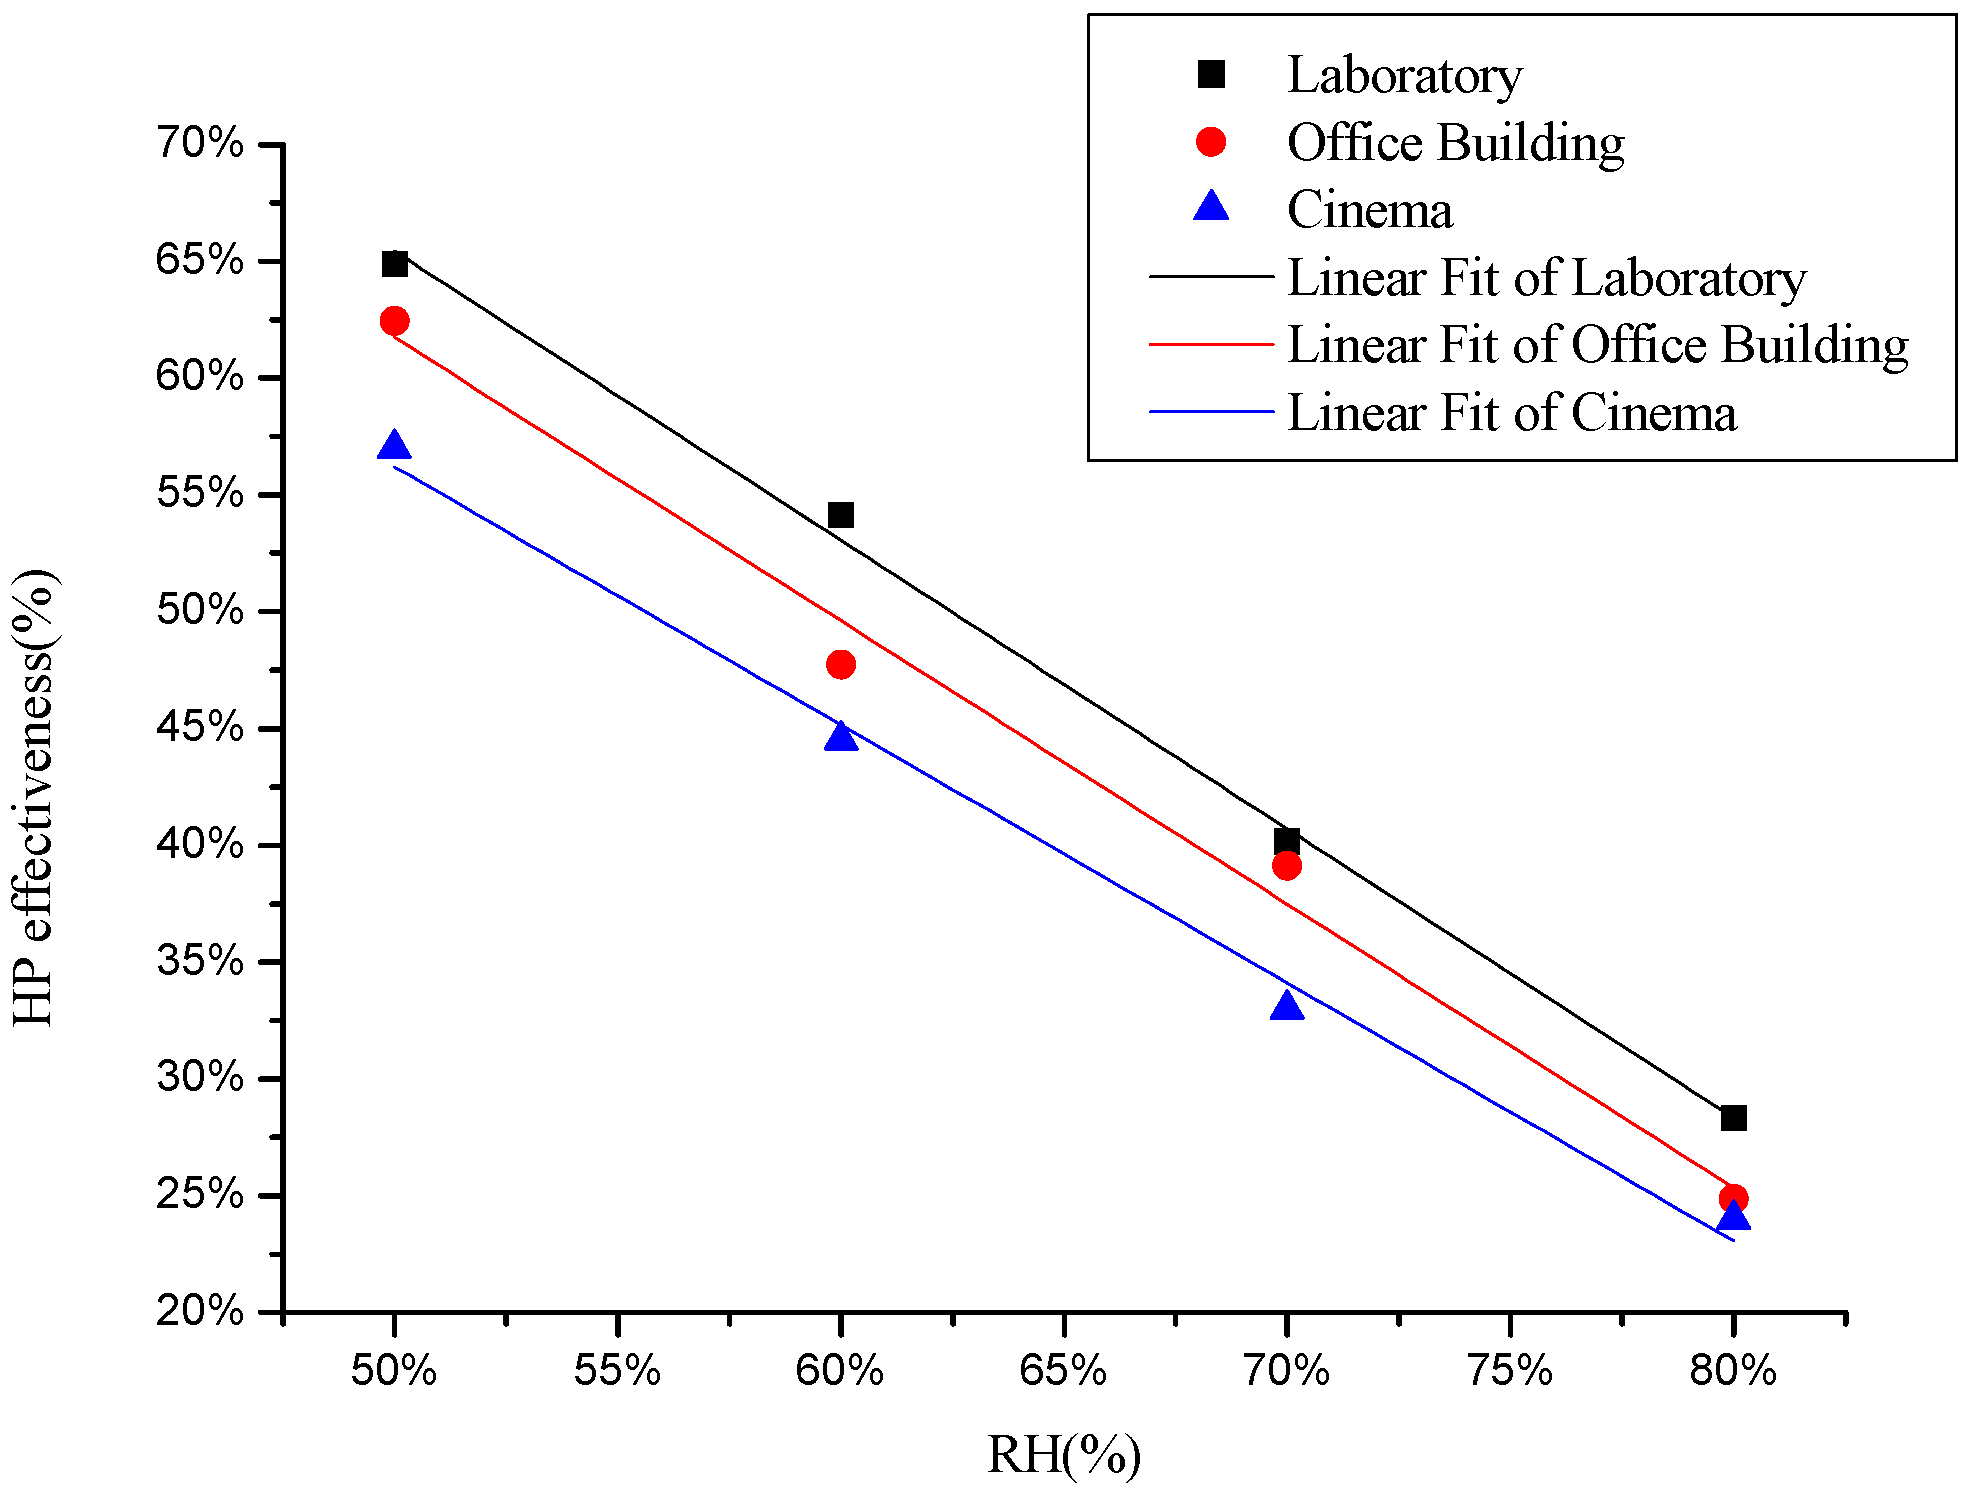
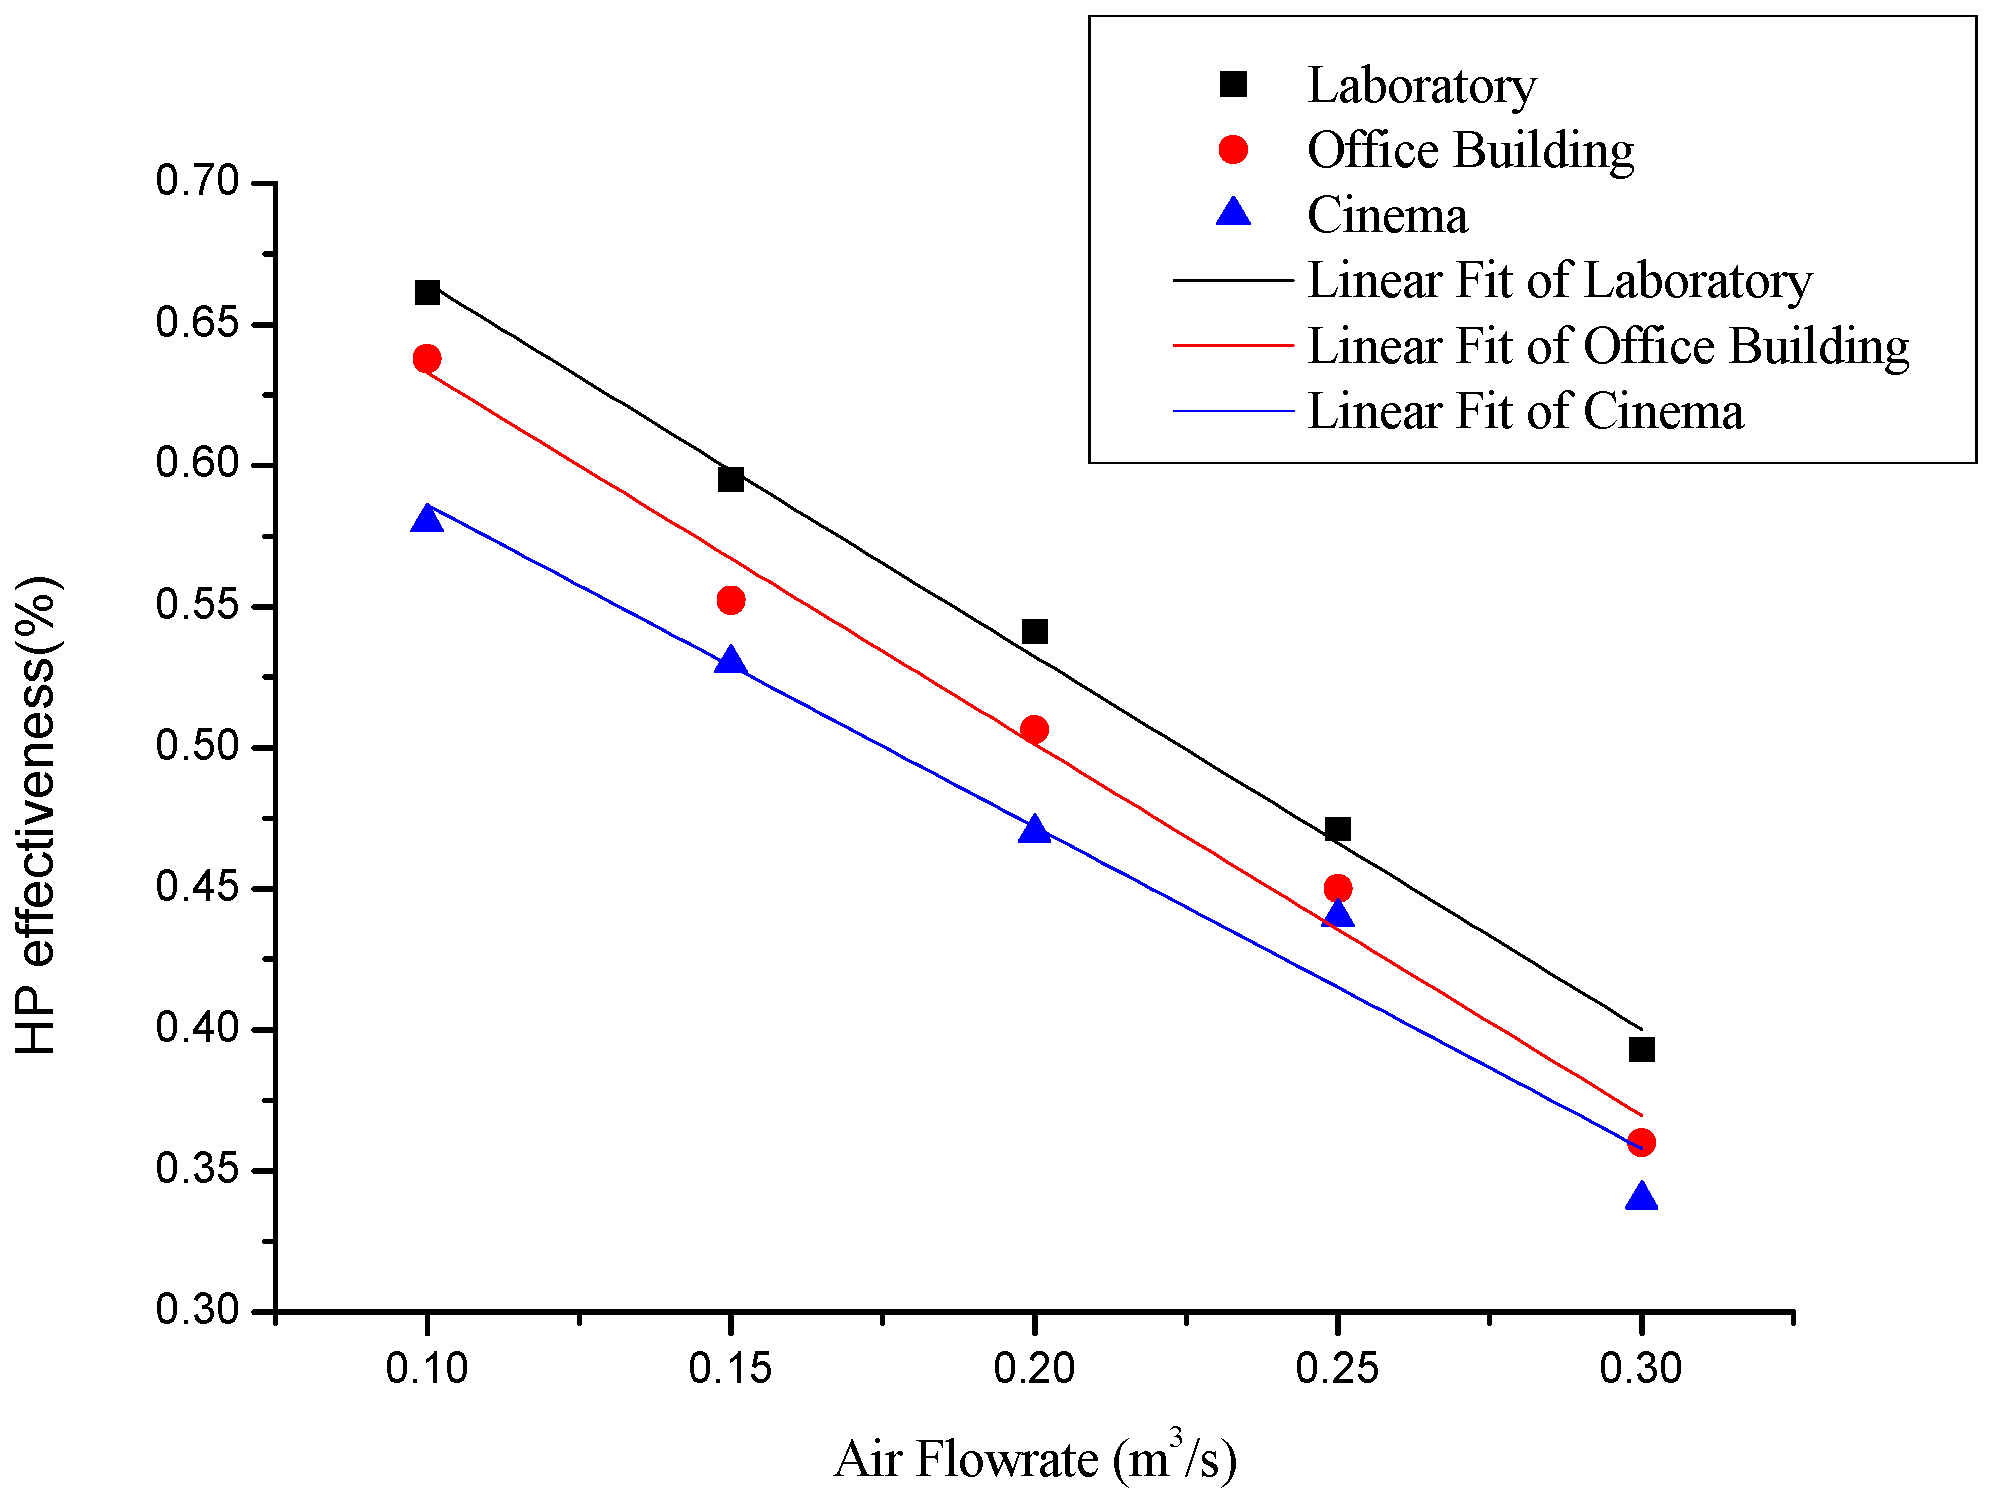
6. Results, Comparison and Discussion

The experimental model simulated the laboratory conditions rather than those of the other two buildings. The thermal insulation performance of a laboratory is the best of the three buildings. The heat generator and the moisture generator simulated the occupancy of the laboratory which has little changes when the system was being operated. The laboratory model is neither as large as the cinema with windowless rooms nor as changeable as the space area of the office building, which is the closest to the actual situations compared with the other two buildings.

6.1. Heat Pipe (HP) Effectiveness

The HP effectiveness (ηHP) for all kinds of experimental conditions was calculated based on Equations (4)–(7). It was noted that ηHP varied between 24% and 69.4%. The ηHP at different To, RHo and VFA were discussed and compared to evaluate whether the outdoor conditions (To; RHo and VFA) would affect the HP effectiveness (ηHP). The results are shown in Figure 10, Figure 11 and Figure 12.
Figure 10. Heat pipe (HP) effectiveness of various temperatures for different buildings.
Energies 09 00024 g010
Laboratory: ηHP = −0.0212(T0) + 1.216 coefficient of determination (R2) = 0.9948
Office Building: ηHP = −0.0199(T0) + 1.156 R2 = 0.9648
Cinema: ηHP = −0.0172(T0) + 1.048 R2 = 0.9647
Figure 11. HP effectiveness of various RH for different buildings.
Energies 09 00024 g011
Laboratory: ηHP = −1.237(RH0) + 1.273 R2 = 0.9967
Office Building: ηHP = −1.214(RH0) + 1.224 R2 = 0.986
Cinema: ηHP = −1.105(RH0) + 1.114 R2 = 0.9922
Figure 12. HP effectiveness of various airflow rates for different buildings.
Energies 09 00024 g012
Laboratory: ηHP = −1.321(VFA) + 0.7966 R2 = 0.9946
Office building: ηHP = −1.316(VFA) + 0.7644R2 = 0.9826
Cinema: ηHP = −1.14(VFA) + 0.7 R2 = 0.9606
It could be seen that various outdoor conditions (To; RHo and VFA) affected the HP effectiveness for different buildings, and the correlation between outdoor conditions (To; RHo and VFA) and HP effectiveness could be regressed to one straight line. The high correlation level showed that with a decrease of outdoor conditions (To; RHo and VFA) the ηHP increased. The HP effectiveness (ηHP) of the laboratory was higher than that of the other buildings.
According to the regression analysis, it was noted that there exists a linear relationship givden by the regression model:
η HP = 0.0024 ( T 0 ) 0.8307 ( R H 0 ) 0.4409 ( V F A ) + 1.1558
The coefficient of determination (R2) of this model was found to be 0.8243, indicating a linear correlation at the 95% confidence level.

6.2. Energy Saving Calculation

FA was processed by the HPHX and DX unit before supplying it to the chamber in the proposed system. Cooling output of the DX unit could be represented by:
Q FA ( τ ) = ρ V FA ( h 3 ( τ ) h set )
where hset = space air enthalpy (22 °C, 50%) per s, kJ/kg.
The QAHU(τ) and QH(τ) were measured and stored in the built-in computer of the space automatically, and the QFA(τ) was determined by energy balance calculations. Equation (23) was adopted to check the accuracy of the experimental data for subsequent analysis.
FA was processed only by the DX unit before supplying it to the chamber in the conventional system. Cooling output of the DX unit could be represented by:
Q FA ( τ ) = ρ V FA ( h 2 ( τ ) h set )
QFA (τ)′ = cooling load from FA at time (τ) for the conventional system, kW
Combining Equations (34) and (35), the saving in reheating load was:
Δ Q FA ( τ ) = Q FA ( τ ) Q FA ( τ ) = ρ V FA C pa ( t 3 ( τ ) t 2 ( τ ) )
Thus, the energy saving potential (εAC) for the proposed system was:
ε AC = τ = 1 m Δ Q FA ( τ ) τ = 1 m Q H ( τ ) × 100 %
QH(τ)′ = heating load from the heat and moisture generators at time (τ) for the conventional system, kW.
The proposed laboratory system could reduce the FA cooling load as well as the reheating load. The εAC under various outdoor conditions (To, RHo and VFA) was evaluated and compared for different buildings. The results are shown in Figure 13, Figure 14 and Figure 15.
Figure 13. Energy saving of various temperatures for different buildings.
Energies 09 00024 g013
Laboratory: ηHP = −0.0034(To) + 0.1848 R2 = 0.9595
Office Building: ηHP = −0.0033(To) + 0.183 R2 = 0.9534
Cinema: ηHP = −0.0034(To) + 0.1834 R2 = 0.9456
Figure 14. Energy saving of various RH for different buildings.
Energies 09 00024 g014
Laboratory: ηHP = −0.1071(RHo) + 0.1503 R2 = 0.9863
Office Building: ηHP = −0.1108(RHo) + 0.1501 R2 = 0.9611
Cinema: ηHP = −0.11(RHo) + 0.147 R2 = 0.9661
Figure 15. Energy saving of various airflow rates for different buildings.
Energies 09 00024 g015
Laboratory: ηHP = −0.1992(VFA) + 0.04182 R2 = 0.9845
Office Building: ηHP = −0.202(VFA) + 0.0361 R2 = 0.9673
Cinema: ηHP = −0.202(VFA) + 0.03244 R2 = 0.9699
The correlation between outdoor conditions (To; RHo and VFA) and energy savings could also be regressed to a straight line. For different To and RHo values, ηHP and εAC had the same trend which increased with a decrease of To and RHo. However, it was evident from Equations (36) and (37) that a higher VFA would obtain a higher εAC. The energy saving potential (εAC) of the laboratory was obviously better than that of the other two buildings.
It was evident that the outdoor conditions (To; RHo and VFA) and energy savings for the laboratory could also be regressed to a linear relationship which model was:
η HP = 0.0024 ( T 0 ) 0.1218 ( R H 0 ) 0.189 ( V FA ) + 0.1959
The coefficient of determination (R2) of this model was found to be 0.9217, indicating an excellent linear correlation at the 95% confidence level. In the simulation part, these simulated results are based on some assumptions which were adiabatic air transport between the DX and the HPHX, constant energy transfer rates and constant air mass flow rates. However, these assumptions cannot occur in the experimental conditions and the major instruments have different measuring accuracy. As a result, the energy saving potential of the experimental results which ranged from 5.78% to 9.92% is considered consistent with the simulated results based upon simulation studies (6.16% to 9.31%).

7. Conclusions

To evaluate the energy saving potential of a HPHX combined with a dedicated ventilation system when used in Southern China, a prototype HPHX system has been designed and constructed for simulation and experimental research to estimate the overall performance under various indoor and outdoor conditions. Because the differences between the three buildings are characteristics of their load and occupancy changes, this paper proposed an application on the operating model of a laboratory, which is different from the other two buildings. The results were used to compare the previous papers by the authors [18,19] which presented an office building model and a cinema model. Furthermore, they were used to verify that the laboratory model had more energy saving potential than the other two buildings.
Based on the design characteristics of a laboratory, the HTB2 simulation software was used to decide the cooling load profiles yearly for practical estimations of the proposed system to decouple dehumidification from cooling. It was shown that only 1.69% of the time the dried and cooled FA processed by the proposed system cannot be applied to entirely remove the chamber latent load during the annual operating hours of the air conditioning system. The energy saving potential of the cooling load and the reheating load were evaluated to correspond to 6.16–9.31% of the FA system and 3.2% to 4.5% of the overall system in the laboratory air conditioning system in Southern China. Considering the comparison between this paper and the previous ones, the energy saving potential of the laboratory was highest one. The results also showed that HVAC systems combined with HPHX for dehumidification improvement and energy savings are suitable for laboratories. This study demonstrates that the heat recovery technology combined with dedicated ventilation system is a feasible and energy efficient way to improve the energy consumption performance of conventional air-conditioning systems.

Acknowledgments

This research work was supported by the Science Fund of Tian Jin Urban and Rural Construction Commission (Grant No. 2014-34) and Tian Jin Higher Education Science and Technology Fund Planning Project (Project No. 20140426).

Author Contributions

The research work has been done by Lian Zhang and YuFeng Zhang not only for the simulation part but also for the experiment part. All the authors significantly contributed to the editing and improvement of the manuscript.

Conflicts of Interest

The authors declare no conflict of interest.

Nomenclature

HPHXHeat pipe heat exchanger
COPCoefficient of performance
HPHeat pipe
NHRSThe time the decoupling objective cannot be achieved
FAFresh air
DXDirect-expansionDirect-expansion
h0,1,2,30–3 point air enthalpy (kJ/kg)
ω0,1,2,30–3 point air moisture contents (kg/kg)
CpaAir specific heat( kJ/kg·K)
t0,10 and 1 air temperature (°C)
HTB2A model for the thermal environment of building in operation
t0Outdoor air temperature (°C)
HVACHeating ventilation and air conditioning
QDXN,OThe net total cooling load for fresh air treatment (kW)
HDX,OThe net total reheating load for fresh air treatment (kW)
ρAir density (kg/m3)
VFAFresh air supply flow rate (m3/s)
t2Leaving cooling air temperature in DX (°C)
t3Leaving heat pipe condenser section air temperature (°C)
τTime (s)
t1Leaving heat pipe evaporator section air temperature (°C)
ηHPEffectiveness of the heat pipe (%)
ωsAir moisture contents at the various states denoted by the subscript (kg/kg; s = 0, 1, 2, 3)
ε1Energy saving potential of the fresh air system (%)
mTotal running hour (h)
HDXN,OThe net total reheating load for fresh air treatment (kW)
QFCN,OThe net total returning air load for fresh air treatment (kW)
VRAReturn air supply flow rate (m3/s)
VSSupply air supply flow rate (m3/s; vs = vra + vfa)
h5Supply air enthalpy hourly (kJ/kg)
h6Space design air enthalpy hourly (kJ/kg)
ε2Energy saving potential of the whole system (%)
η0.45Heat pipe of effectiveness 0.45
η0.6Heat pipe of effectiveness 0.6
SHRSensible heat ratio
AHUAir handling unit
QAHU(τ)Cooling load from air handling unit at time (τ) (kW)
QFA(τ)Cooling load from fresh air at time (τ) (kW)
QH(τ)Heating load from the heat and moisture generators at time (τ) (kW)
PIDProportion integration differentiation
tDry-bulb temperatures (°C)
twWet-bulb temperatures (°C)
MaAir flow rate (m/s)
WPower (kW)
DBTDry-bulb temperature
RHRelative humidity
R2Coefficient of determination
hsetSpace air enthalpy (22 °C, 50%) per s (kJ/kg)
QFA(τ)Cooling load from fresh air at time (τ) for the conventional system (kW)
εACThe energy saving potential (%)
QH(τ)Heating load from the heat and moisture generators at time (τ) for the conventional system (kW)

References

  1. Sekhar, S.C. Higher space temperatures and better thermal comfort—A tropical analysis. Energy Build. 1995, 23, 63–70. [Google Scholar] [CrossRef]
  2. Electrical and Mechanical Services Department. Hong Kong Energy End—Use Data (1990–2000); The Hong Kong SAR Government: Hong Kong, China, 2002.
  3. Amos-Abanyie, S.; Akuffo, F.O.; Kutin-Sanwu, V. Effects of Thermal Mass, Window Size, and Night-Time Ventilation on Peak Indoor Air Temperature in the Warm-Humid Climate of Ghana. Sci. World J. 2013, 2013. [Google Scholar] [CrossRef] [PubMed]
  4. Hassan, M.A.M. Investigation of Performance of Heat Pipe as Heat Exchanger Using Alternative Refrigerants. J. Energy Eng. 2013, 139, 18–24. [Google Scholar] [CrossRef]
  5. Liu, G. The application of heat pipe heat exchanger in exhaust gas heat recovery system and its thermodynamic analysis. In Proceedings of the 8th International Heat Pipe Conference, Beijing, China, 14–18 September 1992; pp. 582–585.
  6. Sun, J.Y.; Shyu, R.J. Waste Heat Recovery Using Heat Pipe Heat Exchanger for Industrial Practices. In Proceedings of the 5th International Heat Pipe Symposium, Melbourne, Australia, 17–20 November 1996.
  7. Ma, G.; Zhou, F.; Liu, T.; Wang, L.; Zhang, X.; Liu, Z. Study on Optimal Operating Mode of a Thermosyphon Heat Exchanger Unit in a Shopping Center. J. Energy Eng. 2013, 139, 275–280. [Google Scholar] [CrossRef]
  8. O’Connor, D.; Calautit, J.K.; Hughes, B.R. A study of passive ventilation integrated with heat recovery. Energy Build. 2014, 82, 799–811. [Google Scholar] [CrossRef]
  9. Riffat, S.B.; Gan, G. Determination of effectiveness of heat-pipe heat recovery for naturally-ventilated buildings. Appl. Therm. Eng. 1998, 18, 121–130. [Google Scholar] [CrossRef]
  10. Hughes, B.R.; Chaudhry, H.N.; Calautit, J.K. Passive energy recovery from natural ventilation air streams. Appl. Energy 2014, 113, 127–140. [Google Scholar] [CrossRef]
  11. Calautit, J.K.; O'Connor, D.; Hughes, B.R. A natural ventilation wind tower with heat pipe heat recovery for cold climates. Renew. Energy 2015. [Google Scholar] [CrossRef]
  12. Yau, Y.H. Application of a heat pipe heat exchanger to dehumidification enhancement in a HVAC system for tropical climates-a baseline performance characteristics study. Int. J. Therm. Sci. 2007, 46, 164–171. [Google Scholar] [CrossRef]
  13. Yau, Y.H. The use of a double heat pipe heat exchanger system for reducing energy consumption of treating ventilation air in an operating theatre—A full year energy consumption model simulation. Energy Build. 2008, 40, 917–925. [Google Scholar] [CrossRef]
  14. Yau, Y.H.; Ahmadzadehtalatapeh, M. A review on the application of horizontal heat pipe heat exchangers in air conditioning systems in the tropics. Appl. Therm. Eng. 2010, 30, 77–84. [Google Scholar] [CrossRef]
  15. Ahmadzadehtalatapeh, M.; Yau, Y.H. The application of heat pipe heat exchangers to improve the air quality and reduce the energy consumption of the air conditioning system in a hospital ward—A full year model simulation. Energy Build. 2011, 43, 2344–2355. [Google Scholar] [CrossRef]
  16. Ge, G.; Xiao, F.; Xu, X. Model-based optimal control of a dedicated outdoor air-chilled ceiling system using liquid desiccant and membrane-based total heat recovery. Appl. Energy 2011, 88, 4180–4190. [Google Scholar] [CrossRef]
  17. Gendebien, S.; Bertagnolio, S.; Lemort, V. Investigation on a ventilation heat recovery exchanger: Modeling and experimental validation in dry and partially wet conditions. Energy Build. 2013, 62, 176–189. [Google Scholar] [CrossRef]
  18. Zhang, L.; Lee, W.L. Evaluating the use heat pipe for dedicated ventilation of office buildings in Hong Kong. Energy Convers. Manag. 2011, 52, 1983–1989. [Google Scholar] [CrossRef]
  19. Zhang, L.; Zhang, Y.-F. Research on Energy Saving Potential for Dedicated Ventilation Systems Based on Heat Recovery Technology. Energies 2014, 7, 4261–4280. [Google Scholar] [CrossRef]
  20. Lewis, P.T.; Alexander, D.K. Htb2: A flexible model for dynamic building simulation. Build. Environ. 1990, 25, 7–16. [Google Scholar] [CrossRef]
  21. Alexander, D.K. HTB2 User Manual Version; Welsh School of Architecture R&D, University of Wales College of Cardiff: Cardiff, UK, 1997. [Google Scholar]
  22. Product Manual of Heat Pipe. Beijing Zhong Ke Long Zi Heat Pipe Technology Company Limited, 2015. Available online: http://www.zklz.com (accessed on 14 May 2015).
  23. Product Manual of Heat Pipe. Dezhou Ya Tai Heat Pipe Technology COMPANY Limited. Available online: http://www.yatai.cc (accessed on 21 June 2015).
  24. Lee, W.L.; Yik, F.W.H.; Burnett, J. Simplifying Energy Performance Assessment Method in the Hong Kong building Environmental Method. Build. Serv. Eng. Res. Technol. 2005, 22, 113–132. [Google Scholar] [CrossRef]

