Article

Combined X-ray and Raman Studies on the Effect of Cobalt Additives on the Decomposition of Magnesium Borohydride

1
Physics Department, Institute for Energy Technology, P.O. Box 40, Kjeller NO-2027, Norway
2
Department of Chemistry, Centre for Nanostructured Interfaces and Surfaces (NIS), National Interuniversity Consortium of Materials Science and Technology (INSTM), University of Turin, Via P. Giuria 7, Turin 10125, Italy
3
Science and Technology Department, University of Insubria, Via Valleggio 11, Como 22100, Italy
4
Department of Physical and Colloid Chemistry, I.F. National University of Lviv, 6 Kyryla and Mefodia Str., Lviv UA-79005, Ukraine
5
SINTEF Materials & Chemistry, Trondheim NO-7465, Norway
*
Author to whom correspondence should be addressed.
Energies 2015, 8(9), 9173-9190; https://doi.org/10.3390/en8099173
Submission received: 24 July 2015 / Revised: 18 August 2015 / Accepted: 19 August 2015 / Published: 27 August 2015
(This article belongs to the Special Issue Hydrides: Fundamentals and Applications)

Abstract

:
Magnesium borohydride (Mg(BH4)2) is one of the most promising hydrogen storage materials. Its kinetics of hydrogen desorption, reversibility, and complex reaction pathways during decomposition and rehydrogenation, however, present a challenge, which has been often addressed by using transition metal compounds as additives. In this work the decomposition of Mg(BH4)2 ball-milled with CoCl2 and CoF2 additives, was studied by means of a combination of several in-situ techniques. Synchrotron X-ray diffraction and Raman spectroscopy were used to follow the phase transitions and decomposition of Mg(BH4)2. By comparison with pure milled Mg(BH4)2, the temperature for the γ → ε phase transition in the samples with CoF2 or CoCl2 additives was reduced by 10–45 °C. In-situ Raman measurements showed the formation of a decomposition phase with vibrations at 2513, 2411 and 766 cm−1 in the sample with CoF2. Simultaneous X-ray absorption measurements at the Co K-edge revealed that the additives chemically transformed to other species. CoF2 slowly reacted upon heating till ~290 °C, whereas CoCl2 transformed drastically at ~180 °C.

Graphical Abstract

1. Introduction

Metal borohydrides (or tetrahydroborates) are complex hydrides containing BH4 anions counterbalanced by metal cations. Group I and II borohydrides (except Be) have pure ionic interactions between the cations and BH4 and thus strong B-H bonding, which renders the compounds particularly stable, decomposing only above 200 °C with typically pure H2 release [1,2]. In transition metal (TM) or mixed cation borohydrides, on the contrary, the interaction between the cation(s) and H of the BH4 group can be partially covalent, which significantly destabilizes the B-H bonding and promotes decomposition even below room temperature (RT), but with release of mostly B2H6 [3,4,5,6,7,8]. TM borohydrides can, in many cases, be obtained by reaction of the corresponding chloride with an alkali borohydride [5,8]. Due to their exceptionally high gravimetric hydrogen content (up to 18 wt% in LiBH4), metal borohydrides, both stable and unstable, have been extensively studied for hydrogen storage applications [2,9,10].
Magnesium borohydride (Mg(BH4)2) has one of the highest hydrogen densities (14.5 wt.% and >100 kg·m−3) [11,12,13,14]. DFT calculations have predicted its decomposition to a mixture of MgBx (or MgB12H12) with MgH2 below 100 °C, accompanied by H2 release [15,16,17,18]. Experimentally Mg(BH4)2 decomposes only at ~200 °C, which is still a low temperature compared to other stable borohydrides. The decomposition is a multi-step reaction, the path depending on the experimental conditions, and involves the formation of amorphous boron hydride compounds at 285 °C–320 °C [19,20,21,22,23,24,25,26,27]. Nevertheless, it has been shown that H→D substitution at the surface occurs at ~100 °C in γ-Mg(BH4)2 [28], which is a much lower temperature than seen in other ionic borohydrides [29,30,31], confirming a comparatively low stability of the B-H bonds in the compound. These inconsistencies between the theoretical stability of Mg(BH4)2 and experimental Tdec can be explained by kinetic barriers, such as H diffusion in the bulk [28], and/or the formation of intermediate phases disregarded in the calculations [32].
Addition of TM-based additives, e.g., oxides, halides, metal nanoparticles, has been one of the strategies used to enhance the hydrogen storage performance of borohydrides. After the report of Bogdanovic et al. [33] that Ti-based additives resulted in significantly improved hydrogen cycling properties of NaAlH4, this approach has been applied to a wide range of similar compounds and composites, including metal borohydrides [2,26,34,35,36,37,38,39,40,41,42]. The addition of several TM-compounds has indeed resulted in improved hydrogen storage properties of stable borohydrides and related composites, including decrease in Tdec [35,41], in some cases remarkably by as much as 200 °C [36]. Enhancement of the desorption and absorption reactions kinetics [26,42], improved hydrogen purity, reversibility [37] and borohydride synthesis from the decomposition products [39] has also been documented. A few studies have addressed the mechanisms of the additives’ “catalytic” activity [26,34,42,43]. It has been shown that the additives undergo chemical transformations and form alkali- or alkaline-earth metal halides [34], finely dispersed metal clusters or/and boride-like structures [26,42,43]. The latter can be stable upon cycling [26,42] or change the metal-B coordination numbers reversibly [43].
In our previous works [26,42] we have shown that Ni- and Co-based additives have an effect on the kinetics of hydrogen desorption and absorption in γ-Mg(BH4)2 [13]. Ex-situ X-ray absorption spectroscopy (XAS) studies have shown that the additives were chemically modified to compounds similar to Ni- and Co-borides after first decomposition of Mg(BH4)2. In this work we present a series of in-situ measurements involving quasi simultaneous monitoring of the changes in both the Co-additives and in γ-Mg(BH4)2. XAS spectroscopy was applied to follow the modifications in the additives, and synchrotron radiation powder X-ray diffraction (SR-PXD) with Raman spectroscopy were used to contemporaneously characterize the borohydride matrix. Additional characterization of the samples was performed by transmission electron microscopy (TEM) ex situ.

2. Results

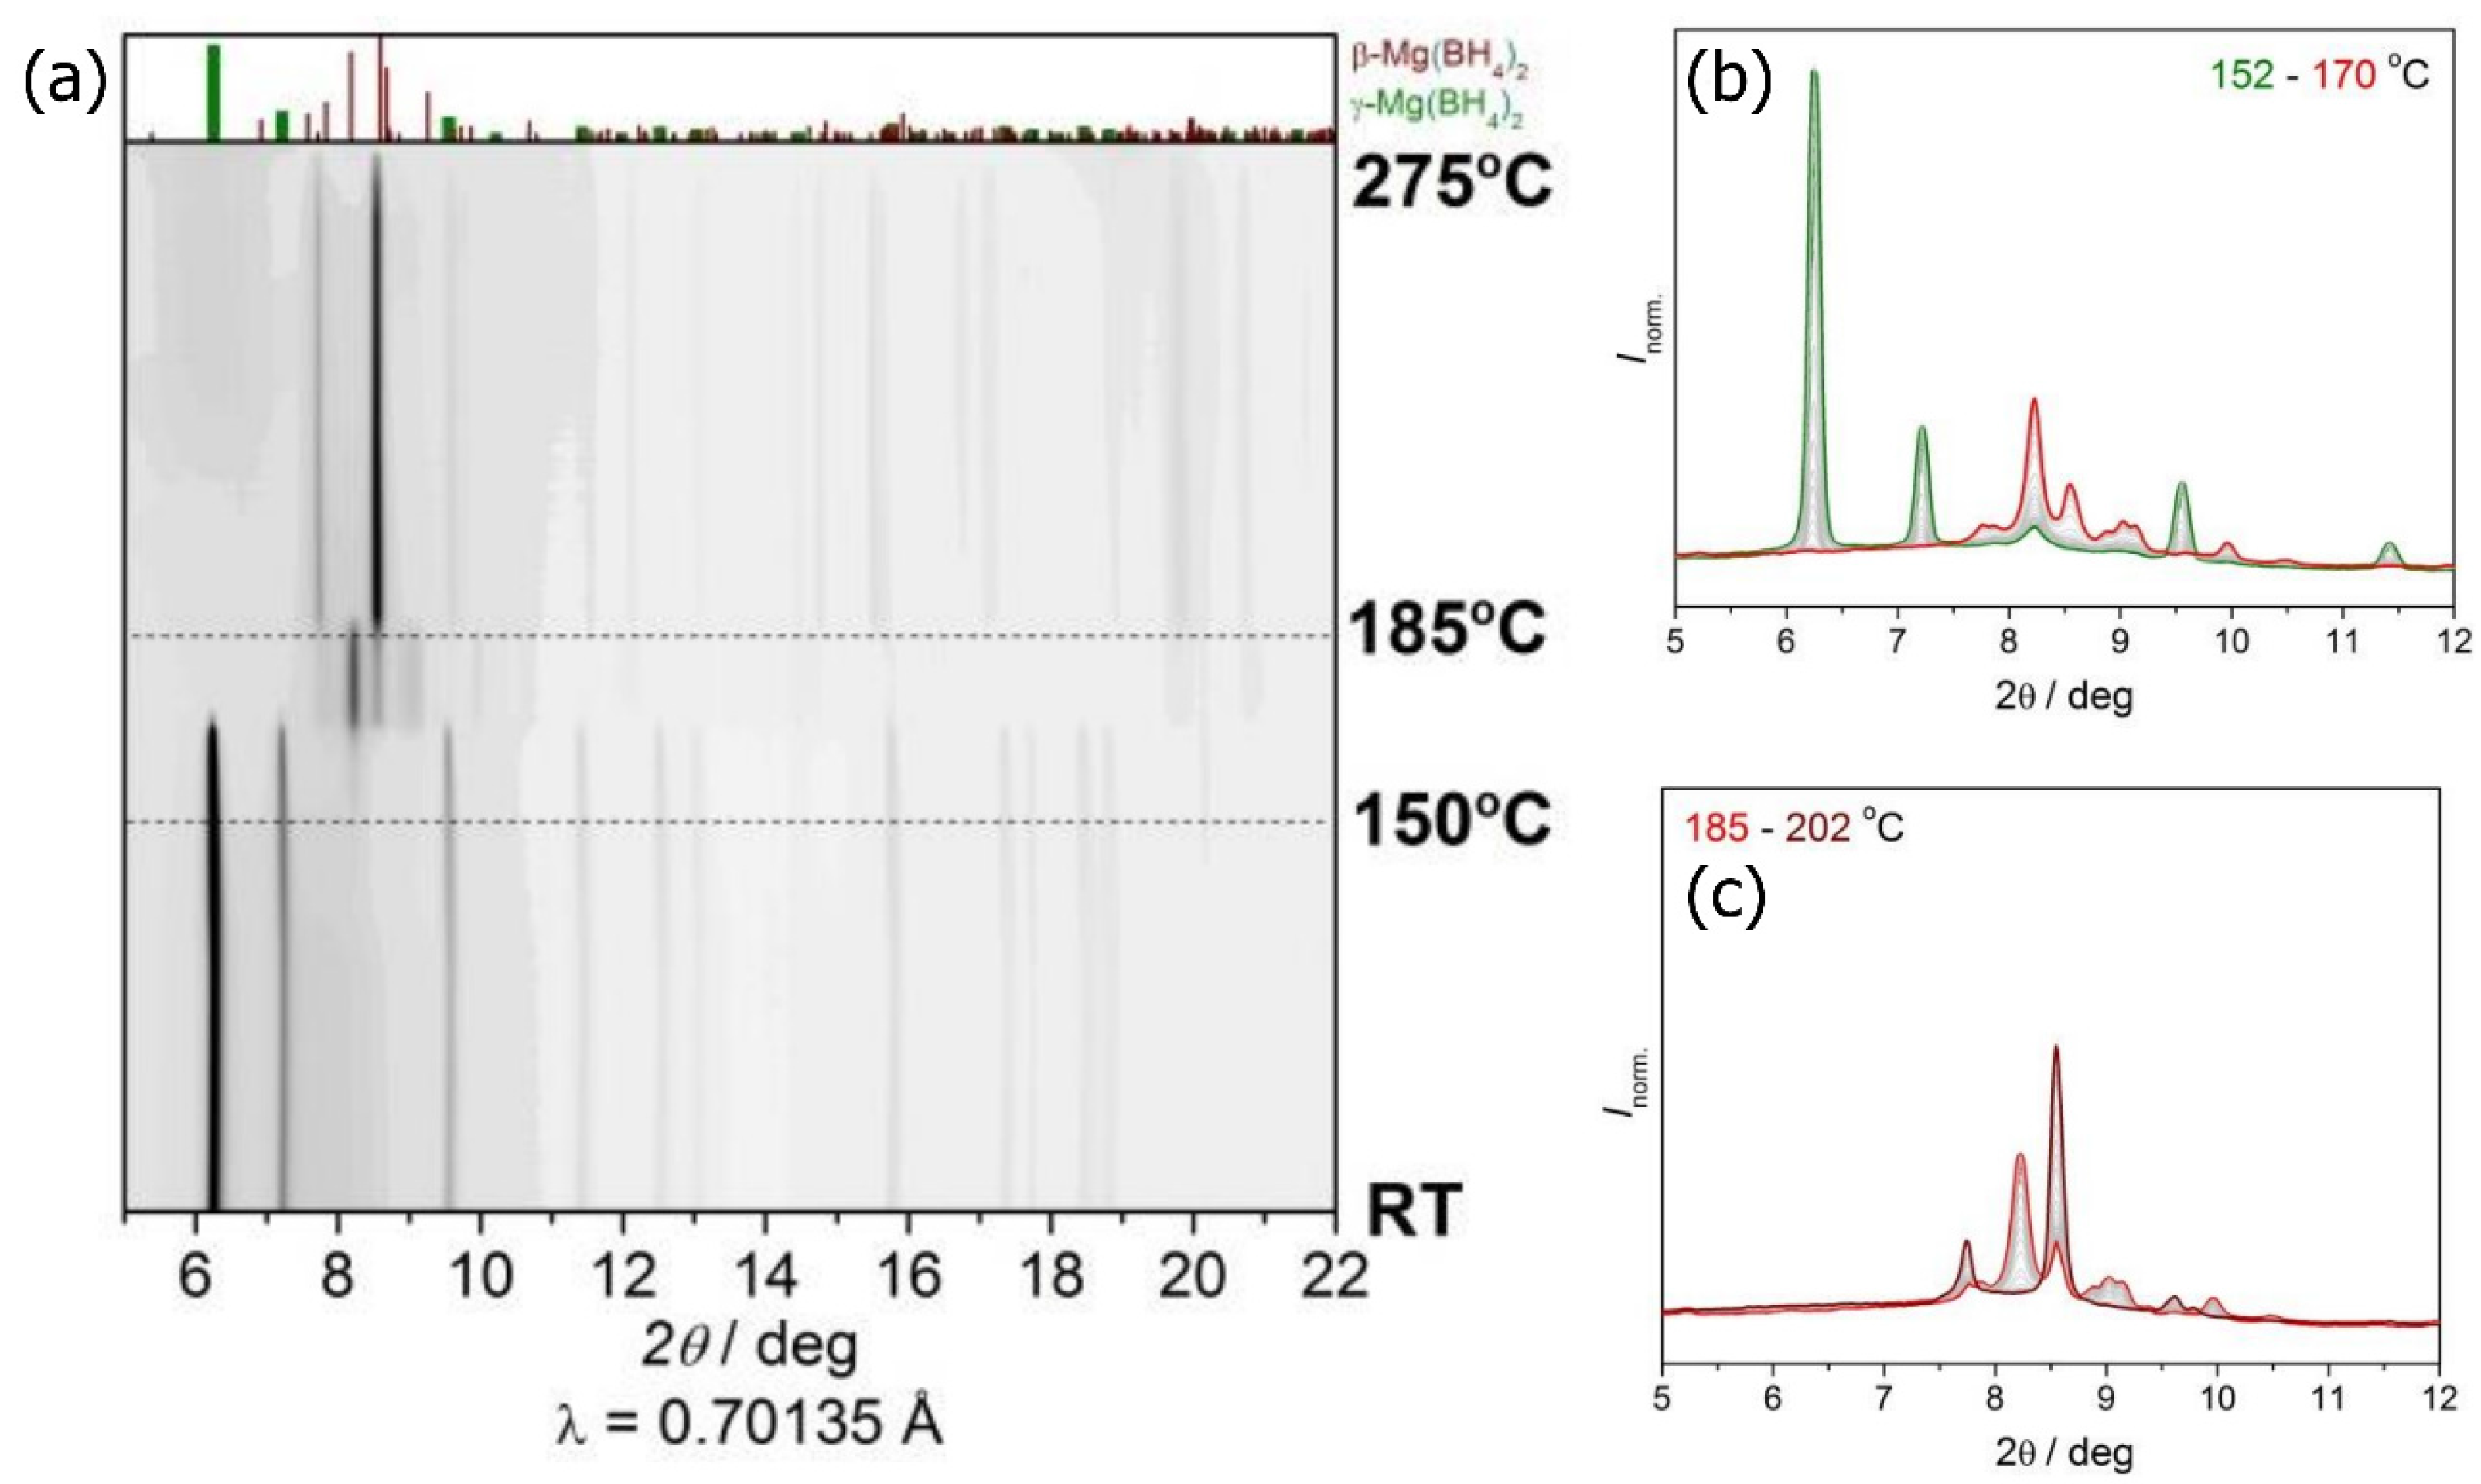
2.1. Synchrotron Radiation Powder X-ray Diffraction (SR-PXD) Study of Mg(BH4)2 Decomposition at 2.5 Bar H2

Figure 1 shows in-situ SR-PXD data upon heating the γ-Mg(BH4)2 at 2.5 bar H2 backpressure until the formation of amorphous phase(s) and/or melting at ~285 °C. The sample was ball-milled before the thermal treatment, following the same procedure adopted for the samples with the additives. The RT pattern of γ-Mg(BH4)2 (Figure 1) has a high background at small 2θ, which can be assigned to amorphous Mg(BH4)2 formed upon material storage [44] and milling [25]. In the 150–200 °C range, pure γ-Mg(BH4)2 underwent two phase transitions.
Figure 1. (a) In-situ synchrotron radiation powder X-ray diffraction (SR-PXD) of milled γ-Mg(BH4)2 obtained by heating the sample from room temperature (RT) to 285 °C at 5 °C/min and 2.5 bar H2. Detailed view: (b) γ → ε; and (c) ε → β′ phase transitions in γ-Mg(BH4)2.
Energies 08 09173 g001
The first phase transition (Figure 1b) to the commonly named ε-phase occurred in the 150–170 °C temperature range. The PXD pattern of this phase is similar to the one observed earlier [24]. The second phase transition (Figure 1c), to the disordered β-Mg(BH4)2 or β′-Mg(BH4)2 [45], was observed at 185–202 °C. At about 200 °C the peak intensities of β′-Mg(BH4)2 started decreasing, together with the simultaneous increase in the amorphous background, which indicated the onset of sample decomposition. At ~285 °C all crystalline reflections disappeared, in agreement with sample decomposition to the amorphous phases and/or melting [24].
Figure 2. In-situ characterization using (from top to bottom) SR-PXD, Raman and X-ray absorption (XAS) spectroscopies of the thermal decomposition of Mg(BH4)2 + 2 mol% CoF2 (C1 sample) in the RT-300 °C range in two different annealing environments: (ac) 2.5 bar H2; and (df) 1 bar Ar.
Energies 08 09173 g002

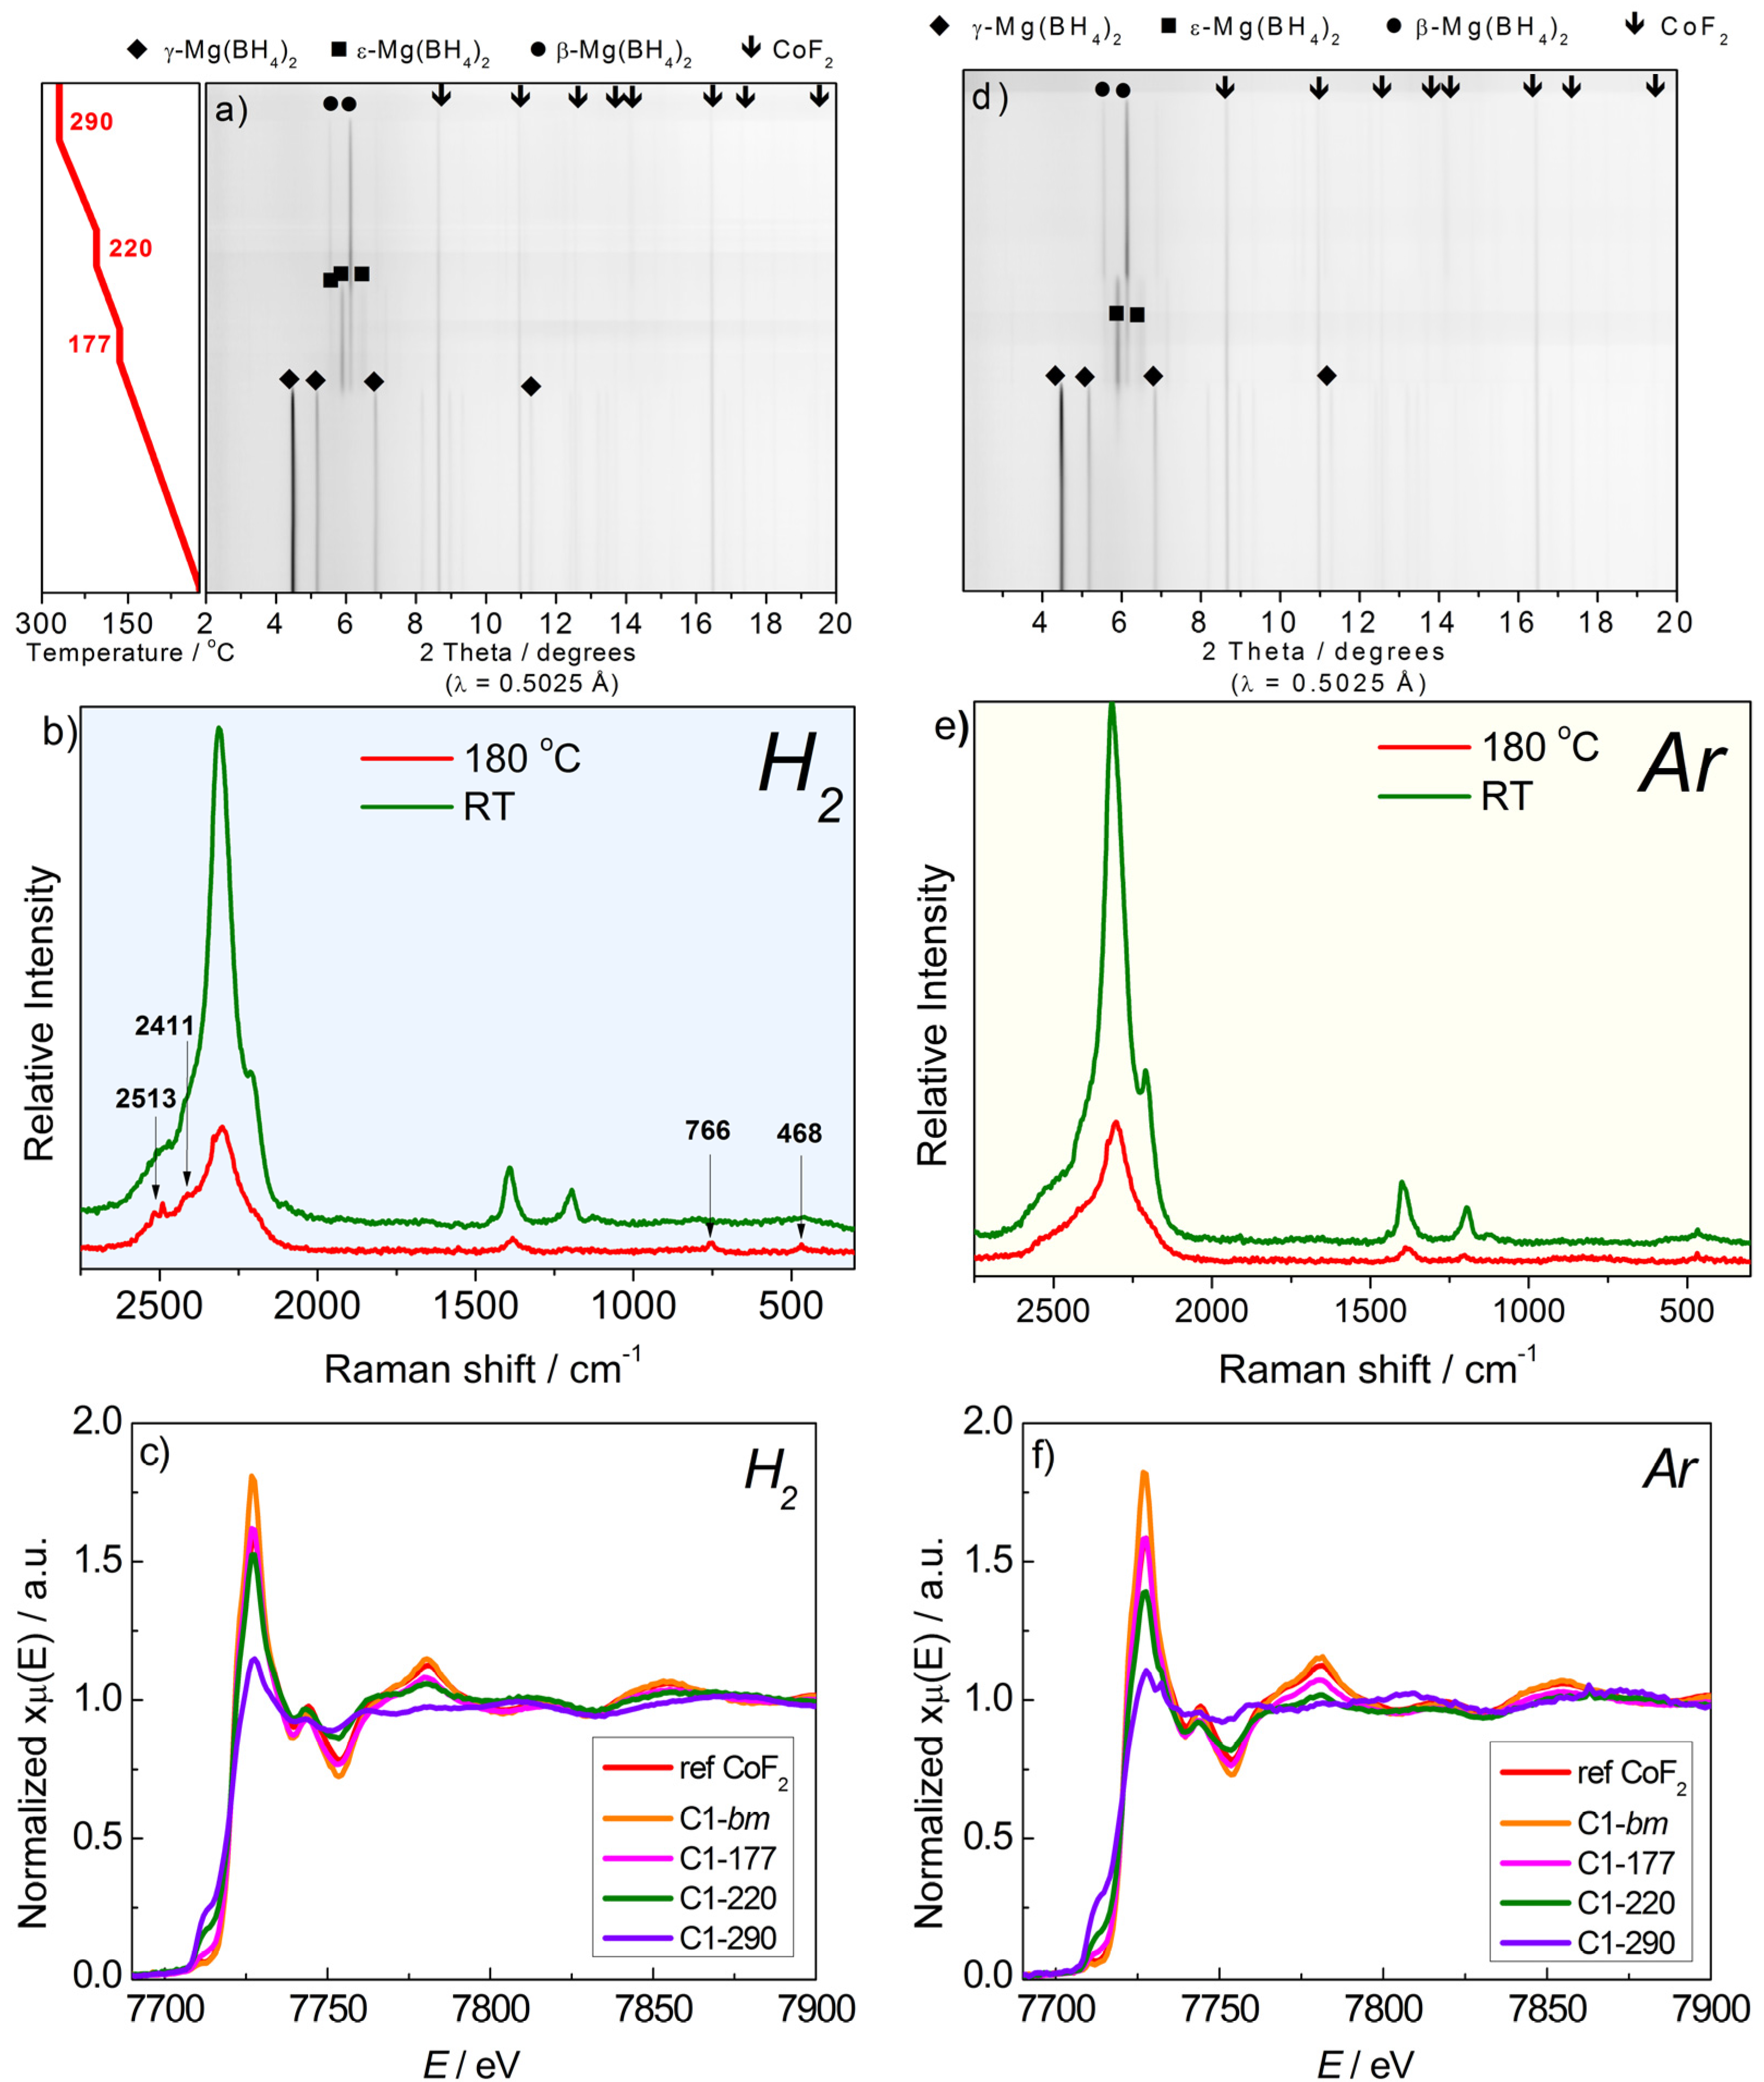
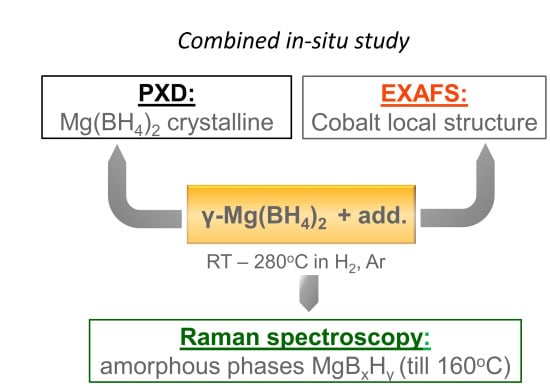
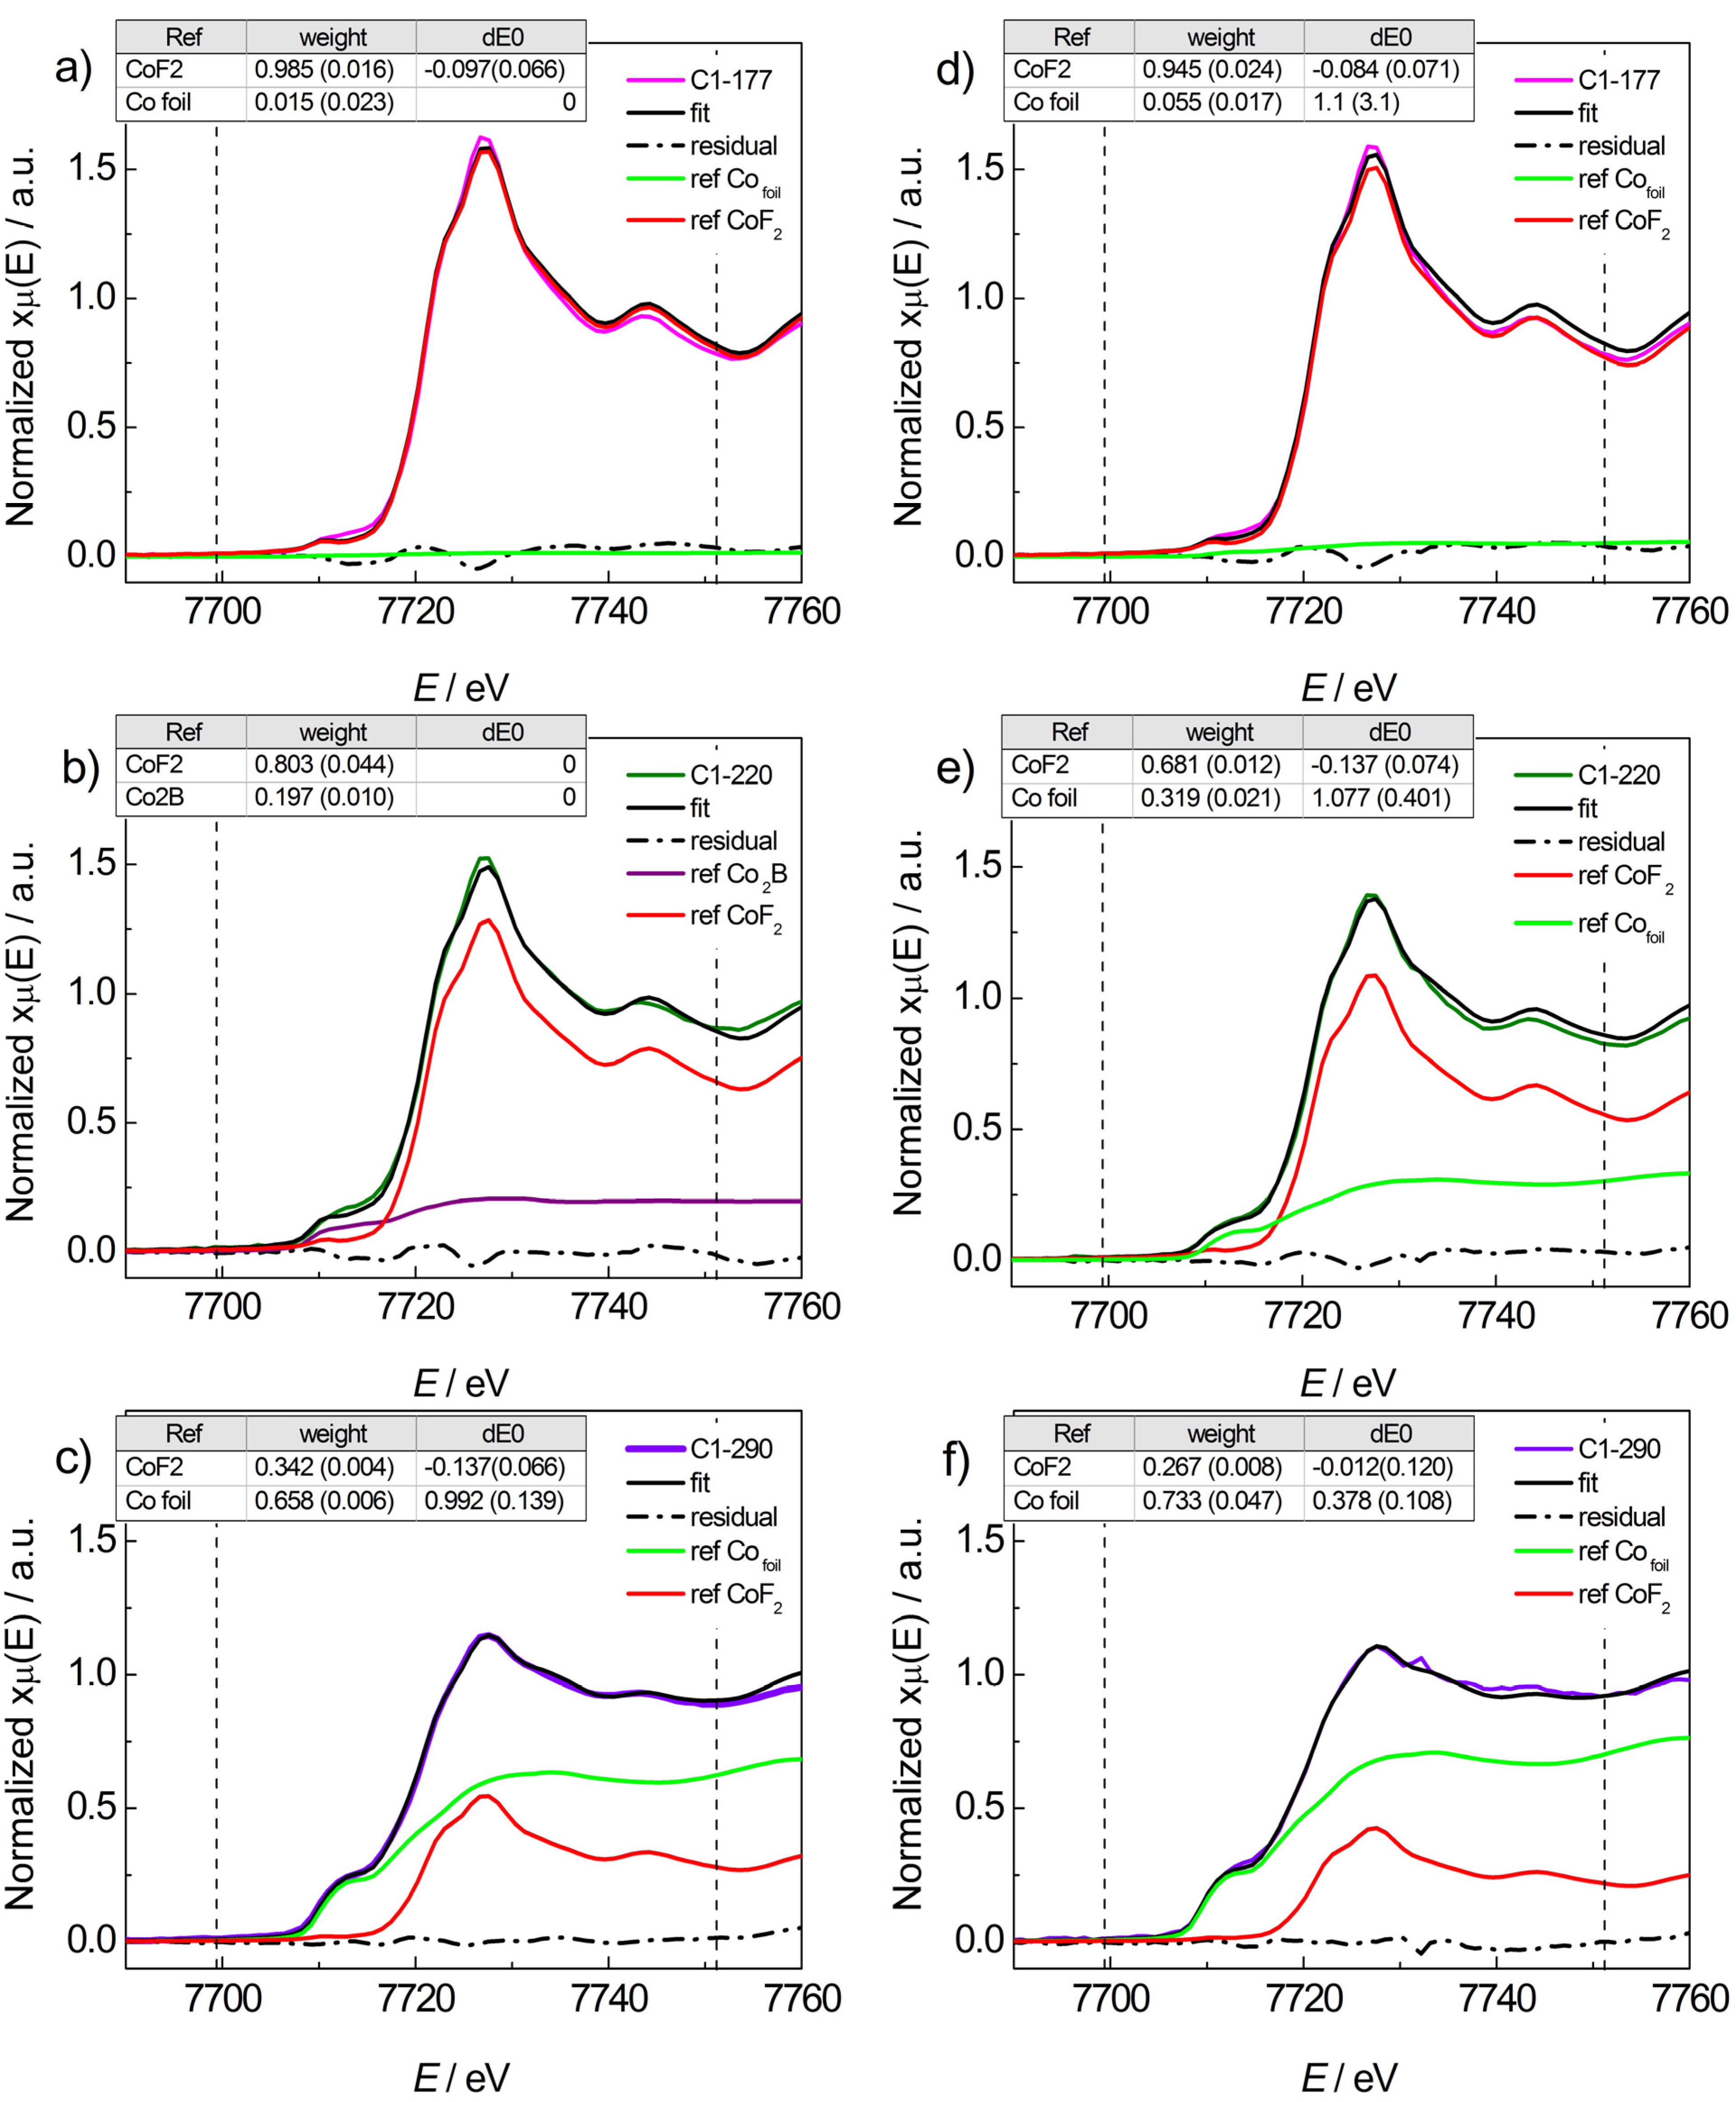
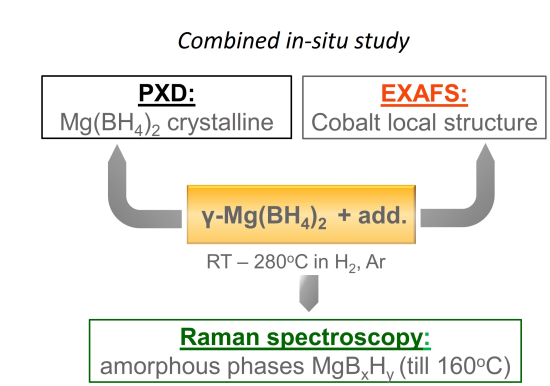
2.2. In-Situ X-ray Diffraction (XRD)/X-ray Absorption Spectroscopy (XAS)/Raman Study of Mg(BH4)2+Coadd Decomposition

2.2.1. Mg(BH4)2 + CoF2

Figure 2a,d show the series of in-situ SR-PXD data obtained while decomposing the sample Mg(BH4)2 + 2 mol% CoF2 (named C1) in 2.5 bar H2 (C1-H2) and 1 bar Ar (C1-Ar). The γ → ε phase transition in Ar was observed at a lower temperature than that in H2, in the ~105–160 °C range vs. ~130–175 °C in H2. The ε → β′ phase transition occurred at ~175–190 °C in the C1-H2 sample and at ~175–200 °C in the C1-Ar sample. Starting from about 220 °C, a change was observed in the amorphous background profile and in the β′-Mg(BH4)2 peaks intensities in the C1-H2 sample. Such changes can be related to the decomposition of Mg(BH4)2 to amorphous compounds.
Raman spectroscopy can be used to characterize both amorphous and crystalline phases. Raman spectra of the C1 sample in H2 and Ar obtained at RT before the measurements (Figure 2b,e) in the 2900–600 cm−1 region show peaks due to the vibrations of BH4 molecular ions [46]. The B–H stretching modes are centered at 2316 cm−1 (symmetric stretching, νsym), and the bending modes are located at ca. 1400 (symmetric bending, δsym), 1197 and 1120 cm−1 (asymmetric bending, δasym), respectively [46]. Scattering due to the overtones and combinations of BH4 bending were observed at ~2520 and 2208 cm−1. The weak broad peaks >500 cm−1 can be tentatively assigned to the librations of (BH4). The small peak at 468 cm−1 might be due to CoF2 [47]. Heating to 180 °C caused a gradual decrease of the intensities of (BH4) stretching and bending bands, due mainly to thermal effects since no decomposition is expected below 200 °C. No evident new peaks were observed during heating. At 180 °C, new vibrations appeared at 2513, 2411, and 766 cm−1 in samples heated in both Ar and in H2, although the intensities of these peaks were more pronounced in the spectrum of C1-H2. Unfortunately, further decomposition at >180 °C could not be followed with Raman measurements, the spectrum being obscured by a strong fluorescence background. This background may be related to the decomposition phase fluorescent with the used laser.
The crystalline additive CoF2 was observed in the SR-PXD patterns after ball-milling and throughout the in-situ measurement until 290 °C, when the Mg(BH4)2 either melted or decomposed to amorphous phases. The intensity of CoF2 peaks started to decrease only at ~220 °C, indicating a reaction of the fluoride during heating both in Ar and in H2.
Co K-edge XAS spectra of sample C1, obtained at the isothermal steps during the in-situ measurement in H2 and Ar are shown in Figure 2 (c and f, respectively). The spectrum obtained at RT (orange curve) is very similar to the reference CoF2, indicating that no chemical reactions occurred during ball-milling. No significant modification of the spectra was observed during heating up to 220 °C. However, the spectra obtained at 290 °C were considerably different, reflecting changes in the oxidation and coordination state of cobalt atoms. The high intensity of the white line in the spectrum at RT is characteristic for cobalt atoms in high oxidation states (CoF2, CoF3) and its decrease is an indication of reduction of cobalt atoms [26]. The observed modifications in the post-edge region (ca. above 7730 eV) suggest also changes in the structural environment around Co atoms. The final XAS spectrum was not similar to either Co2B, Co or CoF2, indicating that the additive had reacted to an intermediate phase or mixture of phases.
In order to clarify the nature of the intermediate phases, reference spectra of pure Co2B, Co or CoF2 were collected. The linear combination fitting (LCF) of the spectra of C1 decomposed in H2 and in Ar are reported in Figure 3a–f, respectively, for three temperatures: 177 (a,d), 220 (b,e) and 290 °C (c,f).
Figure 3. Linear combination fitting (LCF) of C1-H2 (ac) and C1-Ar (df) XAS spectra recorded (from top to bottom) at 177 °C, 220 °C and 290 °C using CoF2, Co, and Co2B as references. All combinations of the three references were used in the fit, with the weight sum set to 1; the edge energy parameter, E0, was freed and ΔE0 denotes its shift after fitting. The fit range is shown by vertical dashed lines. The errors are indicated in parenthesis.
Energies 08 09173 g003
LCFs of C1-H2 show that the additive was still primarily composed of CoF2 at 177 °C with a residual part converted in a new phase, which was present in too small quantity to be properly fitted. At 220 °C, the best fit was obtained with the CoF2 and Co2B references, whereas at 290 °C CoF2 and Co had to be used. Notably, the amounts of CoF2 regularly decreased in the spectra collected at increasing temperatures. However, the attempts to obtain better fits with consistently Co2B or Co for the 220 °C and 290 °C spectra were unsuccessful, resulting in unacceptably large shifts in E0 (>9 eV) and visibly bad fits. The poor fit at the two highest temperatures can be an indication of other than the references phase(s). On the basis of the LCF analysis, it can be suggested that at ~200 °C CoF2 formed borides which were transformed to metallic nano-clusters (giving no diffraction peaks) at higher temperature. The spectrum of C1-Ar sample (Figure 3d–f) obtained at 177 °C was best fitted with CoF2 and Co foil references, although the fit with CoF2 and Co2B (not shown) was only slightly worse. Notable is the large shift in the edge energy, ΔE0, (both in the fit with Co foil and Co2B) and small amount of the new phase. The large ΔE0 can indicate that the reference set was not strictly adequate to the actual composition of the additive and/or that the amount of the new cobalt phase was too low to obtain meaningful fit. The satisfactory fit with CoF2 and Co references of the C1-Ar spectra obtained at 220 °C and 290 °C indicates a gradual transformation of CoF2 to metallic cobalt with increasing temperature.

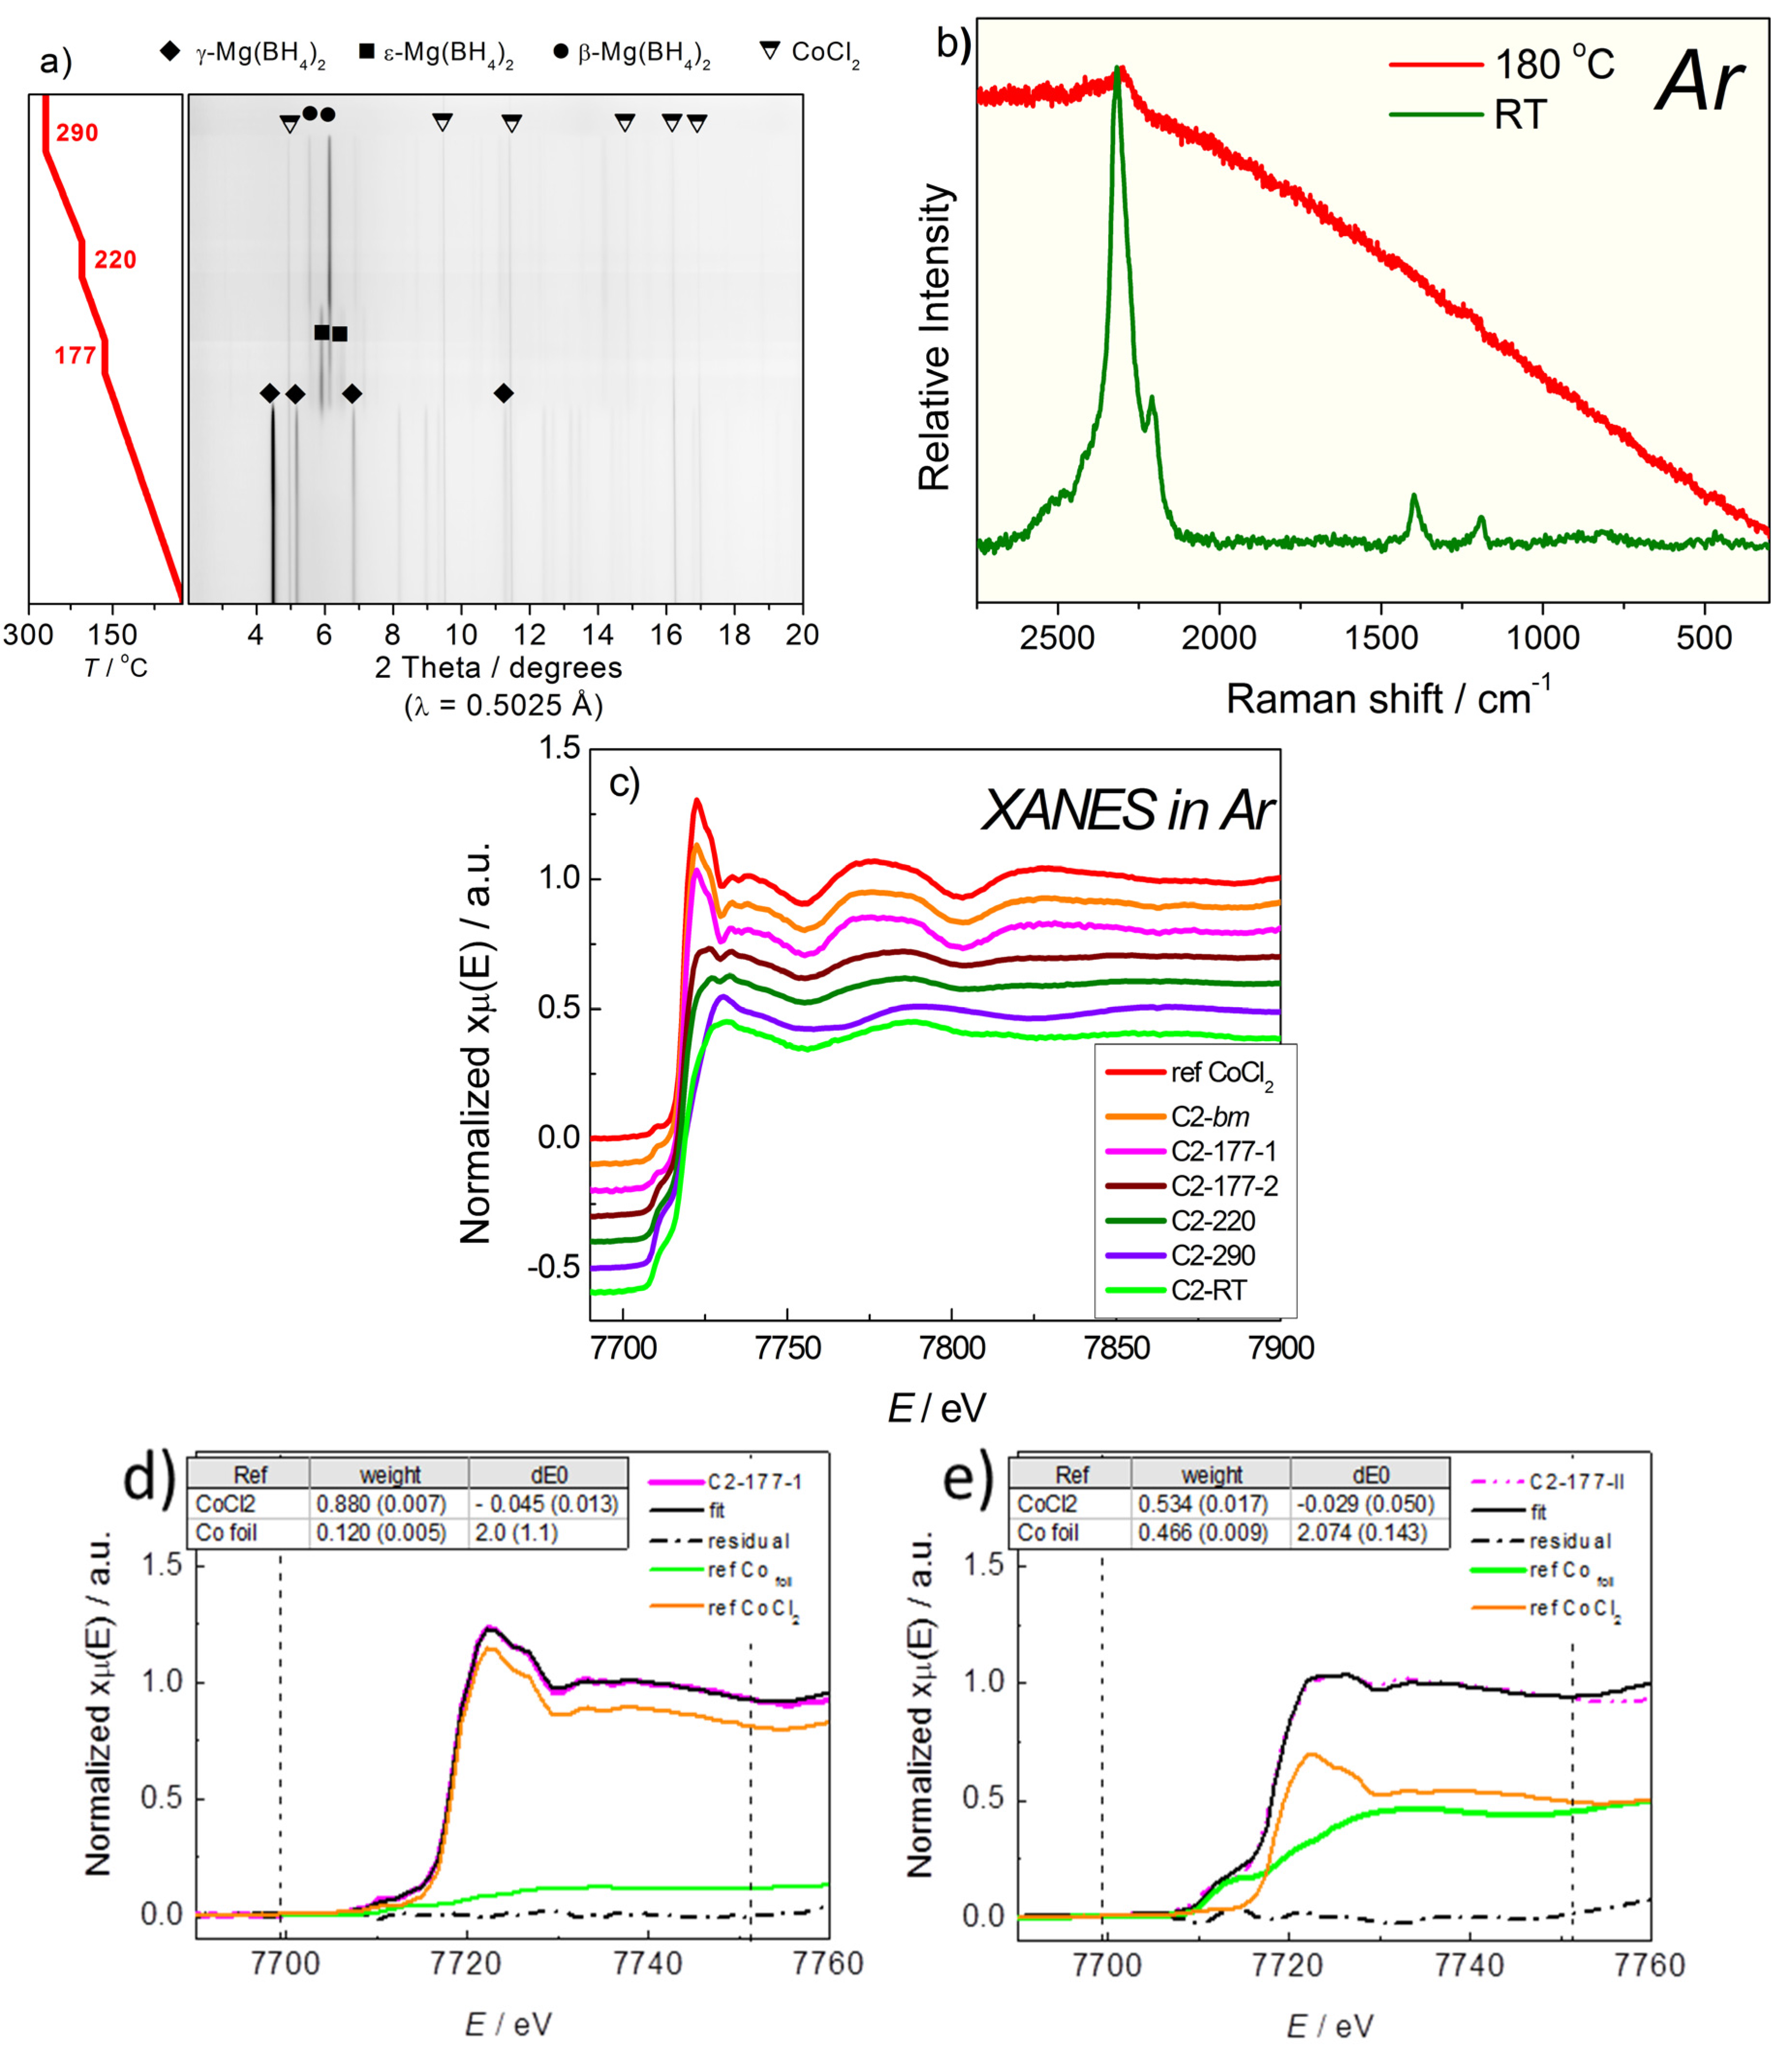
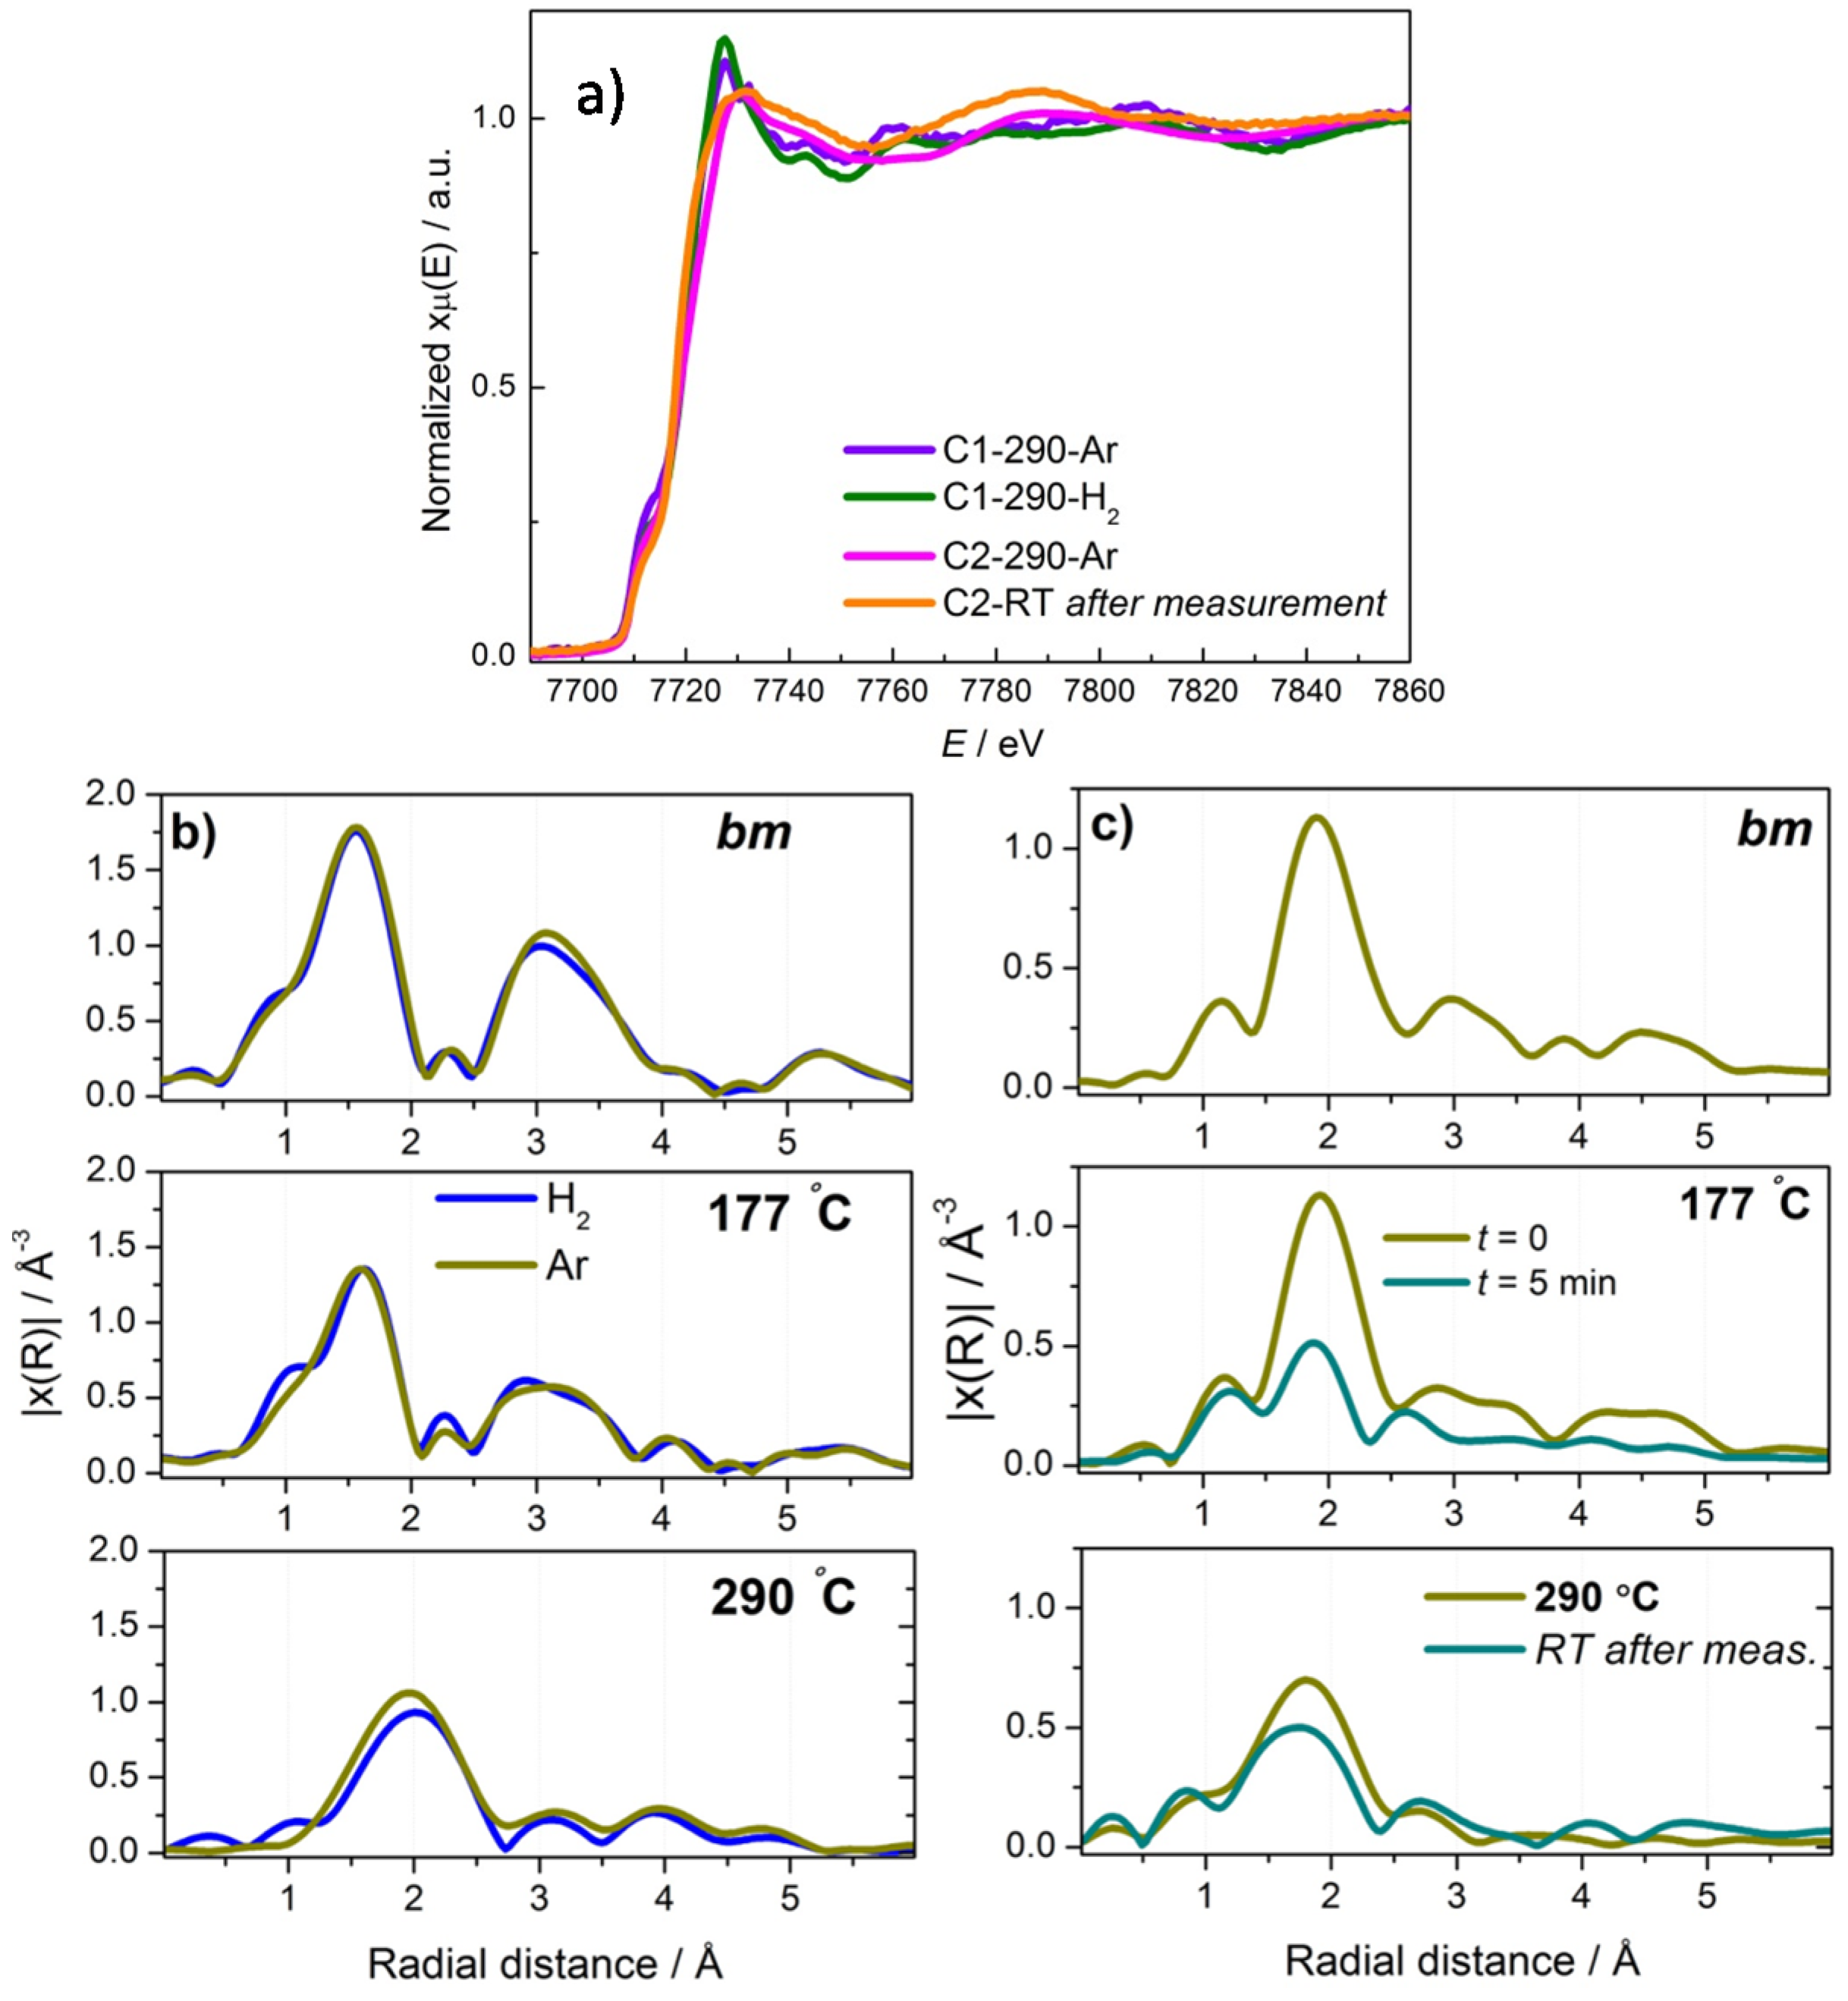
2.2.2. Mg(BH4)2 + CoCl2

Mg(BH4)2 + 2 mol% CoCl2 (named C2 in the following) was annealed only in Ar. The γ → ε and ε → β′ phase transitions in Mg(BH4)2 were observed at ~107–150 °C and ~177–190 °C, respectively (Figure 4a). The onset temperature for the decrease in the intensity of diffraction peaks due to β′-Mg(BH4)2 was ~220 °C. The Raman spectrum of C2 at RT was similar to that of samples C1 (Figure 4b, green line) but, at about 180 °C, the sample was already fluorescent and all vibrational features were obscured (red curve in Figure 4b).The diffraction peaks of the crystalline CoCl2 additive were observed in the PXD pattern of the sample after milling indicating that the additive had not reacted with Mg(BH4)2.
In the in-situ SR-PXD measurements (Figure 4a), the intensities of the peaks for CoCl2 remained unaltered up to 200 °C. At this temperature they started to decrease, and disappeared completely by 290 °C. On the contrary, in-situ XAS spectra (Figure 4c) showed a larger temperature dependence of Co coordination and oxidation state. A strong change in the XAS spectra was observed during the 177 °C isotherm. In particular, after 5 min at 177 °C the spectrum (Figure 4c, brown curve) was very different from the one recorded at RT. It suggests that the local environment around cobalt in the CoCl2 additive was significantly altered already at this temperature. LCF of the first spectrum in the sequence at 177 °C (Figure 4d) indicated that Co was present mostly as CoCl2 (~88%). However, the spectrum recorded only after ~5 min shows that the amount of CoCl2 was reduced by half (Figure 4e). A nano-scale dimension of the Co particles could explain the absence of the peaks due to metallic Co in the SR-PXD patterns. The residuals in the fitting of the XAS-data indicate that, as for the C1-Ar and C1-H2 sample, a considerable amount of Co atoms were in the oxidation/coordination states different from those of the references. Further changes were observed in the spectrum obtained at 290 °C. Fitting this spectrum with the available references was unsuccessful, indicating that the Co atoms were mainly bound in unidentified compounds. The XAS spectrum obtained by quenching C2-Ar at RT after the experiment (light green curve in Figure 4c) showed further chemical transformations of the Co-additive. Also in this case, LCF did not give any meaningful results with the available references.
Figure 4. In-situ characterization of the thermal decomposition of Mg(BH4)2 + 2 mol% CoCl2 in Ar in the RT-290 °C range. (a) SR-PXD at increasing T; (b) Raman spectra at RT (green) and at 180 °C (red); (c) Co K-edge XAS spectra of CoCl2 reference (at RT) and C2 recorded at different temperatures and at RT after the measurements (light green). XAS spectra are y-offset for clarity. LCF of C2-Ar with CoF2, Co, and Co2B references: at 177 °C (d) and after 5 min at 177 °C (e). All combinations of the three references were used in the fit with the weight sum set to 1; the E0 parameter was freed. The fit range is shown by dashed lines. The errors are indicated in parenthesis.
Energies 08 09173 g004
The as-milled sample was additionally characterized by TEM (Figure 5). A TEM image (Figure 5a) illustrates variable size of the sample particles ranging from some tens of nanometers to over a hundred nanometers. Figure 5b shows a dark-field scanning (S)TEM image of several particles in the sample, along with the corresponding energy dispersive spectroscopy (EDS) maps. The Mg map identifies the main Mg/B phase particles. Figure 5c shows electron energy loss spectroscopy (EELS) spectra obtained from three different representative positions in the sample. The positions of the B-K, Cl-L2,3, C-K, O-K and Co-L2,3 peaks are indicated. Curve 1 from a discrete particle of the additive phase exhibits strong peaks due to Cl and Co. Carbon in the spectrum is due to the slight contamination of the sample and the fact that the electron beam was passing through the carbon support film. Curves 2 and 3 were obtained from the positions indicated in the STEM image of an aggregate of particles shown in the dark-field STEM image of Figure 5d.
Curve 2 is from the main part of the particle. The prominent oxygen peaks indicate some oxidation of the sample which could have happened during transportation and handling. A strong B peak is also present and the EELS map for this element is also shown on the Figure 5d. There is no Mg peak in the energy range of the EELS spectra, but the presence of this element was confirmed by the Mg map of Figure 5b, which includes the aggregate of Figure 5d.
Figure 5. Transmission electron microscopy (TEM) observations of C2-bm sample. (a) TEM image showing Mg(BH4)2 particles dispersed on C support film; (b) STEM image and EDS maps; (c) EELS spectra from different positions in the specimen; (d) STEM image and Boron EELS map from region included in (b).
Energies 08 09173 g005
The Co and Cl maps indicate similar distributions of these elements confirming that most of the additive remained as CoCl2 phase after milling and confirming the PXD results. However, the maps show also that a small amount of the elements is associated with the Mg/B phase, which suggests breaking up of CoCl2 and its incorporation into the borohydride matrix. It should be mentioned that the EDS maps are susceptible to variations in background intensity when the level of elements is low.
Spectrum 3 of Figure 5c was obtained from a small area at the particle surface. It shows the presence of Co, in addition to B and O, and relatively smaller amount of Cl, which suggests that a small amount of a chlorine-less phase of cobalt had formed at the particle surfaces during ball milling. In this way, TEM and SR-PXD analyses (Figure 4) show that most of CoCl2 additive did not react with the sample during ball-milling.
A comparison between the XAS spectra of the C1 and C2 samples obtained at 290°C is shown in Figure 6a. It is clear that the CoF2 and CoCl2 additives did not form identical compounds at this stage (violet and pink curves). In particular, cobalt in CoF2 at 290 °C both in H2 and Ar preserves higher oxidation state than the cobalt in CoCl2. This is evident both from the slightly higher edge energy (7721 eV vs. 7718 eV in CoF2 and CoCl2, respectively) and more intense white line. Meanwhile the XAS spectra of CoCl2 obtained at 290 °C and at RT after the measurements also show some differences which can probably be explained by temperature-related changes in the cobalt coordination state.
Figure 6. (a) Co K-edge XAS spectra of the C1 sample at 290 °C obtained in Ar (violet line) and H2 (green line) and XAS spectrum of C2 sample at 290 °C in Ar pink curve). The spectrum recorded after quenching C2 at RT is also reported for comparison (yellow line). Co K-edge k2-weighted FT-transform moduli of the EXAFS signals (phase-uncorrected) at different temperatures of (b) C1-H2 and C1-Ar and (c) C2-Ar.
Energies 08 09173 g006
Fourier transform of the extended X-ray absorption fine structure (FT-EXAFS) spectra are presented in Figure 6b, c for samples C1 and C2, respectively. These graphs show the moduli part of the FT of the k2-weighted EXAFS signal. The latter represents the radial distribution function centered on Co atom. The position of each peak in the FT corresponds to an average length (after phase correction, Δφ) of a single scattering path or to the convolution of more than one path, whereas the intensity is related to the number of the nearest neighbors and structural disorder in the system.
In the spectrum of C1-bm (CoF2 additive, Figure 6b), the first (and most intense) peak at 1.56 Å corresponds to the backscattering from the six fluorine atoms in the first coordination shell of cobalt [26]. These atoms are located at 2.01 and 2.06 Å, thus giving the phase difference, Δφ, of 0.45–0.5 Å. This first peak shifts to 1.63 and 1.96 Å upon heating to 177 °C and 290 °C, respectively (Figure 6b). The reduction in the peak intensity can be explained by structural disorder around cobalt and/or decrease in the coordination number. The peaks at 2.5–4.2 Å are composed by several contributions from different scatterers with predominant contributions from cobalt atoms at 3.2 Å and 3.7 Å and from F atoms at 3.6–3.8 Å [26]. The intensity of these peaks decreased significantly with temperature (Figure 6b) reflecting more disorder in the distant coordination shells. At 220 °C, a new peak at 2.2 Å appeared in the spectra, which shifted to 2.0 Å at 290 °C and became the only feature in the spectra. These changes in cobalt environment upon heating can be explained by atomic rearrangements around cobalt. Firstly, the Co-F distances increase by ~0.1 Å due to the thermal lattice expansion and a simultaneous decrease in the number of the first shell neighbors. Above 200 °C new neighboring atoms appeared around cobalt with the new coordination shell formed at ~2.45 Å (2.0 + Δφ). This value is very close to the interatomic distances in cobalt metal (2.42 Å). Furthermore it can be noted that the EXAFS spectra (Figure 6b) obtained at 290 Å do not exhibit the shoulder at low radial distance which would correspond to the first-shell B neighbors [26]. Thus, it can be suggested that cobalt metal clusters, rather than cobalt boride species, were the predominant phases formed by the CoF2 additive in this study. The changes in cobalt environment observed upon C1 decomposition in Ar and H2 were very similar, suggesting a small effect of the atmosphere on the chemical transformations in the additive in the present temperature range. Therefore, the slight difference in the γ-ε phase-transition and decomposition temperature of Mg(BH4)2, observed in the in-situ SR-PXD (Section 2.2.1) should be attributed to the different atmosphere.
The analysis of the EXAFS spectra conducted for the C2 sample (CoCl2 additive) is shown in Figure 6c. Also in this case the radial distribution function for the as milled sample indicates that the additive was essentially unreacted during the milling. In fact, the most intense peaks at 1.9 Å and 3.0 Å are due to the scattering from Cl and Co neighbors located in CoCl2 at 2.5 and 3.6 Å, respectively (Δφ = 0.6 Å) [26]. Up to 177 °C (Figure 6c), the FT-EXAFS spectra indicates the presence of only one cobalt species, CoCl2. In the spectra collected after 5 min at 177 °C, a significant change in the local cobalt environment is evident (Figure 6c, 177 °C cyan curve). A strong reduction in the intensity indicates also a highly disordered coordination environment which was preserved upon heating up to 290 °C and after cooling the sample down to room temperature. In the new cobalt phase the nearest neighbors were located at the distances 2.3–2.4 Å, if the Δφ obtained from fitting the CoCl2 reference is used.

2.3. Discussion

It has been repeatedly shown that TM-additives, particularly halides, react with the host complex hydride matrix [26,34,42,43]. Even the borides lose long-range order, although preserving the local environment around the metal [26,42]. Therefore, these types of compounds cannot be called catalysts in the classical meaning. Our in-situ study demonstrates that this is also the case for Co-based additives, although some differences can be noticed between CoF2 and CoCl2. CoCl2 already reacted with Mg(BH4)2 at 177 °C, whereas CoF2 was slowly reduced upon heating above this temperature. At 290 °C both the additives produce highly disordered phases that, however, differ slightly from each other. The EXAFS extraction allowed some information about the cobalt environment in these compounds to be obtained, but their precise nature remains somewhat unclear. In particular, CoF2 forms the species with the first coordination shell at ~2.45 Å whereas for CoCl2 a 2.3–2.4 Å distance was suggested for the first neighbors. Linear combination fits of the Co K-edge XANES spectra indicate that cobalt metal rather than cobalt boride is formed upon reduction, with the concomitant presence of other, unidentified, phases. In our previous ex-situ study [26], we have found that cobalt additives transform into boride-like species upon cycling with Mg(BH4)2. Nevertheless, in that study the ex-situ XAS measurements were performed at least one month after cycling. It may indicate that borides could be formed upon further cycling in H2 and/or ageing of the samples. The in-situ XAS spectra have shown also a gradual change in the cobalt environment in the additives which rules out the low-temperature formation and decomposition of cobalt borohydride. TEM observations suggest that some of the Co was incorporated into the hydride surfaces.
Table 1 summarizes the phase-transitions and decomposition temperatures of the samples, as observed by in-situ SR-PXD in this study. It is notable that the γ→ε phase transition occurred about 45 °C lower in the samples with CoF2 and CoCl2 decomposed in Ar than in pure milled Mg(BH4)2. In the C1-H2 sample this temperature was lowered by only 20 °C. A destabilization of the γ phase (and then a decrease in the temperature of γ → ε transition) can be explained on the basis of the effect of the additive on the metastable nature of the porous γ-Mg(BH4)2. A smaller effect was observed also in the onset temperature of the ε → β′ phase transition, which was lowered by 10 °C in all cases. The Tdec, which was defined as the onset of the decrease in the diffraction peaks intensities of the β' phase and increase in the amorphous halo intensity, was similar for all the samples. C1-H2 appeared to be stabilized by the CoF2 additive. It is noteworthy as only in this case the LCF of the XANES spectra did not evidence the partial transformation of the Co-additive in Co metal particles for T lower than 220°C.
Table 1. Summary of phase transition and decomposition temperatures of the Mg(BH4)2 samples obtained in this study.
EventMg(BH4)2 Milled-H2C1 (Mg(BH4)2 + 0.2 mol% CoF2)/H2C1 (Mg(BH4)2 + 0.2 mol% CoF2)/ArC2 (Mg(BH4)2 + 0.2 mol% CoCl2)/Ar
γ → ε phase transition150–170 °C130–175 °C105–160 °C107–150 °C
ε → β′ phase transition185–202 °C175–190 °C175–200 °C175–190 °C
Decomposition>200 °C>220 °C>200 °C>200 °C
Raman spectra of C2-Ar have shown that the sample became strongly fluorescent at 180 °C, whereas C1-H2 and C1-Ar still had well defined Raman scattering. This could indicate that the CoCl2 lowers Tdec of Mg(BH4)2. At the same time, since the PXD data have shown similar decomposition temperatures for both C1 and C2, the fluorescence could also originate from the reacted cobalt additive. Raman spectra of the C1-H2 gave also the peaks at 2513, 2411, and 766 cm−1, belonging to an unidentified boron hydride phase. The values at 2513 cm−1 and 2411 cm−1 are similar to the BH stretching in higher boron hydrides whereas the peak at 766 cm−1 is in the range of the B–B stretching of these compounds. It is notable that no peaks were observed in the 1800–2200 cm−1 region where the B–H–B stretching of bridged hydrogen atoms should appear [48].
The question on how Co-additives affect the decomposition process of Mg(BH4)2 is intriguing, especially taking into account the literature results on Ni and Co-additives effect on the decomposition of borohydrides and related compounds. It should be noted though that the most prominent results, such as dramatic decrease in Tdec, was observed for the samples where additives were combined with other destabilization approaches, for example, dispersion in the highly porous media [36,43] or mixing with electron-rich compounds [41]. The effects of pure additives on pure borohydrides could thus be attributed simply to chemical reactions between the two and the ball-milling process usually used to prepare the composites. The large effect of the ball milling alone on the partial decomposition and rehydrogenation of pure Mg(BH4)2 was recently demonstrated [26].

3. Experimental Section

All procedures were carried out in a glove box under a continuously purified Ar atmosphere (O2, H2O < 1 ppm) if not stated otherwise. Commercial γ-Mg(BH4)2 (95%, Sigma-Aldrich, St. Louis, MO, USA) was used. XRD analysis of this sample showed that the crystalline fraction of this batch was constituted by γ-Mg(BH4)2. CoCl2 (99.999%), and CoF2 were purchased from Sigma-Aldrich. The starting powder mixtures consisted of Mg(BH4)2 and 2 mol% of an additive (Coadd). The milling was carried out in stainless steel vials and balls with a 40:1 ball-to-powder weight ratio. Pure Mg(BH4)2 and the additives were milled for 1 h at 280 rpm under 1 bar Ar pressure.
In-situ SR-PXD of the ball-milled γ-Mg(BH4)2 decomposition was performed at the Swiss-Norwegian Beam Line (station BM01A) at the European Synchrotron Radiation Facility (ESRF) in Grenoble, France. The X-ray wavelength λ = 0.70153 Å was used. The combined in-situ SR-PXD, XAS, and Raman spectroscopies data were collected at the station BM01B at ESRF [49]. For the measurements in Ar, the samples were placed in borosilicate capillaries (1.0 mm in diameter) and sealed in the glove-box with the air-tight glue. For the measurements in H2, the capillaries were attached to a sample holder enabling connection to a gas line. Before the measurements in H2, the samples were degassed in vacuum at RT, and 2.5 bar H2 pressure was set in the capillaries. The capillaries were heated by a calibrated hot blower. Temperature calibration was carried out with In and Sn standards (experimental melting points were obtained at the nominal temperatures 145 (In) (theoretical. 156.61 °C) and 219 (Sn), theoretical 231.9 °C). The samples were heated up to 290 °C with a 5 °C /min heating rate with two isothermal pauses at 177 °C and 220 °C of 60 min. After reaching 290 °C, the samples were kept at that temperature for several hours. SR-PXD data were collected every 0.5 min during the heating ramps and every 4 min at the isothermal steps. XAS scans were obtained during the isothermal steps every 5 min. Raman spectra were collected during the experiments until the samples became fluorescent at about 180 °C.
SR-PXD data were collected with a wavelength of 0.5025 Å. 2D images were obtained with an exposure time of 30 s using an image plate detector. A number of dark-current images (17–90 for different ramps and isothermal steps) were obtained before the sample scans, averaged, and subsequently subtracted from the sample images.
In-situ XAS data were collected in the XANES and EXAFS regions in the energy range 7.6–8.6 keV comprising Co K-edge at 7.7089 keV in transmission mode using a double crystal Si (111) monochromator. The spectrum of the Co foil (hcp) was used as a reference for data calibration and alignment. The spectra of the reference powders—CoF2, CoF3, CoCl2, used in the preparation of the composites, and additionally Co powder (99.5%, Alfa Aesar, Ward Hill, MA, USA), Co2B (American Elements, Los Angeles, CA, USA), and CoO (>99.99%, Aldrich) were measured diluted with boron nitride to 2 mol% of Coadd. XAS data analysis was carried out with DEMETER software pack (ATHENA and ARTEMIS, B. Ravel and M. Newville, Brookhaven National Laboratory, Upton NY, USA) [50]. The spectra were pre-processed in ATHENA (background subtracted, aligned, the step scans were averaged and used for final plots and fitting). Liner combination analyses (fits, LCF) in the range from −30 eV to +20 eV were performed with the ATHENA software. Calculation of the theoretical scattering paths in the EXAFS region and fitting were performed with the FEFF6 code [51] using ARTEMIS. Due to the low concentration of the additive and the small sample quantities required by the capillaries in the experimental set-up, the energy step was low and the spectra obtained were rather noisy, especially in the EXAFS region. Therefore, several consequent spectra, obtained at the higher temperatures were merged in order to increase the signal to noise ratio.
Raman spectra were collected on an RA 100 Raman analyzer (Renishaw, New Mills, UK) using a 532 nm (green) excitation wavelength in backscattering mode with exposure times of 200 s and step of 1.2 cm−1 over a 3200–200 cm−1 range.
TEM was performed in the NORTEM TEM Gemini Centre, Norwegian University of Science and Technology (NTNU), Norway, using an ARM200F instrument (JEOL, Tokyo, Japan) operating at 200 kV. A JEOL Centurio detector was used for EDS analysis and a Gatan and EELS using a Gatan Quantum imaging filter. As-milled sample was studied. Sample preparation was performed in a glove box. A small quantity of the powder was crushed in a mortar and dispersed onto a standard holey carbon film on a Cu support grid. The sample was rather stable under the electron beam.

4. Conclusions

The in-situ study combining X-ray diffraction and absorption, and Raman spectroscopy allowed us to follow several aspects of the decomposition of Mg(BH4)2-Coadd system simultaneously, i.e., changes in the crystalline and amorphous Mg(BH4)2 matrix and in the cobalt-based additives. This approach can provide valuable knowledge on the decomposition process of complex (molecular) hydrides and effect of the metal-based additives on this process. It allowed us to follow the reaction during the thermal treatment, pointing out that the cobalt was reduced by Mg(BH4)2. CoF2 was found to be more stable at a higher temperature than CoCl2. In-situ XAS measurements suggested that Co-additives form metal clusters rather than CoBx species upon reduction. In case of CoCl2 additive, TEM observations suggest that small amount of the Co was incorporated into the hydride surfaces already after ball-milling although the main additive phase remained as CoCl2. The identification of the amorphous fraction of the Mg(BH4)2 decomposition products by means of Raman scattering was hindered by fluorescence with the 532 nm laser, and the data obtained at higher temperature were not very informative. However, we were still able to observe that one of the decomposition products had the vibrational modes at 2513, 2411, and 766 cm−1, belonging to an unidentified boron hydride phase. These vibrations are very similar to the ones measured by means of infrared spectroscopy in a previous study on Mg(BH4)2 decomposition [52].

Acknowledgments

This work was financed by the European Fuel Cells and Hydrogen Joint Undertaking under collaborative project “BOR4STORE” (Grant Agreement No. 303428). Partial financial support from SYNKNØYT program in the Research Council of Norway is greatly acknowledged. TEM analysis was supported by the NORTEM (Grant 197405) within the program INFRASTRUCTURE of the Research Council of Norway (RCN). NORTEM was co-funded by the RCN and the project partners NTNU, UiO and SINTEF. We thank the beamline scientists Paula Abdala, Herman Emerich, and Wouter van Beek at the BM01B SNBL for their help with the measurements.

Author Contributions

Stefano Deledda, Bjørn C. Hauback, Jiri Muller, Ivan Saldan, and Olena Zavorotynska have initiated the research and planned the experiments. Olena Zavorotynska, Ivan Saldan, Jenny G. Vitillo, and Matylda N. Guzik have carried out most of the experimental work and analyzed the results. Olena Zavorotynska wrote the manuscript with substantial revisions from Jenny G. Vitillo and Stefano Deledda; John C. Walmsley carried out TEM measurements and data analysis. All the authors significantly contributed to the editing and improvement of the manuscript.

Conflicts of Interest

The authors declare no conflict of interest.

References

  1. George, L.; Saxena, S.K. Structural stability of metal hydrides, alanates and borohydrides of alkali and alkali-earth elements: A review. Int. J. Hydrog. Energy 2010, 35, 5454–5470. [Google Scholar] [CrossRef]
  2. Li, H.-W.; Yan, Y.; Orimo, S.; Zuttel, A.; Jensen, C.M. Recent Progress in Metal Borohydrides for Hydrogen Storage. Energies 2011, 4, 185–214. [Google Scholar] [CrossRef]
  3. Hummelshoj, J.S.; Landis, D.D.; Voss, J.; Jiang, T.; Tekin, A.; Bork, N.; Dulak, M.; Mortensen, J.J.; Adamska, L.; Andersin, J.; et al. Density functional theory based screening of ternary alkali-transition metal borohydrides: A computational material design project. J. Chem. Phys. 2009, 131. [Google Scholar] [CrossRef] [PubMed]
  4. Besora, M.; Lledos, A. Coordination modes and hydride exchange dynamics in transition metal tetrahydroborate complexes. In Contemporary Metal Boron Chemistry I: Borylenes, Boryls, Borane; Marder, T.B., Lin, Z., Eds.; Springer: Berlin, Germany, 2008; pp. 149–202. [Google Scholar]
  5. Marks, T.J.; Kolb, J.R. Covalent transition metal, lanthanide, and actinide tetrahydroborate complexes. Chem. Rev. 1977, 77, 263–293. [Google Scholar] [CrossRef]
  6. Callini, E.; Borgschulte, A.; Ramirez-Cuesta, A.J.; Zuettela, A. Diborane release and structure distortion in borohydrides. Dalton Trans. 2013, 42, 719–725. [Google Scholar] [CrossRef] [PubMed]
  7. Chong, M.; Callini, E.; Borgschulte, A.; Zuettel, A.; Jensen, C.M. Dehydrogenation studies of the bimetallic borohydrides. RSC Adv. 2014, 4, 63933–63940. [Google Scholar] [CrossRef]
  8. Albanese, E.; Civalleri, B.; Casassa, S.; Baricco, M. Investigation on the Decomposition Enthalpy of Novel Mixed Mg(1−x)Znx(BH4)2 Borohydrides by Means of Periodic DFT Calculations. J. Phys. Chem. C 2014, 118, 23468–23475. [Google Scholar] [CrossRef]
  9. Schouwink, P.; Ley, M.B.; Tissot, A.; Hagemann, H.; Jensen, T.R.; Smrčok, L.; Černý, R. Structure and properties of complex hydride perovskite materials. Nat. Commun. 2014, 5. [Google Scholar] [CrossRef] [PubMed]
  10. Wang, J.; Li, H.W.; Chen, P. Amides and borohydrides for high capacity solid-state hydrogen storage—Materials design and kinetics improvement. MRS Bull. 2013, 38, 480–487. [Google Scholar] [CrossRef]
  11. Li, H.-W.; Kikuchi, K.; Sato, T.; Nakamori, Y.; Ohba, N.; Aoki, M.; Miwa, K.; Towata, S.; Orimo, S. Synthesis and Hydrogen Storage Properties of a Single-Phase Magnesium Borohydride Mg(BH4)2. Mater. Trans. 2008, 49, 2224–2228. [Google Scholar] [CrossRef]
  12. Matsurtaga, T.; Buchter, F.; Miwa, K.; Towata, S.; Orimo, S.; Zuttel, A. Magnesium borohydride: A new hydrogen storage material. Renew. Energy 2008, 33, 193–196. [Google Scholar] [CrossRef]
  13. Filinchuk, Y.; Richter, B.; Jensen, T.R.; Dmitriev, V.; Chernyshov, D.; Hagemann, H. Porous and Dense Magnesium Borohydride Frameworks: Synthesis, Stability, and Reversible Absorption of Guest Species. Angew. Chem. Int. Ed. 2011, 50, 11162–11166. [Google Scholar] [CrossRef] [PubMed]
  14. Roennebro, E. Development of group II borohydrides as hydrogen storage materials. Curr. Opin. Solid State Mater. Sci. 2011, 15, 44–51. [Google Scholar] [CrossRef]
  15. Ozolins, V.; Akbarzadeh, A.R.; Gunaydin, H.; Michel, K.; Wolverton, C.; Majzoub, E.H. First-principles computational discovery of materials for hydrogen storage. J. Phys. Conf. Ser. 2009, 180. [Google Scholar] [CrossRef]
  16. Ozolins, V.; Majzoub, E.H.; Wolverton, C. First-principles prediction of a ground state crystal structure of magnesium borohydride. Phys. Rev. Lett. 2008, 100. [Google Scholar] [CrossRef]
  17. Van Setten, M.J.; de Wijs, G.A.; Fichtner, M.; Brocks, G. A density functional study of α-Mg(BH4)2. Chem. Mater. 2008, 20, 4952–4956. [Google Scholar] [CrossRef]
  18. Pinatel, E.R.; Albanese, E.; Civalleri, B.; Baricco, M. Thermodynamic modelling of Mg(BH4)2. J. Alloys Compd. 2015, 645, S64–S68. [Google Scholar] [CrossRef]
  19. Riktor, M.D.; Sorby, M.H.; Chlopek, K.; Fichtner, M.; Buchter, F.; Zuttel, A.; Hauback, B.C. In situ synchrotron diffraction studies of phase transitions and thermal decomposition of Mg(BH4)2 and Ca(BH4)2. J. Mater. Chem. 2007, 17, 4939–4942. [Google Scholar] [CrossRef]
  20. Hanada, N.; Chlopek, K.; Frommen, C.; Lohstroh, W.; Fichtner, M. Thermal decomposition of Mg(BH4)2 under He flow and H2 pressure. J. Mater. Chem. 2008, 18, 2611–2614. [Google Scholar] [CrossRef]
  21. Soloveichik, G.L.; Gao, Y.; Rijssenbeek, J.; Andrus, M.; Kniajanski, S.; Bowman, R.C., Jr.; Hwan, S.-J.; Zhao, J.-C. Magnesium borohydride as a hydrogen storage material: Properties and dehydrogenation pathway of unsolvated Mg(BH4)2. Int. J. Hydrog. Energy 2009, 34, 916–928. [Google Scholar] [CrossRef]
  22. Yan, Y.; Li, H.-W.; Maekawa, H.; Aoki, M.; Noritake, T.; Matsumoto, M.; Miwa, K.; Towata, S.; Orimo, S. Formation Process of [B12H12]2− from [BH4] during the Dehydrogenation Reaction of Mg(BH4)2. Mater. Trans. 2011, 52, 1443–1446. [Google Scholar] [CrossRef]
  23. Yang, J.; Zhang, X.; Zheng, J.; Song, P.; Li, X. Decomposition pathway of Mg(BH4)2 under pressure: Metastable phases and thermodynamic parameters. Scr. Mater. 2011, 64, 225–228. [Google Scholar] [CrossRef]
  24. Paskevicius, M.; Pitt, M.P.; Webb, C.J.; Sheppard, D.A.; Filso, U.; Gray, E.M.; Buckley, C.E. In-Situ X-ray Diffraction Study of γ-Mg(BH4)2 Decomposition. J Phys. Chem. C 2012, 116, 15231–15240. [Google Scholar] [CrossRef]
  25. Guo, S.; Chan, H.Y.L.; Reed, D.; Book, D. Investigation of dehydrogenation processes in disordered γ-Mg(BH4)2. J. Alloys Compd. 2013, 580, S296–S300. [Google Scholar] [CrossRef]
  26. Zavorotynska, O.; Saldan, I.; Hino, S.; Humphries, T.D.; Deledda, S.; Hauback, B.C. Hydrogen cycling in γ-Mg(BH4)2 with cobalt-based additives. J. Mater. Chem. A 2015, 3, 6592–6602. [Google Scholar] [CrossRef]
  27. Chong, M.; Karkamkar, A.; Autrey, T.; Orimo, S.-I.; Jalisatgi, S.; Jensen, C.M. Reversible dehydrogenation of magnesium borohydride to magnesium triborane in the solid state under moderate conditions. Chem. Commun. 2011, 47, 1330–1332. [Google Scholar] [CrossRef] [PubMed]
  28. Zavorotynska, O.; Deledda, S.; Li, G.; Matsuo, M.; Orimo, S.-I.; Hauback, B.C. Isotopic Exchange in Porous and Dense Magnesium Borohydride. Angew. Chem. Int. Ed. 2015. [Google Scholar] [CrossRef]
  29. Brown, W.G.; Kaplan, L.; Wilzbach, K.E. The exchange of hydrogen gas with lithium and sodium borohydrides. J. Am. Chem. Soc. 1952, 74, 1343–1344. [Google Scholar] [CrossRef]
  30. Gremaud, R.; Lodziana, Z.; Hug, P.; Willenberg, B.; Racu, A.-M.; Schoenes, J.; Ramirez-Cuesta, A.J.; Clark, S.J.; Refson, K.; Züttel, A.; et al. Evidence for hydrogen transport in deuterated LiBH4 from low-temperature Raman-scattering measurements and first-principle calculations. Phys. Rev. B 2009, 80, 1–4. [Google Scholar] [CrossRef]
  31. Mesmer, R.E.; Jolly, W.L. The Exchange of Deuterium with Solid Potassium Hydroborate. J. Am. Chem. Soc. 1962, 84, 2039–2042. [Google Scholar] [CrossRef]
  32. Van Setten, M.J.; Lohstroh, W.; Fichtner, M. A new phase in the decomposition of Mg(BH4)2: First-principles simulated annealing. J. Mater. Chem. 2009, 19, 7081–7087. [Google Scholar] [CrossRef]
  33. Bogdanovic, B.; Schwickardi, M. Ti-doped alkali metal aluminium hydrides as potential novel reversible hydrogen storage materials. J. Alloys Compd. 1997, 253–254, 1–9. [Google Scholar] [CrossRef]
  34. Mao, J.F.; Yu, X.B.; Guo, Z.P.; Liu, H.K.; Wu, Z.; Ni, J. Enhanced hydrogen storage performances of NaBH4-MgH2 system. J. Alloys Compd. 2009, 479, 619–623. [Google Scholar] [CrossRef]
  35. Zhang, B.J.; Liu, B.H. Hydrogen desorption from LiBH4 destabilized by chlorides of transition metal Fe, Co, and Ni. Int. J. Hydrog. Energy 2010, 35, 7288–7294. [Google Scholar] [CrossRef]
  36. Wahab, M.A.; Jia, Y.; Yang, D.; Zhao, H.; Yao, X. Enhanced hydrogen desorption from Mg(BH4)2 by combining nanoconfinement and a Ni catalyst. J. Mater. Chem. A 2013, 1, 3471–3478. [Google Scholar] [CrossRef]
  37. Xu, J.; Qi, Z.; Cao, J.; Meng, R.; Gu, X.; Wang, W.; Chen, Z. Reversible hydrogen desorption from LiBH4 catalyzed by graphene supported Pt nanoparticles. Dalton Trans. 2013, 42, 12926–12933. [Google Scholar] [CrossRef] [PubMed]
  38. Humphries, T.D.; Kalantzopoulos, G.N.; Llamas-Jansa, I.; Olsen, J.E.; Hauback, B.C. Reversible Hydrogenation Studies of NaBH4 Milled with Ni-Containing Additives. J. Phys. Chem. C 2013, 117, 6060–6065. [Google Scholar] [CrossRef] [Green Version]
  39. Au, Y.S.; Yan, Y.; de Jong, K.P.; Remhof, A.; de Jongh, P.E. Pore Confined Synthesis of Magnesium Boron Hydride Nanoparticles. J. Phys. Chem. C 2014, 118, 20832–20839. [Google Scholar] [CrossRef]
  40. Zhang, Z.G.; Wang, H.; Liu, J.W.; Zhu, M. Thermal decomposition behaviors of magnesium borohydride doped with metal fluoride additives. Thermochim. Acta 2013, 560, 82–88. [Google Scholar] [CrossRef]
  41. Zhang, Y.; Liu, Y.; Pang, Y.; Gao, M.; Pan, H. Role of Co3O4 in improving the hydrogen storage properties of a LiBH4-2LiNH2 composite. J. Mater. Chem. A 2014, 2, 11155–11161. [Google Scholar] [CrossRef]
  42. Saldan, I.; Hino, S.; Humphries, T.D.; Zavorotynska, O.; Chong, M.; Jensen, C.M.; Deledda, S.; Hauback, B.C. Structural changes observed during the reversible hydrogenation of Mg(BH4)2 with Ni-based additives. J. Phys. Chem. C 2014, 118, 23376–23384. [Google Scholar] [CrossRef]
  43. Ngene, P.; Verkuijlen, M.H.W.; Zheng, Q.; Kragten, J.; van Bentum, P.J.M.; Bitter, J.H.; de Jongh, P.E. The role of Ni in increasing the reversibility of the hydrogen release from nanoconfined LiBH4. Faraday Discuss. 2011, 151, 47–58. [Google Scholar] [CrossRef] [PubMed]
  44. Ban, V.; Soloninin, A.V.; Skripov, A.V.; Hadermann, J.; Abakumov, A.; Filinchuk, Y. Pressure-Collapsed Amorphous Mg(BH4)2: An Ultradense Complex Hydride Showing a Reversible Transition to the Porous Framework. J. Phys. Chem. C 2014, 118, 23402–23408. [Google Scholar] [CrossRef]
  45. David, W.I.F.; Callear, S.K.; Jones, M.O.; Aeberhard, P.C.; Culligan, S.D.; Pohl, A.H.; Johnson, S.R.; Ryan, K.R.; Parker, J.E.; Edwards, P.P.; et al. The structure, thermal properties and phase transformations of the cubic polymorph of magnesium tetrahydroborate. Phys. Chem. Chem. Phys. 2012, 14, 11800–11807. [Google Scholar] [CrossRef] [PubMed]
  46. Giannasi, A.; Colognesi, D.; Ulivi, L.; Zoppi, M.; Ramirez-Cuesta, A.J.; Bardaji, E.G.; Roehm, E.; Fichtner, M. High Resolution Raman and Neutron Investigation of Mg(BH4)2 in an Extensive Temperature Range. J. Phys. Chem. A 2010, 114, 2788–2793. [Google Scholar] [CrossRef] [PubMed]
  47. Shimanouchi, T.; Nakagawa, I. Infrared spectroscopic study on the co-ordination bond-I: Infrared spectra of cobalt hexammine, pentammine and trans-tetraammine complexes. Spectrochim. Acta 1962, 18, 89–100. [Google Scholar] [CrossRef]
  48. Tomkinson, J.; Ludman, C.J.; Waddington, T.C. IR Raman and Inelastic Neutron-Scattering Spectra of Cesium Octahydroborate, CSB3H8. Spectrochim. Acta Part A Mol. Biomol. Spectrosc. 1979, 35, 117–122. [Google Scholar] [CrossRef]
  49. Newton, M.A.; van Beek, W. Combining synchrotron-based X-ray techniques with vibrational spectroscopies for the in situ study of heterogeneous catalysts: A view from a bridge. Chem. Soc. Rev. 2010, 39, 4845–4863. [Google Scholar] [CrossRef] [PubMed]
  50. Ravel, B.; Newville, M. ATHENA, ARTEMIS, HEPHAESTUS: Data analysis for X-ray absorption spectroscopy using IFEFFIT. J. Synchrotron Radiat. 2005, 12, 537–541. [Google Scholar] [CrossRef] [PubMed]
  51. Rehr, J.J.; Albers, R.C. Theoretical approaches to x-ray absorption fine structure. Rev. Mod. Phys. 2000, 72, 621–654. [Google Scholar] [CrossRef]
  52. Vitillo, J.G.; Bordiga, S.; Baricco, M. Spectroscopic and structural characterization of thermal decomposition of γ-Mg(BH4)2: Dynamic vacuum vs. H2 atmosphere. J. Phys. Chem. C 2015, in press. [Google Scholar]

