Article

Effects of Low-Carbon Technologies and End-Use Electrification on Energy-Related Greenhouse Gases Mitigation in China by 2050

State Key Lab of Power Systems, Department of Thermal Engineering, Tsinghua University, Beijing 100084, China
*
Author to whom correspondence should be addressed.
Energies 2015, 8(7), 7161-7184; https://doi.org/10.3390/en8077161
Submission received: 3 June 2015 / Revised: 4 July 2015 / Accepted: 6 July 2015 / Published: 15 July 2015

Abstract

:
Greenhouse gas emissions in China have been increasing in line with its energy consumption and economic growth. Major means for energy-related greenhouse gases mitigation in the foreseeable future are transition to less carbon intensive energy supplies and structural changes in energy consumption. In this paper, a bottom-up model is built to examine typical projected scenarios for energy supply and demand, with which trends of energy-related carbon dioxide emissions by 2050 can be analyzed. Results show that low-carbon technologies remain essential contributors to reducing emissions and altering emissions trends up to 2050. By pushing the limit of current practicality, emissions reduction can reach 20 to 28 percent and the advent of carbon peaking could shift from 2040 to 2030. In addition, the effect of electrification at end-use sectors is studied. Results show that electrifying transport could reduce emissions and bring the advent of carbon peaking forward, but the effect is less significant compared with low-carbon technologies. Moreover, it implies the importance of decarbonizing power supply before electrifying end-use sectors.

1. Introduction

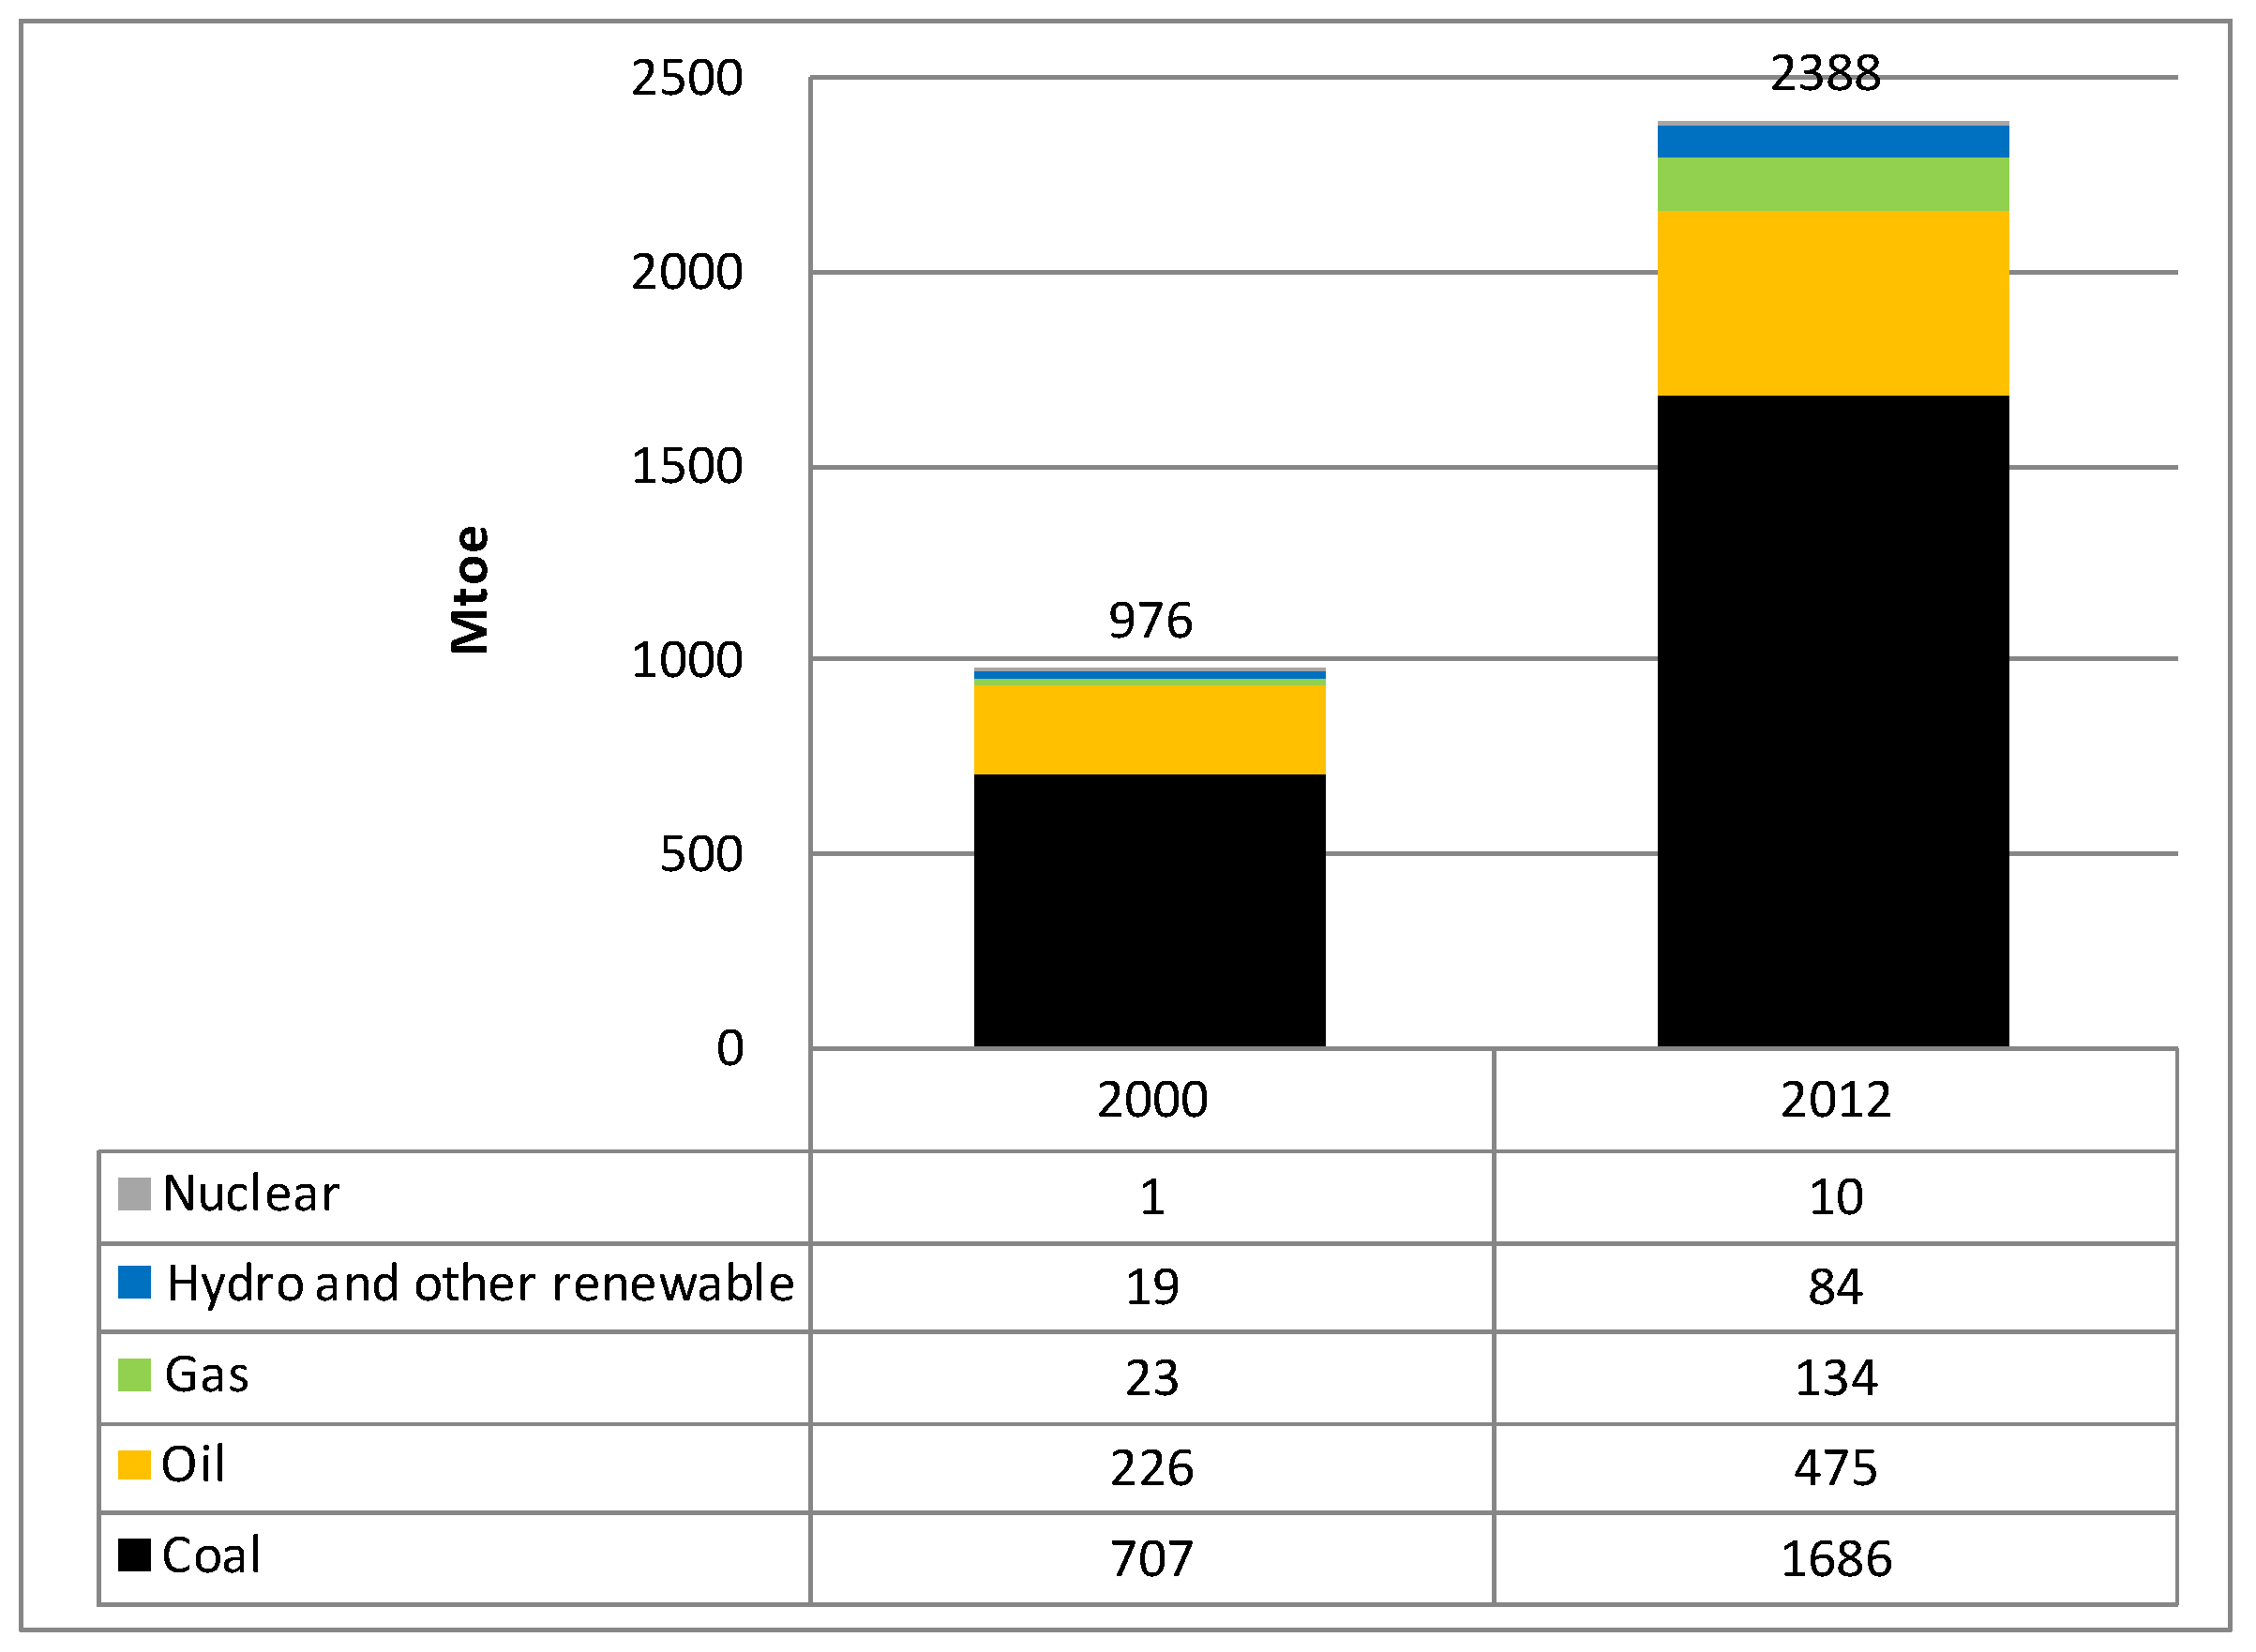
China’s primary energy consumption in the last decade has been increasing at a tremendous speed. From 2000 to 2012, total primary energy consumption in China increased by 121%, from 976 to 2388 million ton oil equivalent (Mtoe) [1]. Consumption of coal, oil, gas, renewable energy and nuclear power increased by 145%, 139%, 110%, 485%, 330% and 559%, respectively. 
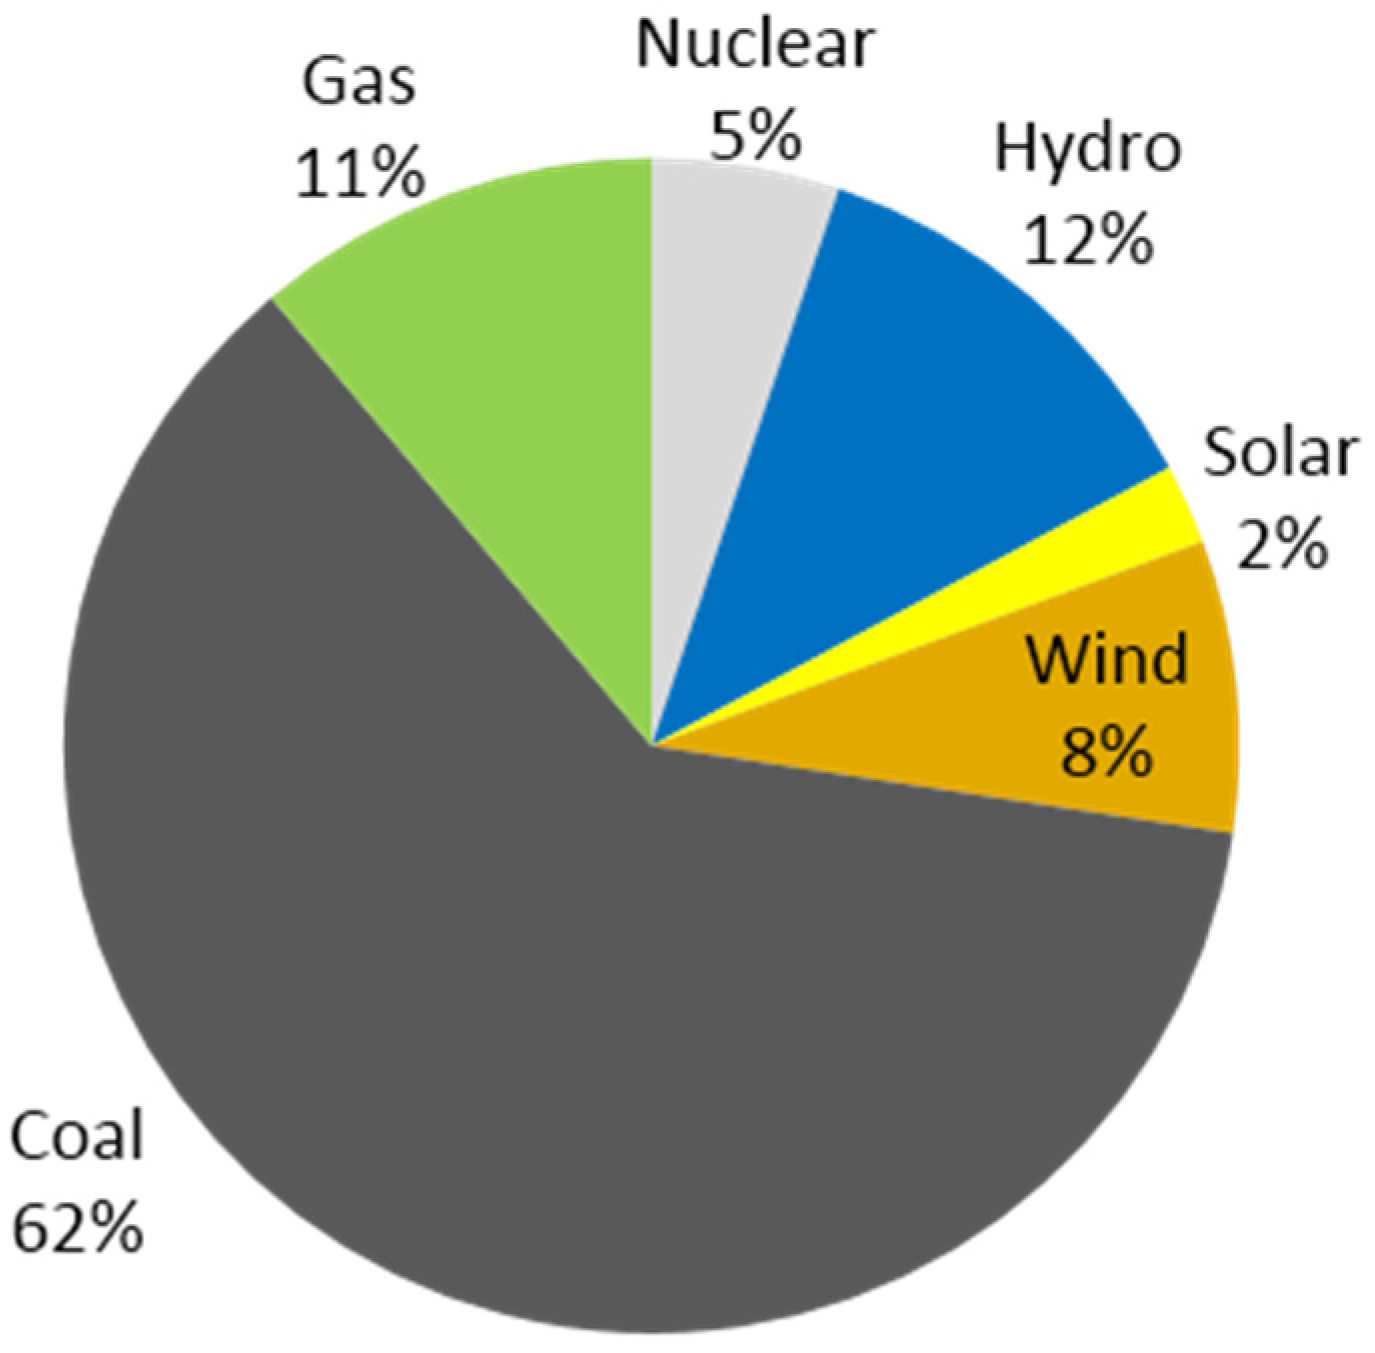
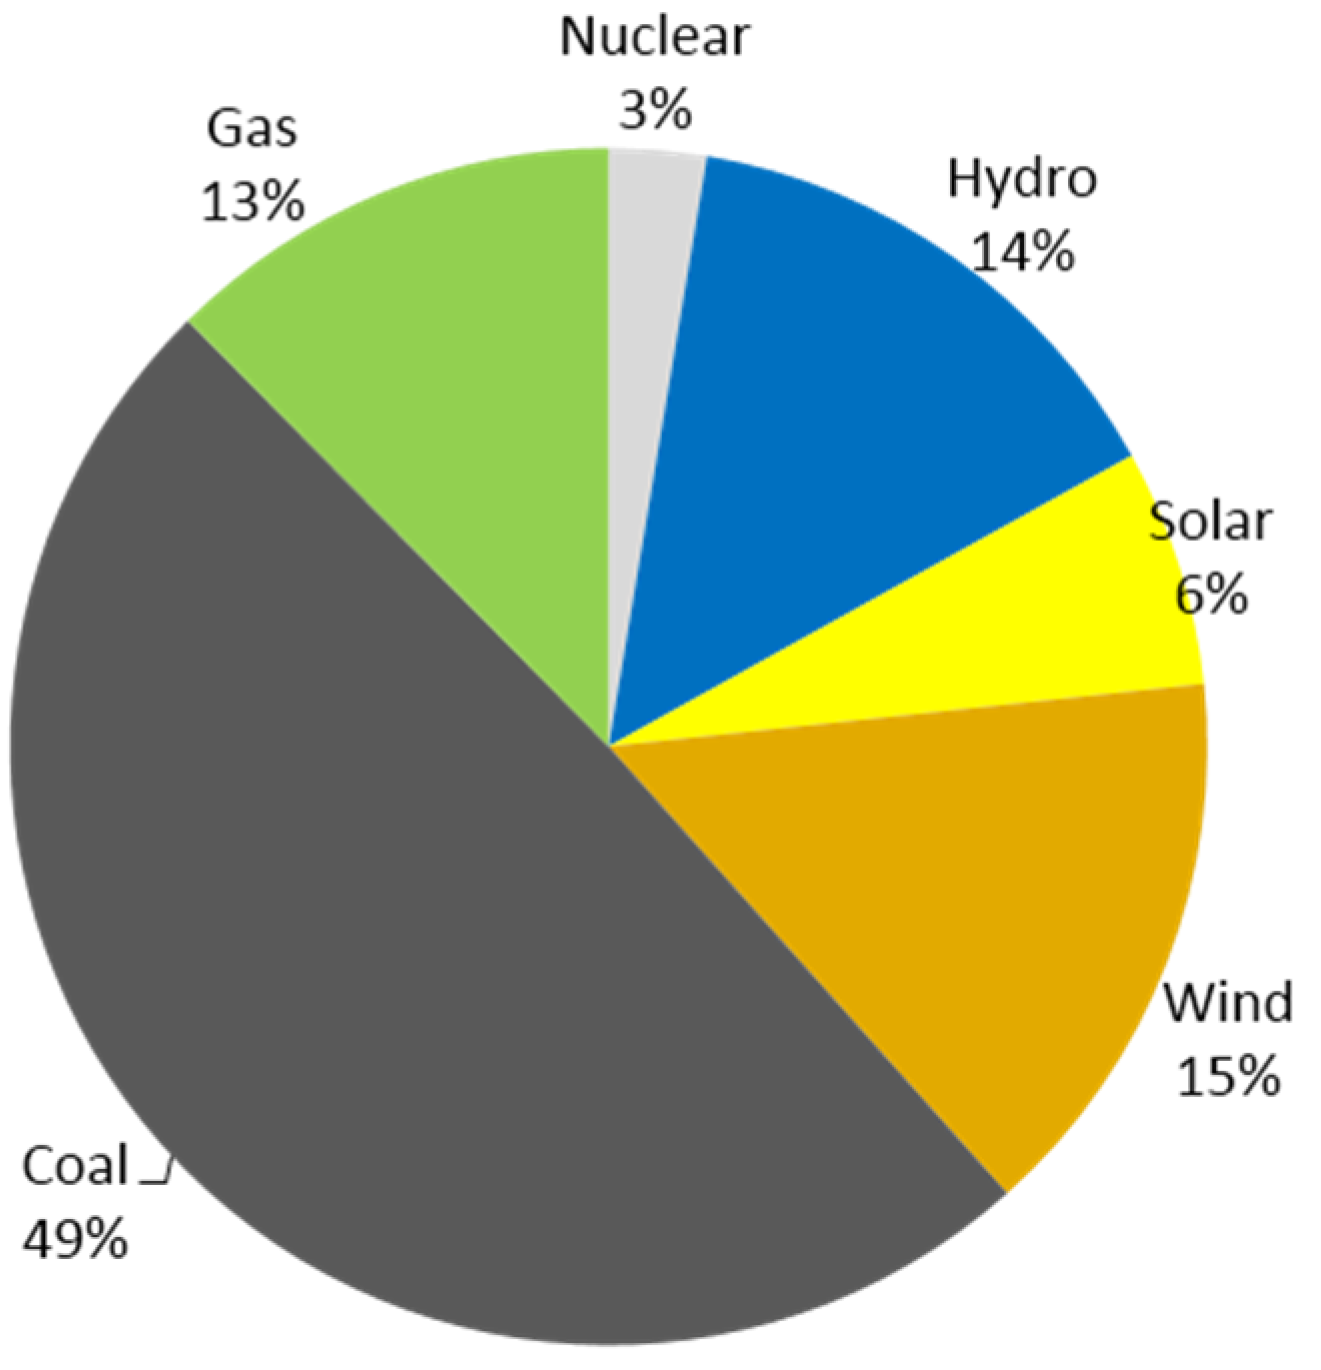
Figure 1 illustrates that fossil fuel still dominates primary energy consumption and coal still remains the largest primary energy source. On the contrary, though increasing at a much faster rate, total amount of low-carbon power generation technologies only accounts for rather a small proportion.
Figure 1. Energy consumption of China in 2012 [1].
Energies 08 07161 g001
Between 2000 and 2012, world carbon dioxide emissions from energy consumption increased from 24,150 million metric tons to 32,723 million metric tons [2]. China accounted for more than 26% of the global carbon emissions in 2012 and is now the largest carbon dioxide emitter in the world. Given that China is predicted to maintain high economic growth rates [3], total energy consumption and energy-related greenhouse gas emissions are expected to increase in a similar manner. Recently, a national plan was released committing to reduce carbon dioxide emissions per unit of GDP by 40 to 45 percent by 2020 from the 2005 levels and reach carbon emissions peaking by around 2030 [4]. In order to achieve such goals, the plan set targets to boost the deployment of clean energy in China by 2020. Thus, it is worth analyzing possible pathways for China to reduce its emissions and alter its carbon emissions trends in the future as part of the global efforts to deal with the climate change issue.
Many international agencies have published their projection to future energy trends of China. International Energy Agency (IEA)’s World Energy Outlook 2012 (WEO 2012) [5] gave three scenarios for future energy development: New Policies, Current Policies and 450 Scenarios. These scenarios considered a combination of various technical and political issues and generate future perspectives. The U.S. Energy Information Administration (EIA)’s International Energy Outlook 2013 [6] projected several scenarios considering different economic perspectives and oil prices. Similarly, other institutions also published reports such as 2050 China Energy and CO2 Emissions Report [7], China’s Green Revolution: Prioritizing technologies to achieve energy and environmental sustainability [8] and China Energy Medium and Long-term (2030, 2050) Development Strategy Research [9]. Most of these reports extrapolated future energy demand trends in scenarios linearly depending on economic performances [10]. In addition, they emphasized the importance of low-carbon technologies including nuclear energy, wind and solar, and indicated strong growth. However, these reports did not demonstrate how these technologies would be deployed considering historical experiences and practicality, as well as how these deployment pathways would alter carbon dioxide emissions trends in the long term. Thus, it is worth analyzing the contributions of different low-carbon technologies deployment pathways to emissions reduction and peaking in the future in order to set goals as well as deploy in advance.
As noted in the Energy Technology Perspectives 2014 [11], another option for greenhouse gas emissions reduction was to reduce direct consumption of fossil fuel products at end use, for instance, natural gas, gasoline, diesel, whilst shifting to more use of electricity with an assumption that its greenhouse gas emissions coefficient would drop continuously as a result of structural change in the power generation sector. In the book Sustainable Energy Without the Hot Air [12], the author stated that electrifying transport and using heat pumps instead of burning gas would become effective approaches to reduce carbon emissions in the UK as long as the electricity is from a clean source. These studies indicated the potential of electrifying energy demand at end-use sectors in emissions reduction in the future.
The demand trends of end-use sectors have been extensively studied in order to achieve energy savings and carbon dioxide emissions mitigation. In most studies that focus on energy savings in demand sectors, such as industry and transport [13,14], energy supply side got relatively less attention, on which the mix of electricity sources could change carbon emissions substantially. Zhou et al. [15] developed the Lawrence Berkeley National Laboratory (LBNL) China End-Use Energy Model to analyze future energy demand and carbon emissions trends in China. This bottom-up model illustrated explicit energy saving methods at end-use sectors and constructed two scenarios: Continued Improvement Scenario (CIS) and Accelerated Improvement Scenario (AIS). The results indicated that carbon emissions would reach 10 Gt in the CIS and 7 Gt in the AIS by 2050 (both scenarios are without Carbon Capture and Storage (CCS)), whilst emissions peaking would be around 2030 in the CIS and 2025 in the AIS. However, the work did not consider much on the power supply side, for instance, it gave assumptions for overall efficiency and capacity by 2050 without explaining reasons and practicality. In addition, the scenarios in this work combined improvement at end-use sectors and decarbonization in power supply, thus it cannot reflect the contributions of low-carbon technologies to carbon emissions reduction and peaking. Gambhir et al. [16] established a hybrid model and gave three scenarios: Hypothetical Counterfactual Baseline (HCB), Efficiency and Mix. Energy demand in each scenario in this study was built based on a bottom-up model, and energy supply was optimized based on costs, technical parameters and policy assumptions. Compared with a bottom-up model for supply, this approach was an effective way for future capacity planning, rather than studying the potential of low-carbon technologies in carbon emissions reduction and emissions peaking. In addition, this study included CCS in the Mix scenario. However, due to the lack of commercialized CCS experiences worldwide and governmental policies nationwide, tremendous challenges and uncertainties are on the way to large deployment of CCS by 2050 [17]. Thus, it would be quite a great uncertainty to include CCS technology in models.
In order to study the roles of clean energy and electrification to energy-related carbon dioxide emissions mitigation and peaking, this paper aims at building a transparent bottom-up model giving insights into two issues. The first one is how China is likely to deploy low-carbon energy technologies based on policies, practicality and international experiences, and how these deployment would alter carbon dioxide emissions trends up to 2050. The second one is to study the effects of electrifying demand sectors on emissions reduction and peaking under different clean energy deployment pathways. The remaining of this paper is organized as follows. Section 2 demonstrates the principles behind the bottom-up model used to analyze the energy system and sets scenarios for future demand trends and supply pathways in China concerning different levels of electrification for demand sectors and the potential of low-carbon technologies in energy supply. Section 3 shows the effects of low-carbon technologies and electrification on carbon emissions reduction and peaking based on combinations of proposed scenarios. Section 4 concludes the results and gives main findings. Section 5 provides policy implications for the deployment of low-carbon technologies and electrification in the future.

2. Methodology

In this part, firstly a model is built to link energy demand, supply and energy-related carbon dioxide emissions, and principles and assumptions of the model are demonstrated. Then, different energy demand and supply scenarios concerning economic trends, electrification levels and pathways for the deployment of low-carbon energy supply technologies are discussed.

2.1. Basic Model and Assumptions

A bottom-up model is constructed to build the link between energy demand and consumption, as well as its related carbon emissions. The model comprises three main modules, namely a supply module, a transformation module, and a demand module, shown in Figure 2. The demand module is the end-use energy for customers and could be classified into five sectors according to China’s energy statistical year book [1]: residential, commercial (including wholesale, retail trade, hotel and restaurants), industry (including industry and construction), transportation (including transport, storage and post) and others (including farming, forestry, animal husbandry, fishery conservancy and others). The inputs of this module are external factors, including economic growth and the level of electrification, which are key assumptions for each scenario since they can significantly alter future demand through to 2050. The outputs of this module are overall demand for different energy forms such as electricity, oil, coal and gas in each sector. The expression indicating energy demand is express in Equation (1). Demand for energy form f in sector s in year t equals to its value in year t – 1 multiplied by its annual projected growth rate in year t and its electrification level. The growth rates for each energy form and electrification levels in different sectors are discussed in the next section.
demand ( f , s , t ) = demand ( f , s , t 1 ) growth ( f , s , t ) electrification ( f , s , t )
The transformation module is the link between primary energy and end-use energy products. It converts primary energy into designated end-use products. The inputs of this model are the overall demand for end-use energy (the outputs of the demand module), as well as primary energy supplies in terms of renewable and nuclear from the supply model. These inputs are computed to reach an equilibrium generating total consumption of primary energy resources as outputs. Due to the abundant reserves of indigenous coal, capacity of coal power plants will be added or reduced to balance the electricity gap between demand and supply. In this module, internal parameters such as efficiency of transformation equipment are considered. As shown in Equation (2), demand for energy form f in all sectors in year t equals to primary energy supply type p in year t multiply transformation efficiency from primary energy type p to demand energy form f in year t. For instance, coal consumption from the demand module can be classified into three categories: direct industrial use, fuel use and electricity use. For some industrial and fuel use, coal is processed through coking. In terms of the electricity use, it is transformed by power plants whose efficiency is expected to improve over times.
s demand ( f , s , t ) = p supply ( p , t ) trans ( p , f , t )
Figure 2. Bottom-up energy model schematic.
Energies 08 07161 g002
The supply module consists of five types of primary energy. As shown in Equation (3), future extrapolated trends of low-carbon energy supplies depend their growth rates, which largely rely on national policies and are constrained by physical practicality. Total energy-related carbon dioxide emissions can then be calculated based on primary energy supply and carbon dioxide emission coefficients of different primary energy types as expressed in Equation (4).
supply ( p , t ) = supply ( p , t 1 ) growth ( p , t )
emission ( t ) = p supply ( p , t ) coefficient ( p )
Another key assumption of the model is that different primary energy cannot directly substitute each other. For instance, oil consumption cannot be replaced by coal in the transformation module. Even though China has built some coal-to-oil plants, due to their scale compared with the overall consumption and political uncertainty, it is not expected that this kind of replacement will happen substantially and affect the whole energy system essentially. The model is initialized and converged based on China’s energy data in 2010 [1] and future energy trends are derived from this baseline.

2.2. Scenario Settings

As identified before, key assumptions are economic growth, demand trends and supply capacity. In terms of demand trends, reference, high and low demand trends corresponding to economic performances are assumed in industry, transport, and residential and commercial sectors. In addition, normal and accelerated levels of electrification are set in these demand scenarios. With respect to energy supply, capacity for power generation technologies is set in four scenarios considering different policy perspectives. Other assumptions such as the improvement of transformation efficiency and load factors for technologies are discussed at the end of this chapter.

2.2.1. Economy and Energy Demand

Different organizations have projected China’s future GDP growth rates. International Monetary Fund (IMF) estimates that annual GDP growth rates are above 6.5% from 2014 to 2019 [3]. In OECD (Organization for Economic Co-operation and Development) Environment Working Papers [18], it is expected that China will achieve an average annual GDP growth rate of 7.2% between 2010 and 2020, then drop to 4.2% between 2020 and 2030, and further shrink to 3.0% between 2030 and 2050. By comparison, for energy outlook reports, World energy outlook 2012 (WEO 2012) [5] assumes that GDP growth rates will maintain an annual average of 7.9% between 2010 and 2020, and fall to 5.7% between 2020 and 2035. In the reference scenario of International energy outlook 2013 (IEO 2013) [6], it is expected that China’s GDP will grow by 7.5% per year from 2010 to 2020, after then slowdown to 5.7% per year from 2020 to 2030, and fall to 4.0% per year from 2030 to 2040. These projected growth rates are close to each other and indicate an optimistic attitude to China’s medium-term and long-term economic development.
In order to discuss the influences of economic growth on energy demand, this paper references three economic scenarios in IEO 2013, and extrapolates these trends to 2050 based on the projections of the OECD Environment Working Papers. Assumptions for reference, low and high economic growth rates are listed in Table 1.
Table 1. Economic growth rates for the three scenarios during different periods.
Scenarios2010–20202020–20302030–20402040–2050
Reference economic growth7.5%5.7%4.0%2.5%
Low economic growth6.9%4.4%2.7%1.7%
High economic growth7.9%6.6%4.8%3.0%

2.2.2. Energy Demand in Sectors

Future energy trends in sectors such as industry, transport, residential and commercial are discussed in this part. Compared with the counterpart scenario in WEO 2012, IEO 2013 presented more rapidly growing energy demand for China in its reference scenario [6], and gave another two scenarios considering low and high economic performances, which could more reasonably reflect uncertainties for future development. Thus, in this study, similarly, reference, low and high demand scenarios corresponding to economic performances are set for sectors referencing IEO’s study, along with normal and accelerated levels of electrification.

Industry

From the composition of energy demand in industry in 2010, it can be seen that coal was the dominant fuel, followed by electricity. Gas only took a low share (3.6%) due to its much higher price than coal in China and insufficient supply. The proportion of electricity consumed in industrial sector increased from 17.4% in 2000 to 21.9% in 2010. Nevertheless, compared with the U.S., in which electricity and gas accounted for 27.0% and 38.8% [19], respectively, in industrial energy demand in 2010, further increase in electricity and gas shares are expected in China’s industrial energy demand.
In the Reference case of IEO 2013 (EIA, 2013), energy demand in industry is expected to increase at a high rate in the short term owing to continuously growing GDP. This growing trend is projected to slow down gradually and reach its peak at around 2035, and will then begin to drop slightly as the result of continuously decreasing energy intensity and the ending of industrialization. Three scenarios corresponding to economic growth and referencing IEO 2013’s projections are demonstrated in Table 2. Notably, according to the latest statement from the Chinese government [4], carbon emission peak will be around 2030, thus here we assume that industrial energy demand will start to decline from 2030.
Table 2. Growth rates for industrial energy demand in scenarios.
Demand Trends2010–20202020–20302030–20402040–2050
Reference4.4%1.6%−0.2%−1.5%
Low4.0%1.2%−0.3%−2.2%
High4.6%1.9%−0.1%−1.3%
In addition, for the purpose of presenting the transition from fossil fuel to electricity in industrial energy demand, two levels (normal level and accelerated level) of electrification are set to evaluate future demand trends. Normal level assumes that the shares of different energy forms will vary little compared with that in 2010. Gas and electricity are expected to increase slightly, accounting for 5% and 25%, respectively, in final industrial energy demand by 2050. Accelerated level projects that electric boilers will gradually replace some coal and oil boilers, and as a result electricity will account for 30% in 2050. Meanwhile, due to the higher efficiency of electric boilers, less end-use demand will be required compared with the normal level. The shares of different energy forms in industrial demand by 2050 are listed in Table 3.
Table 3. Shares of different energy forms in industrial demand by 2050.
Electrification LevelsElectricityCoalOilGas
Normal25%55.3%14.7%5%
Accelerated30%51.3%13.7%5%

Transport

Total final demand in transport sector in China increased sharply from 62.19 Mtoe in 2000 [20] to 169.19 Mtoe in 2010 [1] with an average annual growth rate of 10.5%. Main reasons for the growth are increasing car ownership and the expansion of roads and rail infrastructure as proposed in the 12th Five-Year Plan. In terms of energy composition, oil was dominant and comprised for around 90% of the total during the decade. Meanwhile, demand for electricity increased by nearly three-fold from 2.42 Mtoe in 2000 to 6.32 Mtoe in 2010. This can be understood as the rapid development of electric trains and the replacement of coal-fired trains.
In the IEO 2013 Reference case (EIA, 2013), energy demand for transport is expected to increase by 5.2% from 2010 to 2020 and 3% from 2020 to 2040. With respect to energy composition by 2040, oil is projected to remain its dominant status. In addition, it is expected that coal will be gradually phased out and electricity will increase in proportion with the demand in transport. Gas is predicted to have minor increase in the future. Based on the information, three scenarios referencing IEO 2013 are set for energy demand in transport sector, as listed in Table 4.
Table 4. Growth rates for transport energy demand in scenarios.
Demand Trends2010–20202020–20302030–20402040–2050
Reference5.2%3.0%2.9%1.8%
Low4.8%2.3%2.0%1.2%
High5.4%3.5%3.5%2.2%
These scenarios are based on the assumption that electric vehicles will not penetrate through to 2050, and this is defined as the normal level for the electrification of transport. For scenarios at the normal level, it assumes that the share of electricity will remain at 3.7% through to 2050. Gas will remain at its level in 2010 with slight increase. Coal will gradually shrink to zero. On the other hand, in order to evaluate the effect of electric vehicles and its contribution to altering energy demand, accelerated electrification level of transport system assumes that electricity will gradually replace oil and will substitute 40% of oil demand in transport sector by 2050 and the shares of energy forms are listed in Table 5. In order to achieve this goal, strong policies need to be implemented in order to encourage the shift of vehicles from oil to electric. Meanwhile, due to the higher efficiency of electrical cars, we assume that per unit caloric electricity will be able to replace five units caloric oil for the same travel distance [12].
Table 5. Shares of different energy forms in transport demand by 2050.
Electrification LevelsElectricityCoalOilGas
Normal3.7%0%94.1%2.2%
Accelerated16.1%0%80.8%3.1%

Residential and Commercial

Residential and commercial energy demand increased gradually from 2000 to 2010, with annual growth rates of 8.6% and 8.3% [1,20], respectively. For residential energy demand, main increase was in gas and electricity, and their share expanded from 4.0% and 19.2% in 2000 to 12.3% and 25.7% in 2010, respectively. The increase is mainly due to the process of urbanization (the percentage of urban population increased from 36.2% in 2000 to 50.0% in 2010 [21]), which is expected to be further developed. On the other hand, commercial enenrgy demand also experienced fast increase due to urbanization. The share of electricity climbed from 25.2% in 2000 to 37.1% in 2010 and the demand for gas experienced an eight-fold increase.
In IEO 2013 Reference case [6], residential energy demand is expected to increase by 4.1%, 3.8% and 2.9% p.a. through the periods of 2010–2020, 2020–2030 and 2030–2040, respectively. Coal and oil is projected to be flat through to 2040. On the contrary, most of the increase is in electricity and gas, which are expected to account for 46.0% and 35.5%, respectively, in 2040. Commercial energy demand is expected to expand with an annual growth rate of 3.4% from 2010 to 2020, 4.2% from 2020 to 2030 and 3.7% from 2030 to 2040. No increase is expected in coal and oil consumption through to 2040. The shares of electricity and gas are projected to reach 57.9% and 23.7% in 2040. Three scenarios referencing IEO 2013 are set as follows to give future trends for residential and commercial energy demand through to 2050, listed in Table 6 and Table 7.
Table 6. Growth rates for residential energy demand in scenarios.
Demand Trends2010–20202020–20302030–20402040–2050
Reference4.1%3.8%2.9%1.8%
Low3.8%2.9%2.0%1.2%
High4.3%4.1%3.5%2.2%
Table 7. Growth rates for commercial energy demand in scenarios.
Demand Trends2010–20202020–20302030–20402040–2050
Reference3.4%4.2%3.7%2.3%
Low3.1%3.2%2.5%1.6%
High3.6%4.9%4.4%2.8%
For these three scenarios above, it assumes coal and oil demand will stay at their level in 2010. Gas and electricity will be the main increase. For residential energy demand, gas and electricity will account for around 35% and 45% by 2050, respectively. And these numbers will be around 25% and 60% for commercial sector by 2050. These assumptions are defined as the normal level of electrification for residential and commercial sectors. With respect to accelerated level of electrification, higher proportion of electricity is assumed. This indicates that heat pumps will be popular for house heating rather than burning gas through to 2050. Here we assume that the average coefficient of performance for heat pumps can reach 4 [12]. Accelerated level projects that half of the demand for gas in both residential and commercial sectors will be replaced by electricity. The shares of energy forms in residential and commercial sectors are listed in Table 8 and Table 9.
Table 8. Shares of different energy forms in residential demand by 2050.
Electrification LevelsElectricityCoalOilGas
Normal46.3%11.5%6.4%35.7%
Accelerated58.6%13.3%7.4%20.6%
Table 9. Shares of different energy forms in commercial demand by 2050.
Electrification LevelsElectricityCoalOilGas
Normal60.8%9.9%4.4%24.9%
Accelerated70.5%10.9%4.9%13.7%

2.2.3. Low-Carbon Technologies Supply

The configuration of future energy supply in China is largely based on governmental deployment associated with policies and past experiences. Thus, developing plans will essentially shape future energy system. In this part, four scenarios are set to extrapolate possible pathways for low-carbon energy technologies. Scenario A presents that the past developing trend will be maintained. Scenario B indicates that future development will follow certain national plans. Scenario C projects that the best historical performances or reasonably achievable construction rates will remain. Scenario D assumes that the physical limit of practicality can be further pushed to achieve higher annual capacity addition.

Nuclear Power

In order to deal with climate change issues and guarantee energy security, nuclear power has developed rapidly in China. At the end of 2012, China had 17 reactors in operation with the capacity of 12.86 GW and 29 reactors under construction with the capacity of 28.84 GW [22]. In 2013 and 2014, with another five reactors in commercial operation, total operating capacity for nuclear power reached 17 GW [23]. These indicated the rapid development of nuclear power and its promising future.
Early in 2007, the Medium- and Long-term Nuclear Power Development Plan (2005–2020) was released and considered as the beginning of rapid nuclear development in China [24]. According to this plan, operating capacity of nuclear power is expected to reach 40 GW and capacity under construction is likely to be 18 GW by 2020. More recently, in November 2014, China’s National Plan on Climate Change 2014–2020 (CNPCC 2014–2020) [4] noted that operating capacity of nuclear power is projected to amount to 58 GW by 2020. Though the Fukushima accident had halted the development of nuclear power in China, from these governmental plans it implies that China has ambitious nuclear plans for the future.
In the U.S., nuclear power accounted for more than 19% in electricity generation with total capacity of 102 GW in 2012 [2]. Considering the similar economic scales of the U.S. and China [25], nuclear power in China is highly likely to become a major contributor to electricity supply in the future. The first nuclear reactor in the U.S. was commercialized in 1969 and the last one was in 1996 [26]. Annual addition for nuclear capacity in the U.S. between 1969 and 1996 is shown in Figure 3. Most of these reactors were built between 1969 and 1990 with total capacity of 96.27 GW and average increase in operating capacity is around 5 GW per annum. In addition, the peak year is 1986 with annual additional capacity of 9.37 GW. Two peak periods are 1972–1977 and 1983–1988, in which average annual capacity was 5.88 GW and 6.79 GW, respectively.
Based on the information above, four scenarios are set for the development of nuclear power in China by 2050 as follows:
Scenario A: Assumes that nuclear capacity will increase as it was in the past decade (1.5 GW per annum). This can be understood as the “business as usual” scenario and this goal is relatively easy to achieve owing to historical construction experience. As a result of these assumptions, nuclear capacity will reach 25 GW by 2020 and 70 GW by 2050.
Scenario B: Assumes that the development of nuclear power will stick to the Medium- and Long-term Nuclear Power Development Plan (2005–2020) and will not meet the target in the CNPCC 2014–2020 due to the limit of construction practicality. In this way, nuclear capacity will reach 40 GW by 2020. After that, it is assumed that this trend will be maintained (an annual growth of 2.7 GW), giving the capacity of 120 GW by 2050.
Scenario C: Considers that China will achieve its goal in the CNPCC 2014–2020 plan with total operating capacity of 58 GW by 2020 (6.7 GW per annum, similar to the U.S.’s addition between 1983 and 1988). After that, it assumes that China will perform in a similar way, an annual addition of 7 GW. In this manner, nuclear capacity will reach 270 GW by 2050. The practicality of this scenario is challengeable due to massive construction work, but it is reasonably achievable according to the U.S.’s experience.
Scenario D: Projects that China will experience even more rapid development in nuclear power. It assumes that nuclear capacity in China will reach 58 GW by 2020, and after that, the construction of nuclear plants will be at even higher speed (10 GW per annum) than the peak rate in the U.S.’s history. Under these circumstances, nuclear capacity will reach 360 GW by 2050.It is doubtful whether China could physically achieve such a high growth rate due to construction speed unless nuclear power programs become an absolute and over-riding national priority.
Figure 3. Historical annual addition to nuclear capacity in the U.S.
Energies 08 07161 g003

Renewable Energy

Three forms of renewable energy are considered in this section: hydroelectric, wind and solar. Hydroelectric power has experienced vast development and it is expected to be further installed until all developable resources are fully exploited. Wind and solar power experienced rapid growth in recent years and it seems that released national plans are going to boost the development of these two further. Other renewable such as tidal and geothermal are not considered in this section, because neither the technology has been largely successfully deployed in other countries, nor have national plans stated a clear goal for their development in the future.

Hydroelectric Power

As a clean and relatively low-cost energy resource, hydroelectric power has been developed for many years in China, and its capacity reached 219 GW in 2010 [2]. In the 12th Five-Year Plan for energy development [27], hydroelectric power capacity is expected to increase to 290 GW in 2015, an annual addition of 14 GW. At the end of 2013, installed hydroelectric capacity was 280 GW and the plan is about to be fulfilled [21]. According to the CNPCC 2014–2020 [4], hydroelectric capacity is projected to reach 350 GW in 2020, which implies an annual addition of 12 GW from 2015 to 2020. The projected deceleration of hydroelectric power development is mainly due to difficulties for construction, as most promising sites have already been developed. According to statistics [1], total hydropower resource is 676 GW in China, of which 379 GW is developable. This sets the limit for the capacity of hydroelectric power in China.
Considering historical deploying speed of hydropower, potential natural resources and technology improvement, four scenarios are set as follows:
Scenario A: Assumes that the deceleration trend of hydropower will last in the future. Hydroelectric capacity will reach 290 GW in 2015 as planned. After that, annual addition will slow down to 3 GW giving 335 GW in 2030. The rest of developable capacity (44 GW) will then be gradually exploited and total hydropower capacity will reach 379 GW in 2050.
Scenario B: Projects that China will install most of its developable hydropower by 2030. Under these circumstances, hydroelectric capacity will climb to 290 GW in 2015 and 350 GW in 2020 as planned and exploit the total 379 GW in 2030. From 2030 to 2050, no new capacity will be added due to the limit of natural resources and technology.
Scenario C: Expects technology improvement will help exploit more currently undevelopable hydro resources. It assumes that hydro capacity will reach 379 GW in 2030 as stated in Scenario Band be progressively added to 400 GW in 2050.
Scenario D: Expects technology improvement will further push the limit. It assumes hydroelectric capacity will reach 379 GW in 2030, as noted in previous scenarios, and expand to 450 GW in 2050. This scenario remains to be examined due to the limit of hydroelectric resources in China.

Other Renewable

For other renewable, wind and solar are the most important ones and can make major contributions to a clean electricity system. Wind power developed slowly in China until 2005. It skyrocketed with an annual addition of around 12 GW per annum from 2008 to 2010 and roughly 16 GW per annum from 2010 to 2013, reaching 76.5 GW at the end of 2013 [2]. Meanwhile, solar power experienced the same situation. Its capacity expanded by hundreds-fold between 2009 and 2013, reaching 15.9 GW at the end of 2013, and the peak construction rate was 12 GW per annum in 2013. The strong growth in wind and solar power indicates promising future for renewable energy in China.
For future development, Chinese government has a strong determination in favor of renewable energy. As noted in the 12th Five-Year Plan for Wind Power[28] and reiterated in the CNPCC 2014–2020 [4], nominal wind capacity is planned to be more than 104 GW in 2015 and 200 GW in 2020. This means an addition rate of 14 GW p.a. between 2010 and 2015, and 19 GW p.a. between 2015 and 2020. Considering the achieved construction practicality in 2013, the target by 2015 is about to be accomplished. The proposed target by 2020 is achievable if wind power companies can expand their production capacity in advance.
Similarly, the 12th Five-Year Plan for Solar Power [29] broached grand perspectives. Solar PV capacity will be more than 21 GW in 2015 and 50 GW in 2020. This implies additional capacity of 4 GW p.a. between 2010 and 2015, and 6 GW p.a. between 2015 and 2020. Furthermore, according to the CNPCC 2014–2020 [4], an even higher target of 100 GW for solar power by 2020 was stated. This indicates an annual addition of 12 GW between 2013 and 2020. Referencing the addition capacity of solar in 2013, the target by 2020 is reasonably achievable if China can remain this historical construction rate.
Considering the deployment of solar power in Germany, whose economic scale was only one fifth of China in 2014 [25], more aggressive goals could be achieved in China in the future. Annual addition for solar PV was around 8 GW in Germany from 2009 to 2012. If this rate multiplies the economic scale differences, China may be able to achieve a much higher construction rate for PV, and to be conservative, this maximum rate is set to be 20 GW in the long term. Based on the information from the government and projections, four scenarios are set as follows.
Scenario A: The reference scenario, which assumes that the deployment will be in line with the 12th Five-Year Plan, giving 104 GW by 2015 and 200 GW by 2020 for wind, and 21 GW by 2015 and 50 GW by 2020 for solar. However, considering the cancellation of subsidies for wind by 2020 and solar by 2030 [30], annual addition for wind will slow down to 10 GW from 2020 to 2030, and 5 GW from 2030 to 2050 (400 GW in 2050). Solar capacity will increase by 6 GW per year from 2020 to 2030 and 3 GW per year from 2030 to 2050 (170 GW in 2050).
Scenario B: Expects no significant deceleration of these two after 2020. Annual addition for wind and solar will remain 10 GW and 6 GW, respectively, from 2020 to 2050. This gives 500 GW for wind and 230 GW for solar by 2050.
Scenario C: Presents more optimistic projections for wind and solar. Capacity for wind and solar will be deployed as noted in the CNPCC 2014–2020 [4]. Then through to 2050, it is expected that the deploying speed of these two will be maintained as between 2015 to 2020 (19 GW per year for wind and 12 GW per year for solar). Under these circumstances, wind capacity will reach 200 GW in 2020 and 770 GW in 2050. Solar capacity will expand to 100 GW in 2020 and 460 GW in 2050.
Scenario D: Assumes that the deployment of wind and solar will be even faster due to carbon dioxide mitigation goals. Projections before 2020 are the same as in Scenario 3. After that, annual addition of wind and solar are further pushed to 25 GW and 20 GW, respectively. This gives 950 GW for wind and 700 GW for solar by 2050. The practicality of these assumptions is challengeable. Nevertheless, the large-scale deployment of these low-carbon technologies may reduce costs and spur on their development in turn.

Thermal Power

Thermal power has played an important role in China’s electricity supply system. Electricity generated by thermal power was more than 80% of total electricity consumption until 2009 [1]. Due to sharply increasing demand for electricity and abundant indigenous coal supply, thermal power expended over times from 238 GW in 2000 to 707 GW in 2010. However, due to environmental concerns, future expansion of thermal power is expected to slow down as noted in the 12th Five-year Plan for Energy Development [27] and the CNPCC 2014–2020 [4]. On the other hand, though gas capacity accounted for a small share of total thermal capacity, the penetration of gas power is increasing. In the New Policies Scenario of WEO 2012 [5], it is expected that capacity share of gas power is projected to gradually increase from 5% in 2010 to 15.4% in 2035. In this study, it assumes that the penetration of gas power will take place step by step and its share will gradually increase to 20% of total thermal power by 2050.

2.2.4. Technical Assumptions

With respect to transformation efficiency, the model assumes that the average efficiency for thermal generation plants in China will reach the best performances in the world in 2010. For instance, thermal efficiency for coal power plants is expected to gradually increase from 36.67% in 2010 to 43.87% in 2050 [1]. The efficiency of oil refinery and coking was more than 95% in 2010 and it is expected that these numbers will slightly increase in the future. In addition, transmission and distribution losses are set to decrease from 6.5% in 2010 [1] to 5% in 2050. This assumption is mainly based on the goals proposed in the 12th Five-Year Plan for Energy Development [27]. Other losses such as heating and gas pipelines are set to decrease slightly in the future.
In terms of load factors for technologies, numbers are calculated based on the projections of WEO 2012 [5], as listed in Table 10. While calculating carbon emissions, carbon dioxide emission coefficients are referencing Intergovernmental Panel on Climate Change’s guidelines [31], as shown in Table 11.
Table 10. Load factors for technologies during the projected period.
Technologies20102020203020402050
Coal0.560.550.550.550.55
Gas0.270.370.440.450.45
Nuclear0.770.880.870.880.88
Hydro0.390.370.370.370.37
Wind0.110.220.250.270.27
Solar PV0.110.150.150.150.15
Table 11. Carbon dioxide emission coefficients for fossil fuel.
Fuel TypesCarbon Dioxide Coefficients
Coal3.96 Mt CO2/Mtoe
Oil3.42 Mt CO2/Mtoe
Gas2.35 Mt CO2/Mtoe

3. Results and Discussion

With the model provided in the previous section, three scenarios are built to analyze the effect of low-carbon technologies and end-use electrification. A reference scenario is firstly built and set as the baseline for analyses and comparisons. Scenarios of low-carbon technologies and end-use electrification are then built and compared with the reference scenario. Results obtained from these scenarios are discussed.

3.1. Reference Scenario

In order to examine the contributions of nuclear energy and the effects of electrification, we set a scenario as the baseline, or the Reference Scenario. In the Reference Scenario, demand trend is set to be the reference demand, and the normal electrification level is set. In terms of supply, nuclear power and renewable energy are both in Scenario A, which represents the least optimistic attitude to clean energy with the lowest capacity. Energy demand and supply of China by 2050 can then be modeled with these assumptions.
As shown in Figure 4, total final energy demand will increase to 3181 Mtoe in 2050, doubled the number in 2010. Industry will account for more than 53.9% of the total, less than its share of 70.8% in 2010. The shares of transport, residential and commercial in 2050 will be higher than they were in 2010, reaching 18.9%, 18.6% and 3.6%, respectively. It can be seen that industry will be the major driver of demand between 2010 and 2030. Then, from 2030 to 2050, though the demand of industrial sector will shrink, increasing demand in other sectors will expand. As a result, energy demand will continuously increase through to 2040, peaking at 3225 Mtoe, and then slightly decrease from 2040 to 2050.
Figure 4. Total final demand of China by 2050 in the Reference Scenario.
Energies 08 07161 g004
Total primary energy consumption shows an increasing trend corresponding to the demand. As shown in Figure 5, coal will increase steadily from 2010 to 2030, and gradually decrease through to 2050. Due to the increasing demand for oil in transport sector and gas in residential and commercial sectors, oil and gas will expand to 959 Mtoe and 516 Mtoe, respectively, by 2050. Coal will remain the dominant primary energy accounting for 58.1% and clean energy will only take a low share of 5.9% by 2050, though higher than the share in 2010. In terms of electricity supply, clean energy will account for 27.4% by 2050 (shown in Figure 6), which is slightly higher than it was in 2010, and its capacity will take 38.4% of total installed capacity (shown in Figure 7). Due to the low share of clean energy, increasing energy consumption will mainly be met by fossil fuel, and in this way, energy-related carbon dioxide emissions will increase sharply to its peak 14.1 Gt by 2040, almost twice the emissions in 2010, and then drop to 13.5 Gt by 2050.
Figure 5. Total primary energy consumption of China in the Reference Scenario.
Energies 08 07161 g005
Figure 6. Shares of electricity power by 2050.
Energies 08 07161 g006
Figure 7. Shares of installed capacity by 2050.
Energies 08 07161 g007

3.2. Contributions of Low-Carbon Technologies

3.2.1. Carbon Emission Reduction with Different Demand Trends

In order to examine the potential contribution of low-carbon technologies to emissions reduction, different scenarios are examined (as shown in Table 12). With the reference, low and high demand, Scenarios A to D for low-carbon technologies are set in the model. Under these conditions, reduction of emissions in different scenarios is shown in Figure 8. Carbon dioxide emissions will drop by 3.6%, 14.8% and 23.2% with increasing clean supply compared with the Reference Scenario. In addition, emissions reduction of clean energy under different demand trends is studied for sensitivity analyses. Under high demand trend, deploying low-carbon technologies in Scenario D will achieve emissions reduction of 20.4% compared with that in Scenario A by 2050. In terms of low demand trend, higher reduction of 28.2% can be achieved with high capacity compared with the low. These results show that accelerating deploying clean capacity will be able to help China reduce emissions by around 20% to 28% under different demand trends by 2050. From the amount of emissions reduction in different scenarios, it can be seen that different ways of deploying future low-carbon technologies could make substantial changes to carbon emissions. For instance, comparing scenario C and D, by pushing the construction limit further, another 7%~10% emissions reduction can be achieved under different demand trends.
Table 12. Scenarios used for analyzing contributions of low-carbon supply to carbon dioxide mitigation with different demand trends.
Low-Carbon Supply ScenariosDemand Scenarios (At Normal Level of Electrification)
Scenario AHigh demand
Reference demand
Low demand
Scenario BHigh demand
Reference demand
Low demand
Scenario CHigh demand
Reference demand
Low demand
Scenario DHigh demand
Reference demand
Low demand
Figure 8. Emissions reduction with increasing low-carbon technology capacity under different demand trends by 2050.
Energies 08 07161 g008

3.2.2. Effects on Carbon Emission Reduction and Peaking

By altering the scenario of a certain low-carbon technology and the other assumptions remain the same as the Reference Scenario (as shown in Table 13), the contributions of each technology to emissions reduction can be demonstrated. As shown in Figure 9, Nuclear energy takes the lead in emissions reduction (11.9% by 2050), followed by wind (6.2% by 2050), solar (3.8% by 2050) and hydroelectric power (1.3% by 2050). This is mainly due to the high availability of nuclear power stations. By contrast, though nominal capacity of wind and solar will increase many folds in the future, their low availability results in relatively small reduction. For hydroelectric power, due to the limit of natural resource, its capacity cannot increase substantially in the future.
Table 13. Scenarios used for analyzing contributions of each low-carbon supply to carbon dioxide mitigation with the reference demand trend.
Low-Carbon Supply ScenariosDemand Scenarios
Hydroelectric in Scenario ANuclear, solar and wind in Scenario AReference demand at normal level of electrification
Hydroelectric in Scenario B
Hydroelectric in Scenario C
Hydroelectric in Scenario D
Solar in Scenario AHydroelectric,nuclear and wind in Scenario A
Solar in Scenario B
Solar in Scenario C
Solar in Scenario D
Wind in Scenario AHydroelectric,solar and nuclear in Scenario A
Wind in Scenario B
Wind in Scenario C
Wind in Scenario D
Nuclear in Scenario AHydroelectric,solar and wind in Scenario A
Nuclear in Scenario B
Nuclear in Scenario C
Nuclear in Scenario D
Figure 9. Comparisons of emissions reduction for each low-carbon technology in scenarios by 2050.
Energies 08 07161 g009
Furthermore, carbon dioxide emission trends with reference demand in different low-carbon technology scenarios are studied. As shown in Figure 10, it can be seen that carbon emissions will reach its peak by 2040 in Scenarios A, B and C. By contrast, owing to the aggressive deployment of low-carbon technologies in Scenario D, carbon emissions will reach its peak by 2030.This indicates the importance of deploying low-carbon technologies for altering the emission trends. Also, as promised by the Chinese government that the emission peak would be around 2030, low-carbon technologies should be deployed with priority to achieve the goal.
Figure 10. Carbon emission trends in different low-carbon supply scenarios.
Energies 08 07161 g010

3.3. Effects of Electrification

3.3.1. Influences of Electrification on Carbon Emissions by 2050

In this section, under the reference demand trend, normal and accelerated levels of electrification in sectors are applied to examine its contribution to emissions reduction (as shown in Table 14). In terms of supply, low-carbon technologies are set from Scenario A to D in order to find the influence of clean supply on emissions reduction. As shown in Figure 11, changes of carbon dioxide emissions between normal and accelerated electrification in sectors are illustrated. For instance, while low-carbon supply is in scenario A, by accelerating electrification, emissions in residential and commercial sectors will increase by 0.03 Gt. Industrial emissions will expand by 0.31 Gt. Nevertheless, emissions in transport sector will decrease by 0.48 Gt. Though adapting higher capacity of clean supply (low-carbon technology scenarios from A to D), the increase in residential and commercial sectors will amplify, and that in industry will diminish. Meanwhile, emissions reduction in transport sector will became more notable.
With respect to the increase in emissions by electrifying industry, it is mainly due to the higher efficiency of transforming coal to heat directly rather than generating electricity and then to heat. As long as coal plays as the back-up source to balance electricity deficit, additional electricity demand caused by electrification will be met by coal power plants with average efficiency of around 44% by 2050. On the other hand, the efficiency of coal boilers can reach as high as 85% [32]. In this way, electrifying industry sector will sacrifice heating efficiency and result in increasing emissions.
Table 14. Scenarios used for analyzing contributions of electrification to carbon dioxide mitigation in different low-carbon supply scenarios.
Low-Carbon Supply ScenariosDemand Scenarios
Scenario AReference demand at normal and accelerated levels of electrification
Scenario BReference demand at normal and accelerated levels of electrification
Scenario CReference demand at normal and accelerated levels of electrification
Scenario DReference demand at normal and accelerated levels of electrification
Figure 11. Changes of emissions by implementing two electrification levels in different low-carbon supply scenarios.
Energies 08 07161 g011
For residential and commercial sectors, electrifying final demand will save gas but require more electricity for heat pumps. Even though heat pumps are assumed to have high COP, but the additional electricity required is from thermal power plants. Coal possesses much higher carbon emission coefficient than gas (almost doubled), and this will make the overall electricity with higher emissions. Thus electrifying residential and commercial sectors will increase emissions instead.
In terms of transportation sector, electrification has a positive effect on the reduction of emissions. This can be explained as the much higher efficiency of electrical cars than oil-fueled cars. Though the emission coefficient of oil is around 20% lower than that of coal, the high efficiency of electrical cars can overcome these disadvantages and cut emissions.
However, though these changes seem to be large for their quantitative amount, their values over the emissions in the Reference Scenario are low. The increase part for accelerating electrification in residential and commercial sectors accounts for less than 0.8%, and that in industry comprises around 2.1%. On the other hand, the decrease in transport emissions reaches as much as 4%. These small shares will not substantially affect total emissions compared with the contributions of low-carbon technologies.

3.3.2. Effects of Electrifying Transport on Altering Carbon Emission Trends

Considering that electrifying transport could decrease carbon emissions, its role in altering carbon emission trends are studied in this part. With the reference demand trend, low-carbon technologies in Scenario A to D are set, as well as normal and accelerated electrification levels (as shown in Table 15). As shown in Figure 12, comparing emission trends in the same low-carbon supply scenario, electrifying transport will not only reduce carbon emissions, but also accelerate the advent of emission peaking. The slopes of the accelerated electrification emission lines are less than that of the normal electrification ones, indicating a lower carbon emission peaking value and a faster pace towards peaking. For instance, the emission trend at accelerated electrification level in Scenario C almost remains flat, though carbon emission peaking years in these scenarios are not changed.
Table 15. Scenarios used for analyzing contributions of electrifying transport to carbon dioxide mitigation in different low-carbon supply scenarios.
Low-Carbon Supply ScenariosDemand Scenarios
Scenario AReference demand with transport at normal/accelerated electrification level, other demand sectors at normal electrification level
Scenario B
Scenario C
Scenario D
Figure 12. Carbon emission trends at different transport electrification levels.
Energies 08 07161 g012
With the rapid deployment of clean energy in Scenario D and the electrification of transport, carbon emissions will reach 10.0 Gt by 2050, 26.1% lower than that in the Reference Scenario. Compared with scenarios in the Energy Technology Perspectives 2014 [11] and considering China’s carbon emissions share (25% [2]) in 2012, it would be impossible to achieve the 2DS (2 °C Scenario) in which global annual carbon dioxide emissions are limited to 16 Gt by 2050, but the results are close to the 4DS (4 °C Scenario). Key assumptions for the emissions difference between 2DS and the scenario in this study are the deployment of CCS and the decoupling of energy use from economic activity. This indicates efforts that China will need to take if further emissions reduction is required.

4. Conclusions

China has experienced rapid economic growth and it is expected that China will have optimistic economic performances through to 2050 along with increasing energy consumption as well as attendant growth in the level of carbon dioxide emissions.
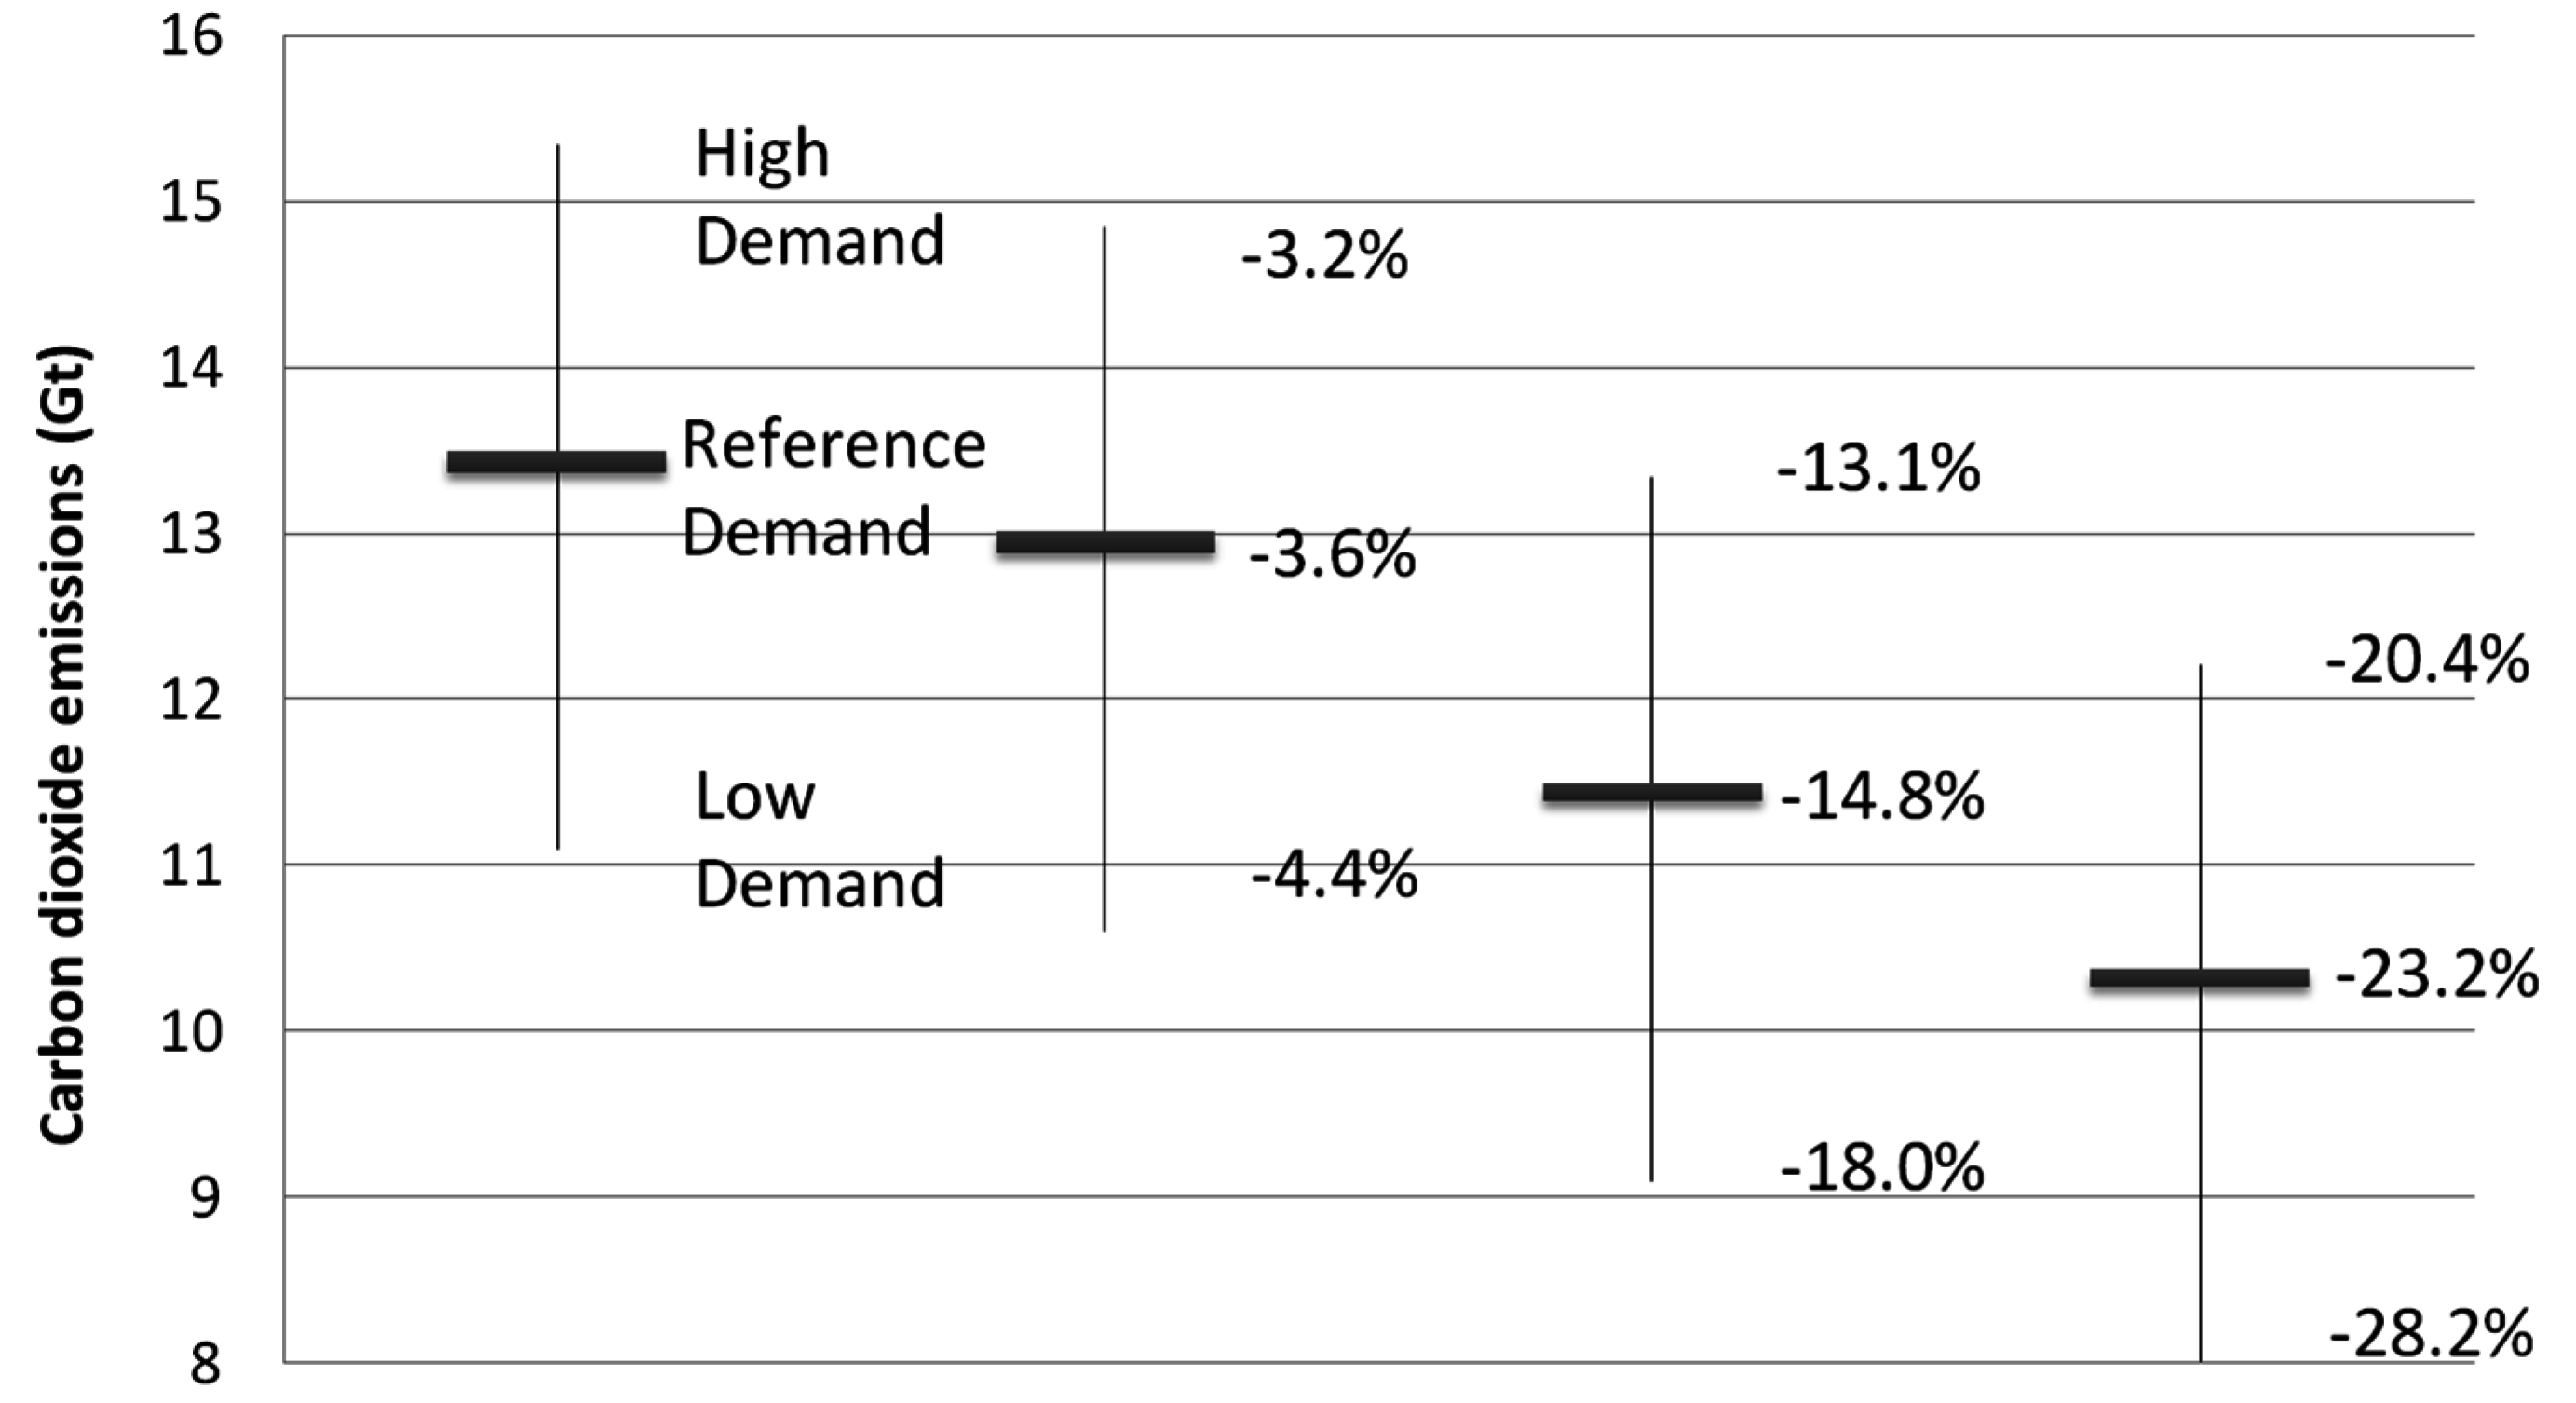
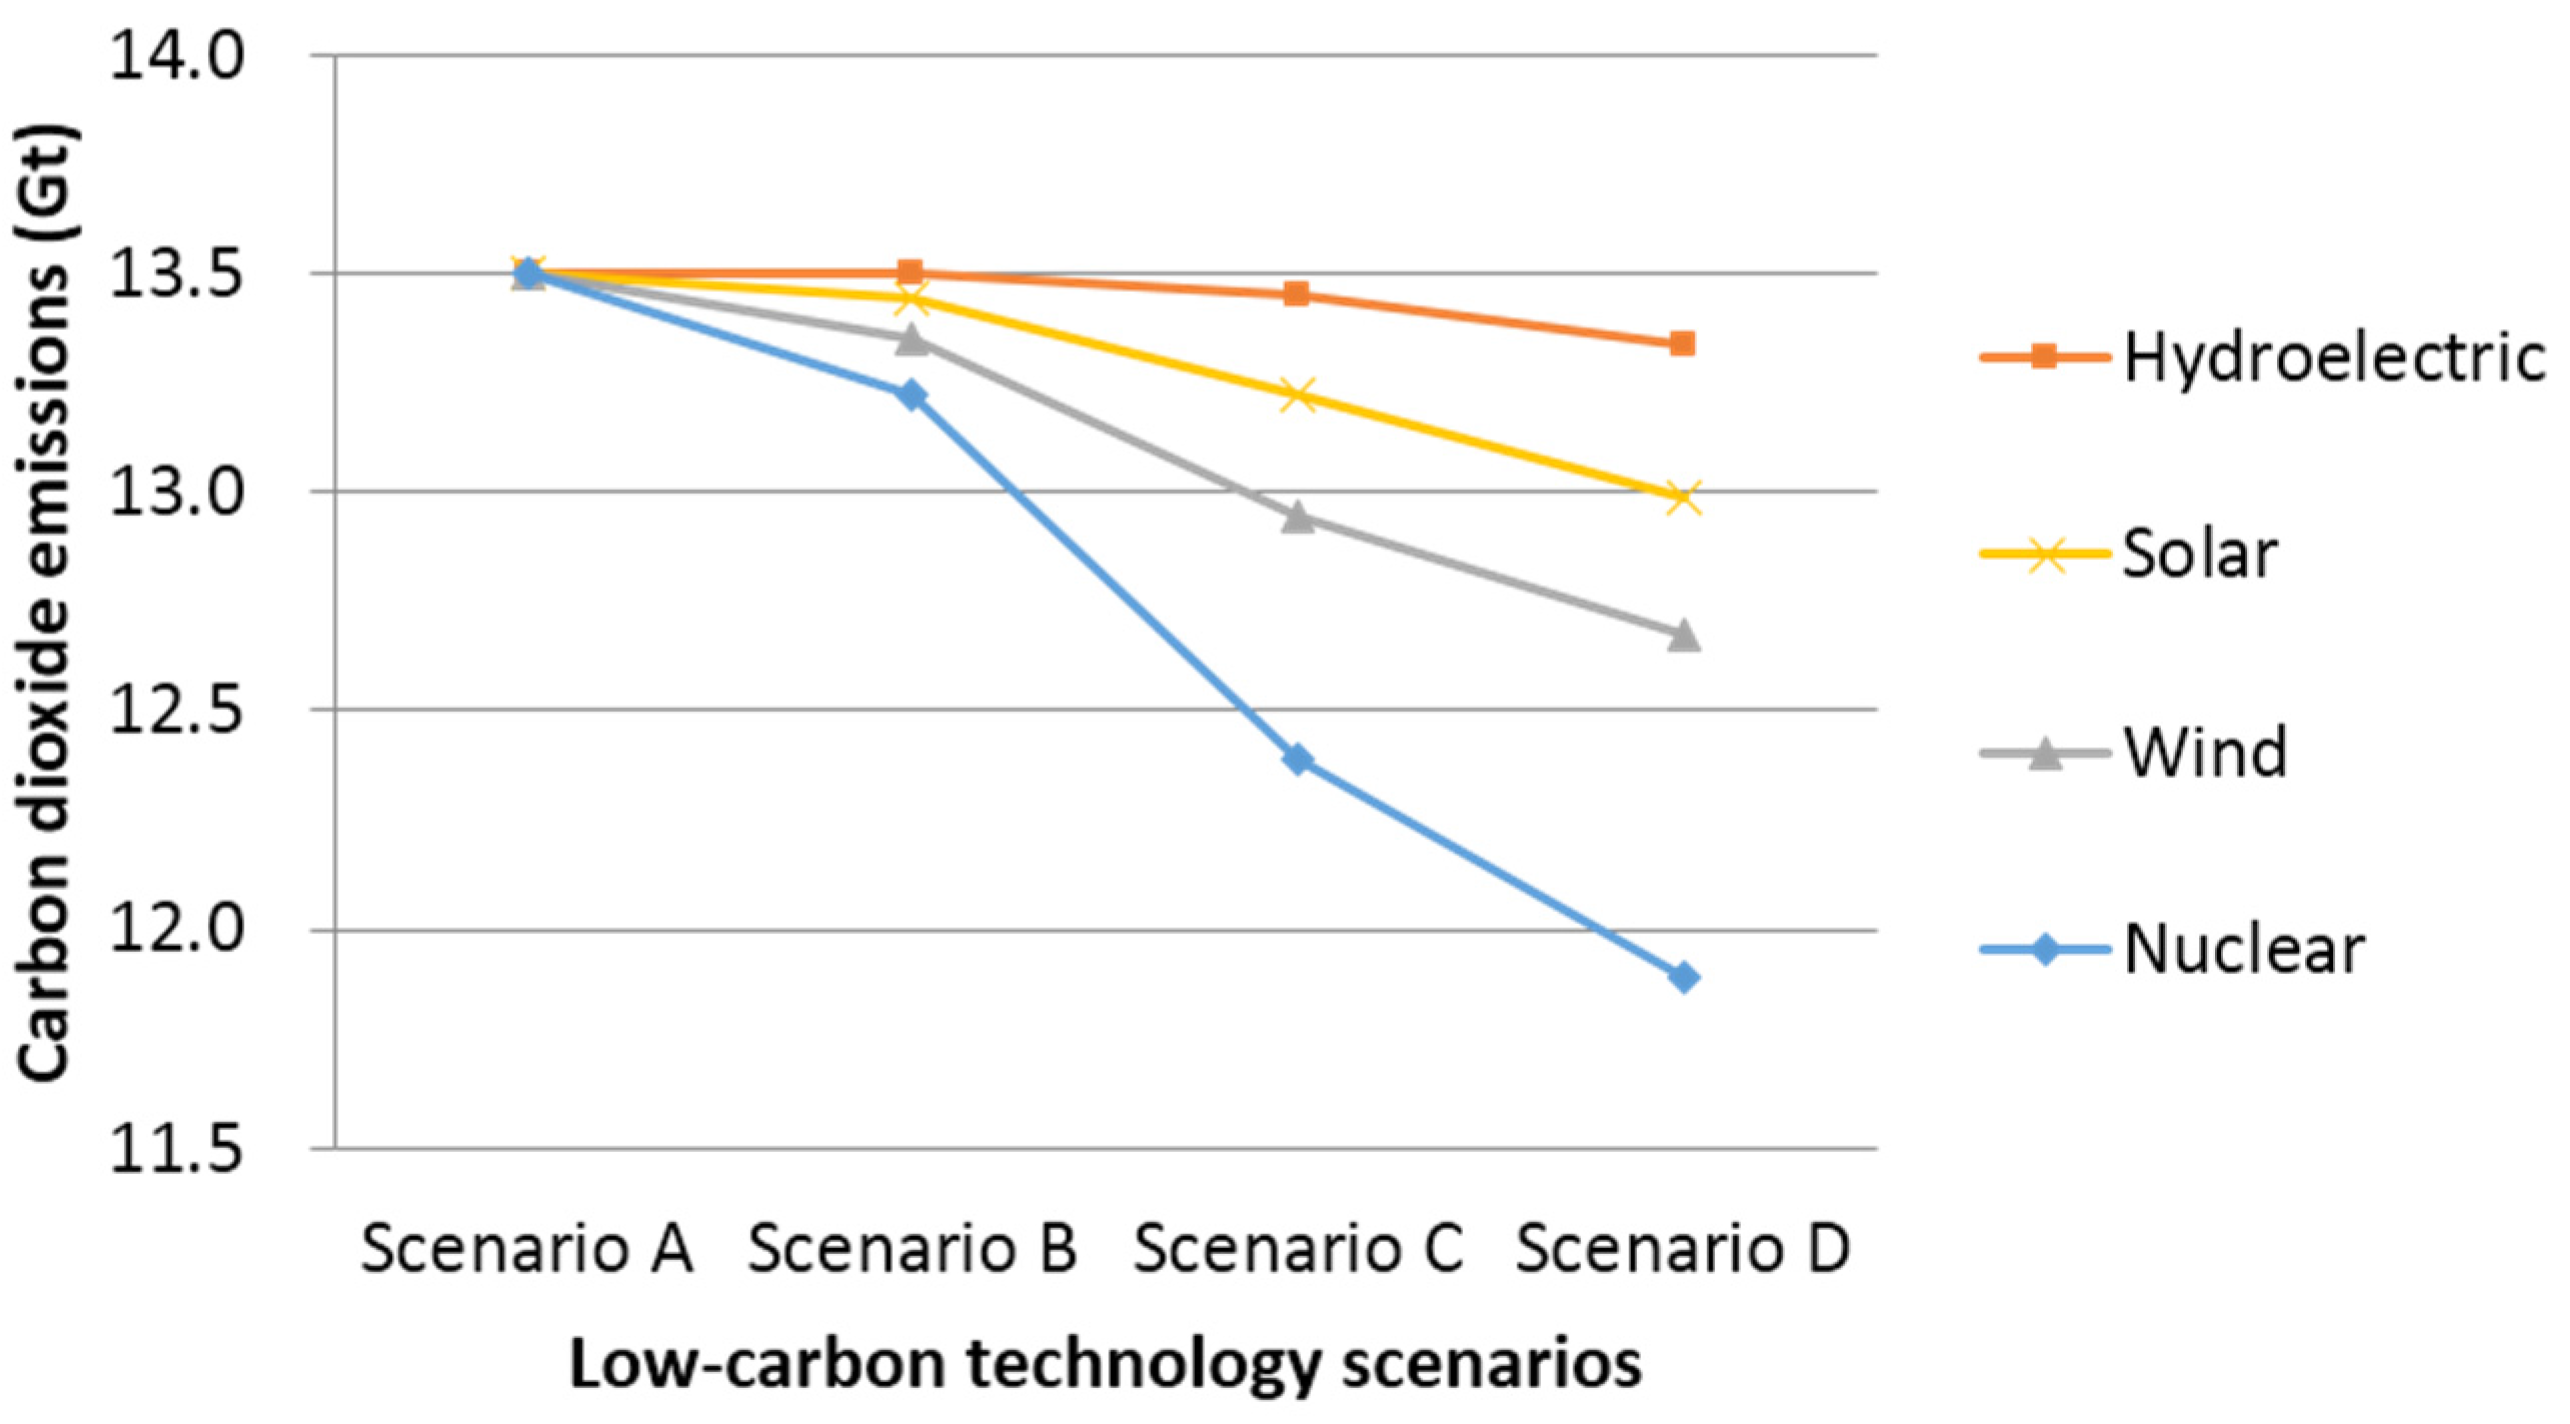
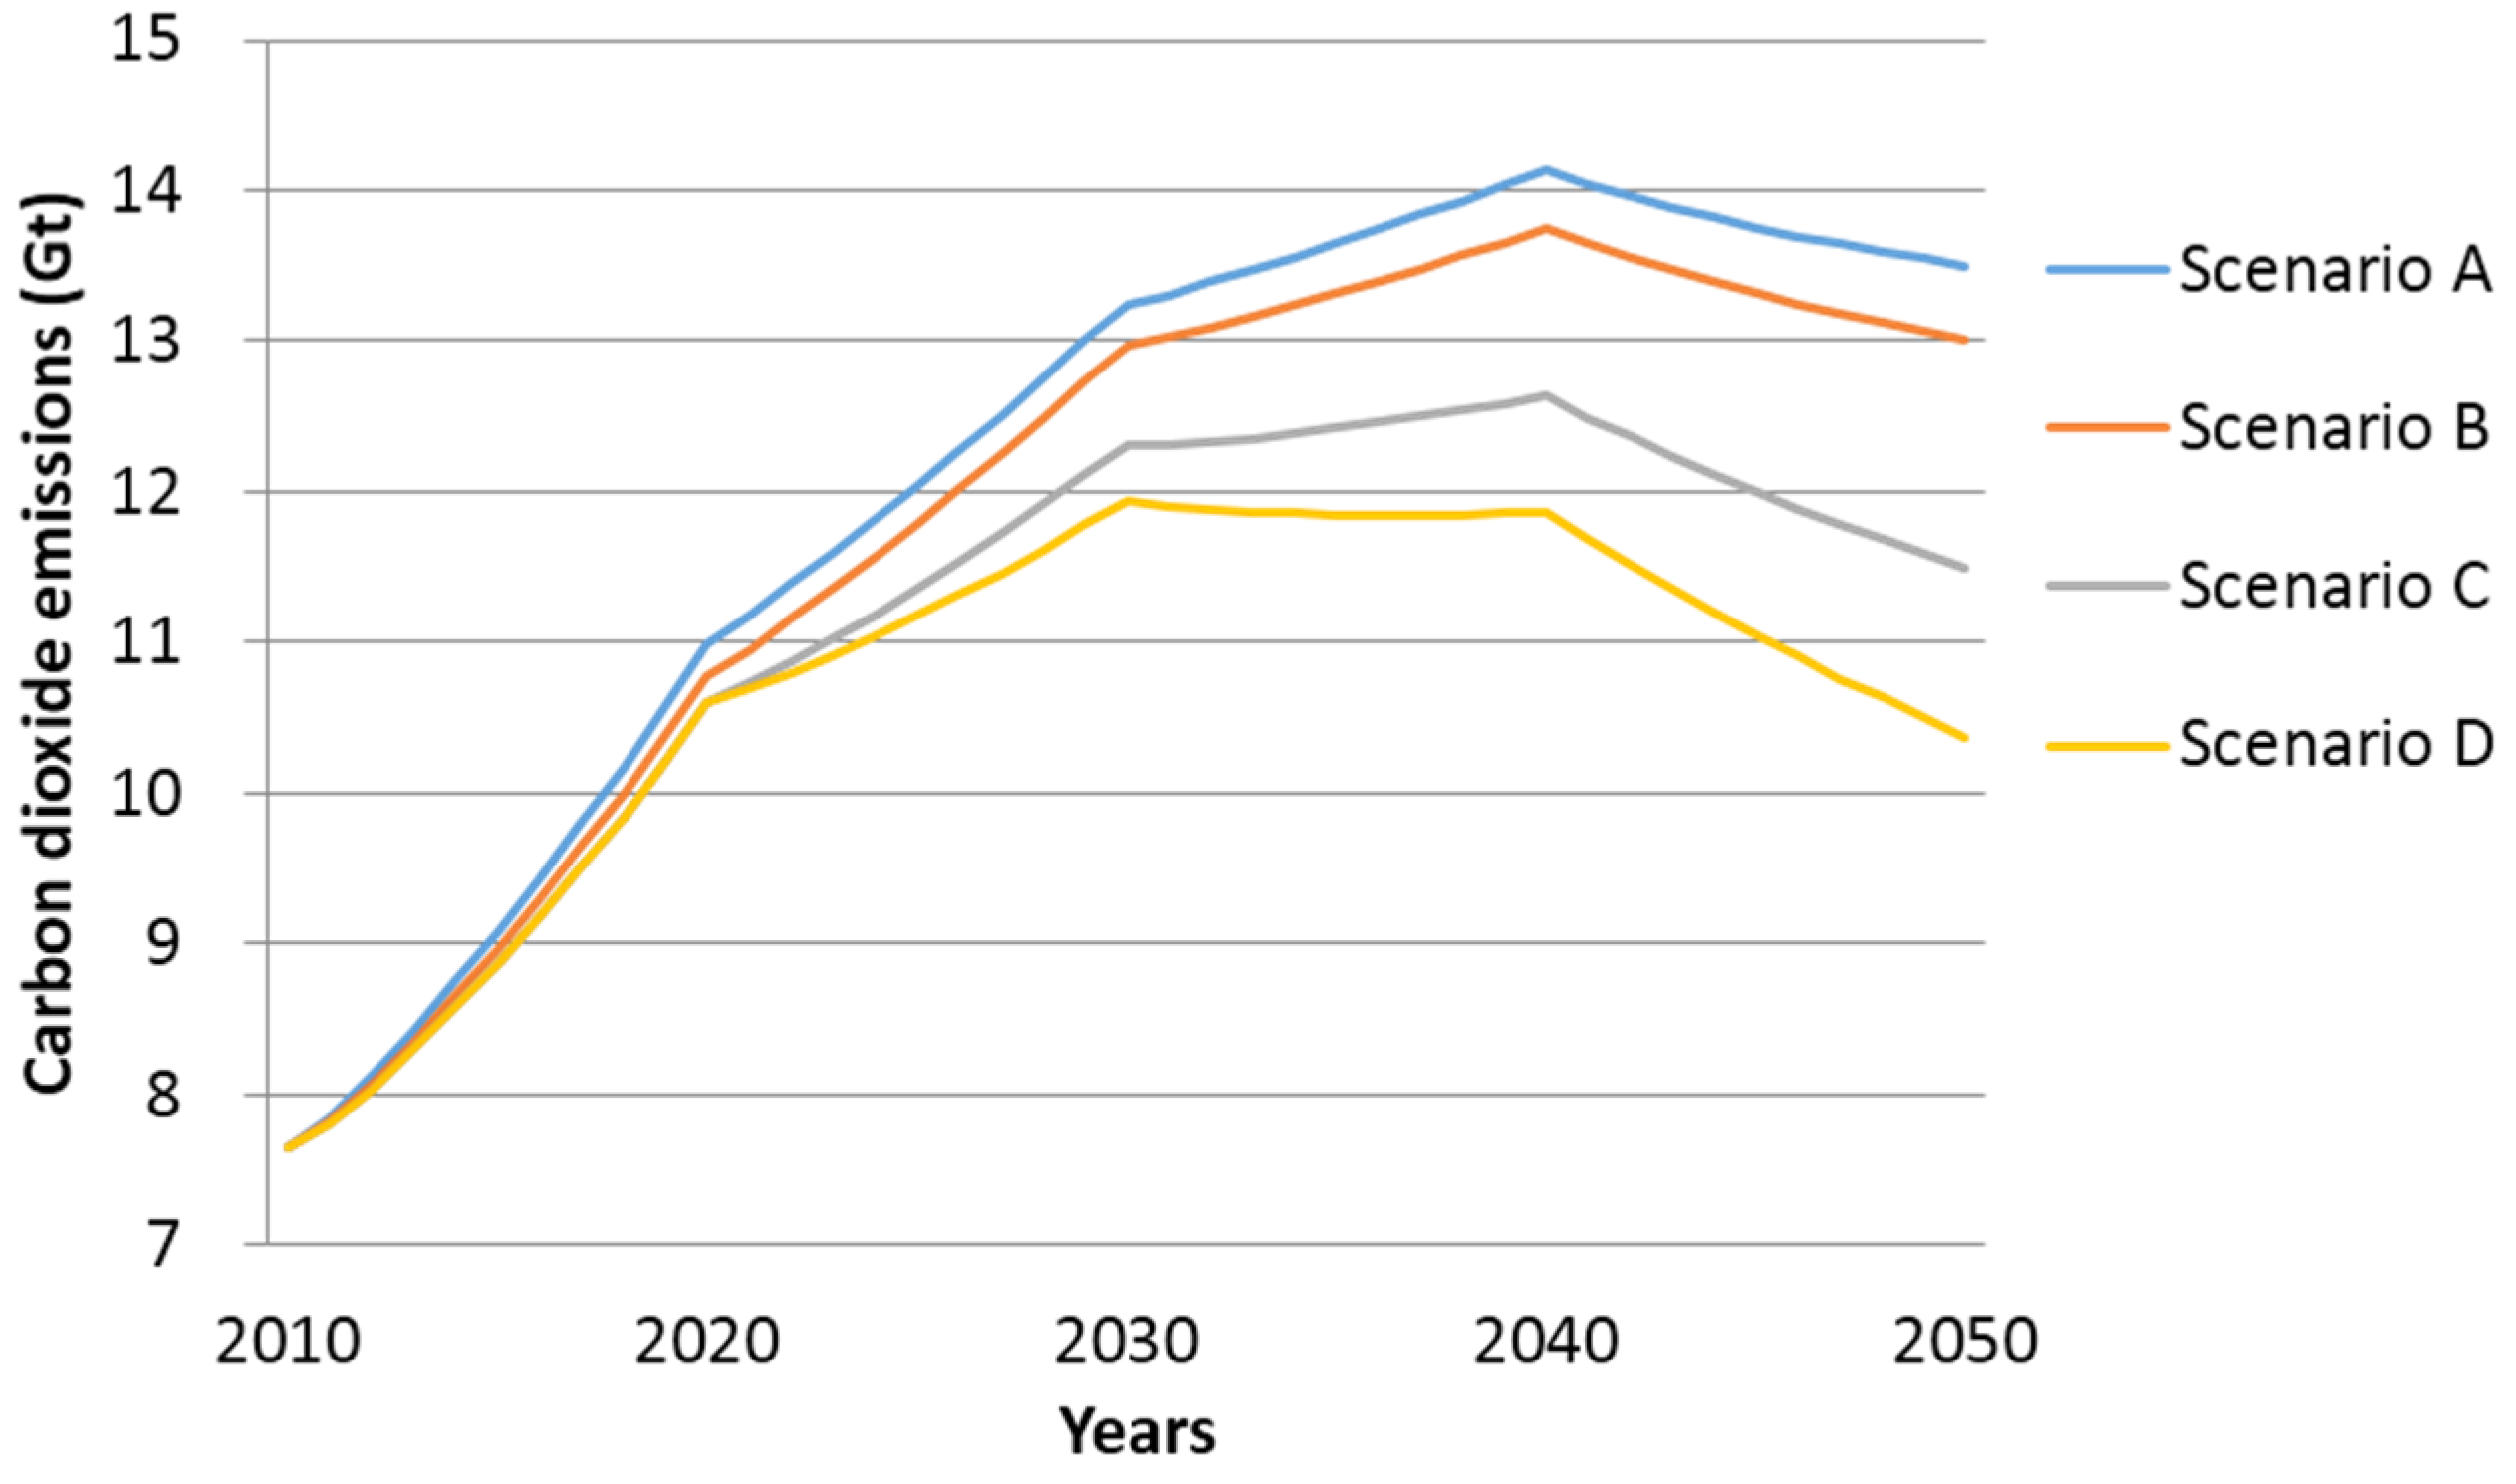
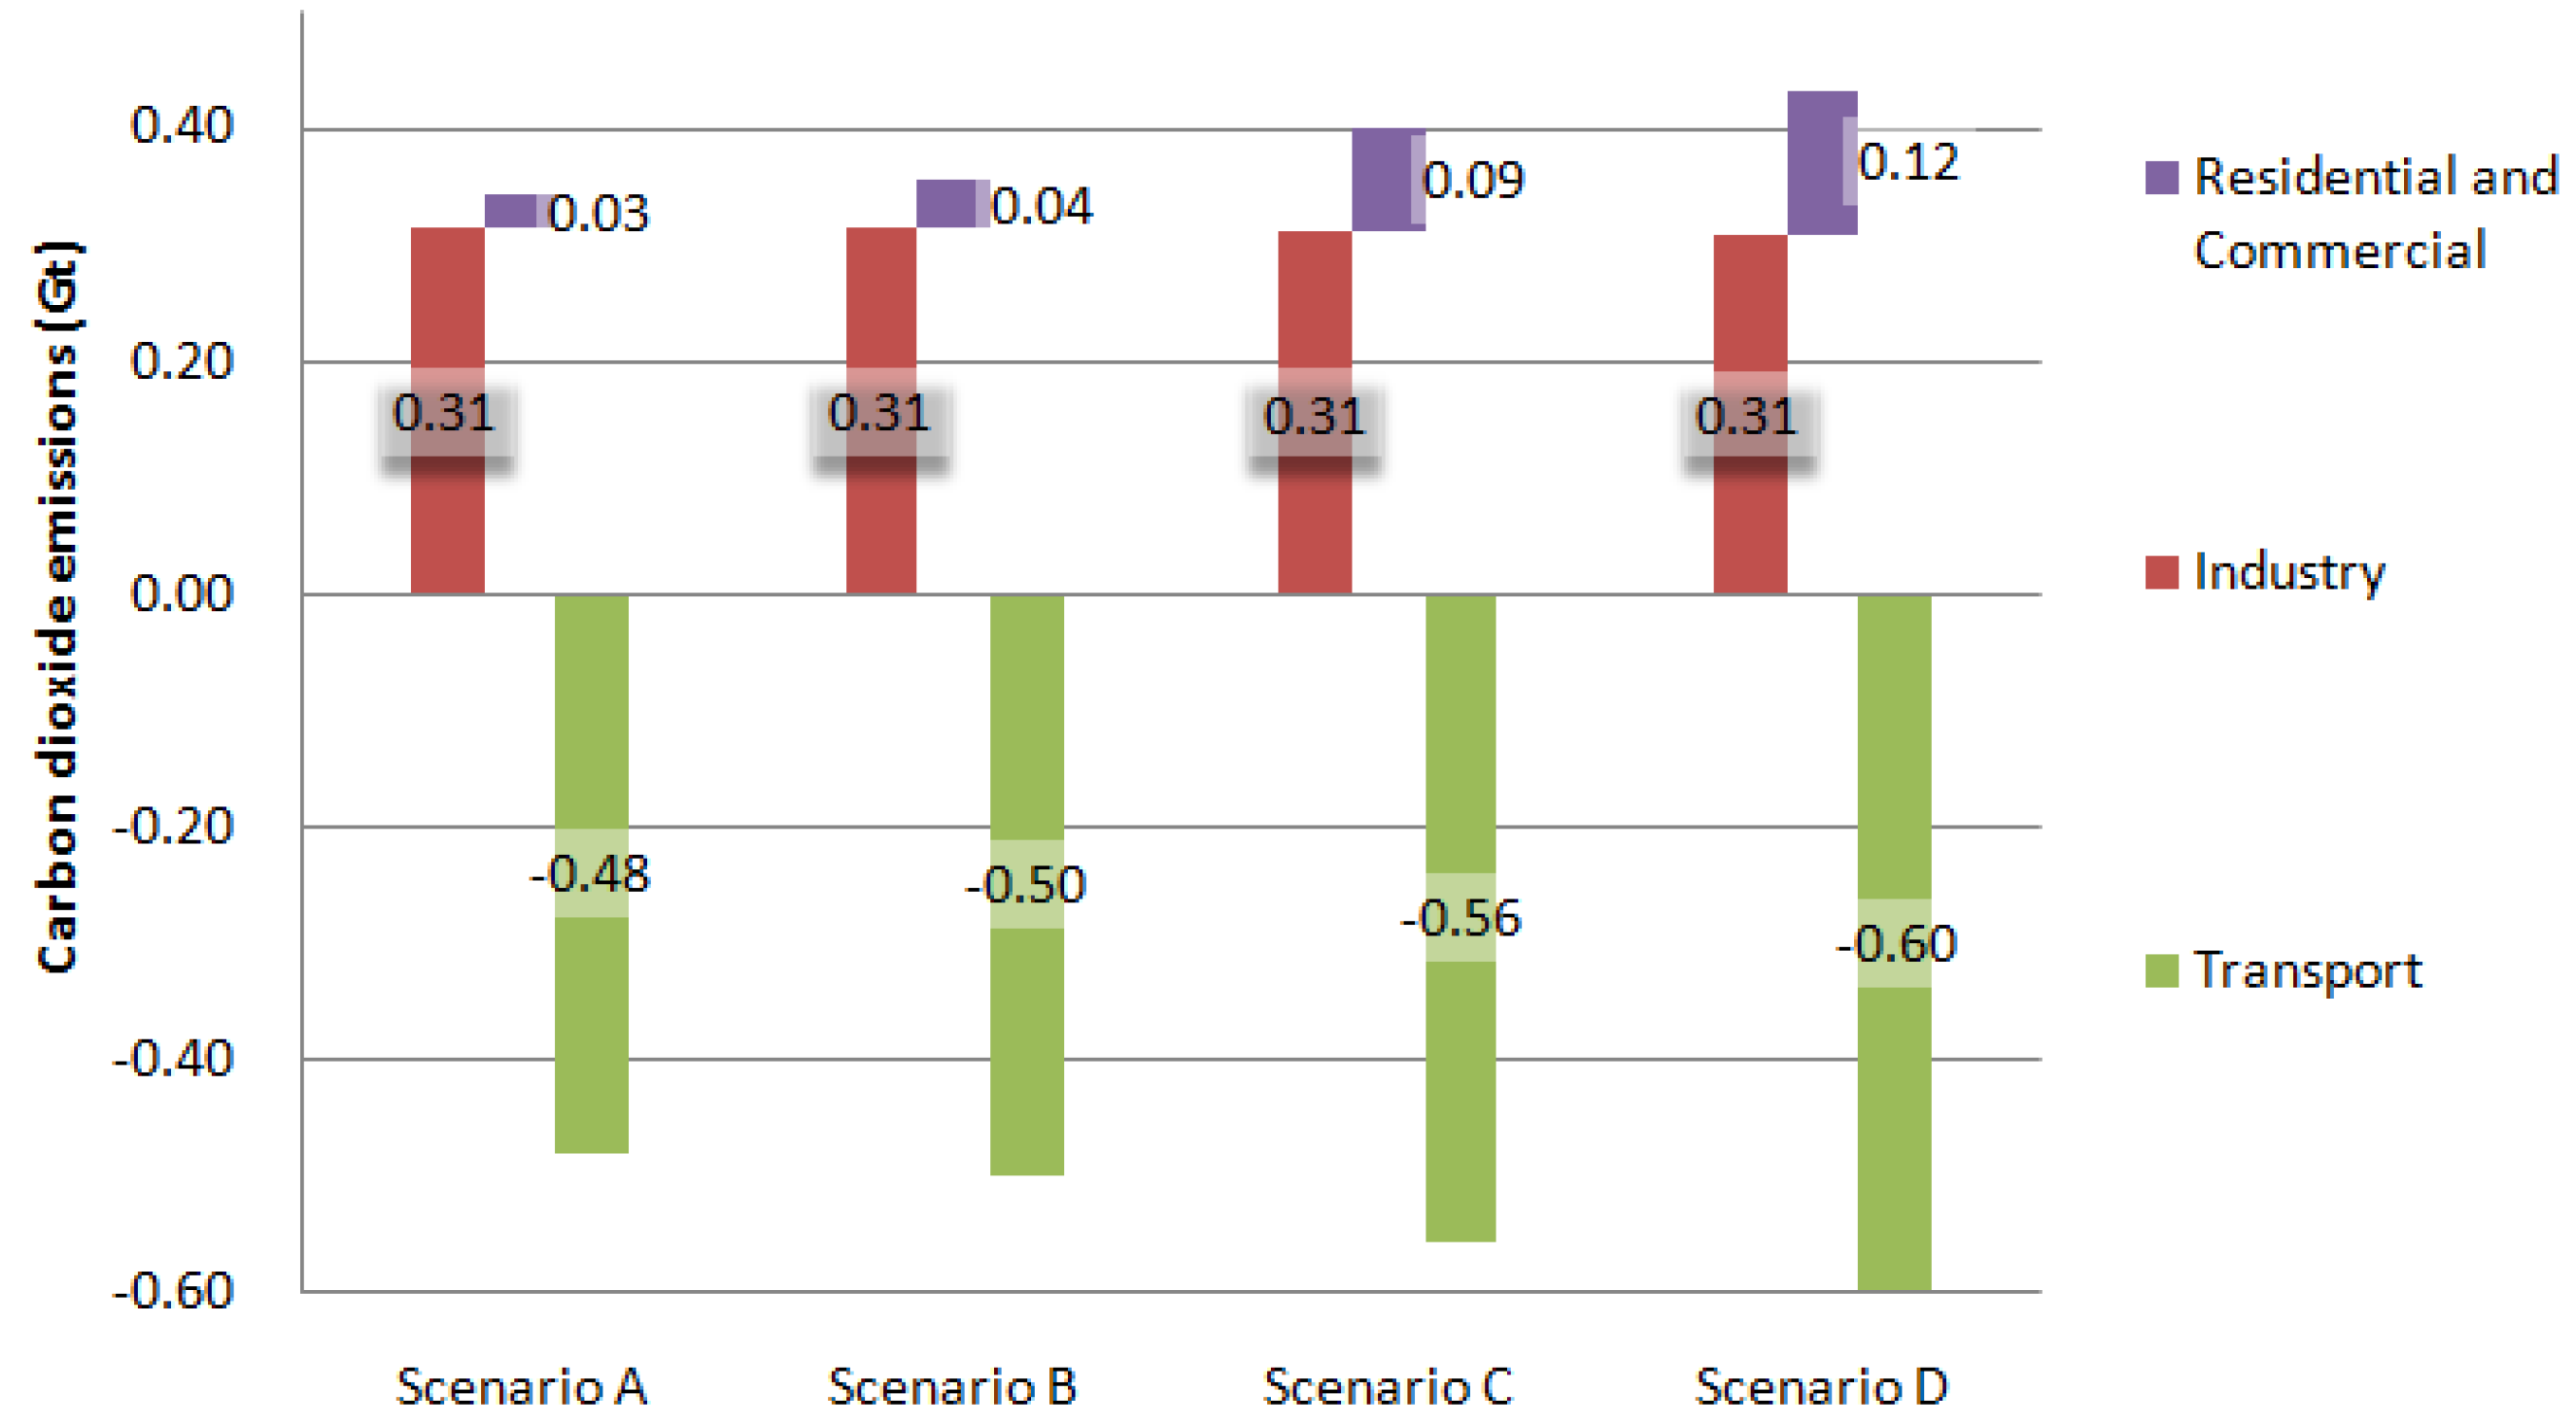
A bottom-up model is built in this paper to estimate how low-carbon technologies and electrification would affect future energy-related carbon dioxide emissions trends. Results show that by deploying low-carbon technologies on a large scale (360 GW for nuclear, 450 GW for hydroelectric power, 950 GW for wind and 700 GW for solar), carbon emissions can be reduced by 20 to 28 percent by 2050 compared with the Reference Scenario (70 GW for nuclear, 379 GW for hydroelectric power, 400 GW for wind and 170 GW for solar) under different economic growth trends. More importantly, this could bring carbon emission peaking forward from 2040 to 2030. In terms of potential carbon dioxide emissions reduction for different low-carbon technologies, nuclear power could achieve the highest emissions reduction owing to its foreseeable rapid development, 290 GW addition compared with the “business as usual” case. By contrast, although wind and solar would have large capacity addition, their contributions to carbon emissions reduction are less notable than nuclear. This is mainly because of their low annual operating hours compared with nuclear energy.
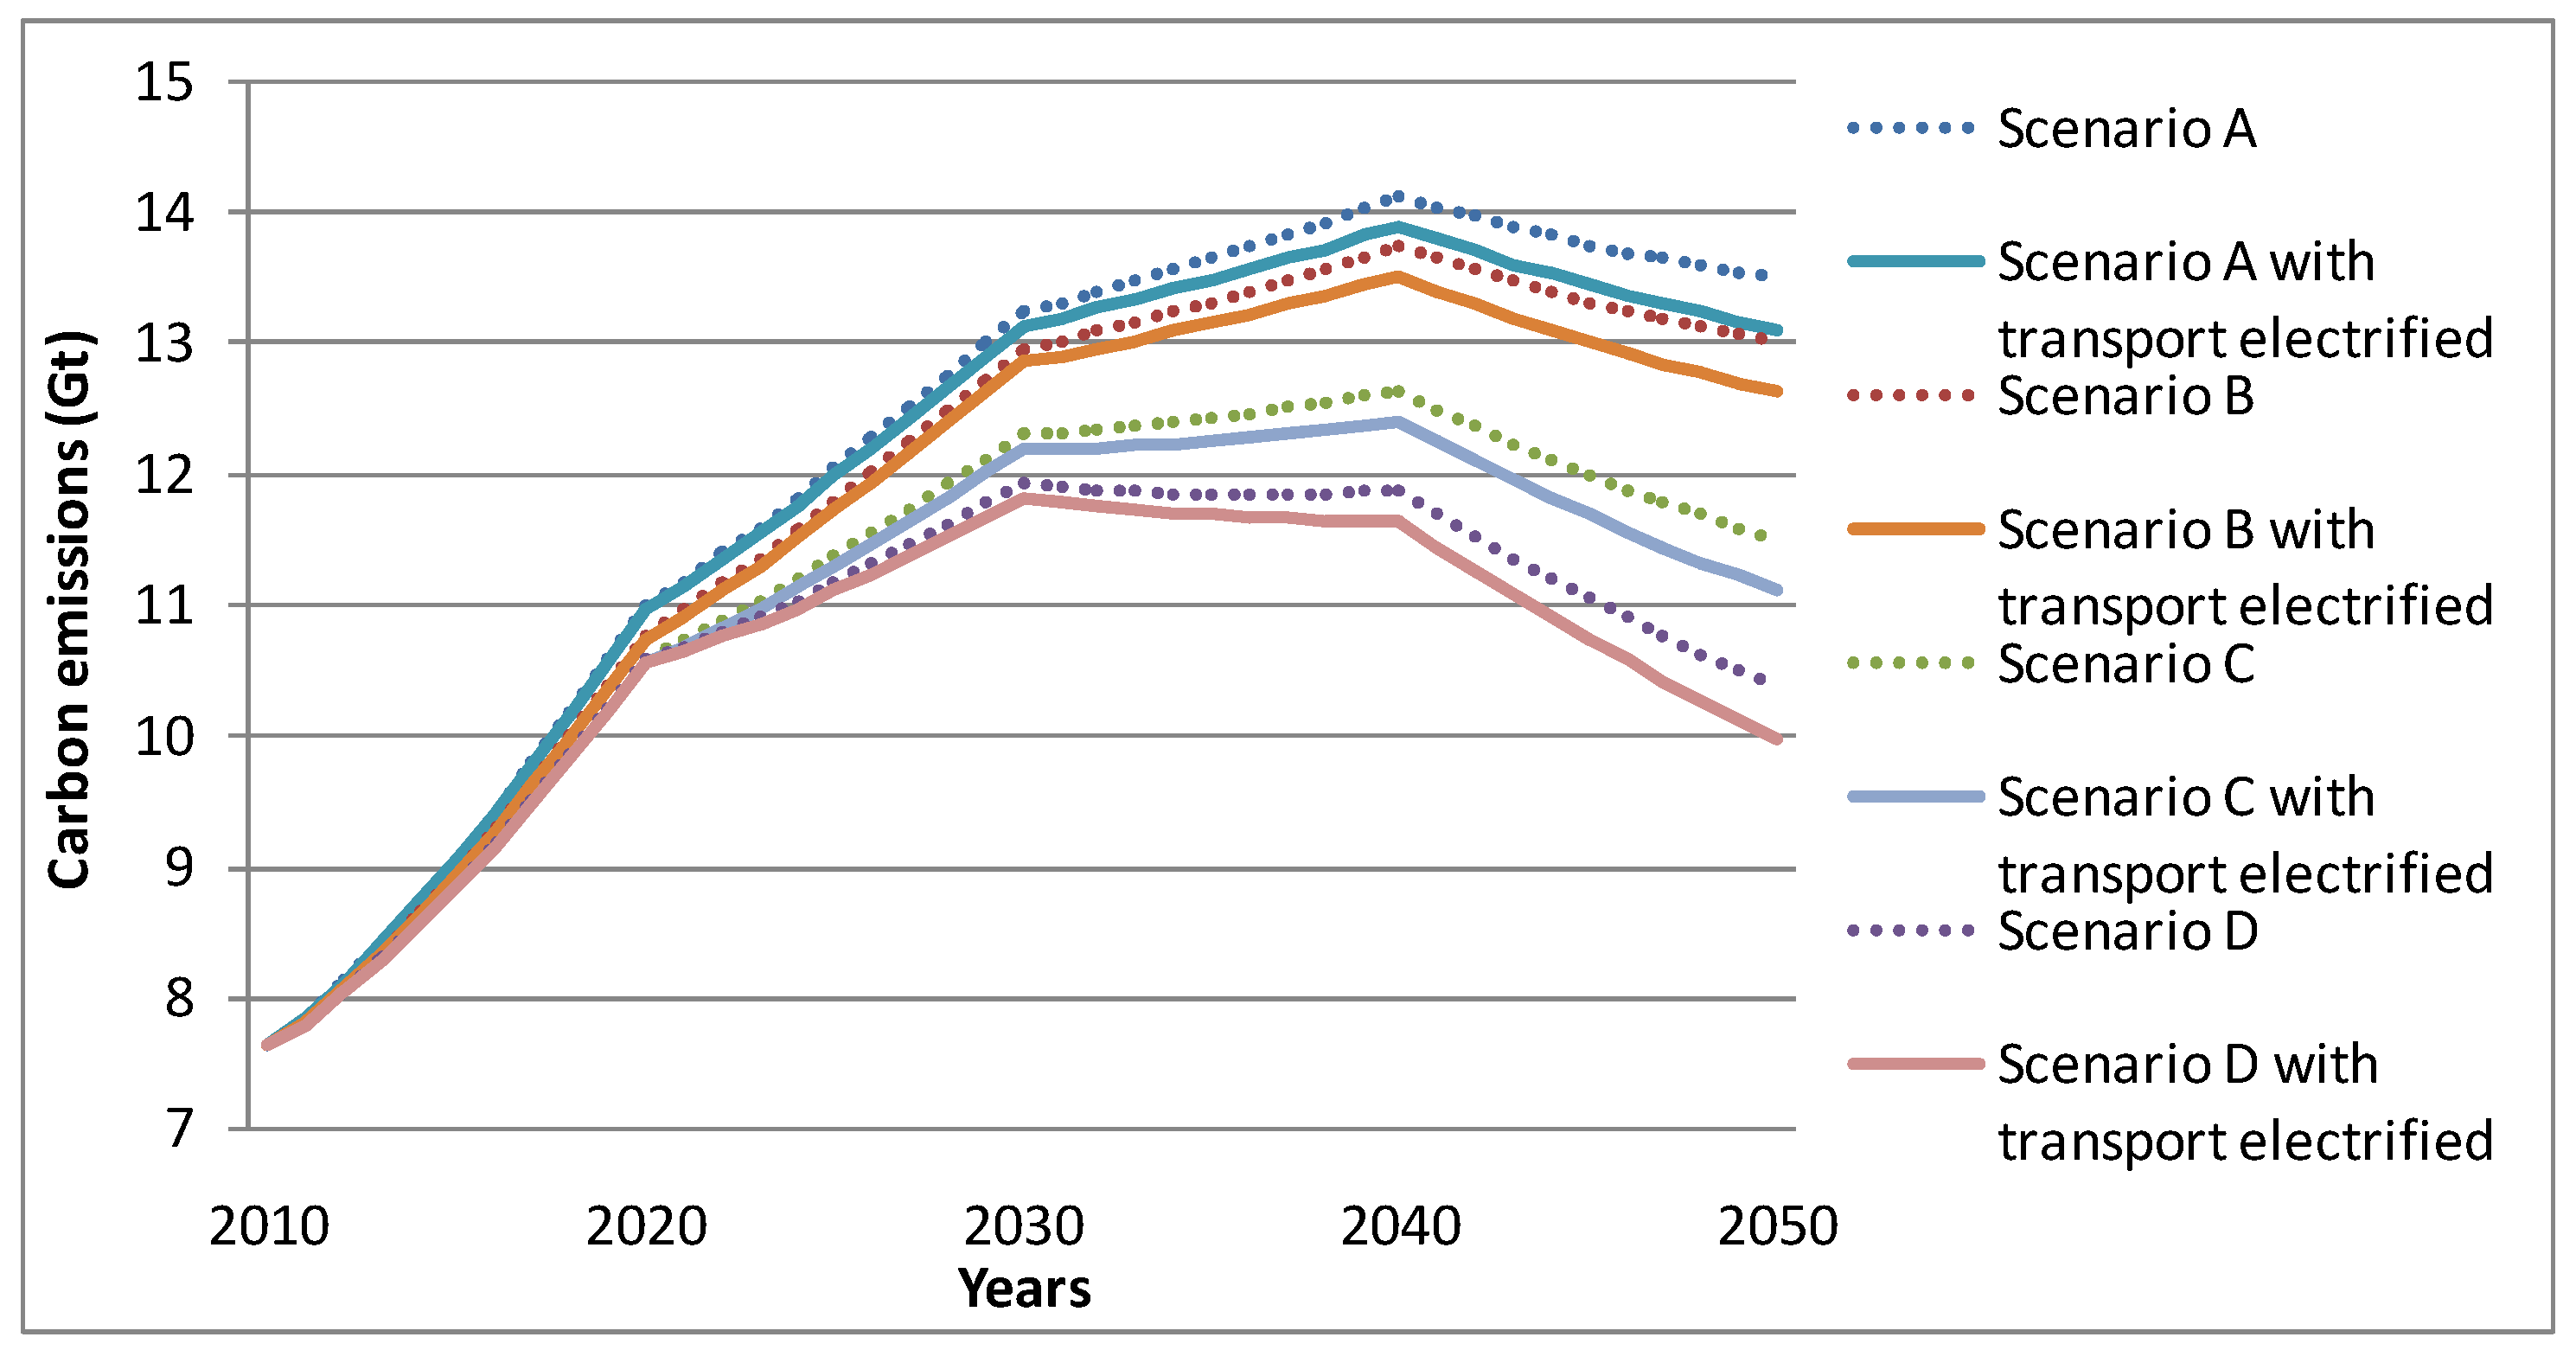
In addition, the effect of electrification is studied. It turns out that electrifying industry, residential and commercial sectors would increase emissions but electrifying transport would reduce emissions with the reference demand trend. Moreover, the increase in emissions by electrifying industry, residential and commercial sectors and the reduction in emissions by electrifying transport would become greater if the deployment of low-carbon technologies accelerates. However, these changes accounts for a small share compared with the emissions in the Reference Scenario and are less significant compared with the emissions reduction that could be achieved by deploying low-carbon technologies. Last but not least, electrifying transport would accelerate the advent of carbon emission peaking.

5. Policy Implications

In terms of future development of low-carbon technologies, their contributions to carbon emissions reduction are significant. Nuclear power should be deployed with priority due to its large potential capacity addition and high availability. However, deployment speed for low-carbon technologies in Scenario D requires higher construction practicality than the current achieved. These indicate the importance of the government to further push the limit of construction practicality, especially for nuclear, by implementing encouraging policies in order to achieve lower emissions through clean energy supply.
With respect to electrification, the results imply that electrifying industry, residential and commercial sectors will not substantially reduce emissions as long as coal is the major fuel for electricity generation. Thus, it is necessary to decarbonize power generation before electrifying these demand sectors. On the other hand, electrifying transport will not only reduce carbon dioxide emissions but also bring carbon peaking forward. Policies should promote the development of electric vehicles to reduce carbon emissions and this might be considered for the purpose of reaching carbon emission peak by 2030 as well.

Acknowledgments

The authors gratefully acknowledge the financial support from the IRSES ESE Project of FP7 (contract No: PIRSESGA-2011-294987) and from BP Company in the scope of the Phase II Collaboration between BP and Tsinghua University.

Author Contributions

All authors contribute ideas to the paper. Zheng Guo focuses on low-carbon technology scenarios and is the main writer of the work. Pei Liu is in charge of developing the methodology part. Linwei Ma provides relative data for future energy demand projection. Zheng Li concludes main findings from the results.

Conflicts of Interest

The authors declare no conflict of interest.

References

  1. NBSC (National Bureau of Statistics of China). China Energy Statistical Yearbook 2011; China Statistics Press: Beijing, China, 2011. (In Chinese)
  2. EIA (U.S. Energy Information Administration). International Energy Statistics Database. Available online: http://www.eia.gov/cfapps/ipdbproject/IEDIndex3.cfm?tid=44&pid=44&aid=2 (accessed on 9 July 2015).
  3. IMF (International Monetary Fund). World Economic Outlook Database. Available online: http://www.imf.org/external/pubs/ft/weo/2014/01/weodata/weorept.aspx?pr.x=57&pr.y=8&sy=2012&ey=2019&scsm=1&ssd=1&sort=country&ds=.&br=1&c=924&s=NGDP_RPCH&grp=0&a= (accessed on 9 July 2015).
  4. NDRC (National Development and Reform Commission). China’s National Plan on Climate Change (2014–2020); NDRC: Beijing, China, 2014. (In Chinese)
  5. IEA (International Energy Agency). World Energy Outlook 2012; IEA: Paris, France, 2012. [Google Scholar]
  6. EIA (U.S. Energy Information Administration). International Energy Outlook 2013. EIA: Washington, DC, USA, 2013. [Google Scholar]
  7. 2050 China Energy and CO2 Emissions Research Group. 2050 China Energy and CO2 Emissions Report; Science Press: Beijing, China, 2009. (In Chinese) [Google Scholar]
  8. McKinsey and Company. China’s Green Revolution: Prioritizing Technologies to Achieve Energy and Environmental Sustainability; McKinsey and Company: Shanghai, China, 2009. [Google Scholar]
  9. Chinese Academy of Engineering. The Mid-Term and Long-Term Energy Development Strategy of China (2030, 2050); Science Press: Beijing, China, 2010. (In Chinese) [Google Scholar]
  10. Pan, L.; Guo, Z.; Liu, P.; Ma, L.; Li, Z. Comparison and analysis of macro energy scenarios in China and a decomposition-based approach to quantifying the impacts of economic and social development. Energies 2013, 6, 3444–3465. [Google Scholar] [CrossRef]
  11. IEA (International Energy Agency). Energy Technology Perspectives 2014; IEA: Paris, France, 2014. [Google Scholar]
  12. MacKay, D. Sustainable Energy—Without the Hot Air; UIT Cambridge: Cambridge, UK, 2008. [Google Scholar]
  13. Ke, J.; Price, L.; Ohshita, S.; Fridley, D.; Khanna, N.Z.; Zhou, N.; Levine, M. China’s industrial energy consumption trends and impacts of the Top-1000 enterprises energy-saving program and the ten key energy-saving projects. Energy Policy 2012, 50, 562–569. [Google Scholar] [CrossRef]
  14. Wu, L.; Huo, H. Energy efficiency achievements in China’s industrial and transport sectors: How do they rate? Energy Policy 2014, 73, 38–46. [Google Scholar] [CrossRef]
  15. Zhou, N.; Fridley, D.; Khanna, N.Z.; Ke, J.; McNeil, M.; Levine, M. China’s energy and emissions outlook to 2050: Perspectives from bottom-up energy end-use model. Energy Policy 2013, 53, 51–62. [Google Scholar] [CrossRef]
  16. Gambhir, A.; Schulz, N.; Napp, T.; Tong, D.; Munuera, L.; Faist, M.; Riahi, K. A hybrid modelling approach to develop scenarios for China’s carbon dioxide emissions to 2050. Energy Policy 2013, 59, 614–632. [Google Scholar] [CrossRef]
  17. Hetland, J. Broaching CCS into society. Timeline considerations for deployment of CO2 capture and storage linked with the challenge of capacity building. Int. J. Greenh. Gas Control 2012, 9, 172–183. [Google Scholar] [CrossRef]
  18. Chateau, J.; Rebolledo, C.; Dellink, R. An Economic Projection to 2050: The OECD “ENV-Linkages” Model Baseline; OECD (Organization for Economic Co-operation and Development): Paris, France, 2011. [Google Scholar]
  19. IEA (International Energy Agency). Energy Balances of OECD Countries 2012; IEA: Paris, France, 2012. [Google Scholar]
  20. NBSC (National Bureau of Statistics of China). China Energy Statistical Yearbook 2000–2002; China Statistics Press: Beijing, China, 2002. (In Chinese)
  21. NBSC (National Bureau of Statistics of China). China Statistical Yearbook 2014; China Statistics Press: Beijing, China, 2014. (In Chinese)
  22. IAEA (International Atomic Energy Agency). IAEA Annual Report 2012; IAEA: Vienna, Austria, 2013. [Google Scholar]
  23. World Nuclear Association. Nuclear Power in China. Available online: http://www.world-nuclear.org/info/Country-Profiles/Countries-A-F/China--Nuclear-Power/F/China--Nuclear-Power/ (accessed on 9 July 2015).
  24. NDRC (National Development and Reform Commission). Medium- and Long-term Nuclear Power Development Plan (2005-2020); NDRC: Beijing, China, 2007. (In Chinese)
  25. IMF (International Monetary Fund). Report for Selected Country Groups and Subjects (PPP valuation of country GDP). Available online: http://www.imf.org/external/pubs/ft/weo/2015/01/weodata/index.aspx (accessed on 9 July 2015).
  26. EIA (U.S. Energy Information Administration). Nuclear Reactor Operational Status Tables. Available online: http://www.eia.gov/nuclear/reactors/index.html (accessed on 22 November 2011).
  27. The State Council. The 12th Five-Year Plan for Energy Development; The State Council: Beijing, China, 2013. (In Chinese)
  28. The State Council. The 12th Five-Year Plan for Wind Power; The State Council: Beijing, China, 2013. (In Chinese)
  29. The State Council. The 12th Five-Year Plan for Solar Power; The State Council: Beijing, China, 2013. (In Chinese)
  30. The State Council. The Energy Development Strategy Action Plan (2014–2020); The State Council: Beijing, China, 2014. (In Chinese)
  31. Eggleston, H.S.; Miwa, K.; Srivastava, N.; Tanabe, K. IPCC Guidelines for National Greenhouse Gas Inventories; Institute for Global Environmental Strategies: Hayama, Japan, 2008. [Google Scholar]
  32. IEA (International Energy Agency). Good Practice for Industrial Coal-Fired Boilers. Available online: http://www.iea-coal.org/documents/82201/7213/Good-practice-for-industrial-coal-fired-boilersdf (accessed on 9 October 2009).

