Article

Development and Characterization of Non-Conventional Micro-Porous Layers for PEM Fuel Cells

by
Riccardo Balzarotti
*,
Saverio Latorrata
,
Paola Gallo Stampino
,
Cinzia Cristiani
and
Giovanni Dotelli
Politecnico di Milano, Dipartimento di Chimica, Materiali e Ingegneria Chimica "G. Natta", Piazza Leonardo da Vinci 32, 20133 Milano, Italy
*
Author to whom correspondence should be addressed.
These authors contributed equally to this work.
Energies 2015, 8(7), 7070-7083; https://doi.org/10.3390/en8077070
Submission received: 16 June 2015 / Revised: 2 July 2015 / Accepted: 6 July 2015 / Published: 13 July 2015
(This article belongs to the Special Issue Polymer Electrolyte Membrane Fuel Cells 2015)

Abstract

:
Gas diffusion medium (GDM) is a crucial component in proton exchange membrane fuel cells (PEMFCs). Being composed of a gas diffusion layer (GDL) with a micro-porous layer (MPL) coated onto it, it ensures a proper water management due to the highly hydrophobic materials employed in cell assembly. In current commercial applications, the desired water repellent behaviour is usually obtained by using polytetrafluoroethylene (PTFE). In this work, Fluorolink® P56 (Solvay Specialty Polymers, Milan, Italy), a commercially available, anionic, segmented high molecular weight polyfluorourethane with perfluoropolyether groups was extensively evaluated as an alternative to PTFE for micro-porous layer hydrophobization. A change in polymer used is desirable in order to simplify the production process, both in terms of ink formulation and thermal treatment, as well as to get a higher hydrophobicity and, consequently, more efficient water management. Innovative prepared samples were compared to a PTFE-based GDM, in order to assess differences both from morphological and from an electrochemical point of view.

1. Introduction

From the past few decades to now, worldwide energy demand has been reported to be continuously rising, and this trend is also expected for the medium-term future. Quite apart from the fact that common fossil energy sources are not renewable, they are the most remarkable cause of greenhouse gas emissions. Several worldwide organizations are focused on this problem and, among them, the European Union has set several guidelines in order to reduce greenhouse gas emissions. One of the newest (i.e., Roadmap 2050) has set strict targets, aiming to achieve a reduction of 80%–95% with respect to 1990 emission values [1,2]. Therefore, changes in energy production are needed and, in this respect, proton exchange membrane fuel cells (PEMFCs) are considered very promising due to their zero-emission energy production process. Moreover, they show many advantages in terms of low operating temperature, compactness, fast response to load change and high efficiency [3,4,5,6,7]. The electrolyte used in the device is a polymer-based membrane and is usually composed by fluorinated compounds; Nafion®, which was developed by Dupont in the late 1960s, is a very common polymer for that kind of application [8].
Among the structural components of PEMFCs, it is crucial to develop efficient gas diffusion media (GDM) in order to pursue the goal of performance optimization. The GDM is composed of two layers: a macro-porous substrate named gas diffusion layer (GDL) and a micro-porous layer (MPL) coated onto the former.
From the GDL properties’ point of view, some desired key features were identified: reactant and product permeability, electrical and thermal conductivity and mechanical support [9,10]. While thermal and electrical conductivity are commonly achieved by using carbon based materials, reactants and products permeability features are more complicated to be obtained, and they are usually achieved by exploiting specific GDL properties, which are sometimes competing with each other. Reactants’ permeability should be high enough to properly supply fuel and oxidants to the catalyst-coated membrane (CCM), avoiding mass transport limitations. For the same reason, product permeability should be high enough to prevent flooding which could result from excessive water production on the cathode side [11]. This last target is usually reached by making GDL hydrophobic [10]. In many cases, polytetrafluoroethylene (PTFE) is used in order to obtain the desired water-repellent behaviour, with a polymer loading on the layer surface in a range between 5% and 30% (w/w) [10,12]. Polymer content is the result of two competing properties: a high amount of polymer confers good hydrophobic properties to the GDL, but it leads to an increase in terms of ohmic losses due to polymer dielectric properties.
Different carbon-based gas diffusion layers are commercially available. Both from the commercial and the scientific point of view, carbon paper and carbon cloth-based GDLs are the most commonly used [13,14]. They share similarities in terms of diffusion properties and pore size distribution. Pore dimension is crucial for device performance management: an optimum in pore dimension should be found, as higher pores enhance species gas diffusion, but they increase ohmic losses [9].
The MPL is coated onto the GDL strictly in contact with the electrodes; moreover, it introduces a micro-porosity which enhances transport properties, improving electrochemical performances [15,16]. One of the most validated theories about the role of the MPL in water management highlights important contributions to the cell operation by the MPL itself [9,17]; moreover, the introduction of micro-porosity together with hydrophobic properties have been investigated for performance enhancement by many research groups, due to better properties in terms of water removal in the MEA (Membrane Electrode Assembly) [17,18].
MPL is usually manufactured mixing carbon powder, a hydrophobic agent, water, organic solvents and surfactants in order to produce a carbon ink. The latter is then deposited onto the GDL surface by different techniques such as blade coating, tape casting, spray and being thermally treated to remove solvents and surfactants and to consolidate the layer [9,10].
The aim of this work was to evaluate the possibility to use a fluorinated polymer, alternative to the one commonly used—PTFE—for micro-porous layer production, with the final target to get better device performance. For this purpose, Fluorolink® P56, a commercial fluorinated polyurethane based on perfluoropolyether blocks, was compared to PTFE for the effects on GDM features, both from the morphological and from electrochemical point of view. Moreover, a new simplified production route was adopted for obtaining the alternative GDMs. PTFE, as previously mentioned, is a widely used polymer for GDM production and treatments, but shows issues concerning the amount of polymer needed to achieve good electrochemical performance.

2. Experimental Section
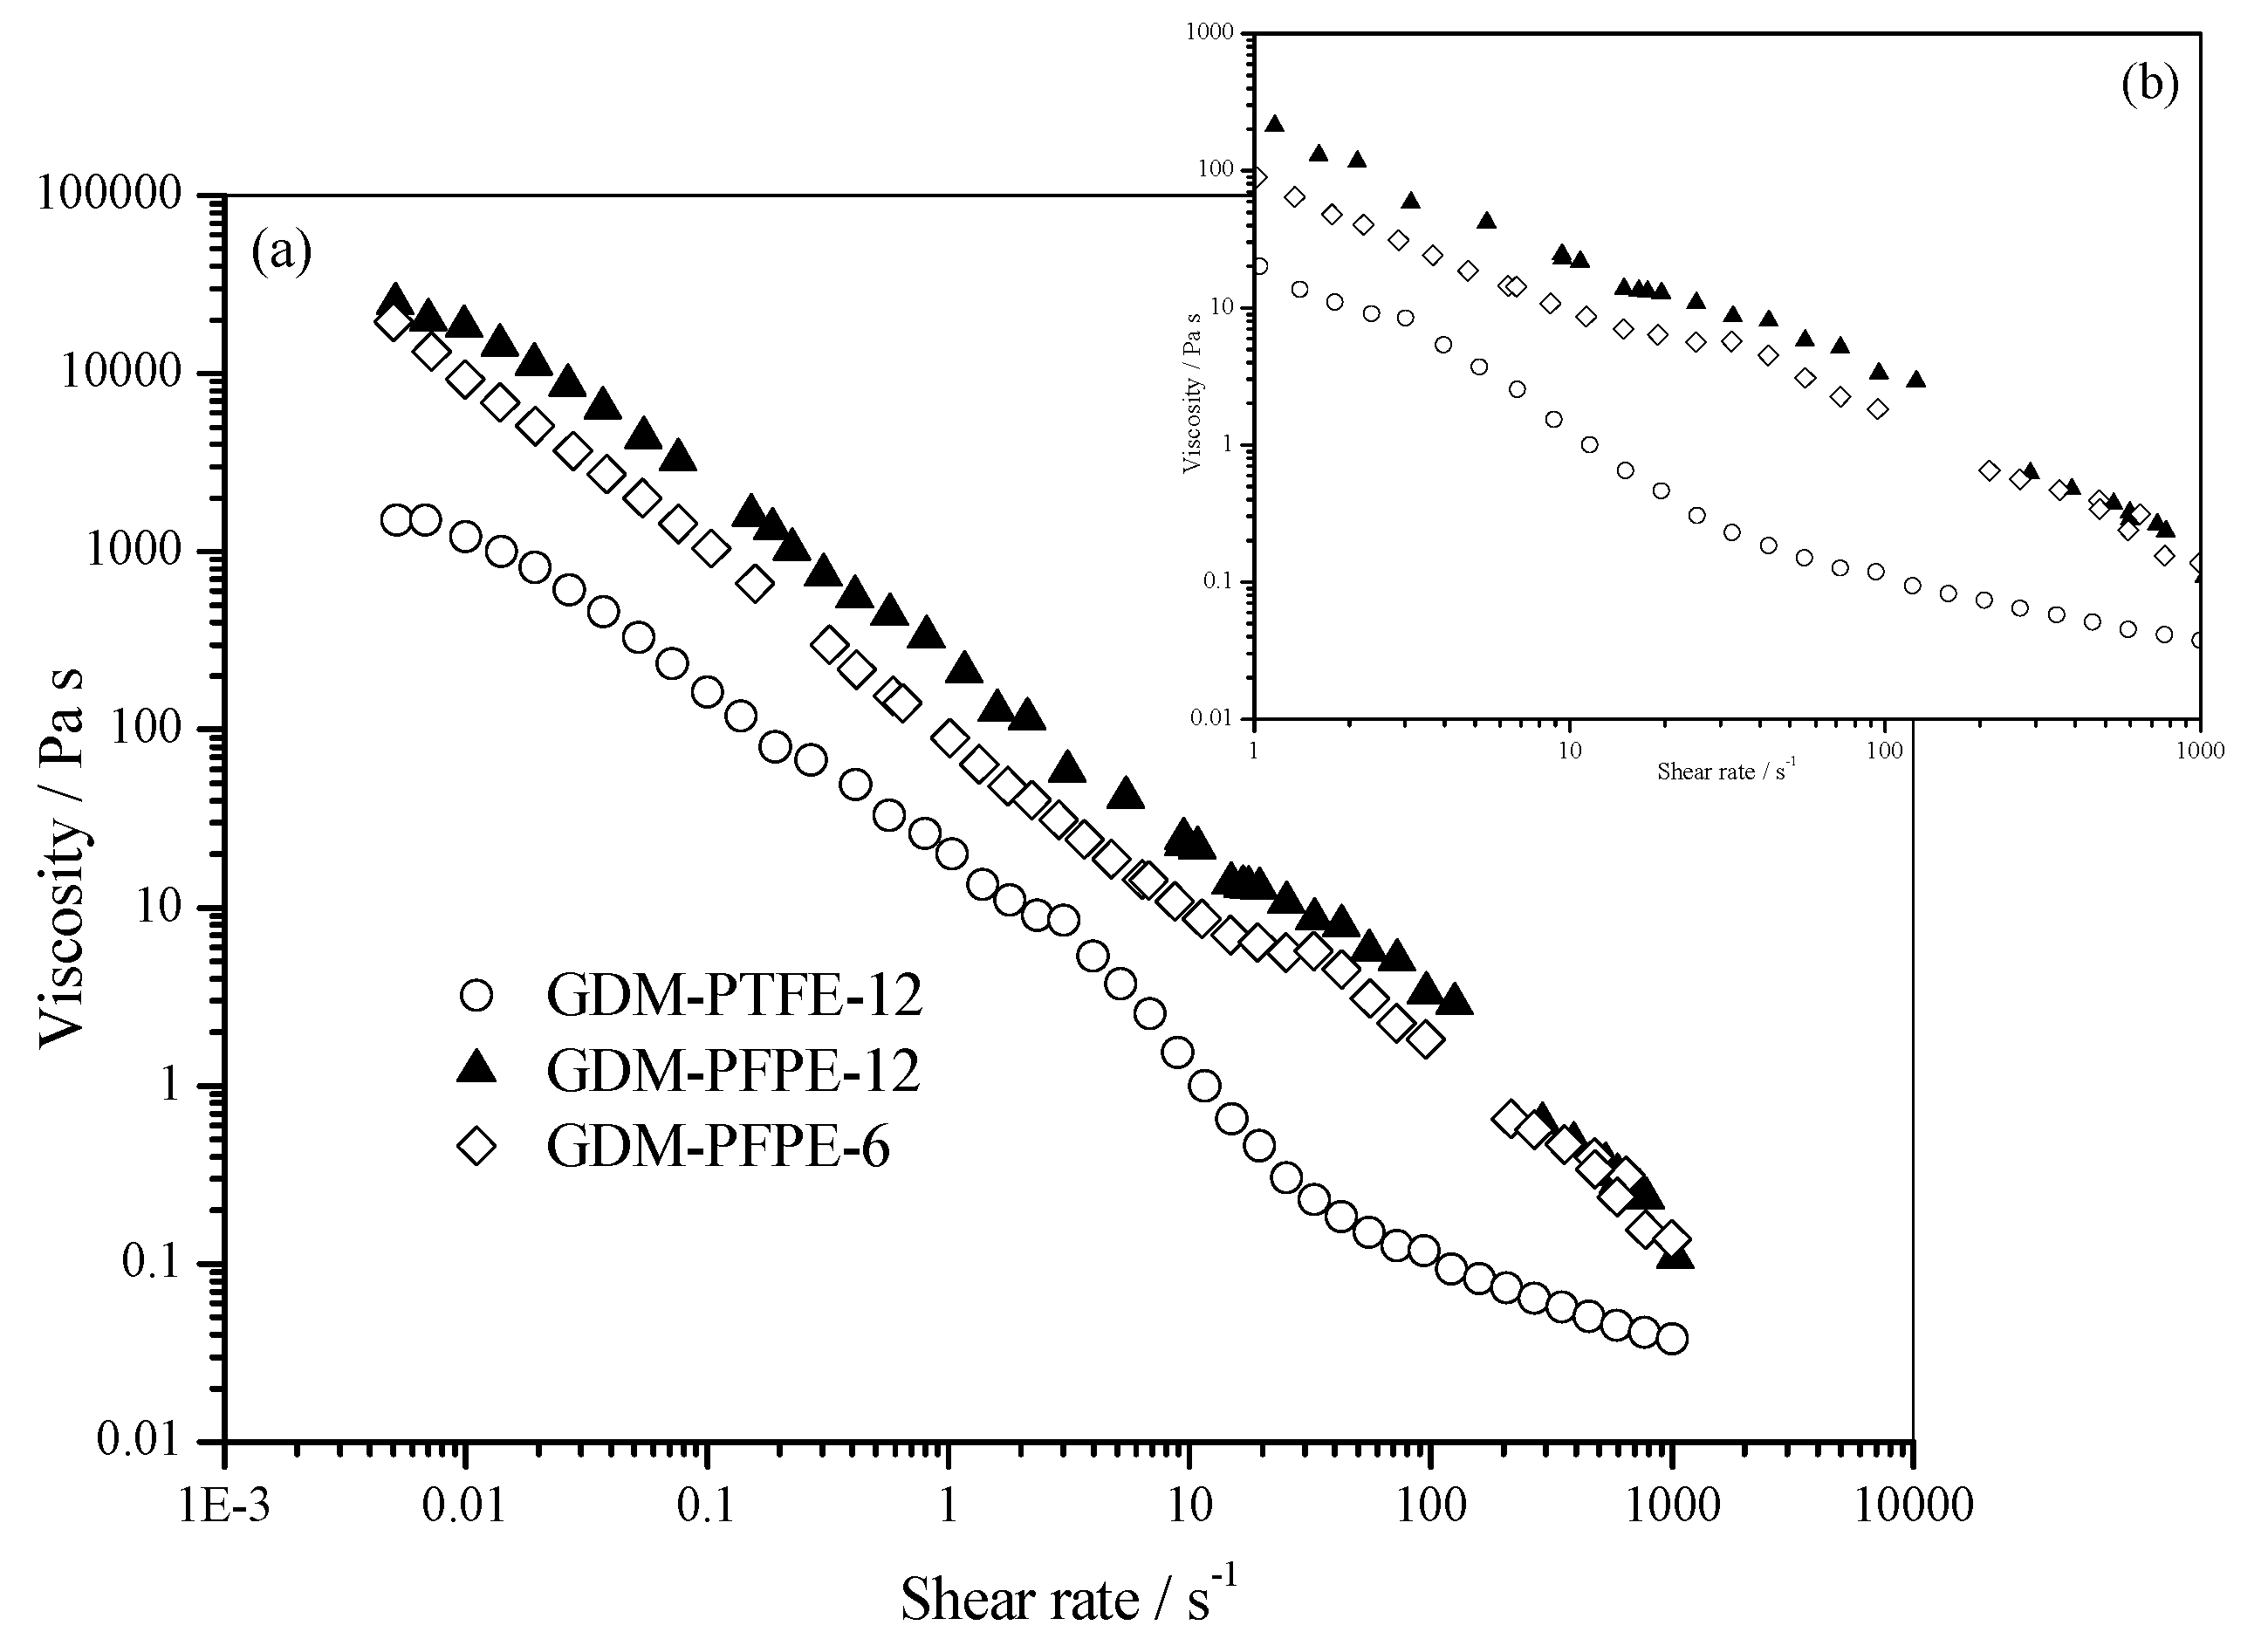
2.1. Preparation

A gas diffusion medium based on the procedure reported in literature [19] and made hydrophobic with PTFE was produced as reference sample, to be compared with samples containing Fluorolink® P56 as hydrophobic agent; a detailed dissertation on physical and electrochemical properties of such a PTFE-based GDM is reported elsewhere [20].
The conventional production route was based on dispersion of a conductive carbon black (CB, Vulcan XC-72R, Cabot Italiana S.p.A., Ravenna, Italy) into a liquid phase (W, distilled water) with a surfactant (T, Triton X-100) by using an UltraTurrax T25 homogenizator for 10 min at 8000 rpm. After that, a 60 wt % PTFE dispersion (Sigma Aldrich Italy, Milan, Italy) was added to the carbon-based slurry, and it was mixed by magnetic stirring for 10 min at 500 rpm. Finally, a 40 µm layer was deposited onto a commercial GDL substrate previously hydrophobized with PTFE (SCCG5 P10, SAATI Group, Milan, Italy) by using a blade coating technique (linear velocity = 0.042 m s−1). A thermal treatment procedure with intermediate dwells (120 °C and 280 °C both for 30 min) allowed the sample and to eliminate the surfactant, while a final step at 350 °C for 30 min was performed in order to consolidate the sample through polymer sintering.
Then, a novel simplified procedure was developed for perfluoropolyurethane-based diffusion media production. In the latter, CB, Fluorolink® P56 and isopropyl alcohol (IPA) were high-speed mixed at 8000 rpm by an Ultra Turrax T25 (IKA Instruments GmbH, Staufen, Germany) for 10 min. The deposition of the ink on the carbon-cloth substrate was performed by blade coating, setting coater speed at 0.154 m s−1, corresponding to a shear rate of about 350 s−1. Samples were treated at 120 °C in order to remove the solvent and to bind the polymer. This faster procedure was devised since Triton X-100 was replaced by IPA as dispersant and, due to the volatility of such alcohol, reducing mixing time was an important issue to be addressed.
Compositions of the different inks are reported in Table 1. Sample GDM-PTFE was prepared following a procedure described in reference [19] while GDM-PFPE-12 and GDM-PFPE-6 were produced following the new procedure described before.
Table 1. Ink composition (all the numbers refers to w/w ratio).
SampleCB/WCB/TCB/IPAPolymer/CB
GDM-PTFE0.135.60.12 PTFE
GDM-PFPE-127.720.12 P56
GDM-PFPE-67.720.06 P56

2.2. Characterization

During MPL deposition on the GDL substrate by blade coating, viscosity plays a crucial role in terms of wet-layer thickness formation. For this reason, each prepared ink was tested in order to evaluate rheological properties by using a lab-scale rheometer (Stresstech 500, Reologica Instruments AB, Lund, Sweden). Dynamic viscosity was measured at room temperature varying the value of the applied shear rate in the range 10−3 s−1–103 s−1.
Electrochemical performance is strongly affected by water management in diffusion layers. As introduced before [10,12], hydrophobic materials are needed in order to properly remove water, especially at high current density conditions. Static contact angle analysis is a very well known technique for surface water management property assessment. For this reason, static contact angle analyses were performed on each sample by using an OCA 20 (DataPhysics Instrument GmbH, Filderstadt, Germany).
Surface characterization was carried out by means of optical microscope analysis (SZ-CTV, Olympus Italia, Milan, Italy). More accurate results, in terms of coated layer thickness, were obtained by using a Scanning Electronic Microscope (SEM, Stereoscan 360 supplied by Cambridge Instruments, Somerville, MA, USA).
Samples were used to set up a single lab-scale fuel cell, whose performance was evaluated in terms of polarization curves. During electrical tests, an electronic load (RBL488 50-150-800, TDI Power, Hackettstown, NJ, USA) was employed for measuring and controlling voltage, current and output power.
In order to specifically focus on the influence of the novel components on device performance, a commercial catalyst coated membrane (CCM, provided by Baltic Fuel Cells GmbH, Schwerin, Germany) was used during the tests. Different platinum loadings were used: 0.3 mg cm−2 and 0.6 mg cm−2 on the anodic and cathodic side, respectively. The active area was 23 cm2, while electrolytic membrane thickness was equal to 50 µm. Cell assembly was completed using graphitic bipolar plates, with a different flow field design for anodic and cathodic compartment: a single feeding channel was used for hydrogen supplying, while a triple serpentine was used for air.
Sample testing was performed at two temperatures: 60 °C and 80 °C. Moreover, inlet gas humidification was tuned in order to stress materials on their water management properties. Relative humidity (RH) of pure anodic hydrogen was held constant at 80%, while two different conditions were tested on the cathodic side, namely 60% and 100% of air RH. Tests were performed using different input flow rates: 0.2 NL/min for hydrogen and 1 NL/min for air, corresponding to stoichiometric ratio values λ = 1.2–2.4 A/C at 1 A cm−2. Measurements were performed in a galvanostatic condition, from open circuit voltage (OCV) to high current density values (1.13 A cm−2) with 0.09 A cm−2 steps. For each value, 420 measurements were made, one per second, in order to obtain values not affected by switching transition. Only the last 300 acquisitions have been averaged.
Electrochemical Impedance Spectroscopy (EIS) is a widely used analysis technique that allows researchers to investigate materials’ electrochemical properties while the device is running. EIS allows for the evaluation of potential losses related to different phenomena and resistances inside the fuel cell system and to assess the corresponding electrochemical parameters by using a suitable equivalent circuit model [21]. A frequency response analyzer (FRA, Solartron 1260, Solartron Analytical, Farnborough, England, UK), connected to the electronic load, was used for that purpose. Signal amplitude was set at 200 mA [22] and frequency range was 0.5 Hz–1 kHz. Five spectra were collected and then averaged for each current density value. The Zview software was used in order to fit experimental results by using an equivalent electrical circuit, which consists of resistance Rs modeling ohmic losses, in series with two capacitance/resistance parallel circuits, namely Rp/Cdl and Rd/Cd. The first parallel is related to activation polarization (i.e., charge transfer resistance) while the second models all losses that can be ascribed to concentration polarization and flooding issues (i.e., mass transfer resistance) [23,24,25]. Actually, the use of constant phase elements was preferred to pure capacitances in order to take into account the porous nature of double layers, thus their capacitive losses [26,27].

3. Results and Discussion

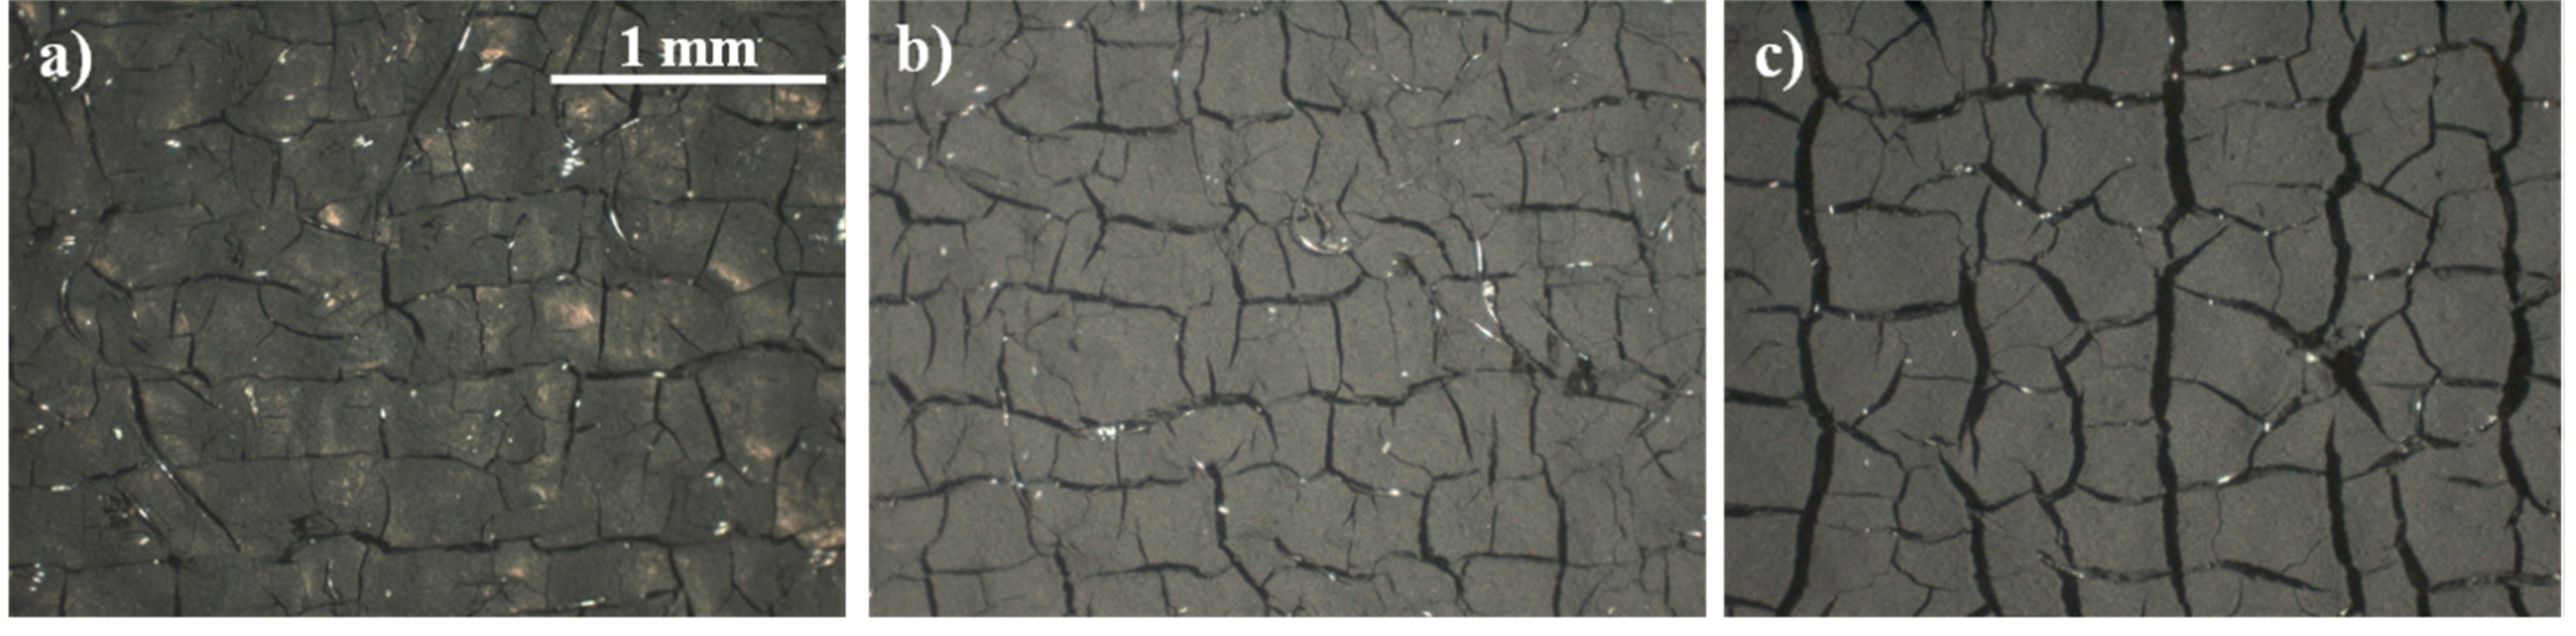
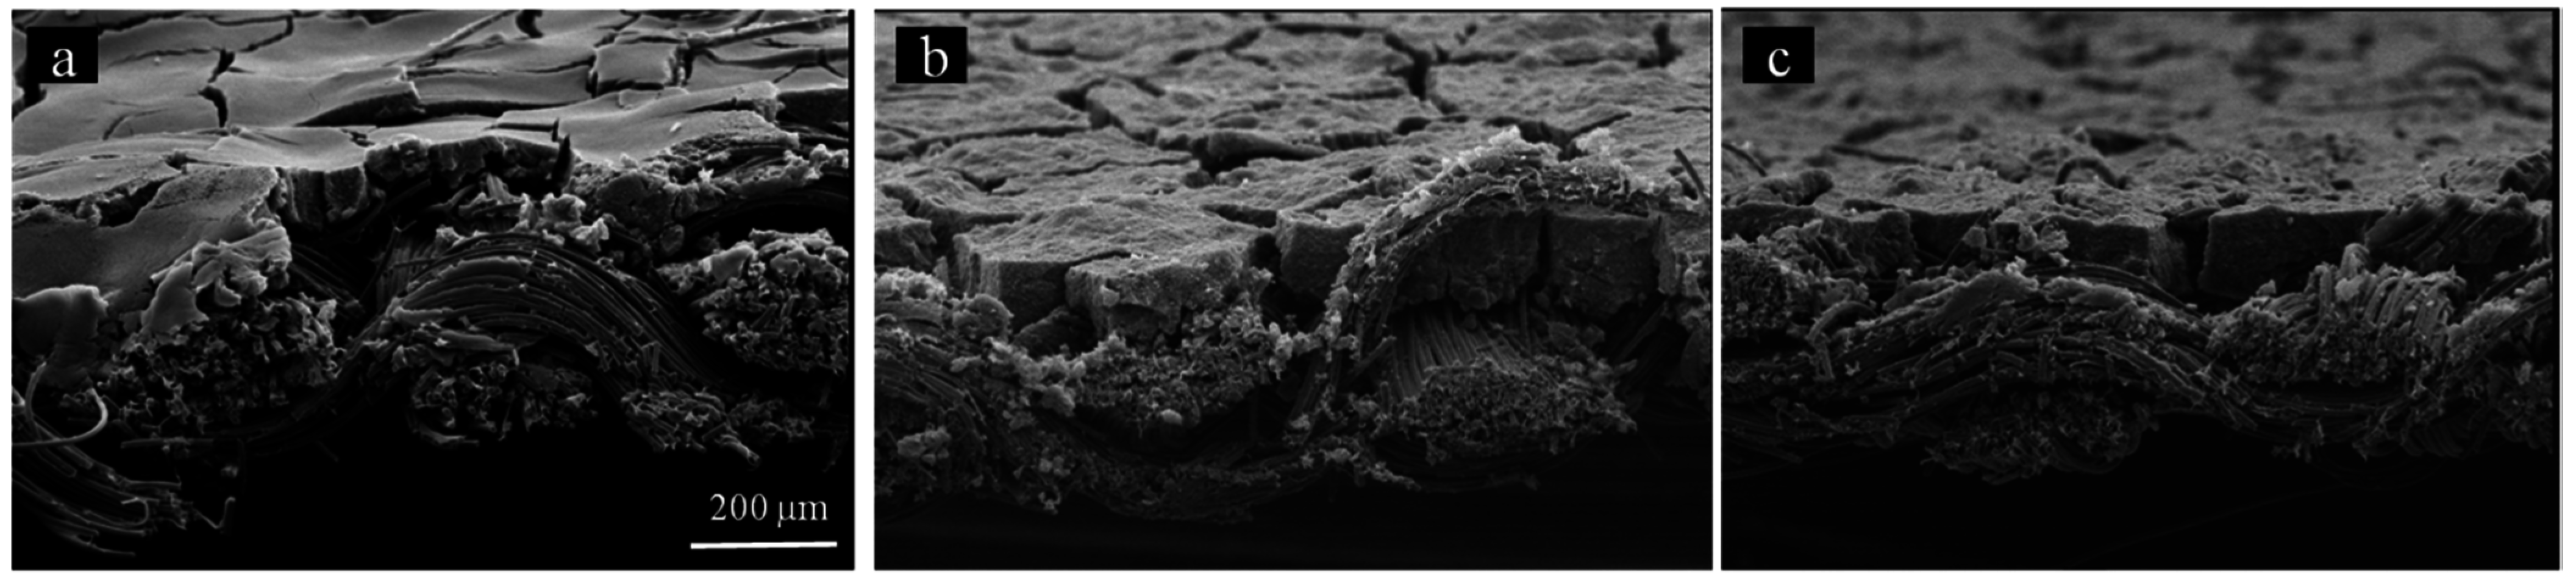
3.1. Physical Characterization

Blade coating technique requires a good knowledge of the inks’ rheological properties in order to control deposited layer thickness. In this view, a shear-thinning slurry is needed in order to obtain a deposition with the desired thickness [28]. The results of the inks’ rheological characterization are shown in Figure 1.
Figure 1. (a) Results of rheological analysis of the prepared inks; (b) Focus of the shear rate range 1–1000 s−1.
Energies 08 07070 g001
The viscosity dependence on shear rate points out a pseudo-plastic shear-thinning behaviour for all samples, as desired for blade coating deposition. The flow curves of inks based on IPA (i.e., the ones containing PFPE) show a remarkable discontinuity in the 100–200 s−1 range, probably due to a partial solvent evaporation during analysis. Moreover, differences can be pointed out as far as viscosity dependence on shear rate is concerned. Considering the focus on the 1–1000 s−1 range, where blade coating shear rate values are commonly located, Fluorolink® P56-based slurries show a more linear trend in viscosity values, if compared to a PTFE-based slurry. However, it is difficult to ascribe this difference to the switch in polymer used or to the change in dispersion components. In any case, an influence of Fluorolink® P56 on flow curve is noticeable: an increase in Fluorolink® P56 content determines an increase in viscosity, even though not dramatic. It should be considered that, as inks containing IPA and Fluorolink® P56 have higher viscosity values at any fixed shear rate value, it is necessary to increase the blade coater speed in order to have an optimal viscosity value for micro-porous layer deposition.
Static contact angle results are reported in Table 2. For each sample, values have been recorded before cell testing (BCT) and after cell testing (ACT); the latter were evaluated by individual measurements for anode (ACT-A) and cathode (ACT-C) components.
Table 2. Static contact angles detected before and after cell testing
SampleBCT [°]ACT-A [°]ACT-C [°]
GDM-PTFE145 ± 4146 ± 2146 ± 2
GDM-PFPE-12151 ± 6149 ± 5151 ± 2
GDM-PFPE-6146 ± 5154 ± 3145 ± 2
The introduction of the non-conventional hydrophobic agent (i.e., Fluorolink P56®) apparently does not affect hydrophobicity, which is similar to the one recorded for a PTFE-based sample. Such small differences, by themselves, are not significant enough to individuate a real variation in hydrophobicity by changing the hydrophobic agent. Moreover, no significant variation in values is noticed by varying Fluorolink® P56 content from 12% (GDM-PFPE-12) to 6% (GDM-PFPE-6). From contact angle results analysis before and after cell testing, no clear trend can be identified; it can be stated, anyway, that cell testing does not affect water-repellent properties for all tested samples.
MPL surfaces were observed by means of optical microscope analysis, whose results are reported in Figure 2.
Figure 2. Optical microscope images of MPL surfaces: (a) GDM-PTFE; (b) GDM-PFPE-12; (c) GDM-PFPE-6 (40×).
Energies 08 07070 g002
GDM-PTFE sample shows a slightly smoother and more homogenous surface, if compared to Fluorolink® P56-based layers. This can probably be ascribed to the relevant differences in both slurry composition and heat treatment performed. As a matter of fact, GDM-PFPE-12 and GDM-PFPE-6 only contain isopropyl alcohol as liquid phase, whose fast removal at 120 °C can have induced large cracks on the surface due to a fast layer shrinkage [29]. On the contrary, in the case of a PTFE-based sample, the wet layer is composed of a mixture of water and surfactant (Triton X-100, Sigma Aldrich Italy, Milan, Italy) and, moreover, a gradual increase in temperature is used in order to consolidate the layer, giving the MPL enough time to shrink. In principle, crack formation has to be avoided because it could result in coating detachment during the cell running. However, if crack formation is limited to the layer surface, e.g., less deep cracks are formed, the coating detachment can be negligible. As a matter of fact, a beneficial effect of the presence of slightly deep cracks has been reported: a limited number of cracks may supply alternative paths for species diffusion toward the catalytic region [30]. This might enhance mass transfer performance for the PFPE-coated GDLs, since permeability, related to total porosity and pore diameters, should result enlarged [31,32]. Indeed, it was already demonstrated that PFPE-based MPLs have slightly higher porosity than conventional PTFE-based ones [33].
MPL thickness is a crucial parameter to be controlled in order to improve overall device performance and several studies pointed out an optimal value in the range 50–90 µm [30,34,35,36,37,38]. For this reason, prepared samples were evaluated in terms of MPL thickness by means of SEM analysis, as reported in Figure 3.
Figure 3. SEM cross-section images of GDL-MPL interfaces: (a) GDM-PTFE; (b) GDM-PFPE-12; (c) GDM-PFPE-6 (100×).
Energies 08 07070 g003
Since a correct measurement of the actual thickness of coatings results difficult, due to the compressible nature of substrates, only a mean range of thickness can be given: results show similarities between PTFE and Fluorolink® P56 based samples, all in the range of 60–80 µm. Moreover, SEM cross-section analysis also confirmed the presence of cracks on MPL surfaces.

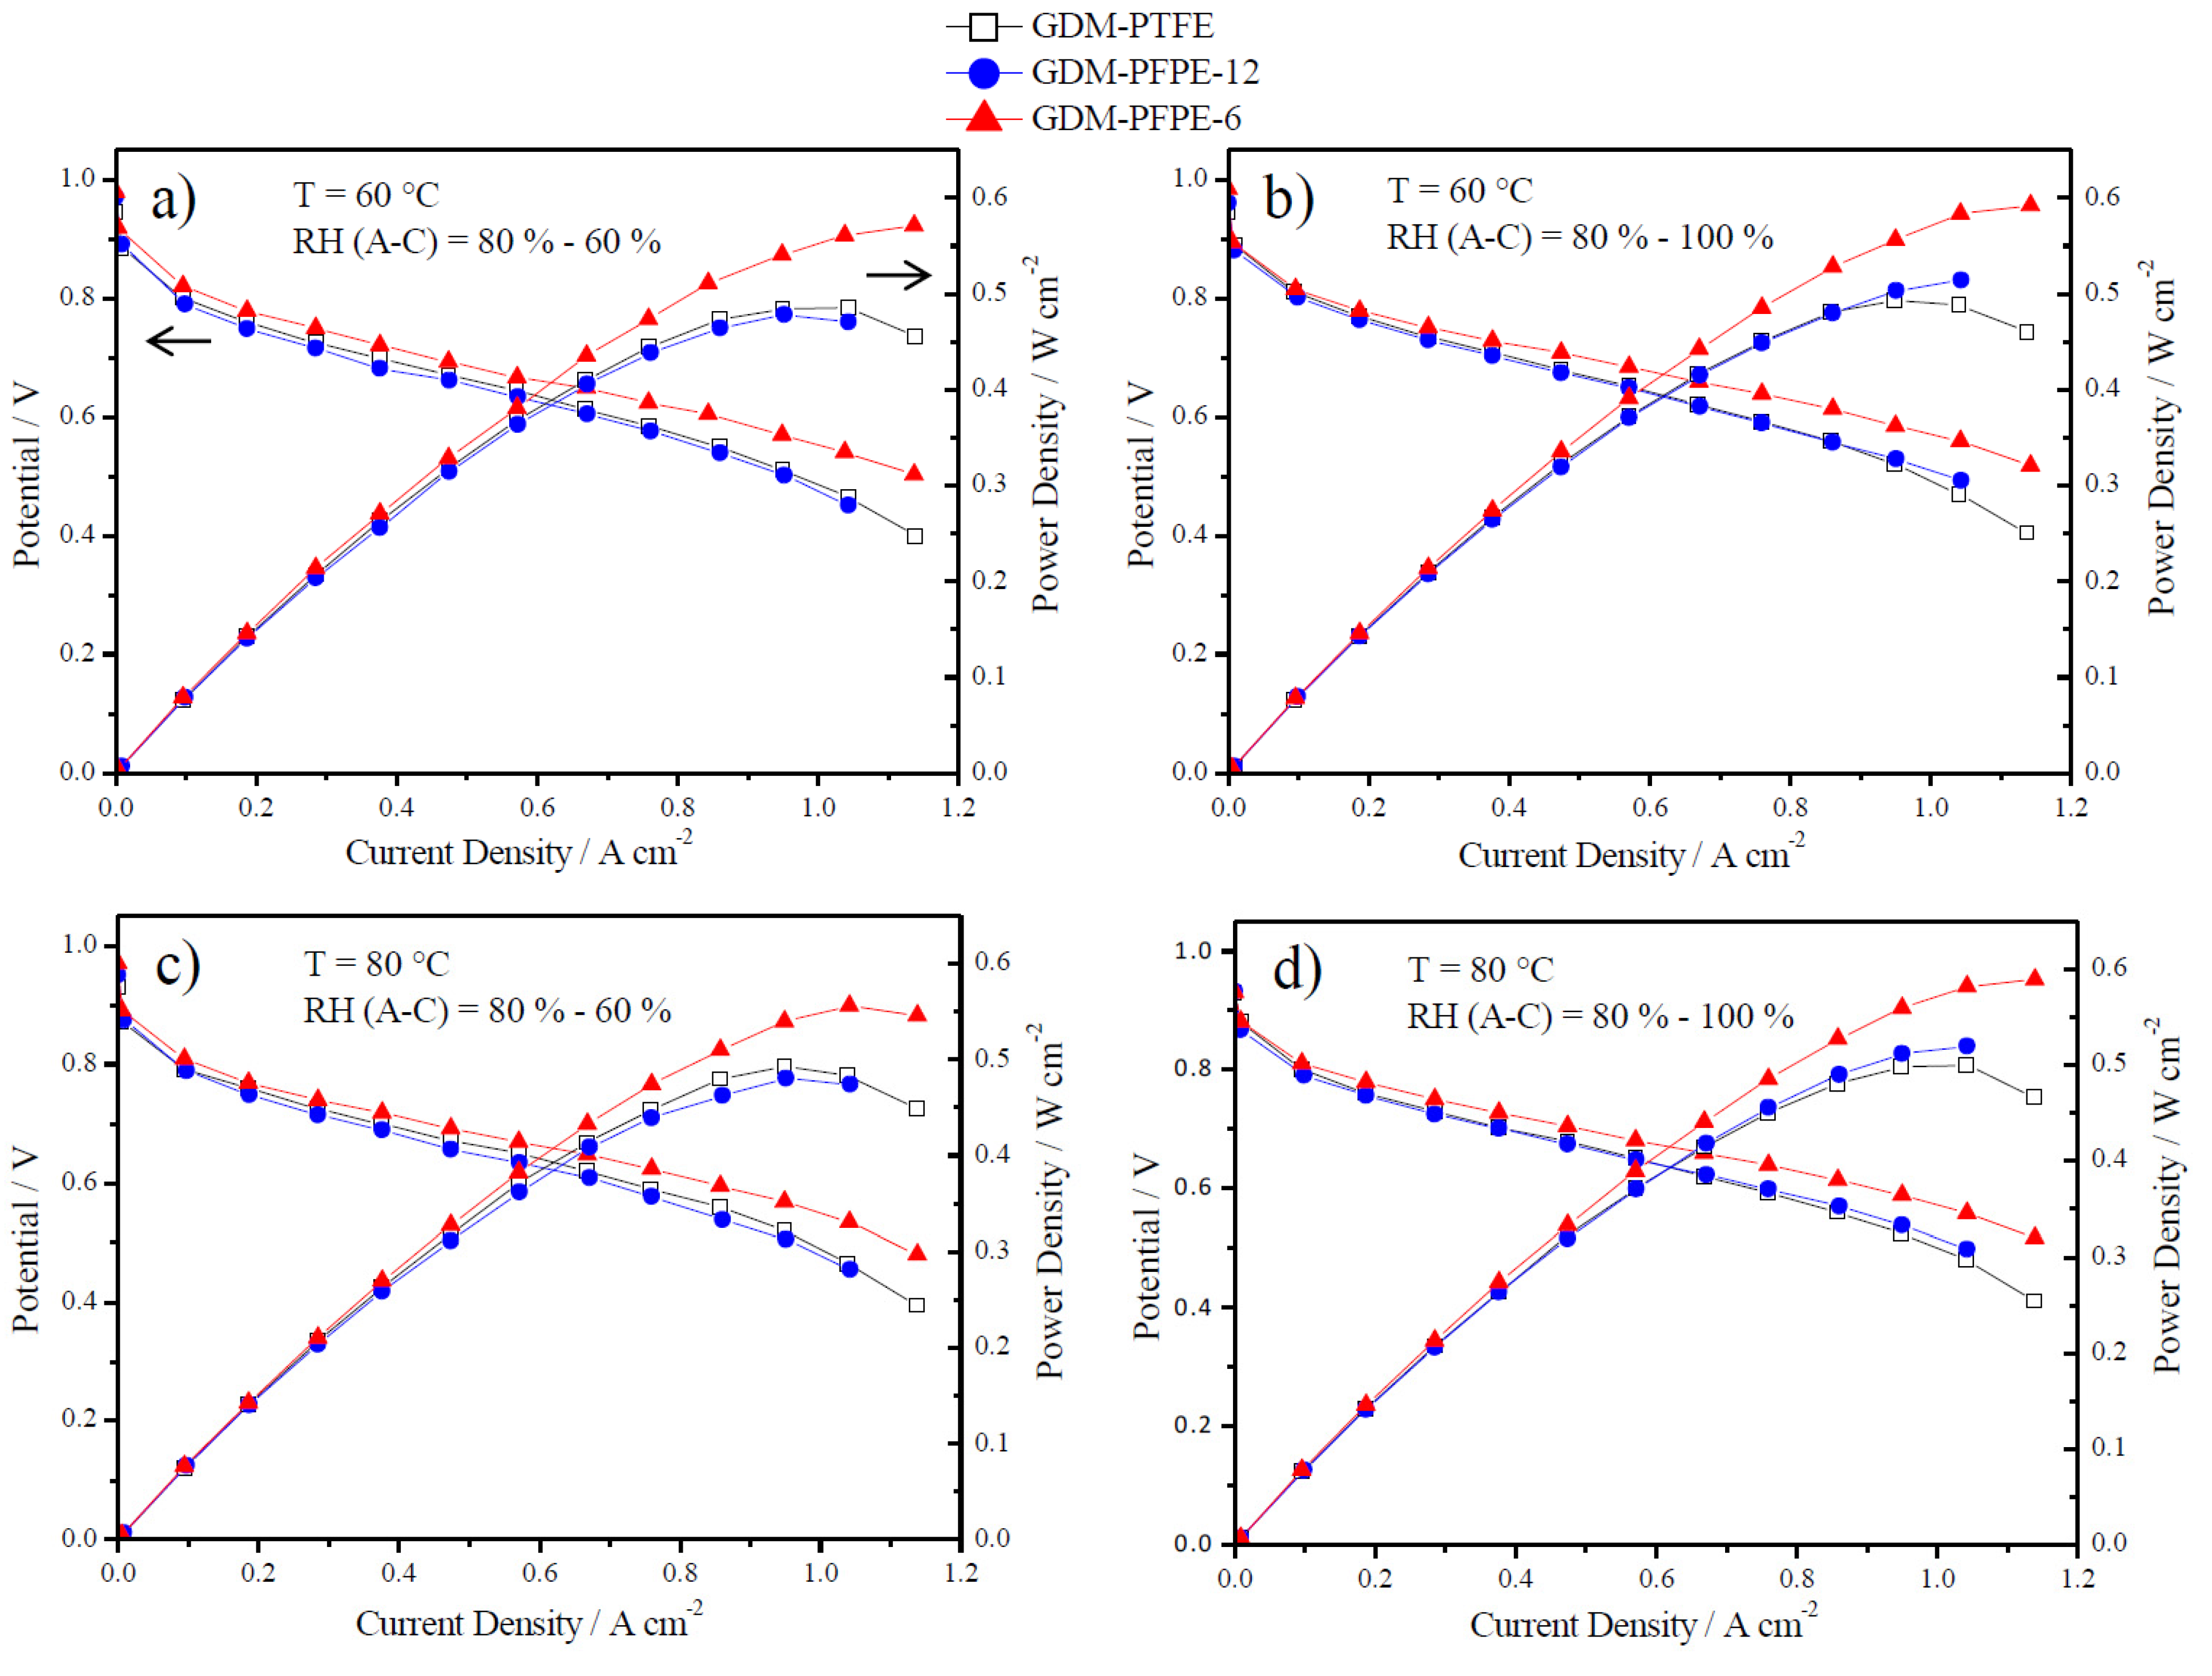
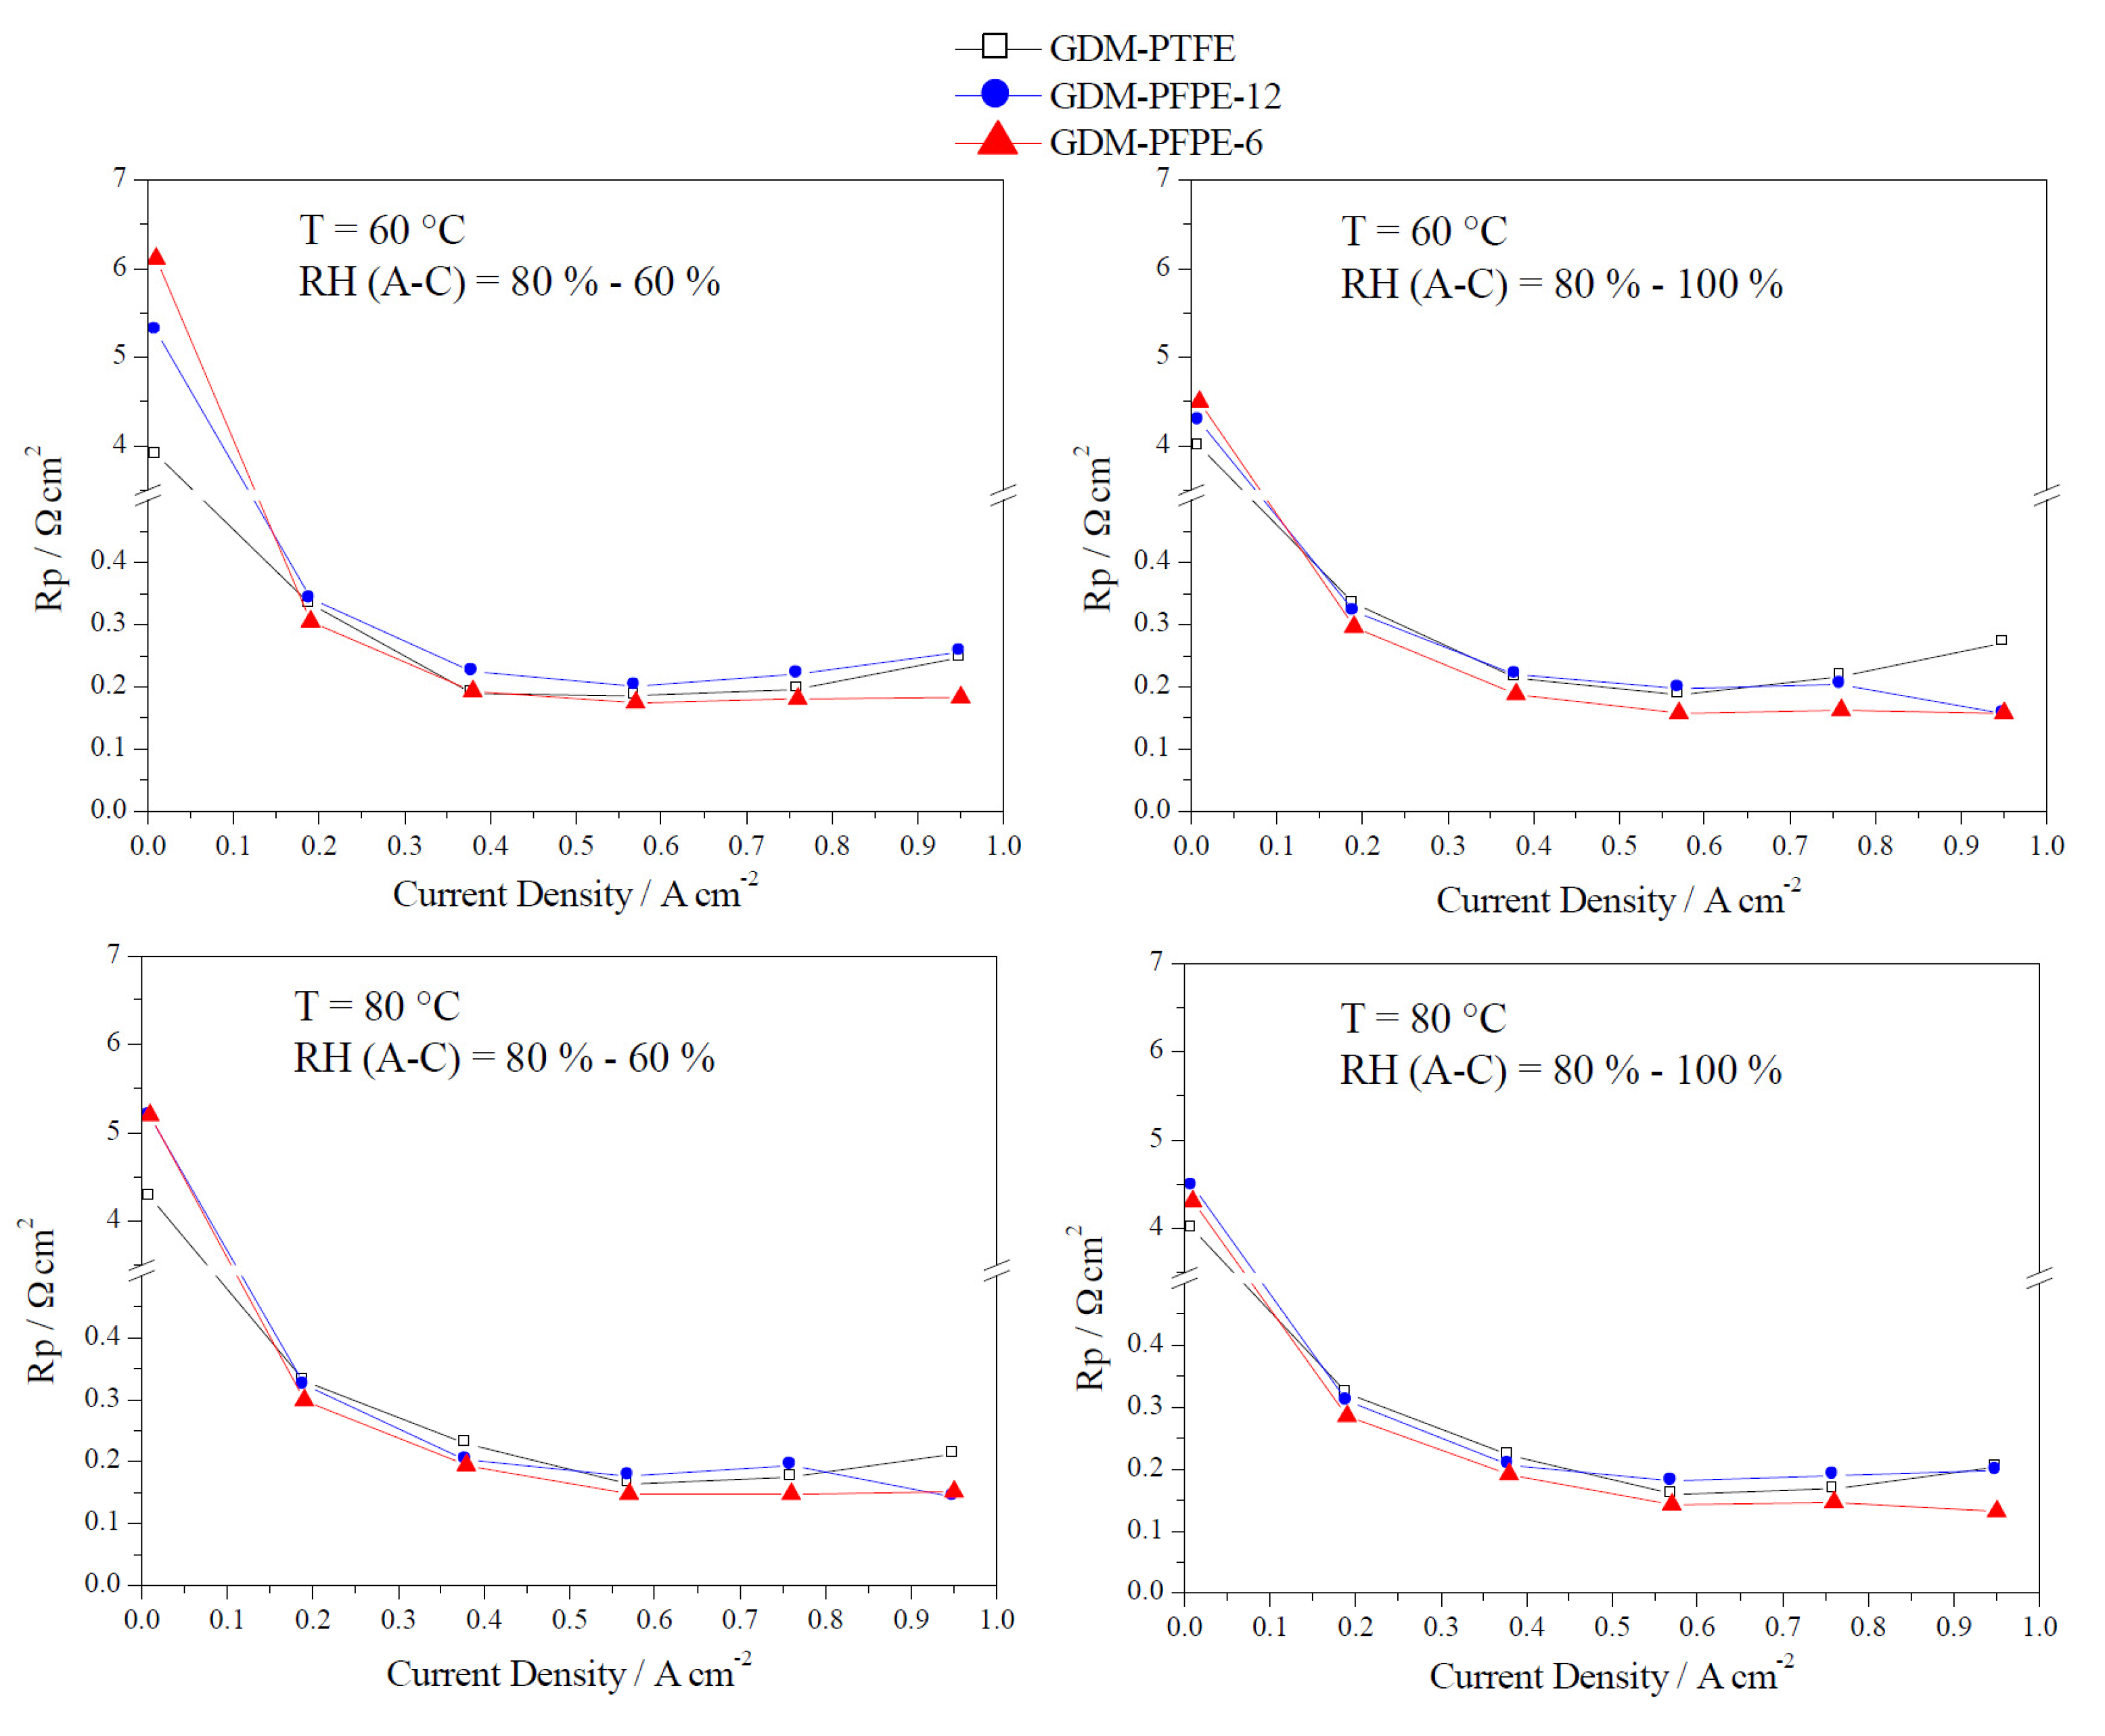
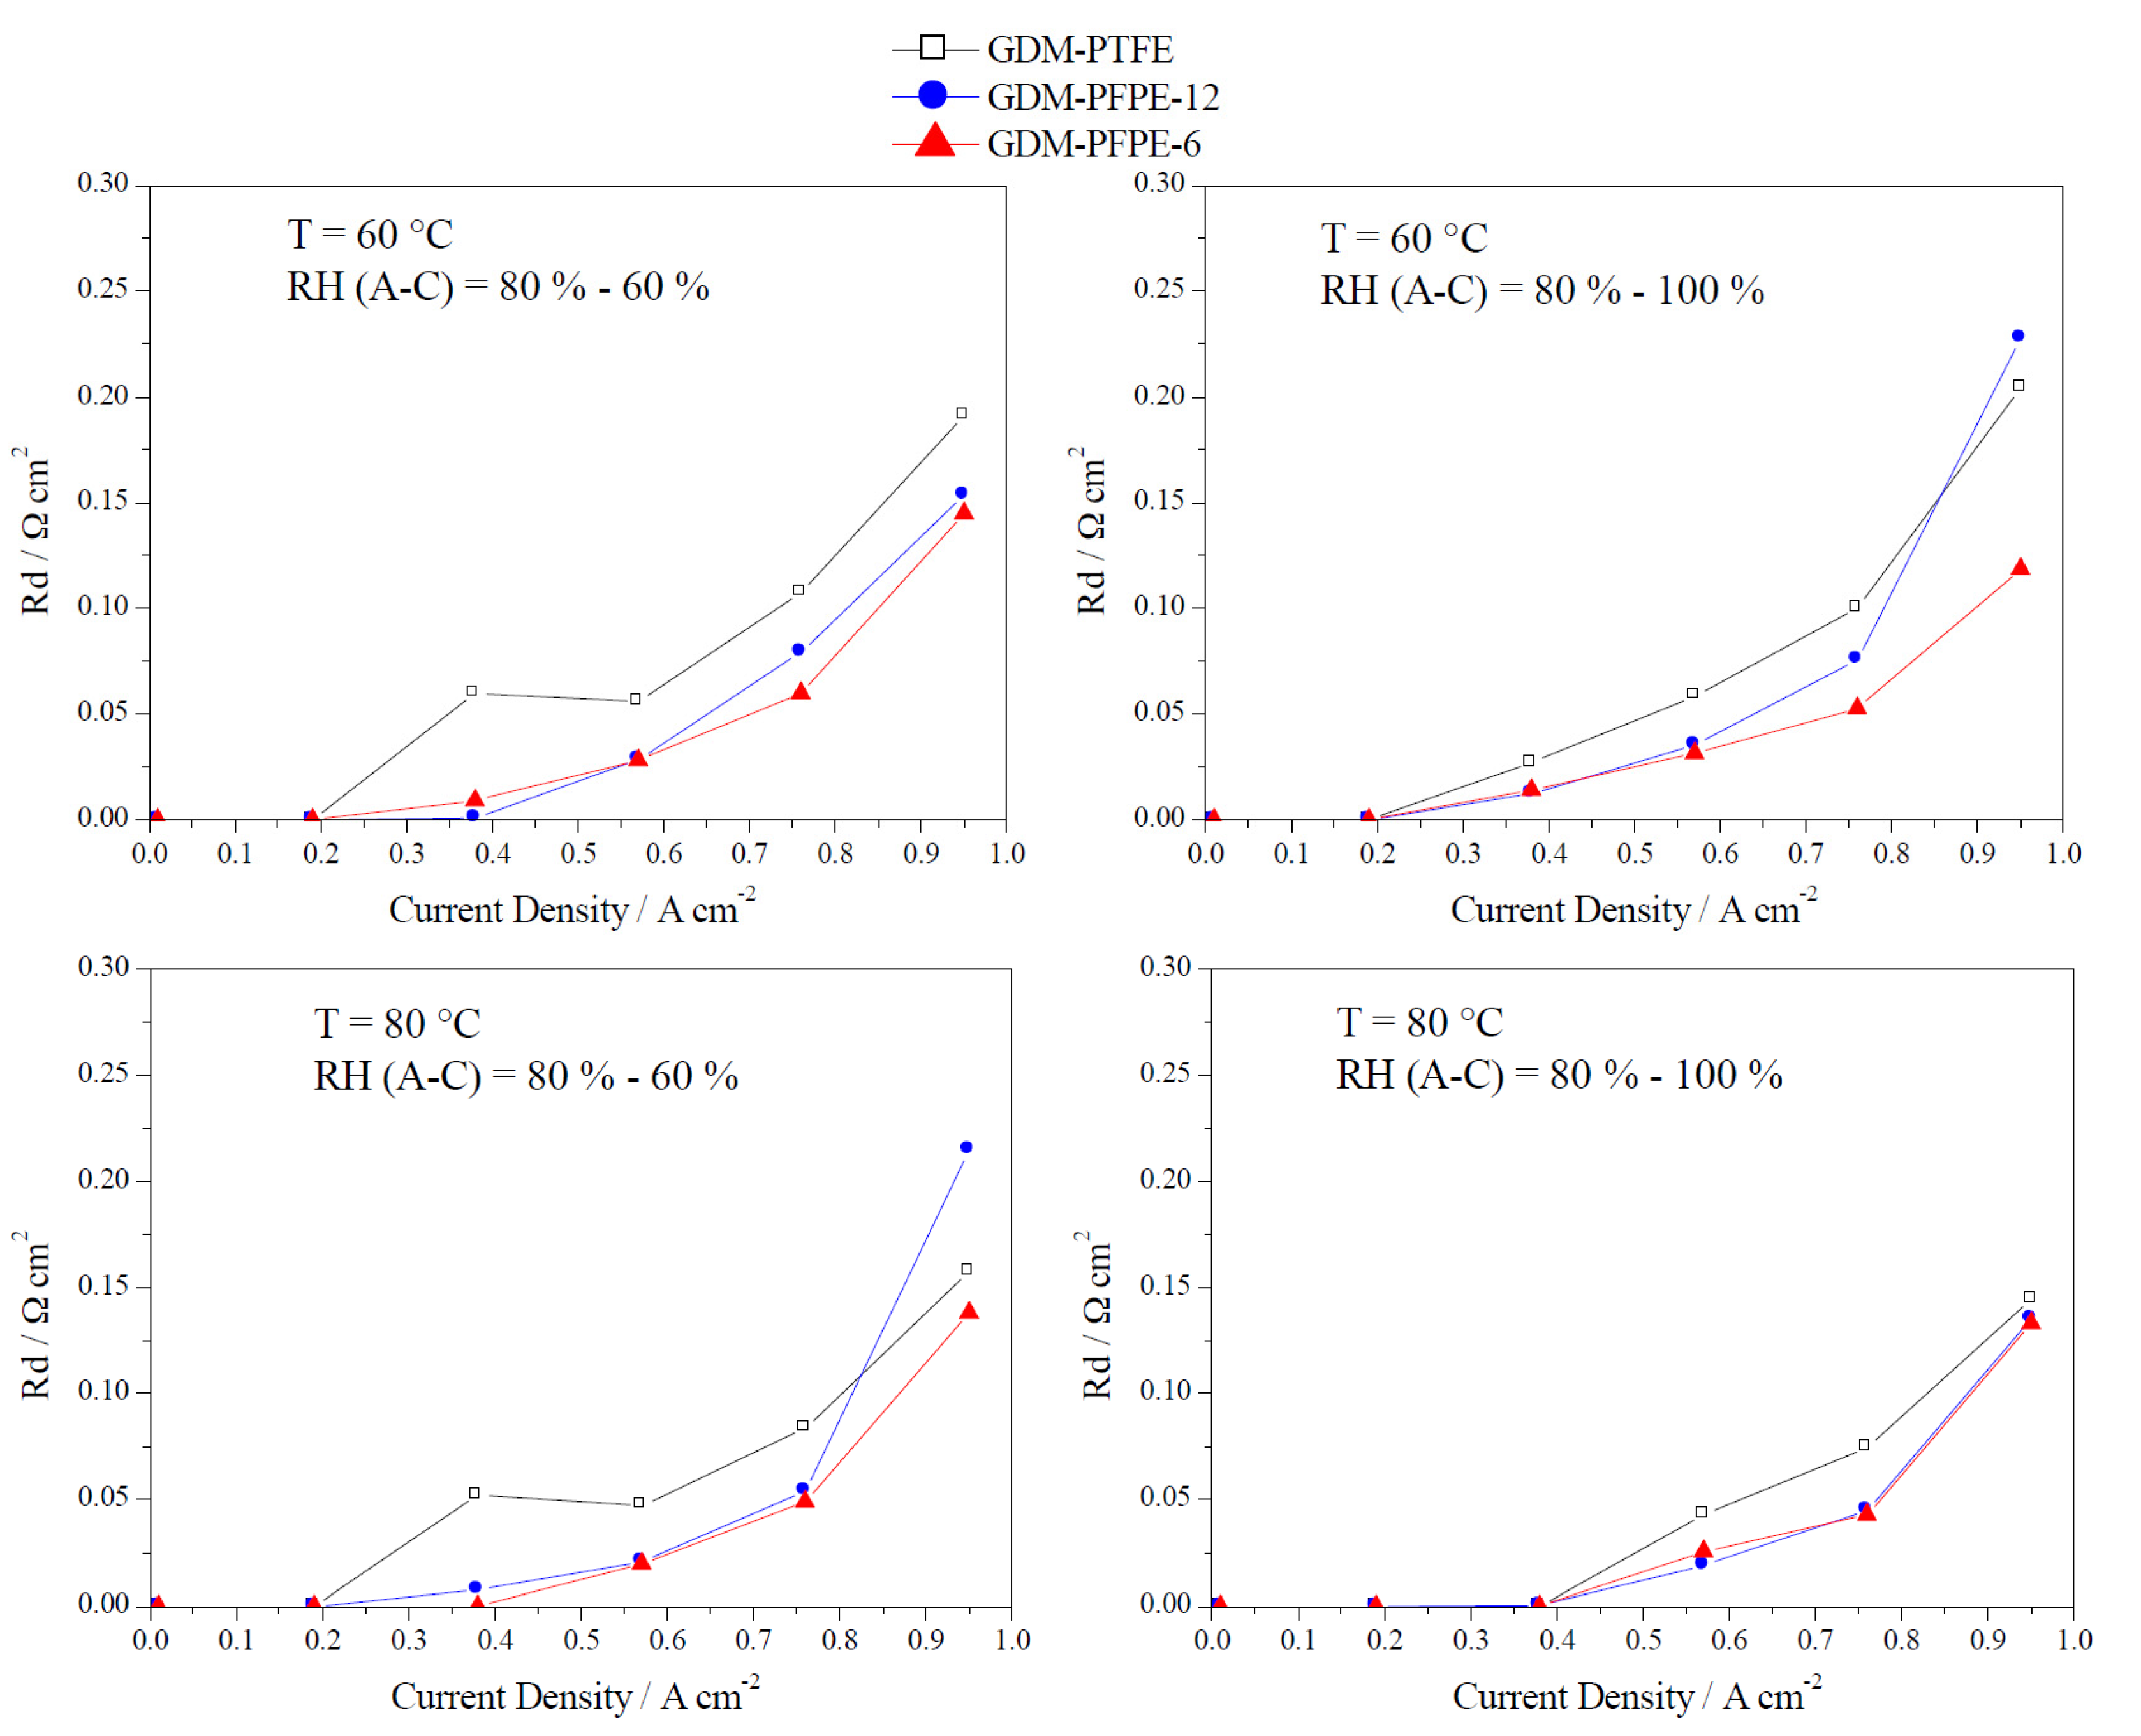
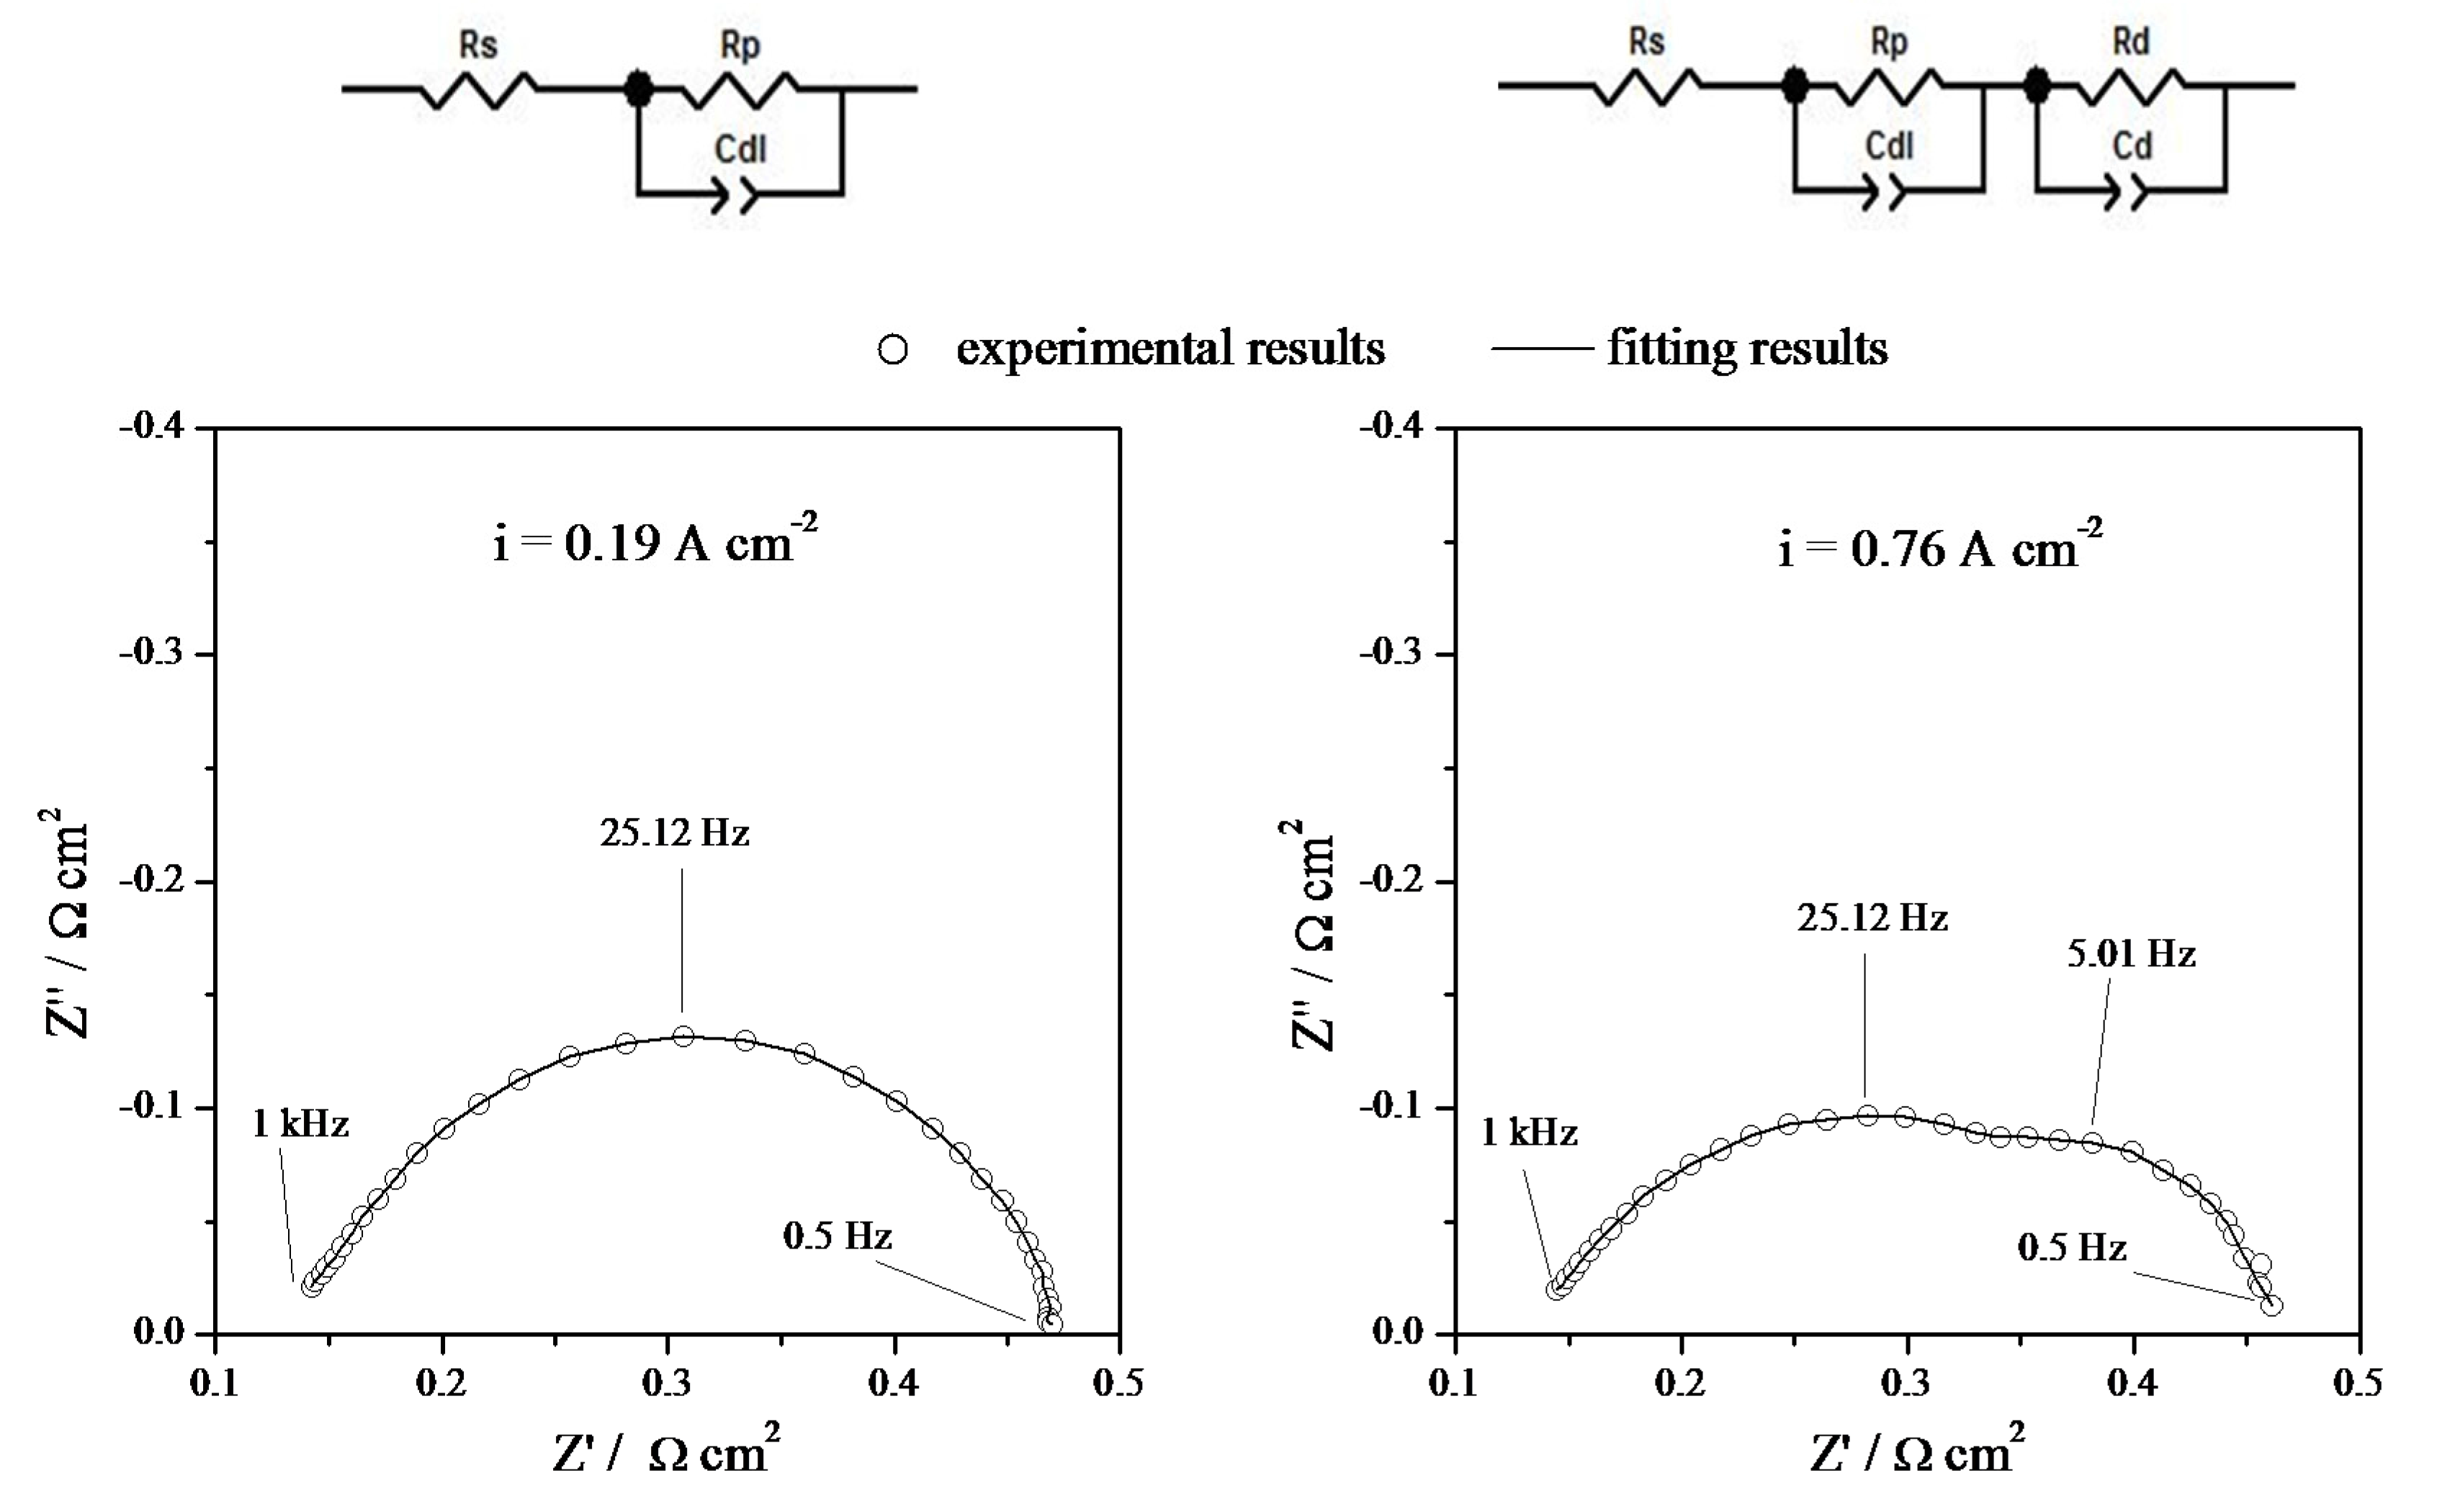
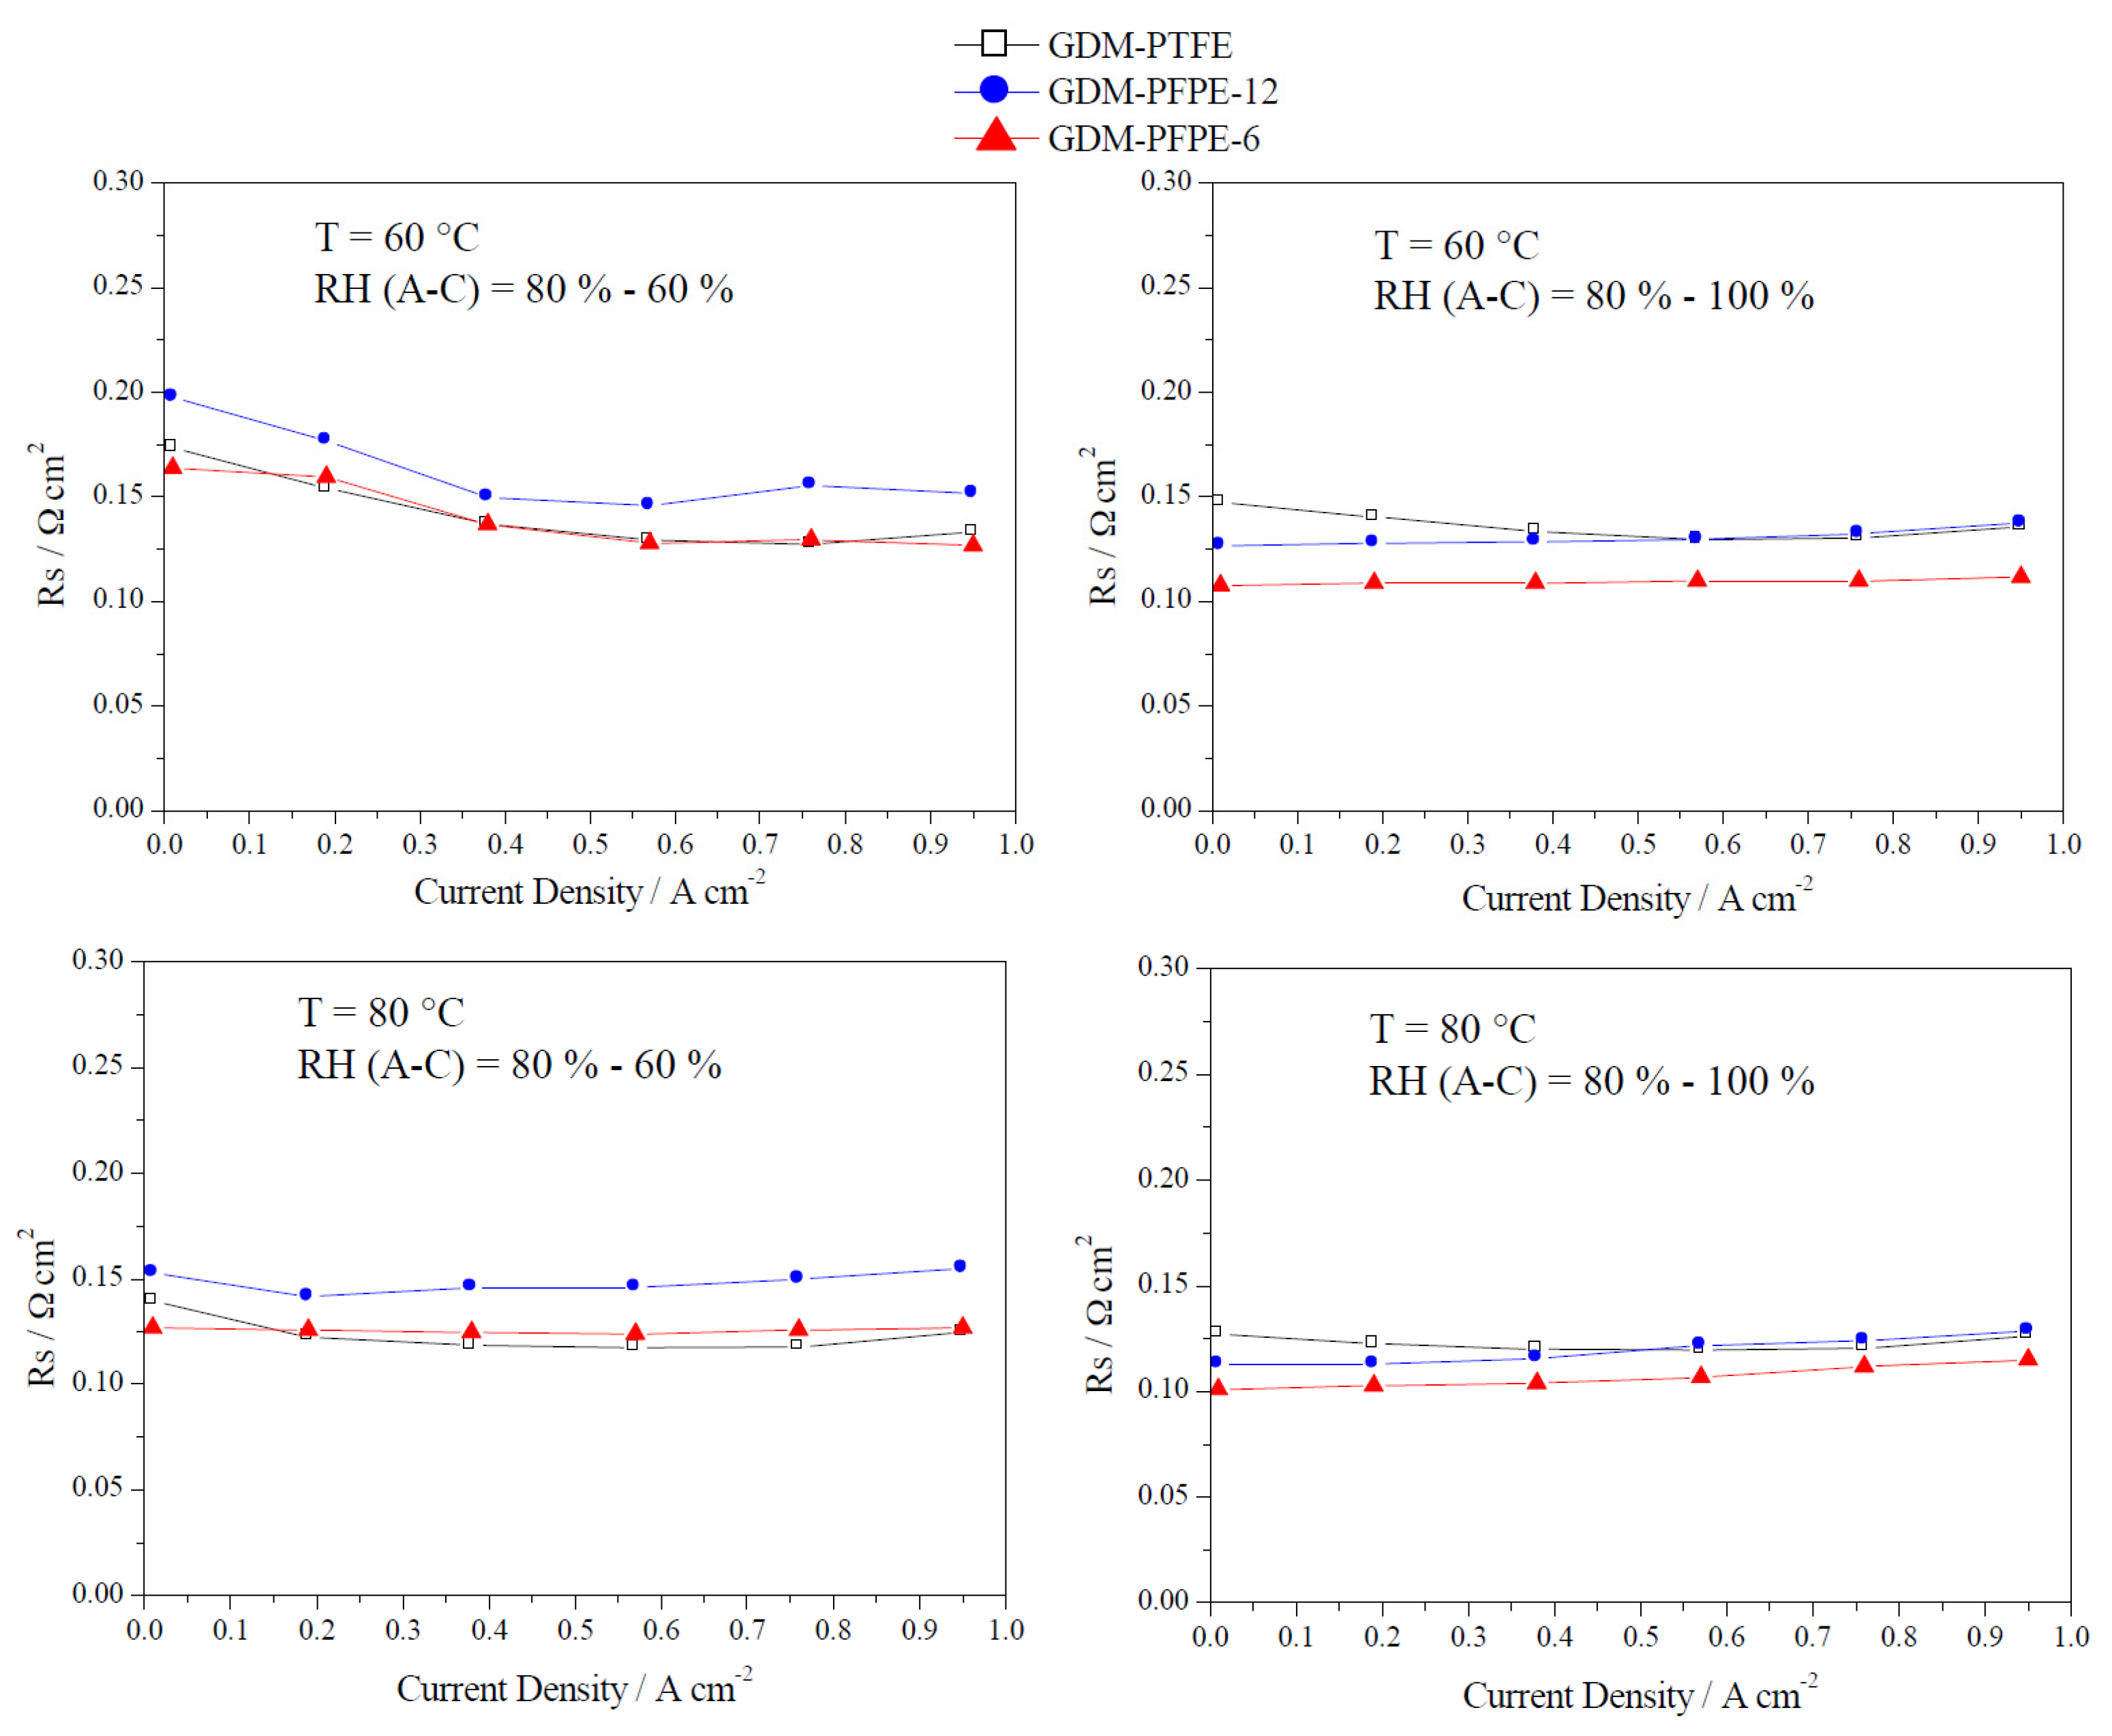
3.2. Electrochemical Characterization

EIS and polarization curves results were evaluated in order to compare samples performance. Polarization curves are reported first: in Figure 4, a comparison between performance of different samples at different operating conditions is shown.
Figure 4. Polarization curves obtained at: (a) T = 60 °C and RH (A-C) = 80%–60%; (b) T = 60 °C and RH (A-C) = 80%–100%; (c) T = 80 °C and RH (A-C) = 80%–60%; (d) T = 80 °C and RH (A-C) = 80%–100%.
Energies 08 07070 g004
From polarization curve analysis, many similarities can be found between GDM-PFPE-12 and GDM-PTFE behaviour. Both samples show similar values in terms of output power density (maximum approximately close to 0.5 W cm−2), while better results are obtained with GDM-PFPE-6, with a maximum in the nearby of 0.6 W cm−2, at both 60 °C and 80 °C at high cathodic humidity conditions. Nevertheless, slight differences can be observed by the comparison of GDM-PTFE and GDM-PFPE-12. Such differences are clearly highlighted in the power density curve: both at 60 °C and 80 °C, a PTFE-based sample shows better performance at low relative humidity, while a switch in performance can be seen at a high relative humidity condition. Even though differences are small, a possible explanation can be found analyzing MPL surface morphology: as reported in literature [39], the presence of cracks on the surface (see Figure 2) can lead to an even slight improvement in water management, corroborating an improvement in performance when saturation condition is experienced at cathodic side. From a wider point of view, all samples do not make evident remarkable problems in terms of water management as, for all samples, maximum values in terms of power density are located in the high current density region, where water production reaches its maximum.
As introduced before, EIS was performed in order to have a more precise characterization of prepared materials. As a brief example, in Figure 5, typical EIS experimental results are plotted together with fit results, obtained by simulating the two different equivalent circuits separately.
Figure 5. Example of both EIS experimental and fitting results at low (0.19 A cm−2) and high current density (0.76 A cm−2). Equivalent circuits used for fitting procedure are also reported. Sample GDM-PTFE; operating condition: T = 60 °C and RH (A-C) = 80%–100%.
Energies 08 07070 g005
The introduction of the second resistance/CPE parallel allows researchers to fit the low-frequency semicircle, whose presence rises in importance at medium-high current density values, due to the intensification of mass transfer limitations. EIS was performed for each sample prepared, in order to investigate different contributions to voltage losses and to determine electrochemical parameters. In the following, only fitting results will be reported Figure 6, Figure 7 and Figure 8) and the dependence of the previously introduced resistive parameters (i.e., Rs, Rp and Rd) on current density will be pointed out.
Values obtained for Rs parameter, i.e., overall ohmic resistance, are reported in Figure 6.
A very weak dependence on current density seems to occur. After a stabilization in the lower current density region, Rs values always lies in the 0.10–0.15 Ω cm2 range. Despite of the overall values’ similarity, Rs results for GDM-PFPE-12 are always higher than those obtained for sample GDM-PFPE-6, probably because of the increased polymer content and MPL thickness.
In Figure 7, fitting results for Rp parameter are reported.
Values rapidly decrease passing from OCV to a generating current mode and then (over 0.2–0.3 A cm−2) they do not vary significantly. Moreover, Rp parameter is more strictly related to catalytic activity and, for this reason, is not of primary importance as a source of information for MPL characterization.
Rd parameters are reported in Figure 8.
Figure 6. Ohmic resistance trend as a function of current density: fitting results comparisons at different operating conditions.
Energies 08 07070 g006
Figure 7. Polarization resistance trend as a function of current density: fitting results comparisons at different operating conditions.
Energies 08 07070 g007
Figure 8. Diffusion resistance trend as a function of current density: fitting results comparisons at different operating conditions.
Energies 08 07070 g008
All samples show a typical behaviour, characterized by an increase in terms of concentration losses (i.e., diffusive limitations) upon increasing current density. This behaviour is closely linked to the water management properties of samples [21]. From a direct comparison, GDM-PTFE has always higher Rd values—except for the highest current density point analyzed—than Fluorolink® P56-based GDMs, pointing out a slightly worse water management in the case of PTFE-based MPLs. In addition to that, an unexpected trend is found from the comparison between the two Fluorolink® P56-based MPLs: a lower amount of polymer (6% by weight, sample GDM-PFPE-6) leads to better performance (i.e., lower values for Rd parameter) with respect to sample GDM-PFPE-12, which contains a larger amount of polymer (12% by weight). This fact, together with the absence of changes in terms of hydrophobicity (i.e., contact angle values), corroborates the previously introduced hypothesis of a performance enhancement strictly linked to the presence of cracks on MPL surface. Therefore, hydrophobicity is not the only key parameter to be optimized for water management. Indeed, mass transfer is deeply influenced by porosity and surface cracks [33]. Thus, it is not surprising that the sample showing the best water management was GDM-PFPE-6, which also showed the largest surface cracks.

4. Conclusions

In this work, the possibility to use a non-conventional hydrophobic agent for MPL manufacturing was investigated. In particular, a fluorinated polymer (Fluorolink® P56) was chosen in order to achieve process simplification and performance improvement targets.
Rheological flow curves of all the prepared inks demonstrated that the change in formulation did not affect the shear-thinning behaviour, making new inks suitable for blade coating deposition. However, the addition of the new polymer increased the viscosity of the inks, leading to a consequent increase of the blade speed during coating deposition in order to guarantee the same shear rate as conventional PTFE-based MPL deposition.
The use of the new polymer was allowed to work at a lower temperature during the heat treatment step, and it did not affect hydrophobic properties, both before and after cell testing.
EIS analysis and polarization curves showed an improvement in performance using Fluorolink® P56 and a lower polymer concentration with respect to PTFE. This improvement has to probably be ascribed to a decrease in terms of concentration losses, thus to an improvement in terms of water management properties. Moreover, it was found that water management could be related more to MPLs’ surface cracks than to hydrophobicity; indeed, larger cracks should improve permeability and diffusive properties. This was achieved with PFPE-based MPLs, which can be regarded as a valid alternative to PTFE, in order to simplify preparation routes, reduce temperature and duration of thermal treatment and use lower concentrations of the water repellent polymer in ink formulation.

Author Contributions

G.D., P.G.S. and S.L. conceived and designed the experiments. R.B. performed the experiments; R.B., S.L. and P.G.S. analyzed the data; C.C. and G.D. contributed reagents/materials/analysis tools; R.B. and S.L. wrote the paper.

Conflicts of Interest

The authors declare no conflict of interest.

References

  1. Nagl, S.; Fursch, M.; Paulus, M.; Richter, J.; Truby, J.; Lindenberger, D. Energy policy scenarios to reach challenging climate protection targets in the German electricity sector until 2050. Util. Policy 2011, 19, 185–192. [Google Scholar] [CrossRef]
  2. Connolly, D.; Lund, H.; Mathiesen, B.V.; Werner, S.; Moller, B.; Persson, U.; Boermans, T.; Trier, D.; Ostergaard, P.A.; Nielsen, S. Heat roadmap europe: Combining district heating with heat savings to decarbonise the EU energy system. Energy Policy 2014, 65, 475–489. [Google Scholar] [CrossRef]
  3. Wee, J.-H. Applications of proton exchange membrane fuel cell systems. Renew. Sustain. Energy Rev. 2007, 11, 1720–1738. [Google Scholar] [CrossRef]
  4. Costamagna, P.; Srinivasan, S. Quantum jumps in the PEMFC science and technology from the 1960s to the year 2000 Part I. Fundamental scientific aspects. J. Power Sources 2001, 102, 242–252. [Google Scholar] [CrossRef]
  5. Mehta, V.; Cooper, J.S. Review and analysis of PEM fuel cell design and manufacturing. J. Power Sources 2003, 114, 32–53. [Google Scholar] [CrossRef]
  6. Chalk, S.G.; Miller, J.F.; Wagner, F.W. Challenges for fuel cells in transport applications. J. Power Sources 2000, 86, 40–51. [Google Scholar] [CrossRef]
  7. Ji, M.B.; Wei, Z.D. A Review of Water Management in Polymer Electrolyte Membrane Fuel Cells. Energies 2009, 2, 1057–1106. [Google Scholar] [CrossRef]
  8. Peighambardoust, S.J.; Rowshanzamir, S.; Amjadi, M. Review of the proton exchange membranes for fuel cell applications. Int. J. Hydrogen Energy 2010, 35, 9349–9384. [Google Scholar] [CrossRef]
  9. Morgan, J.M.; Datta, R. Understanding the gas diffusion layer in proton exchange membrane fuel cells. I. How its structural characteristics affect diffusion and performance. J. Power Sources 2014, 251, 269–278. [Google Scholar] [CrossRef]
  10. Park, S.; Lee, J.W.; Popov, B.N. A review of gas diffusion layer in PEM fuel cells: Materials and designs. Int. J. Hydrogen Energy 2012, 37, 5850–5865. [Google Scholar] [CrossRef]
  11. Wilkinson, D.P.; Zhang, J.; Hui, R.; Fergus, J.; Li, X. Proton Exchange Membrane Fuel Cells: Matersials Properties and Performance; CRC Press: Boca Raton, FL, USA, 2009. [Google Scholar]
  12. Barbir, F. PEM Fuel Cells: Theory and Practice, 2nd ed.; Elsevier: London, UK, 2013. [Google Scholar]
  13. Wang, Y.; Wang, C.Y.; Chen, K.S. Elucidating differences between carbon paper and carbon cloth in polymer electrolyte fuel cells. Electrochim. Acta 2007, 52, 3965–3975. [Google Scholar] [CrossRef]
  14. Frey, T.; Linardi, M. Effects of membrane electrode assembly preparation on the polymer electrolyte membrane fuel cell performance. Electrochim. Acta 2004, 50, 99–105. [Google Scholar] [CrossRef]
  15. Qi, Z.G.; Kaufman, A. Improvement of water management by a microporous sublayer for PEM fuel cells. J. Power Sources 2002, 109, 38–46. [Google Scholar] [CrossRef]
  16. Park, S.; Lee, J.-W.; Popov, B.N. Effect of PTFE content in microporous layer on water management in PEM fuel cells. J. Power Sources 2008, 177, 457–463. [Google Scholar] [CrossRef]
  17. Weber, A.Z.; Newman, J. Effects of microporous layers in polymer electrolyte fuel cells. J. Electrochem. Soc. 2005, 152, A677–A688. [Google Scholar] [CrossRef]
  18. Park, S.; Popov, B.N. Effect of hydrophobicity and pore geometry in cathode GDL on PEM fuel cell performance. Electrochim. Acta 2009, 54, 3473–3479. [Google Scholar] [CrossRef]
  19. Lee, E.; Yang, K.; Jung, H.; Kim, T.; Han, S.; Lee, J.; Seo, Y.; Park, J. Preparation of Gas Diffusion Layer for Fuel Cell. U.S. Patent. 2009/0011308 A1, 2009. [Google Scholar]
  20. Latorrata, S.; Stampino, P.G.; Amici, E.; Pelosato, R.; Cristiani, C.; Dotelli, G. Effect of rheology controller agent addition to Micro-Porous Layers on PEMFC performances. Solid State Ionics 2012, 216, 73–77. [Google Scholar] [CrossRef]
  21. Yuan, X.Z.; Song, C.; Wang, H.; Zhang, J. Electrochemical Impedance Spectroscopy in PEM Fuel Cells: Fundamentals and Applications; Springer: London, UK, 2010; pp. 1–420. [Google Scholar]
  22. Wagner, N.; Gülzow, E. Change of electrochemical impedance spectra (EIS) with time during CO-poisoning of the Pt-anode in a membrane fuel cell. J. Power Sources 2004, 127, 341–347. [Google Scholar] [CrossRef]
  23. Asghari, S.; Mokmeli, A.; Samavati, M. Study of PEM fuel cell performance by electrochemical impedance spectroscopy. Int. J. Hydrogen Energy 2010, 35, 9283–9290. [Google Scholar] [CrossRef]
  24. Wagner, N. Characterization of membrane electrode assemblies in polymer electrolyte fuel cells using a.c. impedance spectroscopy. J. Appl. Electrochem. 2002, 32, 859–863. [Google Scholar] [CrossRef]
  25. Ciureanu, M.; Roberge, R. Electrochemical impedance study of PEM fuel cells. Experimental diagnostics and modeling of air cathodes. J. Phys. Chem. B 2001, 105, 3531–3539. [Google Scholar] [CrossRef]
  26. Ramasamy, R.P.; Kumbur, E.C.; Mench, M.M.; Liu, W.; Moore, D.; Murthy, M. Investigation of macro- and micro-porous layer interaction in polymer electrolyte fuel cells. Int. J. Hydrogen Energy 2008, 33, 3351–3367. [Google Scholar] [CrossRef]
  27. Dhirde, A.M.; Dale, N.V.; Salehfar, H.; Mann, M.D.; Han, T.-H. Equivalent Electric Circuit Modeling and Performance Analysis of a PEM Fuel Cell Stack Using Impedance Spectroscopy. IEEE Trans. Energy Convers. 2010, 25, 778–786. [Google Scholar] [CrossRef]
  28. Sullivan, T.M.; Middleman, S. Film thickness in blade coating of viscous and viscoelastic liquids. J. Non-Newton. Fluid Mech. 1986, 21, 13–38. [Google Scholar] [CrossRef]
  29. Kong, C.S.; Kim, D.Y.; Lee, H.K.; Shul, Y.G.; Lee, T.H. Influence of pore-size distribution of diffusion layer on mass-transport problems of proton exchange membrane fuel cells. J. Power Sources 2002, 108, 185–191. [Google Scholar] [CrossRef]
  30. Lee, H.K.; Park, J.H.; Kim, D.Y.; Lee, T.H. A study on the characteristics of the diffusion layer thickness and porosity of the PEMFC. J. Power Sources 2004, 131, 200–206. [Google Scholar] [CrossRef]
  31. Hao, L.; Cheng, P. Lattice Boltzmann simulations of anisotropic permeabilities in carbon paper gas diffusion layers. J. Power Sources 2009, 186, 104–114. [Google Scholar] [CrossRef]
  32. Chun, J.H.; Jo, D.H.; Kim, S.G.; Park, S.H.; Lee, C.H.; Lee, E.S.; Jyoung, J.Y.; Kim, S.H. Development of a porosity-graded micro porous layer using thermal expandable graphite for proton exchange membrane fuel cells. Renew. Energy 2013, 58, 28–33. [Google Scholar] [CrossRef]
  33. Latorrata, S.; Balzarotti, R.; Stampino, P.G.; Cristiani, C.; Dotelli, G.; Guilizzoni, M. Design of properties and performances of innovative gas diffusion media for polymer electrolyte membrane fuel cells. Prog. Org. Coat. 2015, 78, 517–525. [Google Scholar] [CrossRef]
  34. Hiramitsu, Y.; Sato, H.; Honi, M. Prevention of the water flooding by micronizing the pore structure of gas diffusion layer for polymer electrolyte fuel cell. J. Power Sources 2010, 195, 5543–5549. [Google Scholar] [CrossRef]
  35. Jordan, L.R.; Shukla, A.K.; Behrsing, T.; Avery, N.R.; Muddle, B.C.; Forsyth, M. Diffusion layer parameters influencing optimal fuel cell performance. J. Power Sources 2000, 86, 250–254. [Google Scholar] [CrossRef]
  36. Paganin, V.A.; Ticianelli, E.A.; Gonzalez, E.R. Development and electrochemical studies of gas diffusion electrodes for polymer electrolyte fuel cells. J. Appl. Electrochem. 1996, 26, 297–304. [Google Scholar] [CrossRef]
  37. Nam, J.H.; Lee, K.J.; Hwang, G.S.; Kim, C.J.; Kaviany, M. Microporous layer for water morphology control in PEMFC. Int. J. Heat Mass Tran. 2009, 52, 2779–2791. [Google Scholar] [CrossRef]
  38. Tseng, C.J.; Lo, S.K. Effects of microstructure characteristics of gas diffusion layer and microporous layer on the performance of PEMFC. Energy Convers. Manag. 2010, 51, 677–684. [Google Scholar] [CrossRef]
  39. Markoetter, H.; Haussmann, J.; Alink, R.; Toetzke, C.; Arlt, T.; Klages, M.; Riesemeier, H.; Scholta, J.; Gerteisen, D.; Banhart, J.; et al. Influence of cracks in the microporous layer on the water distribution in a PEM fuel cell investigated by synchrotron radiography. Electrochem. Commun. 2013, 34, 22–24. [Google Scholar] [CrossRef]

