
Power Management Optimization of an Experimental Fuel Cell/Battery/Supercapacitor Hybrid System

Abstract
:1. Introduction
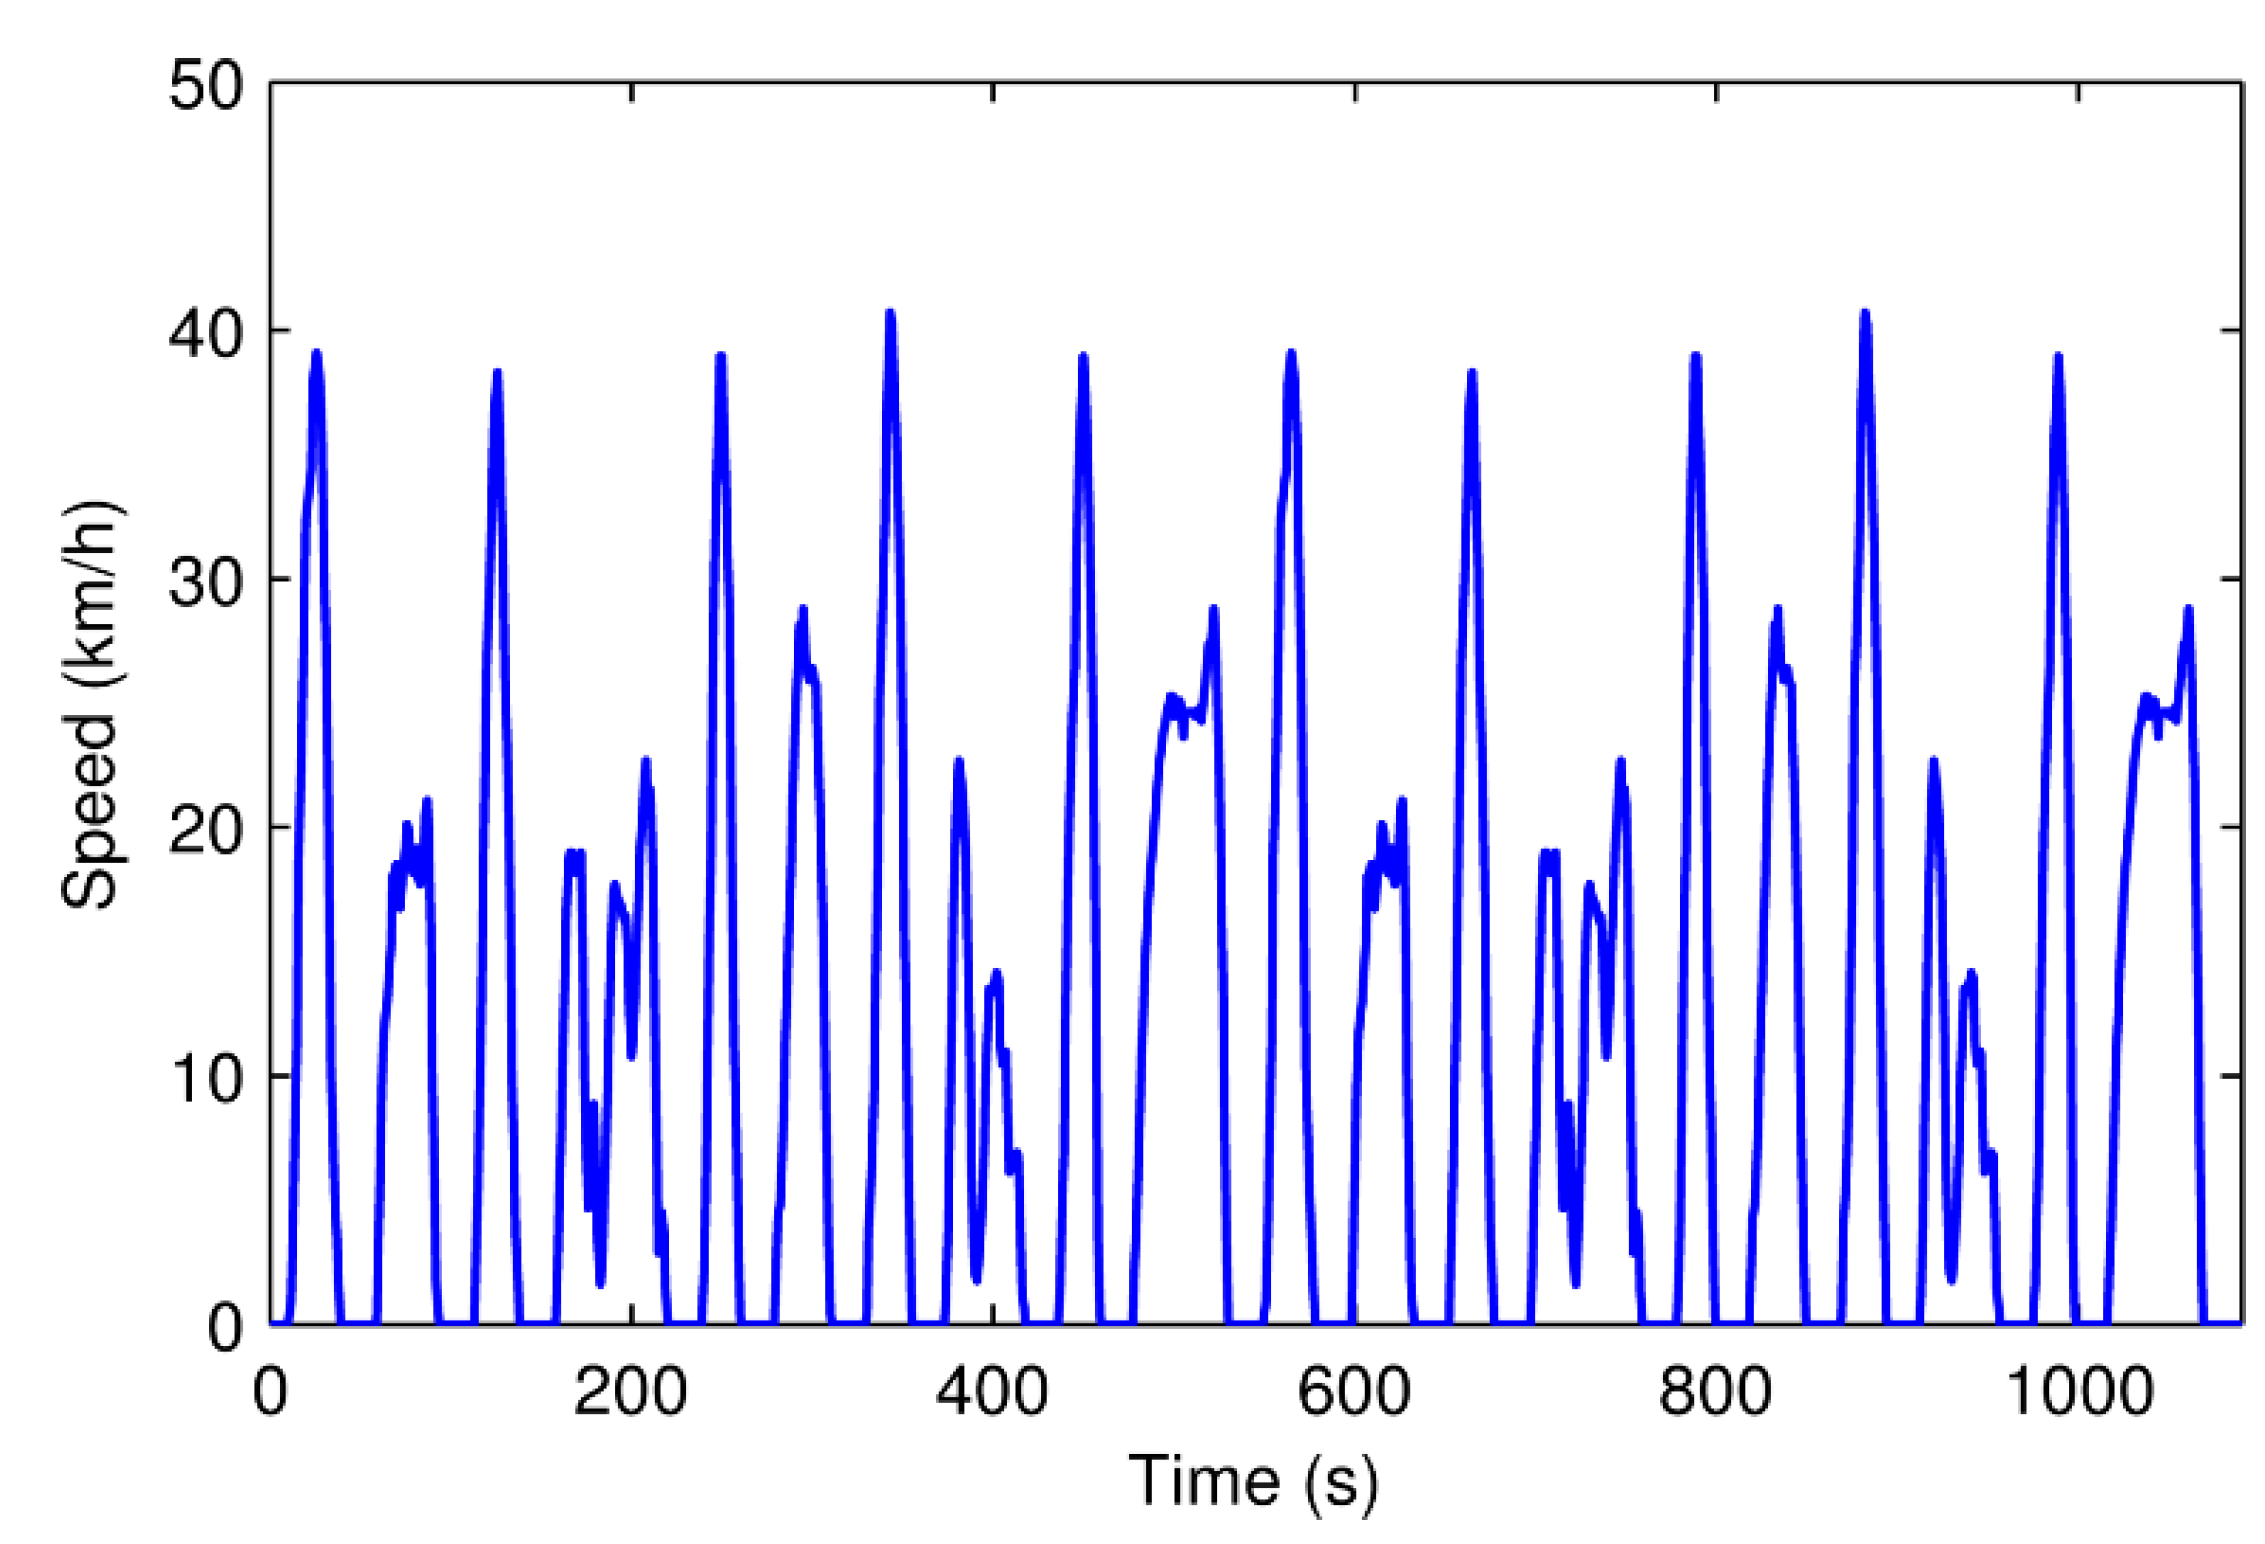
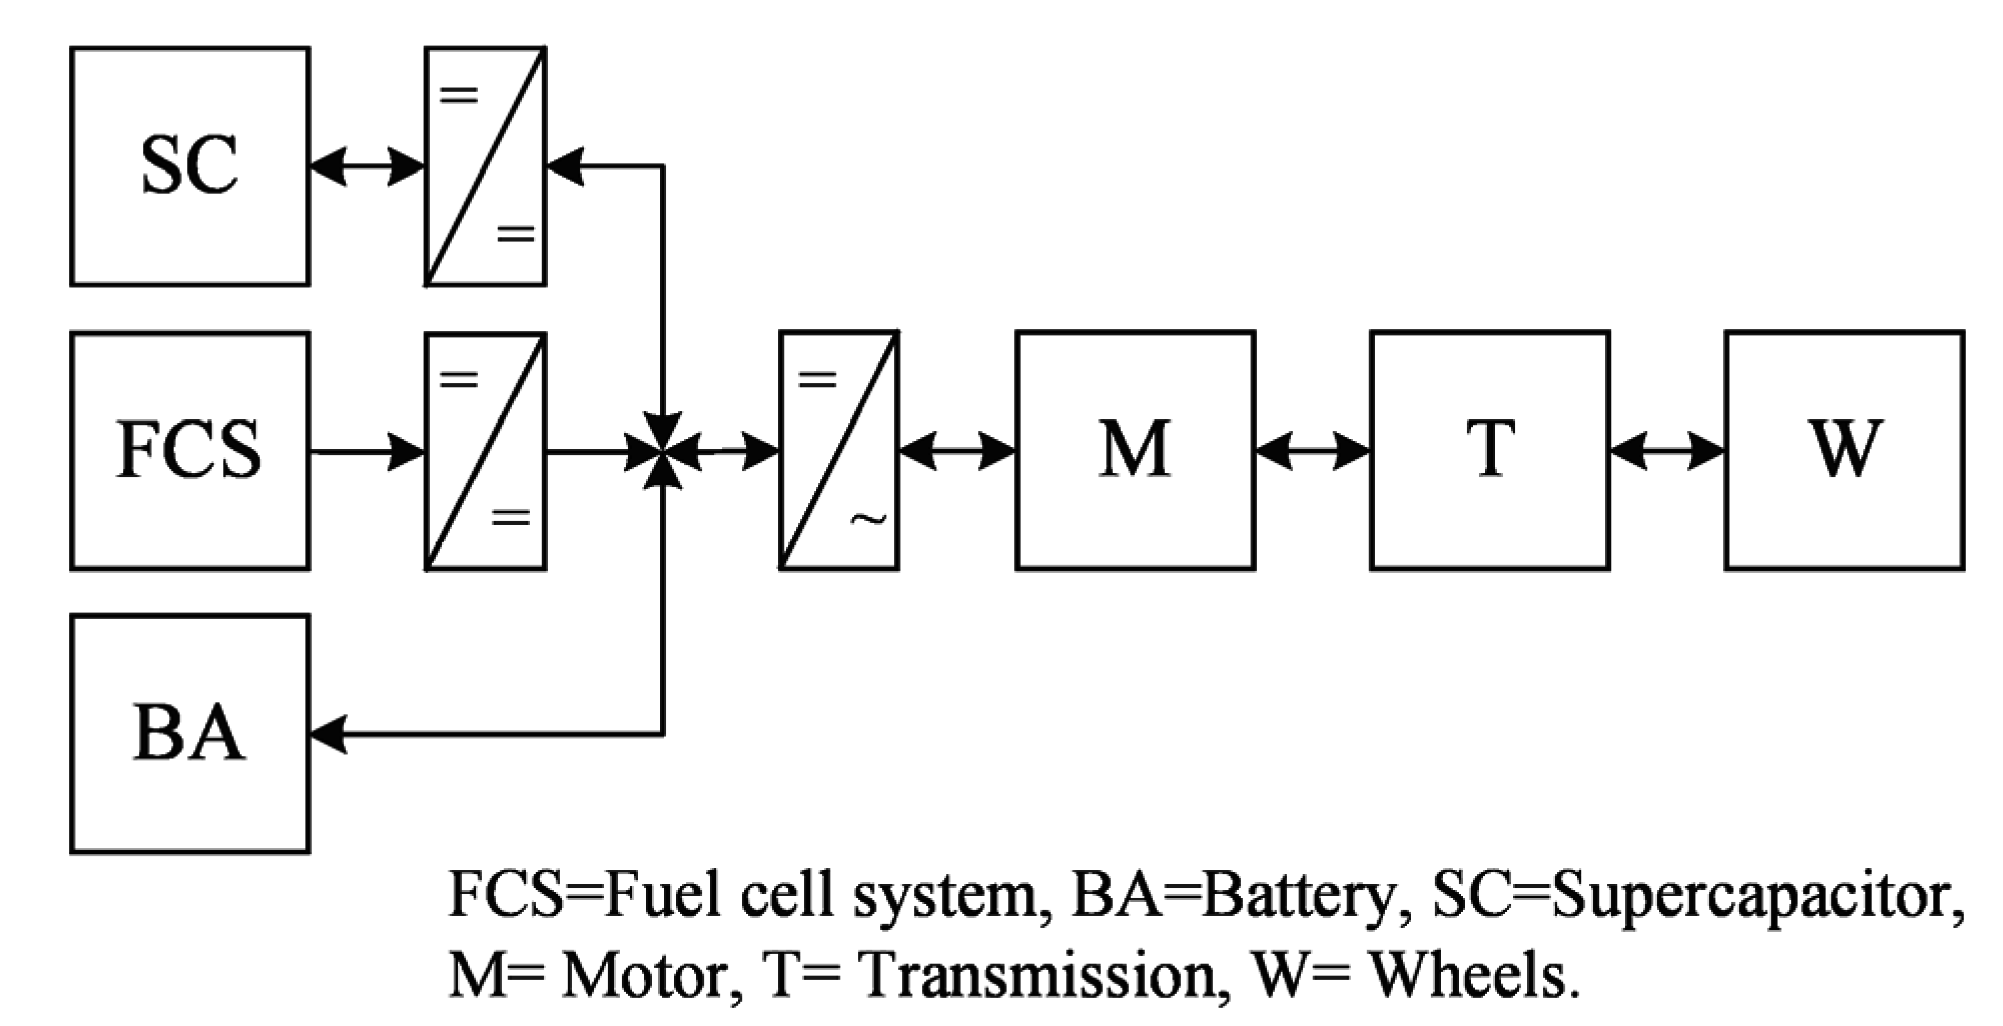
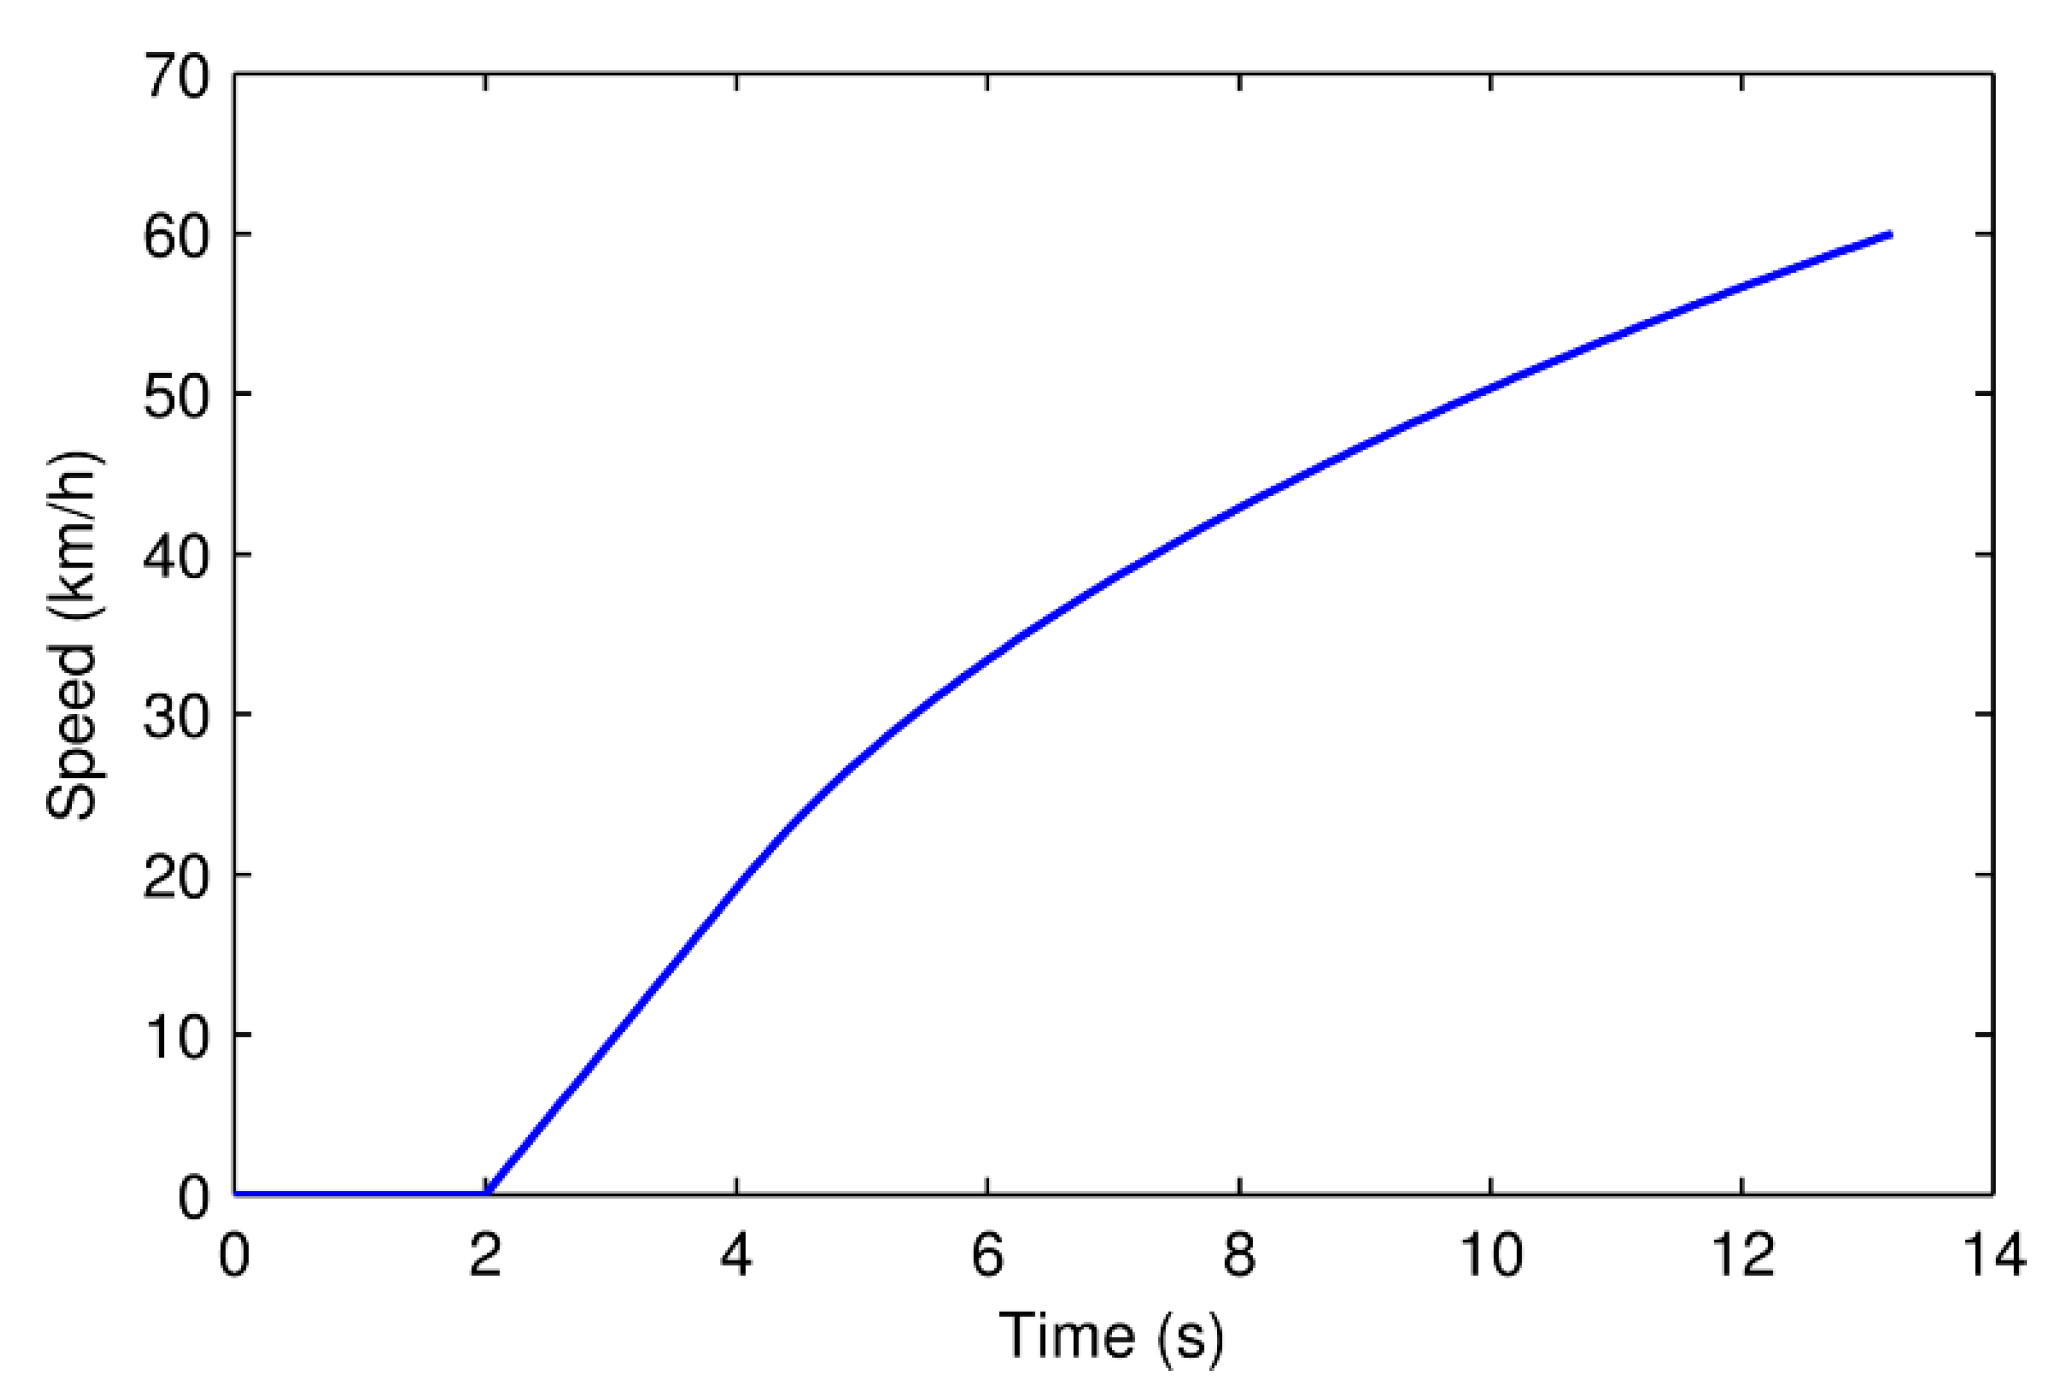
2. Vehicle Model

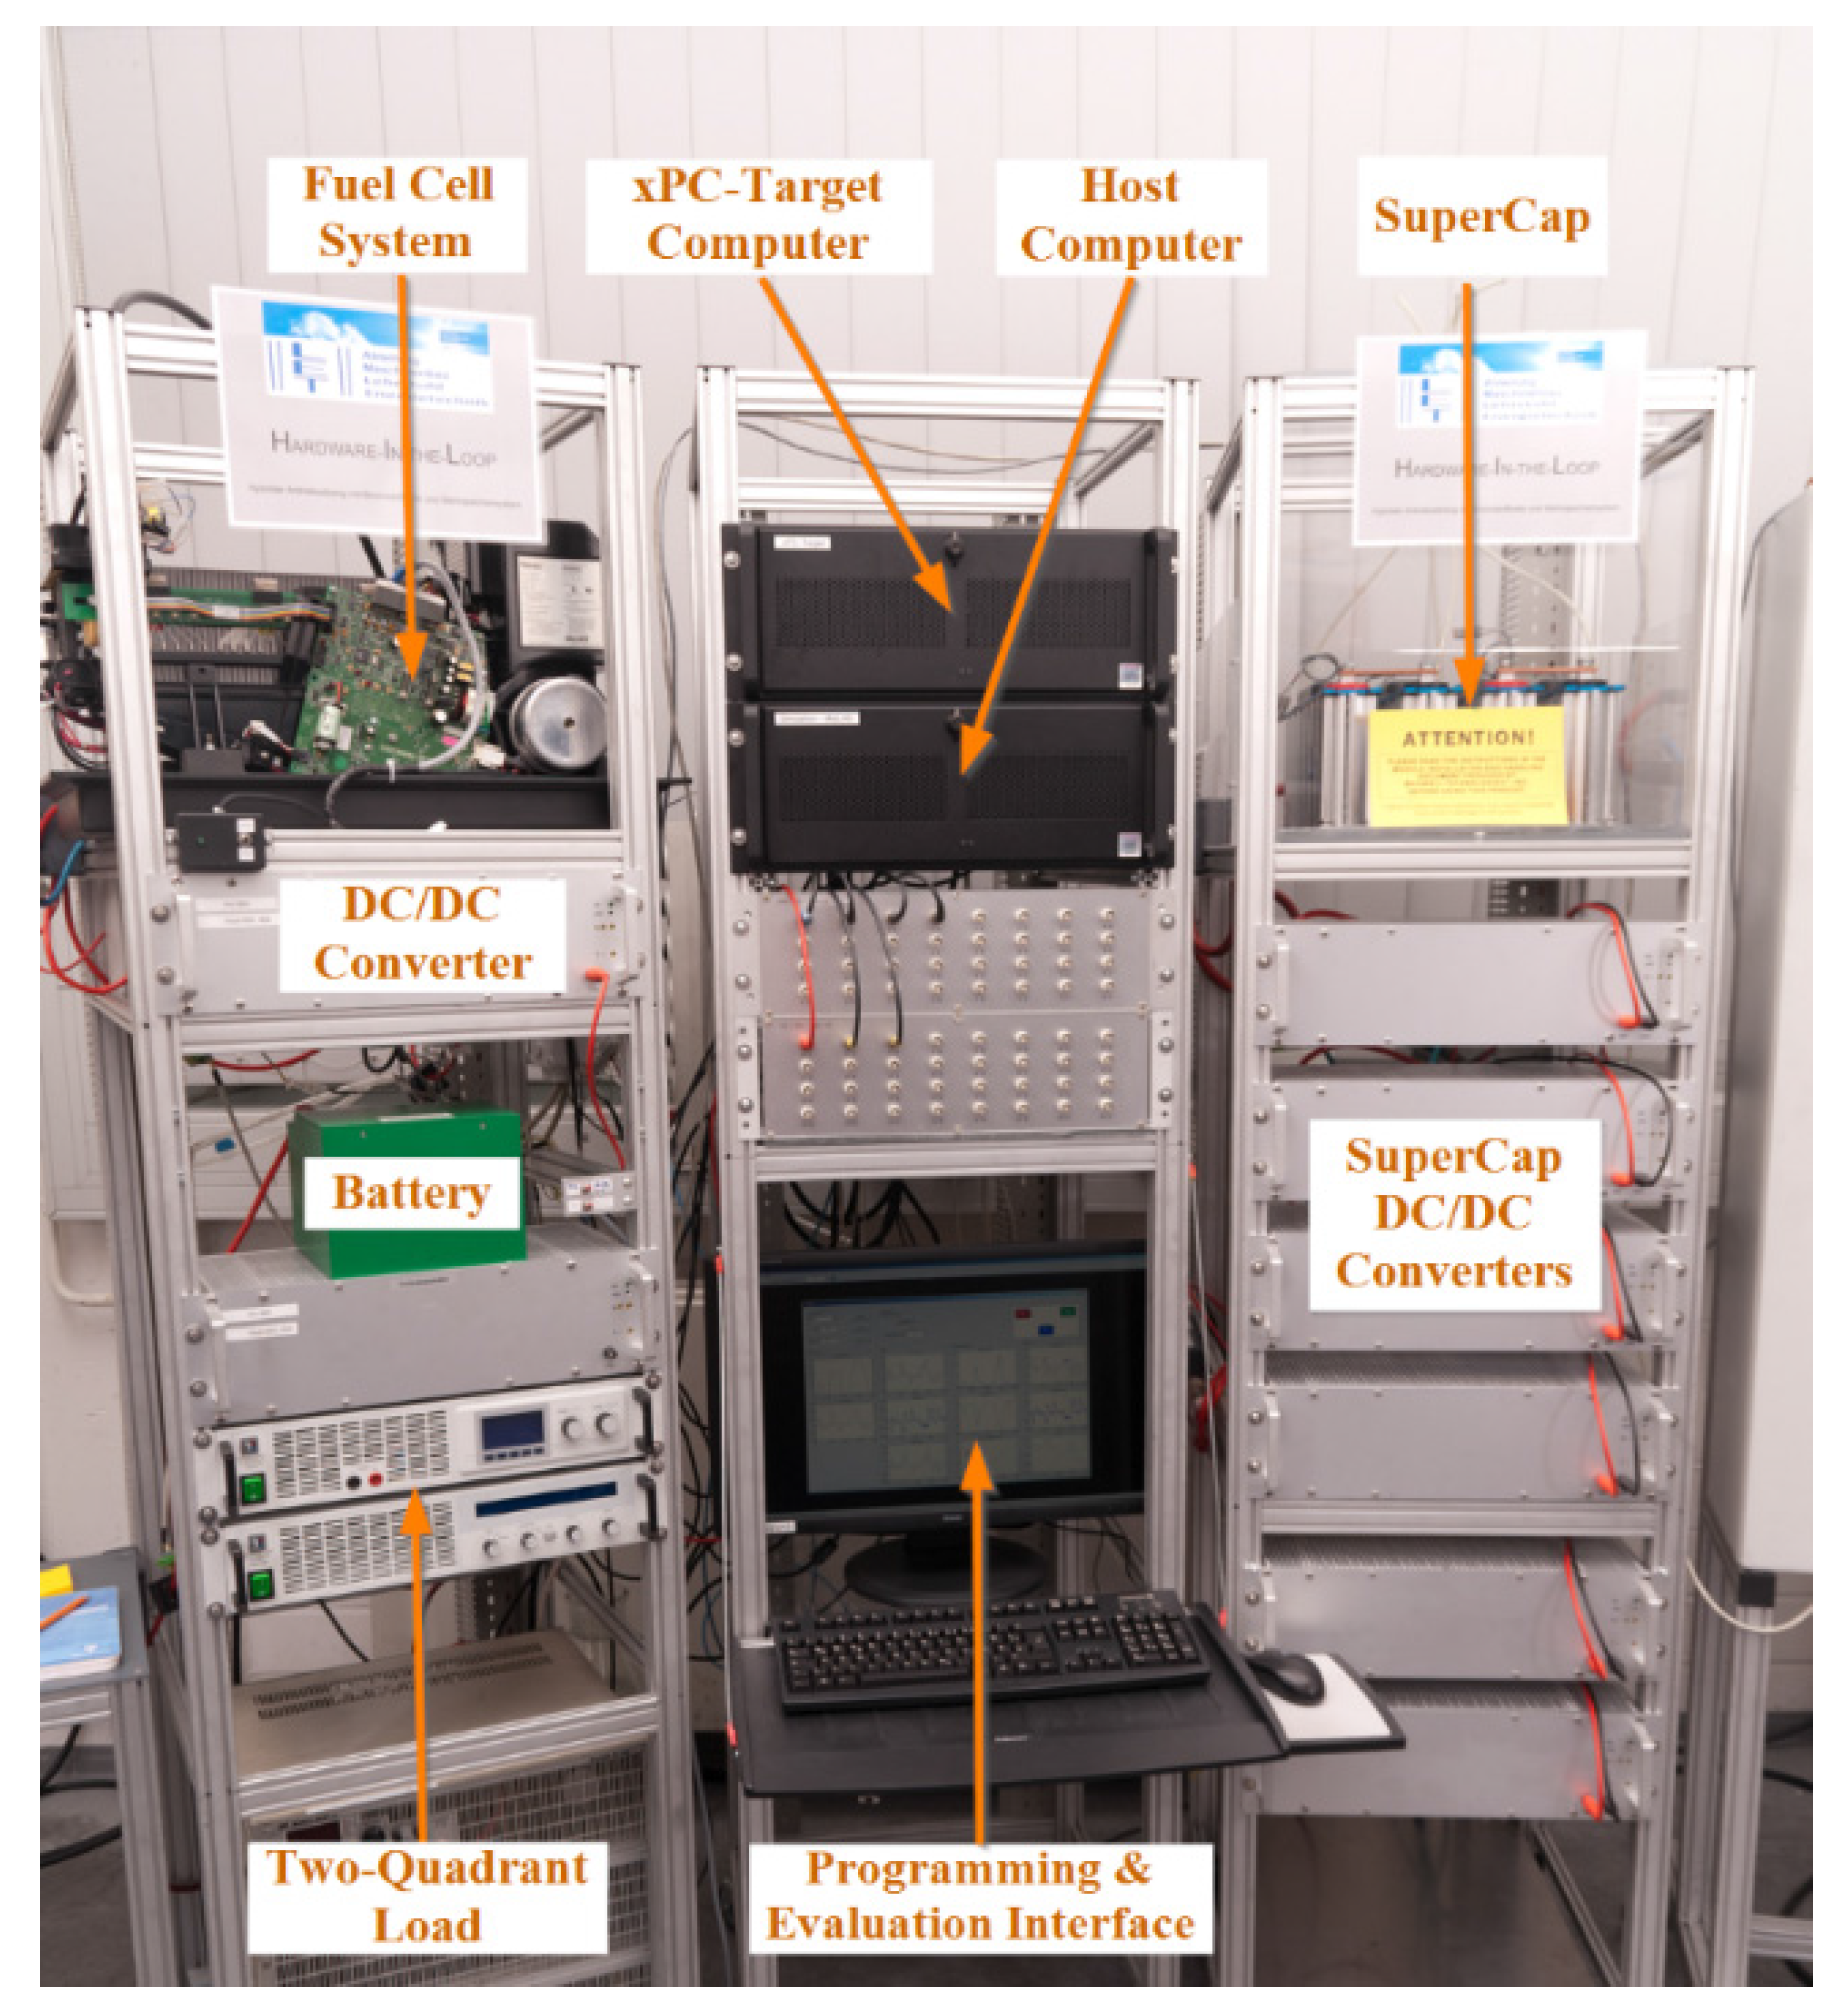
3. Hardware-in-the-Loop Test Bench


| Parameter | Value |
|---|---|
| Fuel cell system | |
| PEM stack | 47 cells |
| Rated power | 1.2 kW |
| Output voltage | 22–43 V (26 V rated) |
| Battery | |
| No. cells | 10 |
| Capacity | 30 Ah |
| Rated voltage | 37 V |
| Current (max./min./rated) | (110/−45/30) A |
| Supercapacitor | |
| No. modules | 3 (each with 6 cells) |
| Module capacitance | 500 F |
| Rated Voltage | 48 V |
| Current (max./min./rated) | (1900/−1900/100) A |
| DC/DC converter | |
| Input voltage | 25–47 V (36 V rated) |
| Output voltage | 25–50 V (50 V rated) |
| Maximum output current | 25 A |
| Load | |
| Sink ratings | 80 V/200 A/2400 W |
| Source ratings | 80 V/50 A/1500 W |
3.1. Fuel Cell System
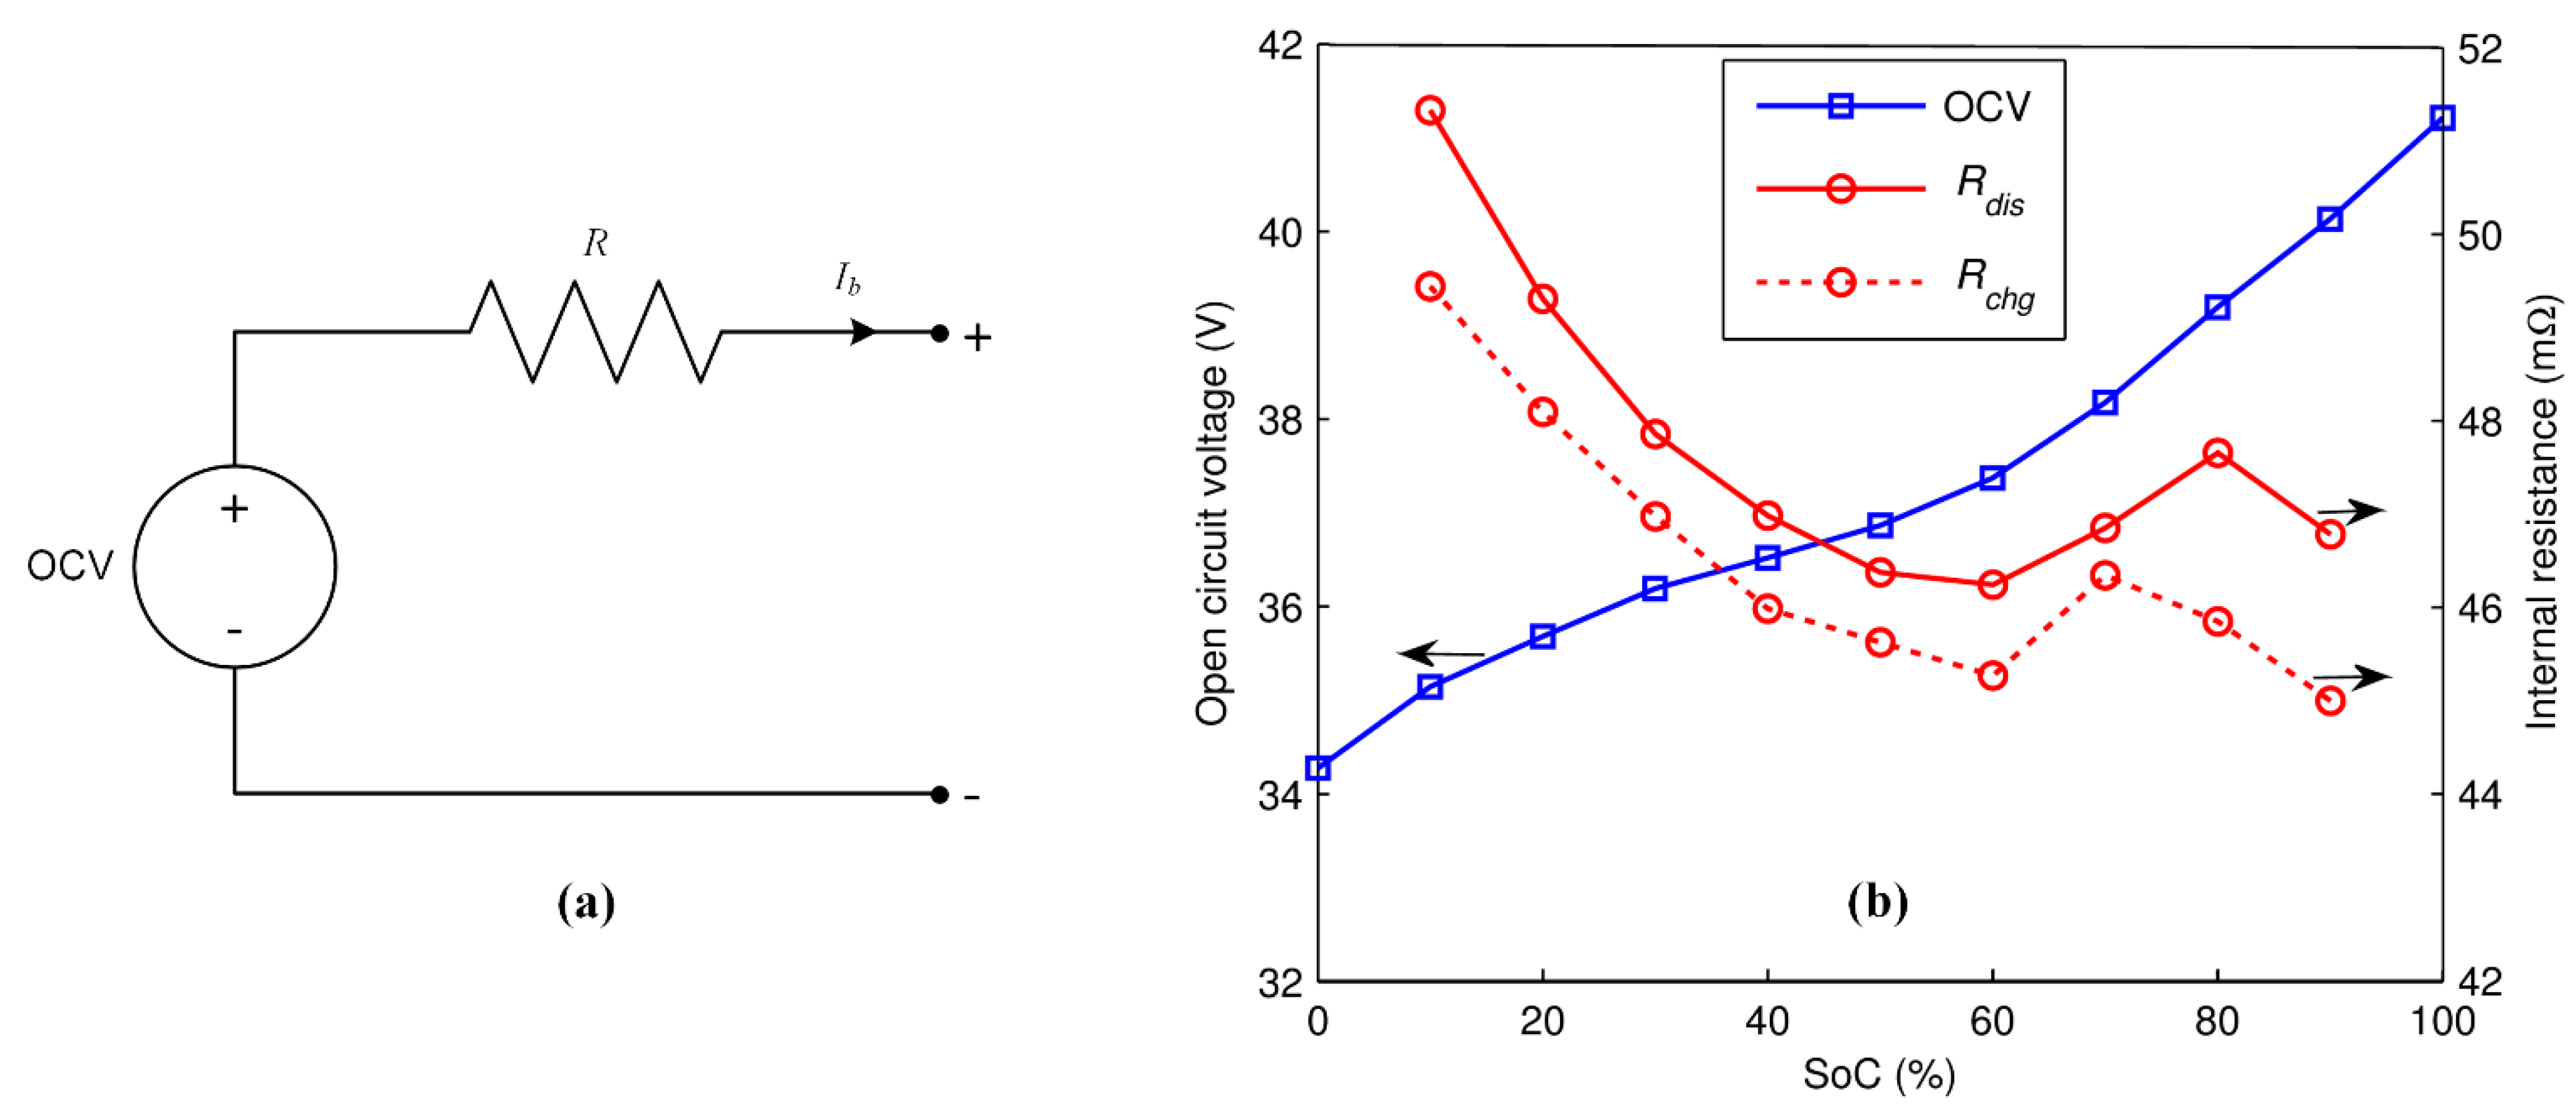
3.2. Battery

3.3. Supercapacitor

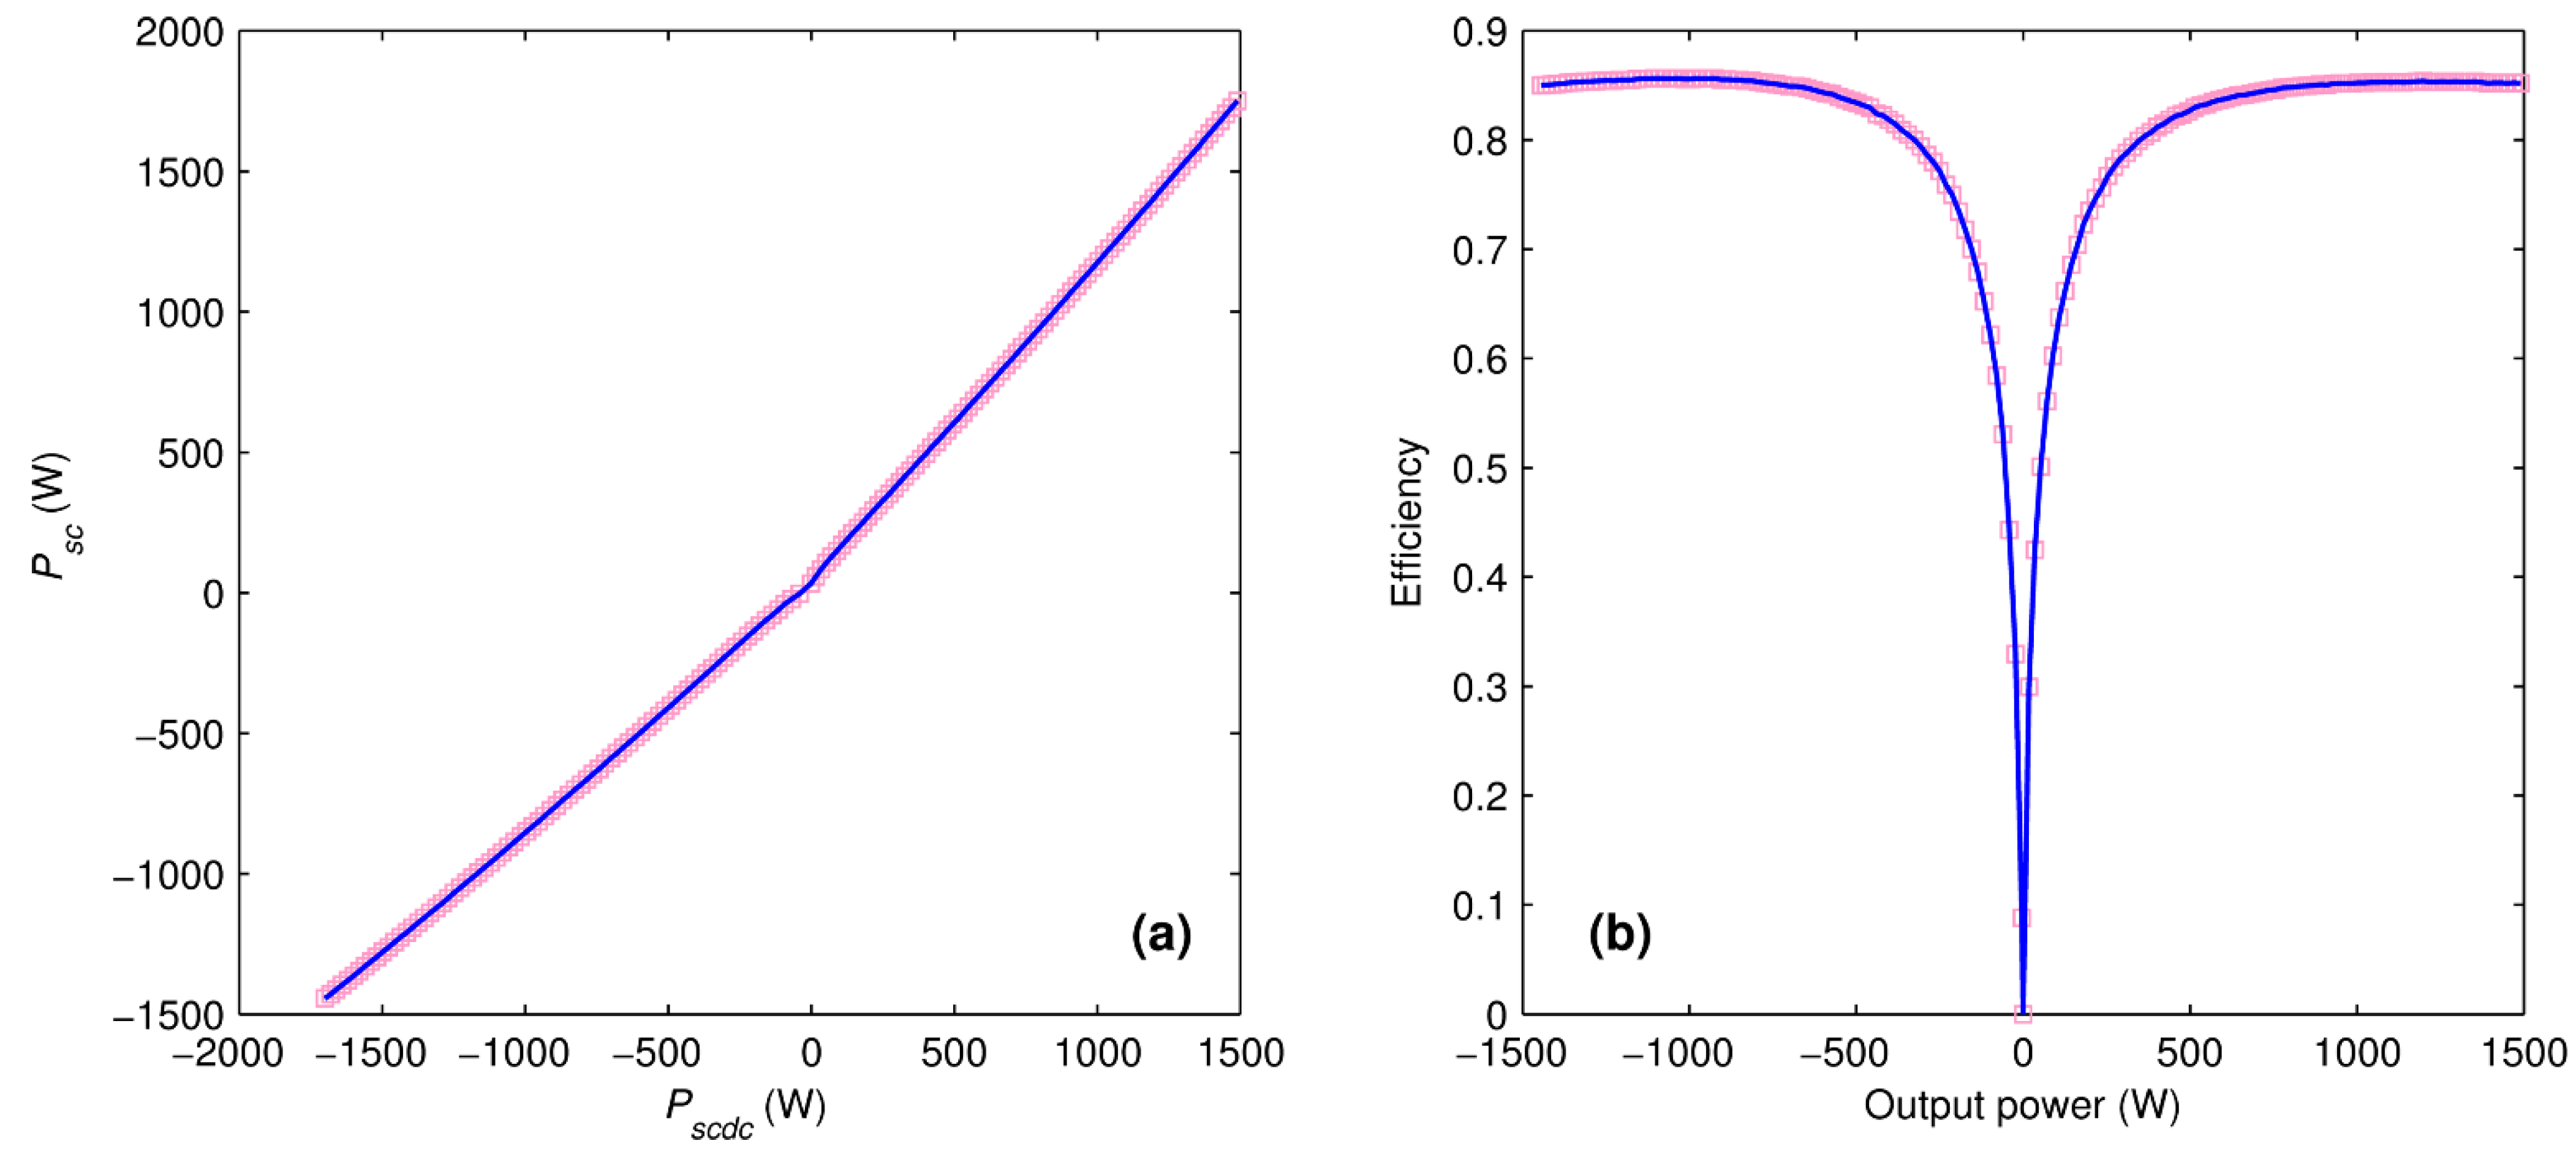
3.4. DC/DC Converters
3.5. Power Sources Sizing
4. Power Management Strategy
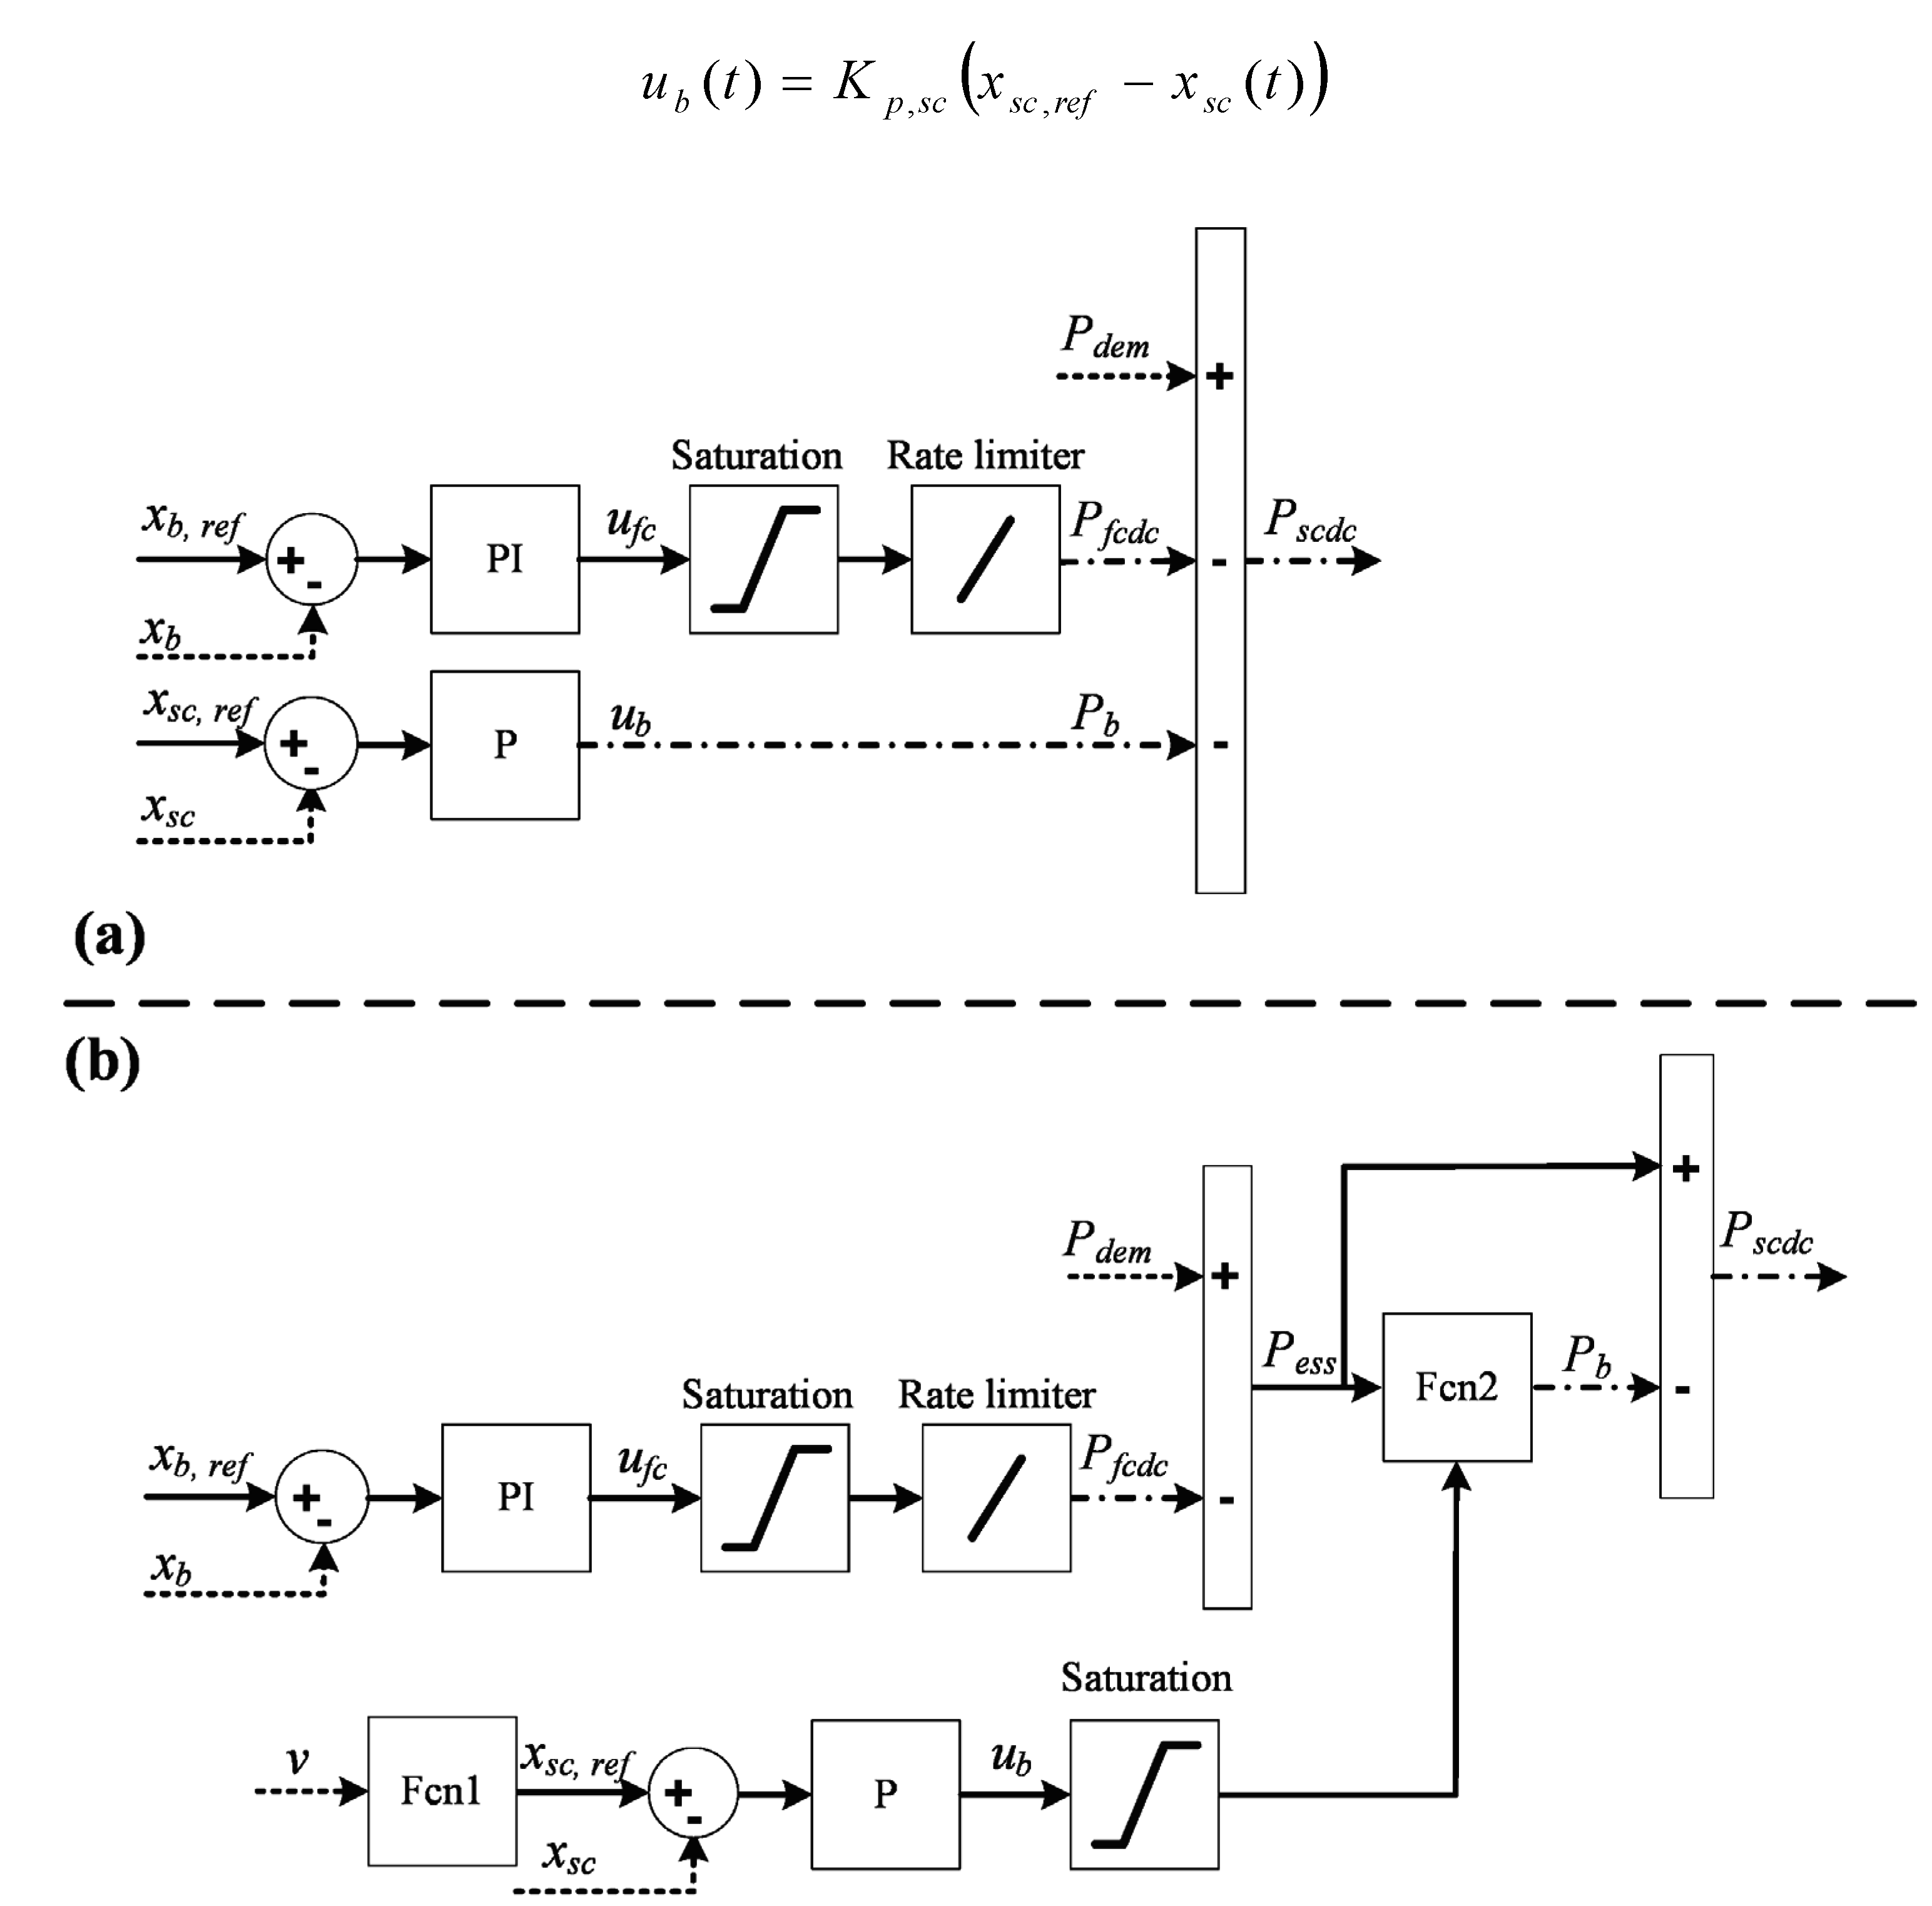
4.1. Strategy S1

4.2. Strategy S2
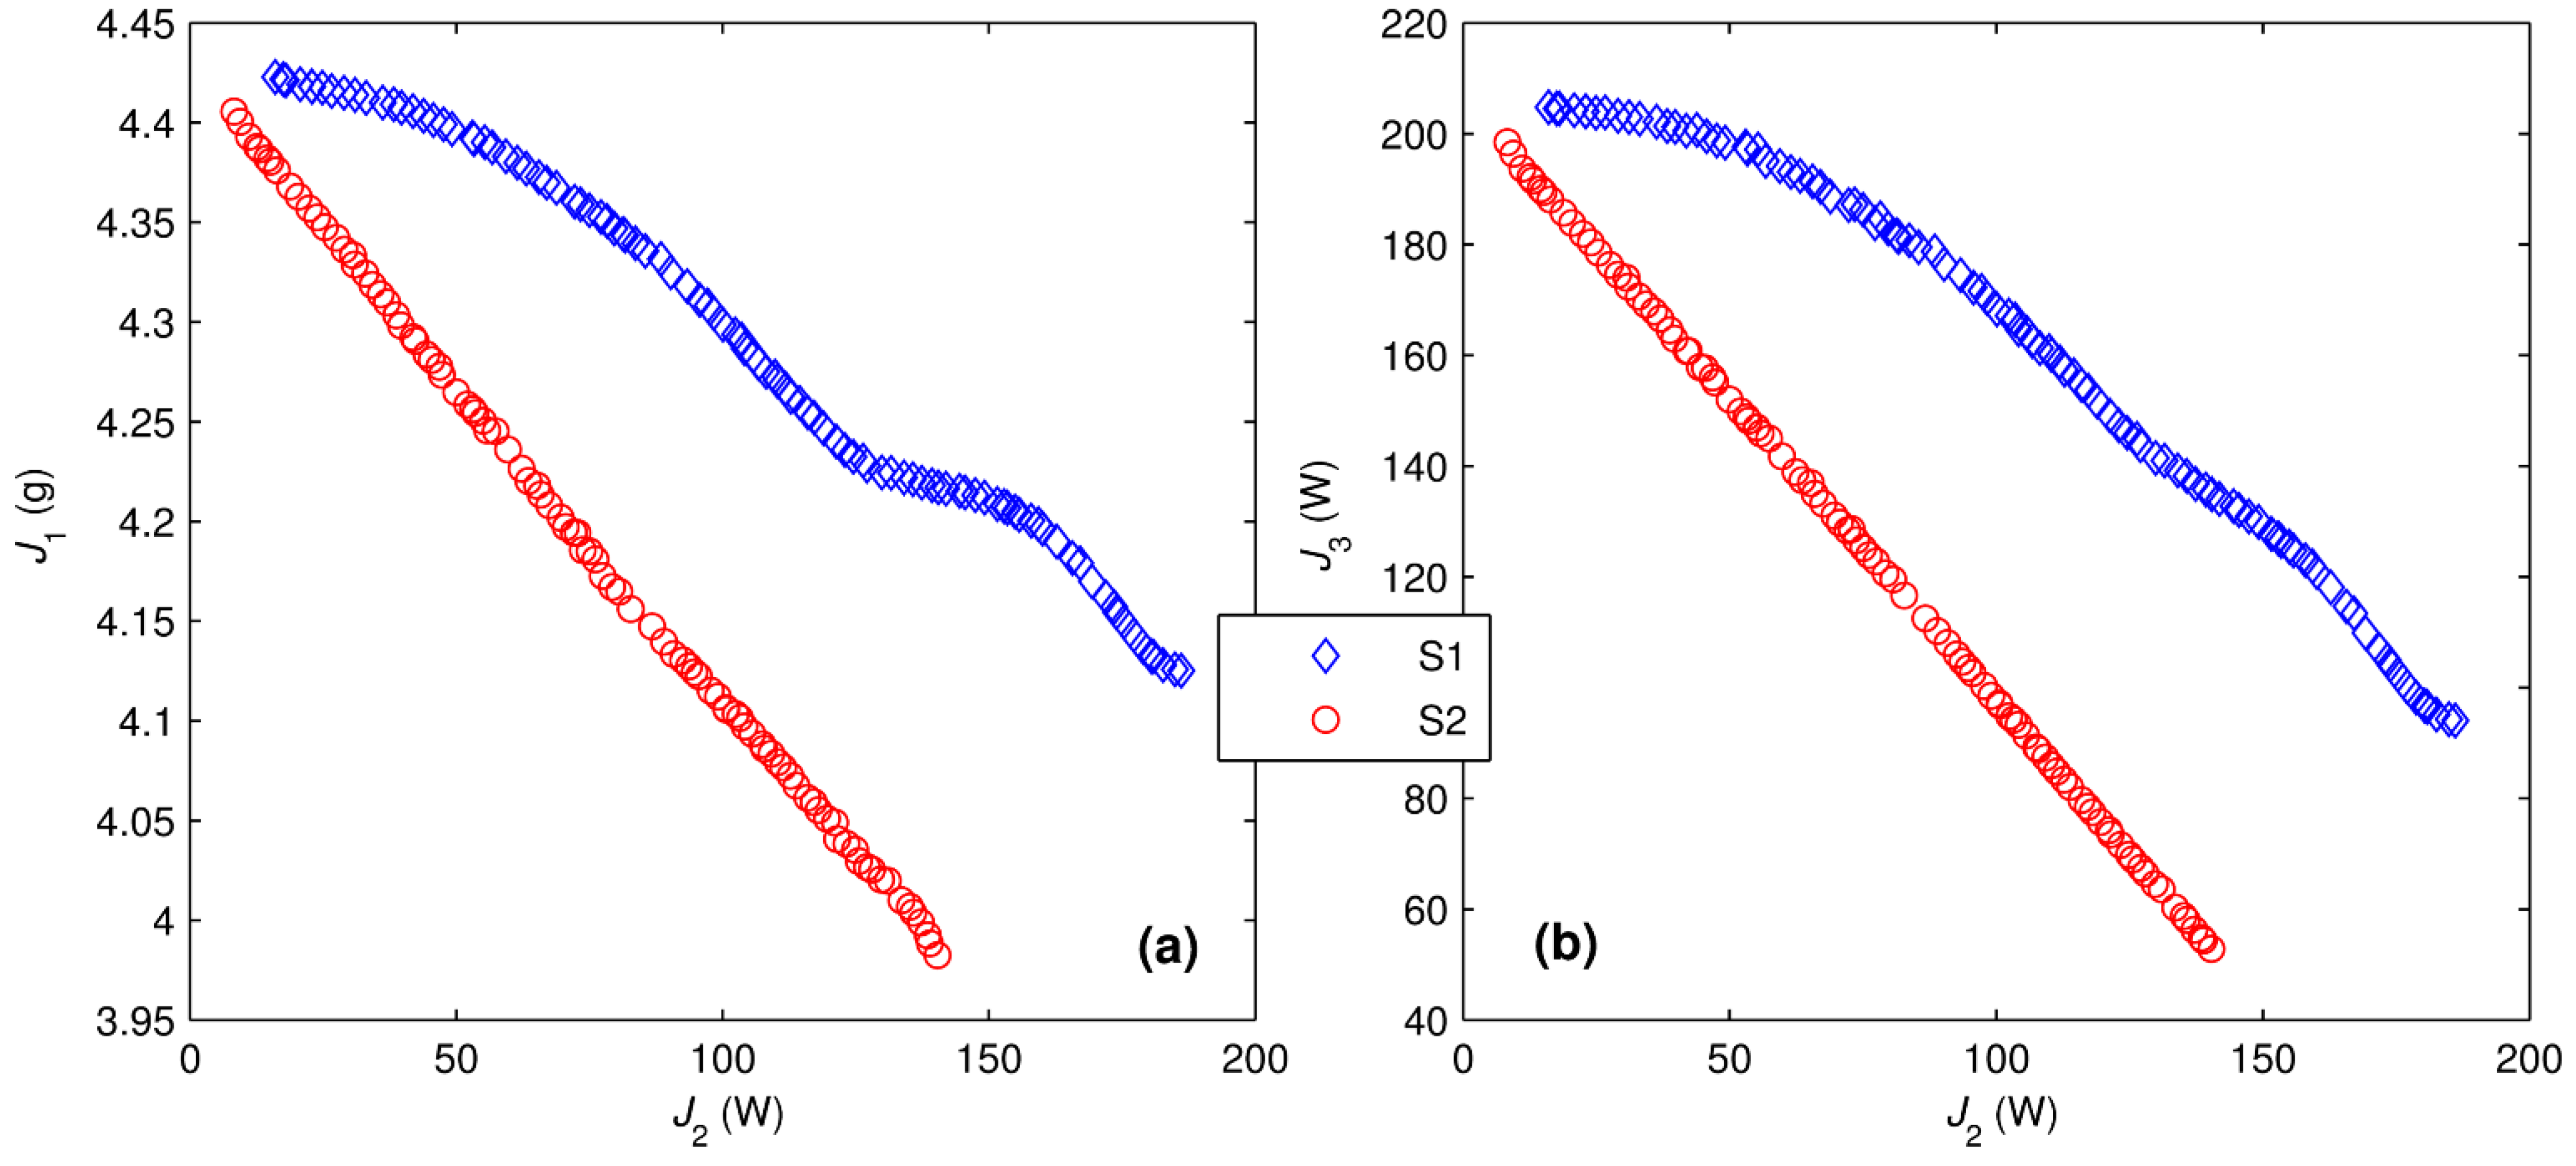
4.3. Optimization
- (1)
- The solution X1 is no worse than X2 in all the objectives.
- (2)
- The solution X1 is strictly better than X2 in at least one objective.


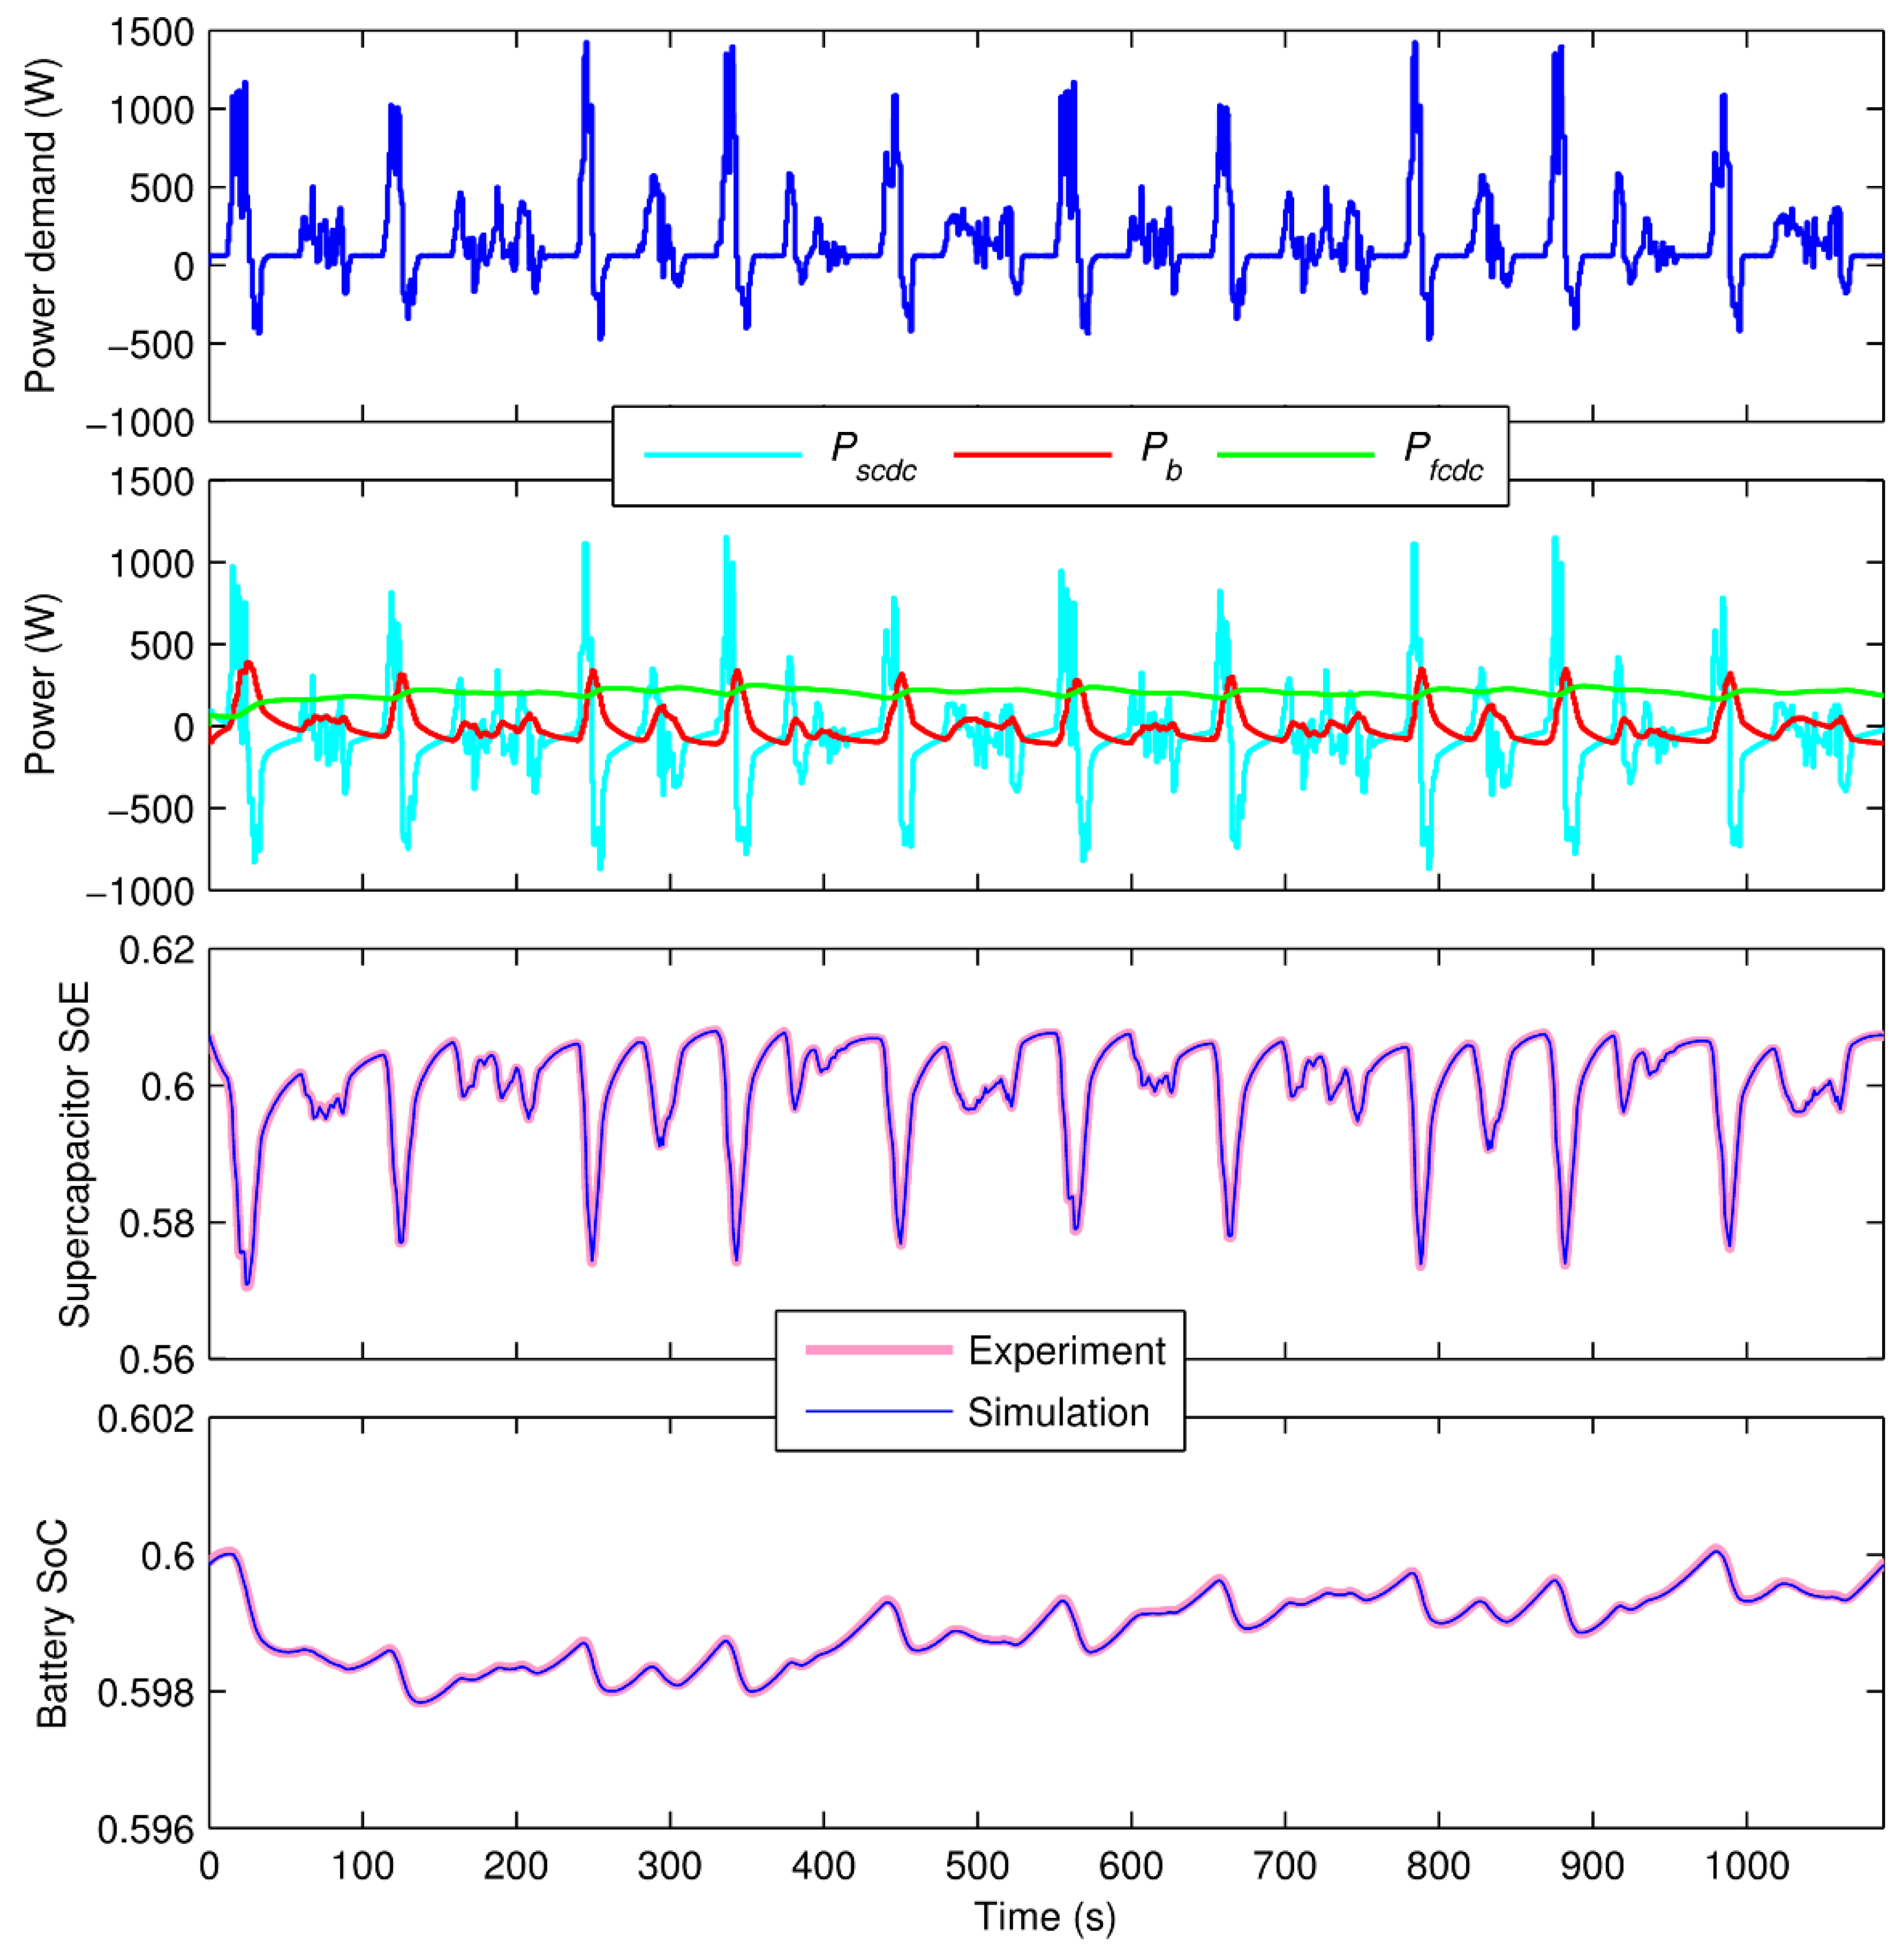
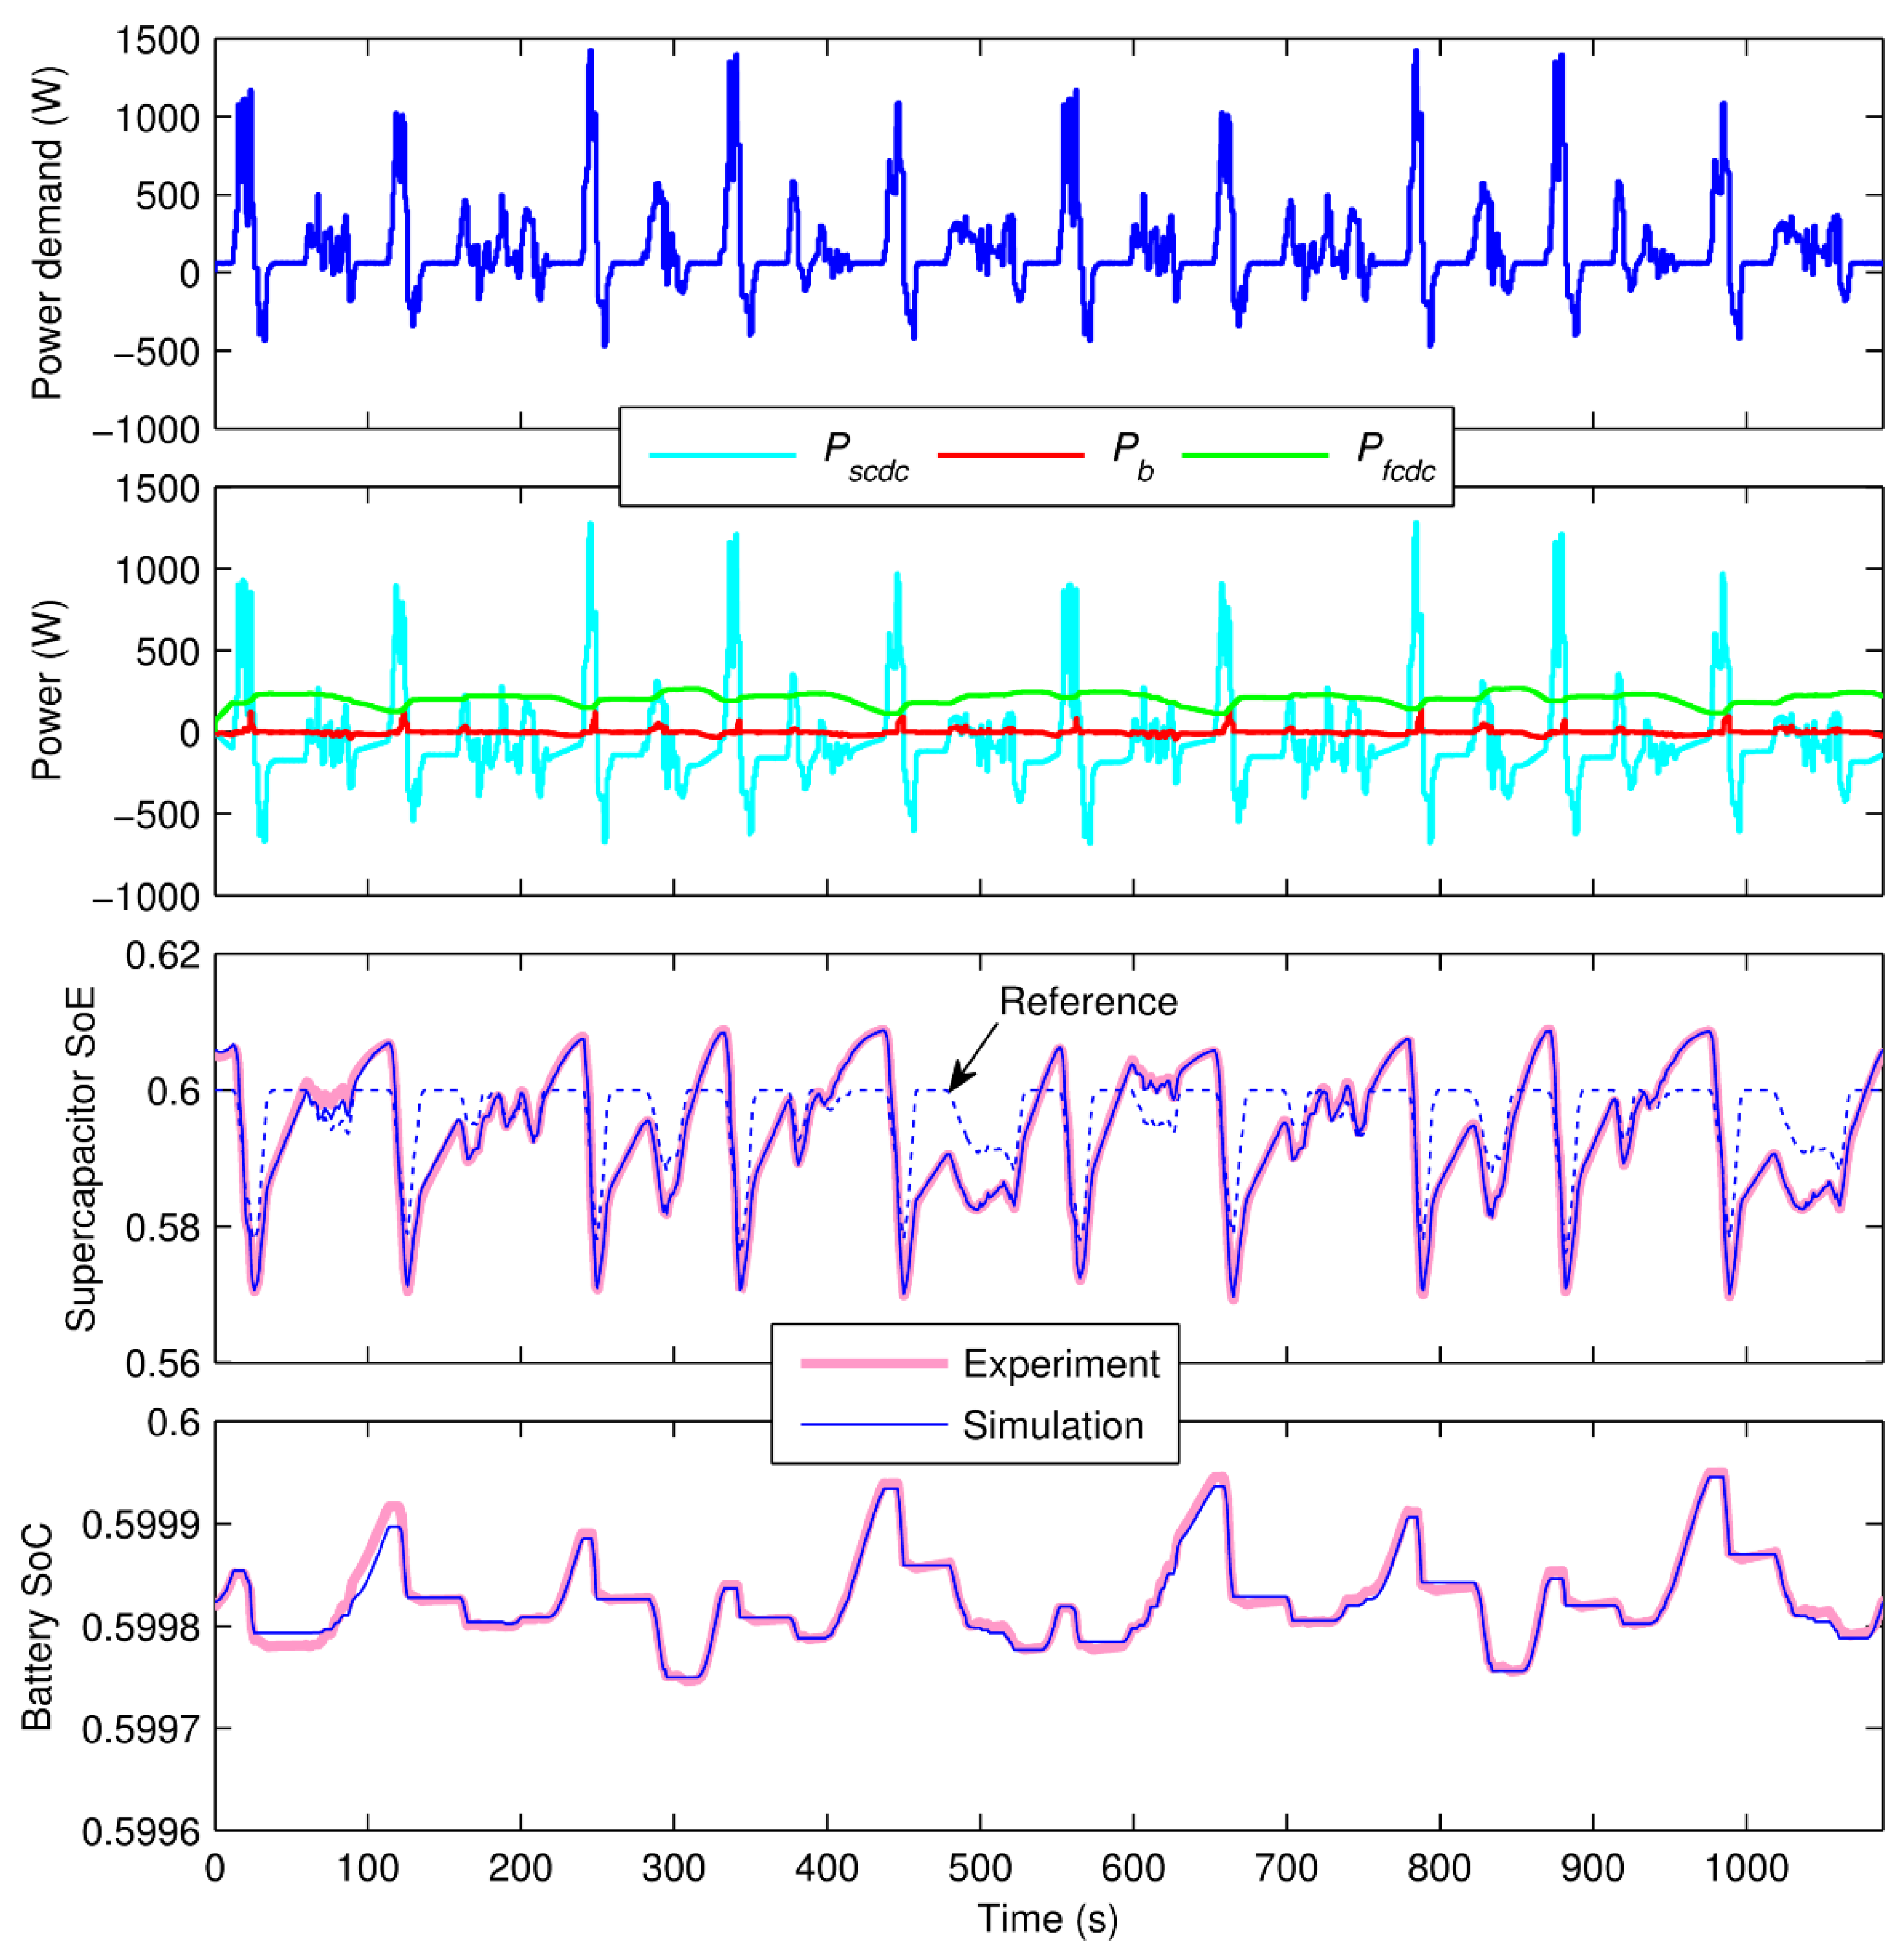
5. Experimental Validation

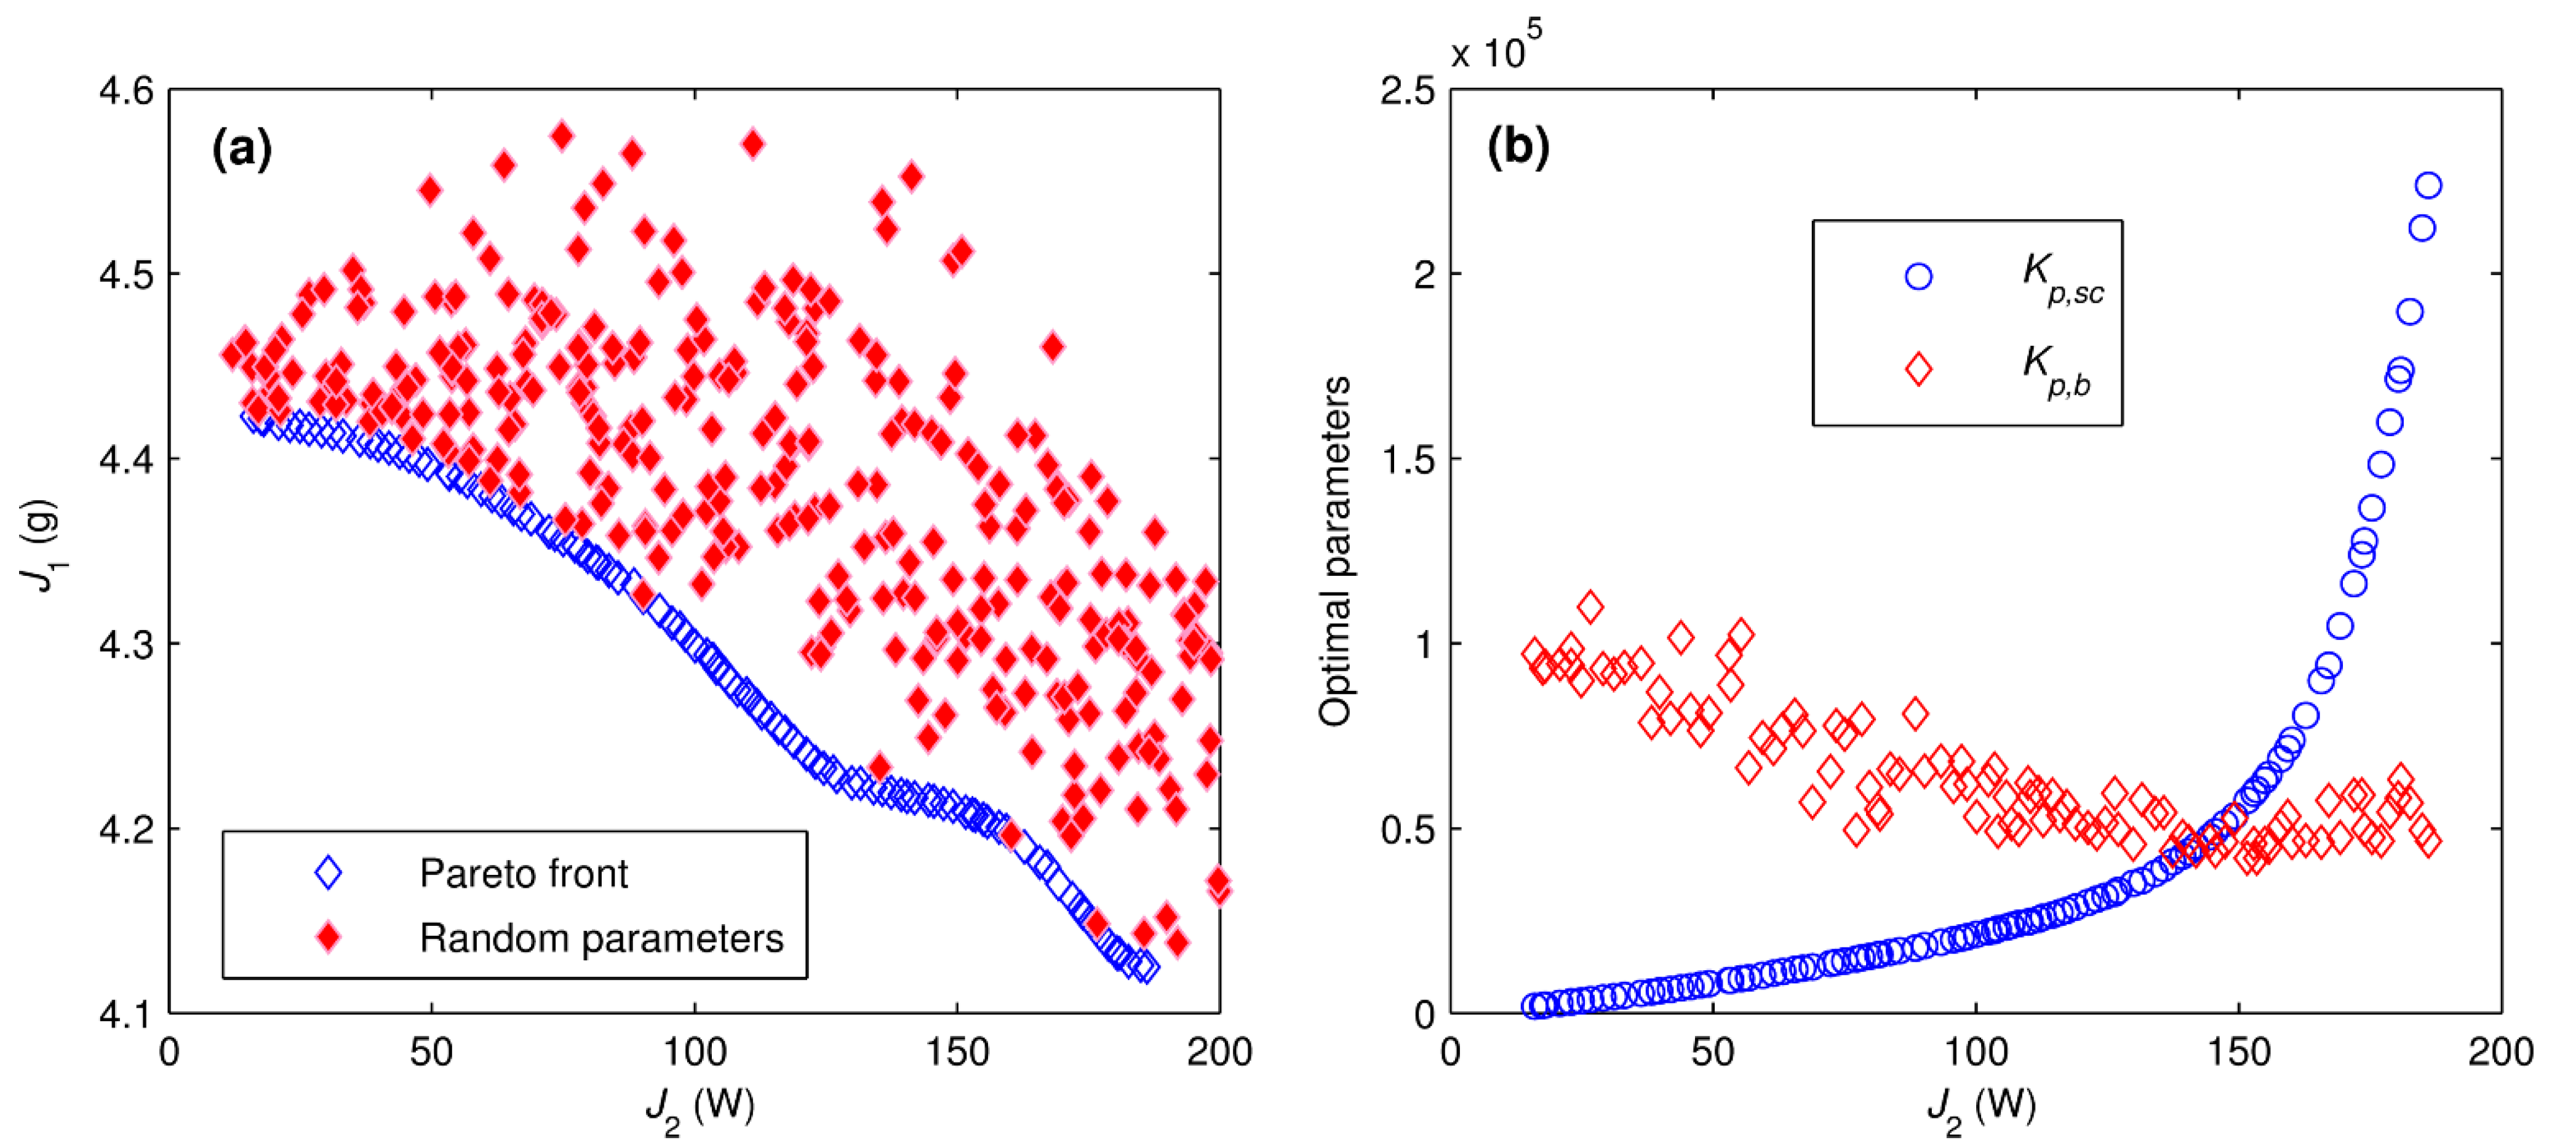
| Strategy | J2 (W) (sim./exp.) | J1 (g) (sim./exp.) |
|---|---|---|
| S1 | 71/73 | 4.36/4.42 |
| S2 | 7/8 | 4.41/4.45 |
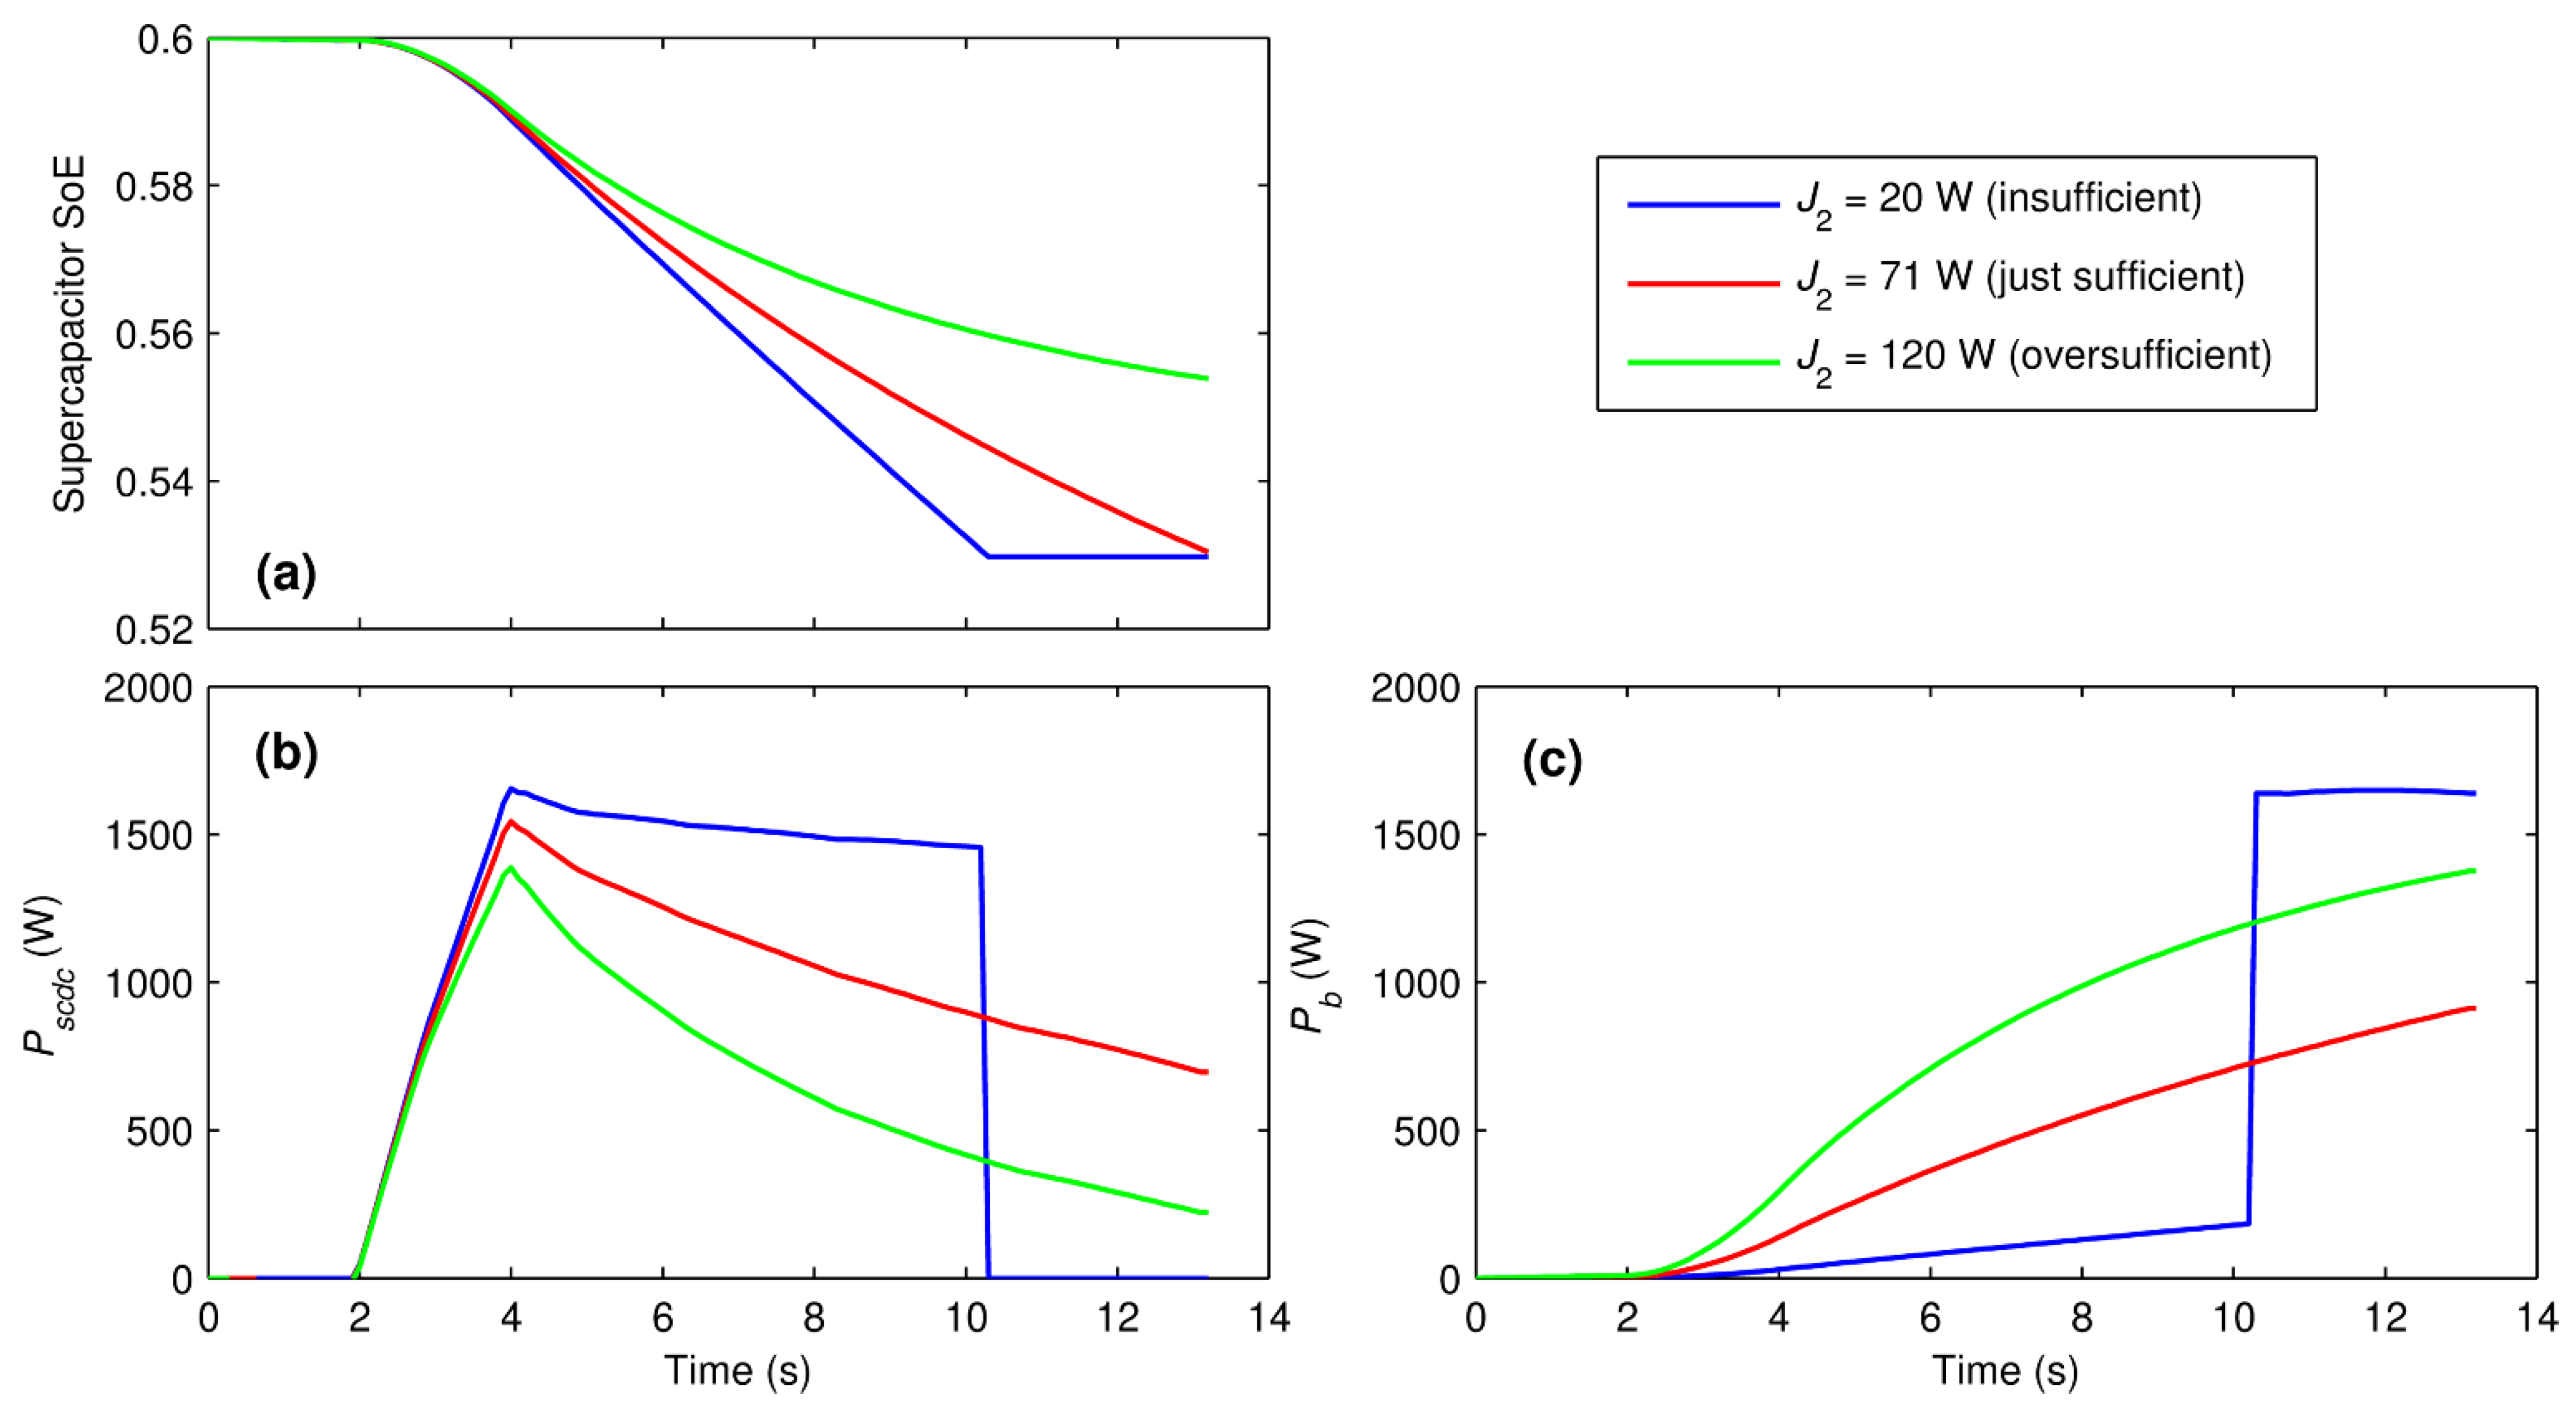
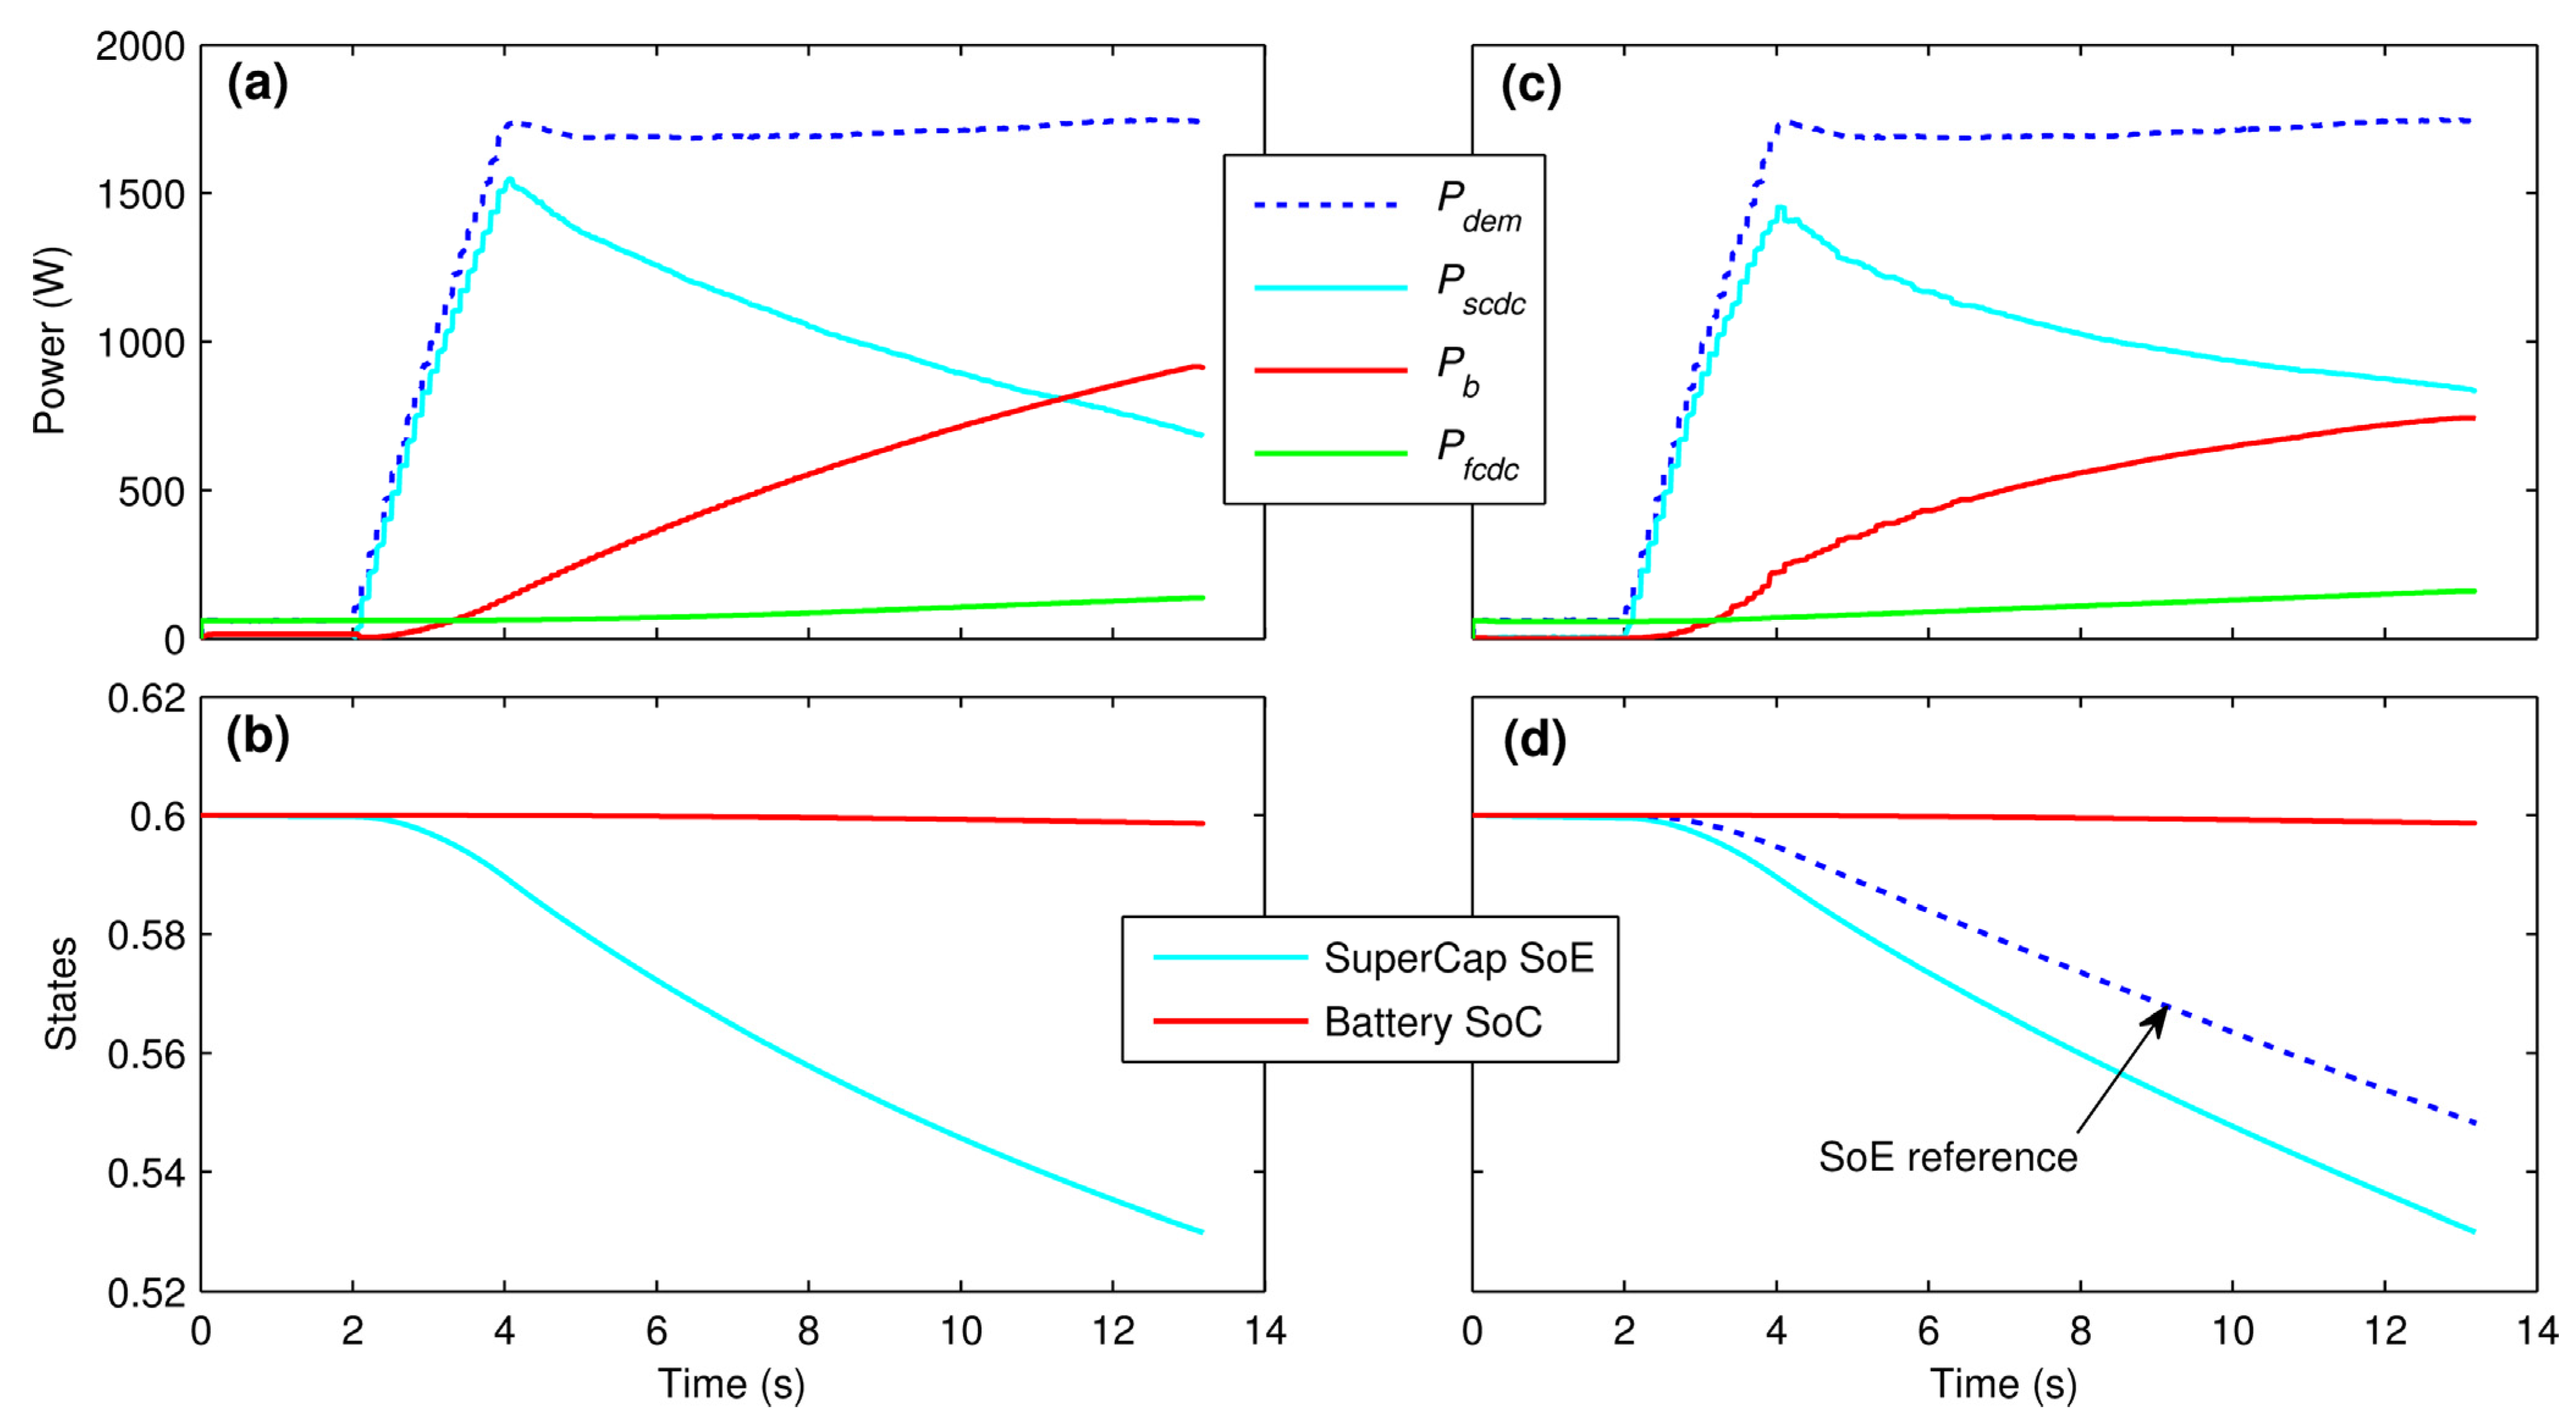
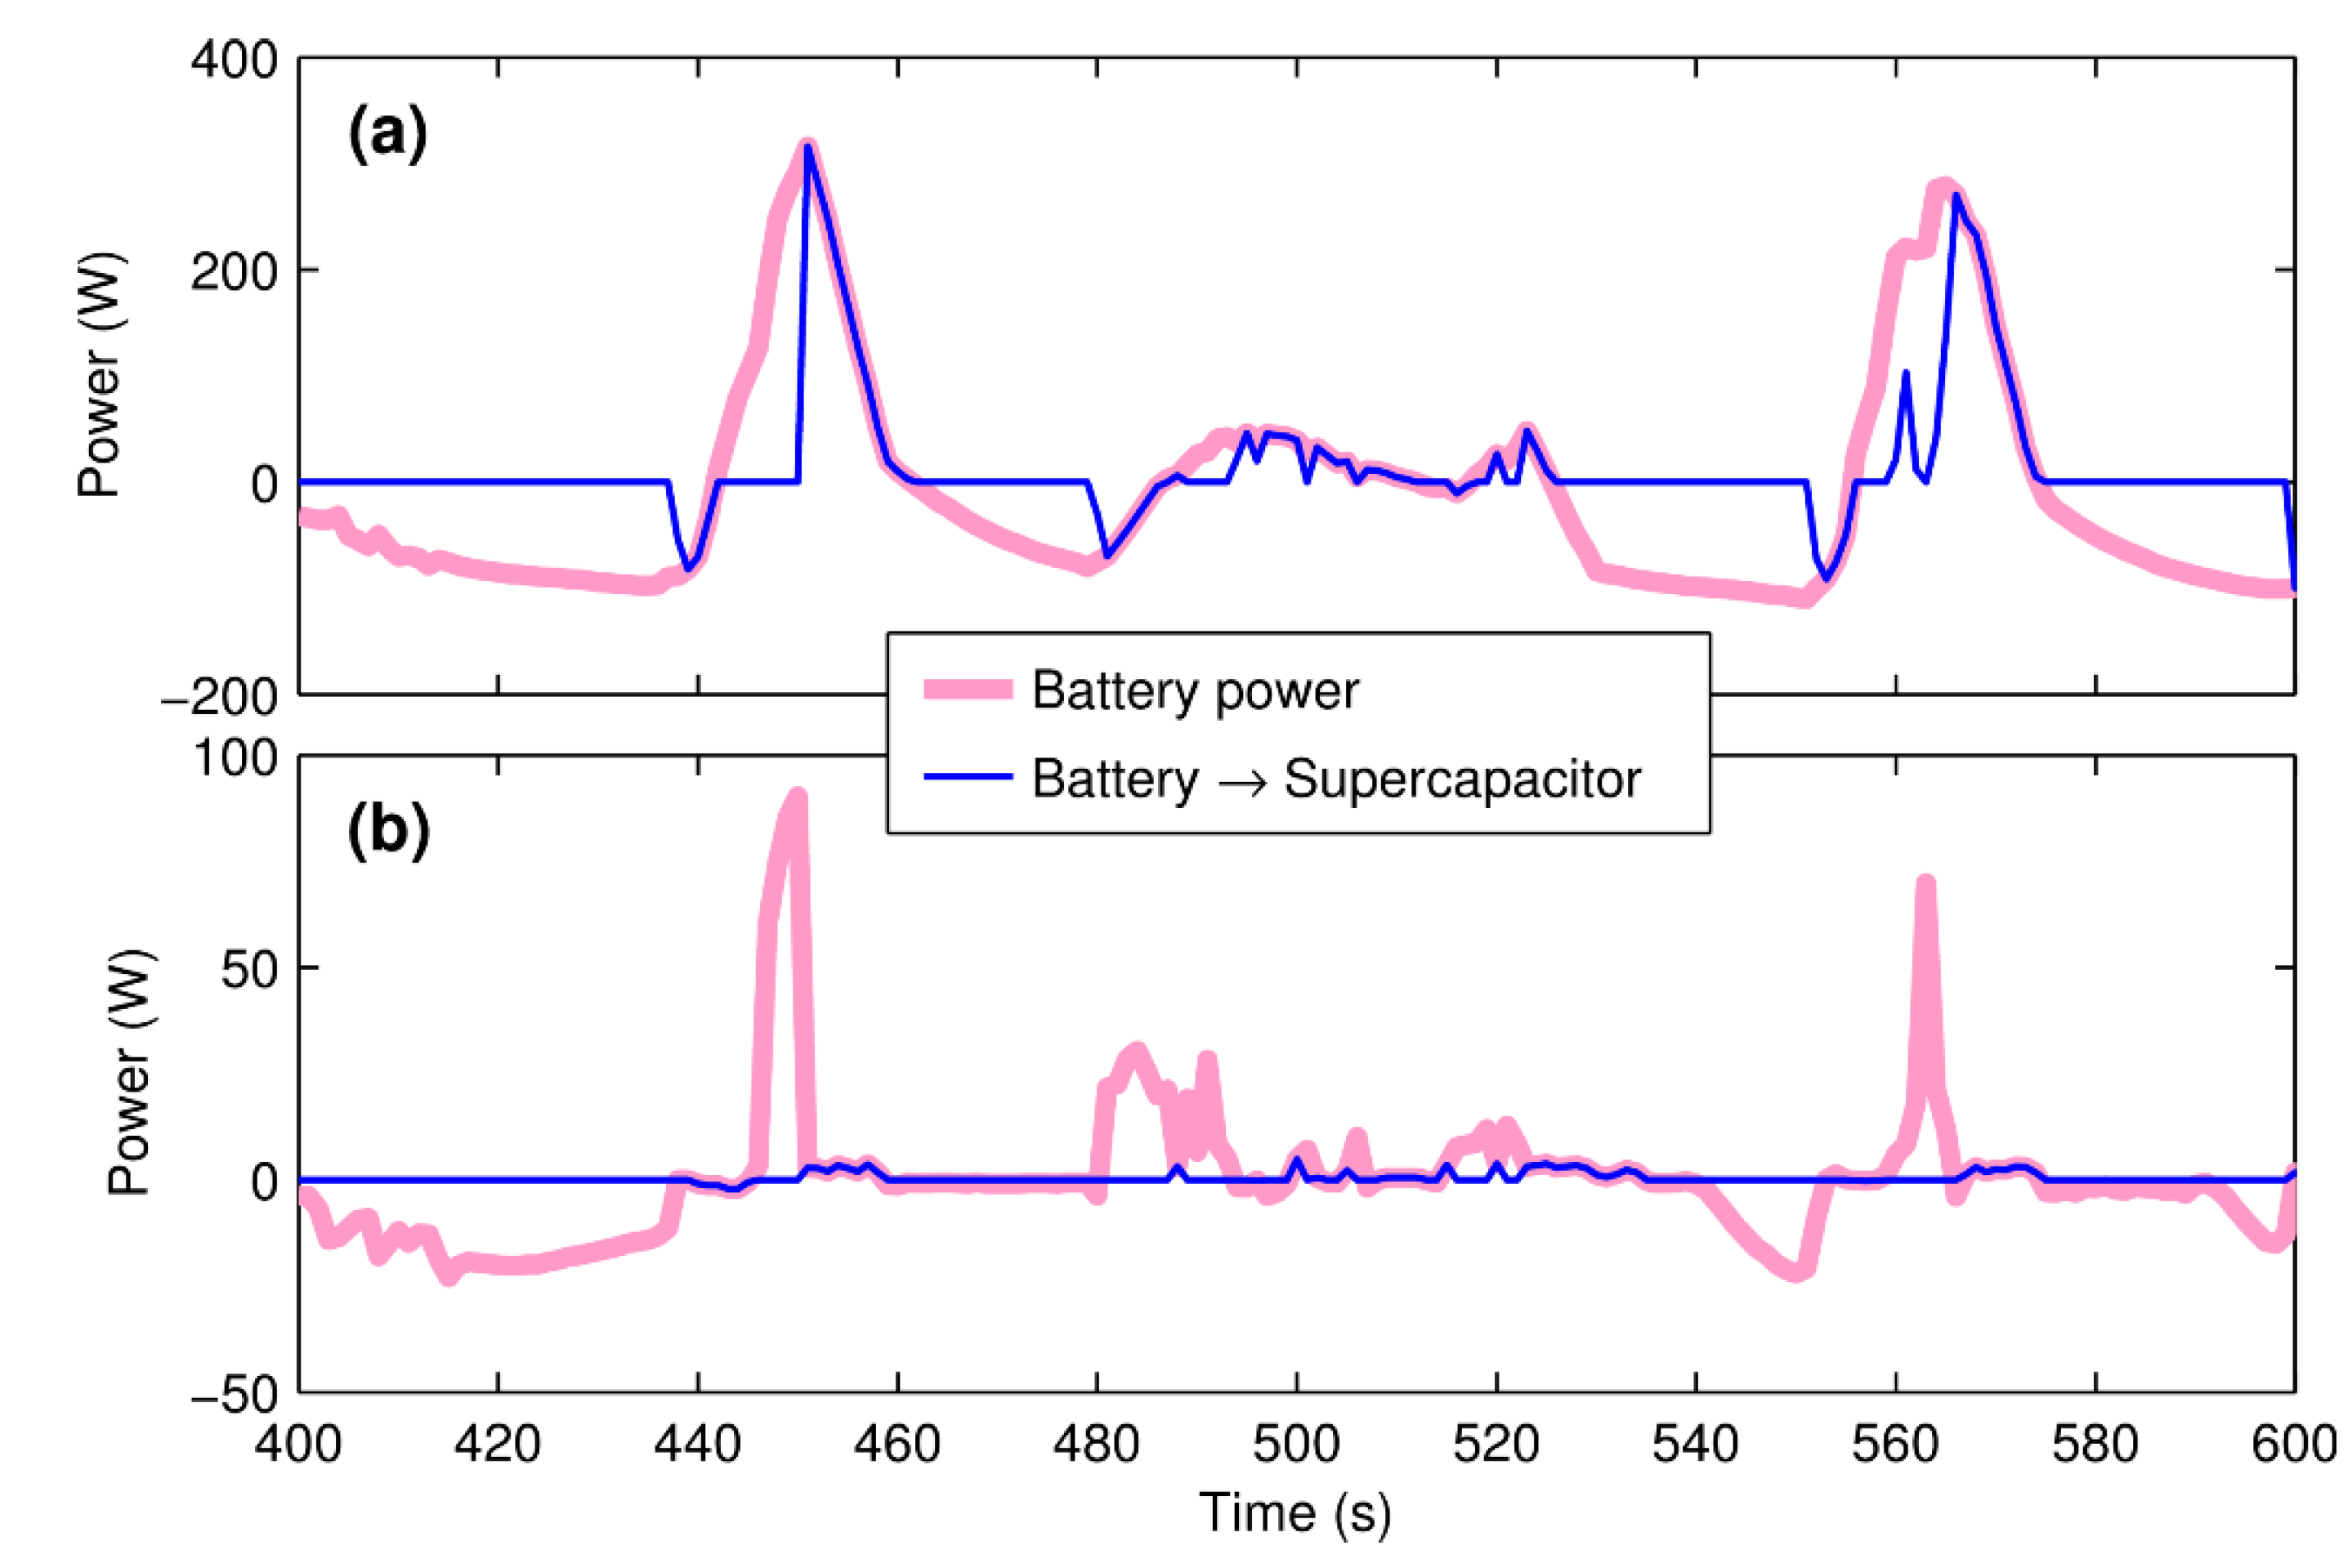
- (1)
- Pdem > 0 and Pfcdc < Pdem (Pess > 0): both FCS and ESS provide the demand.
- (2)
- Pdem > 0 and Pfcdc > Pdem (Pess < 0): FCS provides the whole demand and charges the ESS.
- (3)
- Pdem < 0 (i.e., regenerative braking) (Pess < 0): both FCS and load charge ESS.


6. Further Discussion
7. Conclusions
Acknowledgments
Author Contributions
Conflicts of Interest
References
- Veziroglu, A.; Macario, R. Fuel cell vehicles: State of the art with economic and environmental concerns. Int. J. Hydrog. Energy 2011, 36, 25–43. [Google Scholar] [CrossRef]
- Fuel Cell Technology Challenges—US Department of Energy. Available online: http://www.energy.gov (accessed on 10 March 2015).
- Pei, P.; Chang, Q.; Tang, T. A quick evaluating method for automotive fuel cell lifetime. Int. J. Hydrog. Energy 2008, 33, 3829–3836. [Google Scholar] [CrossRef]
- Pei, P.; Chen, H. Main factors affecting the lifetime of Proton Exchange Membrane fuel cells in vehicle applications: A review. Appl. Energy 2014, 125, 60–75. [Google Scholar] [CrossRef]
- Broussely, M.; Biensan, P.; Bonhomme, F.; Blanchard, P.; Herreyre, S.; Nechev, K.; Staniewicz, R.J. Main aging mechanisms in Li ion batteries. J. Power Sources 2005, 146, 90–96. [Google Scholar] [CrossRef]
- Ecker, M.; Nieto, N.; Käbitz, S.; Schmalstieg, J.; Blanke, H.; Warnecke, A.; Sauer, D.U. Calendar and cycle life study of Li(NiMnCo)O2-based 18650 lithium-ion batteries. J. Power Sources 2014, 248, 839–851. [Google Scholar] [CrossRef]
- Burke, A.F. Batteries and ultracapacitors for electric, hybrid, and fuel cell vehicles. Proc. IEEE 2007, 95, 806–820. [Google Scholar] [CrossRef]
- Bubna, P.; Advani, S.G.; Prasad, A.K. Integration of batteries with ultracapacitors for a fuel cell hybrid transit bus. J. Power Sources 2012, 199, 360–366. [Google Scholar] [CrossRef]
- Hu, X.; Johannesson, L.; Murgovski, N.; Egardt, B. Longevity-conscious dimensioning and power management of the hybrid energy storage system in a fuel cell hybrid electric bus. Appl. Energy 2015, 137, 913–924. [Google Scholar] [CrossRef]
- Odeim, F.; Roes, J.; Wülbeck, L.; Heinzel, A. Power management optimization of fuel cell/battery hybrid vehicles with experimental validation. J. Power Sources 2014, 252, 333–343. [Google Scholar] [CrossRef]
- Wang, X.; He, H.; Sun, F.; Sun, X.; Tang, H. Comparative study on different energy management strategies for plug-in hybrid electric vehicles. Energies 2013, 6, 5656–5675. [Google Scholar] [CrossRef]
- Han, J.; Charpentier, J.F.; Tang, T. An energy management system of a fuel cell/battery hybrid boat. Energies 2014, 7, 2799–2820. [Google Scholar] [CrossRef]
- Simmons, K.; Guezennec, Y.; Onori, S. Modeling and energy management control design for a fuel cell hybrid passenger bus. J. Power Sources 2014, 246, 736–746. [Google Scholar] [CrossRef]
- Maalej, K.; Kelouwani, S.; Agbossou, K.; Dubé, Y. Enhanced fuel cell hybrid electric vehicle power sharing method based on fuel cost and mass estimation. J. Power Sources 2014, 248, 668–678. [Google Scholar] [CrossRef]
- Andreasen, S.J.; Ashworth, L.; Sahlin, S.; Jensen, H.B.; Kær, S.K. Test of hybrid power system for electrical vehicles using a lithium-ion battery pack and a reformed methanol fuel cell range extender. Int. J. Hydrog. Energy 2014, 39, 1856–1863. [Google Scholar] [CrossRef]
- Ansarey, M.; Panahi, M.S.; Ziarati, H.; Mahjoob, M. Optimal energy management in a dual-storage fuel-cell hybrid vehicle using multi-dimensional dynamic programming. J. Power Sources 2014, 250, 359–371. [Google Scholar] [CrossRef]
- Thounthonga, P.; Raël, S.; Davat, B. Energy management of fuel cell/battery/supercapacitor hybrid power source for vehicle applications. J. Power Sources 2009, 193, 376–385. [Google Scholar] [CrossRef]
- Gao, D.; Jin, Z.; Lu, Q. Energy management strategy based on fuzzy logic for a fuel cell hybrid bus. J. Power Sources 2008, 185, 311–317. [Google Scholar] [CrossRef]
- Li, Q.; Chen, W.; Li, Y.; Liu, S.; Huang, J. Energy management strategy for fuel cell/battery/ultracapacitor hybrid vehicle based on fuzzy logic. Int. J. Electr. Power Energy Syst. 2012, 43, 514–525. [Google Scholar] [CrossRef]
- Paladini, V.; Donateo, T.; de Risi, A.; Laforgia, D. Super-capacitors fuel-cell hybrid electric vehicle optimization and control strategy development. Energy Convers. Manag. 2007, 48, 3001–3008. [Google Scholar] [CrossRef]
- Erdinc, O.; Vural, B.; Uzunoglu, M. A wavelet-fuzzy logic based energy management strategy for a fuel cell/battery/ultra-capacitor hybrid vehicular power system. J. Power Sources 2009, 194, 369–380. [Google Scholar] [CrossRef]
- Ayad, M.Y.; Becherif, M.; Henni, A. Vehicle hybridization with fuel cell, supercapacitors and batteries by sliding mode control. Renew. Energy 2011, 36, 2627–2634. [Google Scholar] [CrossRef]
- Amin; Bambang, R.T.; Rohman, A.S.; Dronkers, C.J.; Ortega, R.; Sasongko, A. Energy management of fuel cell/battery/supercapacitor hybrid power sources using Model Predictive Control. IEEE Trans. Industr. Inform. 2014, 10, 1192–2002. [Google Scholar] [CrossRef]
- Wipke, K.B.; Cuddy, M.R.; Burch, S.D. ADVISOR 2.1: A user-friendly advanced powertrain simulation using a combined backward/forward approach. IEEE Trans. Veh. Technol. 1999, 48, 1751–1761. [Google Scholar] [CrossRef]
- Guzzella, L.; Sciarretta, A. Vehicle Propulsion Systems, Introduction to Modeling and Optimization; Springer-Verlag: Berlin, Germany, 2005; pp. 13–17. [Google Scholar]
- The Citaro FuelCELL Hybrid—Mercedes-Benz. Available online: http://www.mercedes-benz.de (accessed on 10 March 2015).
- Emission Test Cycles: Manhattan Bus Cycle—DieselNet. Available online: http://www.dieselnet.com (accessed on 10 March 2015).
- Gunther, S.; Ulbrich, S.; Hofmann, W. Driving cycle-based optimization of interior permanent magnet synchronous motor drives for electric vehicle application. In Proceedings of International Symposium on Power Electronics, Electrical Drives, Automation and Motion, Ischia, Italy, 18–20 June 2014; pp. 25–30.
- Tazelaar, E.; Veenhuizen, B.; van den Bosch, P.; Grimminck, M. Analytical solution of the energy management for fuel cell hybrid propulsion systems. IEEE Trans. Veh. Technol. 2012, 61, 1986–1998. [Google Scholar] [CrossRef]
- Idaho National Engineering and Environmental Laboratory (INEEL). FreedomCAR Battery Test Manual for Power-Assist Hybrid Electric Vehicles; INEEL: Idaho Falls, ID, USA, 2003. [Google Scholar]
- BMOD0500P016B02 Datasheet—Maxwell Technologies. Available online: http://www.maxwell.com (accessed on 10 March 2015).
- Hegazy, O.; van Mierlo, J.; Lataire, P. Analysis, modeling, and implementation of a multidevice interleaved DC/DC converter for fuel cell hybrid electric vehicles. IEEE Trans. Power Electron. 2012, 24, 4445–4458. [Google Scholar] [CrossRef]
- Pukrushpan, J.T.; Stefanopoulou, A.G.; Peng, H. Modeling and control for PEM fuel cell stack system. In Proceedings of American Control Conference, Anchorage, AK, USA, 8–10 May 2002; pp. 3117–3122.
- Boscaino, V.; Liga, R.; Miceli, R.; Cavallaro, C.; Raciti, A. Automotive brushless motor powered by fuel cell. In Proceedings of International Conference on Electrical Machines, Berlin, Germany, 2–5 September 2014; pp. 699–704.
- Hu, X.; Li, S.; Peng, H. A comparative study of equivalent circuit models for Li-ion batteries. J. Power Sources 2012, 198, 359–367. [Google Scholar] [CrossRef]
- Devillers, N.; Jemei, S.; Péra, M.C.; Bienaimé, D.; Gustin, F. Review of characterization methods for supercapacitor modelling. J. Power Sources 2014, 246, 596–608. [Google Scholar] [CrossRef]
- Odeim, F.; Roes, J.; Heinzel, A. Power management optimization of a fuel cell/battery/supercapacitor hybrid system for transit bus applications. IEEE Trans. Veh. Technol. 2015. under review. [Google Scholar]
- Schiffer, J.; Bohlen, O.; de Doncker, R.W.; Sauer, D.U.; Young, A.K. Optimized energy management for fuelcell-supercap hybrid electric vehicles. In Proceedings of IEEE Vehicle Power and Propulsion Conference, Chicago, IL, USA, 7–9 September 2005; pp. 341–348.
- Deb, K. Multi-Objective Optimization Using Evolutionary Algorithms; John Wiley & Sons Ltd.: Chichester, UK, 2001. [Google Scholar]
- Gen, M.; Cheng, R. Genetic Algorithms and Engineering Optimization; John Wiley & Sons Ltd.: New York, NY, USA, 2000; pp. 97–115. [Google Scholar]
- Fang, L.; Qin, S.; Xu, G.; Li, T.; Zhu, K. Simultaneous optimization for hybrid electric vehicle parameters based on multi-objective genetic algorithms. Energies 2011, 4, 532–544. [Google Scholar] [CrossRef]
- Global Optimization Toolbox, User’s Guide—MathWorks. Available online: http://www.mathworks.com (accessed on 10 March 2015).
- Marano, V.; Onori, S.; Guezennec, Y.; Rizzoni, G.; Madella, N. Lithium-ion batteries life estimation for plug-in hybrid electric vehicles. In Proceedings of IEEE Vehicle Power and Propulsion Conference, Dearborn, MI, USA, 7–10 September 2009; pp. 536–543.
- Schmalstieg, J.; Käbitz, S.; Ecker, M.; Sauer, D.U. A holistic aging model for Li(NiMnCo)O2 based 18650 lithium-ion batteries. J. Power Sources 2014, 257, 325–334. [Google Scholar] [CrossRef]
© 2015 by the authors; licensee MDPI, Basel, Switzerland. This article is an open access article distributed under the terms and conditions of the Creative Commons Attribution license (http://creativecommons.org/licenses/by/4.0/).
Share and Cite
Odeim, F.; Roes, J.; Heinzel, A. Power Management Optimization of an Experimental Fuel Cell/Battery/Supercapacitor Hybrid System. Energies 2015, 8, 6302-6327. https://doi.org/10.3390/en8076302
Odeim F, Roes J, Heinzel A. Power Management Optimization of an Experimental Fuel Cell/Battery/Supercapacitor Hybrid System. Energies. 2015; 8(7):6302-6327. https://doi.org/10.3390/en8076302
Chicago/Turabian StyleOdeim, Farouk, Jürgen Roes, and Angelika Heinzel. 2015. "Power Management Optimization of an Experimental Fuel Cell/Battery/Supercapacitor Hybrid System" Energies 8, no. 7: 6302-6327. https://doi.org/10.3390/en8076302