3.1. Simulation Parameters
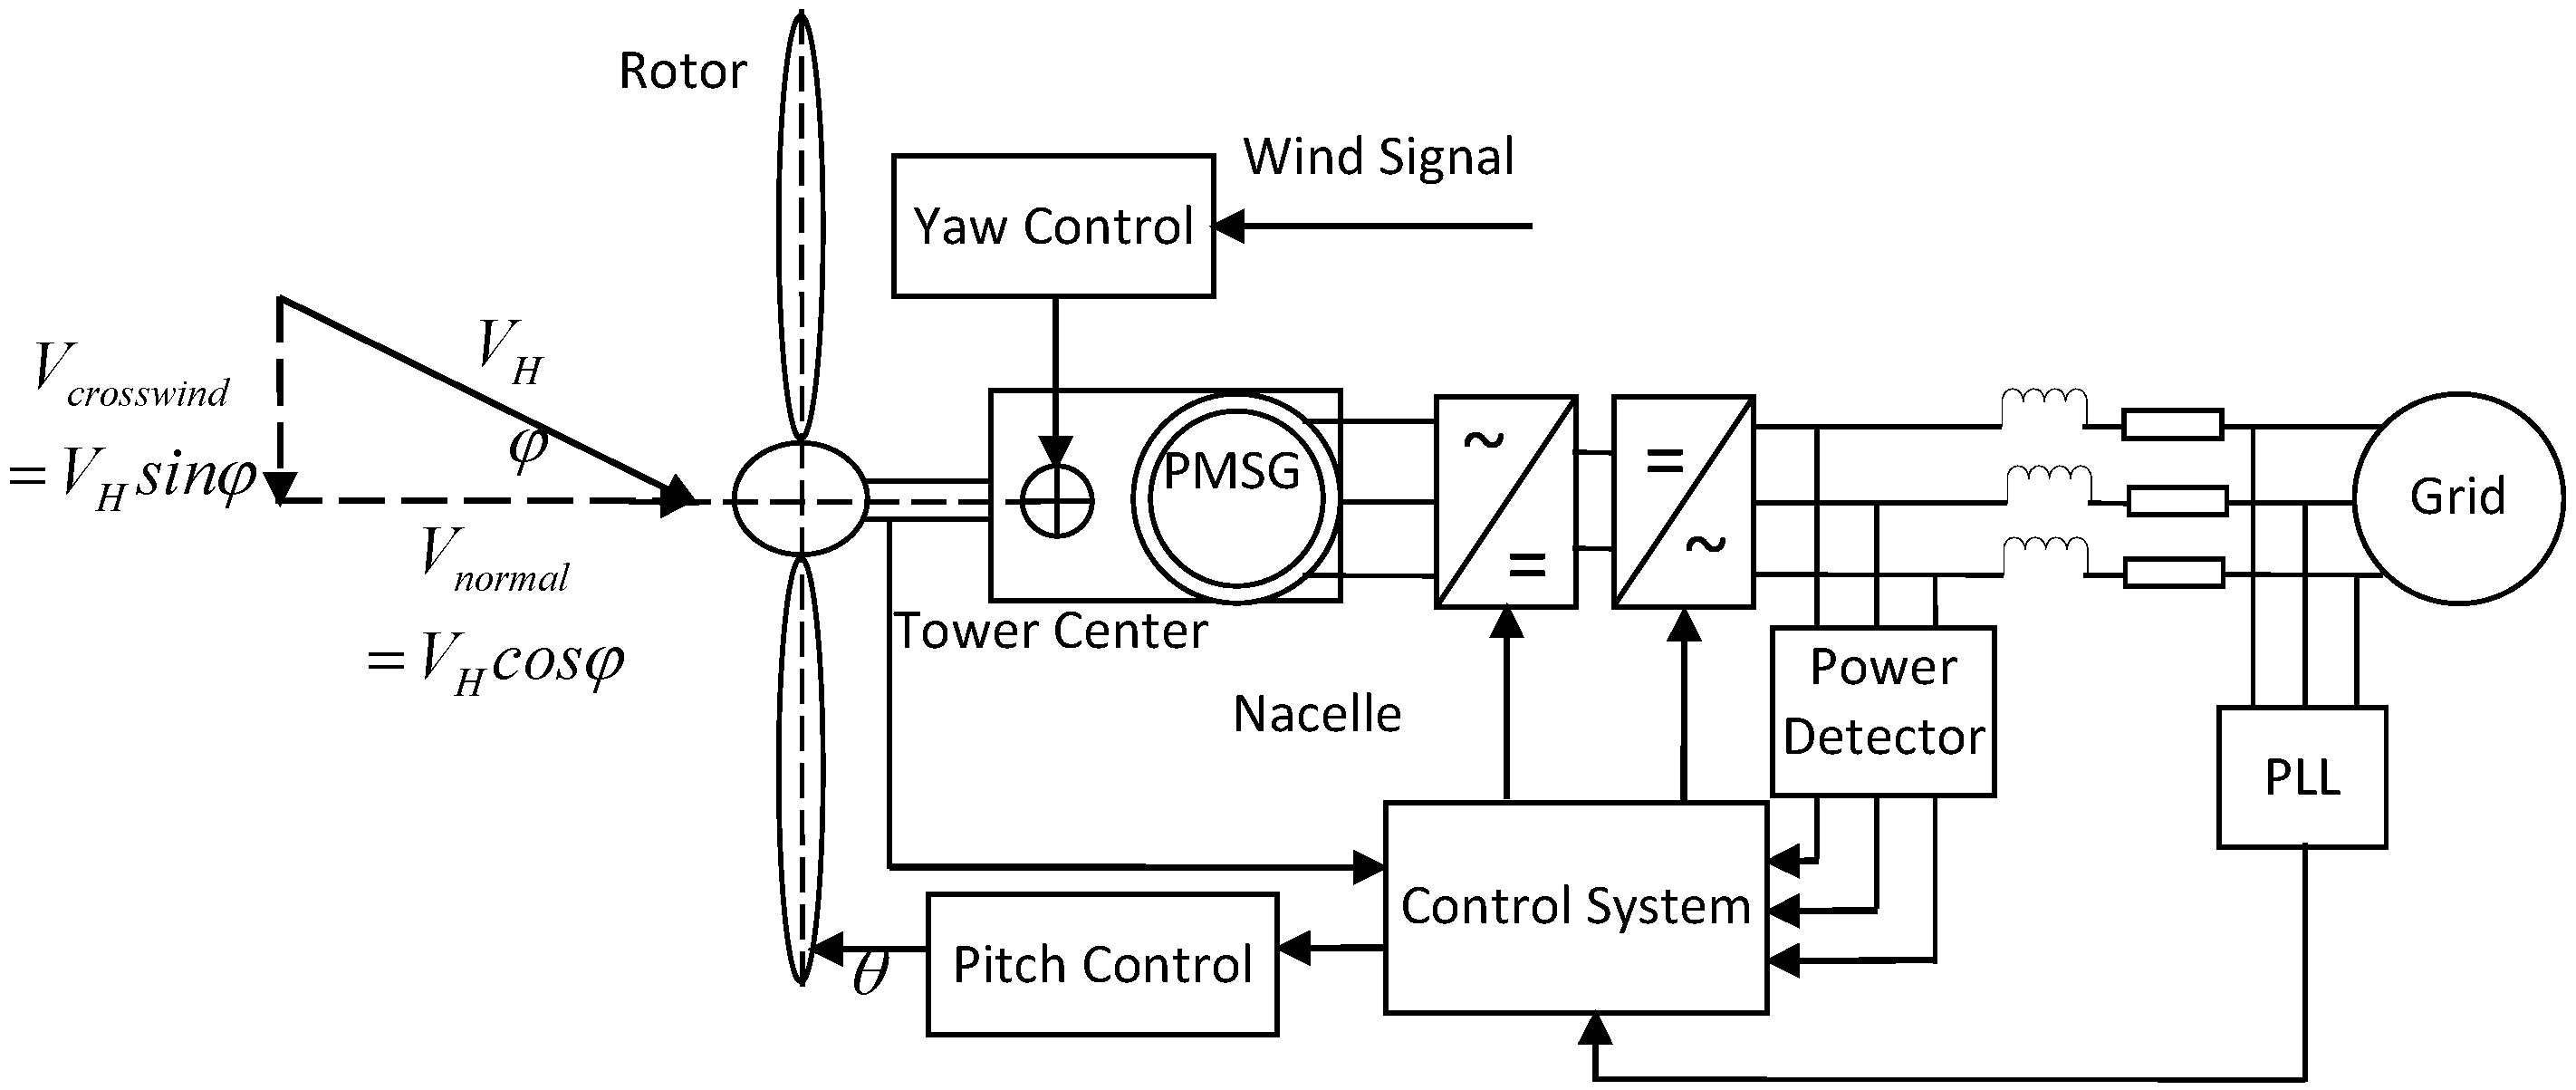
This paper considers a 2.5 MW permanent-magnet direct-drive synchronous wind turbine located on a wind farm in southern China as an example for data acquisition and simulation analysis. The wind turbine is located in the plateau and hilly area on an S-type wind farm, where the air density is low. On the wind farm, vegetation growth is very prosperous, and the terrain is rolling. Consequently, the wind shear exponent is large. Thus, the wind speed and wind direction change frequently due to the climate and terrain or other factors. The parameters of the wind turbine and wind farm are shown in
Table 2.
Table 2.
Parameters of the 2.5 MW permanent-magnet direct-drive synchronous wind turbine.
Table 2.
Parameters of the 2.5 MW permanent-magnet direct-drive synchronous wind turbine.
| Parameters of the Wind Turbine | Value |
|---|
| Blades | 3 |
| Rotor diameter | 113 m |
| Rated power | 2500 kW |
| Cut-in wind speed | 3 m/s |
| Cut-out wind speed | 22 m/s |
| Rated wind speed | 10.5 m/s |
| Mean wind speed for the wind farm | 7 m/s |
| Maximum rotor power coefficient | 0.500422 |
| Optimal tip speed ratio | 8.7 |
| Rated speed | 13 r/min |
| Center height of the hub | 87 m |
| Tower(conical) outside diameter | 4630/3040 mm |
| Minimum distance from the tip to the tower | 5.2 m |
| Rated torque | 2010 kNm |
| Air density | 1.065 kg/m3 |
| Wind shear exponent | 0.4 |
The wind turbine control strategy can be divided into three stages according to the wind speed: Below the rated speed, below the rated power and constant rated power. In the below rated speed stage, the wind turbine operates at the optimal tip speed ratio and achieves the maximum rotor power coefficient. The rotor speed matches the changes in the wind speed by adjusting the generator torque. In the below rated power stage, the rotor speed has already reached the rated speed and remains constant; however, the output power is less than the rated power. In addition, the rotor aerodynamic torque matches the changes in the wind speed in this stage by adjusting the generator torque while using the rotor speed as a control parameter. In the constant rated power stage, the wind speed is sufficiently strong for the wind turbine to run at its rated power and the generator torque to remain at the rated torque. In this stage, the pitch angle is adjusted to match the rotor aerodynamic torque to the generator torque. In different stages, the wind turbine running characteristics and the control parameters are different. In this paper, the effects of yaw error on running characteristics are determined during different stages.
3.2. Analysis of the Effects of Yaw Error on Rotor Torque
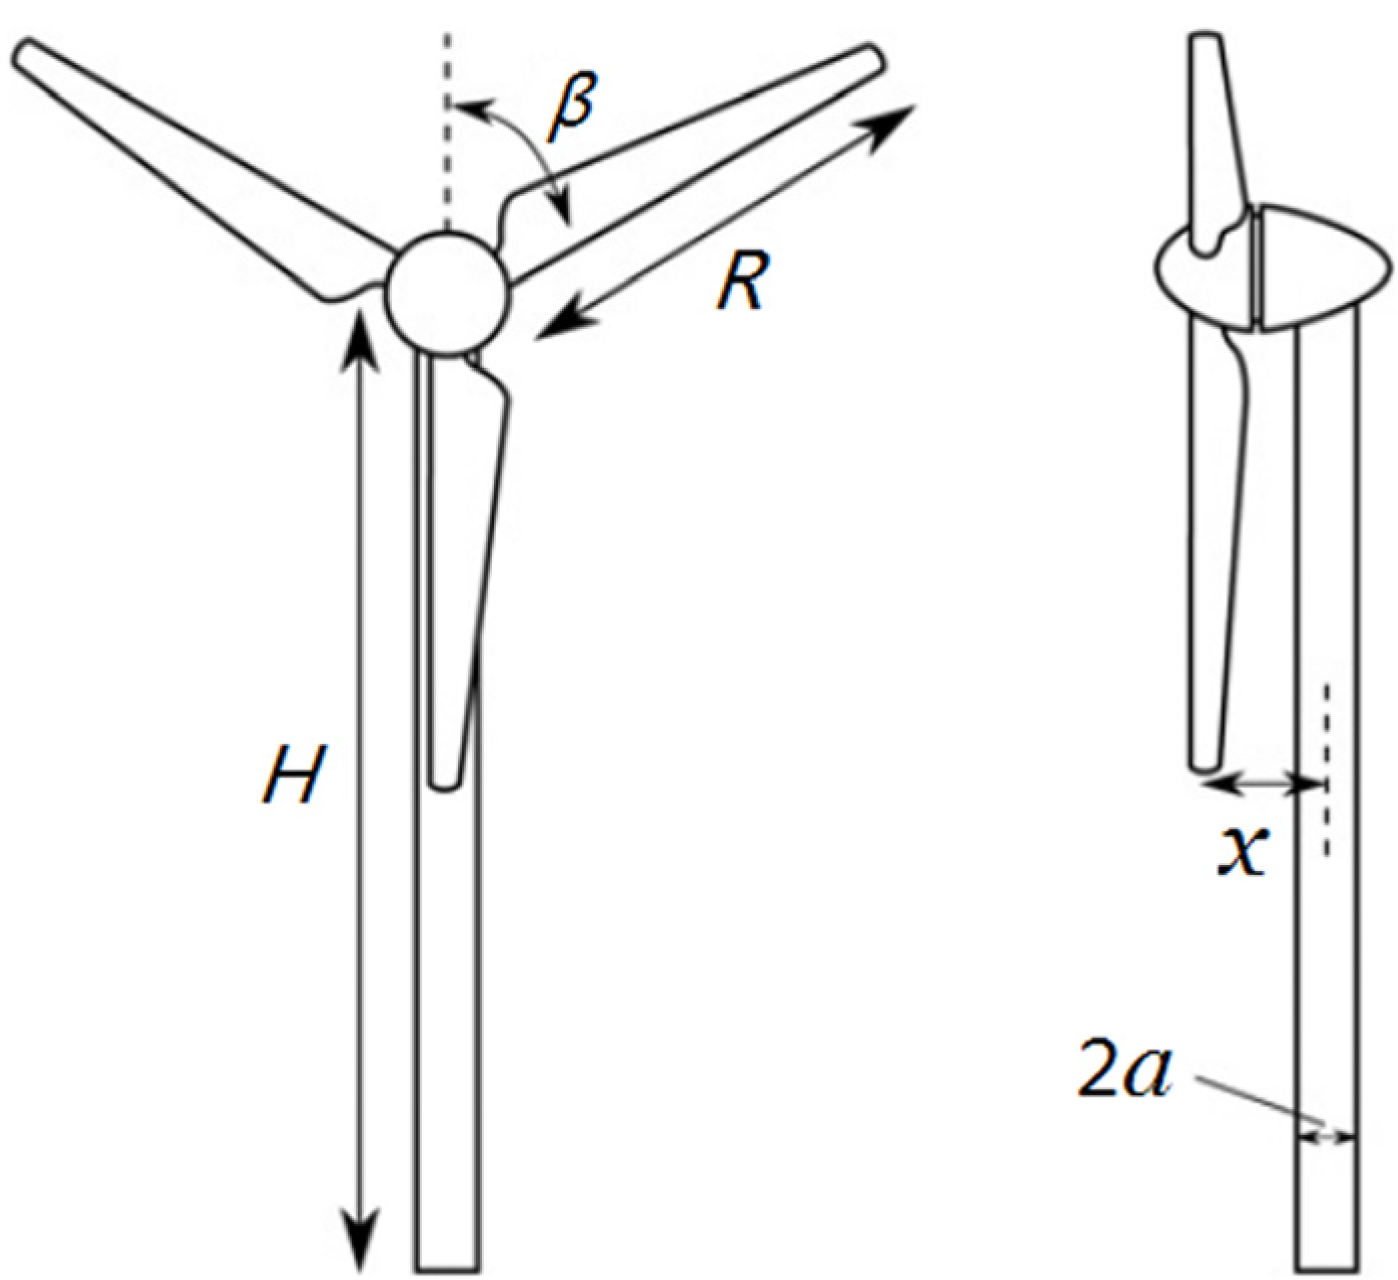
As discussed above, in the below rated speed and below rated power stages, the wind turbine is controlled by adjusting the generator torque. However, in the constant rated power stage, the wind turbine is controlled by adjusting the aerodynamic torque captured from the wind to match the generator torque. Therefore, the torque ripple has very important effects on the operation and control of the wind turbine. According to the equivalent wind speed model and the yaw error model, the rotor aerodynamic torque can be expressed as follows:
Equation (13) shows that the rotor aerodynamic torque is a function of the blade azimuth angle β and yaw error angle φ. β undergoes periodic variations as the rotor rotates and can be converted into a temporal parameter such that the rotor aerodynamic torque also varies periodically with time. The ideal constant torque T0 results from the mean wind speed without considering the wind shear, tower shadow and yaw error, and Tc is the total aerodynamic torque coefficient.
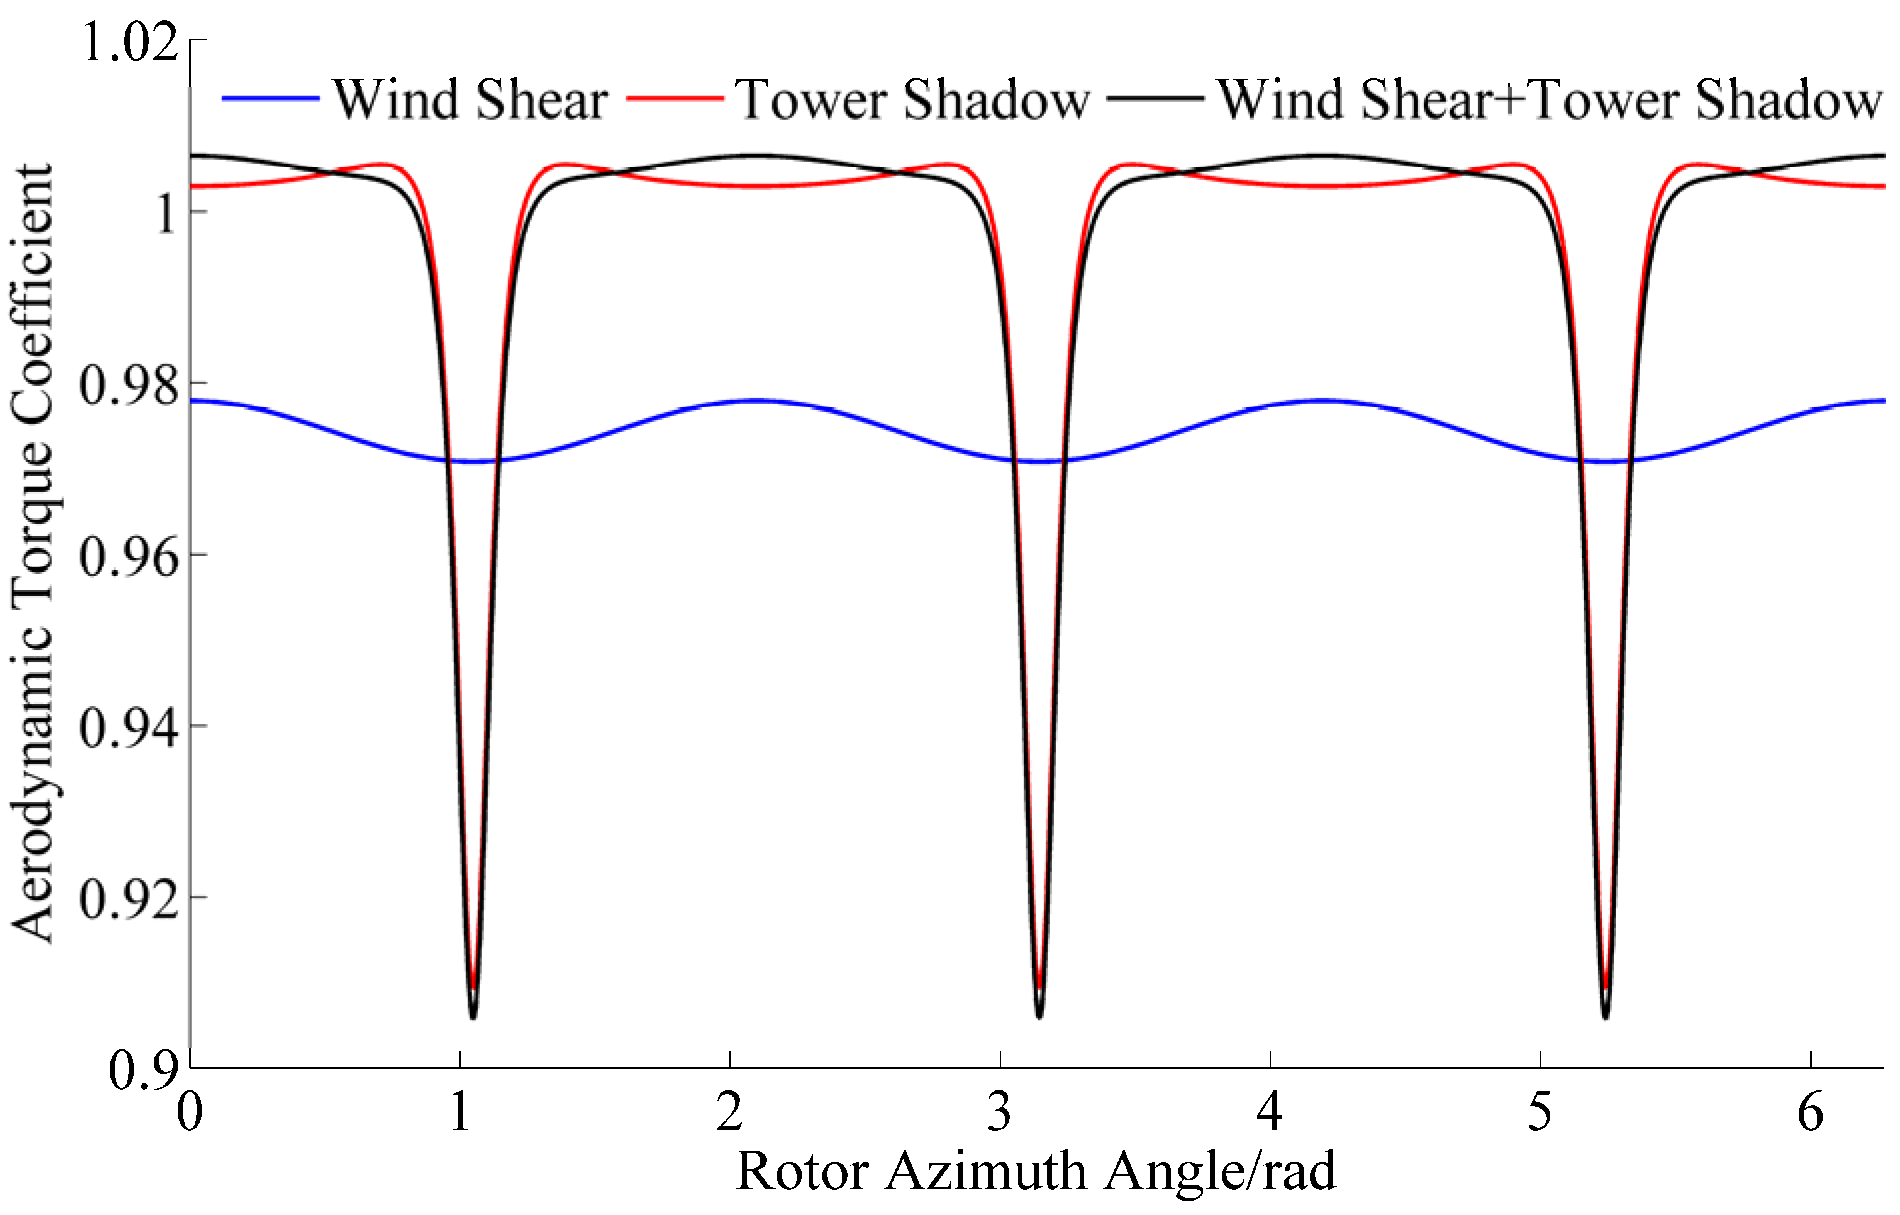
The effects of wind shear and tower shadow on the aerodynamic torque coefficient are shown in
Figure 3. A 3P pulsation in the aerodynamic torque is clearly observed. The effect on the torque ripple of wind shear alone is approximately 0.7%, that of tower shadow alone is approximately 9%, and the total effect is approximately 10%. A similar conclusion was also obtained in Ref. [
21].
Figure 4 shows the effects on the total aerodynamic torque coefficient of the yaw error based on the equivalent wind speed model.
Table 3 presents the values of the total aerodynamic torque coefficient oscillations. It is observed that, the ripple of the total aerodynamic torque coefficient differs significantly by the azimuth angle of the rotor. When the blade is not in the tower shadow zone, the ripple of the total aerodynamic torque coefficient due to the yaw error is very small. In addition, the yaw error angles negatively affect the torque coefficient because the torque coefficient decreases as the yaw error angle increases, which is subtle. When the blade is in the tower shadow zone, the yaw error angle positively affects the torque coefficient, and the torque coefficient increases as the yaw error angle increases. The yaw error angle can restrain the ripple of the torque coefficient. As the yaw error angle increases, the restraining effect becomes significantly stronger. Although the existence of the yaw error can restrain the ripple of the torque coefficient, the effect of the yaw error on the total aerodynamic torque increases markedly as the yaw error angle increases.
Figure 3.
Effects of wind shear and tower shadow on the aerodynamic torque coefficient.
Figure 3.
Effects of wind shear and tower shadow on the aerodynamic torque coefficient.
Figure 4.
Variation in Tc due to yaw error.
Figure 4.
Variation in Tc due to yaw error.
Table 3.
Tc oscillation values.
Table 3.
Tc oscillation values.
| Yaw Error | Blade not in the Tower Shadow Zone | Blade in the Tower Shadow Zone |
|---|
| 0° | 0.0065 | −0.0960 |
| 10° | 0.0062 | −0.0938 |
| 15° | 0.0060 | −0.0892 |
| 20° | 0.0056 | −0.0845 |
| 30° | 0.0049 | −0.0718 |
| 45° | 0.0031 | −0.0479 |
| 60° | 0.0015 | −0.0240 |
Furthermore, as shown in Equation (13), when the yaw error is 10°, the torque ripple is approximately 3%, and when the yaw error is 15°, the torque ripple is approximately 6.7%, which is slightly smaller than the effect on the torque ripple of the tower shadow alone. All these effects are within an acceptable range for normal operation. However, when the yaw error is larger (e.g., 30°, 45° or 60°), the torque loss is very large, and the loss rates are all greater than 25%, which strongly affects the normal operation of the wind turbine.
3.3. Analysis of the Effects of Yaw Error on Rotor Speed
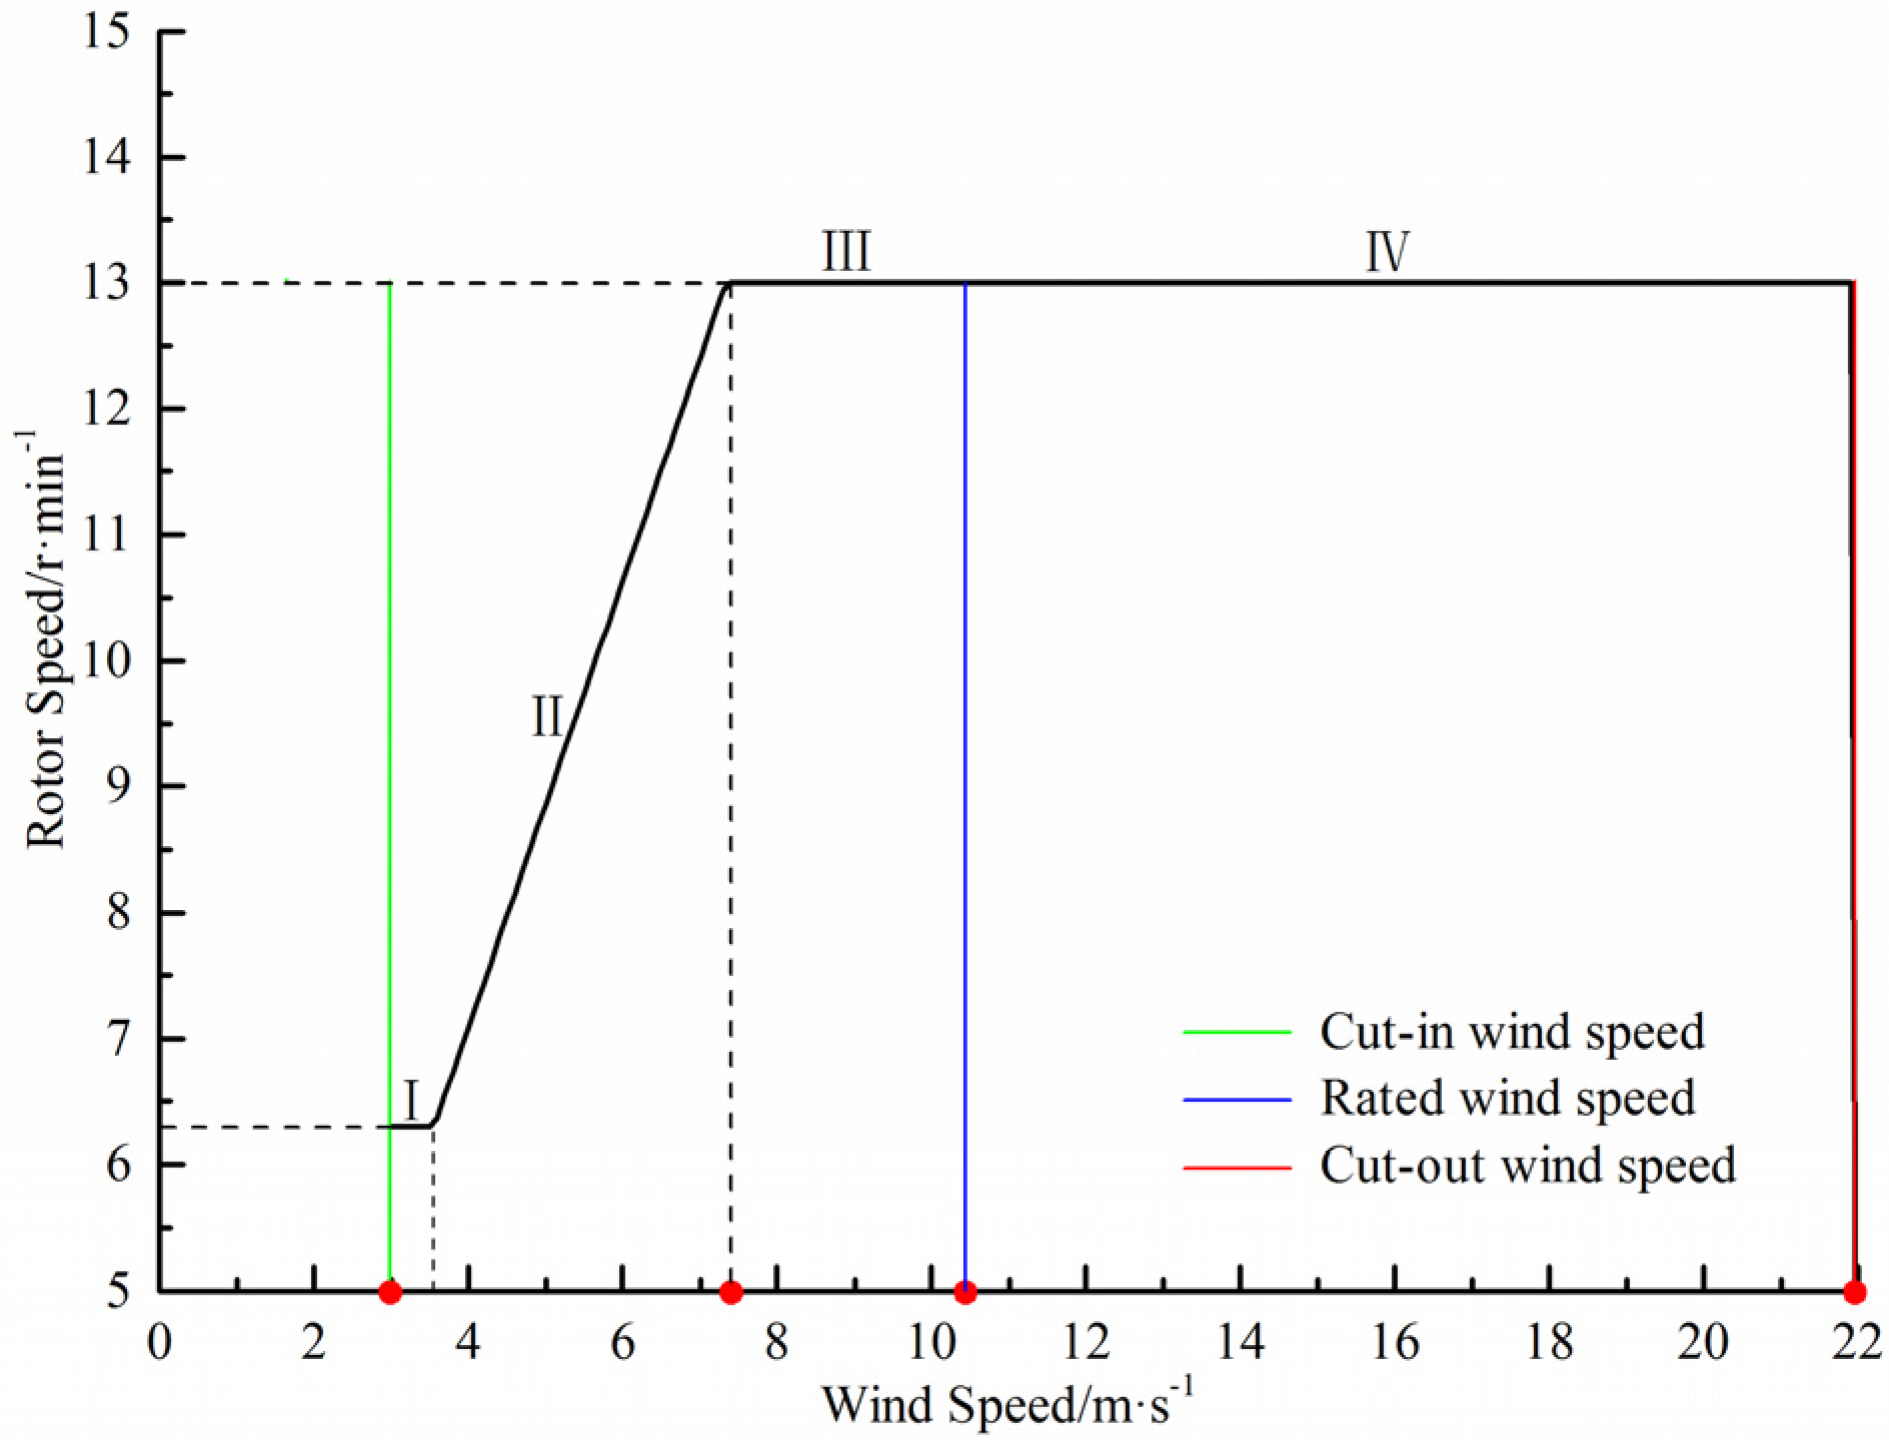
As shown in
Figure 5, the permanent-magnet direct-drive synchronous wind turbine speed control strategy can be divided into four stages: I, Startup with a constant rotor speed; II, Increasing rotor speed with increasing wind speed; III, Constant rated speed with a moderate wind speed; and IV, Constant rated speed with a high wind speed. Stage I is the start of the wind turbine, and the wind is low and varies over a narrow range; as a result, the running state of the wind turbine quickly transitions to stage II after entering stage I. Therefore, stage I is not described in this paper.
Figure 5.
Rotor speed control.
Figure 5.
Rotor speed control.
Similar to the rotor torque derivation and according to the equivalent wind speed model and the yaw error model, the rotor speed can be expressed as follows:
Equation (16) shows that the rotor speed, ωt(β,φ), is a function of the blade azimuth angle, β, and the yaw error angle, φ. The ideal constant torque, ω0, results from the mean wind speed and does not consider the wind shear, tower shadow and yaw error. Sc is the rotor speed coefficient.
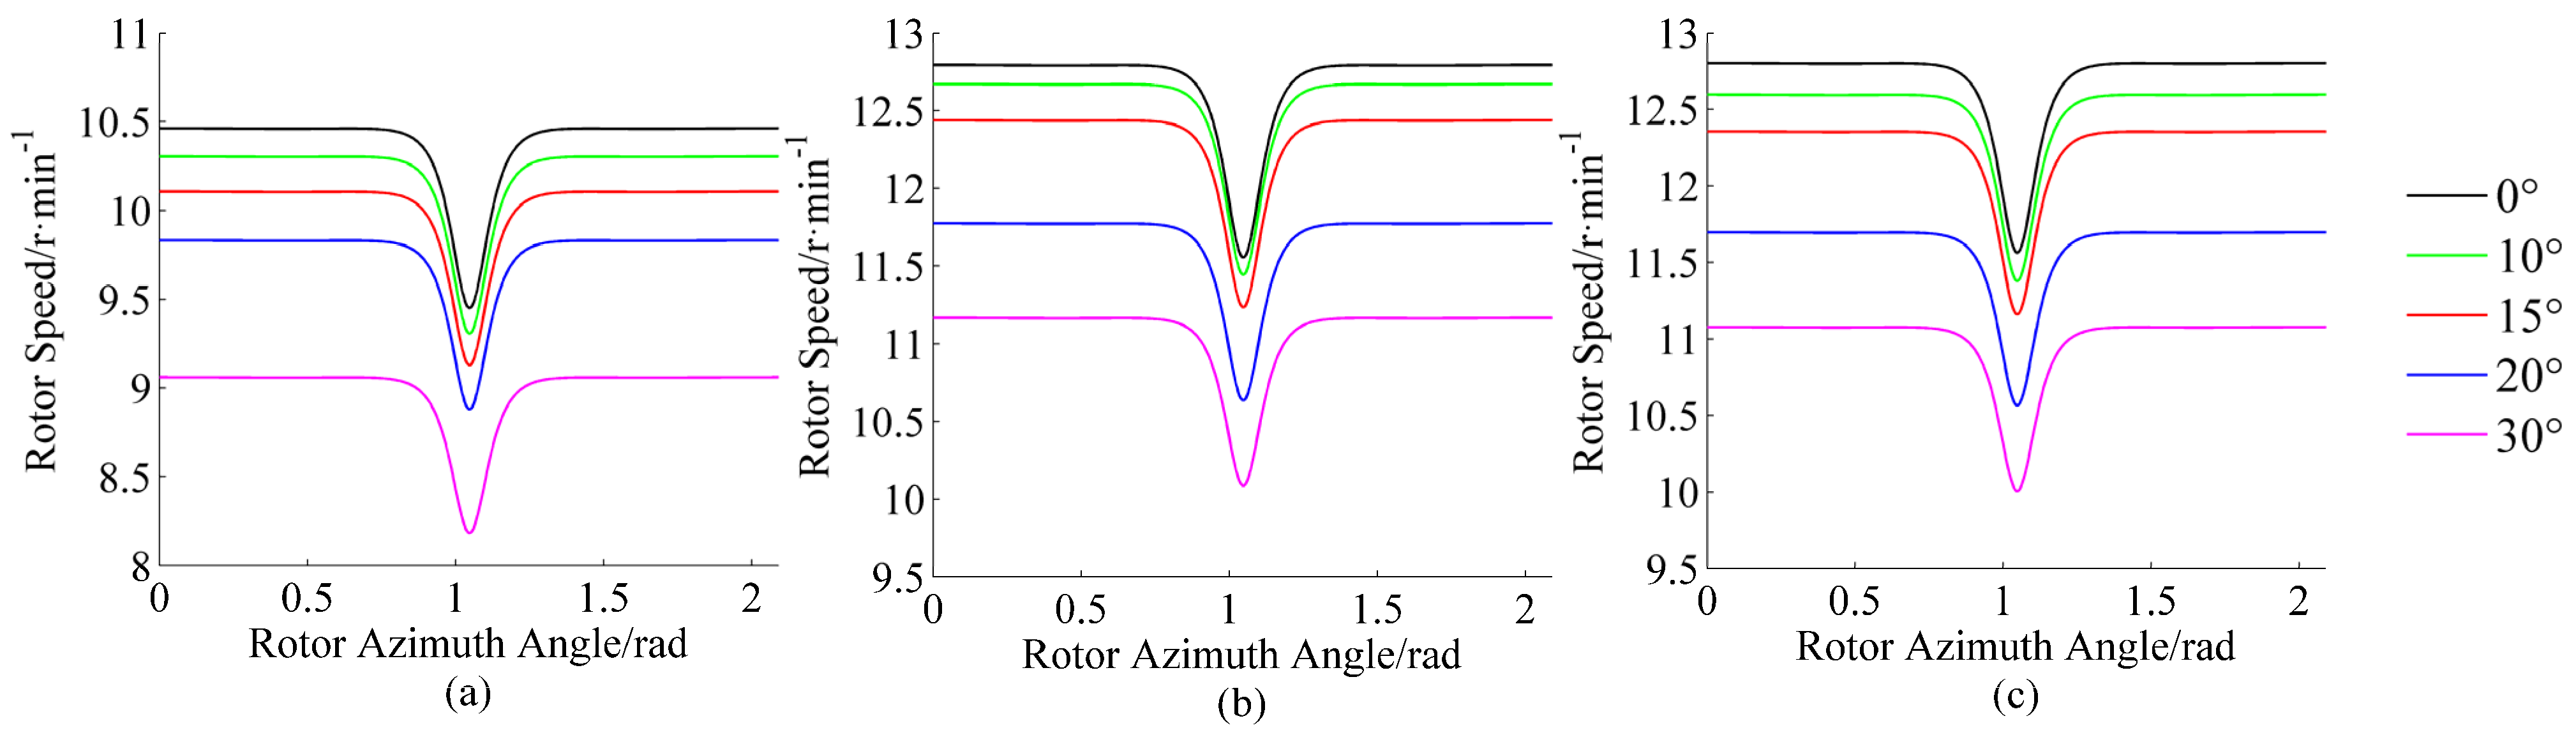
At different stages, the effects of yaw error on rotor speed at different wind speeds are shown in
Figure 6 and
Table 4. In stage II, the wind speed is lower than 7.4 m/s and the rotor speed has not reached the rated speed. In this stage, the tip speed ratio will remain at the optimum value. As shown in
Figure 6a, the wind speed
VH = 7 m/s, when the yaw error is 10°, the rotor speed loss is approximately 1.44%, when the yaw error is 15°, the rotor speed loss is approximately 3.35%, and when the yaw error is 30°, the rotor speed loss reaches approximately 12.92%.
Figure 6.
Effects of yaw error on rotor speed by stage: (a) Stage II, VH = 7 m/s. (b) Stage III, VH = 10 m/s. (c) Stage IV, VH = 15 m/s.
Figure 6.
Effects of yaw error on rotor speed by stage: (a) Stage II, VH = 7 m/s. (b) Stage III, VH = 10 m/s. (c) Stage IV, VH = 15 m/s.
Table 4.
Values of rotor speed oscillation.
Table 4.
Values of rotor speed oscillation.
| Yaw Error | VH = 7 m/s | VH = 10 m/s | VH = 15 m/s |
|---|
| Rotor Speed | Speed Loss | Rotor Speed | Speed Loss | Rotor Speed | Speed Loss |
|---|
| 0° | 10.45 | 0 | 12.80 | 0 | 12.80 | 0 |
| 10° | 10.30 | 1.44% | 12.70 | 0.78% | 12.60 | 1.56% |
| 15° | 10.10 | 3.35% | 12.45 | 2.73% | 12.35 | 3.52% |
| 20° | 9.80 | 6.22% | 11.80 | 7.81% | 11.70 | 8.60% |
| 30° | 9.10 | 12.92% | 11.20 | 12.50% | 11.10 | 13.30% |
In stage III, the wind speed is between 7.4 m/s and 10.5 m/s and the rotor speed has reached the rated speed, but the wind turbine power has not yet reached the rated power. To maintain the turbine at a constant rated speed, the tip speed ratio decreases as the wind speed increases. As observed in
Figure 6b, the wind speed is
VH = 10 m/s, when the yaw error is 10°, the rotor speed loss is approximately 0.78%, when the yaw error is 15°, the rotor speed loss is approximately 2.73%, and when the yaw error is 30°, the rotor speed loss reaches approximately 12.50%.
In stage IV, the wind speed is higher than 10.5 m/s, the rotor speed has reached the rated speed, and the wind turbine power has reached the rated power. As shown in
Figure 6c, for a wind speed of
VH = 15 m/s, when the yaw error is 10°, the rotor speed loss is approximately 1.56%, when the yaw error is 15°, the rotor speed loss is approximately 3.52%, and when the yaw error is 30°, the rotor speed loss reaches approximately 13.30%.
Comparing the simulation results presented in
Figure 6, it can be concluded that, the yaw error has little effect on the rotor speed ripple but can restrain the torque oscillation. In addition, the effects of a given yaw error on rotor speed differ for different stages. These effects are most prominent in stage IV, followed by stage II, and are the weakest in stage III. Furthermore, compared with the rotor speed ripple amplitude caused by wind shear and tower shadow, the rotor speed variation caused by a yaw error within 15° is very small (no more than 1/3) and the variation caused by a yaw error of 20° or more is comparable to the wind shear and tower shadow.
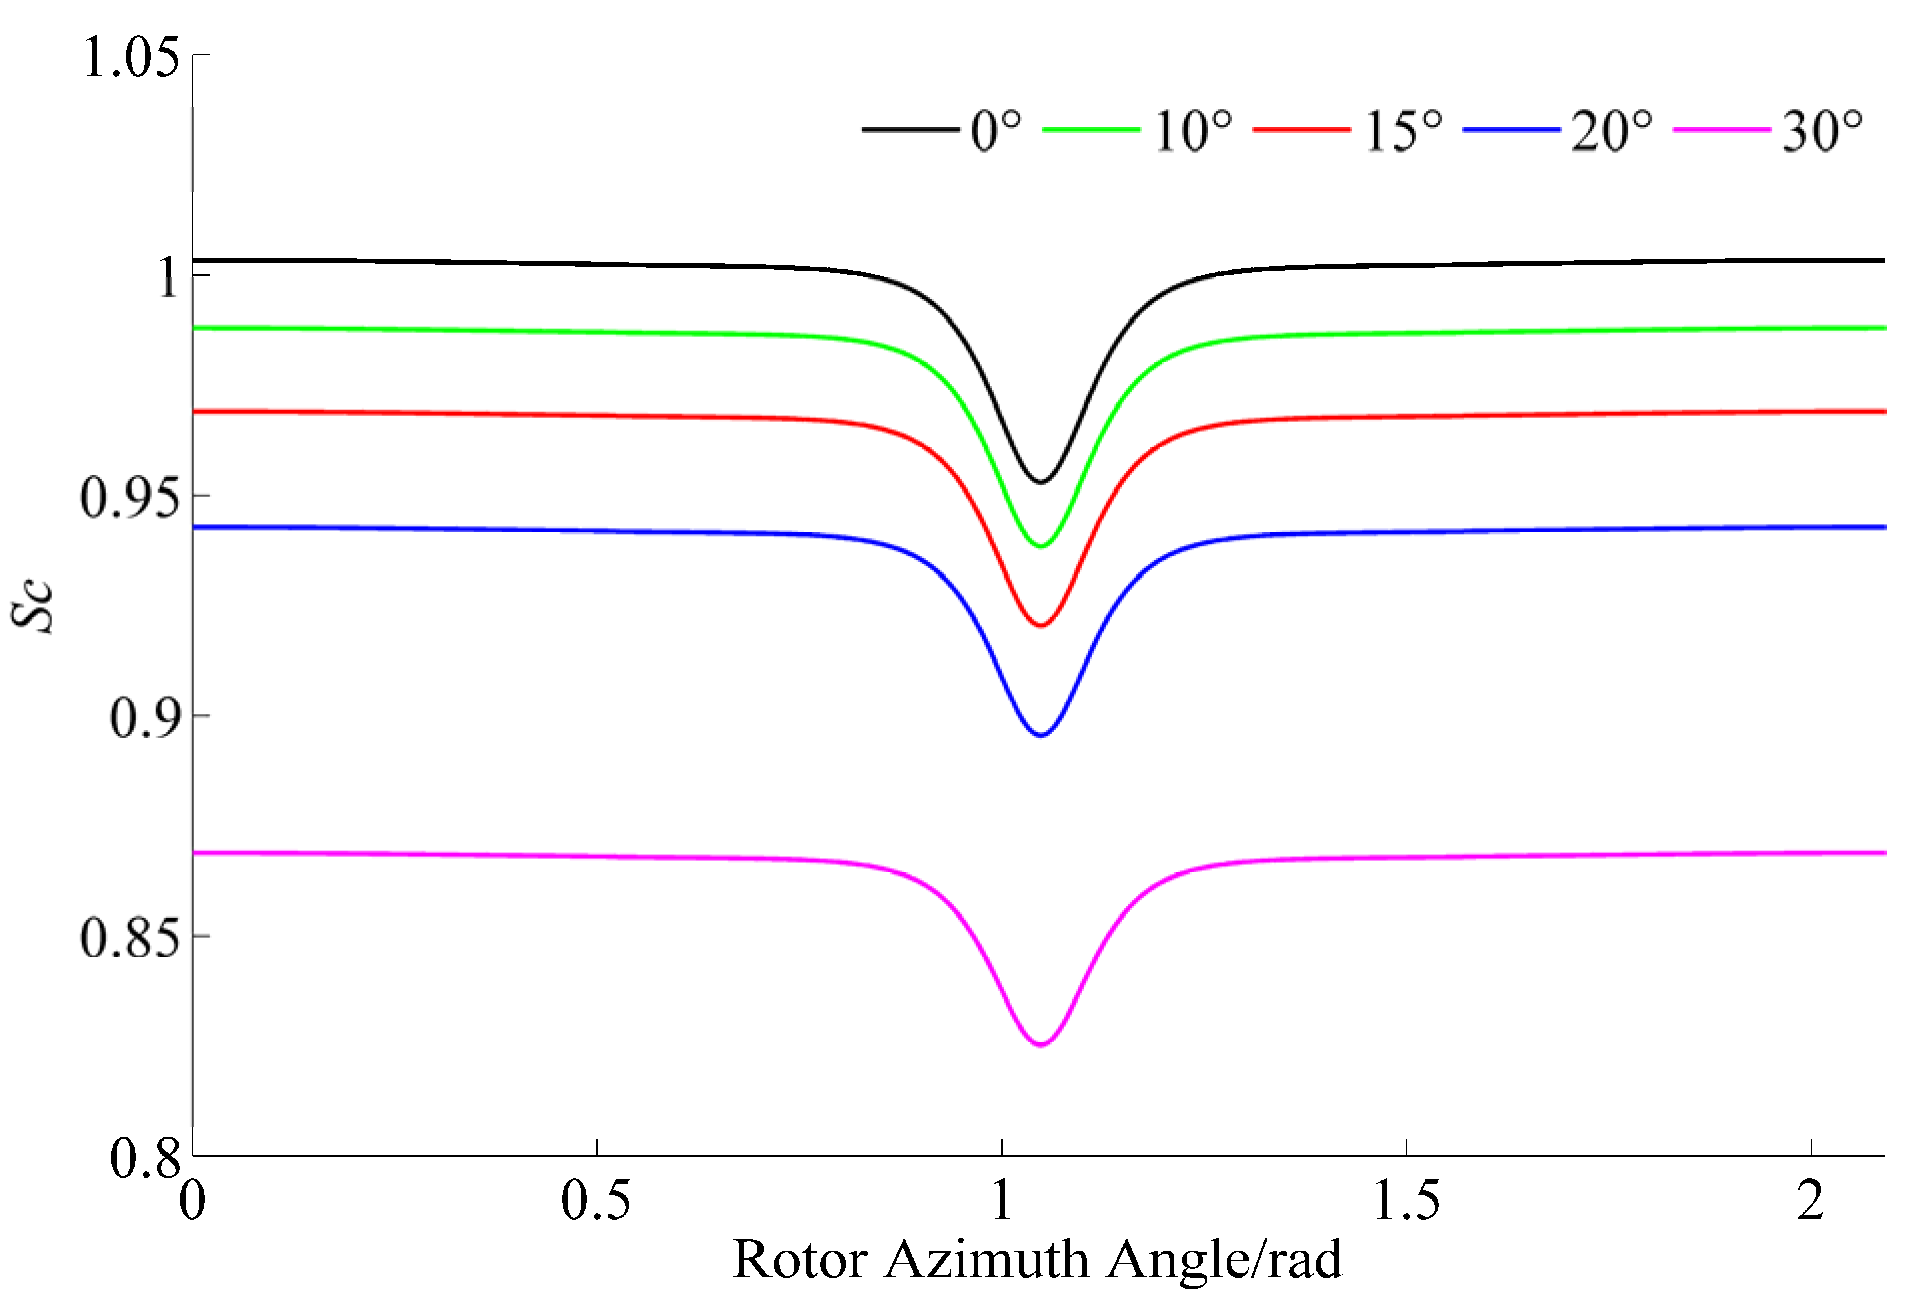
Figure 7 shows the effects of yaw error on the rotor speed coefficient obtained from the simulation results. When the rotor is at various azimuth angles, the rotor speed coefficient also includes 3P ripple components. When the blade is not in the tower shadow zone, the rotor speed coefficient remains nearly constant value. However, when the blade is in the tower shadow zone, the rotor speed coefficient significantly oscillates around a value of approximately 0.05. This effect results from the wind shear and, in particular, the tower shadow. The
Sc oscillation values are shown in
Table 5. When the yaw error is 10°, the attenuation of the rotor speed coefficient is approximately 0.011, and when the yaw error is 20°, the attenuation is approximately 0.058, which is nearly equal to the ripple values resulting from the wind shear and tower shadow. In addition, the oscillation value of the rotor speed coefficient is only weakly affected by the yaw error.
Figure 7.
Effects of yaw error on Sc.
Figure 7.
Effects of yaw error on Sc.
Table 5.
Values of Sc oscillation.
Table 5.
Values of Sc oscillation.
| Yaw Error | Oscillation Value | Reduce Value |
|---|
| 0° | 0.051 | 0 |
| 10° | 0.053 | 0.011 |
| 15° | 0.050 | 0.031 |
| 20° | 0.049 | 0.058 |
| 30° | 0.045 | 0.133 |
3.4. Analysis of the Effects of Yaw Error on Wind Turbine Power
Here, we substitute Equations (13) and (16) into Equation (10) to obtain a final expression for the effects of yaw error on the wind turbine power:
where
Pc is the wind turbine power coefficient,
Tc is the total aerodynamic torque coefficient, and
Sc is the rotor speed coefficient.
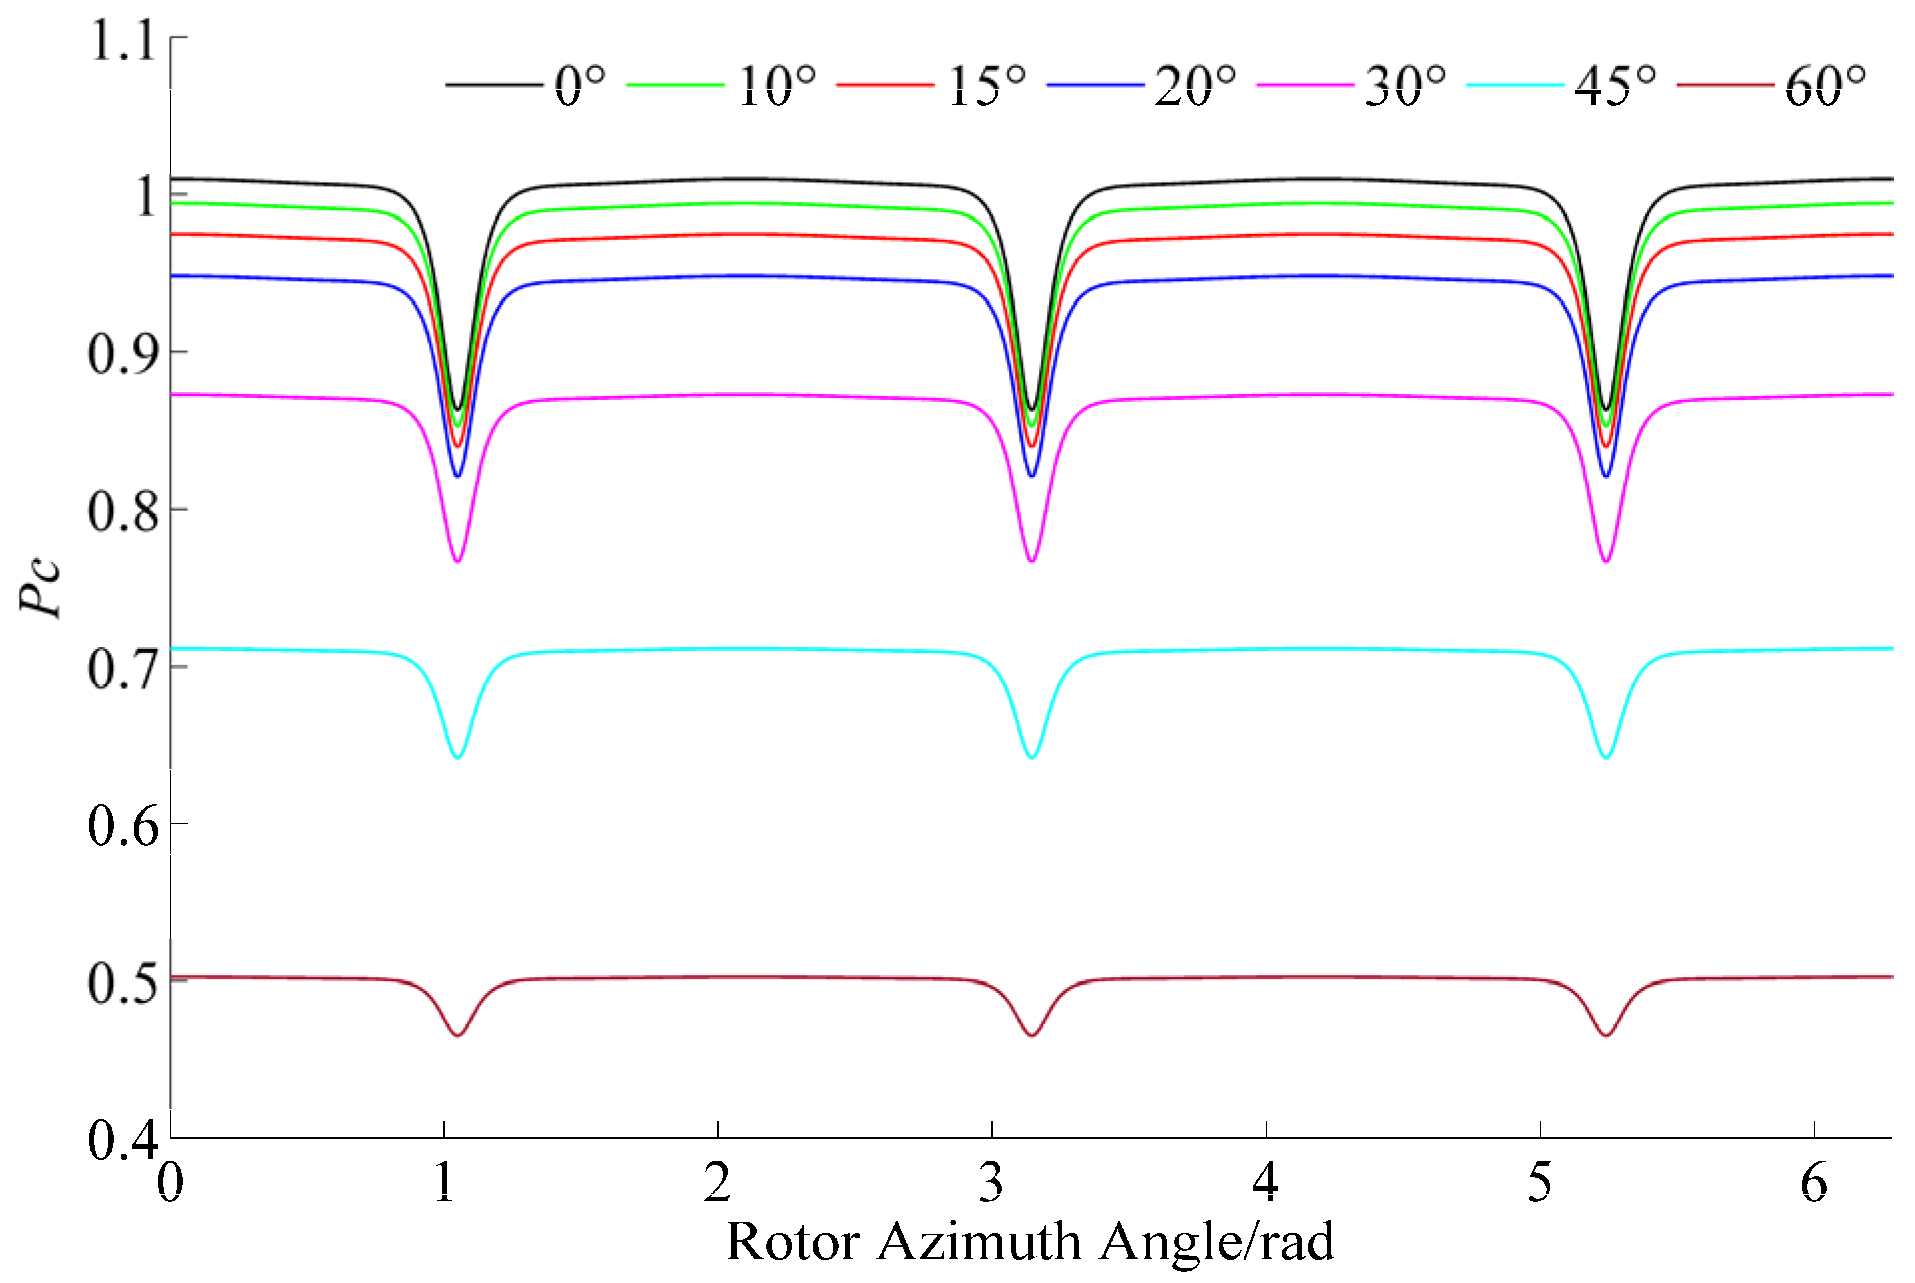
Figure 8 shows the effect curves of for the effect of yaw error on the wind turbine power coefficient.
Figure 8 shows that 3P ripple components are present in
Pc (the synthesis of
Tc and
Sc) as well, and the oscillation significantly affected by the yaw error, as shown in
Table 6. The yaw error angle can restrain the oscillation of
Pc, and this restrain effect becomes stronger as the yaw error angle increases. This result is similar to the effects of yaw error on
Tc. Meanwhile,
Pc is reduced by a factor of cos φ. In Ref. [
23], the experimental results suggest that the power output is reduced by a factor of cos
2 φ, and in Ref. [
1], the relationship between the power output and the yaw error follows the cosine-cubed law
Pyaw =
Pwcos
3 φ, which results from a simplified analysis of the yawed performance without considering adjustments to the control parameters, such as θ, λ,
Cp, and
Te (generator electromagnetic torque)
.
Figure 8.
Effects of yaw error on Pc.
Figure 8.
Effects of yaw error on Pc.
Table 6.
Values of Pc oscillation.
Table 6.
Values of Pc oscillation.
| Yaw Error | Oscillation Value | Reduce Value |
|---|
| 0° | 0.148 | 0 |
| 10° | 0.141 | 0.015 |
| 15° | 0.134 | 0.034 |
| 20° | 0.128 | 0.061 |
| 30° | 0.107 | 0.137 |
| 45° | 0.072 | 0.298 |
| 60° | 0.038 | 0.507 |
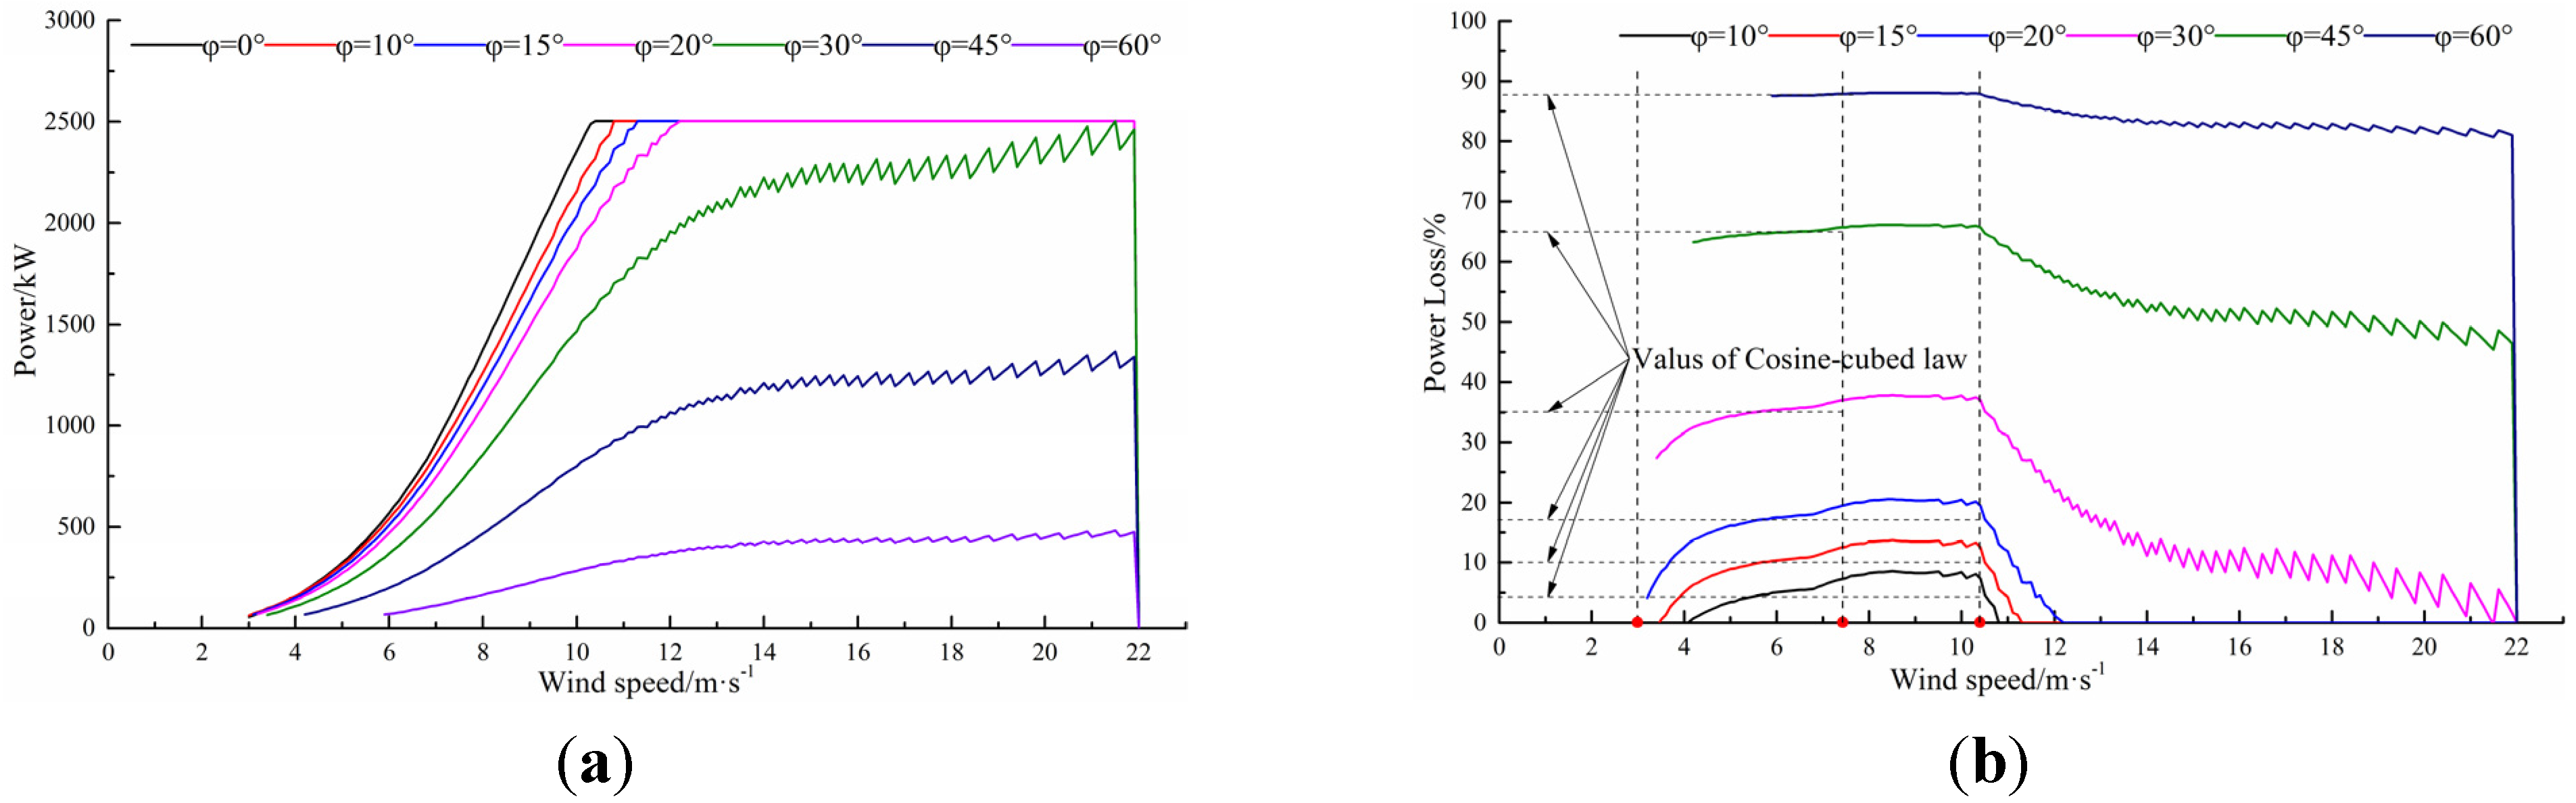
Figure 9 depicts the effects of yaw error on the wind turbine power obtained from the simulation results and also shows that the effects of yaw error on power loss vary markedly by wind speed stages.
Figure 9.
Effects of yaw error on the wind turbine power. (a) Wind turbine power curve; (b) Power loss curve.
Figure 9.
Effects of yaw error on the wind turbine power. (a) Wind turbine power curve; (b) Power loss curve.
When the wind speed is less than 7.4 m/s, the wind turbine is in the below rated speed stage. In this stage, the wind turbine runs at the optimal tip speed ratio, and the maximum rotor power coefficient is achieved.
Figure 9b shows that the effect of yaw error on the power loss gradually increases with the wind speed. When the yaw error angle is small (e.g., 10°, 15° and 20°), the power loss curve rapidly approaches and even exceeds the cosine-cubed law values. When the yaw error angle is large (e.g., 30°, 45° and 60°), the power loss curve is approximately linearly close to the cosine-cubed law values as the limits.
When the wind speed varies between 7.4 m/s and 10.5 m/s, the wind turbine operates in the below rated power stage. In this stage, the pitch angle is still 0°, and the tip speed ratio and the rotor power coefficient both decrease slowly as the wind speed increases. The effects of yaw error on the wind turbine power are generally stable, and the power loss rate reaches a maximum and ceases to change with variations in the wind speed. At this stage, the large yaw error angle agrees well with the value of the cosine-cubed law. However, regarding small yaw error angles, the wind turbine power loss reaches approximately 8% for a yaw error angle of 10° and approximately 13% for a yaw error angle of 15°. Both of these values are much higher than the values of 4.5% and 9.9% predicted by the cosine-cubed law.
When the wind speed is greater than 10.5 m/s, the wind turbine operates in the constant rated power stage. The pitch angle increase is controlled to adjust the wind turbines to capture the aerodynamic torque. The rotor power coefficient rapidly decreases as the wind speed increases. This control strategy ensures that the wind turbine runs at the rated power and protects the turbine from damage due to excessive wind loads. The effects of yaw error on wind turbine power begin to differentiation, and
Figure 9 shows the differentiation that, the effect of yaw error decreases rapidly to zero when the yaw error is small (e.g., 10°, 15° and 20°), the wind turbine can quickly reach the rated power; nevertheless, the wind turbine can no longer reach the rated power when the yaw error is large (e.g., 30°, 45° and 60°), leading to wasted wind energy.
According to the above analysis, the effects of yaw error on the power output and power coefficient differ by case, and the effects do not follow the cos
2 φ law in Ref. [
23] or the cos
3 φ law in Ref. [
1].


