Article

Discrete Fracture Modeling of 3D Heterogeneous Enhanced Coalbed Methane Recovery with Prismatic Meshing

1
Department of Energy & Resources Engineering, College of Engineering, Peking University, Beijing 100871, China
2
Shell International Exploration and Production Inc., Houston, TX 77079, USA
*
Author to whom correspondence should be addressed.
Energies 2015, 8(6), 6153-6176; https://doi.org/10.3390/en8066153
Submission received: 14 April 2015 / Revised: 1 June 2015 / Accepted: 16 June 2015 / Published: 19 June 2015

Abstract

:
In this study, a 3D multicomponent multiphase simulator with a new fracture characterization technique is developed to simulate the enhanced recovery of coalbed methane. In this new model, the diffusion source from the matrix is calculated using the traditional dual-continuum approach, while in the Darcy flow scale, the Discrete Fracture Model (DFM) is introduced to explicitly represent the flow interaction between cleats and large-scale fractures. For this purpose, a general formulation is proposed to model the multicomponent multiphase flow through the fractured coal media. The S&D model and a revised P&M model are incorporated to represent the geomechanical effects. Then a finite volume based discretization and solution strategies are constructed to solve the general ECBM equations. The prismatic meshing algorism is used to construct the grids for 3D reservoirs with complex fracture geometry. The simulator is validated with a benchmark case in which the results show close agreement with GEM. Finally, simulation of a synthetic heterogeneous 3D coal reservoir modified from a published literature is performed to evaluate the production performance and the effects of injected gas composition, well pattern and gas buoyancy.

1. Introduction

In a coalbed methane (CBM) reservoir, the gas sorption effect makes the coal seam act as the source and reservoir rock, hence containing a significant amount of methane with higher purity than conventional gas reservoirs [1]. Primary CBM recovery by pressure depletion is a simple method for CBM extraction. However, the method is less efficient with the recovery factor around 20%–60% [2,3]. Enhanced coalbed methane recovery (ECBM) can significantly increase methane recovery by injecting other gases (e.g., CO2, N2) [4,5]. It is also an appealing option for long term CO2 sequestration in coal seam.
The fundamental difference between coalbed methane reservoirs and conventional gas reservoirs is the porosity system. Typically, the porosity of a coalbed methane reservoir is comprised of three parts: the large-scale structural fractures, smaller fractures (cleats) and coal matrix. The first two parts constitute the naturally fractured system of coal seam. The majority of methane (>95%) is stored in the matrix through gas sorption, while the fractures contribute most of the permeability. A typical CBM process starts with desorption of methane from the matrix surfaces when the coalbed is subjected to pressure depletion. The desorbed methane then migrates to the surrounding cleat through diffusion whose diffusivity is considered to vary with the moisture content in matrix [6]. Once entering the fractures, the desorbed methane as well as the formation water flows through the naturally fractured network to the producer which can be modeled by Darcy’s law. For an ECBM process, the injected gas interacts with methane in-place which leads to more complicated sorption behavior and a multiphase multicomponent flow system.
Mathematical description of CBM/ECBM is challenging due to the complexity of gas sorption and multicomponent-multiphase flow and transport coupled with geomechanical effects. Many studies have been conducted to describe the sorption dynamics with competitive sorption equilibria of mixed gas at reservoir conditions. Arri et al. [7] showed that gas sorption in coal is reversible and can be effectively modeled using an extended Langmuir isotherm (ELM) [8,9]. In later studies, thermodynamic approaches such as the Two-Dimensional Equation of State (2D EOS) and the Ideal Adsorbed Solution (IAS) theory were developed. Pan et al. [10] implemented the 2D EOS model into the established coal seam methane simulator SIMED II and compared its results with ELM and IAS. They concluded that 2D EOS provided higher accuracy in representing the sorption behavior which significantly improved the production forecast of ECBM over a wide pressure range.
Fluid flow of methane, as stated above, is described by equations on different scales. A variety of models have been developed to describe gas diffusion between matrix and cleats, which include the equilibrium model with instantaneous diffusion, non-equilibrium model with pseudo-steady-state or unsteady-state diffusion governed by Fick’s Law [11], and the bidisperse diffusion model [12]. Flow through the natural fractures can typically be represented by dual-porosity single-permeability model (without the presence of large-scale fractures) or triple-porosity dual-permeability model. Although the computational costs are relatively low, these models are inadequate to model complex fractures with sufficient details and the accuracy of transfer function between the matrix and the fractures is questionable [13]. In contrast, the DFM model overcomes the limitations in dual-continuum approach. It is able to account for the effect of large-scale fractures explicitly. Noorishad and Mehran [14], and Baca et al. [15] were among the early authors introducing DFM for single-phase flow. Kim and Deo [16], Karimi-Fard and Firoozabadi [17] developed DFMs based on the finite-element method for two-phase flow in fractured reservoirs. Monteagudo [18] and Matthai et al. [19] implemented the DFM for two-phase flow using the control-volume finite-element (CVFE) formulation. In addition, Fu et al. [20] applied the CVFE method to develop a new 3D, three-phase reservoir simulator compatible with DFM.
The change of permeability as a function of pressure and sorption induced matrix shrinkage and swelling have been extensively investigated. For example, stress dependent permeability was observed in a lab experiment in [21], which clearly indicated an exponential function of permeability in stress. Seidel et al. [22] described the mathematical basis for the change of permeability with applied stress. Analytical models such as the P&M model [23] and S&D model [24,25] were then developed and applied to history match the data from San Juan basin fields. These two models are widely used due to their simplicity and good agreement with field observations [26]. In recent years, more advanced models have been developed and reviewed [27,28,29].
For most of the existing reservoir simulation models, the CBM/ECBM process is typically represented by conventional black-oil simulators. The sorption and diffusion processes are modeled in the same manner as gas dissolution in the immobile oil, which implies a similar assumption as equilibrium sorption [30]. Reservoir simulators, such as GEM developed by the Computer Modeling Group, ECLIPSE developed by Schlumberger, were also extended to model ECBM process. In addition, COMET2 and SIMED II are specialized CBM simulators which are widely used in modeling primary and secondary CBM recovery processes. The later developed COMET3 [31] enables the triple-porosity dual-permeability option to model the cleat and large-scale fracture system. Nevertheless, all these simulators are in the context of a highly-conceptualized equivalent-continuum approach, which assumes fractures are evenly distributed and interconnected and can be represented by structured blocks. These strong assumptions are invalid especially for coal reservoirs with discontinuous large-scale fractures, e.g., structural faults.
In this paper, we develop a 3D, multicomponent multiphase simulator with explicit fracture characterization to simulate the recovery of coalbed methane. In this new model, the methane flow from the matrix by diffusion is calculated using the conventional dual-continuum approach. However, in the Darcy scale, the Discrete Fracture Model (DFM) is introduced to represent the flow interaction between cleats and large-scale fractures. Finite volume method is used to solve the general ECBM equations coupled with geomechanical effects. An efficient gridding technique (prismatic meshing) is applied to handle 3D models with layers permeability distribution. We apply the new model to a benchmark 2D case and a synthetic heterogeneous 3D case to test its performance. Finally, we conclude this paper and provide suggestions for future research direction.

2. Methodology

2.1. Reservoir Characterization

Coal has a highly heterogeneous and anisotropic porosity system, consisting of matrix, cleats and large-scale fractures (Figure 1). The dual-continuum approach [32] is often used to characterize such a porosity system. In this approach, coal reservoir is discretized into two distinct domains, the matrix and the cleats. Most of the pore space (hence the sorption capacity) is in the matrix while the permeability is governed mostly by the cleats. A diffusion term (usually treated as a source term) is introduced to model the mass flux between the matrix and fracture gridblocks.
The conventional dual-continuum approach is a valid approximation for the matrix-cleat system since cleats tend to be continuous and orthogonally distributed throughout the coal reservoir [33,34]. However, the dual-continuum approach may lead to large errors when large-scale fractures with varying lengths, apertures and heights are present [35]. In our approach, DFM is incorporated to represent the large-scale fractures explicitly, which circumvents the strong assumptions in the conventional dual-continuum approach. As shown in Figure 2, the dual-continuum assumption still holds for matrix-cleat system, while DFM model is used for fluid flow in cleat-fracture system.
Figure 1. Schematic of coalbed methane reservoir with multiscale natural fractures (Gray ground color: matrix; white line: small fractures; red line: large fractures).
Energies 08 06153 g001
Figure 2. Schematically shown the new reservoir characterization with DFM.
Energies 08 06153 g002

2.2. Model Formulation

In the naturally fractured system, both water and gas phases are present. In this work, we assume there is no mass exchange between water and gas phases. The capillary pressure is also neglected. Then the mass conservation equation for component i in gas phase (indicated by subscript g) is expressed by:
t ( ϕ ρ g S g x i g ) + ( ρ g u g x i g ) + q i g W ¯ r i = 0 ,    ( i M m )
and for water phase (indicated by subscript w) is:
t ( ϕ ρ w S w ) + ( ρ w u w ) + q w W ¯ = 0
where ϕ is effective cleat porosity, ρ g is molar density of gas phase, S g is gas saturation, q i g W ¯ is well source term. Darcy velocity u j for phase j is given by:
u j = k k r j μ j Φ j    =     k k r j μ j ( p γ j z ) , ( j = g , w )
where k is absolute permeability, krj is phase relative permeability, μj is phase viscosity, γj is phase gradient and z is the elevation. The gas phase density and viscosity, ρg and μg, are computed based on the gas composition and properties of each component. In the compositional model developed here, ρg is computed using cubic Equation of State (Peng-Robinson, SRK etc.) at given pressure and temperature. The Lohrenz-Bray-Clark (LBC) model [36] is applied to calculate the gas phase viscosity. Water properties only depend on pressure, which can be obtained from PVT test.
In matrix, the diffusion source ri is governed by the concentration gradient. Under a pseudo-steady state assumption, it can be described by a first order kinetic model [11]:
r i = C i , m t = 1 σ D i ( C i , m C i , f )
where Di is the diffusion coefficient, σ is the shape factor for dual-continuum approach, Ci,m is the adsorbed concentration in matrix and Ci,f is the equilibrium concentration in cleats for component i. The concentration Ci,m is an independent variable which needs to be solved implicitly while Ci,f is a function of cleat properties. In this work, the Extended Langmuir isotherm is used to compute the sorption behavior. The equilibrium concentration Ci,f in cleats for component i is then given by:
C i , f = ρ s V L , i b i p i 1 + j b j p j
where VL,i is the Langmuir volume for component i (maximum amount of pure component i that can be adsorbed), bi is the sorption constant, ρs is coal density. Both VL,i and bi are determined from laboratory measurements. Partial pressure of component i in the gas phase, pi, is derived using an ideal gas approximation. Note that Equation (4) can be treated as a mass balance equation for component i in the adsorbed state.
Two auxiliary relationships should also be considered to fully specify the system. They are the saturation constraint:
j S j 1 = 0    ,           ( j = g , w )
and the component molar fraction constraint:
i x i g 1 = 0
Combining conservation Equations (1), (2) and (4) as well as the auxiliary Equations (6) and (7), we obtain the general ECBM equations with p, xi,g, Sj and Ci,m are the unknowns. As the equations are highly nonlinear and tightly coupled, numerical methods are required to solve the system. In the following section, a finite volume grid-centered discretization scheme is used, along with a prismatic meshing scheme to enhance the numerical efficiency and represent the layered feature of coalbed methane reservoirs.

2.3. Numerical Discretization and Prismatic Meshing Strategies

Three numerical approaches, the finite difference (FD), the Galerkin finite element (FE), and the finite volume (FV) methods have been studied by previous researchers [37,38,39]. In this work, a finite volume grid-centered discretization scheme is used. In the finite volume method, the discretization is achieved by integrating the mass conservation equations for fluid components over a control-volume Vk, which gives:
V k t ( ϕ ρ g S g x i g ) d V + V k ( ρ g u g x i g ) d V + V k q i g W ¯ d V V k r i d V = 0 V k t ( ϕ ρ w S w ) d V + V k ( ρ w u w ) d V + V k q w W ¯ d V = 0
As the properties are assigned to the center of the control volume, the accumulation term, well source term and diffusion source term can be directly integrated. The flux term, however, cannot be integrated directly because the Darcy velocity is piecewise constant which leads to a discontinuity across the interfaces. Using the divergence theorem, the flux term can be expressed by the summation of mass flux through each interface (denoted by subscript l):
V k u d V = Λ k u n d Λ l = 1 n l [ T Δ Φ ] l
where n denotes the unit normal vector (positive outward), ΔΦ is the potential difference between the neighboring grid cells, Λ is the contact area, n l is the total number of connections, T is interface transmissibility which is computed with the geometry factor Γ l (discussed later) and phase mobility λ l . Upstream weighting scheme is used to compute λ l to ensure numerical stability:
λ l = { k r i μ i ,                      ( Φ i Φ j ) k r j μ j ,                              ( Φ i < Φ j )
By substituting Equations (9) and (10) to Equation (8), we have the final discretized form of the governing equations as:
V k t ( ϕ ρ g S g x i g ) + l [ ρ g x i g Γ λ g Δ Φ g ] l + l Q i g W ¯ V k r i = 0 V k t ( ϕ ρ w S w ) + l [ ρ w Γ λ w Δ Φ w ] l + l Q w W ¯ = 0 ,   
Two-point flux approximation (TPFA) is applied in this work to ensure the robustness and computational efficiency. TPFA assumes the flux through an interface is only influenced by the potential difference between the associated two grid cells. In this work, DFM is used, which results in unstructured grids for control volumes. Figure 3 illustrates a DFM characterization for a 2D problem. The control volumes consist of nodes ( m 0 ~ n 3 ), facet ( s 1 ~ s 3 ) and element ( E 1 ~ E 3 ). A subset of interfaces ( s 1 , s 2 ) represents the computational fracture network while the computational matrix is represented by polygons ( E 1 ~ E 3 ). Due to their difference in geometry, separate approximations are applied to evaluate the transmissibility between control volumes (matrix-matrix, matrix-fracture, and fracture-fracture).
Figure 3. Schematically shown matrix and fractures represented by Discrete Fracture Model (DFM).
Energies 08 06153 g003
For the matrix-matrix pair (e.g., E1E2), the potential gradient can be approximated by introducing an intermediate control volume with unknown potential at the center ( s 1 ). The transmissibility factor can be expressed by:
Γ i j = α i α j α i + α j
where α i is a half transmissibility factor of matrix grid i , which is defined as:
α i = A l k i n d i d i d i
where A is the area of interface, n is the unit normal vector to the interface pointing outside, d i is a distance vector from the control volume centroid to interface centroid. Note that the procedure applied here is similar to the corner-point system discussed in Karimi-Fard et al. [40].
Equation (13) is also used to compute the transmissibility factor for matrix-fracture connections. For the fracture-fracture connections (e.g., s1s2), the half transmissibility factor is given by:
α i = A l k i d i
When there are more than two connections, a “star-delta” transformation is used. The general form is expressed by:
Γ i j = α i α j k = 1 n f α k
where nf denotes the number of intersecting fractures and αk is computed by Equation (14).
TPFA scheme requires generating the K-orthogonal grids for flux computation, which is not easy for DFM. A common choice for gridding is the Delaunay triangulation for 2D models and tetrahedralization for 3D models [41]. The tetrahedral meshing can easily handle the complex 3D geological structures. However, it will generate a large number of grid cells especially for reservoir models with high-aspect-ratio which leads to very expensive computational costs. In addition, tetrahedral meshing encounters difficulties for heterogeneous layered systems as the method implies a uniform property distribution in each direction. To circumvent these issues, prismatic meshing is introduced, which generates unstructured triangular grids in horizontal directions and structured grids in the vertical direction for 3D models (shown in Figure 4). Fractures are represented by vertical rectangles, but have varying orientations in the horizontal plane. The flow rates are calculated individually for each direction. Note that prismatic meshing requires the fractures are rectangular and oriented perpendicular to the lithological layering [42], which is a reasonable assumption for the large-scale fractures in coalbed methane reservoirs.
Figure 4. Schematic of prismatic grid.
Energies 08 06153 g004

2.4. Coupling of Coal Shrinkage and Swelling

Coal permeability is sensitive to the applied stress. In this work, the S&D model is used to describe the permeability change. In the S&D model, permeability change varies exponentially with the change in effective stress (via volumetric strain change), which is given by:
k = k 0 e { c f [ 3 v 1 v ( p p 0 ) + E ( 1 v ) i ε L , i b i ( p i 0 1 + j b j p j 0 p i 1 + j b j p j ) ] }
where E is the Young’s modulus, v is Poisson’s ratio, εL,i is the volumetric Langmuir strain constant for component i. Assuming the volume strain is proportional to the amount of adsorbed component, Equation (16) can be re-written as:
k = k 0 e { c f [ 3 v 1 v ( p p 0 ) + E ( 1 v ) ρ s i ε L , i V L , i ( C m , i 0 C m , i ) ] }
Equation (17) is solved in a coupled manner with the flow equations to model the impact of permeability change on fluid flow and transport. Although the geomechanical properties of a coal reservoir, E and v, are likely to change with reservoir pressure, temperature and gas type [43], these issues are not addressed in this work.
In addition, a revised P&M model is also incorporated for the purpose of validating our model with a commercial simulator (GEM). In the revised P&M model, the pore volume compressibility is represented by an exponential function to avoid negative porosity values. More detailed description of the revised model can be found at GEM user manual [44].

3. Verification and Model Applications

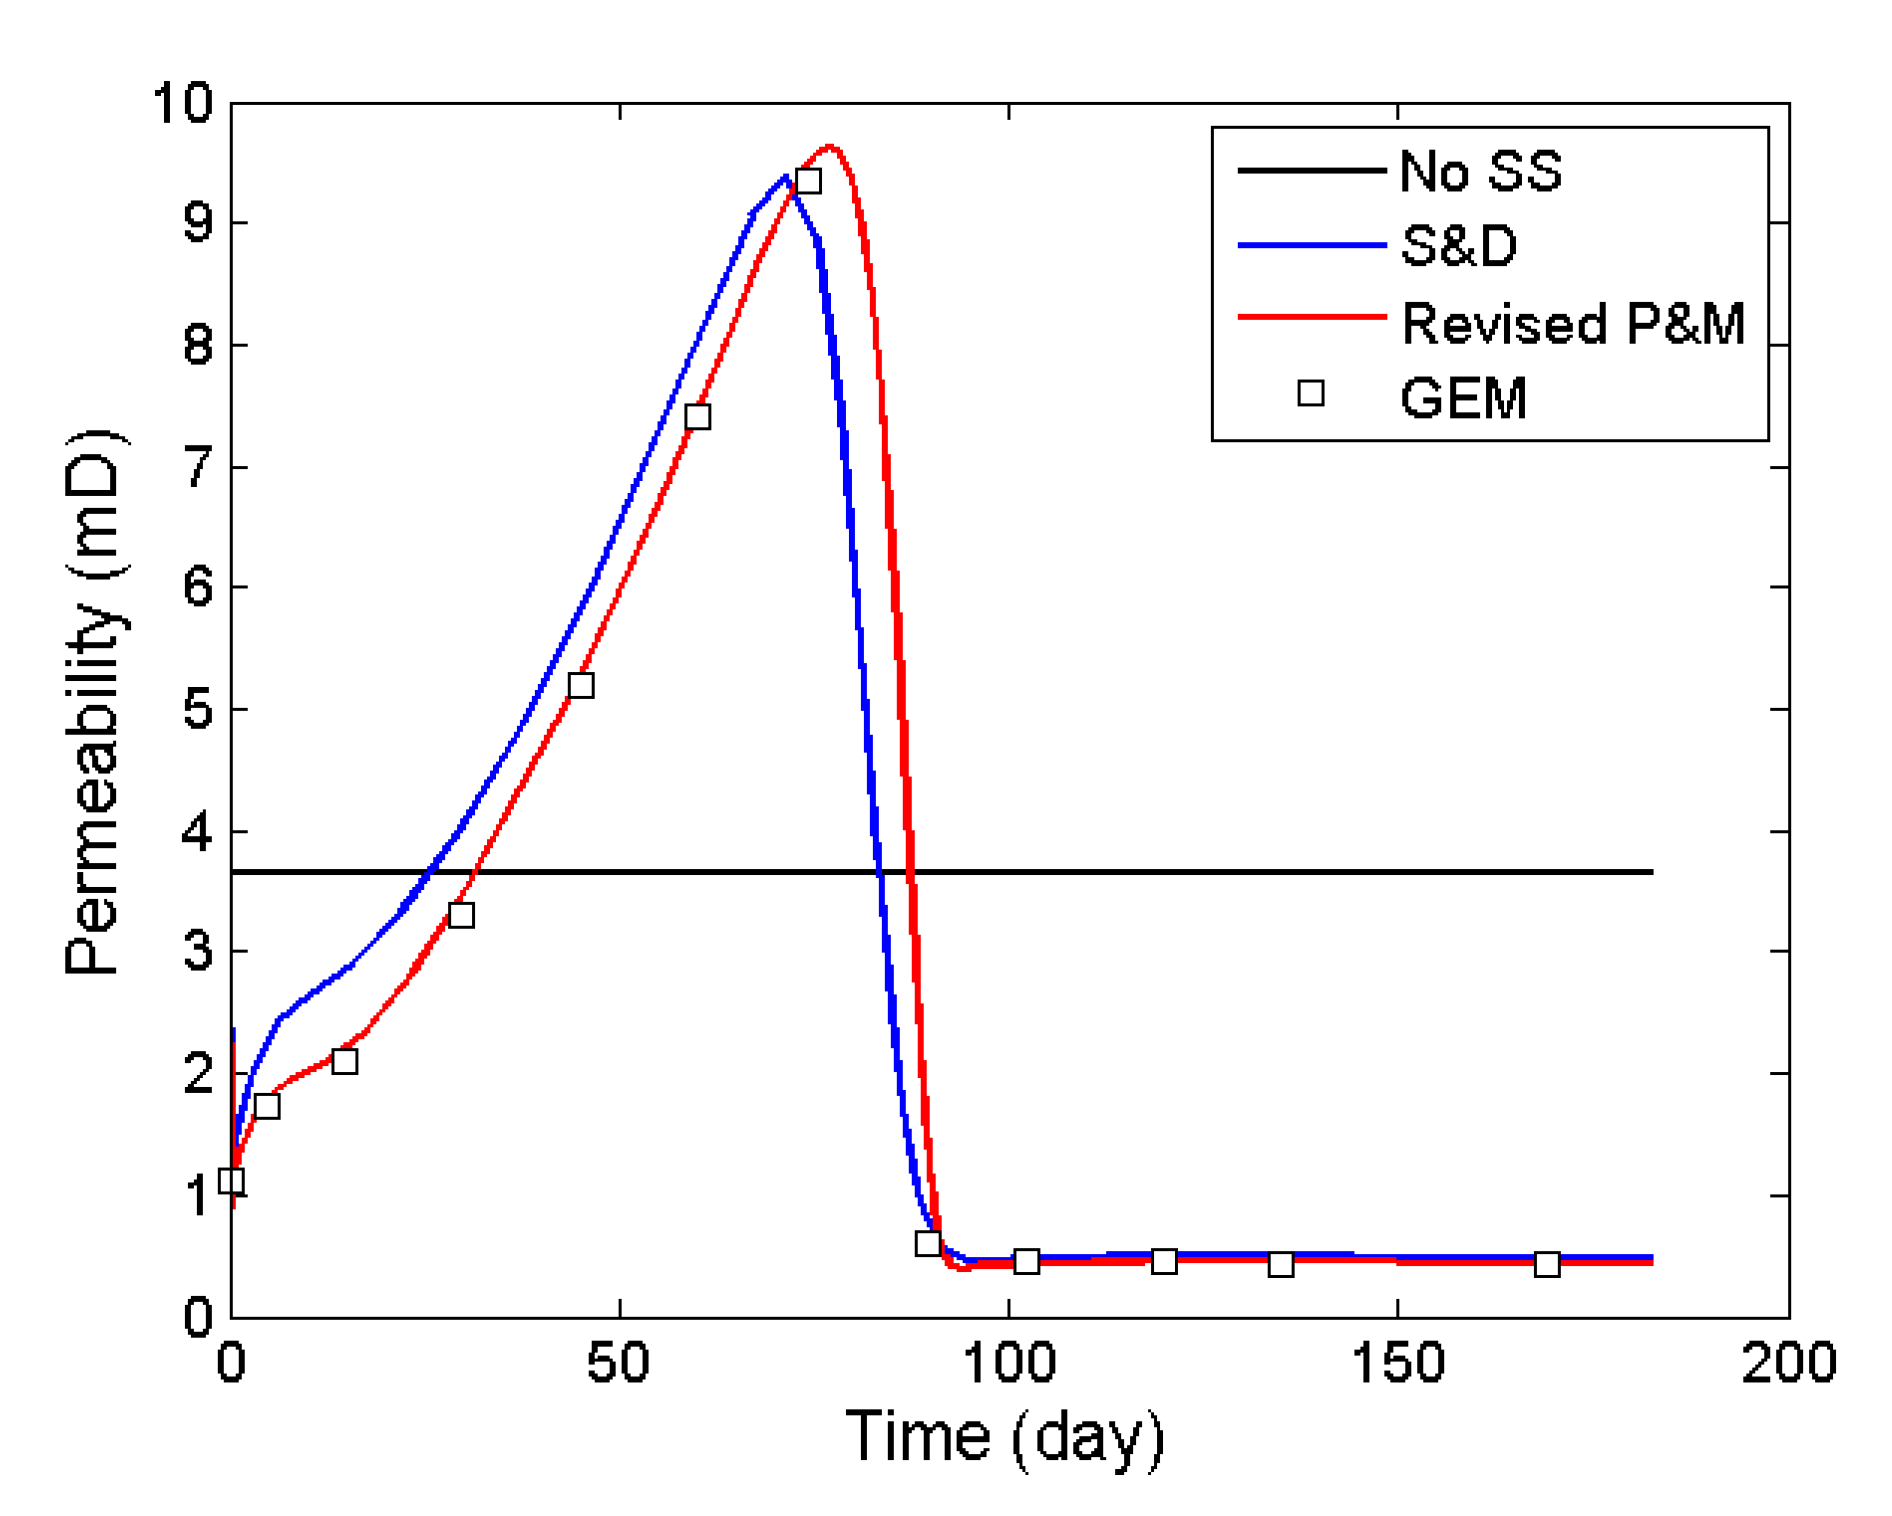
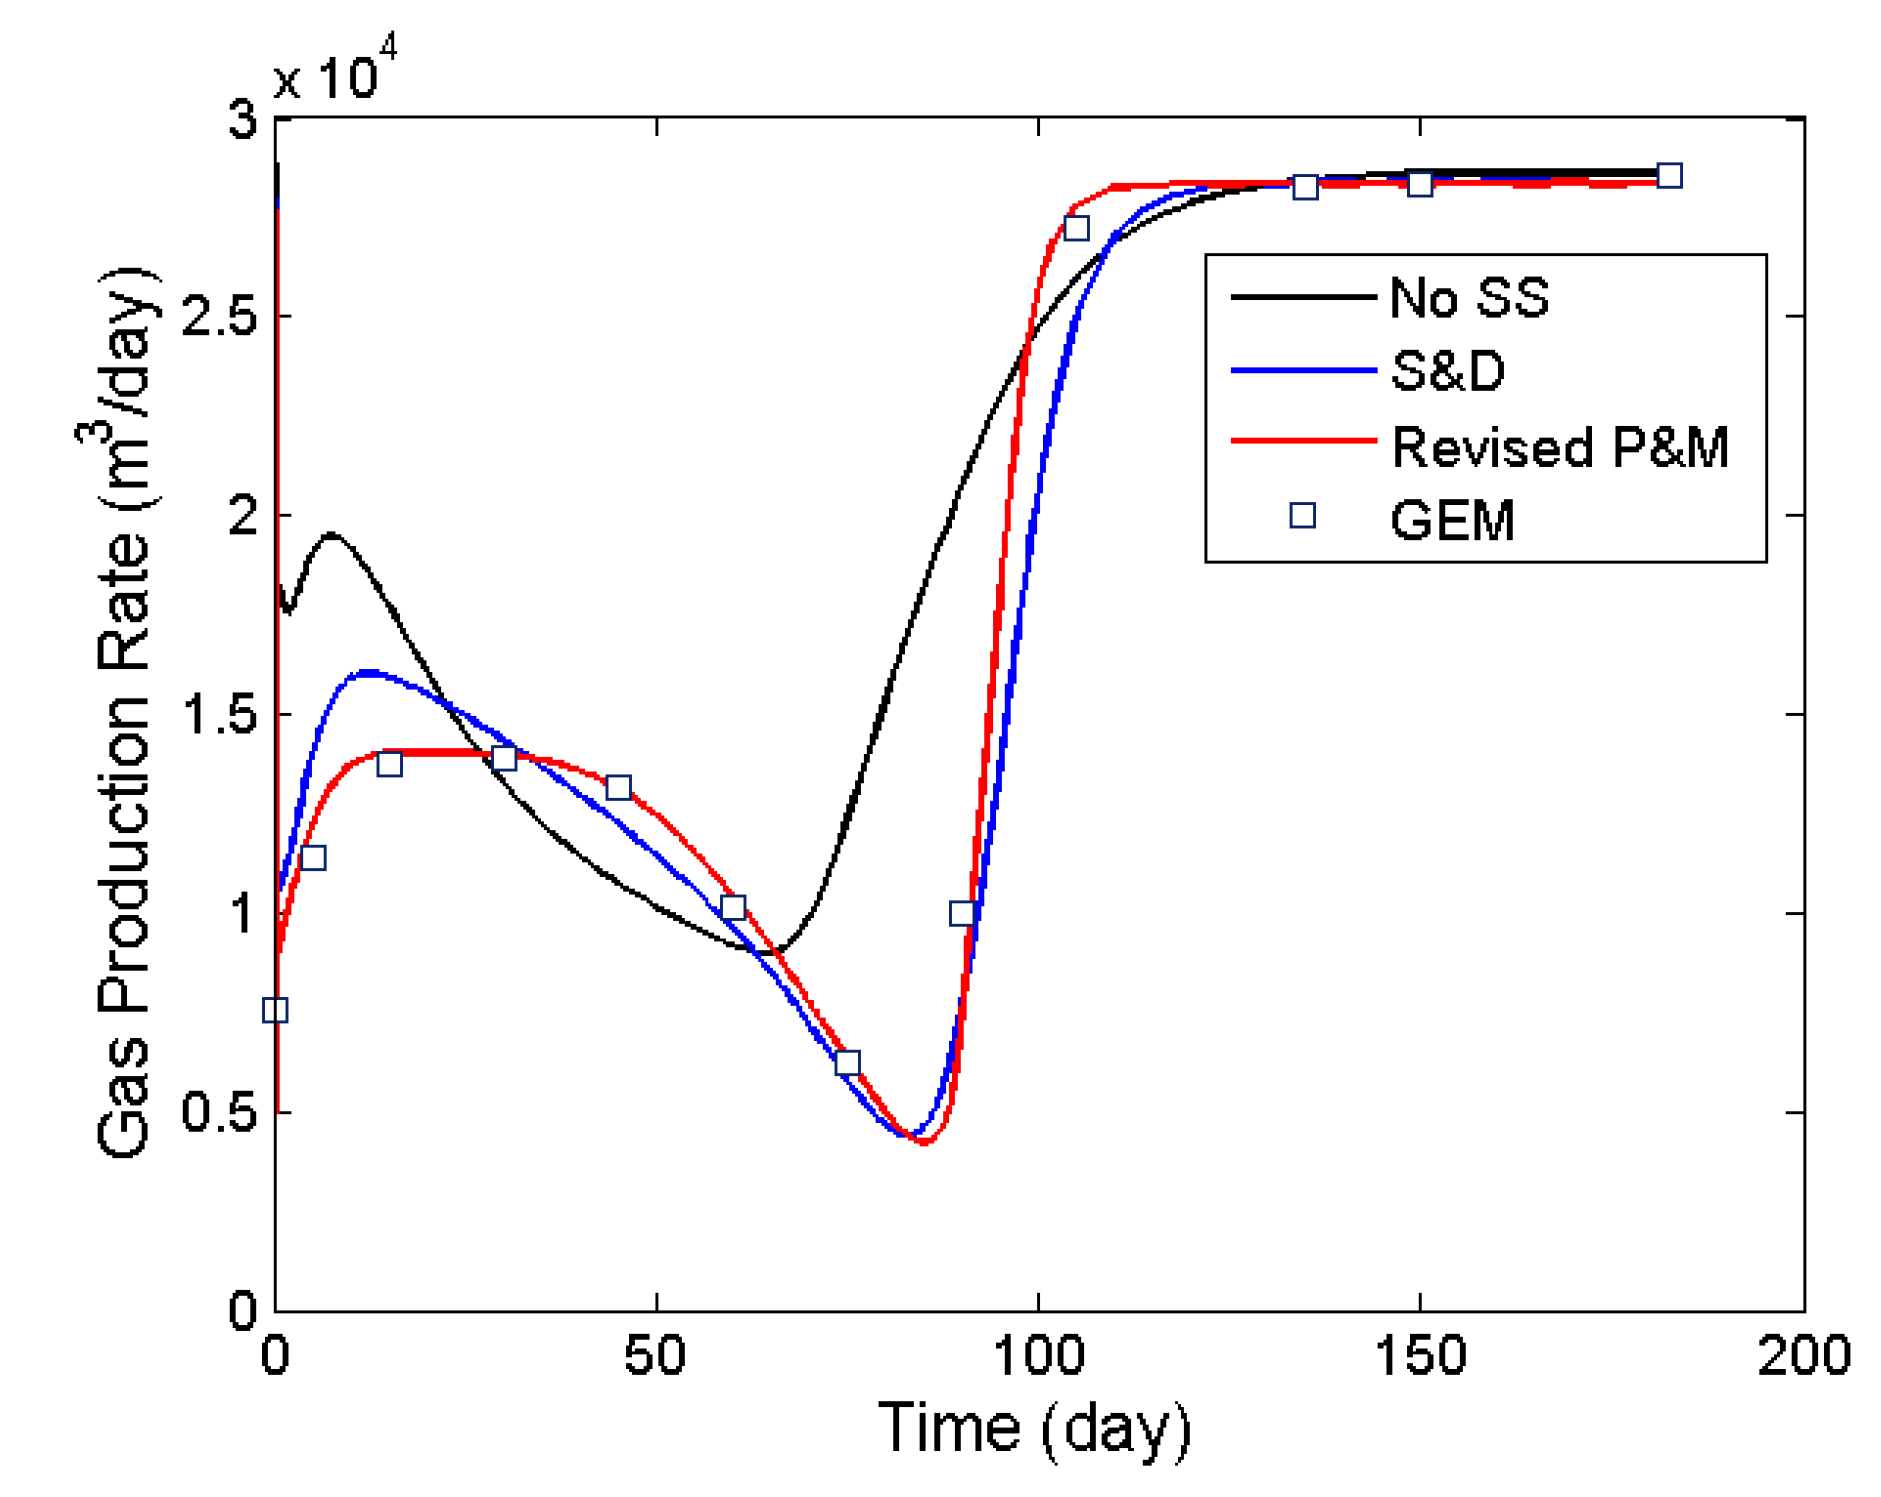
3.1. Case 1: Model Verification

The benchmark case to validate the new model is from Law [45]. It presents a five-spot ECBM recovery process with a pure CO2 injection (see Figure 5 for well locations). The injection rate is set to be 28,316 m3/day. A fixed BHP constraint of 270 kPa is used for all four producers. The reservoir is assumed to be homogenous. Thus, we only simulate one quarter of the model (solid lines in Figure 5). Gas-water relative permeability is shown in Figure 6. All other parameters for the coal seam are shown in Table 1.
There are five components in this case, CH4, CH4(s), CO2, CO2(s) and H2O, where s denotes the component is at the adsorbed state. The sorption and swelling properties of the gas components are given in Table 2. Mechanical properties with Young’s modulus of 1.999 × 10⁶ kPa and Poisson ratio of 0.39 are used for both S&D and the revised P&M models. In addition, the pore volume compressibility factor of 2.9 × 10⁻⁴/kPa is used for S&D model. As mentioned in Section 2.4, the revised P&M model is applied here only for validating purposes, as GEM has only the revised P&M model option.
Figure 7 shows that the permeability of the production well block is below its initial value (3.4 mD) at the beginning and then increases up to 9 mD. When CO2 breaking through at about 70 days, lower permeability is obtained in production well block, which results from the sorption induced swelling of CO2. Figure 8 shows the predictions for gas production rate using various models. We see that the production rates using the revised P&M and S&D models are generally lower compared to the results ignoring shrinkage and swelling effect, especially for the period right before injected gas breakthrough. Figure 7 and Figure 8 also show that the results using the model developed in this work closely match the results using GEM.
Figure 5. Production pattern of benchmark case.
Energies 08 06153 g005
Figure 6. Gas-water relative permeability curve [45].
Energies 08 06153 g006
Table 1. Reservoir and aqueous parameters for benchmark case.
Coal Reservoir Properties
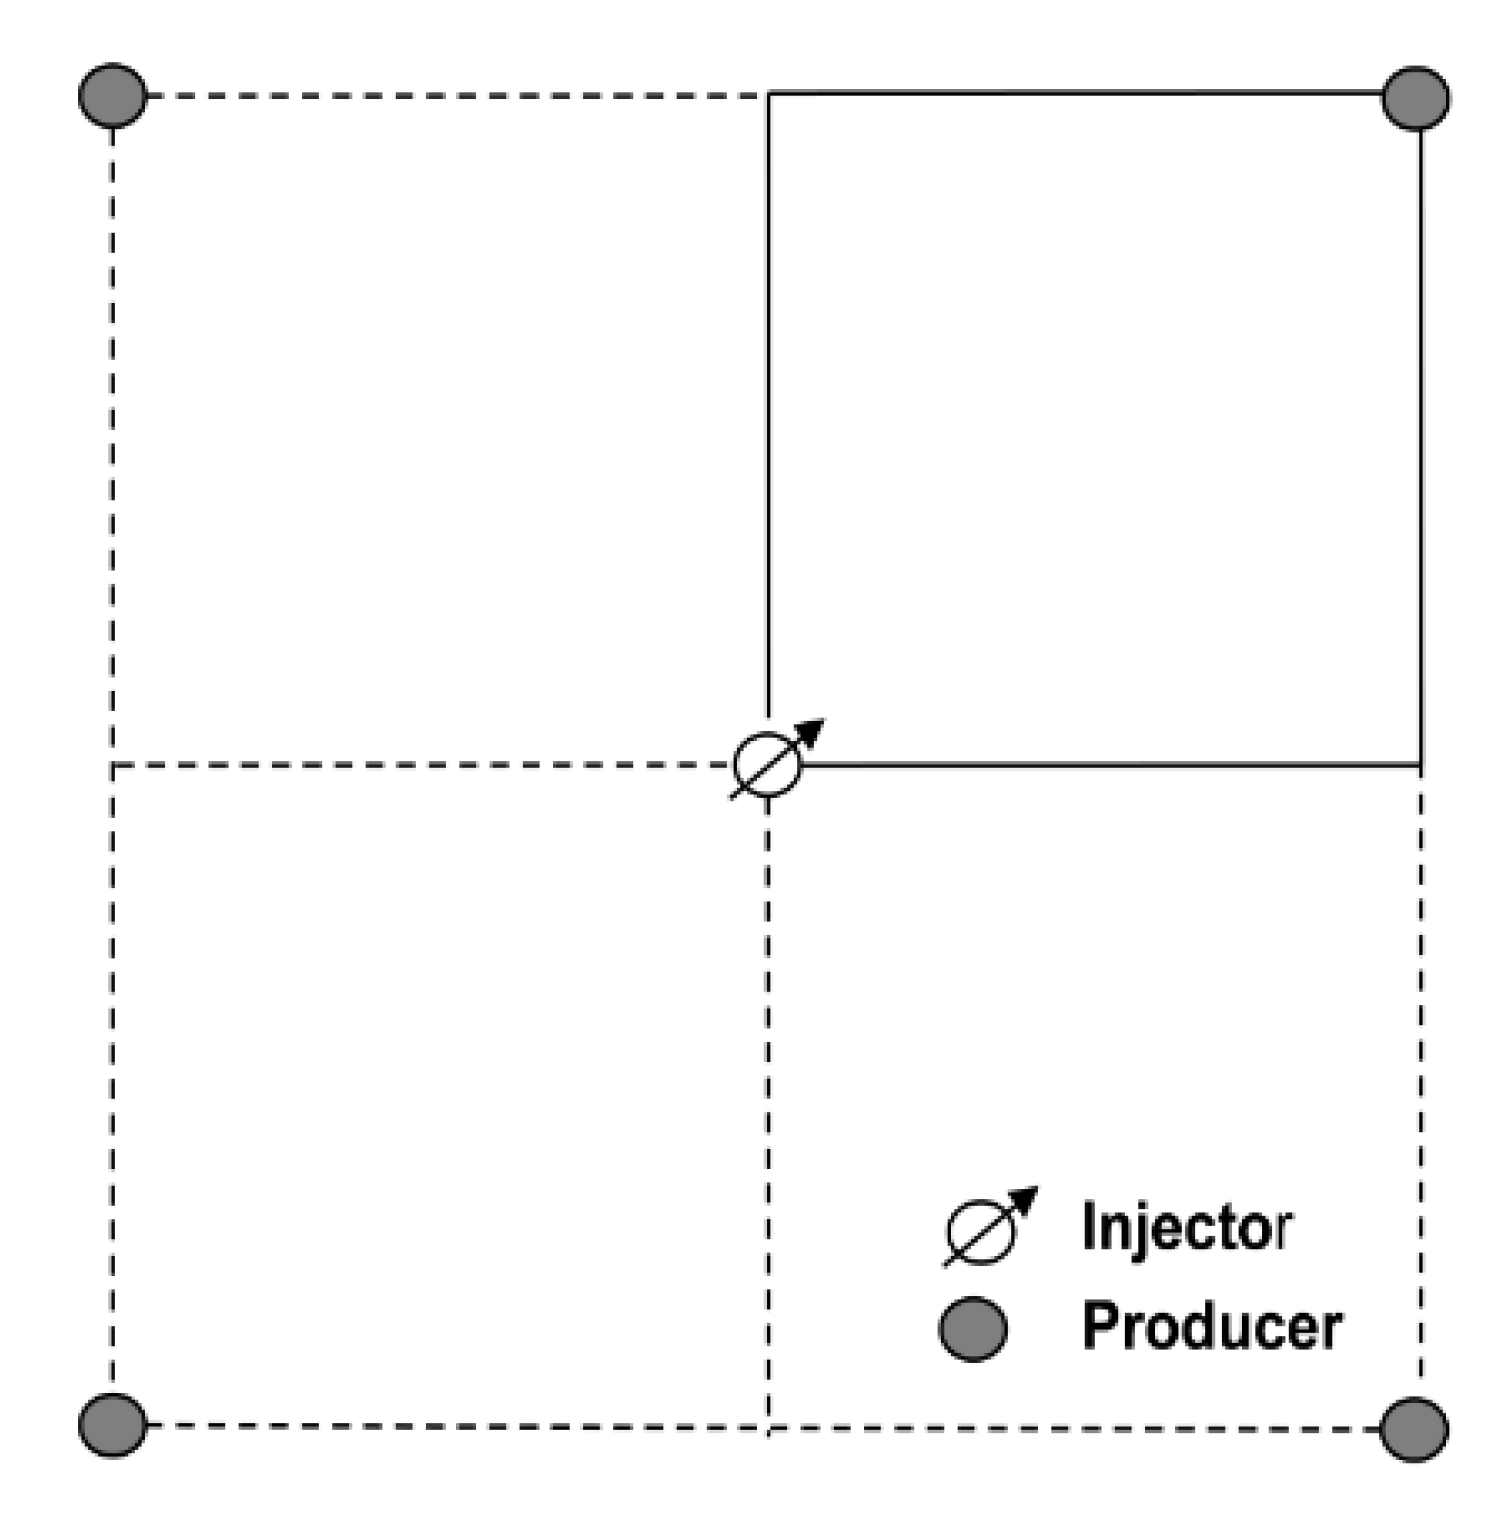
Region of interest1/4 of rectangular area with length 100.586 m
Grid systemCartesian 11 × 11 × 1
Thickness, m9
Coal density, kg/m31434
Temperature, °C45
Initial porosity0.001
Initial permeability (mD)3.4
Initial water saturation0.592
Diffusion coefficient, m2·s−17.88 × 10⁻¹¹
Shape factor, m−21.05 × 10⁵
Aqueous Properties
Aqueous density, kg/m3990
Aqueous viscosity, cp0.607
Aqueous compressibility, kPa−15.8 × 10⁻⁷
Table 2. Langmuir constant for sorption and swelling isotherms.
ComponentSorption Constant b (kPa−1)Langmuir Volume VL (m3/(kg Coal))Sorption Strain Factor εL (-)
CH42.133 × 10−40.01520.1176
CO25.255 × 10−40.03100.1176
N2 *3.671 × 10−50.01500.1176
* Properties of N2 are provided here for case 2.
Figure 7. Comparison of producer block permeability for different models.
Energies 08 06153 g007
Figure 8. Comparison of gas production rates for different models.
Energies 08 06153 g008

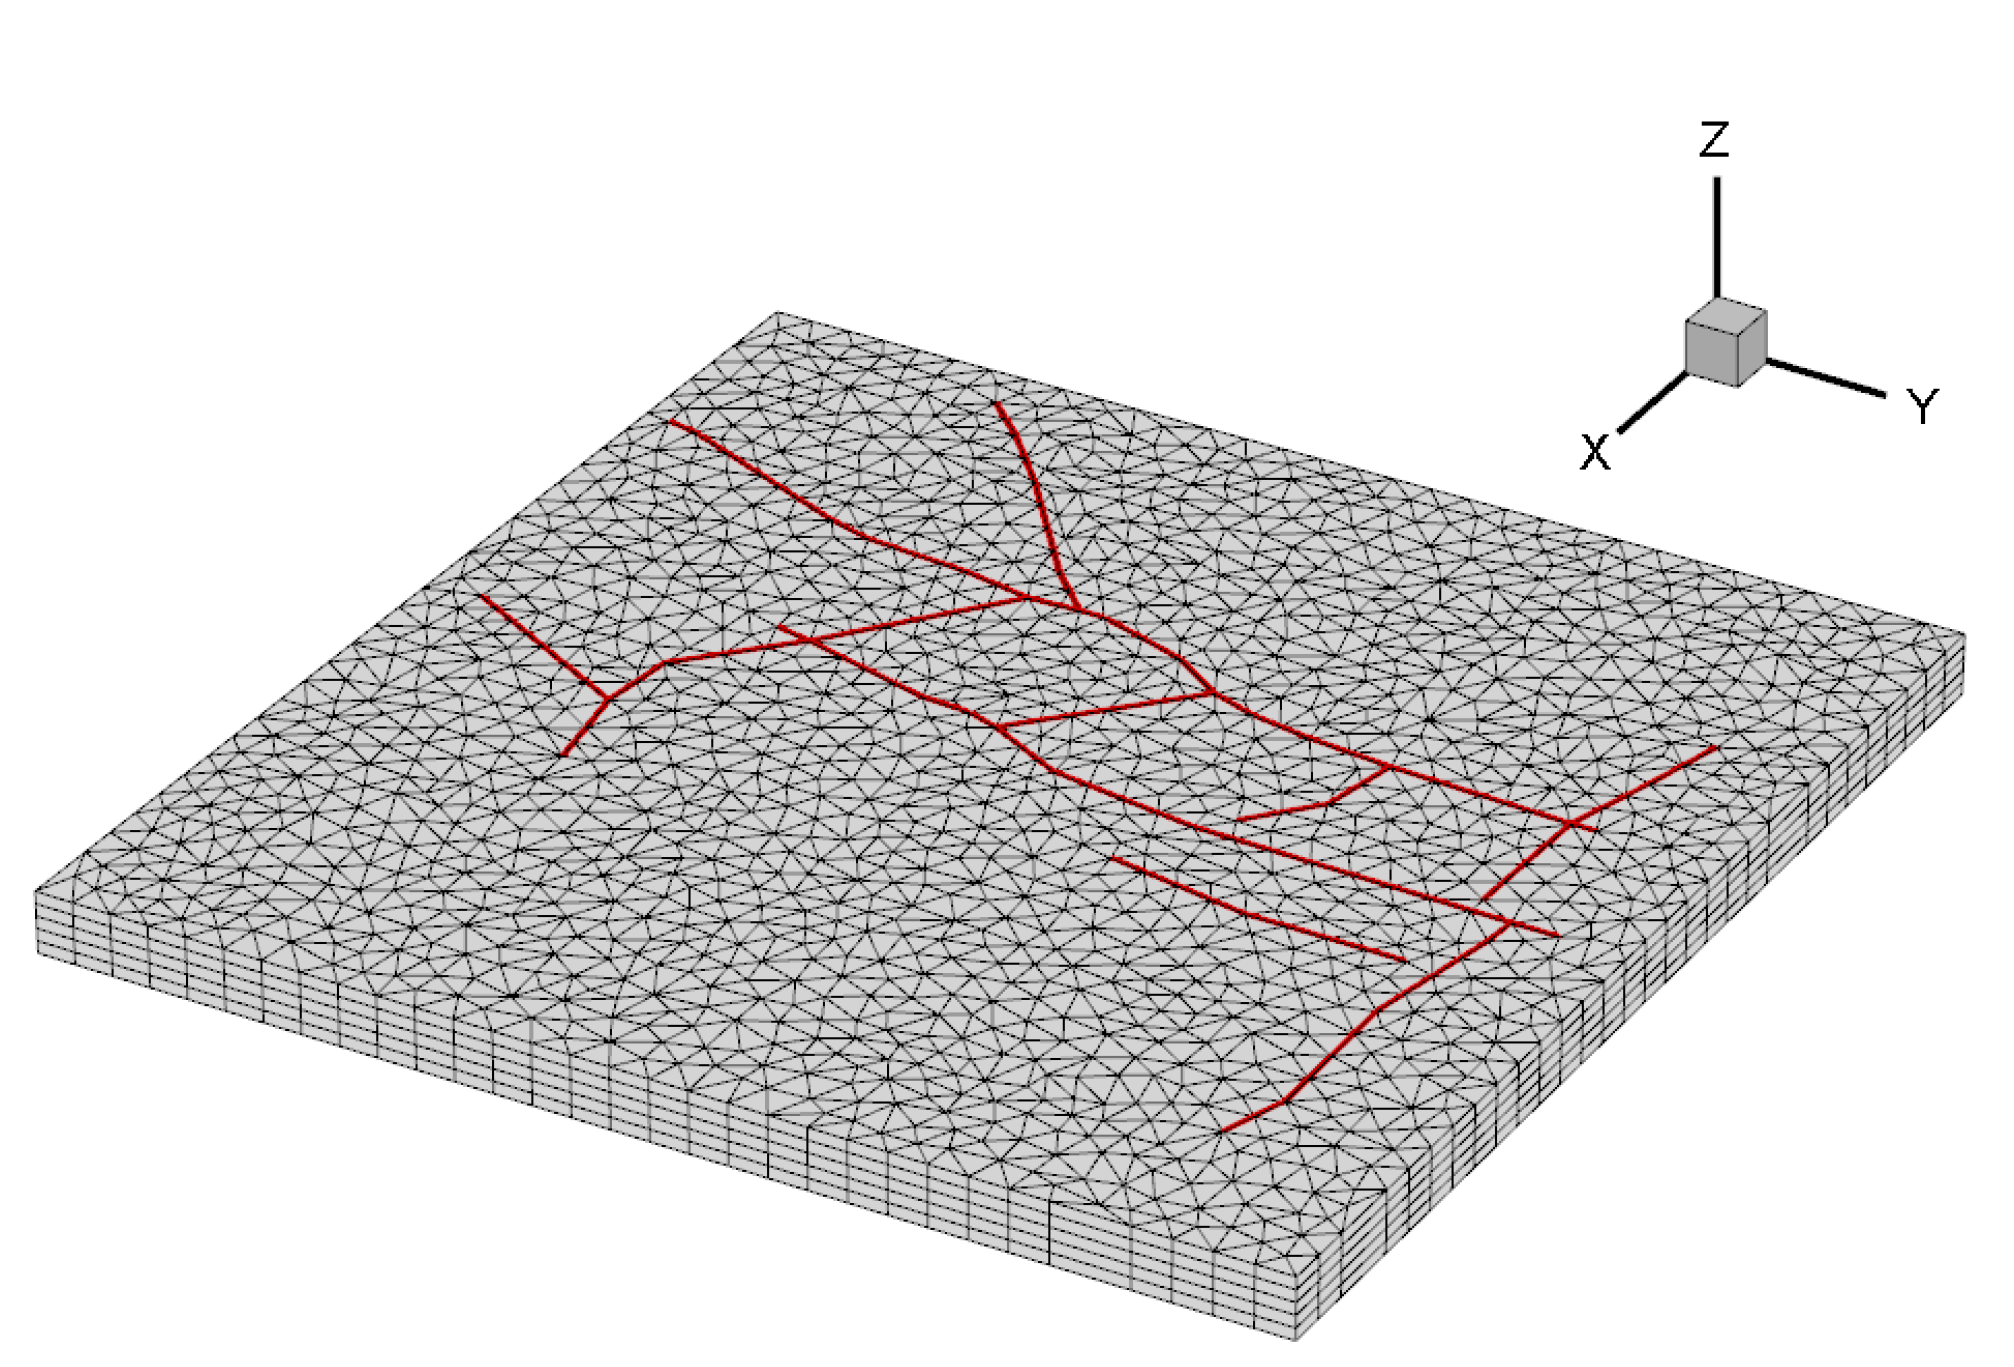
3.2. Case 2: 3D Heterogeneous ECBM Simulation with Prismatic Meshing

3.2.1. Base Case

In this section, we apply the newly developed model to a heterogeneous 3D model. The geological model is modified from a reported dataset which is interpreted from a 3D seismic survey [46]. An injection well is located in the center of the reservoir while four producers are located in the corners (for well pattern A) or in the central boundaries (for well pattern B) (see Figure 9). Figure 10 shows the log-permeability for this 3D model. It can be seen that this is a highly heterogeneous coal reservoir with many irregular, sparsely distributed large-scale fractures (red lines). For simplicity, the fractures are assumed to extend throughout the entire depth of the reservoir. The fracture aperture is assumed to be 0.001 m. The S&D model is applied to account for the variation in the cleat permeability due to geomechanical effects. Other geological properties and the component properties (e.g., pure component sorption isotherm for CH4, CO2 and N2) are the same as in the benchmark case. A 100% initial water saturation is assumed for the cleat system. No-flow boundary conditions are applied at both the vertical and lateral boundaries to ensure no gas leakage occurs.
Figure 9. Geological structure of coal reservoir.
Energies 08 06153 g009
Figure 10. Log-normal permeability field.
Energies 08 06153 g010
In the vertical direction, we divide the model into five layers. Figure 11 displays the prismatic grids with the large-scale fractures shown in red. There are 9450 nodes, 41,178 facets and 15,140 prisms for this model. Only 605 facets are used to fully represent all of the large-scale fractures.
Figure 11. Prismatic meshing of heterogeneous case.
Energies 08 06153 g011
We first consider a primary CBM process and a CO2-ECBM process. For CBM production, four producers are placed with pattern A and each producer is operated with fixed well bottomhole pressure (BHP) at 270 kPa. Well completions are performed through all five layers. In the ECBM run, the injection well is placed at the center of the reservoir with well completion only at the third layer. Pure CO2 is injected at a constant rate of 84,950 m3/day. For both cases, we run the simulation for 800 days.
Figure 12 displays the comparison of the field CH4 production rates for CBM and CO2-ECBM. The production curves show a sharp rise followed by a small-scale falloff. A peak production rate is reached at about 80 days for both CBM and CO2-ECBM processes. The higher methane production rate before the peak production time is contributed to the improvement of gas relative permeability during dewatering process. After the peak point, the production rate declines continuously due to the decrease in CH4 desorption, especially for CO2-ECBM. At the end of the simulation, CBM run can still maintain a relatively low production rate while nearly no CH4 is produced for CO2-ECBM run.
The CH4 recovery factors for CBM and CO2-ECBM are compared in Figure 13. It is seen that the final recovery factor for primary CBM is around 75%, while this recovery factor is increased to almost 100% by CO2 injection. This verifies CO2-ECBM can significantly improve the CH4 production with higher production rate.
Figure 14 is the remaining methane concentration in the coal reservoir for CO2-ECBM after 30 days’ injection. We see that the regions close to the producers and the injector show a lower CH4 concentration due to desorption. However, the mechanisms that controls the desorption process are different. For regions close to the producers, CH4 desorption is dominated by the decrease in overall pressure, while for region close to the injector it is the decrease of CH4 molar fraction that causes the desorption.
Figure 15 shows the CO2 concentration after 30 days’ injection. We see that the main flow paths for CO2 are along the large-scale factures and the neighboring high-permeability regions. The sweep efficiency is quite low since it is difficult for CO2 to enter regions with low permeability. This indicates that the fracture distribution and the corresponding reservoir permeability heterogeneity have a significant impact on flow behaviors. As a result, the production performances for individual producers vary significantly. Figure 16 and Figure 17 show the CH4 and CO2 production rates for the four producers. We see that well A1 and well A4 produce CH4 much quicker than the other two producers, and the CO2 breakthrough time is significantly earlier for A1 and A4 wells. This is because that the connectivity between the injector and producers A1 and A4 are higher than the other two producers, which can be seen clearly in the permeability distribution.
Figure 12. Comparison of field CH4 production rate for CBM and CO2-ECBM.
Energies 08 06153 g012
Figure 13. Comparison of CH4 recovery factor for CBM and CO2-ECBM.
Energies 08 06153 g013
Figure 14. Adsorbed concentration of CH4 after 30 days’ injection (unit: 1.0 × 10⁻³ m3/kg coal).
Energies 08 06153 g014
Figure 15. Adsorbed concentration of CO2 after 30 days’ injection (unit: 1.0 × 10⁻³ m3/kg coal).
Energies 08 06153 g015
Figure 16. CH4 production rates for well pattern A.
Energies 08 06153 g016
Figure 17. CO2 production rates for well pattern A.
Energies 08 06153 g017
Figure 18 and Figure 19 present the permeability ratio after 30 days’ production for CBM and CO2-ECBM, respectively. In Figure 18, the permeability ratio of the immediate region close to the producers is about two. However, for the region far away from the producers, the ratio falls to 0.8. This means that the CH4 desorption induced shrinkage and swelling with a low pressure can enhance the permeability around the producers. In Figure 19, the permeability ratio of CO2 flooded area (blue region) is as low as 0.2. This indicates that the swelling effect due to sorption of CO2 significantly reduces the coal permeability. This permeability decrease will then result in a significant drop in injectivity for the injector. Thus, a high injection pressure is required to maintain the constant injection rate.
Figure 18. Permeability ratio at the top layer after 30 days’ primary CBM production.
Energies 08 06153 g018
Figure 19. Permeability ratio at the top layer after 30 days’ gas injection.
Energies 08 06153 g019

3.2.2. Ternary flooding of N2-CO2-ECBM

As discussed in the previous case, the injected CO2 will lead to a significant reduction in well injectivity, which then influences the production performance. To mitigate this problem, the injection of gas component with weaker swelling effect is considered. Thus, a ternary flooding system of N2-CO2-ECBM is designed. The injected gas is now a mixture of CO2 (50% in molar composition) and N2 (another 50%). The injection rate and all the other properties are identical to the previous case.
Figure 20 shows the total molar fraction of CO2 and N2 after 30 days, which indicates the swept area of the injected gas mixture. We see that the swept area is significantly larger in this case than in the base case for CO2-ECBM (indicated by CO2 molar fraction in Figure 15). Figure 21 is the permeability ratio after 30 days using N2-CO2-ECBM. It is clear that reservoir permeability in this case is much larger than in the base case (Figure 19) due to less swelling effect. Correspondingly, the injection pressure is significantly lower in this case (Figure 22). However, an adverse effect of N2-CO2-ECBM is also observed. Because of the lower absorptivity of N2, it propagates faster than CO2 which leads to an earlier breakthrough of the injected gas mixture and thus reduces the quality (CH4 purity) of the produced gas (Figure 23).
Figure 20. Total molar fraction of CO2 and N2 after 30 days’ injection.
Energies 08 06153 g020
Figure 21. Permeability ratio profile at top layer after 30 days’ injection.
Energies 08 06153 g021
Figure 22. Comparison of injector BHP for CO2-ECBM and N2-CO2-ECBM.
Energies 08 06153 g022
Figure 23. CH4 molar fraction for producers with N2-CO2-ECBM.
Energies 08 06153 g023

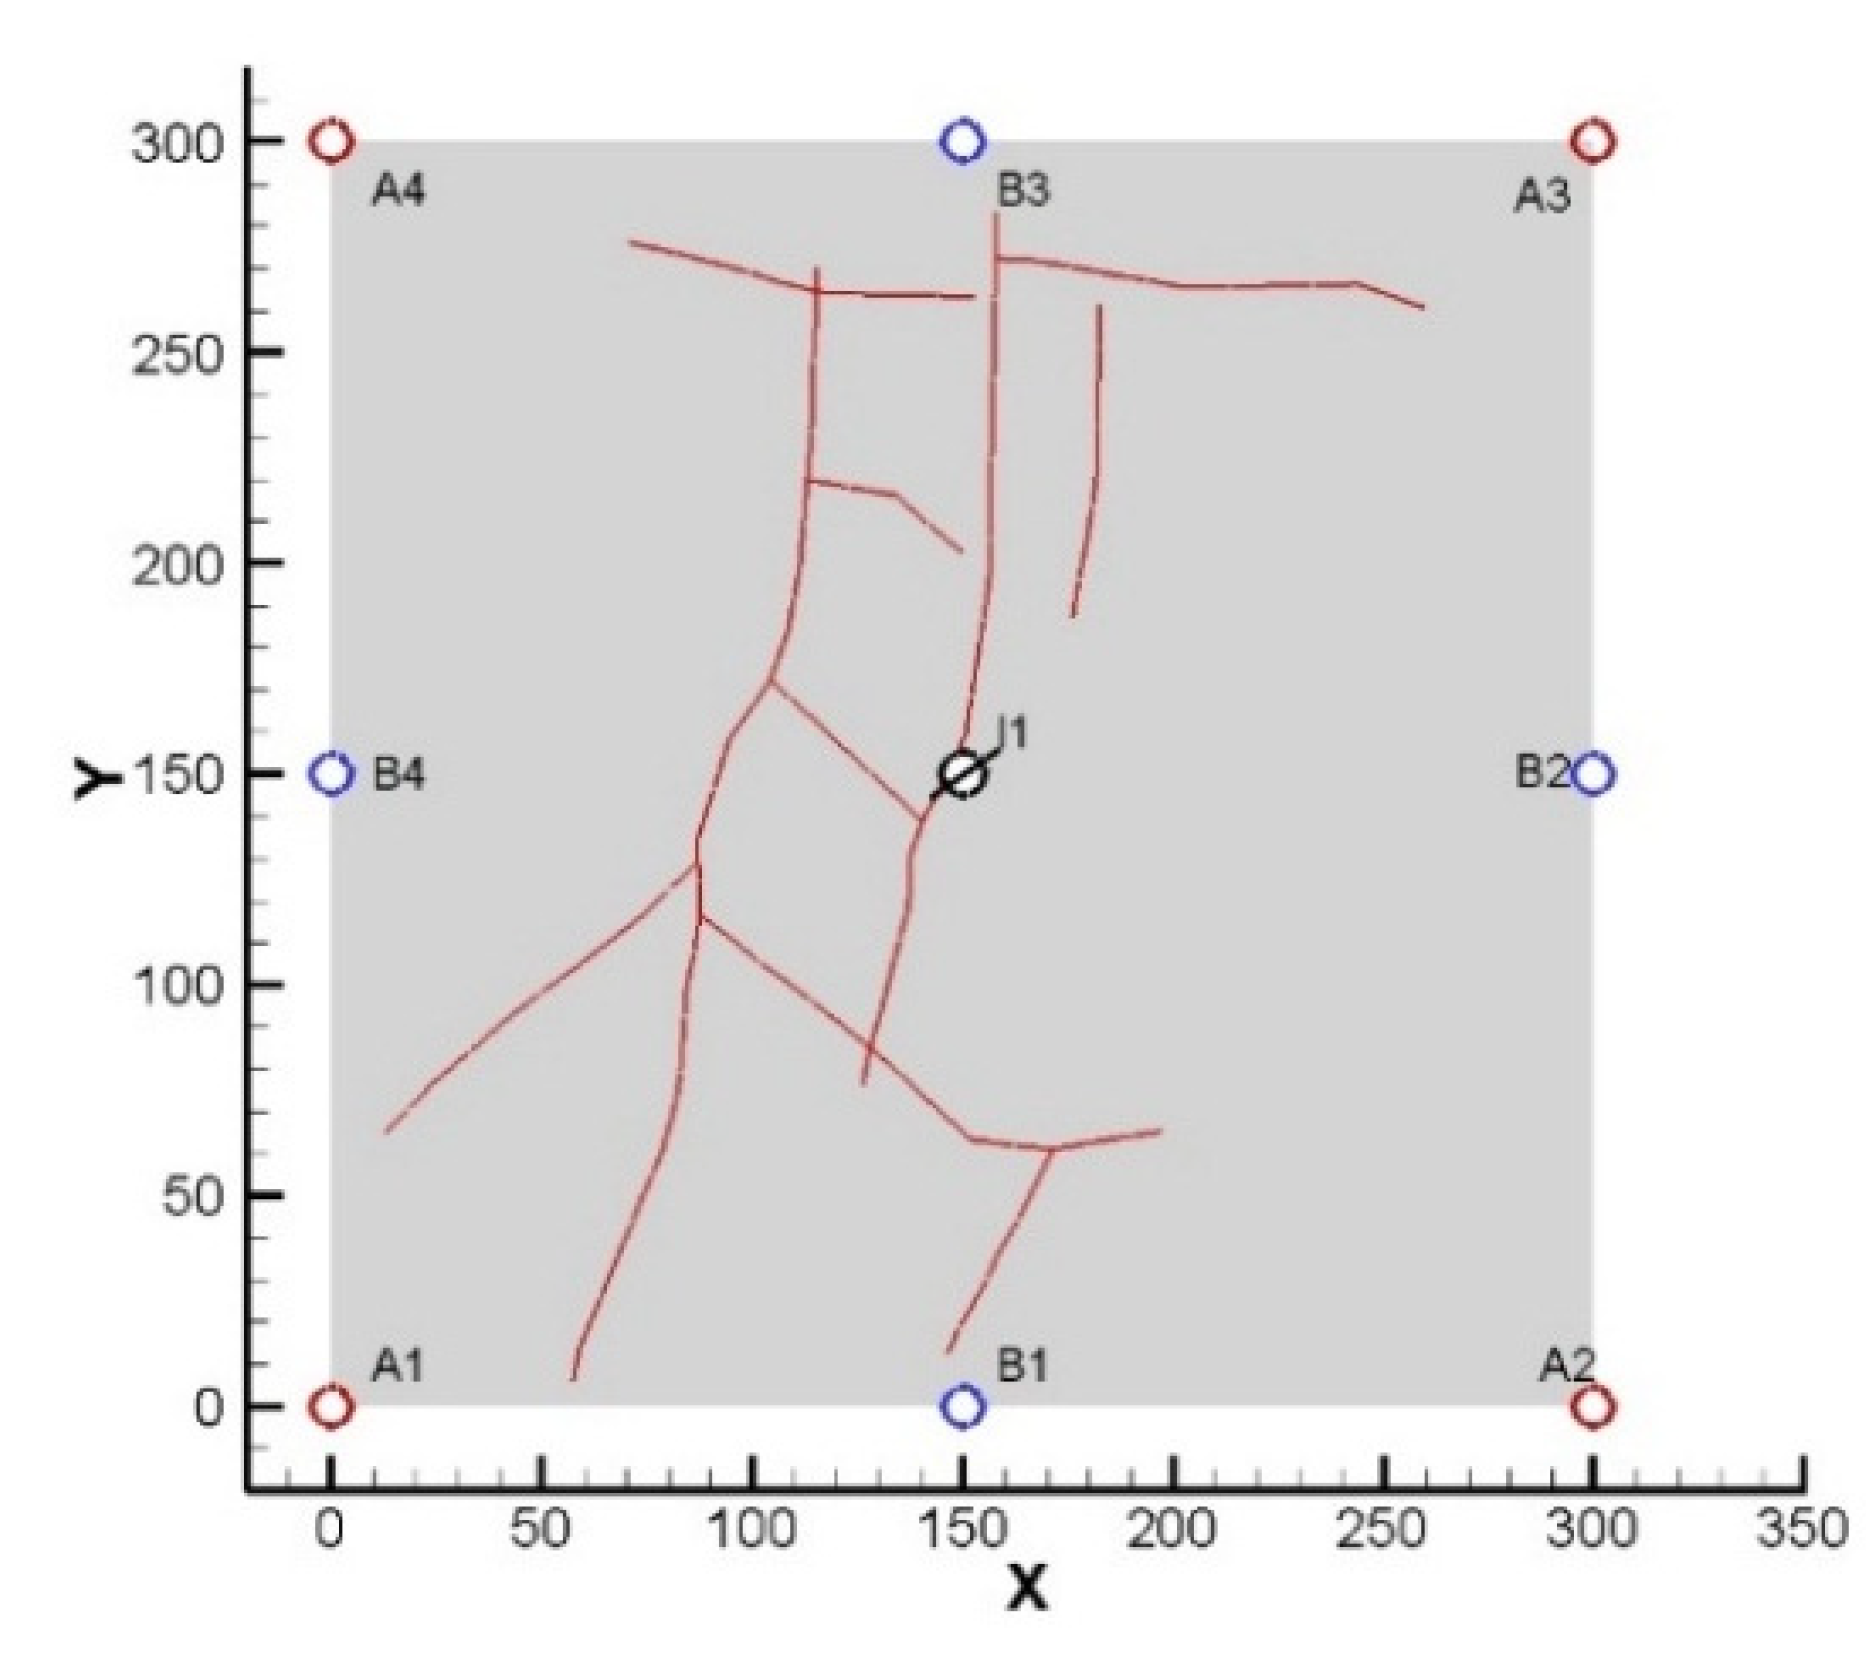
3.2.3. Effect of Well Patterns

Well pattern B is introduced to investigate the effect of well locations on the production performance. We keep all the other parameters the same. Figure 24 shows the production rates for the four producers. Similar to well pattern A, it is evident that the permeability heterogeneity again plays an important role in the production behavior for individual producers. For example, for well B3, we see a significantly higher peak CH4 production and the production rate declines very quickly, which results from the high connectivity between injector and well B3 as can also be seen in CO2 concentration distribution in Figure 25. Consequently, CO2 breakthrough time using pattern B is quicker than using pattern A (shown in Figure 26).
Figure 27 is the comparison of total CH4 recovery factor for pattern A and pattern B. Although pattern B produces CH4 quicker than pattern A at the early time, the final recovery factor for pattern B is still lower. This illustrates the impact of well locations to methane production performance should be especially considered. A comprehensive production optimization is required to determine the optimal well locations.
Figure 24. Production rates for well pattern B.
Energies 08 06153 g024
Figure 25. Adsorbed concentration of CO2 for well pattern B after 30 days’ injection (unit: 1.0 × 10⁻³ m3 /kg coal).
Energies 08 06153 g025
Figure 26. CO2 breakthrough history.
Energies 08 06153 g026
Figure 27. Comparison of methane recovery factor.
Energies 08 06153 g027

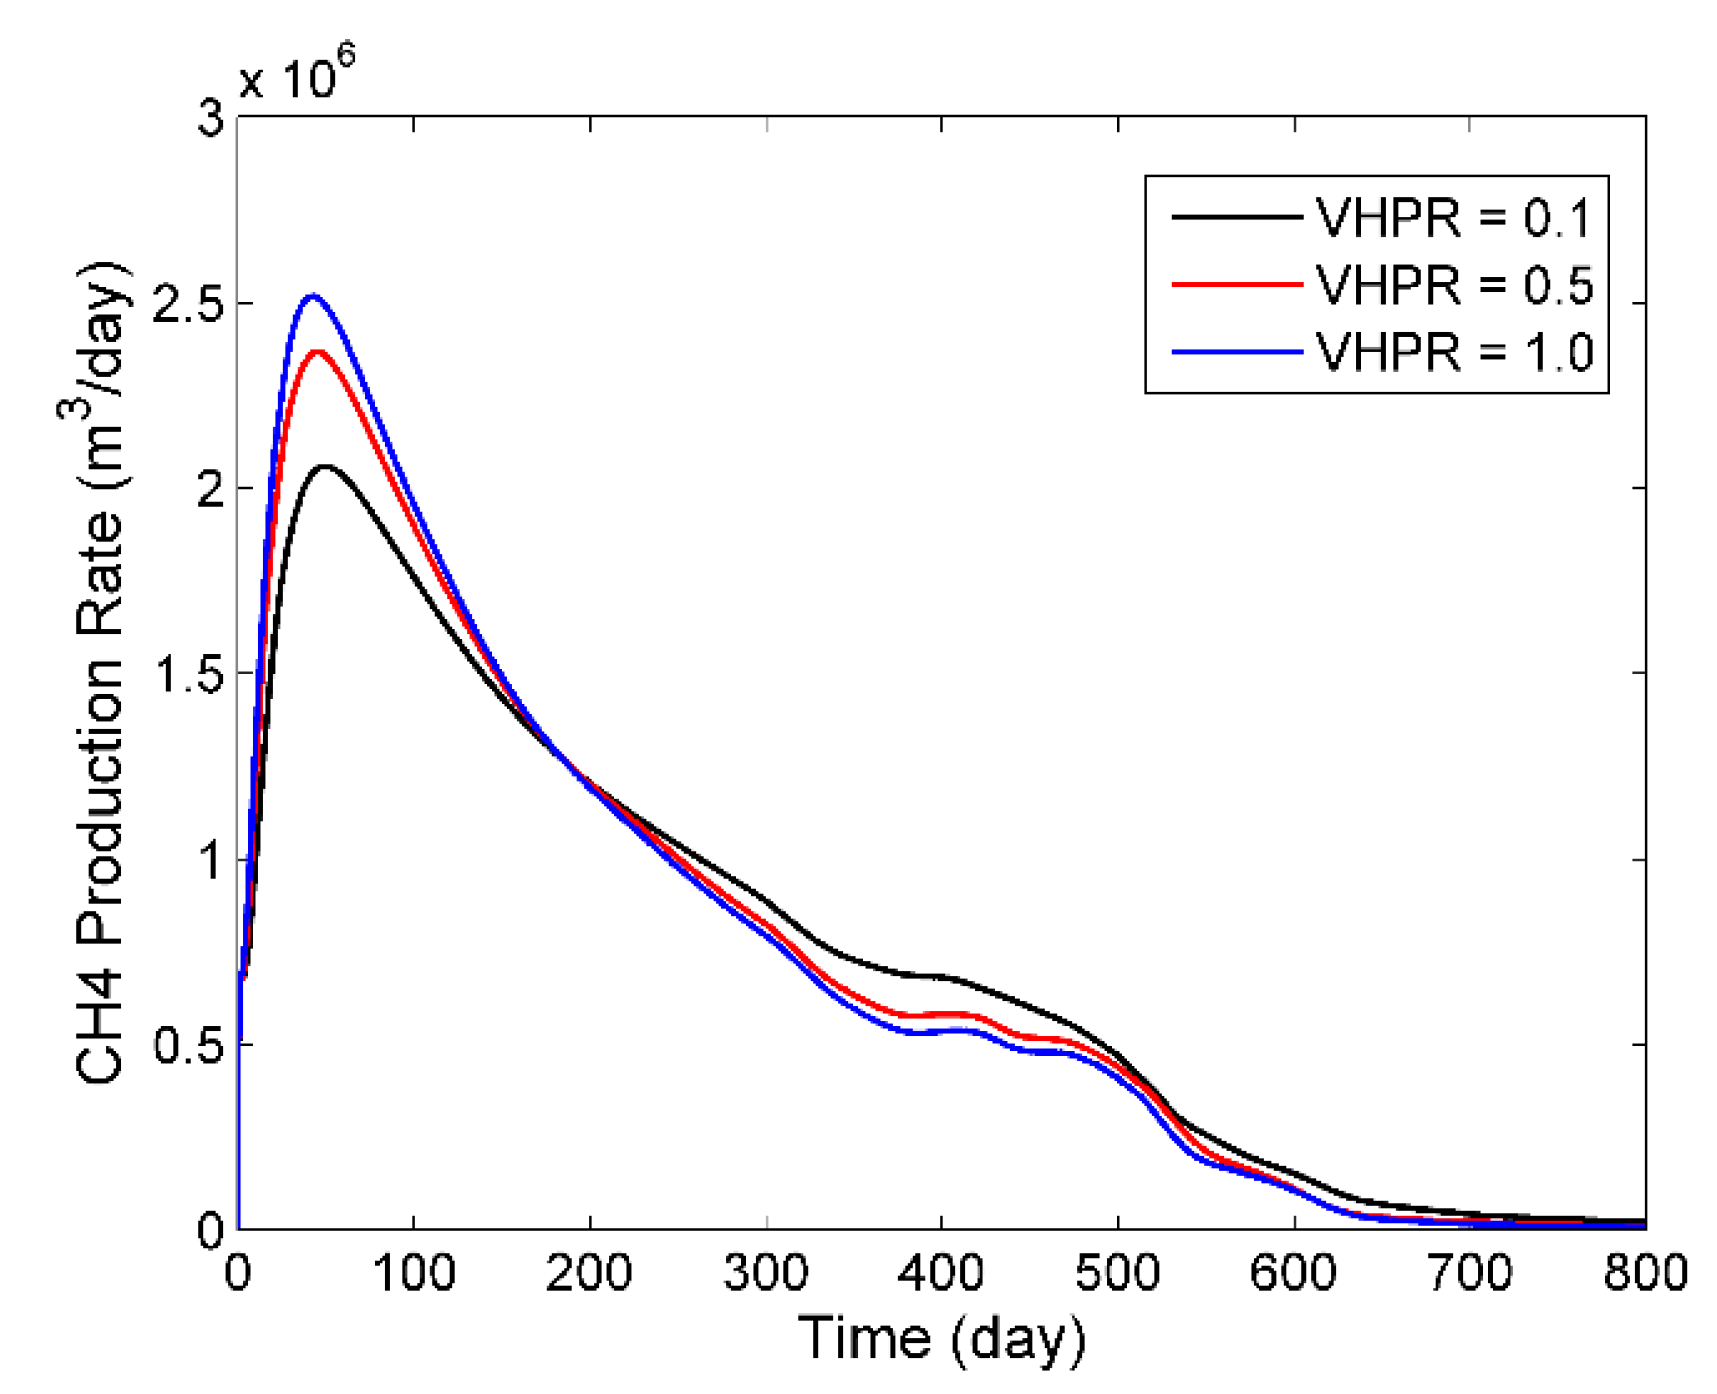
3.2.4. Effect of Buoyancy

Gas buoyancy also impacts the production of CBM/ECBM processes, which has not been considered before. When gas is released from the coal matrix, or injected from injectors, the buoyancy effect drives the gas flowing upward because of its lower density relative to water. Figure 28 shows the gas saturation profile for the previous CO2-ECBM case with pattern A. It is seen that the top layer is almost fully saturated with gas after 30 days’ CO2 injection. In contrast, the bottom layer is mostly water saturated.
The strength of gas migration is governed by permeability in the vertical direction. To investigate further the effect of gas buoyancy on gas production, we construct another two scenarios with vertical-horizontal permeability ratio (VHPR) of 0.1 and 0.5, respectively (note that previous CO2-ECBM run has VHPR equals to 1). Comparison of field methane production rates is shown in Figure 29. We see that as the vertical permeability increases, the peak production rate gets higher. This is because that a higher vertical permeability leads to higher gas accumulation in the top layer, which then leads to higher phase mobility for gas flowing towards the producers.
Figure 28. Gas saturation at the top layer (a) and bottom layer (b) after 30 days’ injection.
Energies 08 06153 g028
Figure 29. CH4 production rates with various vertical-horizontal permeability (VHPR).
Energies 08 06153 g029

4. Conclusions and Future Work

In this study, we developed a new approach to model ECBM recovery. This approach, for the first time, presents a discrete fracture characterization with prismatic meshing scheme to explicitly simulate the large-scale fractures in a 3D coalbed methane reservoir. The conventional dual-continuum approach was used to model the diffusion process in matrix-cleat system, while DFM was used to model fluid flow in fractured system. The S&D model was implemented to specify the permeability change due to geomechanical effects. Using the method, flow in complex large fractures is described appropriately with fewer grids, hence saving the computational cost. Moreover, the method is suitable for coalbed methane reservoirs with layered permeability distribution as K-orthogonal in the vertical direction is maintained.
We first validate the new method using a benchmark case with no large-scale fractures. Numerical results show that the new model is able to match the results using a commercial reservoir simulator. We next apply the method to a synthetic 3D heterogeneous reservoir with complex large-scale fractures. The impact of large-scale fractures on the flow behaviors has been demonstrated clearly during the CO2-ECBM process. It also depicts sorption induced shrinkage and swelling may have either positive or negative impact on methane production. Injection of mixed gas with N2 can mitigate the swelling effect. However, the produced CH4 would be easily contaminated by the injected N2. Results of CO2-ECBM with different well patterns indicate producers with high connectivity to the injectors tend to have higher production rates, but also suffer the earlier breakthrough of the injected gas. Finally, an enhancement of gas peak production due to gas buoyancy effect is founded.
There are a number of issues should be considered in future work. The method discussed in this paper provides an attractive way for simulating hydraulic fracturing which is a significant process for the extraction of coalbed methane from typically low permeability coal reservoirs. Currently, a work on coupling the Displacement Discontinuity Method with DFM is undertaken which can be used to model the fracture propagation process as well as the geomechanical impact on the hydraulic or natural fractures. We expect our method will be able to model realistic coalbed methane reservoirs after addressing these issues.

Acknowledgments

The authors would like to thank Stanford University Reservoir Simulation Research Consortium (SUPRI-B) for granting the access to the General Purpose Research Simulator. Part of the work is sponsored by China National Advanced Technology Research & Development Program (863 Program) under the project 2013AA064901, and we would like to thank PetroChina Limited for their generous support.

Author Contributions

Yongbin Zhang designed and implemented the simulation model under the supervision of Bin Gong. Junchao Li provided the geological model for simulation studies. Huiying Tang provided important suggestions for paper revision and proposed the Displacement Discontinuity Method for further work. Hangyu Li reviewed the final work and provided useful suggestions. All authors contributed to writing the paper.

Conflicts of Interest

The authors declare no conflict of interest.

References

  1. Gentzis, T. Subsurface sequestration of carbon dioxide—An overview from an Alberta (Canada) perspective. Int. J. Coal Geol. 2000, 43, 287–305. [Google Scholar] [CrossRef]
  2. Stevens, S.H.; Spector, D.; Riemer, P. Enhanced Coalbed Methane Recovery Using CO2 Injection: Worldwide Resource and CO2 Sequestration Potential. In International Oil & Gas Conference and Exhibition in China (IOGCEC); Society of Petroleum Engineers: Richardson, TX, USA, 1998. [Google Scholar]
  3. Gale, J.; Freund, P. Coal Bed Methane Enhancement with CO2 Sequestration Worldwide Potential. Environ. Geosci. 2001, 8, 210–217. [Google Scholar] [CrossRef]
  4. Puri, R.; Yee, D. Enhanced Coalbed Methane Recovery. In Proceedings of the SPE Annual Technical Conference and Exhibition, New Orleans, LA, USA, 23–26 September 1990; SPE-20732-MS. pp. 254–368.
  5. Puri, R. A micro-pilot approach to coalbed methane reservoir assessment. In Fuel and Energy Abstracts; Elsevier: Amsterdam, The Netherland, 1996; p. 419. [Google Scholar]
  6. Pan, Z.; Connell, L.D.; Camilleri, M.; Connelly, L. Effects of matrix moisture on gas diffusion and flow in coal. Fuel 2010, 89, 3207–3217. [Google Scholar] [CrossRef]
  7. Arri, L.; Yee, D.; Morgan, W.; Jeansonne, M. Modeling Coalbed Methane Production with Binary Gas Sorption. In Proceedings of the SPE Rocky Mountain Regional Meeting, Casper, WY, USA, 18–21 May 1992; SPE-24363-MS. pp. 18–21.
  8. Ruthven, D.M. Principles of Adsorption and Adsorption Processes; John Wiley & Sons: Hoboken, NJ, USA, 1984. [Google Scholar]
  9. Yang, R. Gas Separation by Adsorption Processes; Pergamon: Bergama, Turkey, 1988. [Google Scholar]
  10. Pan, Z.; Connell, L.D. Comparison of adsorption models in reservoir simulation of enhanced coalbed methane recovery and CO2 sequestration in coal. Int. J. Greenh. Gas Control 2009, 3, 77–89. [Google Scholar] [CrossRef]
  11. King, G.; Ertekin, T. A survey of mathematical models related to methane production from coal seams, Part I–Empirical and equilibrium sorption models. In International Coalbed Methane Symp; University of Alabama: Tuscaloosa, AL, USA, 1989; pp. 125–138. [Google Scholar]
  12. Shi, J.; Durucan, S. A bidisperse pore diffusion model for methane displacement desorption in coal by CO2 injection. Fuel 2003, 82, 1219–1229. [Google Scholar] [CrossRef]
  13. Karimi-Fard, M.; Durlofsky, L.; Aziz, K. An efficient discrete-fracture model applicable for general-purpose reservoir simulators. SPE J. 2004, 9, 227–236. [Google Scholar] [CrossRef]
  14. Noorishad, J.; Mehran, M. An upstream finite element method for solution of transient transport equation in fractured porous media. Water Resour. Res. 1982, 18, 588–596. [Google Scholar] [CrossRef]
  15. Baca, R.; Arnett, R.; Langford, D. Modelling fluid flow in fractured-porous rock masses by finite-element techniques. Int. J. Numer. Methods Fluids 1984, 4, 337–348. [Google Scholar] [CrossRef]
  16. Kim, J.G.; Deo, M.D. Finite element, discrete-fracture model for multiphase flow in porous media. AIChE J. 2000, 46, 1120–1130. [Google Scholar] [CrossRef]
  17. Karimi-Fard, M.; Firoozabadi, A. Numerical simulation of water injection in fractured media using the discrete-fracture model and the Galerkin method. SPE Reserv. Eval. Eng. 2003, 6, 117–126. [Google Scholar] [CrossRef]
  18. Monteagudo, J.; Firoozabadi, A. Control-volume method for numerical simulation of two-phase immiscible flow in two-and three-dimensional discrete-fractured media. Water Resour. Res. 2004, 40. [Google Scholar] [CrossRef]
  19. Matthäi, S.; Mezentsev, A.; Belayneh, M. Control-Volume Finite-Element Two-Phase Flow Experiments with Fractured Rock Represented by Unstructured 3D Hybrid Meshes. In Proceedings of the SPE Reservoir Simulation Symposium, The Woodlands, TX, USA, 31 January–2 February 2005.
  20. Fu, Y.; Yang, Y.; Deo, M. Three-Dimensional, Three-Phase Discrete-Fracture Reservoir Simulator Based on Control Volume Finite Element (CVFE) Formulation. In Proceedings of the SPE Reservoir Simulation Symposium, The Woodlands, TX, USA, 31 January–2 February 2005.
  21. Durucan, S.; Edwards, J. The effects of stress and fracturing on permeability of coal. Min. Sci. Technol. 1986, 3, 205–216. [Google Scholar] [CrossRef]
  22. Seidle, J.; Jeansonne, M.; Erickson, D. Application of matchstick geometry to stress dependent permeability in coals. In Proceedings of the SPE Rocky Mountain Regional Meeting, Casper, WY, USA, 18–21 May 1992; SPE-24361-MS. pp. 18–21.
  23. Palmer, I.; Mansoori, J. How permeability depends on stress and pore pressure in coalbeds: A new model. In Proceedings of the SPE Annual Technical Conference and Exhibition, Denver, CO, USA, 6–9 October 1996.
  24. Shi, J.; Durucan, S. Changes in permeability of coalbeds during primary recovery—Part 1: Model formulation and analysis. In Proceedings of the 2003 International Coalbed Methane Symposium, University of Alabama, Tuscaloosa, AL, USA, 7–8 May 2003.
  25. Shi, J.-Q.; Durucan, S. A model for changes in coalbed permeability during primary and enhanced methane recovery. SPE Reserv. Eval. Eng. 2005, 8, 291–299. [Google Scholar] [CrossRef]
  26. Robertson, E.P.; Christiansen, R.L. Modeling permeability in coal using sorption-induced strain data. In Proceedings of the SPE Annual Technical Conference and Exhibition, Dallas, TX, USA, 9–12 October 2005.
  27. Connell, L.; Detournay, C. Coupled flow and geomechanical processes during enhanced coal seam methane recovery through CO2 sequestration. Int. J. Coal Geol. 2009, 77, 222–233. [Google Scholar] [CrossRef]
  28. Chen, Z.; Pan, Z.; Liu, J.; Connell, L.D.; Elsworth, D. Effect of the effective stress coefficient and sorption-induced strain on the evolution of coal permeability: Experimental observations. Int. J. Greenh. Gas Control 2011, 5, 1284–1293. [Google Scholar] [CrossRef]
  29. Pan, Z.; Connell, L.D. Modelling permeability for coal reservoirs: A review of analytical models and testing data. Int. J. Coal Geol. 2012, 92, 1–44. [Google Scholar] [CrossRef]
  30. Manik, J. Compositional Modeling of Enhanced Coalbed Methane Recovery; The Pennsylvania State University: University Park, PA, USA, 1999. [Google Scholar]
  31. Mazumder, S.; Karnik, A.A.; Wolf, K.-H. Swelling of coal in response to CO2 sequestration for ECBM and its effect on fracture permeability. SPE J. 2006, 11, 390–398. [Google Scholar] [CrossRef]
  32. Warren, J.; Root, P.J. The behavior of naturally fractured reservoirs. SPE J. 1963, 3, 245–255. [Google Scholar] [CrossRef]
  33. Pattison, C.; Fielding, C.; McWatters, R.; Hamilton, L. Nature and origin of fractures in Permian coals from the Bowen Basin, Queensland, Australia. Geol. Soc. Lond. Spec. Publ. 1996, 109, 133–150. [Google Scholar] [CrossRef]
  34. Nelson, C.R. Effects of geologic variables on cleat porosity trends in coalbed gas reservoirs. In Proceedings of the SPE/CERI Gas Technology Symposium, Calgary, AL, Canada, 3–5 April 2000.
  35. Odling, N.; Gillespie, P.; Bourgine, B.; Castaing, C.; Chiles, J.; Christensen, N.; Fillion, E.; Genter, A.; Olsen, C.; Thrane, L. Variations in fracture system geometry and their implications for fluid flow in fractured hydrocarbon reservoirs. Pet. Geosci. 1999, 5, 373–384. [Google Scholar] [CrossRef]
  36. Lohrenz, J.; Bray, B.G.; Clark, C.R. Calculating viscosities of reservoir fluids from their compositions. J. Pet. Technol. 1964, 16, 1171–1176. [Google Scholar] [CrossRef]
  37. Cao, H. Development of Techniques for General Purpose Simulators. Ph.D. Thesis, Stanford University, Stanford, CA, USA, 2002. [Google Scholar]
  38. Jiang, Y. Techniques for Modeling Complex Reservoirs and Advanced Wells. Ph.D. Thesis, Stanford University, Stanford, CA, USA, 2007. [Google Scholar]
  39. Fan, Y. Chemical Reaction Modeling in a Subsurface Flow Simulator with Application to in situ Upgrading and CO2 Mineralization. Ph.D. Thesis, Stanford University, Stanford, CA, USA, 2010. [Google Scholar]
  40. Karimi-Fard, M.; Gong, B.; Durlofsky, L. Generation of coarse-scale continuum flow models from detailed fracture characterizations. Water Resour. Res. 2006, 42. [Google Scholar] [CrossRef]
  41. Shewchuk, J.R. Delaunay refinement algorithms for triangular mesh generation. Comput. Geom. 2002, 22, 21–74. [Google Scholar] [CrossRef]
  42. Belayneh, M.; Geiger, S.; Matthi, S.K. Numerical simulation of water injection into layered fractured carbonate reservoir analogs. AAPG Bull. 2006, 90, 1473–1493. [Google Scholar] [CrossRef]
  43. Pan, Z.; Connell, L.D.; Camilleri, M. Laboratory characterization of coal reservoir permeability for primary and enhanced coalbed methane recovery. Int. J. Coal Geol. 2010, 82, 252–261. [Google Scholar] [CrossRef]
  44. GEM Version 2012 User’s Guide; Computer Modeling Group Ltd.: Calgary, AL, USA, 2009.
  45. Law, D.H.-S.; van der Meer, L.; Gunter, W. Numerical Simulator Comparison Study for Enhanced Coalbed Methane Recovery Processes Part I: Pure Carbon Dioxide Injection. In Proceedings of the SPE Gas Technology Symposium, Calgary, AL, Canada, 30 April–2 May 2002.
  46. Shuck, E.L.; Davis, T.L.; Benson, R.D. Multicomponent 3-D characterization of a coalbed methane reservoir. Geophysics 1996, 61, 315–330. [Google Scholar] [CrossRef]

