Article

Effects of Design/Operating Parameters and Physical Properties on Slag Thickness and Heat Transfer during Coal Gasification

School of Mechanical Engineering, Sungkyunkwan University, Suwon 440-746, Korea
*
Author to whom correspondence should be addressed.
Energies 2015, 8(5), 3370-3385; https://doi.org/10.3390/en8053370
Submission received: 12 March 2015 / Revised: 19 April 2015 / Accepted: 21 April 2015 / Published: 24 April 2015
(This article belongs to the Special Issue Recent Advances in Coal Combustion and Gasification)

Abstract

:
The behaviors of the slag layers formed by the deposition of molten ash onto the wall are important for the operation of entrained coal gasifiers. In this study, the effects of design/operation parameters and slag properties on the slag behaviors were assessed in a commercial coal gasifier using numerical modeling. The parameters influenced the slag behaviors through mechanisms interrelated to the heat transfer, temperature, velocity, and viscosity of the slag layers. The velocity profile of the liquid slag was less sensitive to the variations in the parameters. Therefore, the change in the liquid slag thickness was typically smaller than that of the solid slag. The gas temperature was the most influential factor, because of its dominant effect on the radiative heat transfer to the slag layer. The solid slag thickness exponentially increased with higher gas temperatures. The influence of the ash deposition rate was diminished by the high-velocity region developed near the liquid slag surface. The slag viscosity significantly influenced the solid slag thickness through the corresponding changes in the critical temperature and the temperature gradient (heat flux). For the bottom cone of the gasifier, steeper angles were favorable in reducing the thickness of the slag layers.

1. Introduction

Many commercial coal gasification processes such as the Shell, Prenflo, Mitsubishi, Tsinghua and Siemens ones utilize entrained flow reactors feeding pulverized coal in dry or slurry forms [1,2,3]. Because the syngas temperature typically increases above the ash melting point, most of the coal ash is molten and deposits onto the gasifier wall to form slag layers. The fraction of slag contacting the cold wall is immobilized (solid layer), whereas that facing the hot syngas flows downward by gravity (liquid slag). At the bottom of the gasifier, the liquid slag is discharged through a slag tap to a water bath and quenched. These slag layers play an essential role in protecting the wall from excessive heat and chemical attack by the hot acidic gases.
Because of its importance in ash discharge, wall protection, and heat recovery, controlling the slag behavior is a crucial issue for the design and operation of entrained flow gasifiers [3,4]. The ash fusion temperature and slag viscosity are important properties in relation to the flowability and thickness of the liquid slag, which are determined by inherent properties such as the ash composition and chemistry, as well as external conditions such as the temperature and reaction atmosphere [5,6,7,8,9]. In order to minimize slag-related problems, coals with ash content and properties within an appropriate range should be selected [10,11]. For coals with high or low slag viscosity, additional supply of CaO-based flux or blending with other coals can be considered [12,13,14,15]. Together with the inherent slag properties and the design/operation parameters influence the slag behavior. For example, the syngas temperature within the gasifier dominates the depositing particle temperature and temperature profile developed within the liquid slag. Because the slag viscosity is strongly dependent on the temperature, the gas temperature can directly influence the slag thickness [16,17,18,19]. The size and shape of a gasifier are also important parameters that affect the ash deposition rate and angle of the gravity force applied to the slag [20]. However, it is not straightforward to understand their influences on the thickness, flow, and heat transfer characteristics of the slag layers, because complex mechanisms and variables are involved in the slag behaviors.
Our previous study [21] proposed a new numerical model to predict the flow and heat transfer of the slag layers, which can overcome the limitations of the analytical models of Seggani [22] and Yong et al. [20]. This model solves the governing equations for the slag layers by using the finite volume method to predict the details of their thickness, temperature, and velocity distribution along the gasifier wall. Because the model is not based on simplifications of the temperature profile and viscosity within the liquid slag layer, it can be used for various operating conditions of a gasifier and for different physical models of slag properties.
In this study, the numerical model was applied to understand the influences of the design/operation parameters and the slag properties in a large-scale coal gasifier. The parameters included the syngas temperature, mass rate and temperature of ash deposition, and height of the bottom cone in the gasifier. The slag properties included the viscosity, thermal conductivity and emissivity. These parameters were varied by 10% from the reference condition to evaluate their effects on the slag layer thicknesses, heat transfer rates and temperatures at the interfaces. The underlying physical mechanisms of the slag behaviors were examined by analyzing the details of the velocity and temperature profiles in the slag layers.

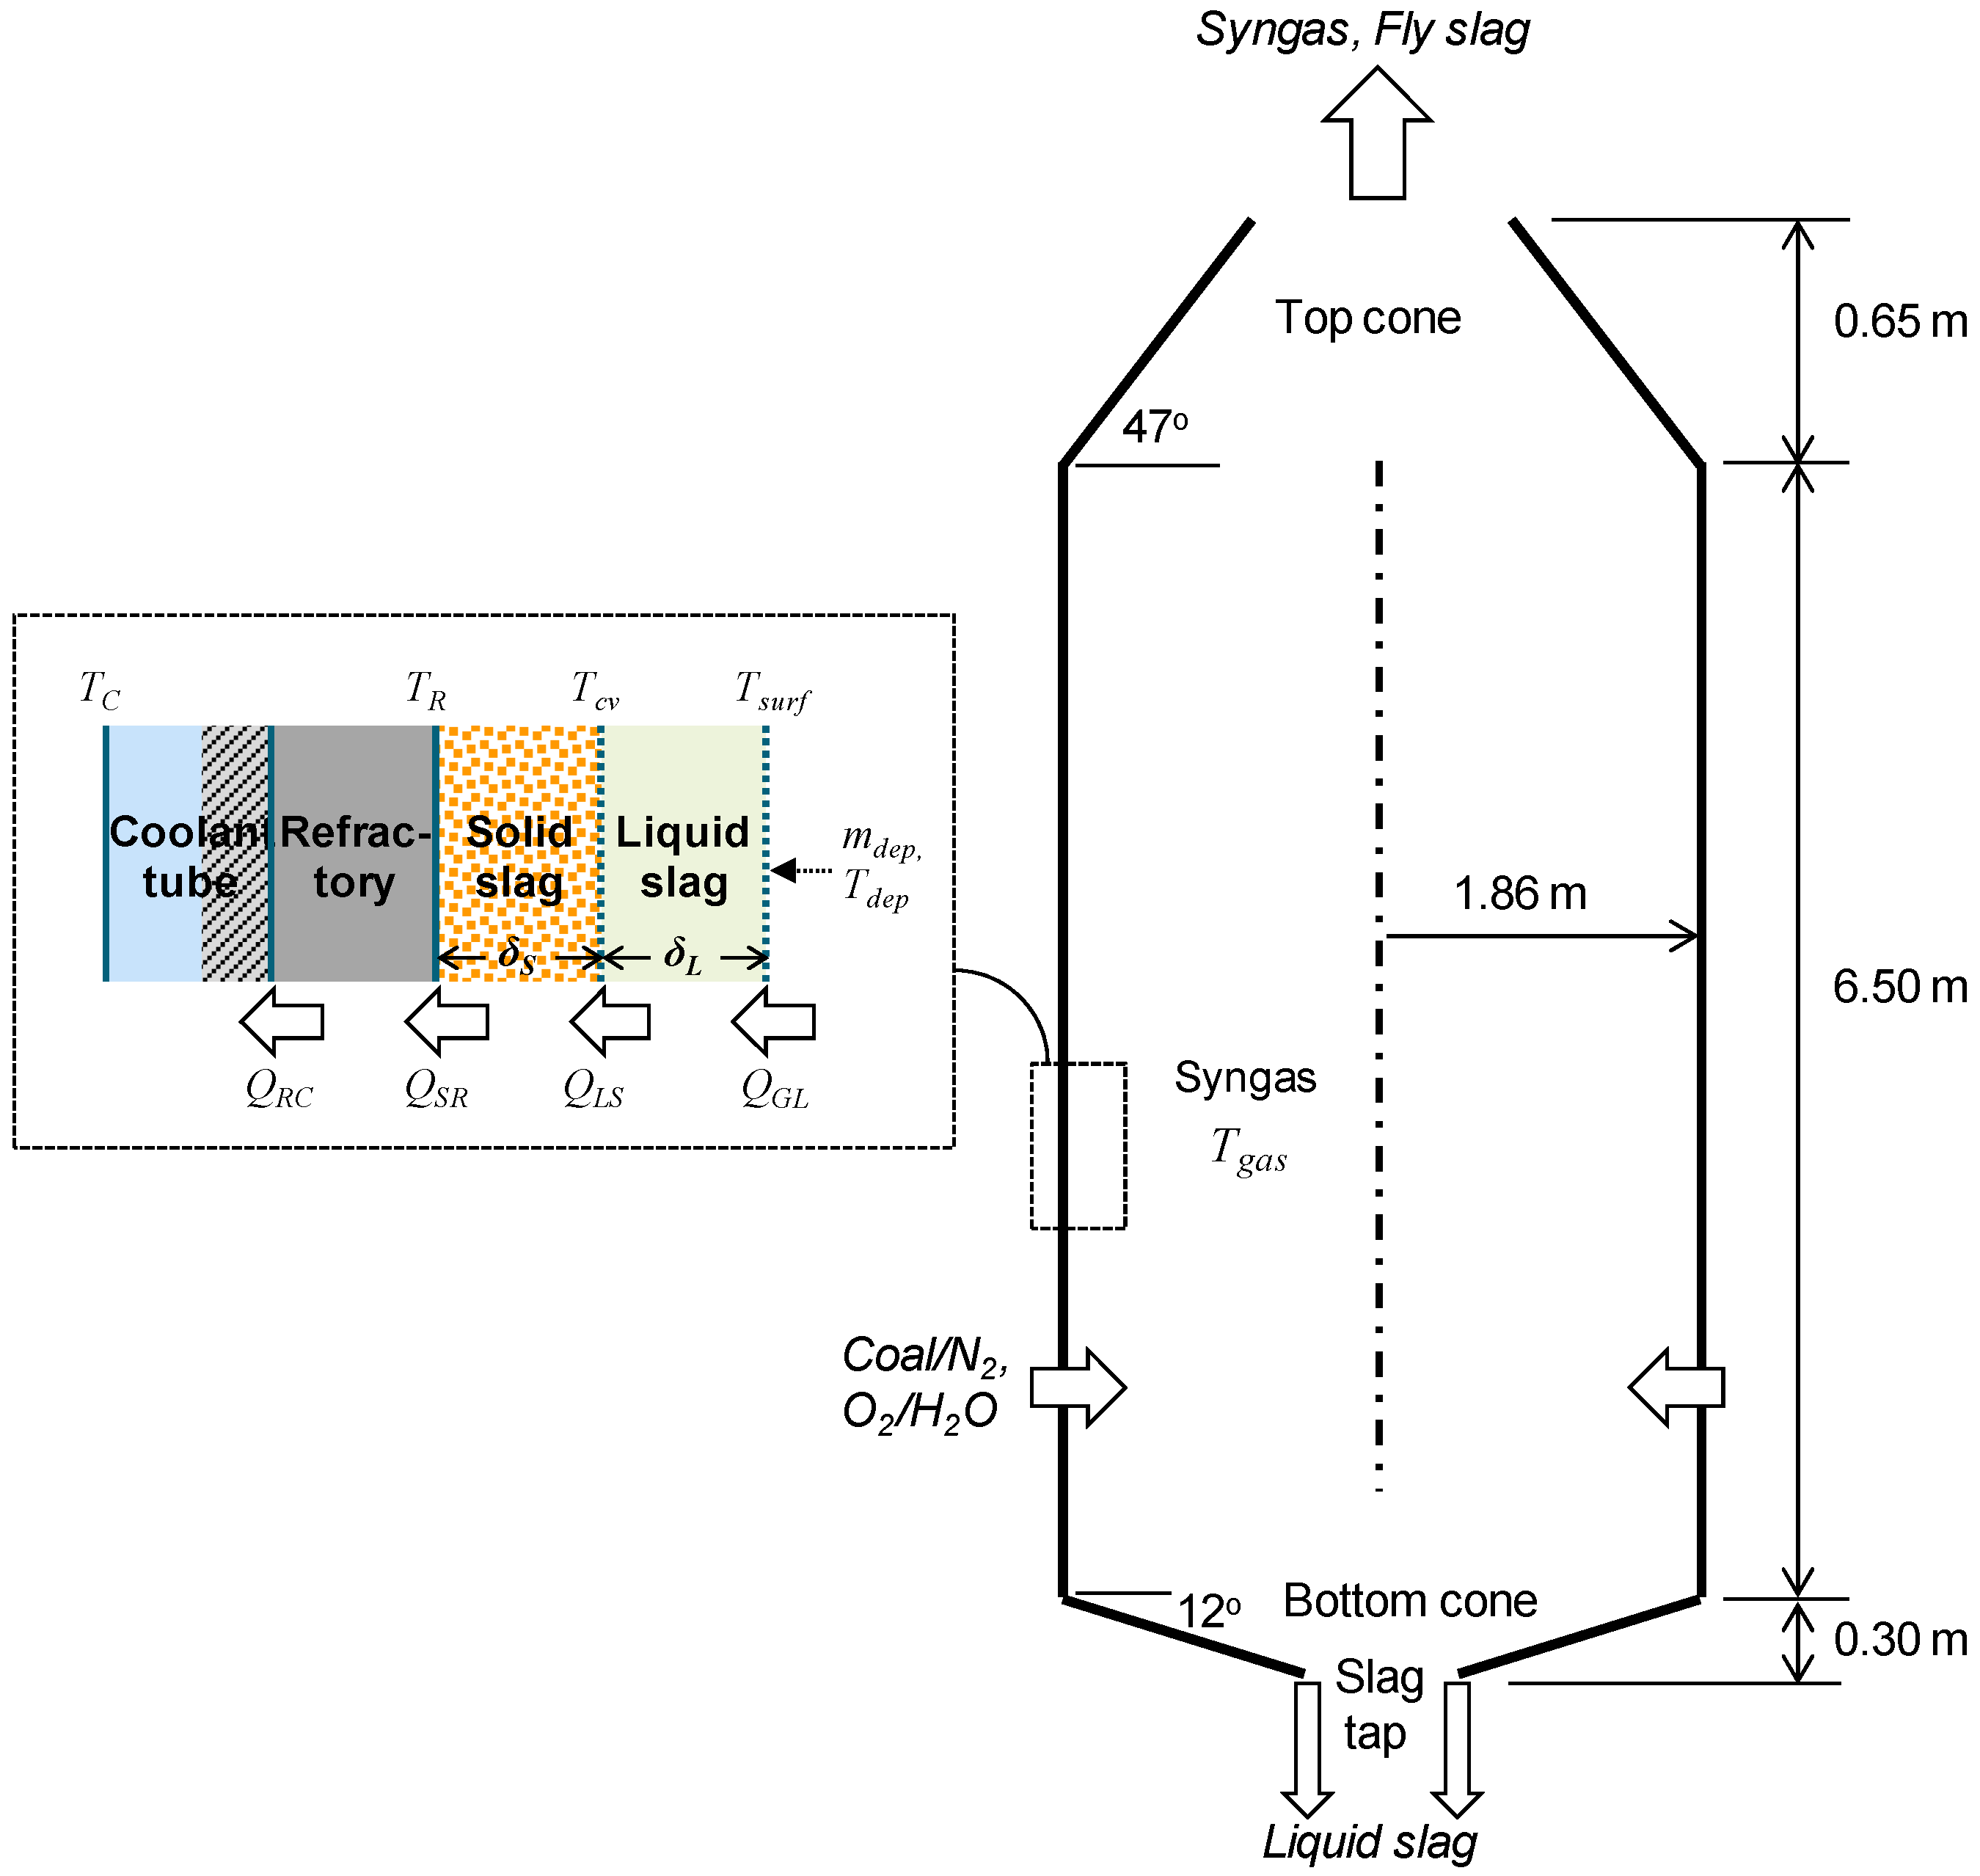
2. Numerical Methods and Test Parameters

Figure 1 shows a schematic of the Prenflo coal gasifier [22] considered in the parametric analysis. It consists of the main body, top cone and bottom cone. The bottom cone has a height of 0.30 m with a wall angle of 12°, leading to a slag tap with a radius of approximately 0.43 m.
Figure 1. Schematic of the gasifier considered in this study.
Energies 08 03370 g001
A numerical model for the slag flow and heat transfer in the gasifier was presented in detail in our previous study [21]. In brief, this model considers the following sets of governing equations for the mass (m), momentum (M) and energy (H) for a control volume within the liquid slag flow:
m o u t = m i n + m d e p
M o u t = M i n + M d e p + ( 2 π ( r + d r ) d y μ d v d r | r + d r 2 π r d y μ d v d r | r ) + ρ g sin α d V
H o u t = H i n + Δ H r e a c t + Q c o n d + H d e p + Q G L
In the above equations, the terms associated with the slag deposition (mdep, Mdep, and Hdep) and heat transfer from the gas (QGL) became zero for inner control volumes. The equations are discretized using the finite volume method on the cylindrical coordinates for a section of the liquid slag layer perpendicular to the wall, and solved to determine the thickness, velocity and temperature distribution. The sum of the thicknesses of the individual control volumes becomes the liquid slag thickness (δL).
The solution marches from the top to the bottom of the gasifier wall in the streamwise direction. The deposition of ash onto the surface of the liquid layer along the gasifier wall is treated as the addition of a new control volume. At the other end, the solid slag layer is considered as a boundary with a no-slip condition with a fixed temperature of Tcv. Tcv represents the temperature for the critical viscosity of 25 Pa·s, below which the slag flow becomes stagnant by a rapid increase of viscosity. Under the steady-state condition, the heat transfer at the interface of the liquid and solid slag (QLS) can be used to determine the solid slag thickness (δS) and the interface temperatures facing the refractory (TR). From the Fourier’s law for a cylindrical system:
Q L S = Q S R = A R k S T c v T R r R ln ( r R / r S )
δ S = r R r S
Note that Qcond at r = 0 in Equation (3) is expressed as QLS in Equation (4).
Table 1 lists the parameters associated with the gasifier design/operation and the slag properties evaluated by varying them 10% from the reference values. The reference values are based on the operating conditions in Seggiani’s study [22], but were simplified for parametric analysis. In the actual gasifier, the parameters such as Tgas and mdep would have considerable variations in both the streamwise and angular directions on the wall. These parameters also interact closely with each other, but were assumed to be independent in order to identify their influences on the slag behaviors and underlying mechanisms. The gas temperature (Tgas) at the reference condition was fixed at 1800 K along the wall. A change in Tgas accompanied the temperature of the ash deposition onto the wall (Tdep), which was assumed to be 50 K less. The ash deposition rate (mdep) at the reference condition was 5 kg/s, which was uniformly distributed per area along the wall. Tdep was also varied by 10% from the reference value of 1750 K, while Tgas remained fixed. As an important parameter for the gasifier shape, the bottom cone height was varied to 0.33 and 0.27 m, while the radius of the slag tap was fixed. The corresponding wall angles were 13.2° and 10.8°, respectively. The height of the main body is another important parameter for the gasifier design, but its effect on the slag behavior was found to be negligible under the reference condition with a fixed mdep for the section.
Table 1. Test parameters varied by ±10% for evaluation of their effects on slag behaviors.
Test ParametersReference ValueAccompanying Changes
Gas temp. (Tgas)1800 KTdep (=Tgas − 50) changed correspondingly
Ash deposition rate (mdep)5 kg/s
Ash deposition temp. (Tdep)1750 K
Bottom cone height0.30 mWith the fixed slag tap radius, the wall angle changed from 12° to 13.2° (+10%) and 10.8° (−10%)
Viscosity of liquid slag (μ)Equation (6)Tcv changed from 1548 K to 1557 K (+10%) and 1538 K (−10%)
Thermal conductivity of slag (k)Equation (7)
Emissivity of liquid slag (ε)0.83
With regard to the slag properties, the viscosity, thermal conductivity, and emissivity were also varied from the reference conditions. The property submodels were also described in detail in our previous study [21]. The viscosity of the reference condition was estimated using the correlation of Kalmanovich and Frank [23] as follows:
μ = 3.27 × 10 10 T exp ( 27420.6 / T )
The constant term (3.27 × 10⁻¹⁰) in the above equation was multiplied by 1.1 and 0.9 to vary the viscosity. This was accompanied by a change in Tcv at 25 Pa·s from 1548 K to 1538 K and 1558 K, respectively. The thermal conductivity was determined from the thermal diffusivity (k/ρCp) which was fixed at 4.5 × 10⁻⁷ m2/s [24]. The slag density was calculated using the slag composition and found to be 2507 kg/m3 [25]. The specific heat was also calculated using the correlation from the literature [24] and found to be 1.40 kJ/kg·K for the liquid and solid slag above the glass transition temperature (Tglass), and 0.922 + 1.796 × 10⁻⁴ T − 0.218/T2 kJ/kg·K for the solid slag below Tglass. Tglass was determined to be 992 K for a Cp of 1.1 kJ/kg·K [24]. Therefore, the thermal conductivity became:
Above Tglass: k = 1.58 (W/m∙K)
Below Tglass: k = 1.040+ 2.025 × 10⁻⁴T − 0.246/T2 (W/m∙K)
The surface emissivity of the liquid slag was also varied from 0.83 [24] to 0.747 and 0.913, which determined the heat transfer rate (QGL) by radiation.
In the boundary condition for heat transfer analysis, the coolant (water/steam) was assumed to have a fixed temperature of 523 K under evaporation with a heat transfer coefficient of 104 W/m2·K. The membrane tube for the coolant had a thermal conductivity of 43 W/m·K and thickness of 6.3 mm. The refractory lining between the membrane tube and solid slag had a thermal conductivity of 8 W/m·K and thickness of 16.0 mm [22].
To assess the influence of the parameters variation, the results were summarized for: (I) the thicknesses of the liquid slag (δL) and solid slag (δS) at the slag tap; (II) the total heat transfer rates from the gas to the liquid slag (QGL) and to the solid slag (QLS); and (III) the temperatures on the liquid slag surface (Tsurf) and refractory-solid slag interface (TR) at the slag tap.

3. Results and Discussion

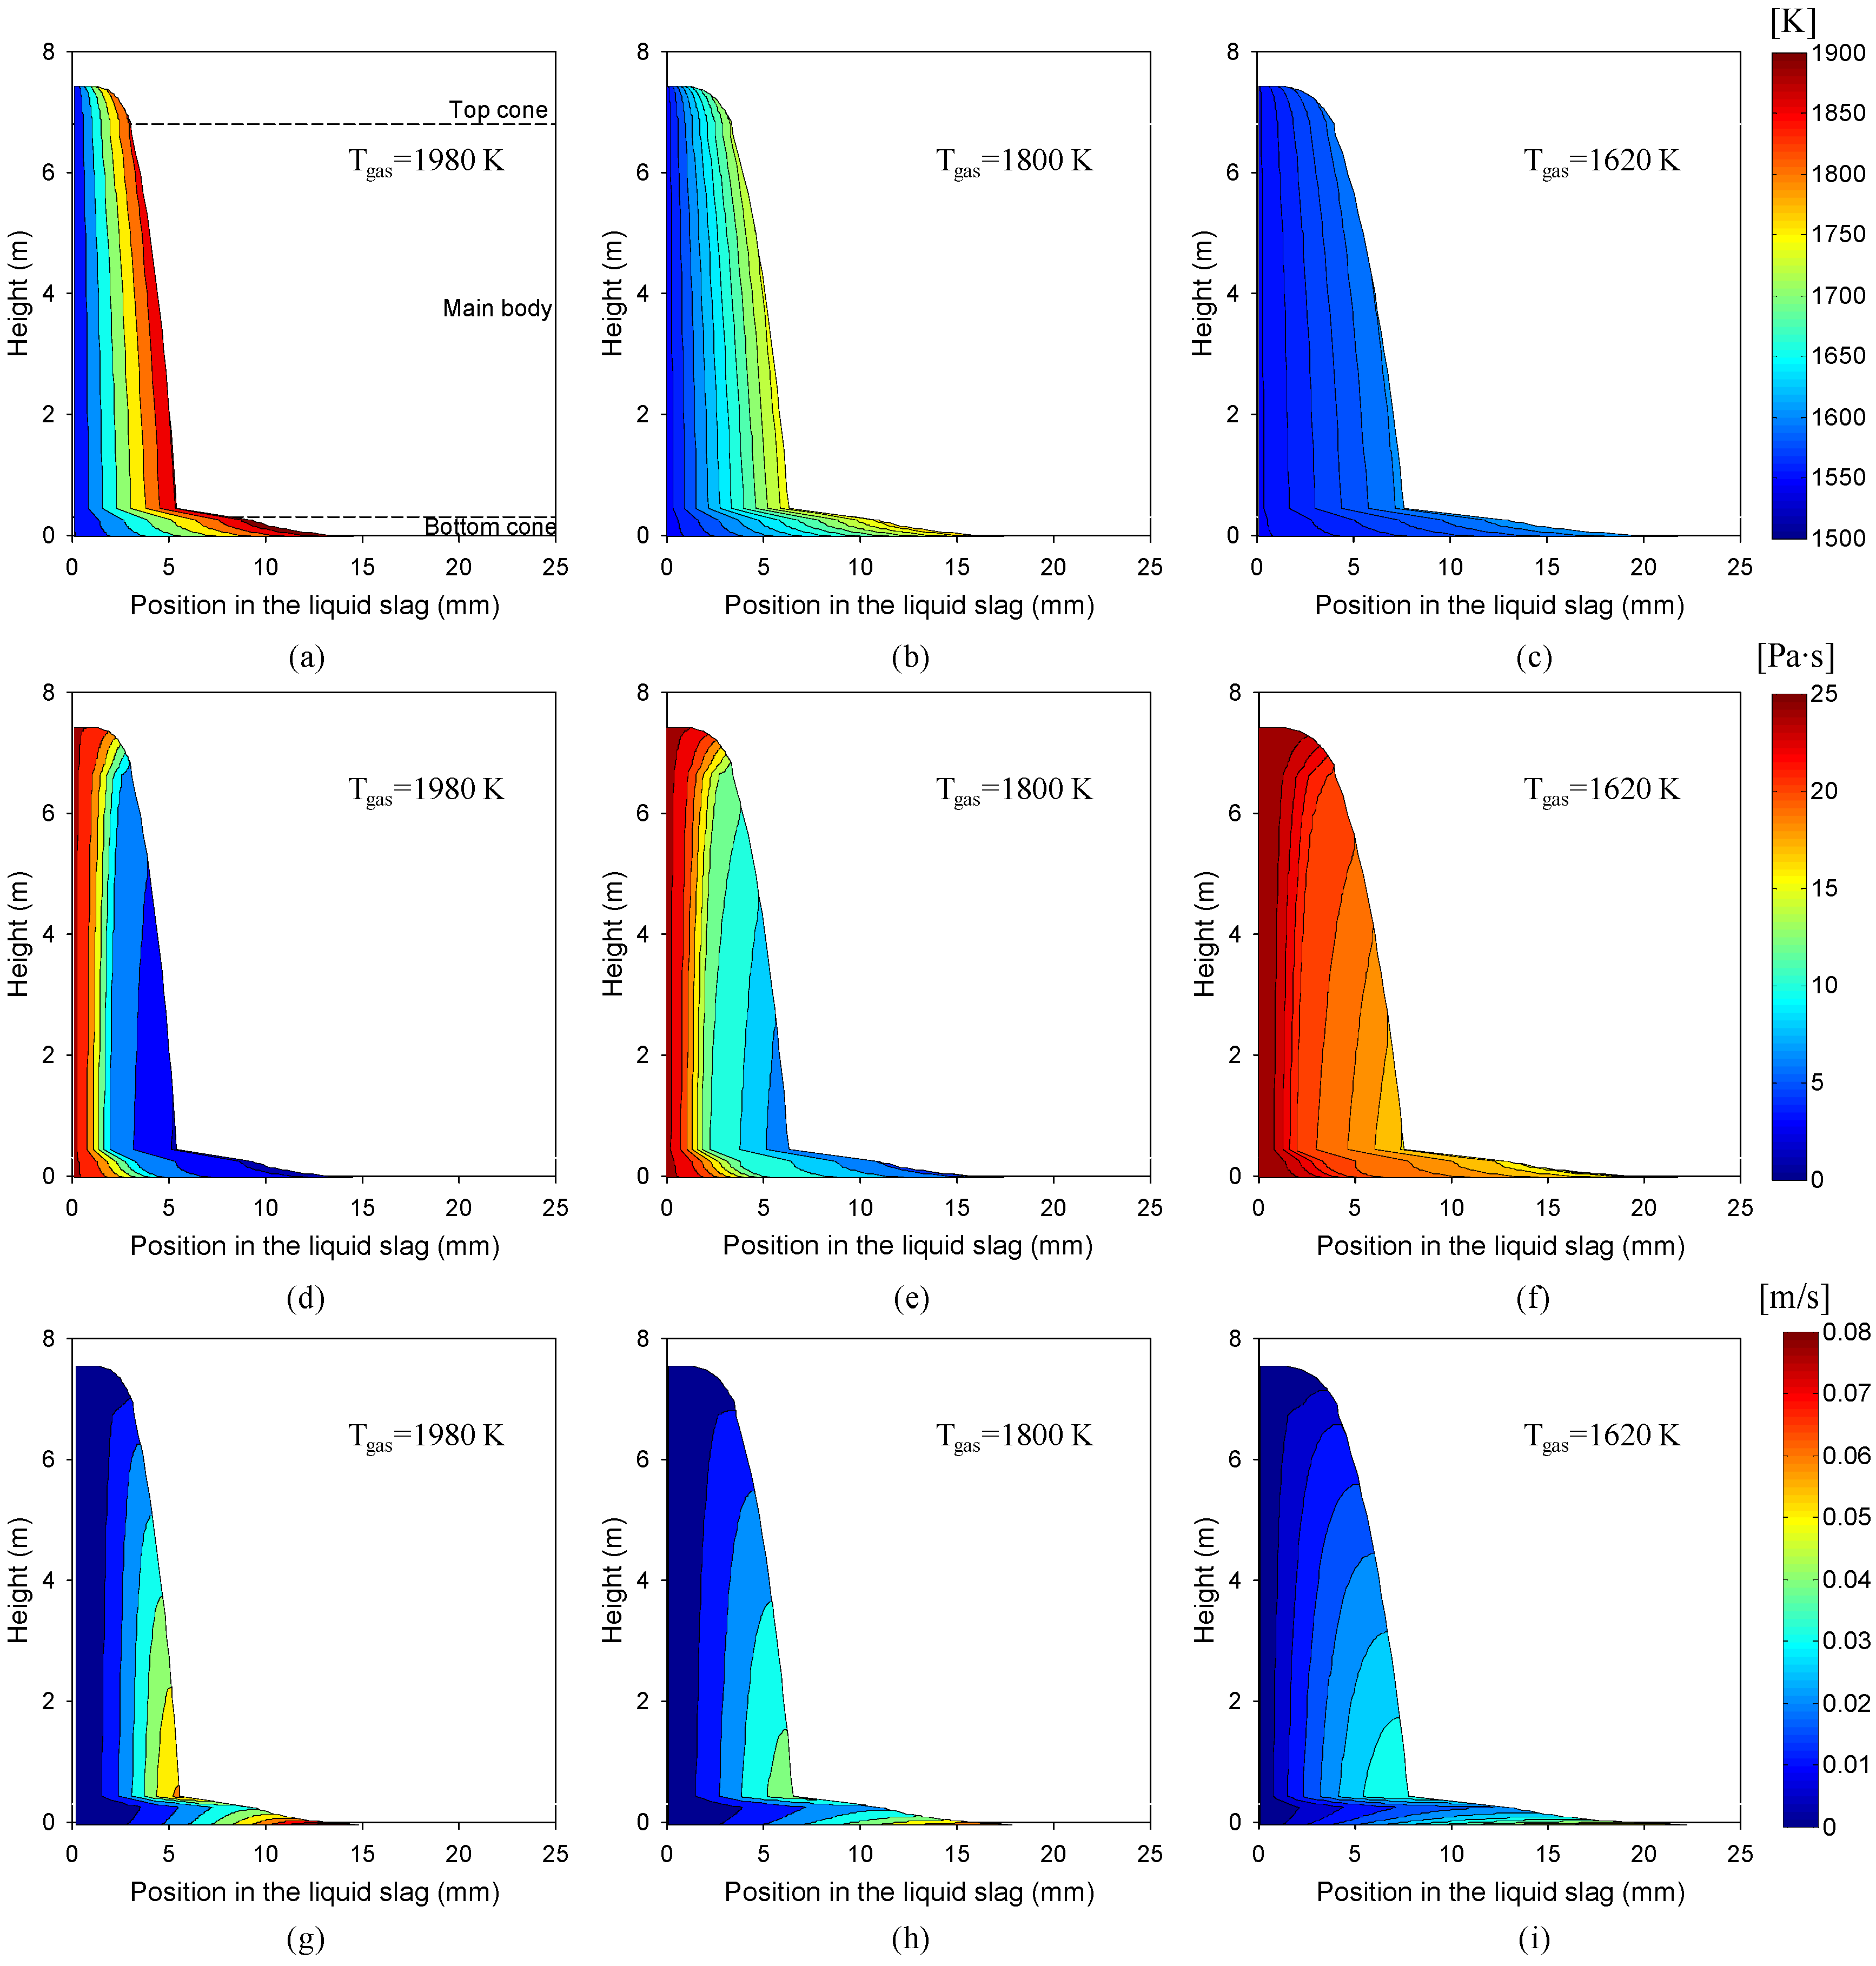
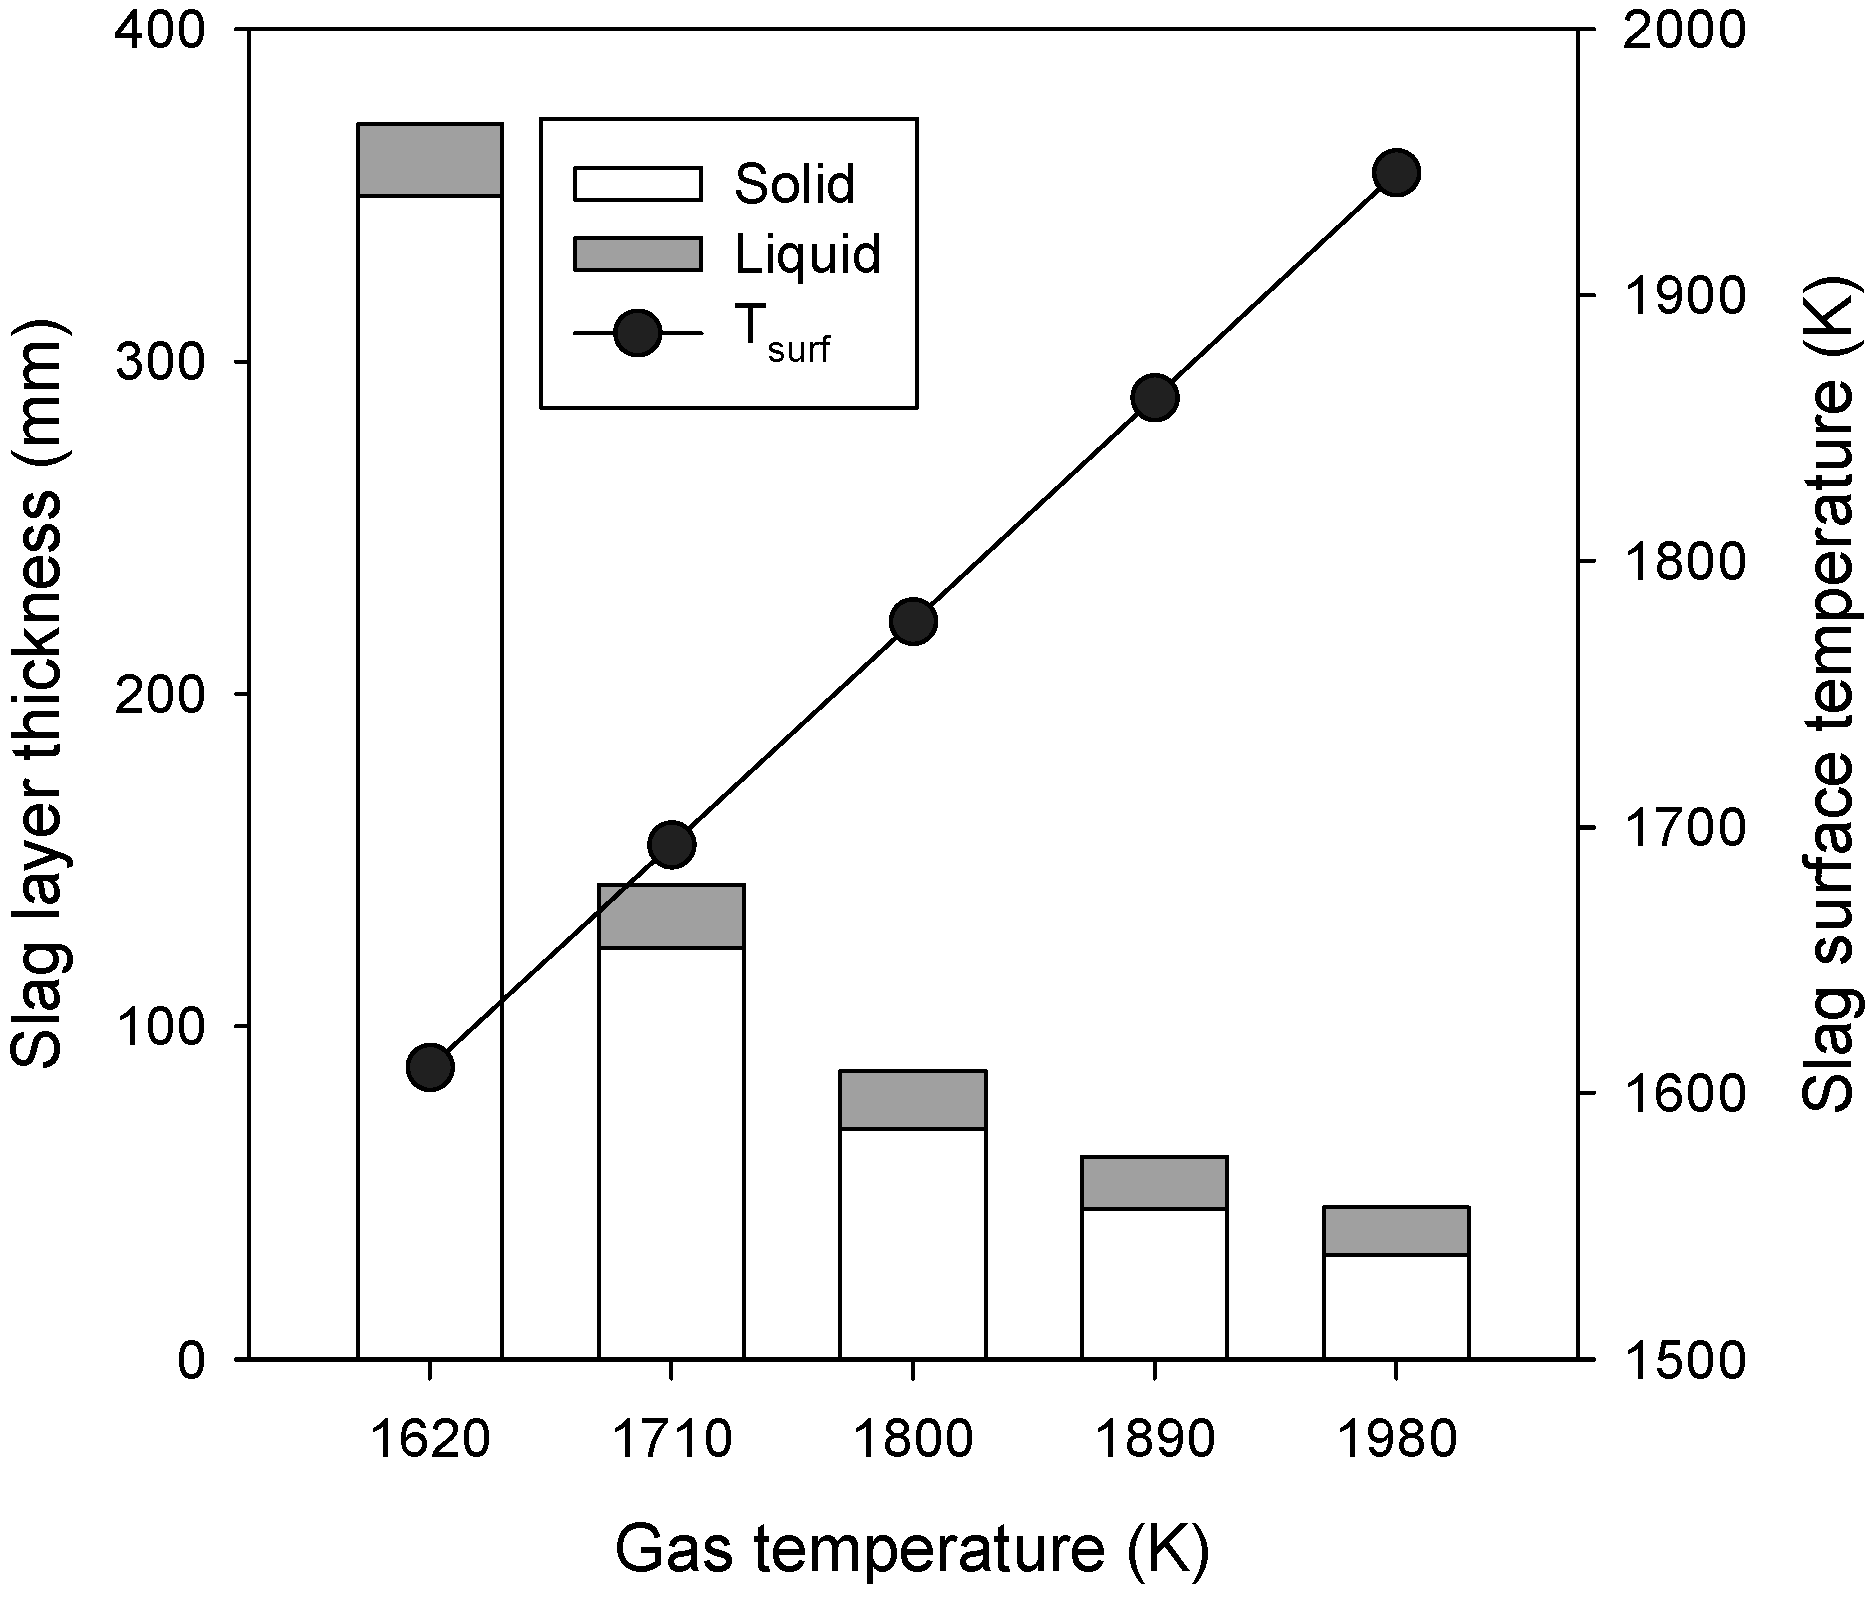
3.1. Effects of Gas Temperature

Figure 2 shows the contours of the temperature, viscosity, and velocity in the liquid slag layer for the reference value of Tgas and its variation of ±10%. Regardless of the value of Tgas, δL exhibited a similar trend along the wall influenced by the gasifier geometry. The liquid slag rapidly built up at the top cone, and gradually increased in the vertical main body with the continuous deposition of the ash. Once it entered the bottom cone, δL suddenly increased because of the change in the wall angle (α) from 90° to 12°. This illustrates a large influence of the wall angle at the bottom cone, which is evaluated in detail later. The value of δL at the slag tap (y = 0 m) was 17.4 mm for Tgas = 1800 K, 21.6 mm for 1620 K, and 14.4 mm for 1980 K.
Within the temperature contours (Figure 2a–c), the interface temperature with the solid slag remained fixed at Tcv (1548 K), but the surface temperature (Tsurf) facing the gas was influenced by Tgas. The gap between the isothermal lines was uniform across the layer, indicating that the temperature profile in the liquid slag had close to a linear relationship. Based on the correlation in Equation (6), the viscosity of the liquid slag exponentially decreased from the interface to the surface facing the syngas as shown in Figure 2d–f. Because of the reduced viscosity near the surface, the liquid slag flowed downward more quickly (Figure 2g–i). For example, the surface velocity of the reference case (Figure 2e) reached 0.045 m/s at the end of the main body of the reactor, but was reduced to as low as 0.028 m/s when the slag flow entered the bottom cone region (y = 0.295 m). The velocity was then restored to 0.075 m/s at y = 0 m as the temperature near the surface further increased as a result of the continuous heat input from the hot syngas.
Figure 2. Slag temperature (ac), viscosity (df) and velocity distribution (gi) in the liquid slag layer for different gas temperature conditions.
Energies 08 03370 g002
Table 2 lists the key results at the slag tap for the ±10% variations in Tgas from the reference value (1800 K). Here, QGL and QLS represent the total heat transfer rate (kW) from the gas to the liquid and solid slag, respectively, integrated along the wall. The slag thicknesses and interface temperatures (Tsurf and TR) were evaluated at the slag tap. Tgas was found to have the greatest influence on the slag flow and heat transfer. Both QGL and QLS were approximately doubled by a 10% increase in Tgas and reduced to a quarter by a 10% decrease, because radiation (~T4) was the main mode of heat transfer at such a high temperature. δS was inversely proportional to qLS (=QLS/A), as indicated in Equation (5) for the thermal conduction across the solid slag layer. Therefore, it gradually increased as qLS decreased along the wall.
Table 2. Changes in key output values for ±10% variations in input parameters from the reference case (QGL and QLS: integrated over the entire wall; δL, δS, Tsurf, and TR: at the slag tap).
Varied ParametersQGL (%)QLS (%)δL (%)δS (%)Tsurf (K)TR (K)
Gas temperature (Tgas)+10%106.4107.1−17.4−54.8168.650.1
−10%−74.3−78.224.0405.5−167.5−35.7
Ash deposition rate (mdep)+10%−2.6−2.03.23.10.5−1.3
−10%2.92.3−3.4−3.4−0.51.5
Ash deposition temp. (Tdep)+10%−16.76.1−1.2−5.810.52.7
−10%16.6−6.11.26.6−10.6−2.7
Bottom cone height+10%2.33.4−2.9−2.7−0.51.1
−10%−2.4−3.63.33.20.6−1.3
Liquid slag viscosity (μ)+10%−4.1−4.31.26.01.0−2.0
−10%4.64.7−1.3−6.1−1.12.3
Slag conductivity (k)+10%7.16.90.31.3−2.03.7
−10%−7.5−7.3−0.3−1.32.0−3.7
Liquid slag emissivity (ε)+10%2.82.4−0.3−1.72.00.8
−10%−3.2−2.80.42.1−2.4−0.9
Values in reference case179.4 kW182.6 kW17.4 mm69.3 mm1777.2 K567.1 K
As shown in Table 2, δL was less influenced by Tgas than δS. For example, it increased by 24% for a Tgas value of 1620 K. This was because the change in δL was moderated by the velocity profile. As shown in Figure 2f, the low value of Tgas greatly increased the slag viscosity (e.g., from 2.9 Pa·s at the surface at y = 0 m for Tgas = 1800 K to 19.2 Pa·s for Tgas = 1620 K). However, the corresponding decrease in the surface velocity was only 0.017 m/s. The velocity close to the interface of the solid and liquid slag (r = 0 mm) remained unaffected owing to the no-slip condition and the critical viscosity being fixed at 25 Pa·s. Because such velocity profiles determine the thickness (m ~ ρδLvavg), δL was less sensitive to the changes in Tgas.
To investigate the exact trend in the slag thicknesses, additional simulations were carried out for two intermediate values of Tgas at 1710 K and 1890 K. Figure 3 summarizes the results of δL, δS, and Tsurf at the slag tap for different values of Tgas. Here, δS exponentially increased with a decrease in Tgas. Under the extreme condition of Tgas = 1620 K, the solid slag became as thick as 350 mm at the slag tap, which would be thick enough to block the slag tap. Because δS was larger and more sensitive to the change in Tgas than δL, this is a crucial parameter of the slag behaviors in relation to the prevention of blockage at the slag tap.
Figure 3 also shows that Tsurf exhibited a linear relationship with Tgas, which can be explained by the overall energy balance. For a section of the liquid slag layer, the energy balance can be approximated as follows:
ε σ A ( T g a s 4 T s u r f 4 ) k A T s u r f T c v δ L + ( H o u t H i n ) t o t a l
The terms in Equation (8) represent the radiative heat transfer from the gas (QGL), conduction through the liquid slag layer, and the enthalpy difference between input and output flow, respectively. When rearranged for Tgas and Tsurf:
T g a s 4 T s u r f 4 + k T s u r f T c v ε σ δ L + ( H o u t H i n ) t o t a l ε σ A
The second and third terms in the RHS of Equation (9) were two-orders of magnitude smaller than those of T g a s 4 and T s u r f 4 . Therefore, Tsurf changed almost linearly with the variations of Tgas. However, the difference between the two temperatures (TgasTsurf) increased from 10 K for Tgas = 1620 K to 34 K for Tgas = 1980 K.
With regard to the influence of low gas temperatures on the slag flow, it is worth reiterating the results from our previous study [21]. The gas temperature at the bottom cone of this gasifier is typically lower than at main body part where partially oxidative reactions of coal take place. If Tgas suddenly falls from 1800 K to below Tcv at the bottom cone, the hot liquid slag from the main body of the gasifier acts as a temporary heat reservoir, providing heat to the solid slag and gas at both ends. This prevents immediate increases in both δL and δS in the bottom cone.
Figure 3. Effects of gas temperature on the slag thicknesses and surface temperature at the slag tap.
Energies 08 03370 g003

3.2. Effects of Ash Deposition Rate

When the particle deposition rate (mdep) changes, it would be reasonable to expect that the slag thickness, especially δL, would be affected by a similar magnitude. However, the values listed in Table 2 show that the changes in the slag thicknesses were reduced to approximately one third of the variation in mdep. This can be explained by the velocity distribution in the liquid slag layer plotted in Figure 4. When mdep was increased by 10%, the liquid slag near the surface was accelerated by 0.005 m/s, and δL was extended by 0.5 mm. Considering that the area under the curve represents the mass flow rate, the increased portion in mdep or the area was absorbed near the surface, where the liquid slag flowed faster. Therefore, δL became less sensitive to the variations in mdep. QGL and QLS corresponded to the change in δL, and were within 3% of their values in the reference case (Table 2). Figure 4 also shows that the temperature profiles in the liquid slag at the slag tap remained linear, and the changes in Tsurf were very small (0.5 K). Although the temperature gradient reflected the change in δL, the gradient at the interface to the solid slag (i.e., QLS) was slightly less sensitive. This led to a 0.6% smaller change in QLS, compared to that in QGL.
Figure 4. Effects of ash deposition rate on temperature and velocity profiles of liquid slag at the slag tap.
Energies 08 03370 g004

3.3. Effects of Ash Deposition Temperature

In an entrained flow gasifier, inert particles almost immediately reach thermal equilibrium with the gas. However, the particle deposition temperature (Tdep) can be influenced by the exothermic oxidation of char or endothermic gasification reactions. When Tdep was varied to 1575 or 1825 K from 1750 K, its impact was noticeable in Tsurf as shown in Figure 5.
Figure 5. Effects of ash deposition temperature on temperature and velocity profiles of liquid slag at the slag tap.
Energies 08 03370 g005
For example, Tsurf became 10.5 K higher by the deposition of hotter ash. Because this decreased the temperature difference with the gas ( T g a s 4 T s u r f 4 ), QGL was decreased by 16.7% compared to the reference case. In contrast, QLS was increased by 6.1% by the higher Tsurf. Among the parameters investigated in this study, Tdep was a unique parameter that caused opposite trends in QGL and QLS. Despite the temperature change near the surface, the velocity profile shown in Figure 5 was not sensitively changed because the viscosity was already low at such high temperatures. This led to a very small change (1.2%) in δL.

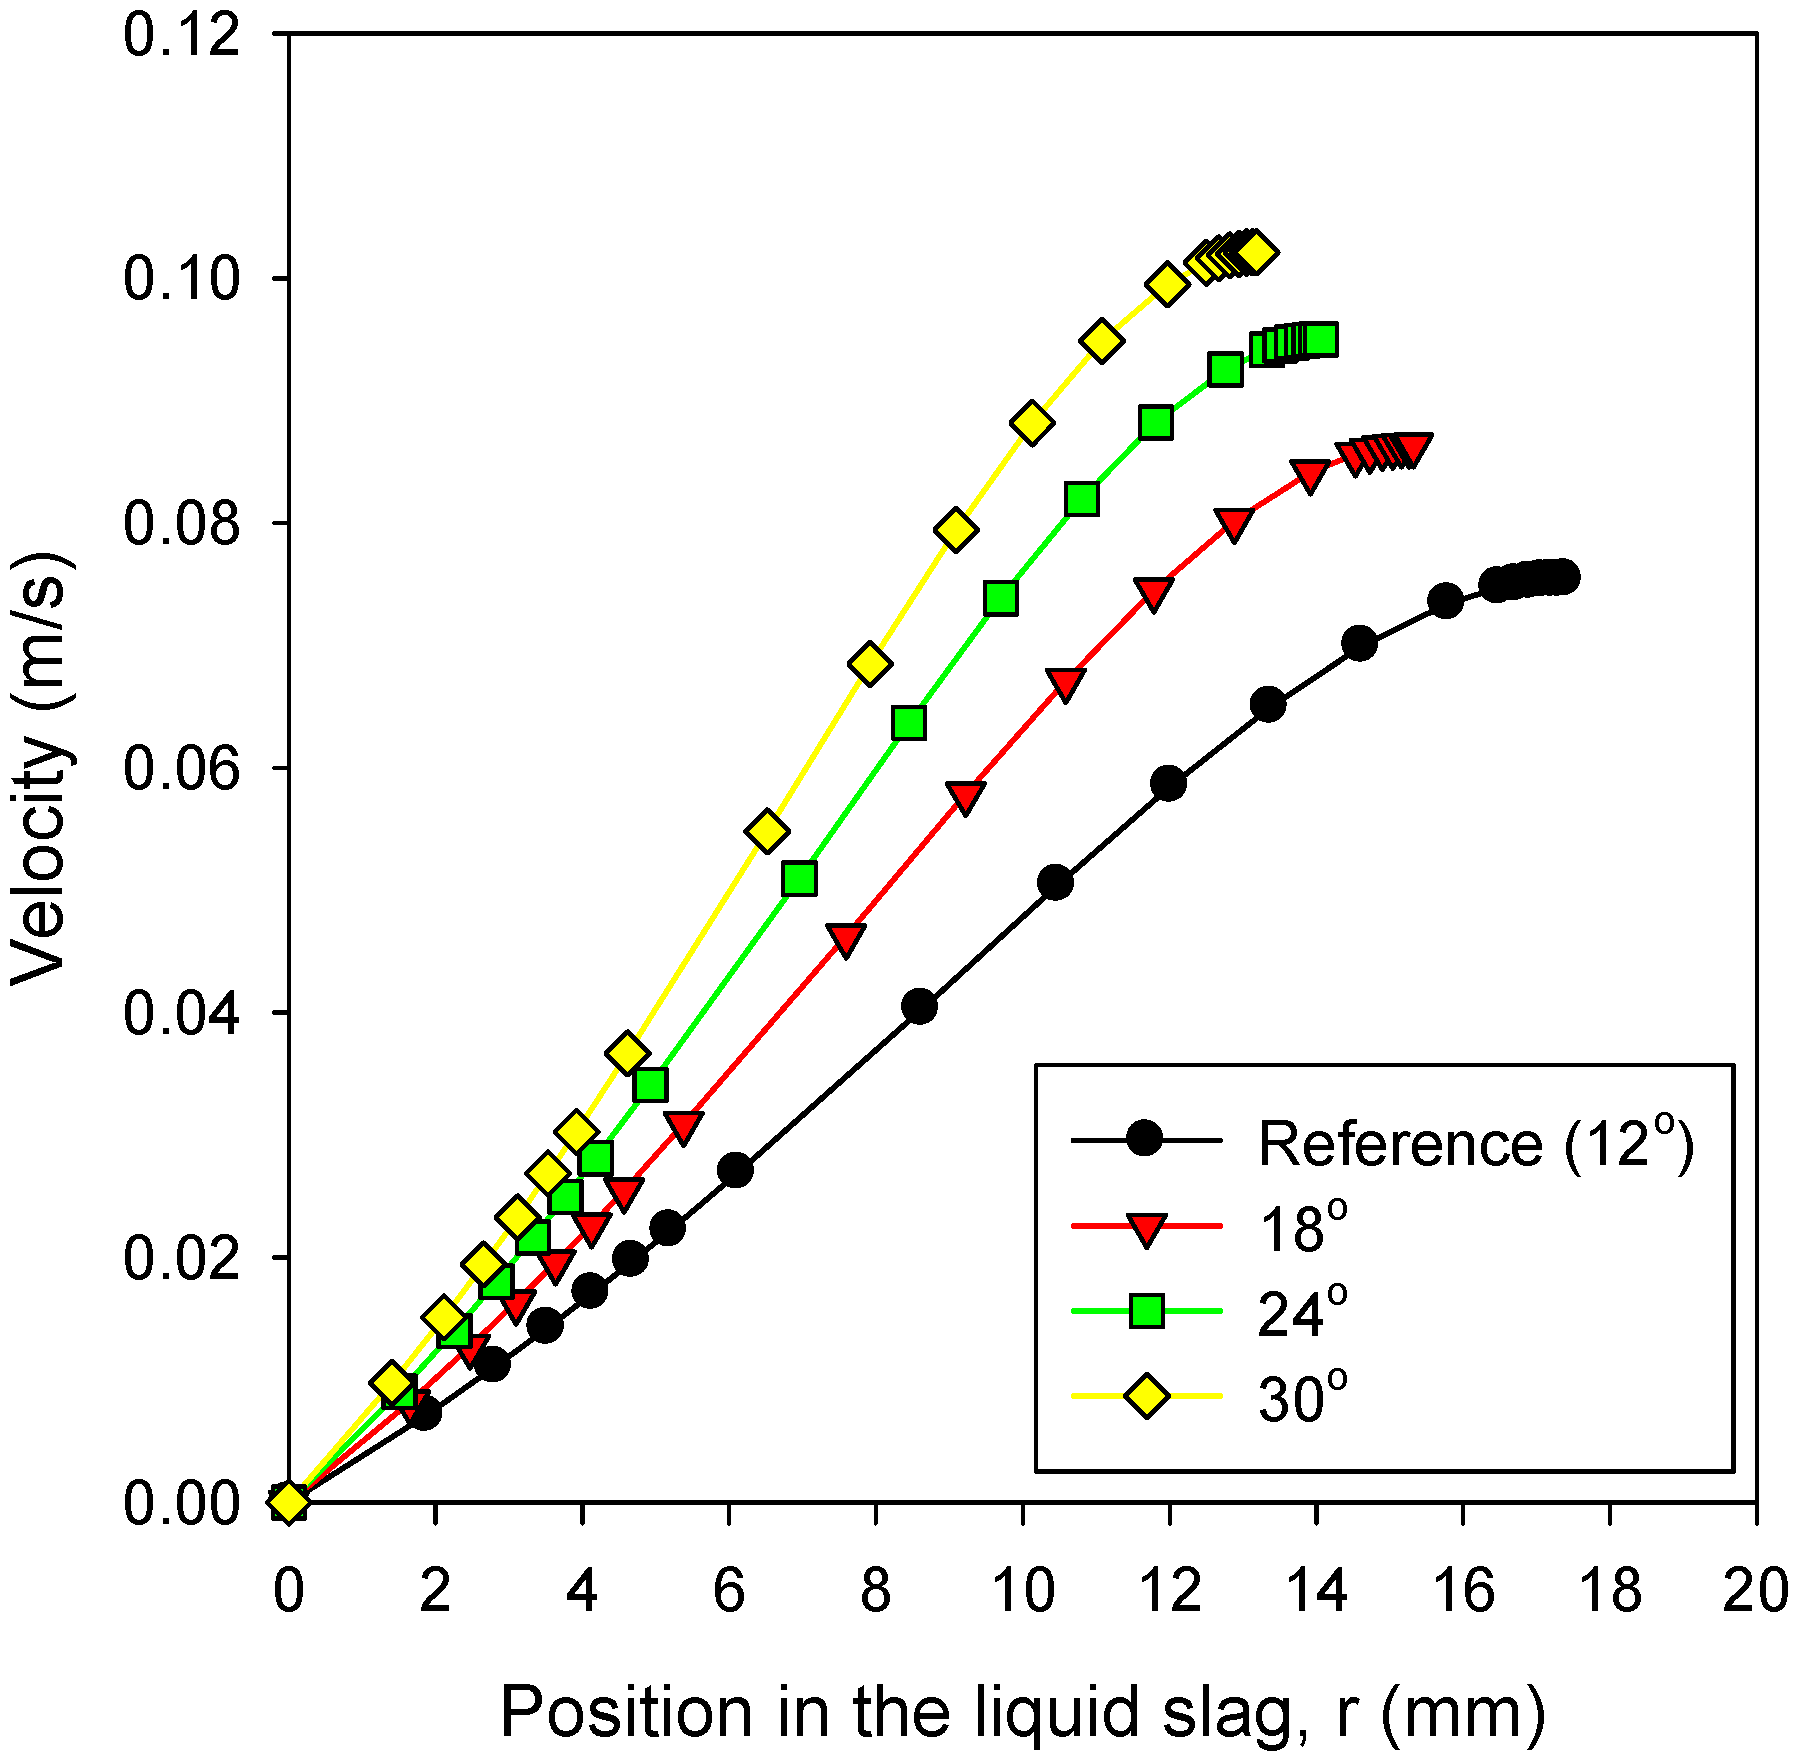
3.4. Effects of Bottom Cone Design

The bottom cone height of the gasifier was varied by 10% from 0.3 m for a fixed slag tap radius. This corresponded to a change in the wall angle of ±1.2°. The values listed in Table 2 show that the influence was approximately 3%, which was smaller than in the other cases. When the bottom cone height was decreased to 0.27 m, for example, the liquid slag at the surface was slowed down by only 0.0025 m/s (Figure 6). This led to an increase in δL of 2.9%.
Figure 6. Effects of bottom cone height on velocity distribution of liquid slag at the slag tap.
Energies 08 03370 g006
Since the bottom cone immediately changed the slag behaviors as shown in Figure 2, the effect of the bottom cone design required further investigations before conclusions were reached. The Prenflo gasifier considered in this study already has a short bottom cone, with a wall angle of 12°. In contrast, recent designs for Shell gasifiers reported in the literature have larger bottom cone angles [26]. Therefore, additional cases were studied, in which the wall angle was changed to 18°, 24°, and 30°. The slag tap radius and ash deposition in the bottom cone remained unchanged. Figure 7 shows the velocity distribution within the liquid slag at the slag tap for these cases. The velocity was increased from 0.075 m/s for 12° to 0.102 m/s for 30° by the increased gravity force in the streamwise direction. This reduced δL to 13.2 mm. Table 2 compares the slag thicknesses for the additional cases. Both δL and δS were reduced by 24% for 30°. More importantly, the equivalent thickness in the horizontal direction ((δL + δS)/cos α) was reduced to about a third. The results clearly suggest that the bottom cone angle is a crucial parameter in reducing the possibility of blockage at the slag tap.
Figure 7. Effects of bottom cone angle on velocity distribution of liquid slag at the slag tap.
Energies 08 03370 g007

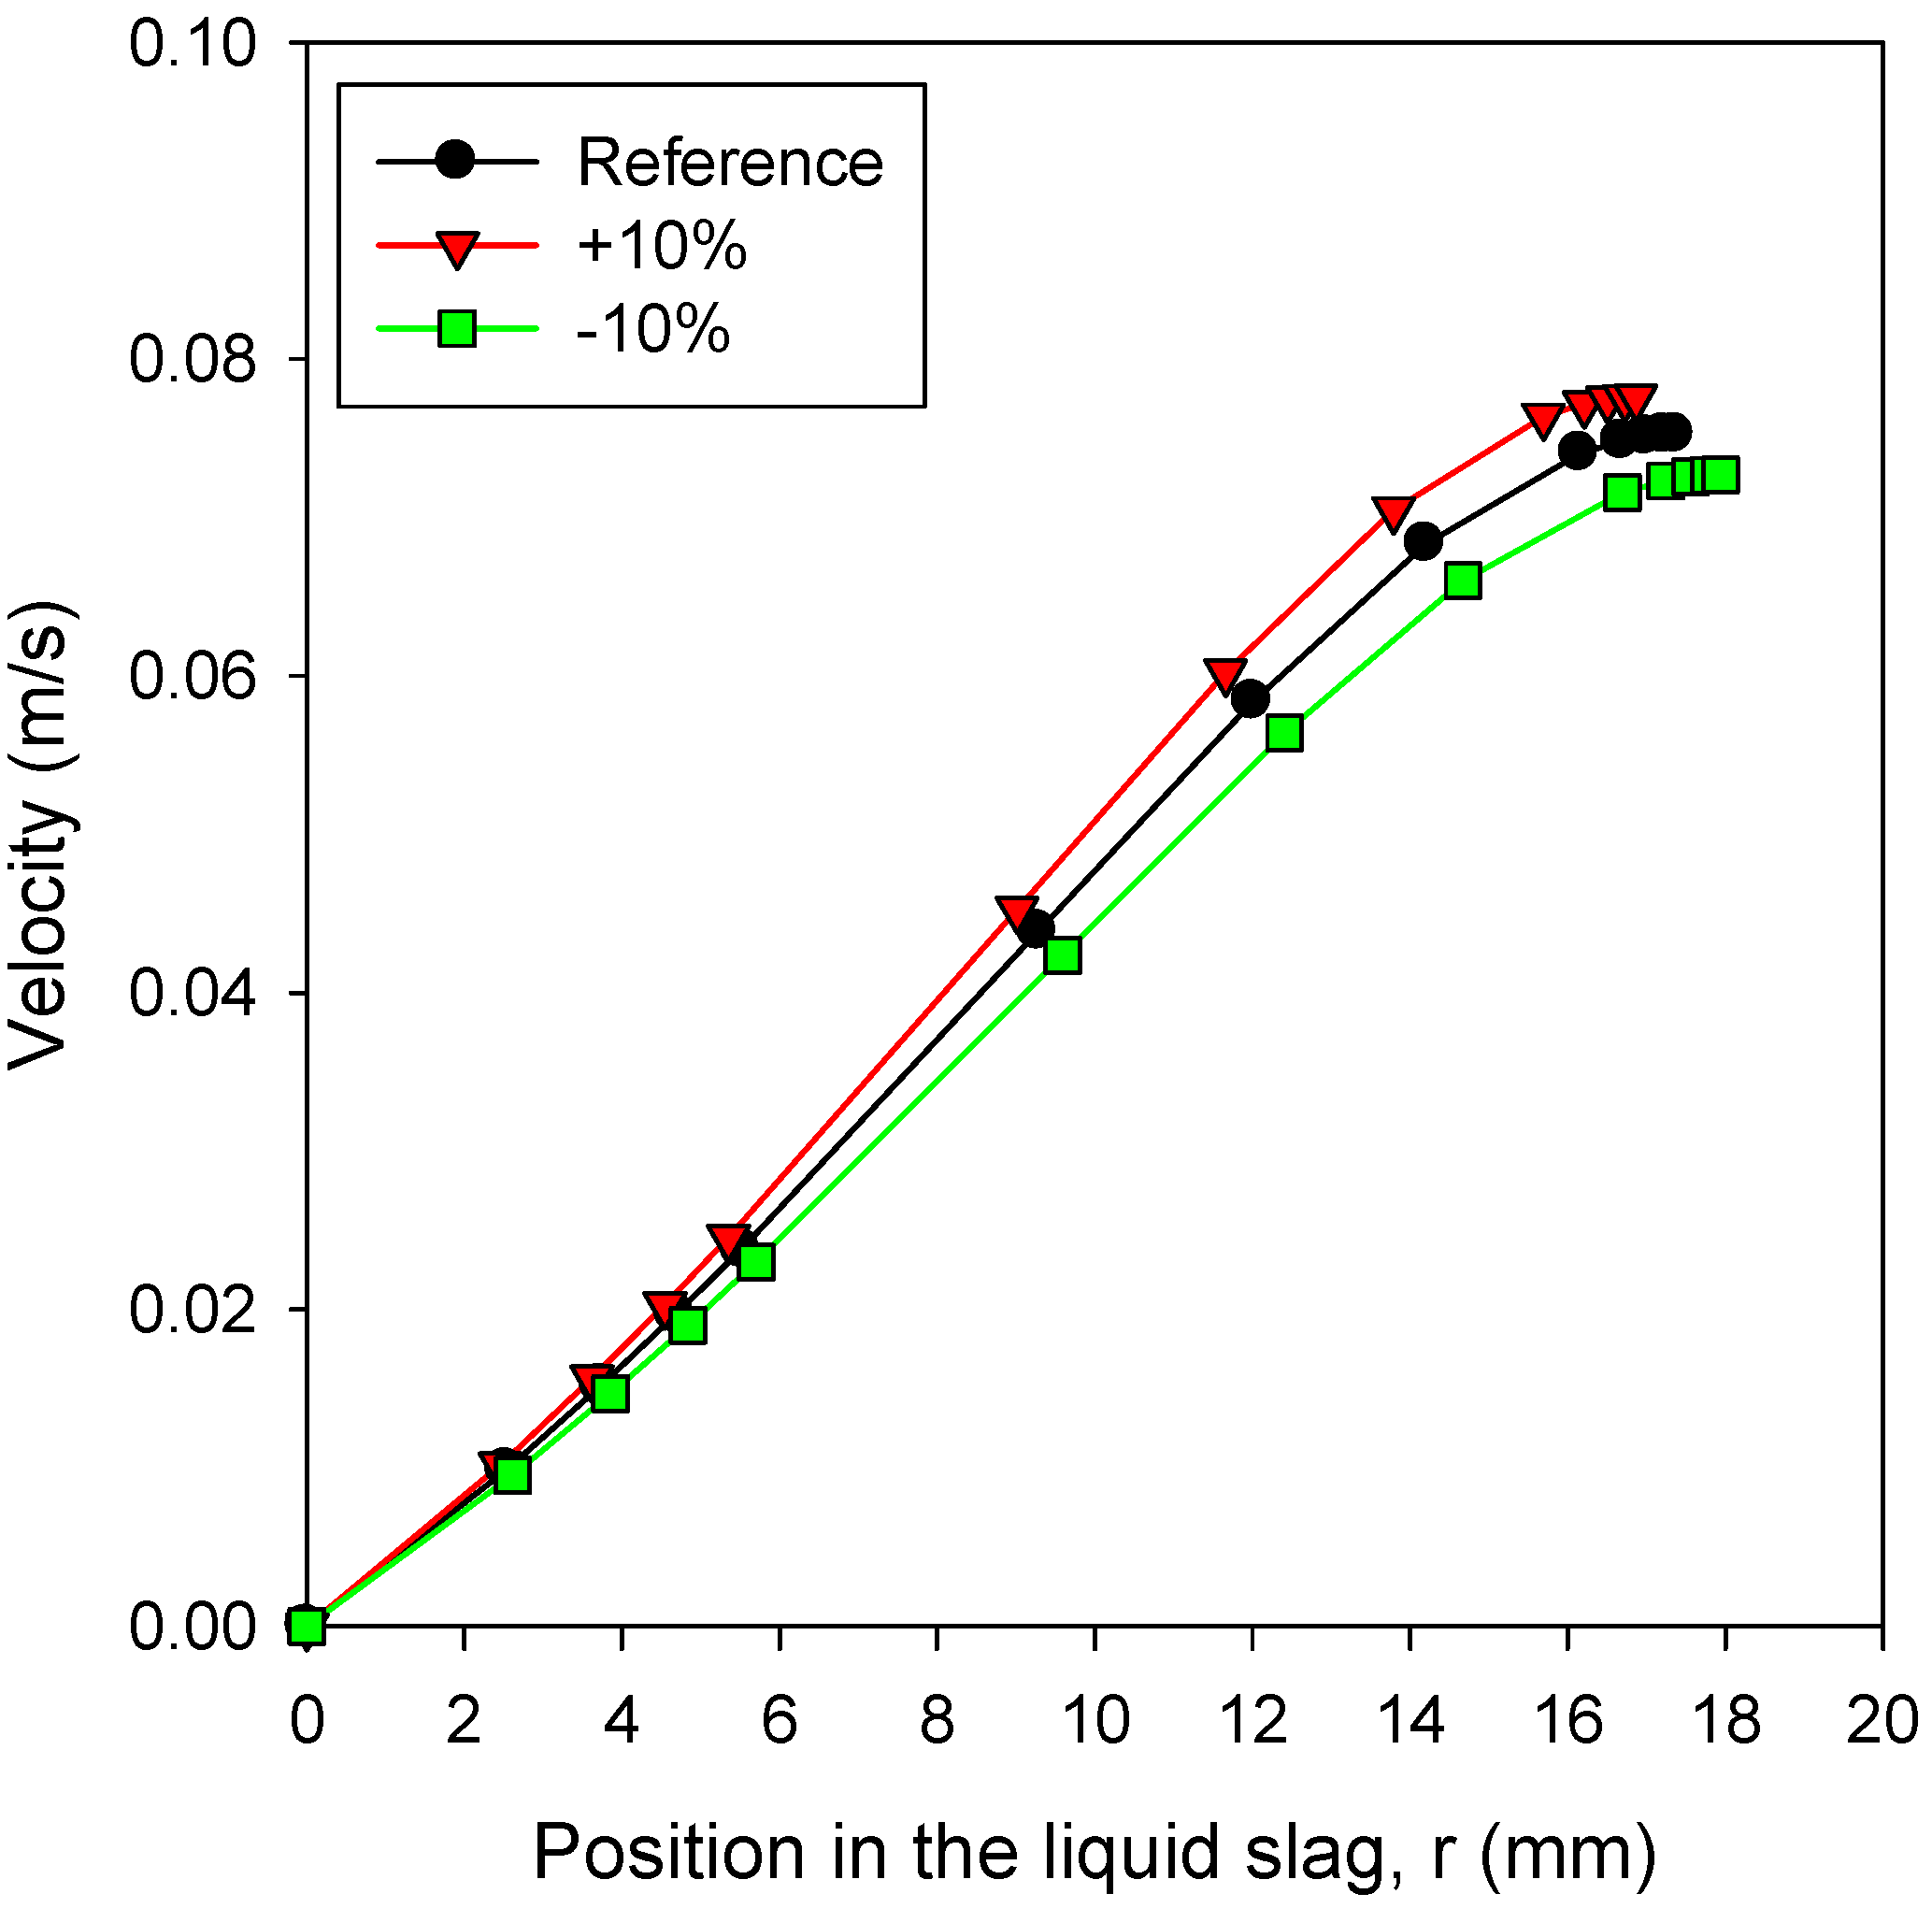
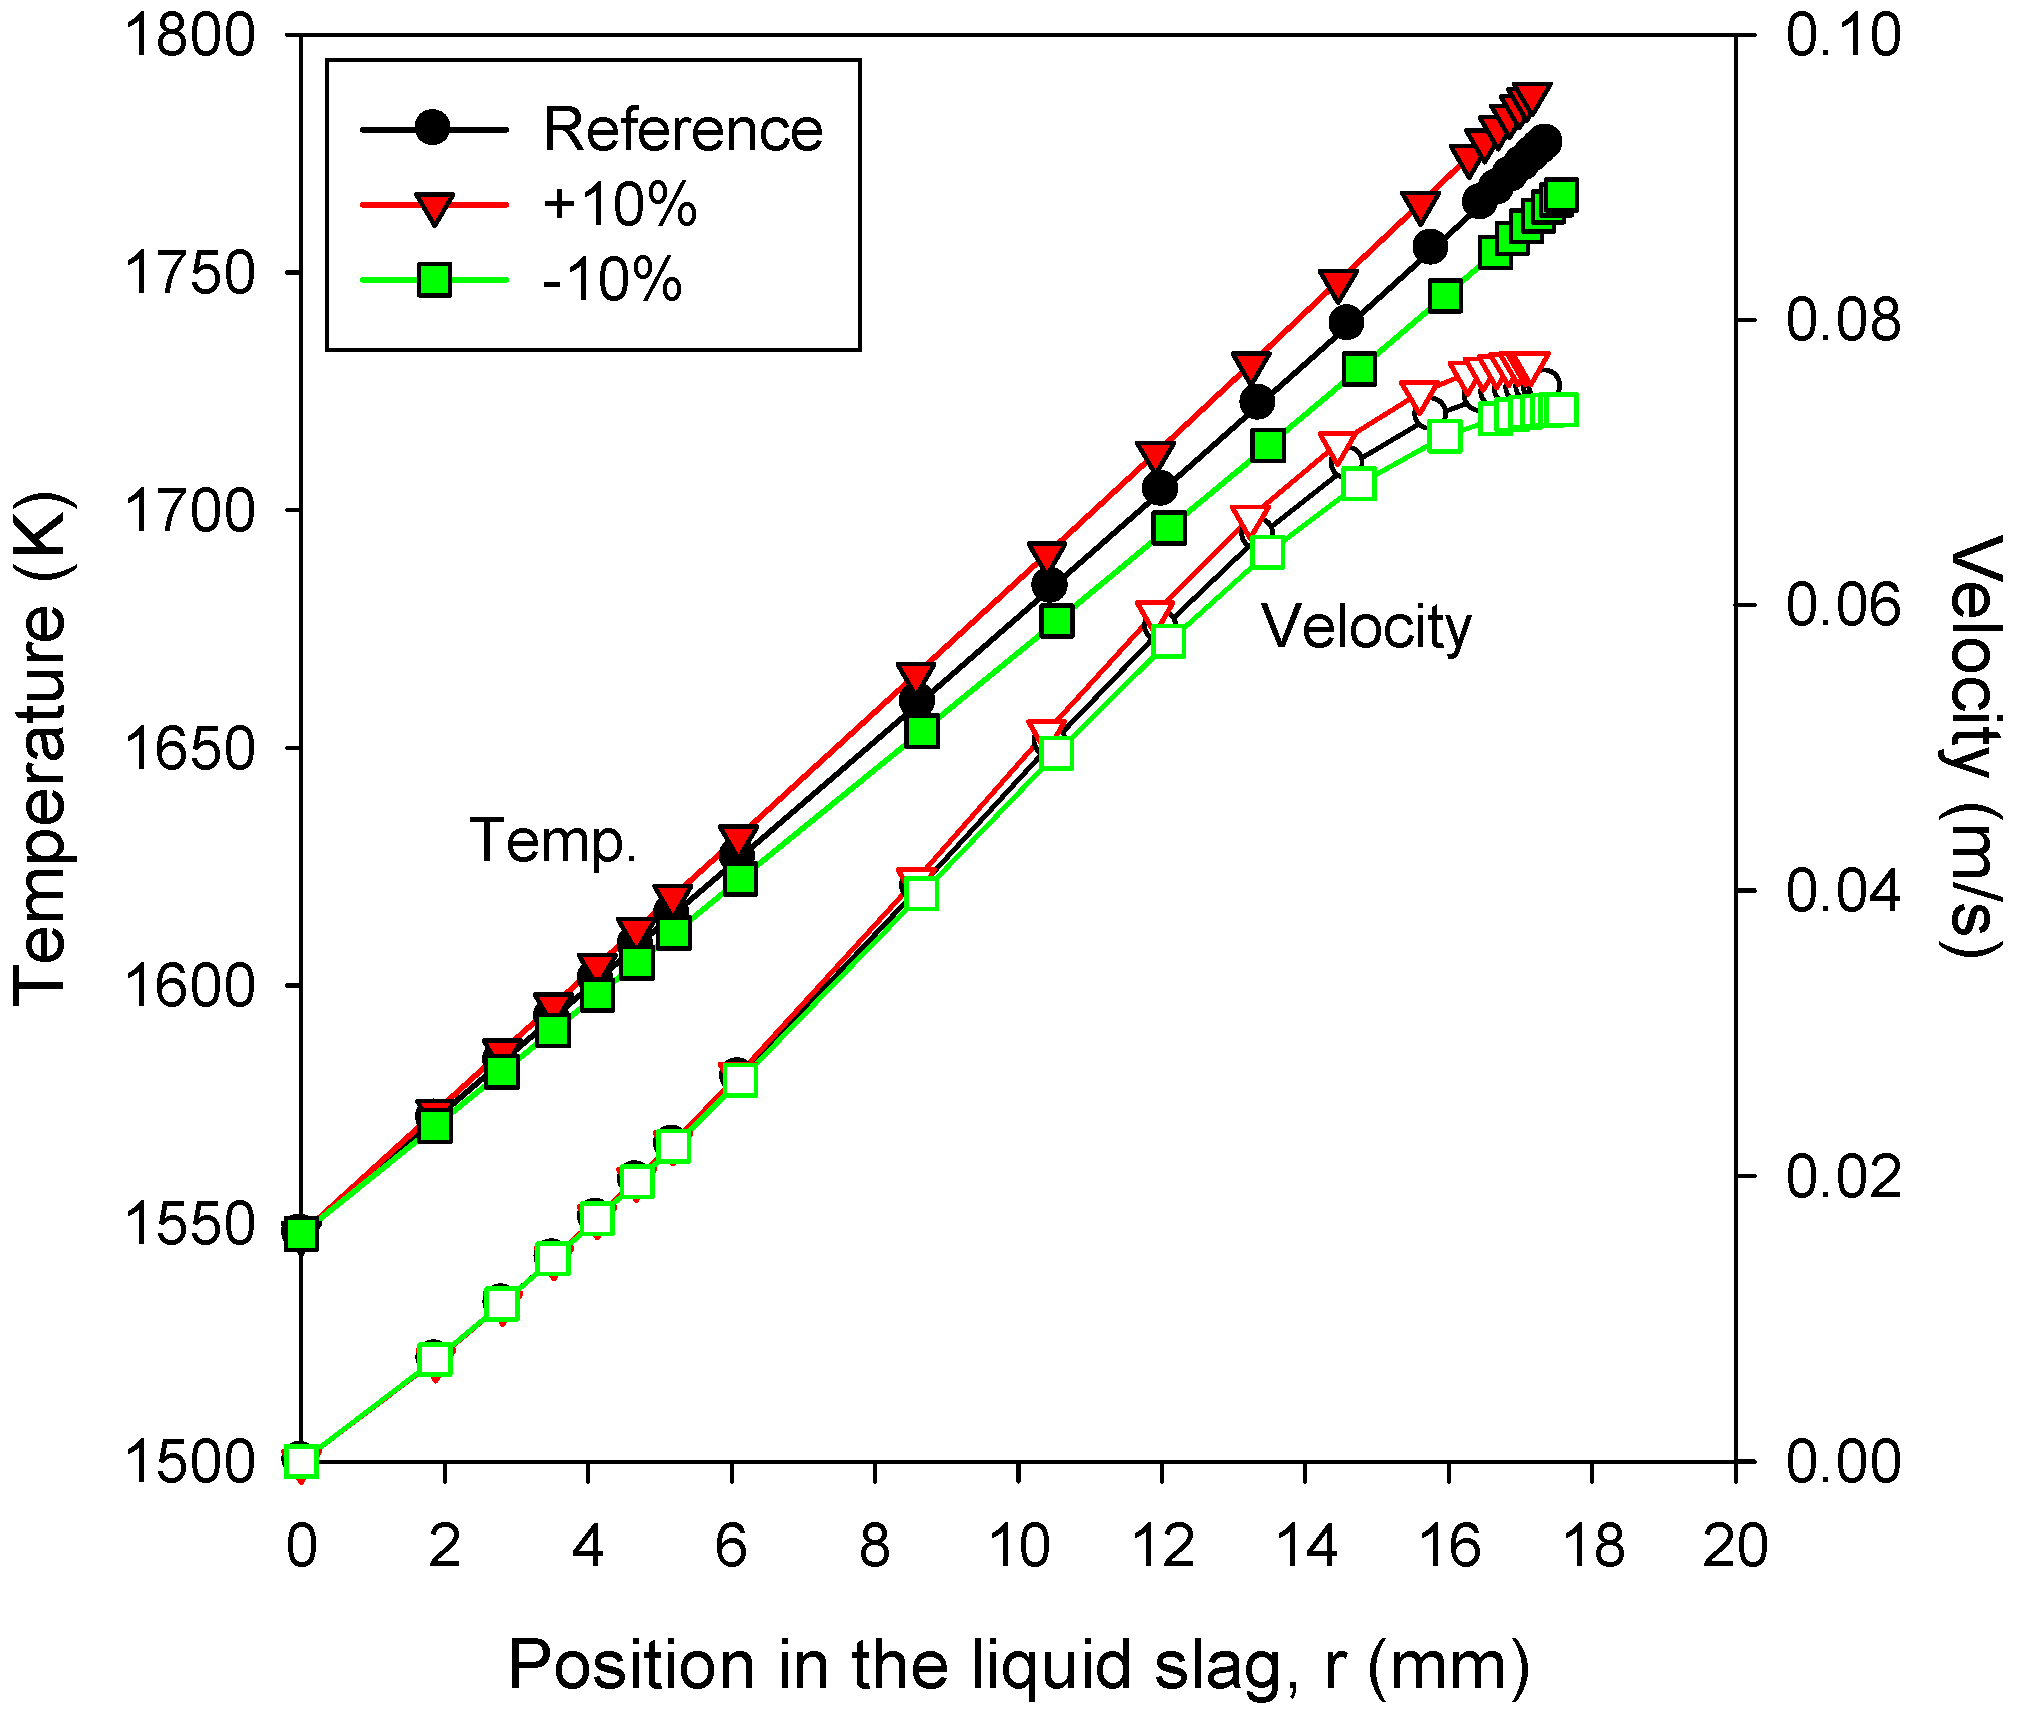
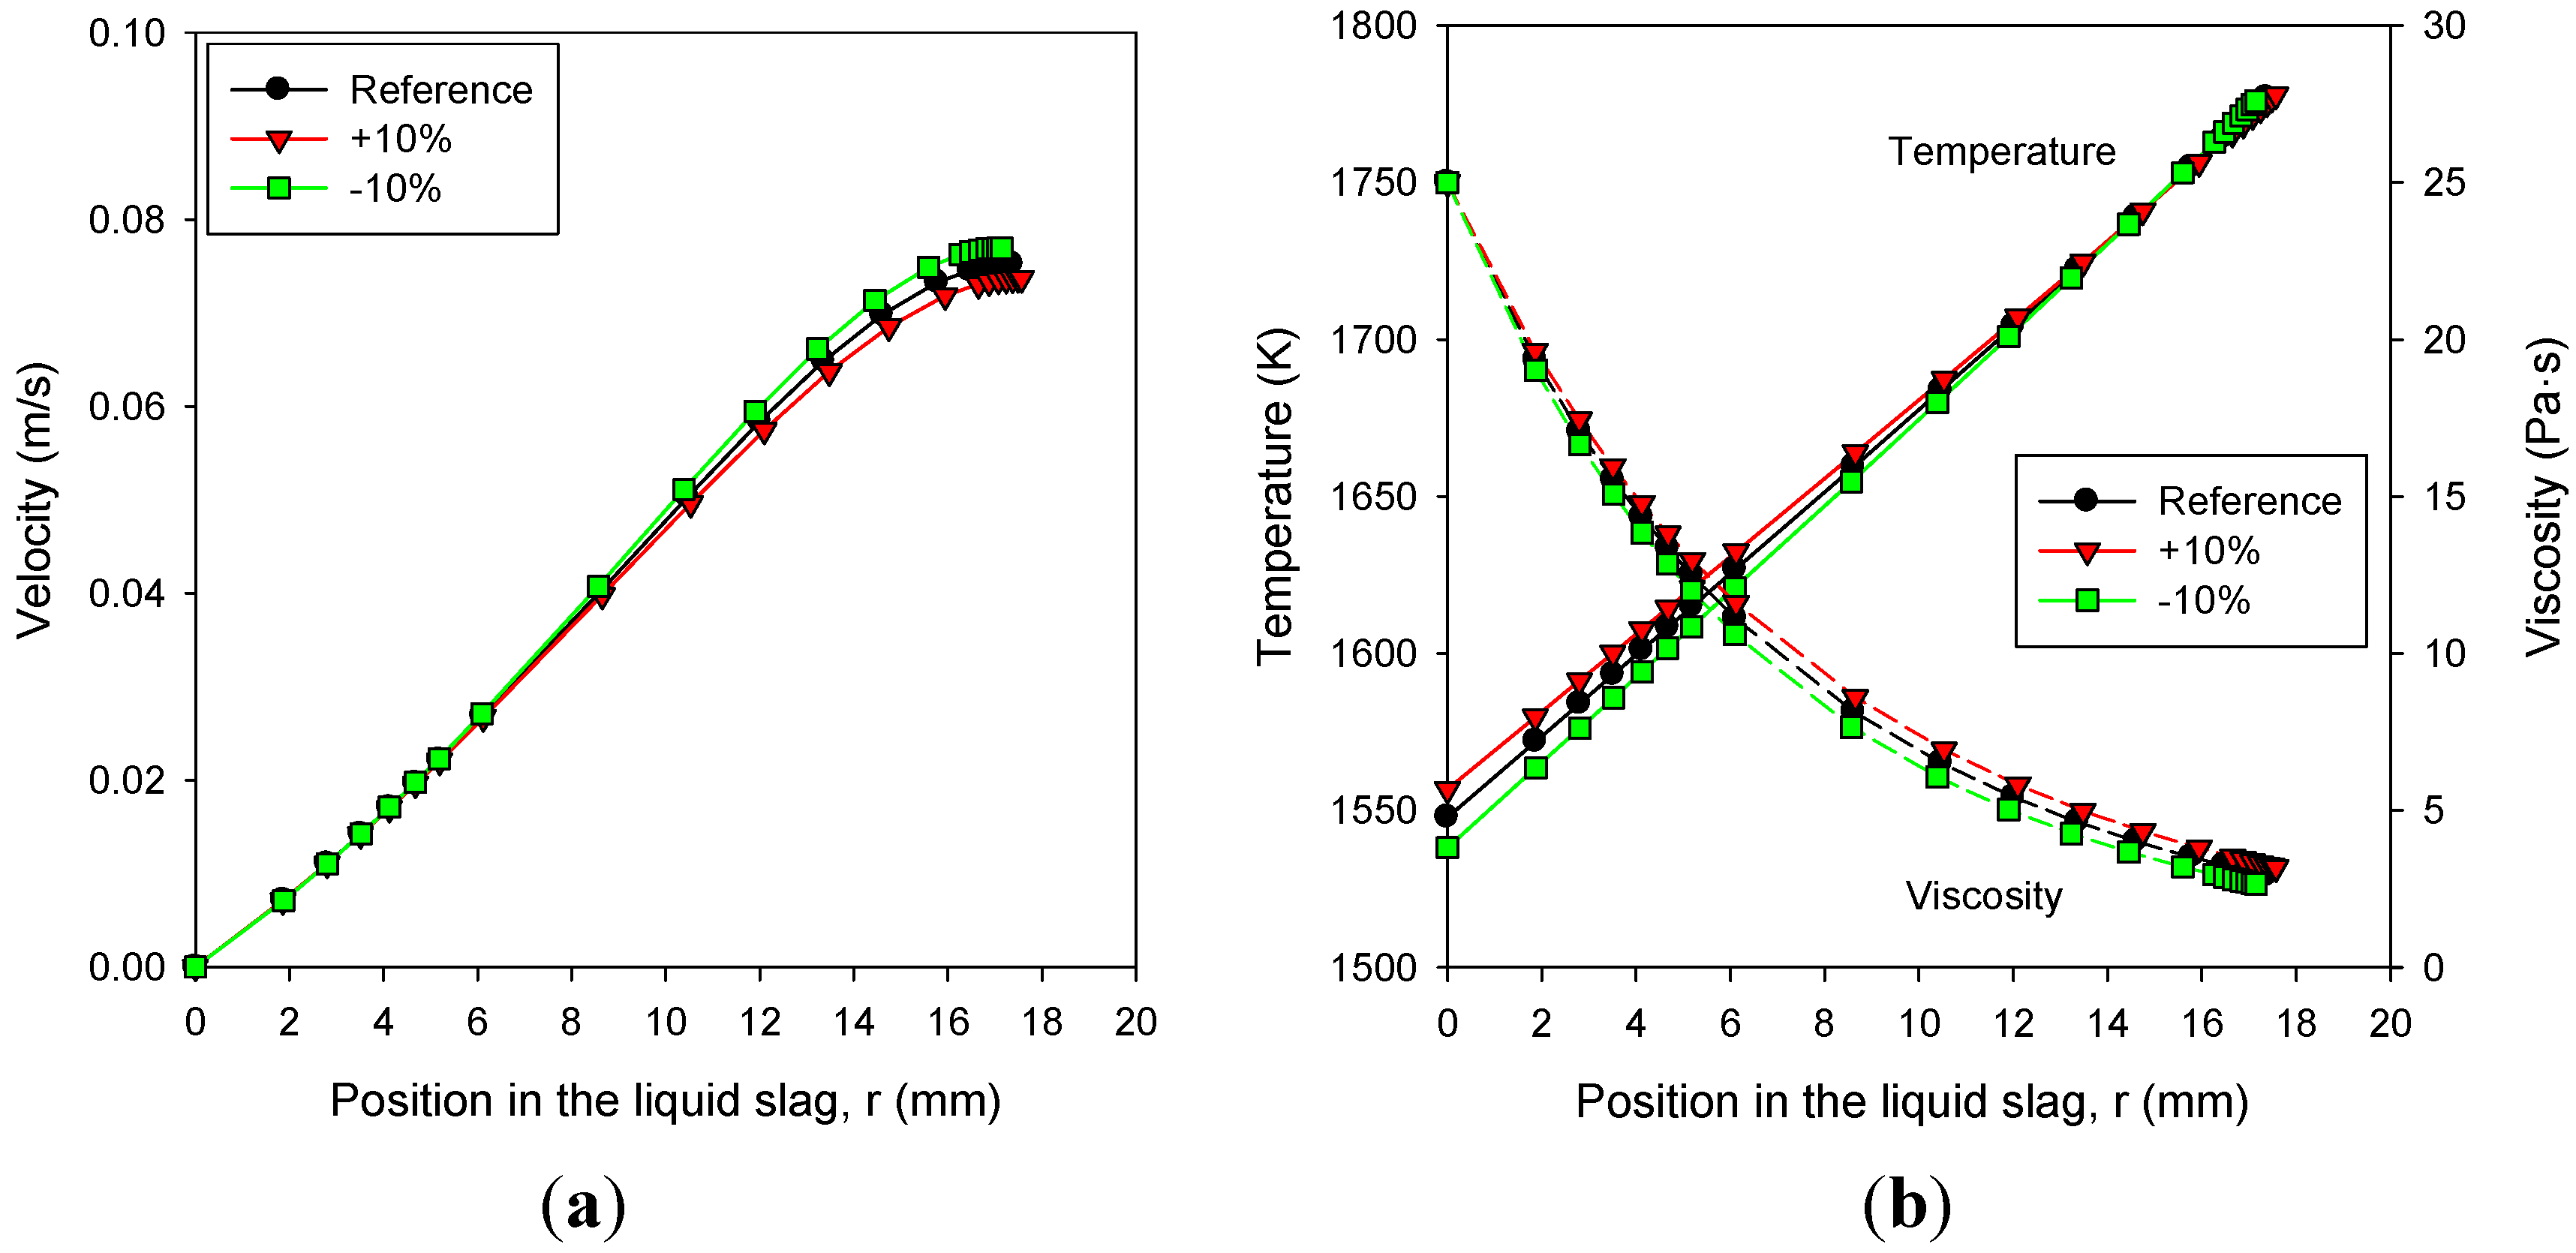
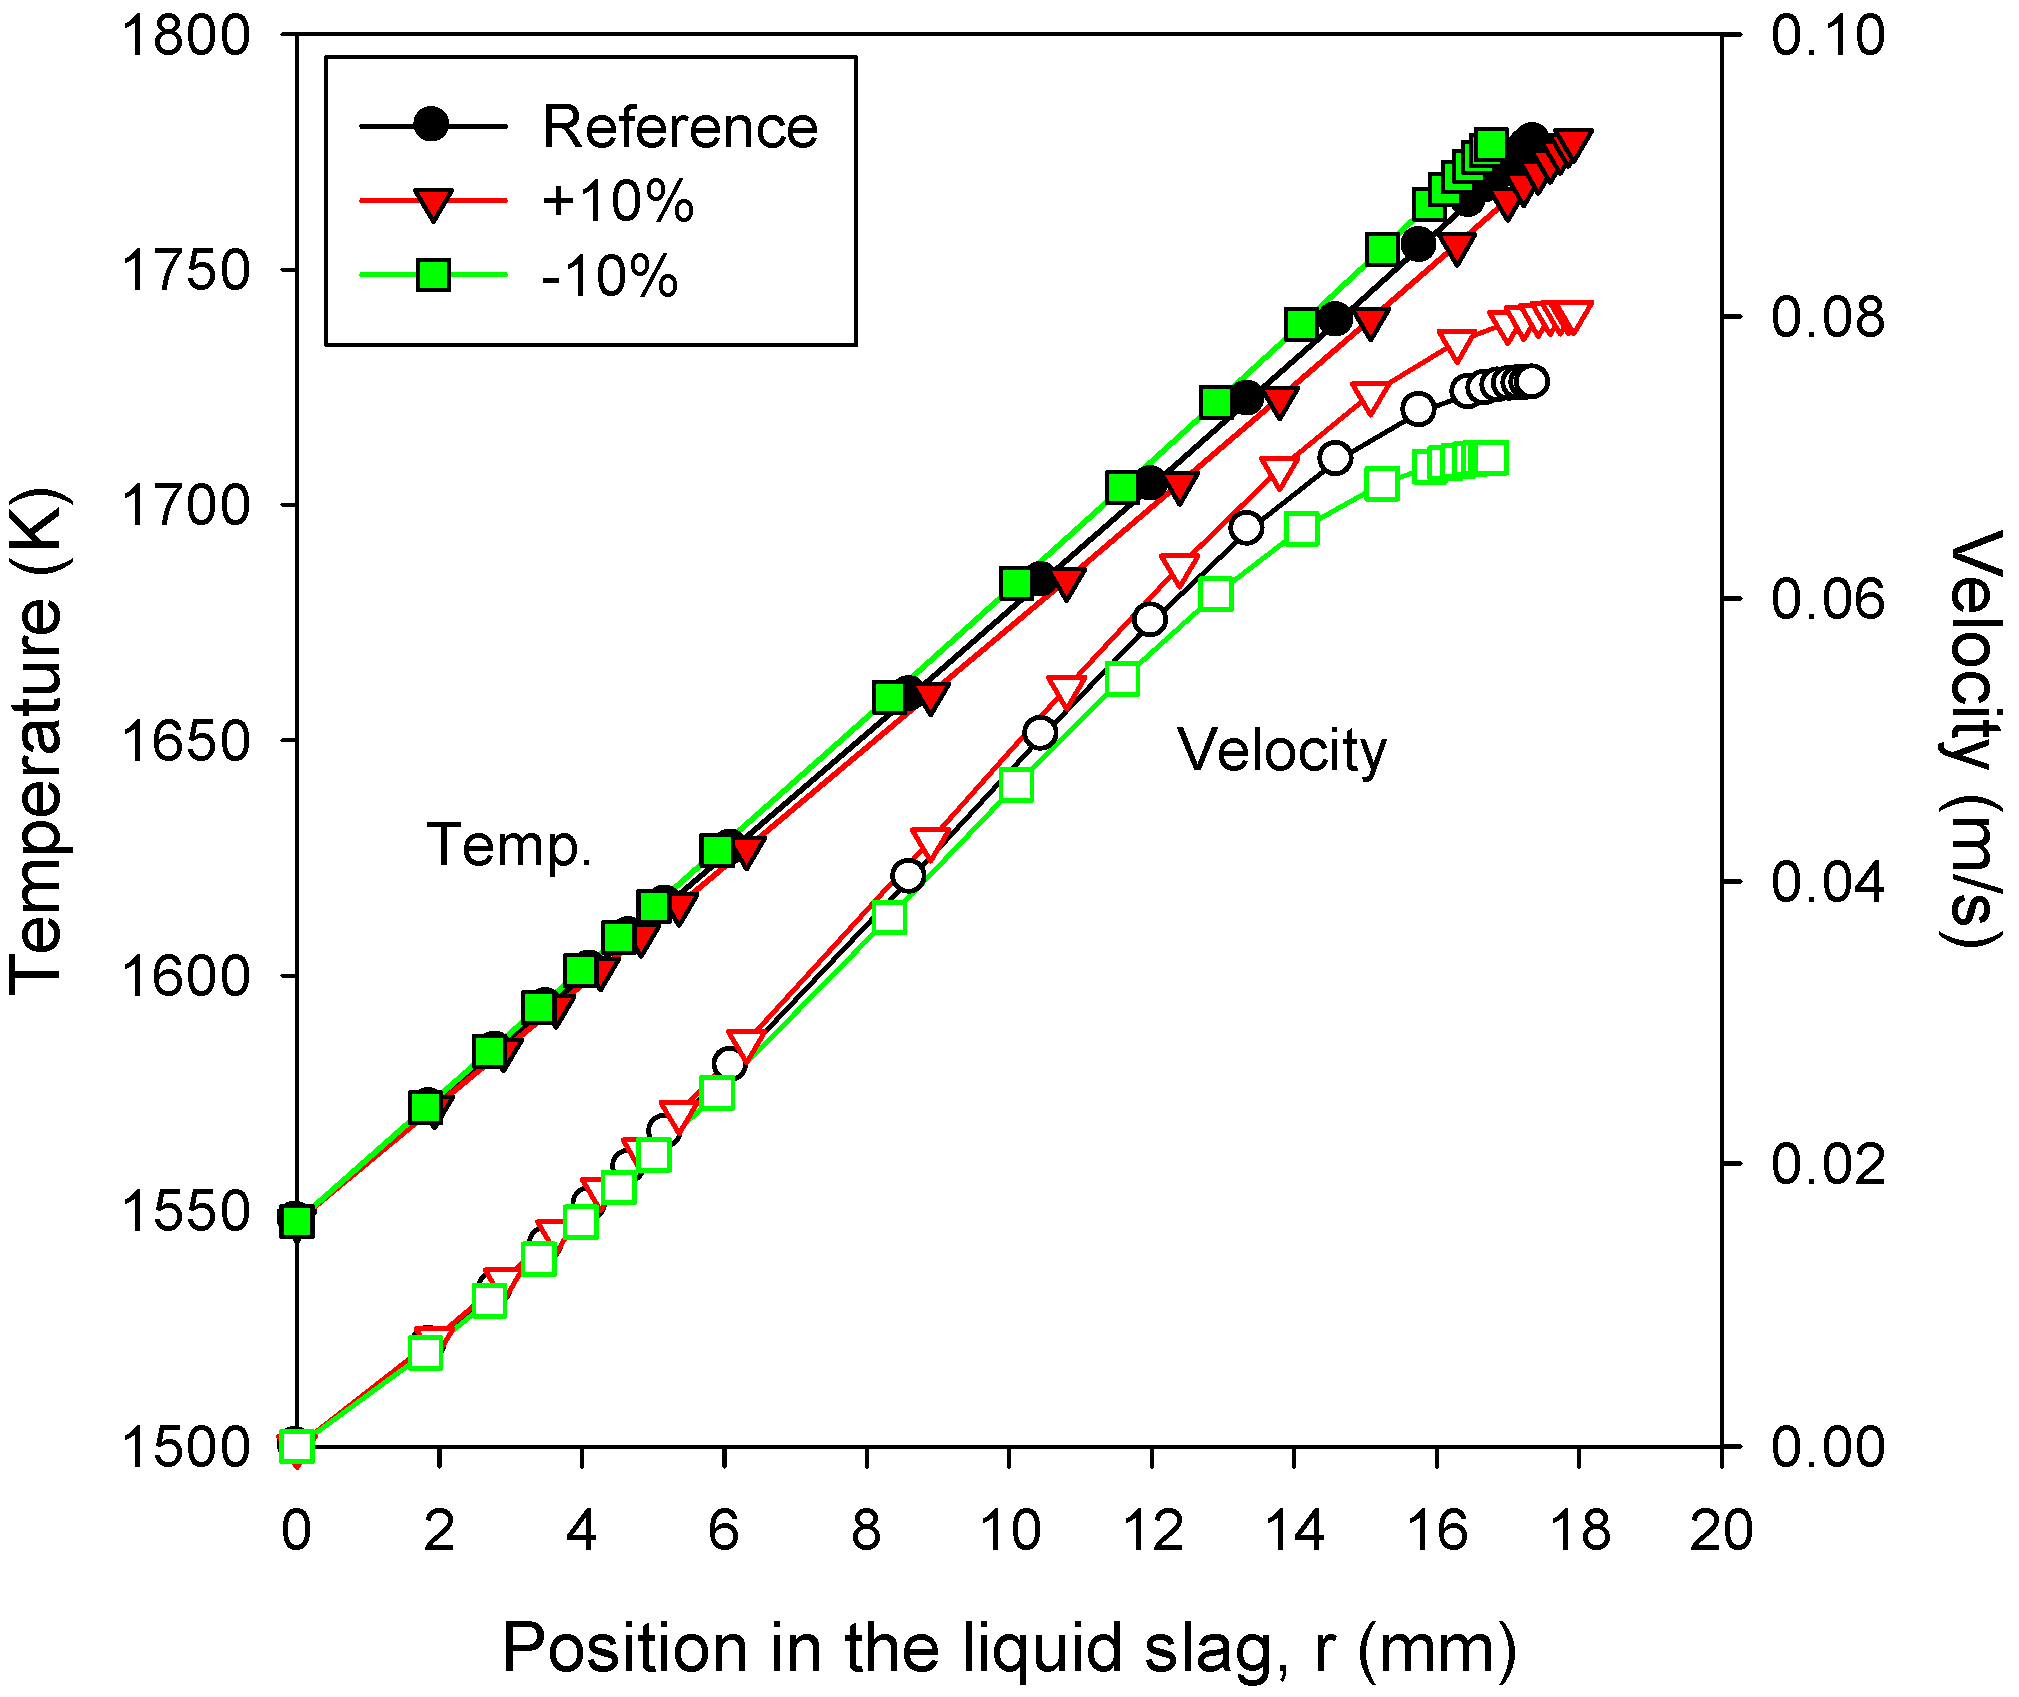
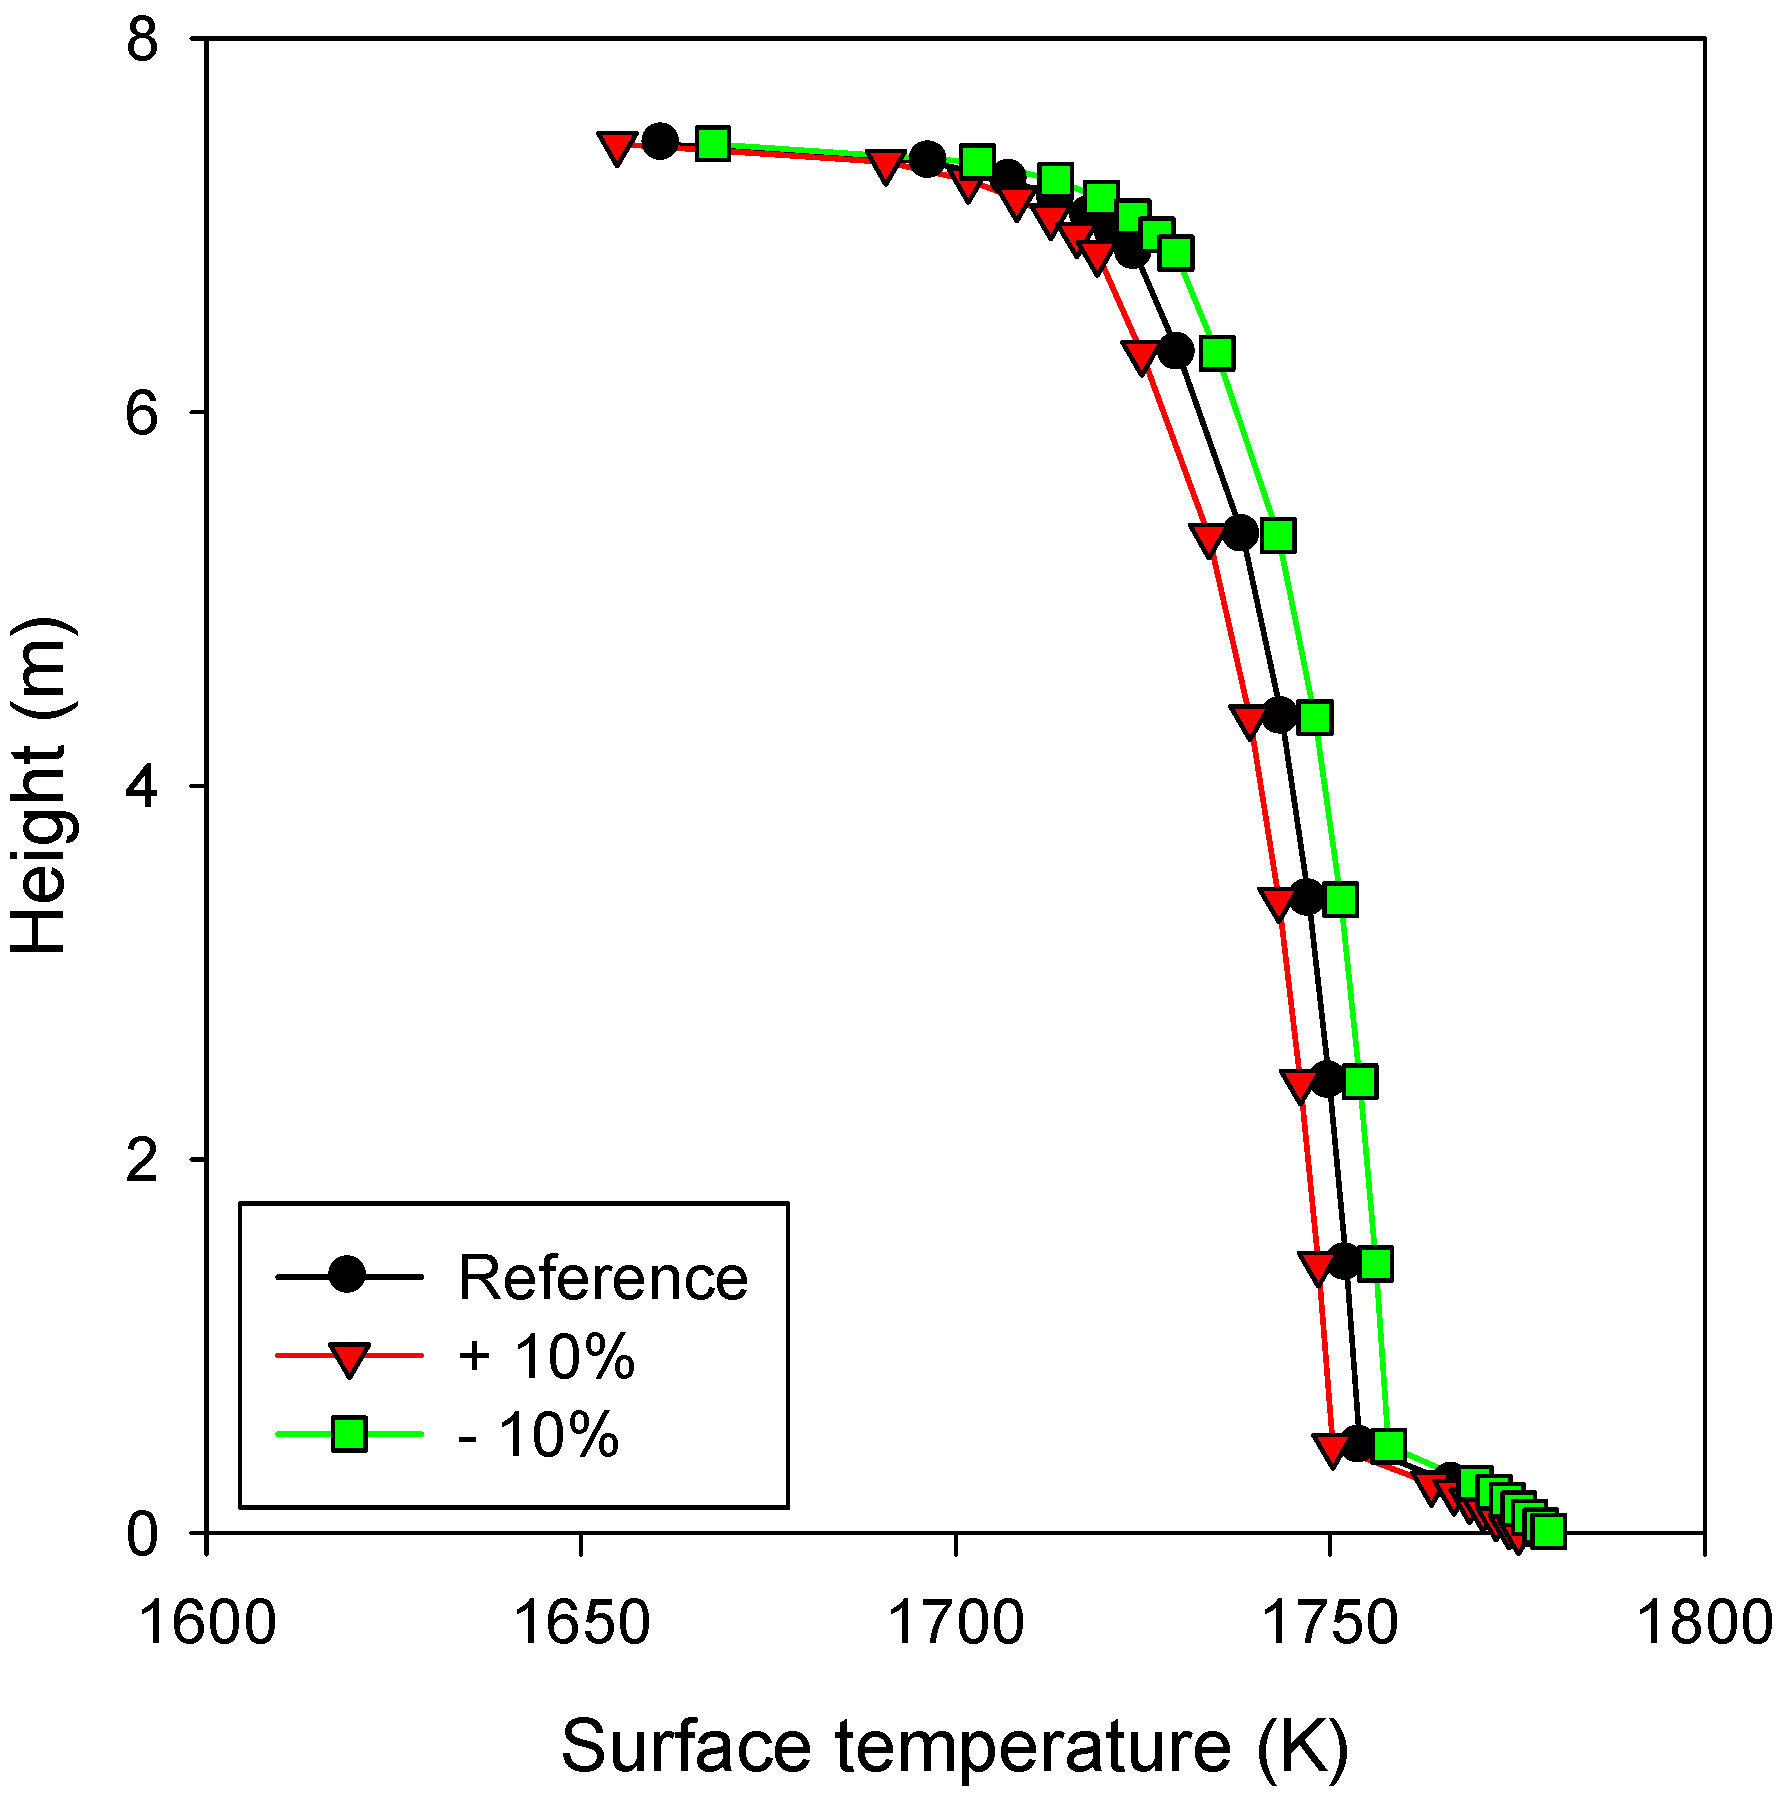
3.5. Effects of Slag Properties: Viscosity

The viscosity of the liquid slag is a crucial property governing the slag behaviors on the wall. Because of the difficulty in measuring the viscosity at high temperatures, several correlations based on the slag composition have been proposed [23,27,28,29,30]. However, these correlations exhibited deviations from the measured data depending on the ash samples [31,32,33] and with each other [34]. Predicting the influence of the viscosity on the slag behaviors would be helpful in evaluating the impact of the uncertainties involved in the correlations. This is also meaningful in terms of the gasifier operation, because the ash characteristics are important parameters in determining the range of suitable coals and the amount of flux required [11].
The ±10% variations in the slag viscosity were accompanied by changes in Tcv from 1548 K to 1557 K (+10%) and 1538 K (−10%), because the critical viscosity was assumed to be constant at 25 Pa·s. The values listed in Table 2 show that the increased viscosity thickened the liquid slag by only 1.2%, and the change in Tsurf was very small (1 K). Because the viscosity at r = 0 m remained the same, the influence on the velocity was visible toward the surface, with changes of about 0.0015 m/s as shown in Figure 8a. With a change in Tcv of about 10 K, however, the temperature gradient within the slag layer (i.e., the heat transfer rate) was reduced as shown in Figure 8b. This resulted in a 4%–5% change in both QGL and QLS (Table 2). As determined by Fourier’s law (δS ~ (TcvTR)/QLS), δS was influenced not only by QLS but also by Tcv. This led to a change in δS of approximately 6%, which was about five times larger than that in δL.
However, the above results require careful interpretation because the numerical model assumed the steady-state condition. A transient change in the viscosity of fresh liquid slag does not immediately affect Tcv at the inner layer facing the solid slag. If Tcv and Tgas remain the same, the results indicate that the change in the slag thickness would be very small. Therefore, expanding the model for transient simulations would be helpful in understanding the time-scale for the impact of the changes in the slag viscosity on the slag thickness. In the long term, lowering the slag viscosity (by changing the ash composition or the injection of flux) would reduce δS more than δL by the change in Tcv, as indicated in the results.
Figure 8. Effects of slag viscosity on (a) velocity; (b) temperature and viscosity distribution of liquid slag at the slag tap.
Energies 08 03370 g008

3.6. Effects of Slag Properties: Thermal Conductivity and Emissivity

The thermal conductivity of the slag positively influenced the heat transfer rates by Fourier’s law. The results in Table 2 show that QGL and QLS were changed by approximately ±7% for 10% variations in the thermal conductivity. However, the values of Tsurf and δL remained almost unaffected, with changes of approximately 2 K and 0.3%, respectively. Such a trend for Tsurf was observed along the entire wall, as shown in Figure 9.
Figure 9. Effects of slag conductivity on surface temperature of liquid slag along the wall.
Energies 08 03370 g009
Compared to δL, the changes in δS were larger (1.3%). This was because a relatively larger change in TR (3.7 K) was also induced by QLS. Overall, the effect of the thermal conductivity on QLS (to the coolant in the wall) was larger than that of the other parameters, except for Tgas. In contrast, its effect on the slag behaviors was smaller.
The surface emissivity (ε) of the liquid slag was found to have less influence on the slag behaviors, as presented in Table 2. Although QGL is proportional to ε based on the Stefan–Boltzmann equation, the actual changes in QGL were only about 3% for ±10% variations in ε from 0.83. This was because it accompanied a change in Tsurf. When ε was decreased to 0.747, for example, Tsurf was also lowered by 2.4 K (Table 2). Since this contributed toward an increase in QGL, the resultant decrease in QGL was limited to 3.2%. Subsequently, δS was increased by 2.1%. The change in δL was very small because the temperature and viscosity within the liquid slag layer were only slightly influenced.

4. Conclusions

Using the numerical model for slag flow, the influences of the design/operation parameters and slag properties were investigated for a commercial coal gasifier by varying the parameters by ±10% from the reference conditions. The key findings are as follows.
  • The velocity profile of the liquid slag was less sensitive to the variations in the parameters, and therefore, the change in the thickness of the liquid slag was typically smaller than that of the solid slag.
  • The gas temperature was found to be highly influential, because of its dominant effect on the radiative heat transfer to the slag layer. The solid slag thickness increased exponentially with an increase in the gas temperature.
  • The effect of the variations in the ash deposition rate was diminished by the high-velocity region developed near the liquid slag surface. Increasing the ash deposition rate by 10% caused an approximate 3% increase in the thickness of the slag layers.
  • The slag viscosity significantly influenced the solid slag thickness through the corresponding changes in the temperature (Tcv) and its gradient (heat flux) at the interface of the solid and liquid slag layers. Decreasing the slag viscosity by 10% reduced the thickness of the liquid slag by only 1.3%, whereas that of the solid slag was reduced by 6%.
  • A higher thermal conductivity of the slag directly increased the heat transfer rate across the slag layer, whereas its effect on the thickness of the slag layers was very small.
  • For the bottom cone of the gasifier, steeper angles were favorable to reduce the slag layer thickness.
In an actual gasifier, the reactions and heat transfer in the gasifier and the slag behaviors on the wall are closely coupled and interact with each other, unlike the simplification in this parametric study. Therefore, applications of the numerical model integrated with a process simulation or computational fluid dynamics are required to gain a deeper understanding of the complex interactions.

Acknowledgments

This work was supported by the New & Renewable Energy Core Technology Program of the Korea Institute of Energy Technology Evaluation and Planning (KETEP) and Doosan Heavy Industries and Construction granted financial resource from the Ministry of Trade, Industry & Energy, Korea (2011951010001A).

Author Contributions

Changkook Ryu and Insoo Ye formulated the numerical model for the slag, and Insoo Ye and Junho Oh developed the Excel VBA code for the model. All authors were involved in determining the simulation conditions, analyzing the results and preparing the manuscript.

Nomenclature

Aarea, m2ggravity, 9.81 m/s2
Henthalpy, J/skthermal conductivity, W/m·K
Mmomentum, kg∙m/s2mmass flow rate, kg/s
Qheat transfer rate, Wqheat flux, W/m2
rradius perpendicular to the wall, mTtemperature, K
Vvolume, m3vstreamwise velocity, m/s
ylength parallel to the wall, m
Greek
αangle from the horizontal plane °δthickness of a slag layer, m
εemissivityμviscosity, Pa·s
ρdensity, kg/m3
Subscript
condconductioncvcritical viscosity
depdepositing slaggasgas
GLfrom gas to liquid slagglassglass transition of slag
ininflowLliquid slag
LSfrom liquid slag to solid slagoutoutflow to the section below
reactreactions of residual carbon or the phase transformationRrefractory
Ssolid slagsurfliquid slag surface facing gas

Conflicts of Interest

The authors declare no conflicts of interest.

References

  1. Stiegel, G.J.; Maxwell, R.C. Gasification technologies: The path to clean, affordable energy in the 21st century. Fuel Process. Technol. 2001, 71, 79–97. [Google Scholar] [CrossRef]
  2. Higman, C.; van der Burgt, M. Gasification, 2nd ed.; Elsevier: New York, NY, USA, 2008. [Google Scholar]
  3. Wang, P.; Massoudi, M. Slag behavior in gasifiers. Part I: Influence of coal properties and gasification conditions. Energies 2013, 6, 784–806. [Google Scholar] [CrossRef]
  4. Duchesne, M.A.; Hughes, R.W.; Lu, D.Y.; McCalden, D.J.; Anthony, E.J.; Macchi, A. Fate of inorganic matter in entrained-flow slagging gasifiers: Pilot plant testing. Fuel Process. Technol. 2014, 125, 18–33. [Google Scholar] [CrossRef]
  5. Ni, J.J.; Zhou, Z.J.; Yu, G.S.; Liang, Q.F.; Wang, F.C. Molten slag flow and phase transformation behaviors in a slagging entrained-flow coal gasifier. Ind. Eng. Chem. Res. 2010, 49, 12302–12310. [Google Scholar] [CrossRef]
  6. Ilyushechkin, A.Y.; Hla, S.S.; Roberts, D.G.; Kinaev, N.N. The effect of solids and phase compositions on viscosity behaviour and TCV of slags from Australian bituminous coals. J. Non-Cryst. Solids 2011, 357, 893–902. [Google Scholar] [CrossRef]
  7. Song, W.J.; Dong, Y.H.; Wu, Y.Q.; Zhu, Z.B. Prediction of temperature of critical viscosity for coal ash slag. AIChE J. 2011, 57, 2921–2925. [Google Scholar] [CrossRef]
  8. McLennan, A.R.; Bryant, G.W.; Bailey, C.W.; Stanmore, B.R.; Wall, T.F. An experimental comparison of the ash formed from coals containing pyrite and siderite mineral in oxidizing and reducing conditions. Energy Fuels 2000, 14, 308–315. [Google Scholar] [CrossRef]
  9. McLennan, A.R.; Bryant, G.W.; Bailey, C.W.; Stanmore, B.R.; Wall, T.F. Index for iron-based slagging for pulverized coal firing in oxidizing and reducing conditions. Energy Fuels 2000, 14, 349–354. [Google Scholar] [CrossRef]
  10. Duchesne, M.A.; Hall, A.D.; Hughes, R.W.; McCalden, D.J.; Anthony, E.J.; Macchi, A. Fate of inorganic matter in entrained-flow slagging gasifiers: Fuel characterization. Fuel Process. Technol. 2014, 118, 208–217. [Google Scholar] [CrossRef]
  11. Yun, Y.; Yoo, Y.D.; Chung, S.W. Selection of IGCC candidate coals by pilot-scale gasifier operation. Fuel Process. Technol. 2007, 88, 107–116. [Google Scholar] [CrossRef]
  12. Song, W.; Tang, L.; Zhu, X.; Wu, Y.; Rong, Y.; Zhu, Z. Fusibility and flow properties of coal ash and slag. Fuel 2009, 88, 297–304. [Google Scholar] [CrossRef]
  13. Kong, L.; Bai, J.; Bai, Z.; Guo, Z.; Li, W. Improvement of ash flow properties of low-rank coal for entrained flow gasifier. Fuel 2014, 120, 122–129. [Google Scholar] [CrossRef]
  14. Kong, L.; Bai, J.; Li, W.; Bai, Z.; Guo, Z. Effect of lime addition on slag fluidity of coal ash. J. Fuel Chem. Technol. 2011, 39, 407–411. [Google Scholar] [CrossRef]
  15. Kong, L.; Bai, J.; Bai, Z.; Guo, Z.; Li, W. Effects of CaCO3 on slag flow properties at high temperatures. Fuel 2013, 109, 76–85. [Google Scholar] [CrossRef]
  16. Wang, J.; Liu, H.; Liang, Q.; Xu, J. Experimental and numerical study on slag deposition and growth at the slag tap hole region of Shell gasifier. Fuel Process. Technol. 2013, 106, 704–711. [Google Scholar] [CrossRef]
  17. Roberts, D.G.; Harris, D.J.; Tremel, A.; Ilyushechkin, A.Y. Linking laboratory data with pilot scale entrained flow coal gasification performance. Part 2: Pilot scale testing. Fuel Process. Technol. 2012, 94, 26–33. [Google Scholar] [CrossRef]
  18. Sun, B.; Liu, Y.; Chen, X.; Zhou, Q.; Su, M. Dynamic modeling and simulation of shell gasifier in IGCC. Fuel Process. Technol. 2011, 92, 1418–1425. [Google Scholar] [CrossRef]
  19. Yang, Z.; Wang, Z.; Wu, Y.; Wang, J.; Lu, J.; Li, Z.; Ni, W. Dynamic model for an oxygen staged slagging entrained flow gasifier. Energy Fuels 2011, 25, 3646–3656. [Google Scholar] [CrossRef]
  20. Yong, S.Z.; Gazzino, M.; Ghoniem, A. Modeling the slag layer in solid fuel gasification and combustion—Formulation and sensitivity analysis. Fuel 2012, 92, 162–170. [Google Scholar] [CrossRef]
  21. Ye, I.; Ryu, C. Numerical modeling of slag flow and heat transfer on the wall of an entrained coal gasifier. Fuel 2015, 150, 64–74. [Google Scholar] [CrossRef]
  22. Seggiani, M. Modeling and simulation of time varying slag flow in a Prenflo entrained-flow gasifier. Fuel 1998, 77, 1611–1621. [Google Scholar] [CrossRef]
  23. Kalmanovitch, D.P.; Frank, M. An effective model of viscosity for ash deposition phenomena. In Proceedings of the Mineral Matter and Ash Deposition from Coal, Santa Barbara, CA, USA, 22–26 February 1998; Bryers, R.W., Vorres, K.S., Eds.; United Engineering Trustees Inc.: New York, NY, USA, 1998. [Google Scholar]
  24. Mills, K.C.; Rhine, J.M. The measurement and estimation of the physical properties of slag formed during coal gasification: 2. Properties relevant to heat transfer. Fuel 1989, 68, 904–910. [Google Scholar] [CrossRef]
  25. Mills, K.C.; Rhine, J.M. The measurement and estimation of the physical properties of slag formed during coal gasification: 1. Properties relevant to fluid flow. Fuel 1989, 68, 193–200. [Google Scholar] [CrossRef]
  26. Liu, S.; Tao, M.; Hao, Y. A numerical model for chemical reaction on slag layer surface and slag layer behavior in entrained-flow gasifier. Therm. Sci. 2013, 17, 1389–1394. [Google Scholar] [CrossRef]
  27. Watt, J.D.; Fereday, F. The flow properties of slags formed from the ashes of British coals: Part 1. viscosity of homogeneous liquid slags in relation to slag composition. J. Inst. Fuel 1969, 42, 99–103. [Google Scholar]
  28. Reid, W.T. External Corrosion and Deposits: Boilers and Gas Turbines; American Elsevier Publishing Co.: New York, NY, USA, 1971. [Google Scholar]
  29. Browning, G.J.; Bryant, G.W.; Hurst, H.J.; Lucas, J.A.; Wall, T.F. An empirical method for the prediction of coal ash slag viscosity. Energy Fuels 2003, 17, 731–737. [Google Scholar] [CrossRef]
  30. Urbain, G. Viscosity estimation of slags. Steel Res. Int. 1987, 58, 111–116. [Google Scholar]
  31. Zhang, L.; Jahansahi, S. Review and modeling of viscosity of silicate melts: Part I. Viscosity of binary and ternary silicates containing CaO, MgO, and MnO. Metall. Mater. Trans. B 1998, 29, 177–186. [Google Scholar] [CrossRef]
  32. Kondratiev, A.; Jak, E. Review of Experimental data and modeling of viscosities of fully liquid slags in the Al2O3-CaO-‘FeO’-SiO2 system. Metall. Mater. Trans. B 2001, 32, 1015–1025. [Google Scholar] [CrossRef]
  33. Seetharaman, S.; Mukai, K.; Sichen, D. Viscosities of slags—An overview. Steel Res. Int. 2005, 76, 267–278. [Google Scholar]
  34. Duchesne, M.A.; Bronsch, A.M.; Hughes, R.W.; Masset, P.J. Slag viscosity modeling toolbox. Fuel 2013, 114, 38–43. [Google Scholar] [CrossRef]

