
Design and Energy Performance of a Buoyancy Driven Exterior Shading Device for Building Application in Taiwan


Abstract
:1. Introduction
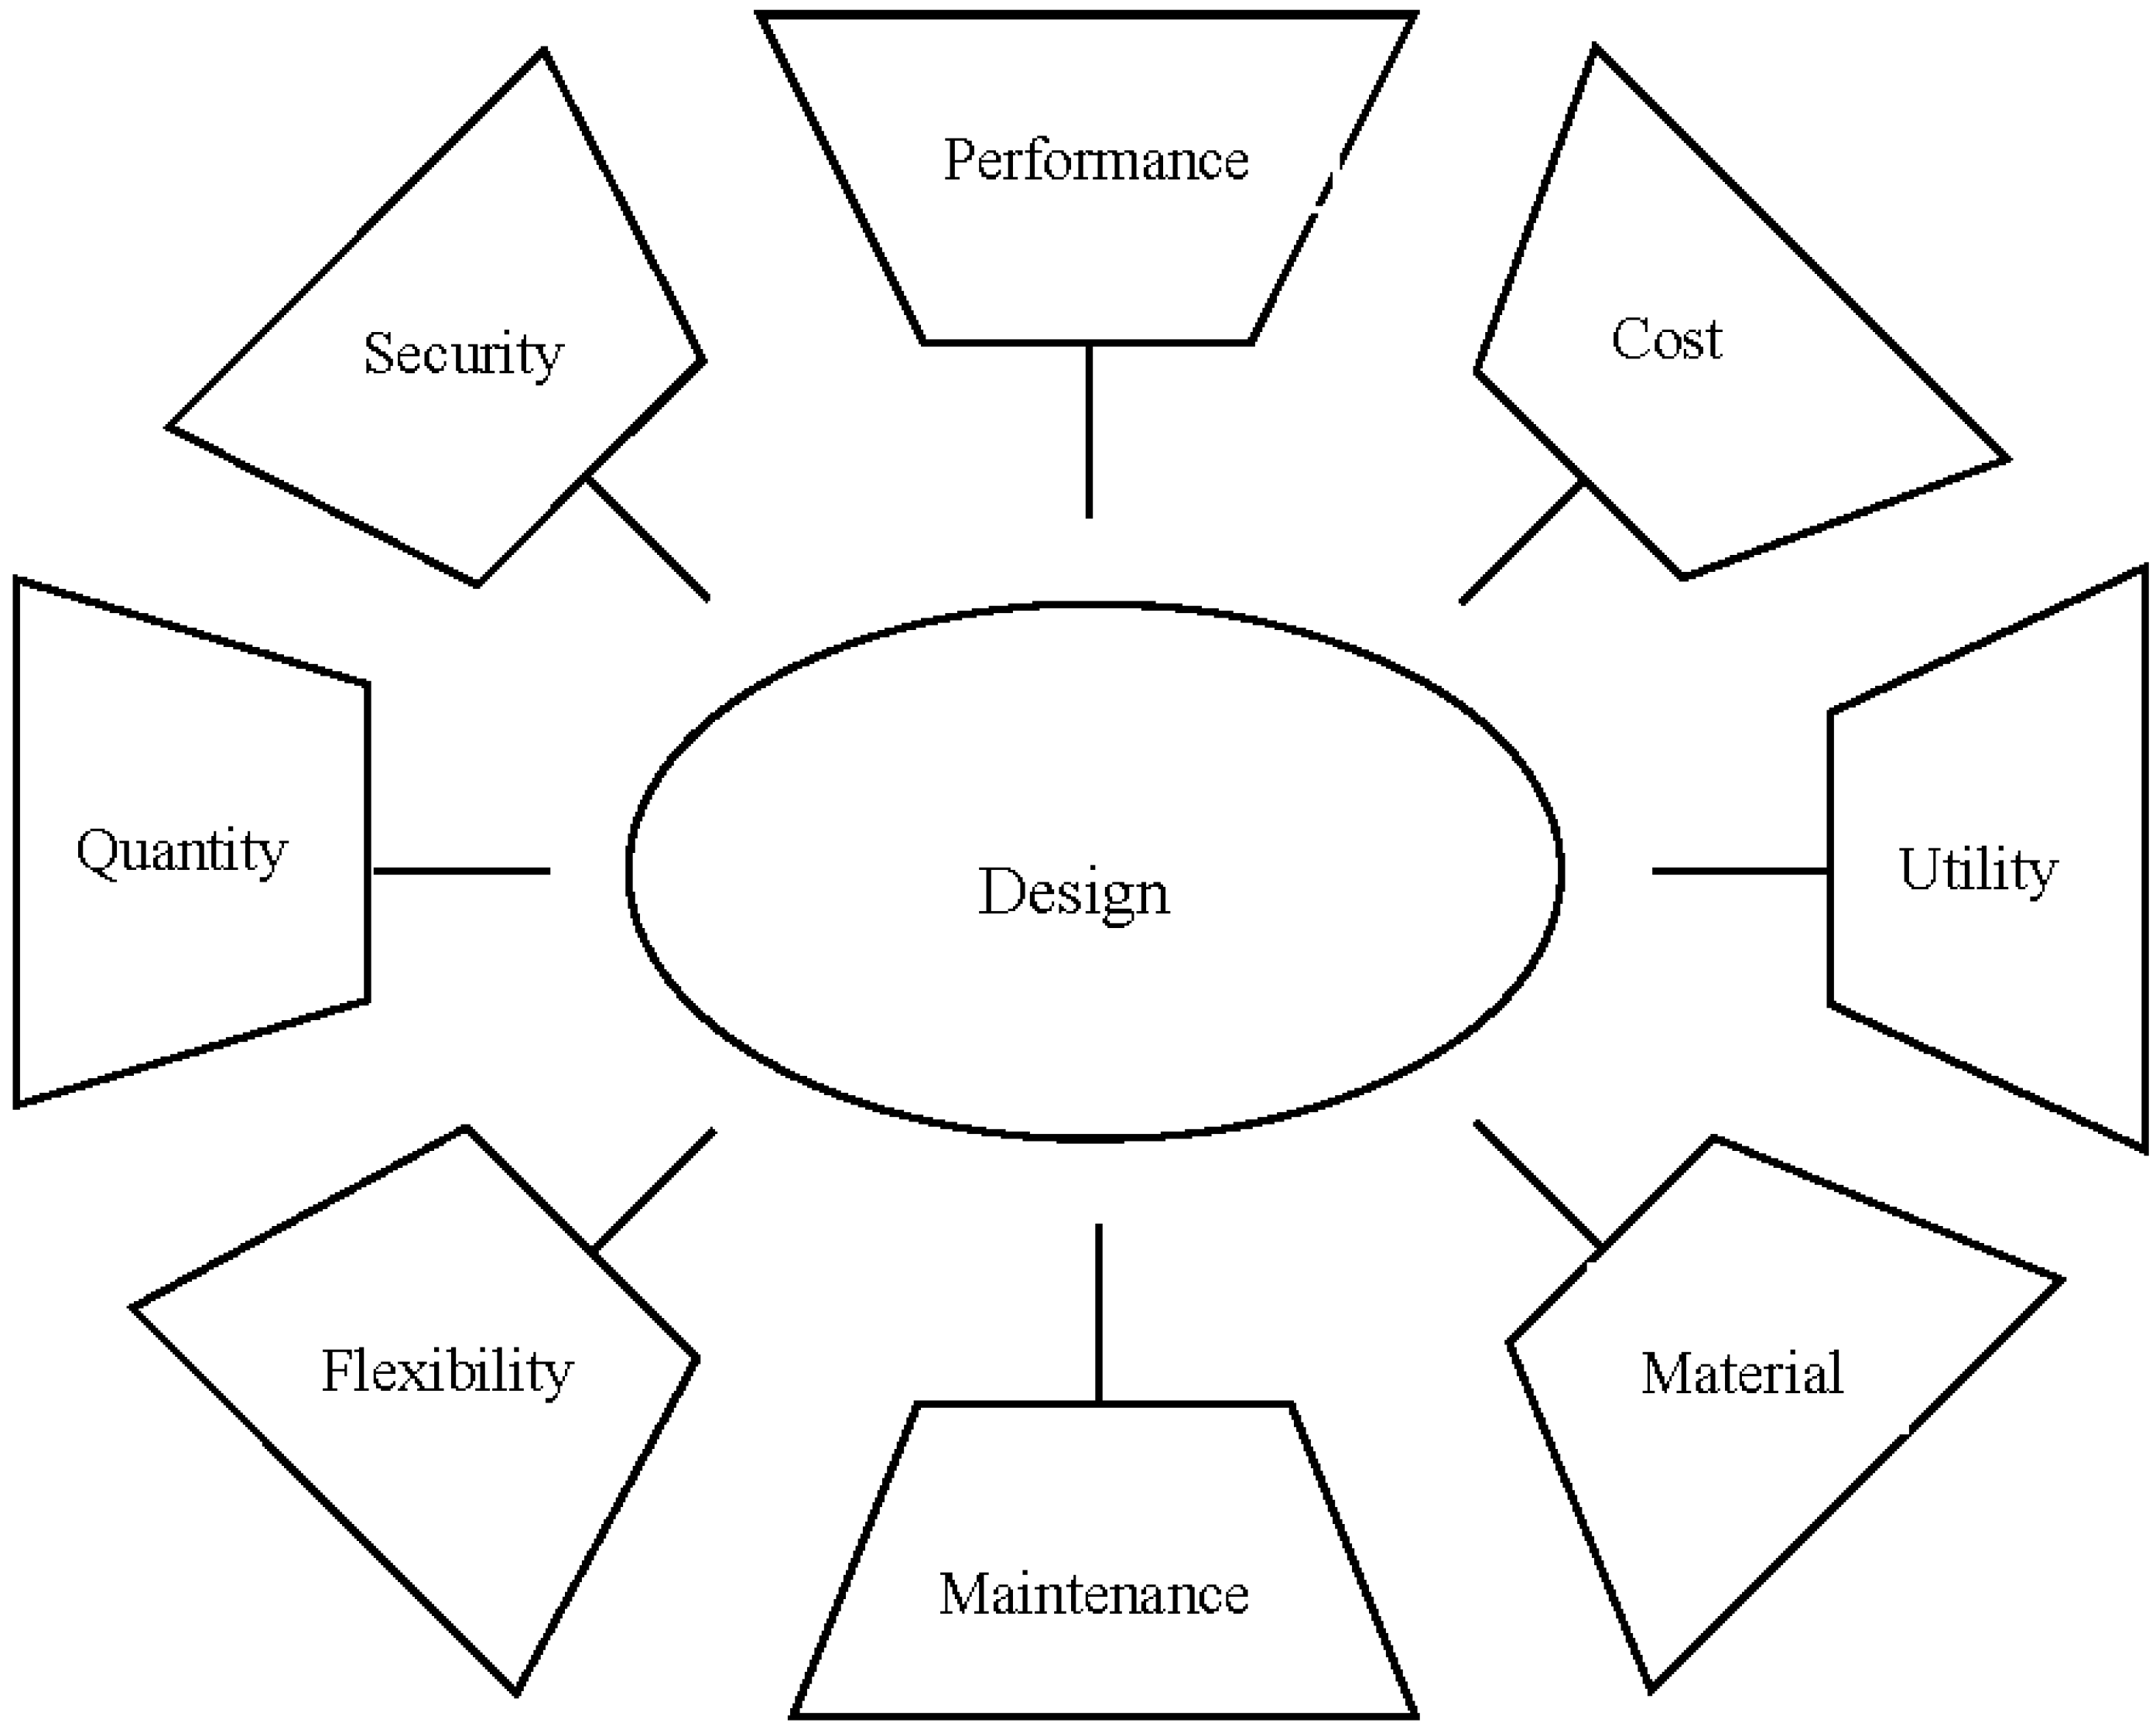
2. Design Consideration
- (1)
- The application must be realistic and practical.
- (2)
- All details must be improved, especially the design process and generation.
- (3)
- The design may be extensively used.
- (4)
- It must also possess the function of home security.
- (5)
- It must include all facts relevant to product maintenance.
- (6)
- The concepts may be improved in the future.
3. Methodology
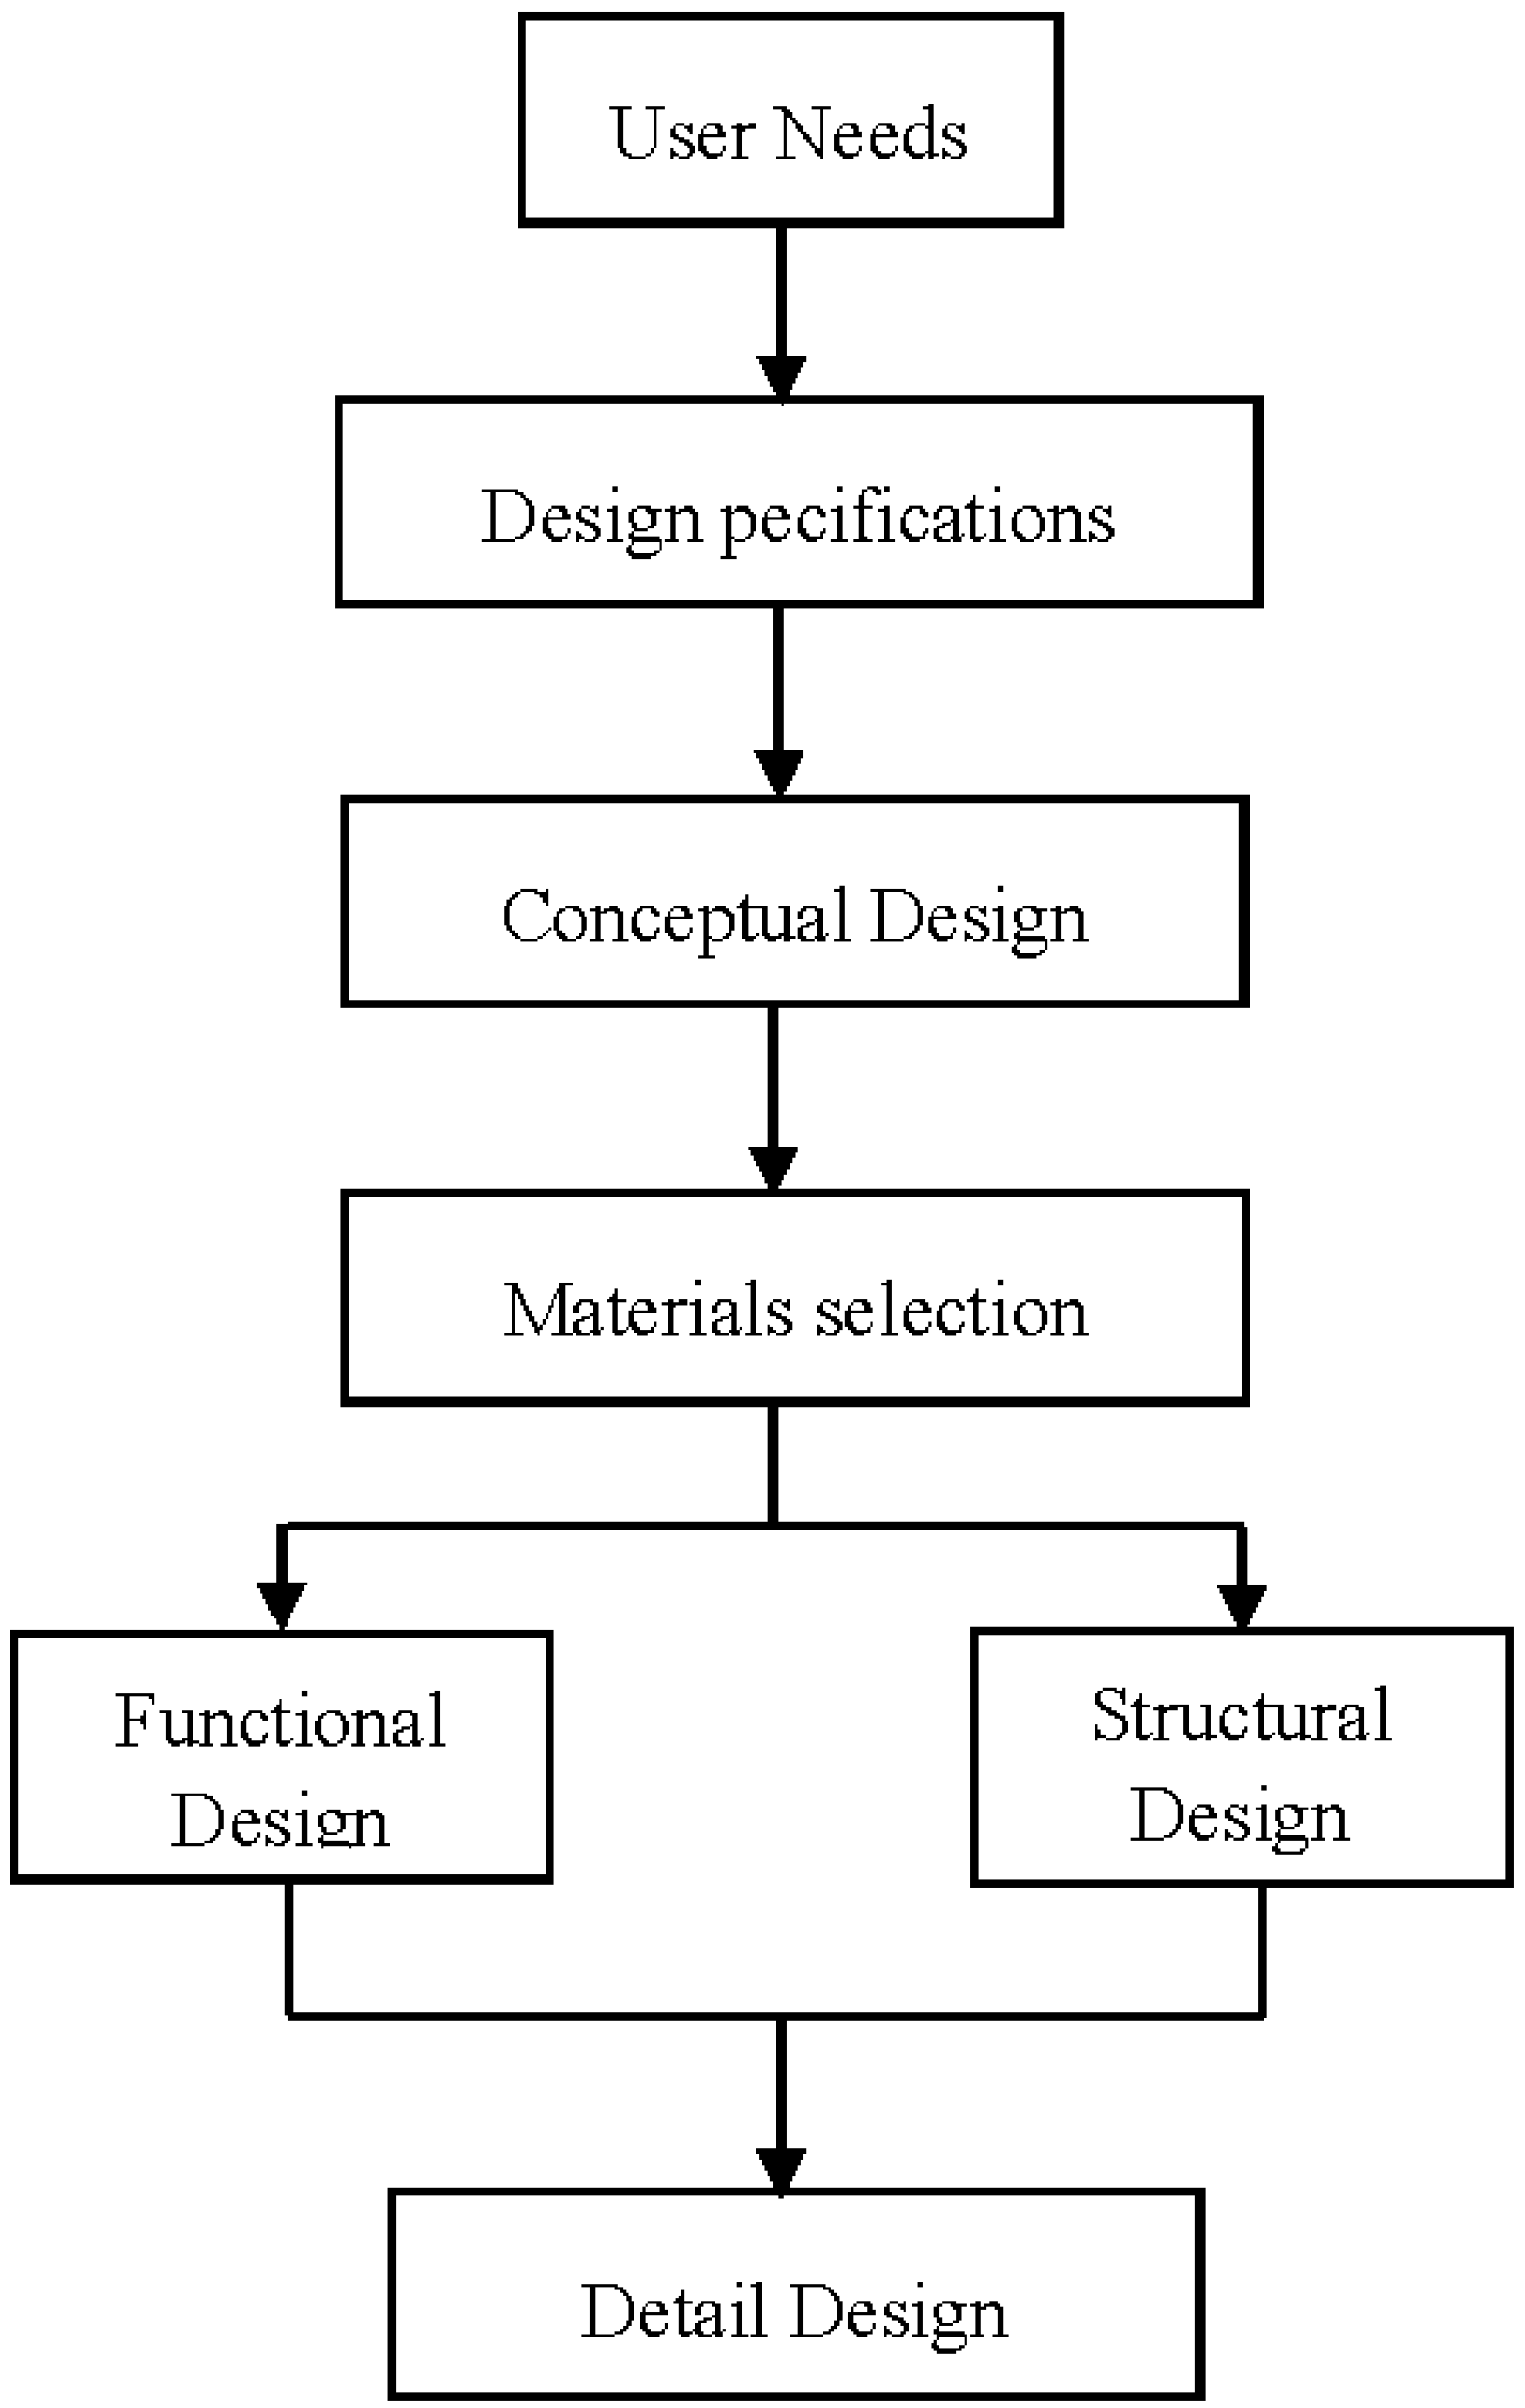
3.1. Materials Selection

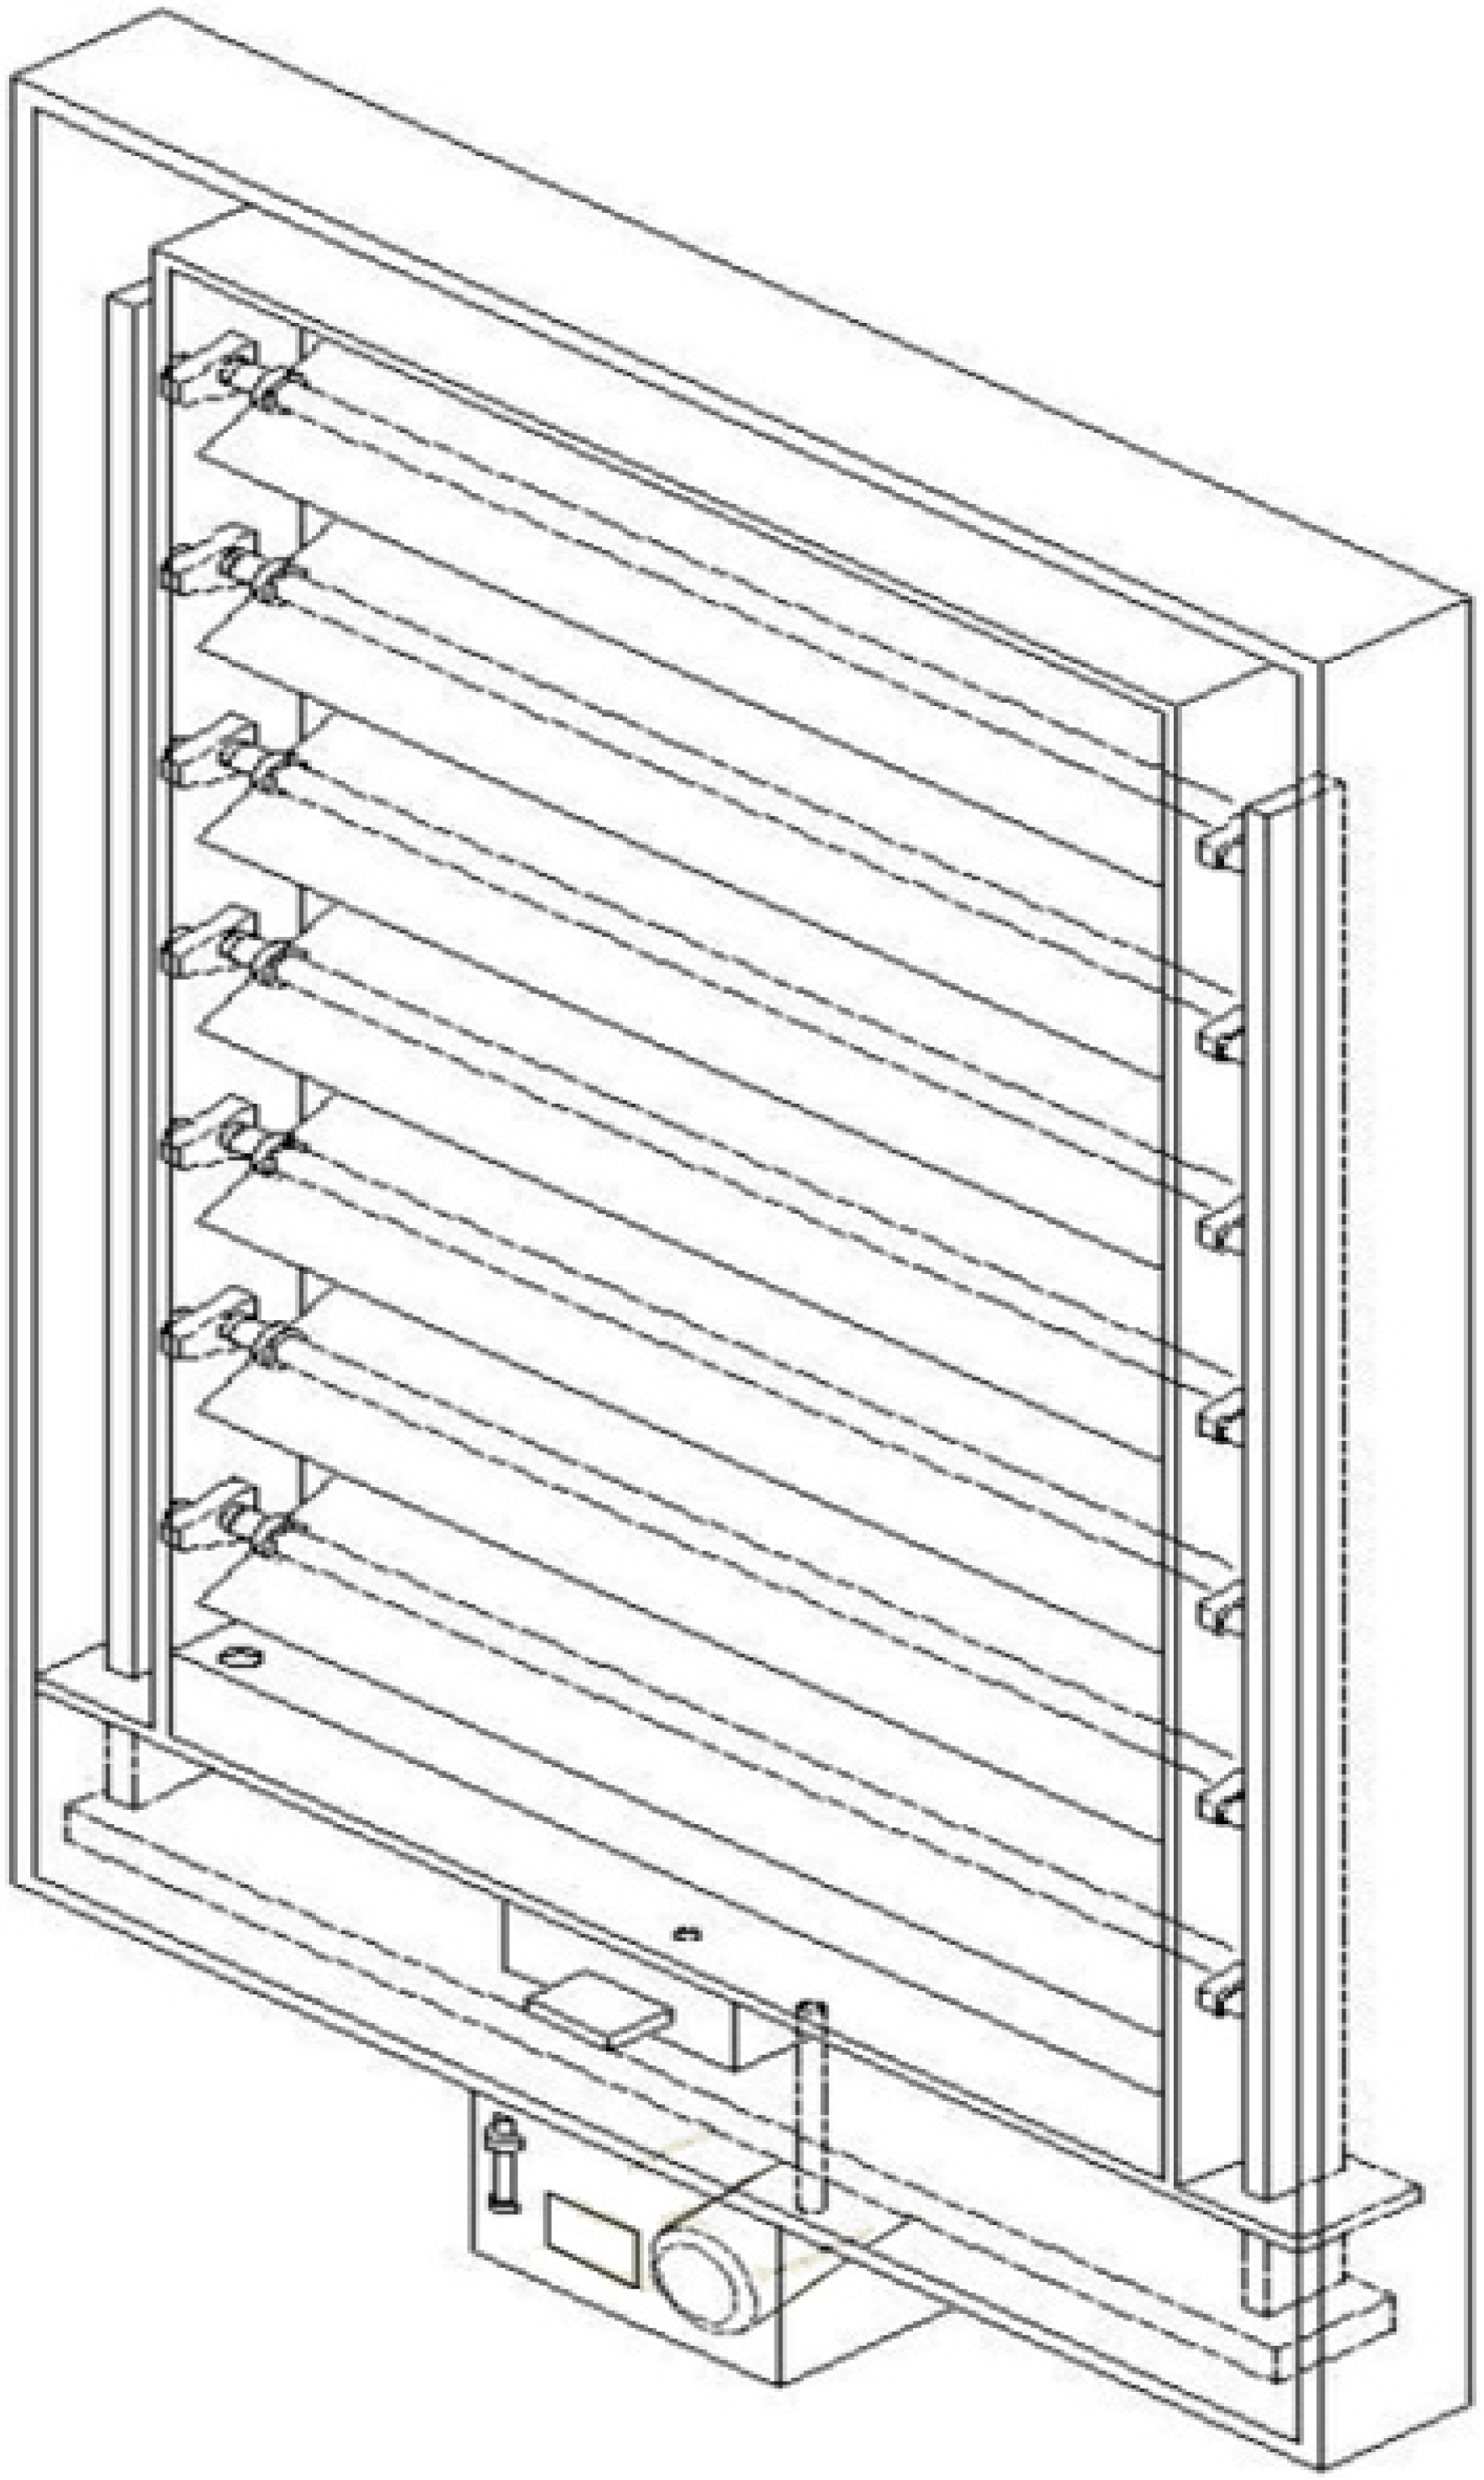
| Diagram | ||
|---|---|---|
 | ||
| Position | Designation | Description |
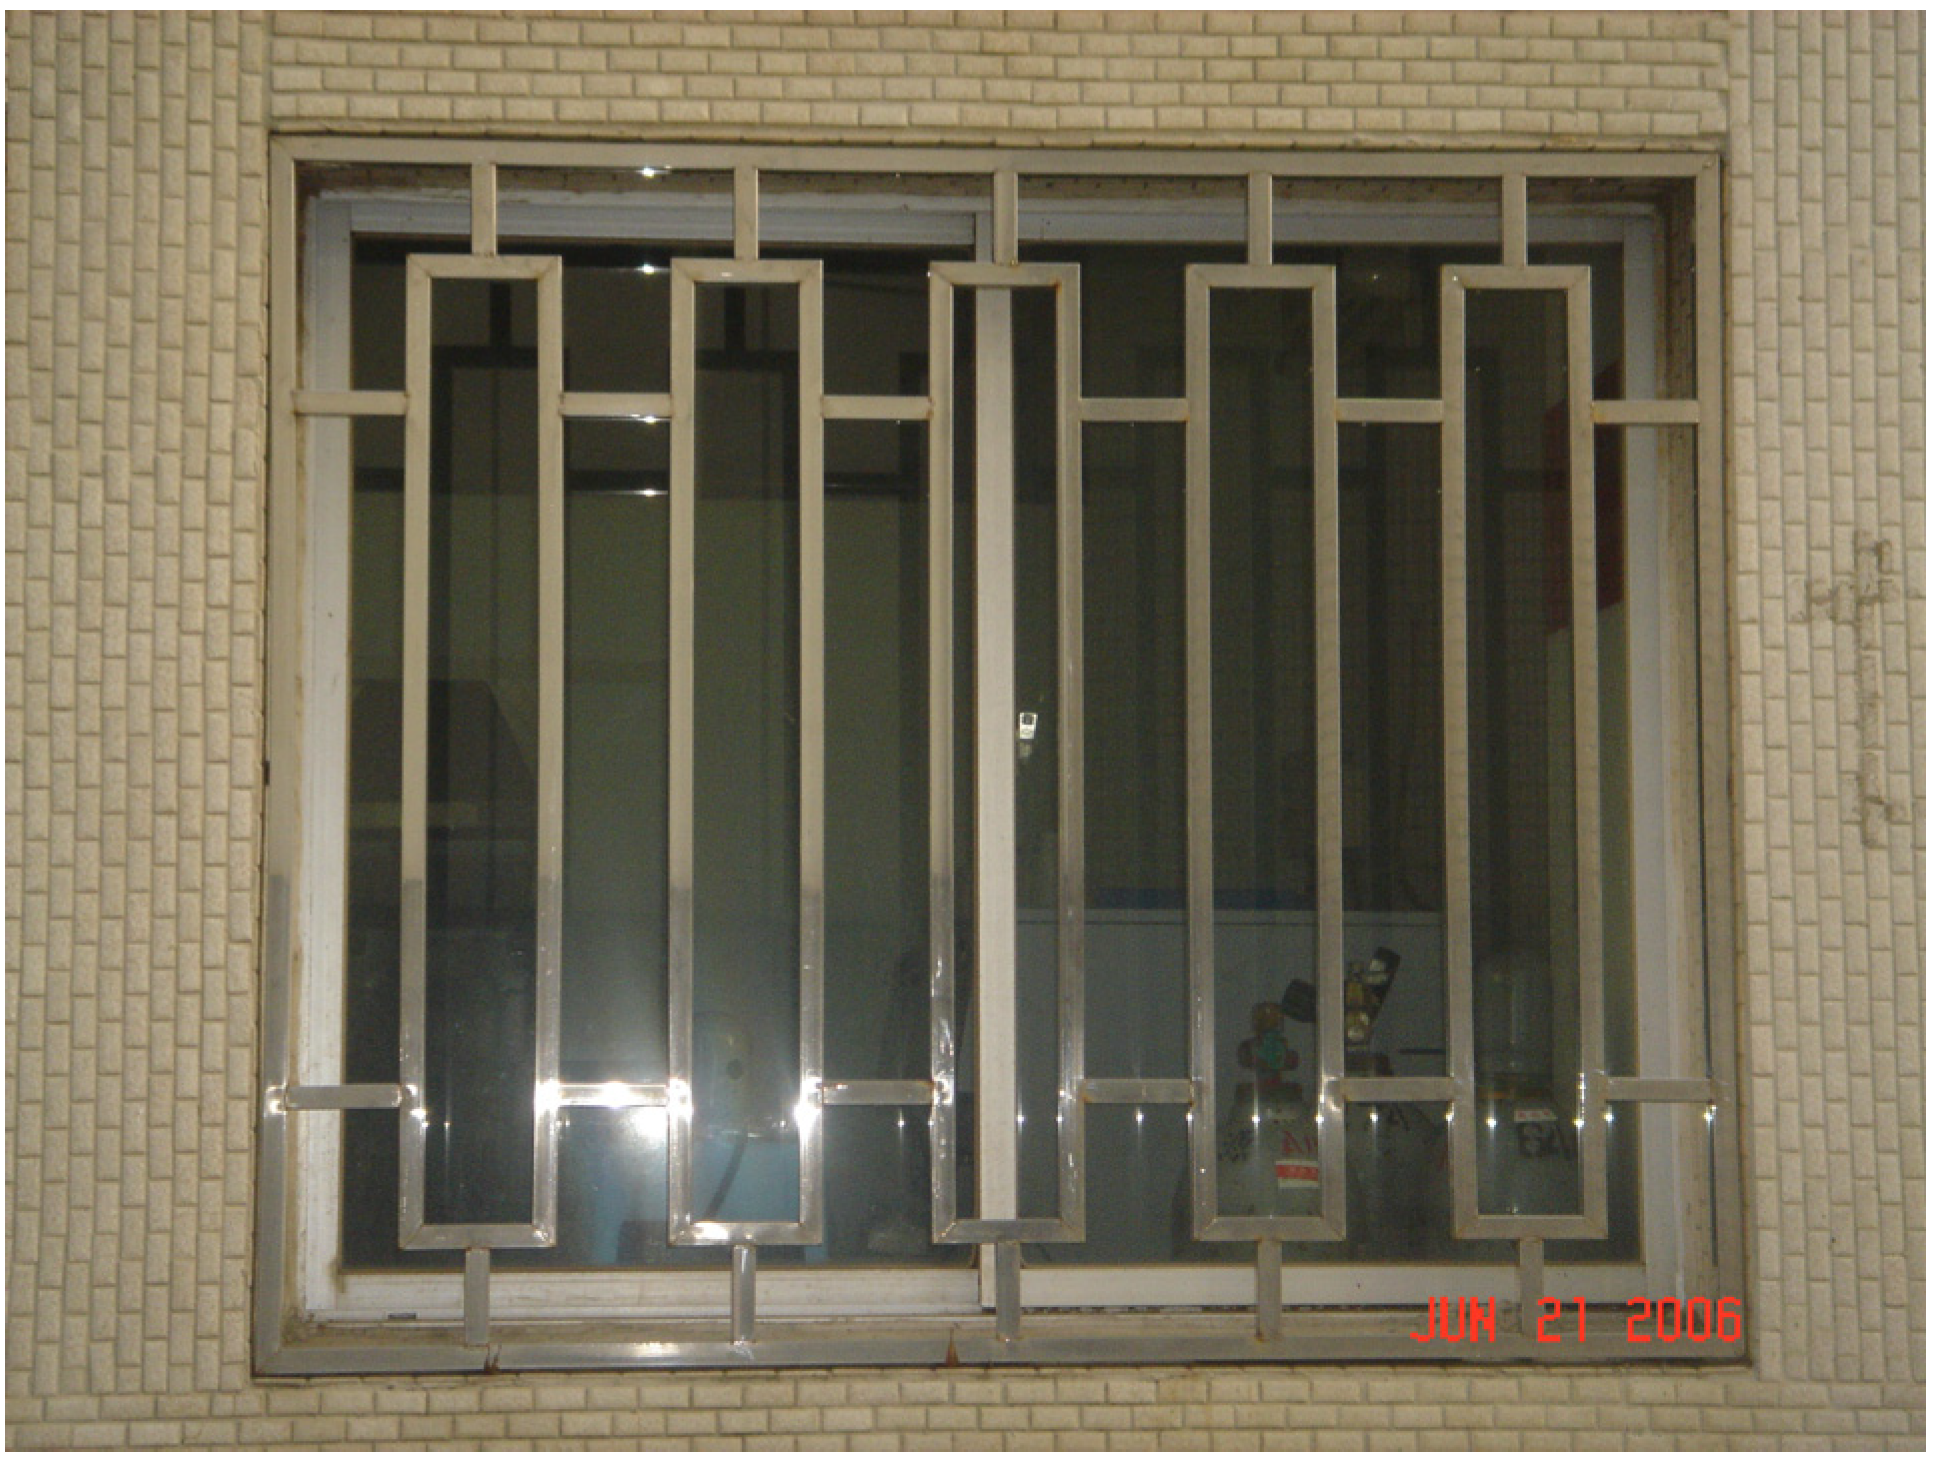
| A | External frame | Aluminum alloy, offer frame stability and security function |
| B | Interior frame | Aluminum alloy, offer frame stability and security function |
| C | Drive lever | Acrylic-plastic, move upward along with the uplifting level of liquid surface inside the compartment |
| D | Link | Acrylic-plastic, one end connected to the drive lever and the other, to the pivot |
| E | Panel | Acrylic-plastic, offer sun-shielding and daylight function |
| F | Pivot | Aluminum alloy, drive the panel to turn toward the intended direction and offer security function |
| G | Liquid supply hole | Rubber material, introduce liquid into the system |
| H | Upper chamber | Propose using liquid, provide the liquid volume required to turn the sun shading panel just for 60° |
| I | Liquid compartment | Connect to upper and lower chambers |
| J | Floating board | Expandable-polystyrene, offer the upward force and make drive lever rise, super-hydrophobic and high porosity |
| K | Lower chamber | Install floating board and make it move upward along with the uplifting level of liquid surface |
| L | Liquid level controller | Control the suitable time and pumping volume of motor |
| M | Maintenance section | Battery Replacement and motor maintenance |
| N | On-off switch | Set the operation time and the start switch |
| O | Motor | Convey the liquid of lower chamber to the upper one |
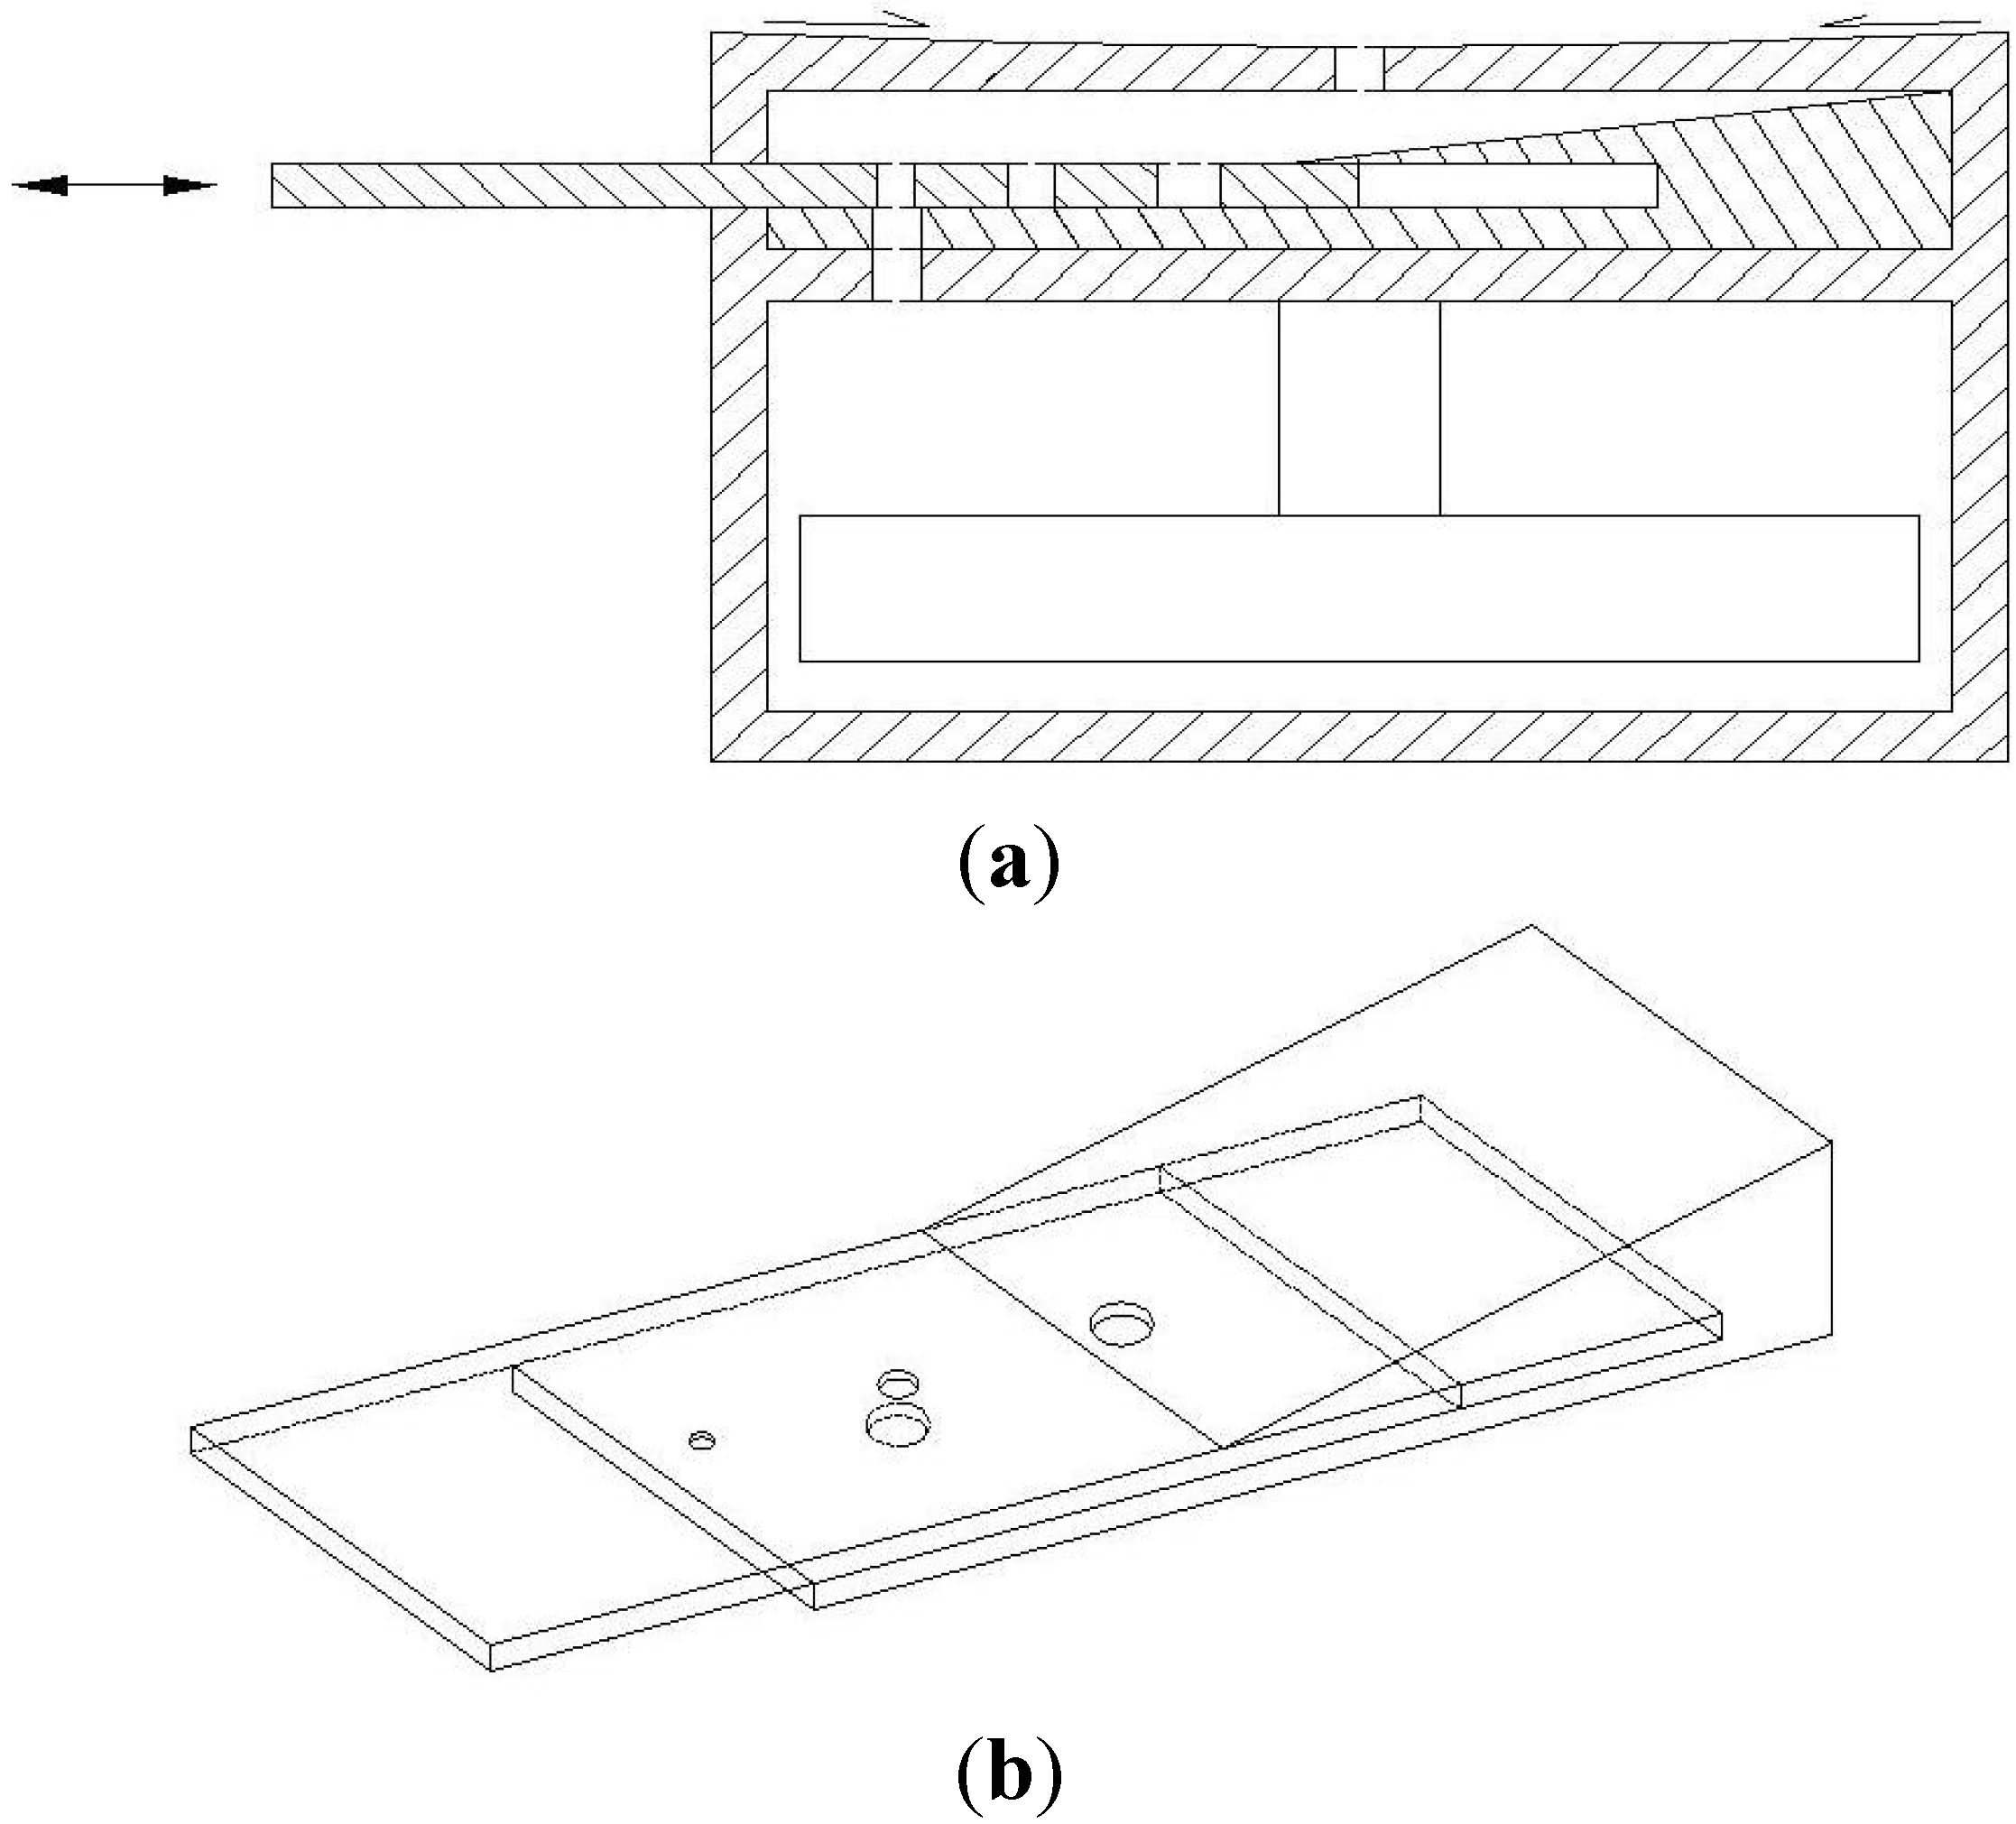
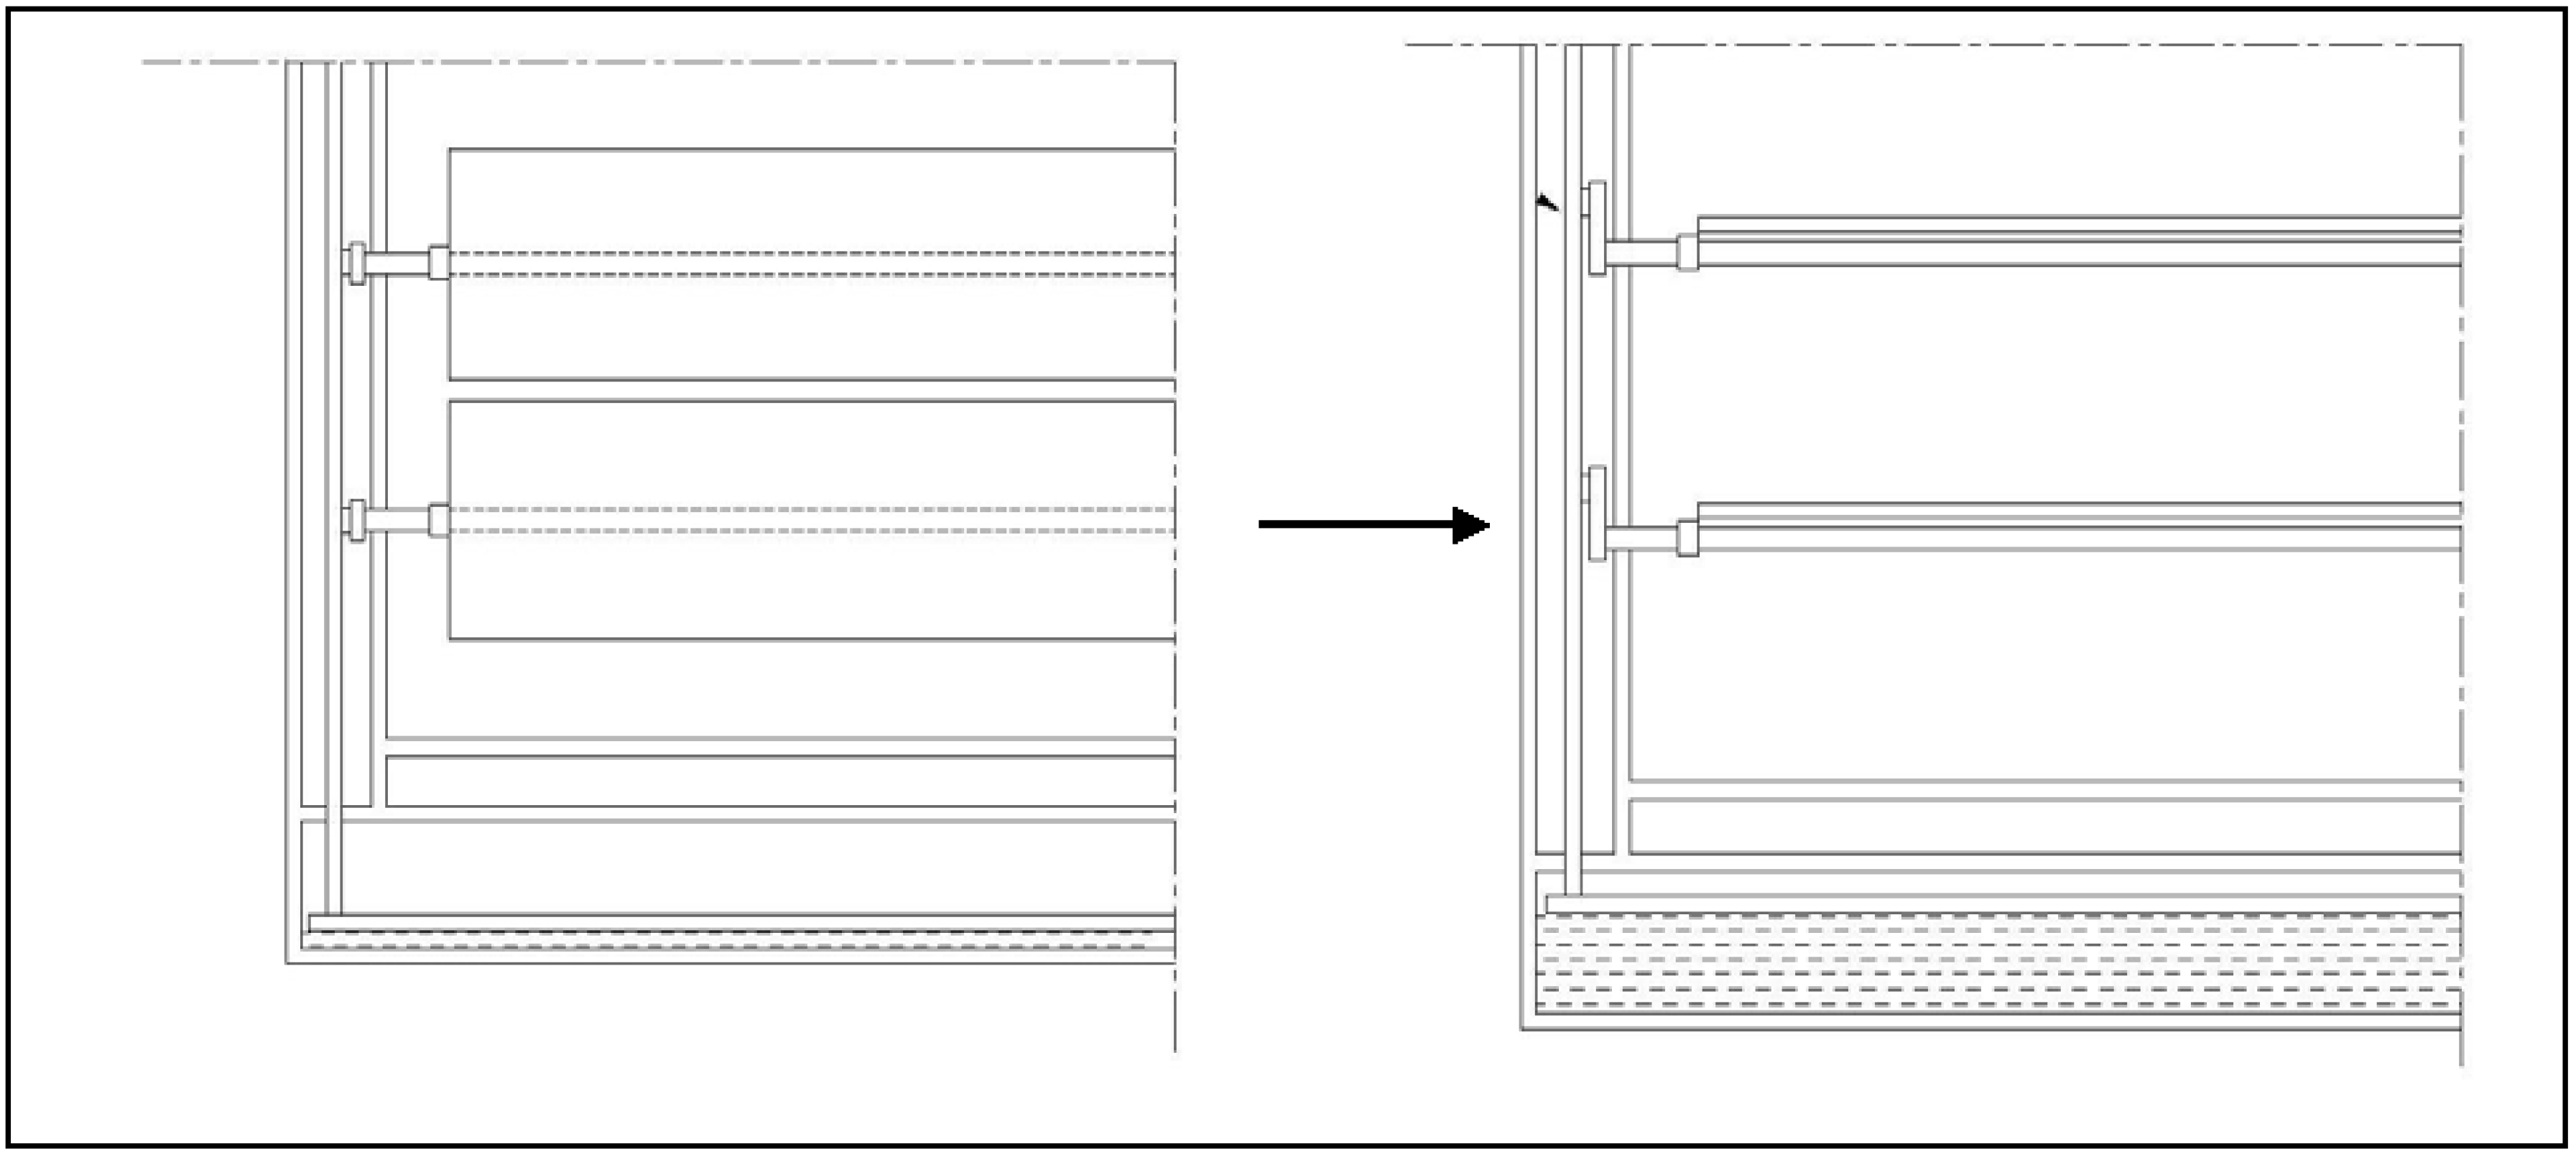
3.2. Functional and Structural Design


3.3. Detail Design

4. Impact on Indoor Environment
4.1. Simulation Tools
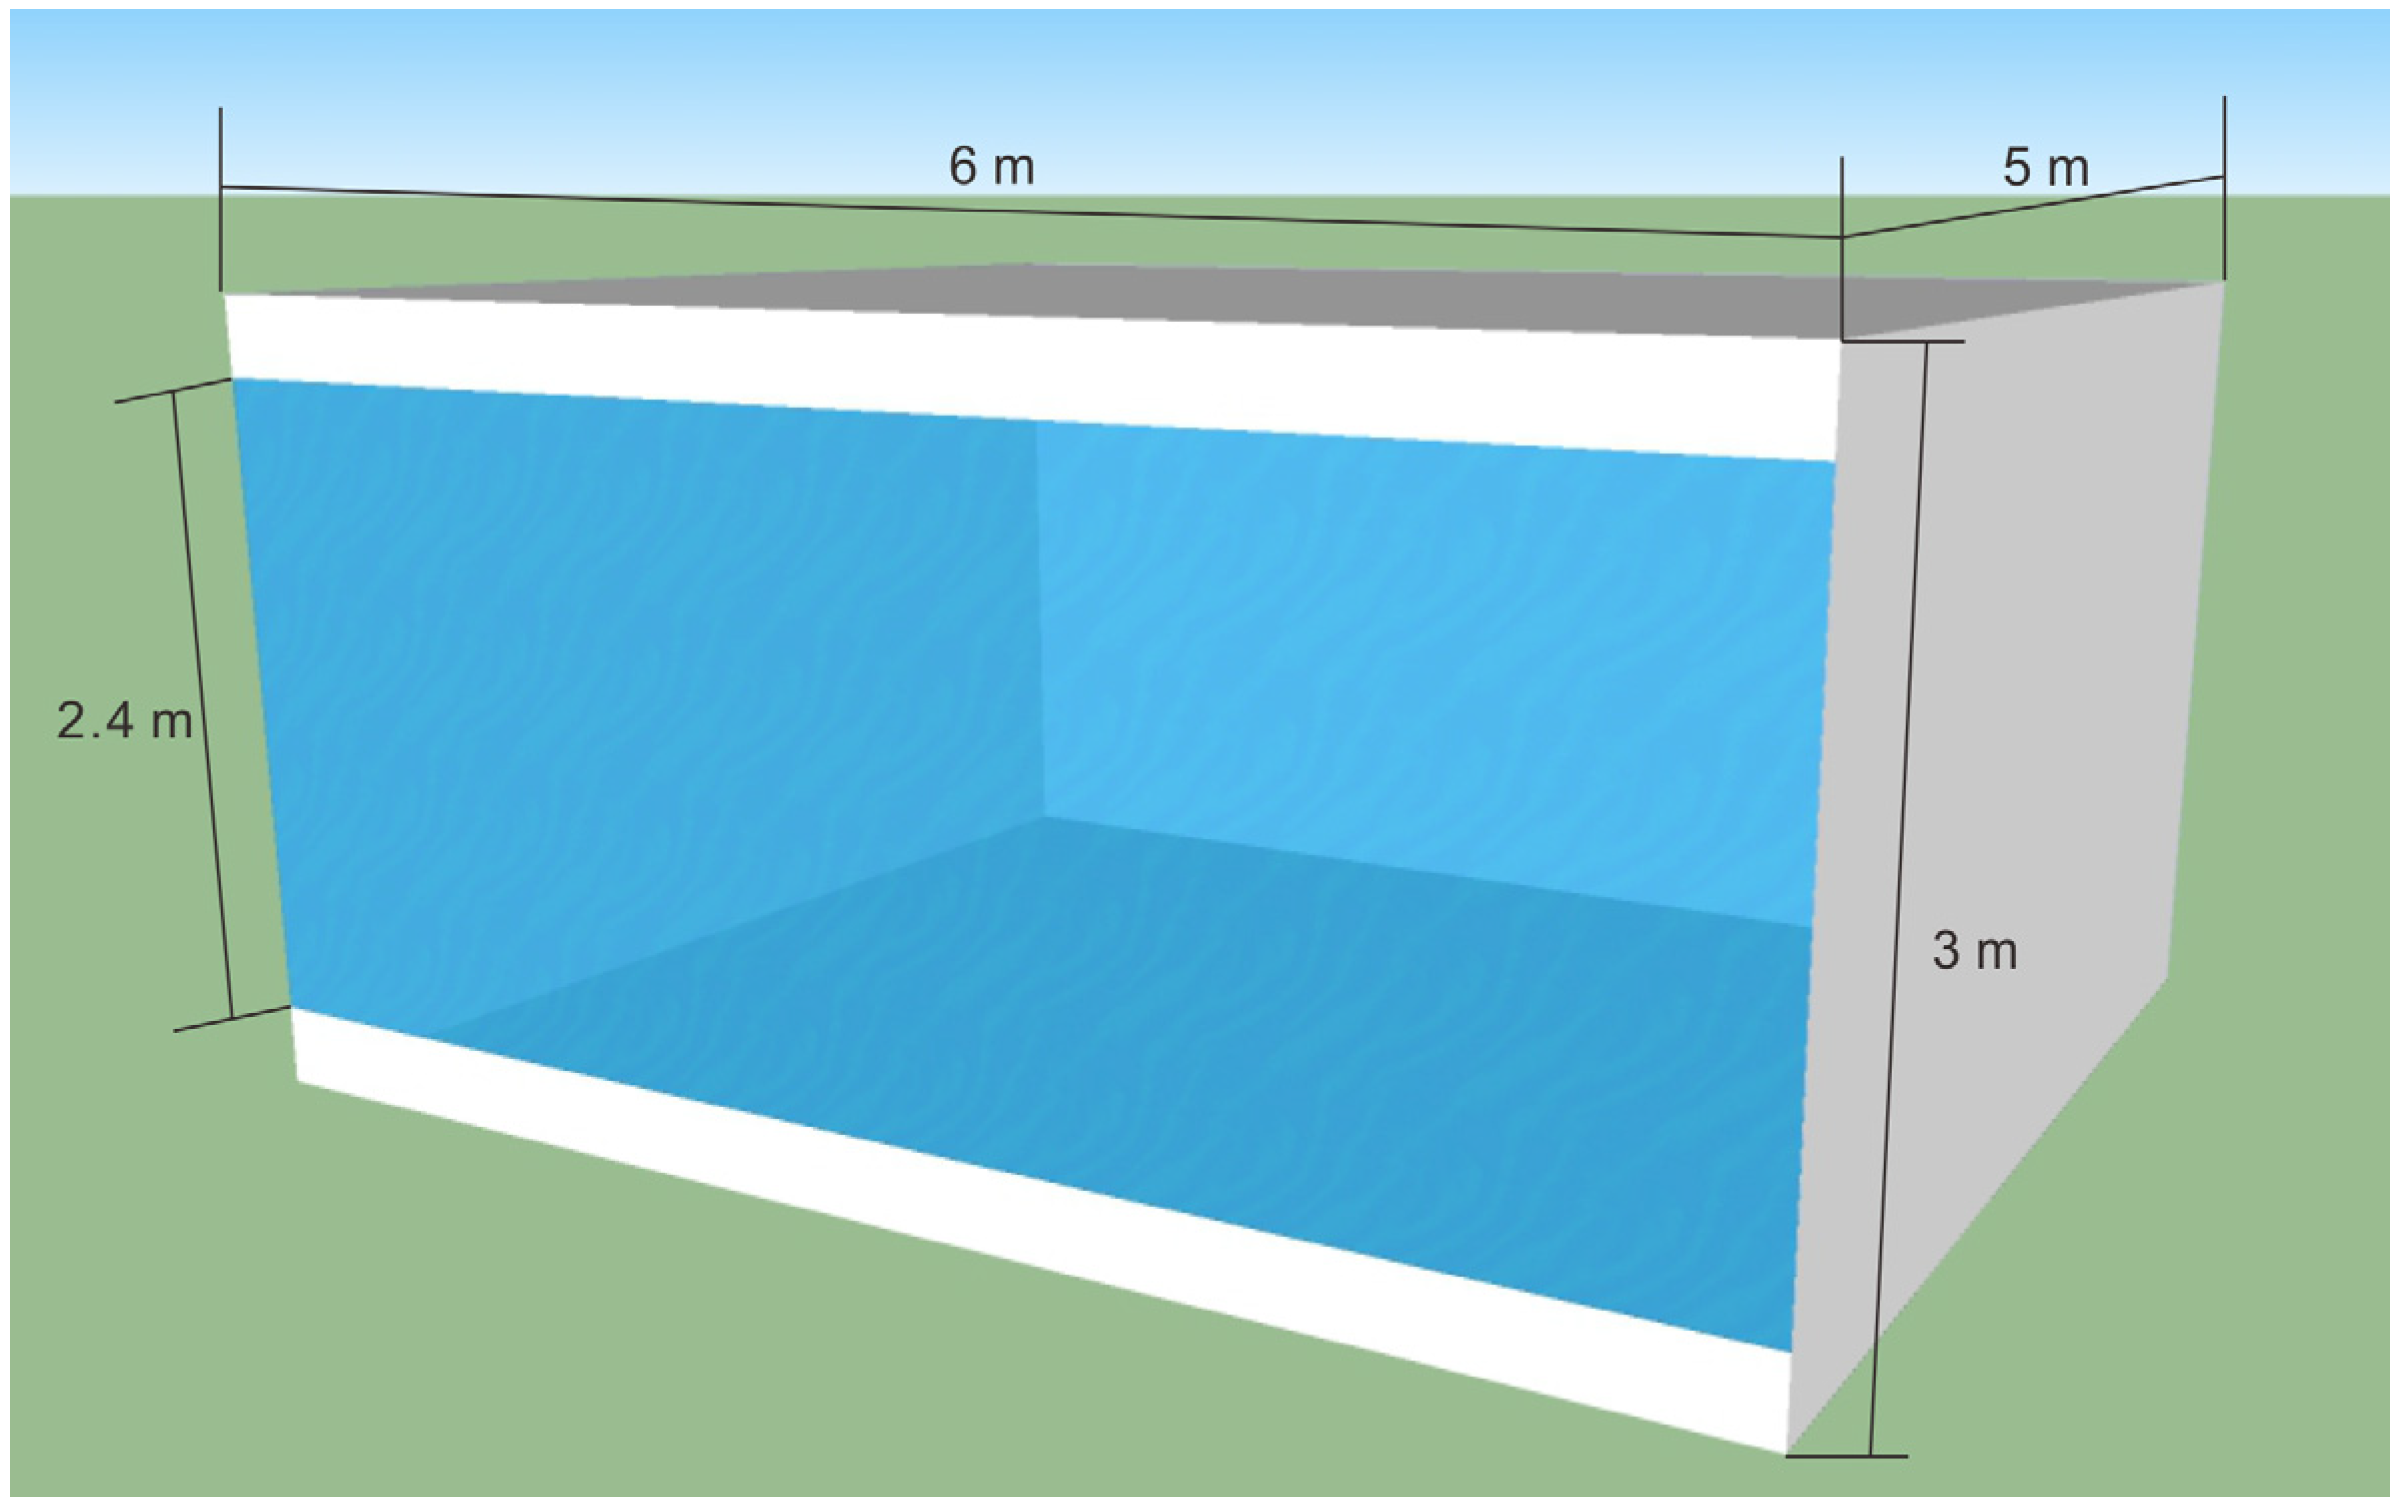
4.2. Description of the Design of a Typical Office Simulation Model

| Item | Description |
|---|---|
| Space geometry | Width = 6.0 m; Depth = 5.0 m; Ceiling height = 3.0 m; with one 6.0 m exterior exposed wall |
| Exterior wall construction | Construction from outside layer to inside layer: 30 mm marble, 30 mm mortar, 150 mm reinforced concrete, 10 mm cement fiber board; equivalent to U-value = 2.76 W/(m2K) |
| Windows | Window-to-wall ratio = 80%; Window width = 6.0 m; Window height = 2.4 m |
| Window glass | 6 mm Clear glass; U-value = 5.78 W/(m2K); SHGC 1 = 0.82 |
| Blinds | Thickness = 0.25 mm; Blind slat width = 300 mm; Slat separation distance = 300 mm; Conductivity = 211 W/(mK); Slat surface reflectance = 0.7 |
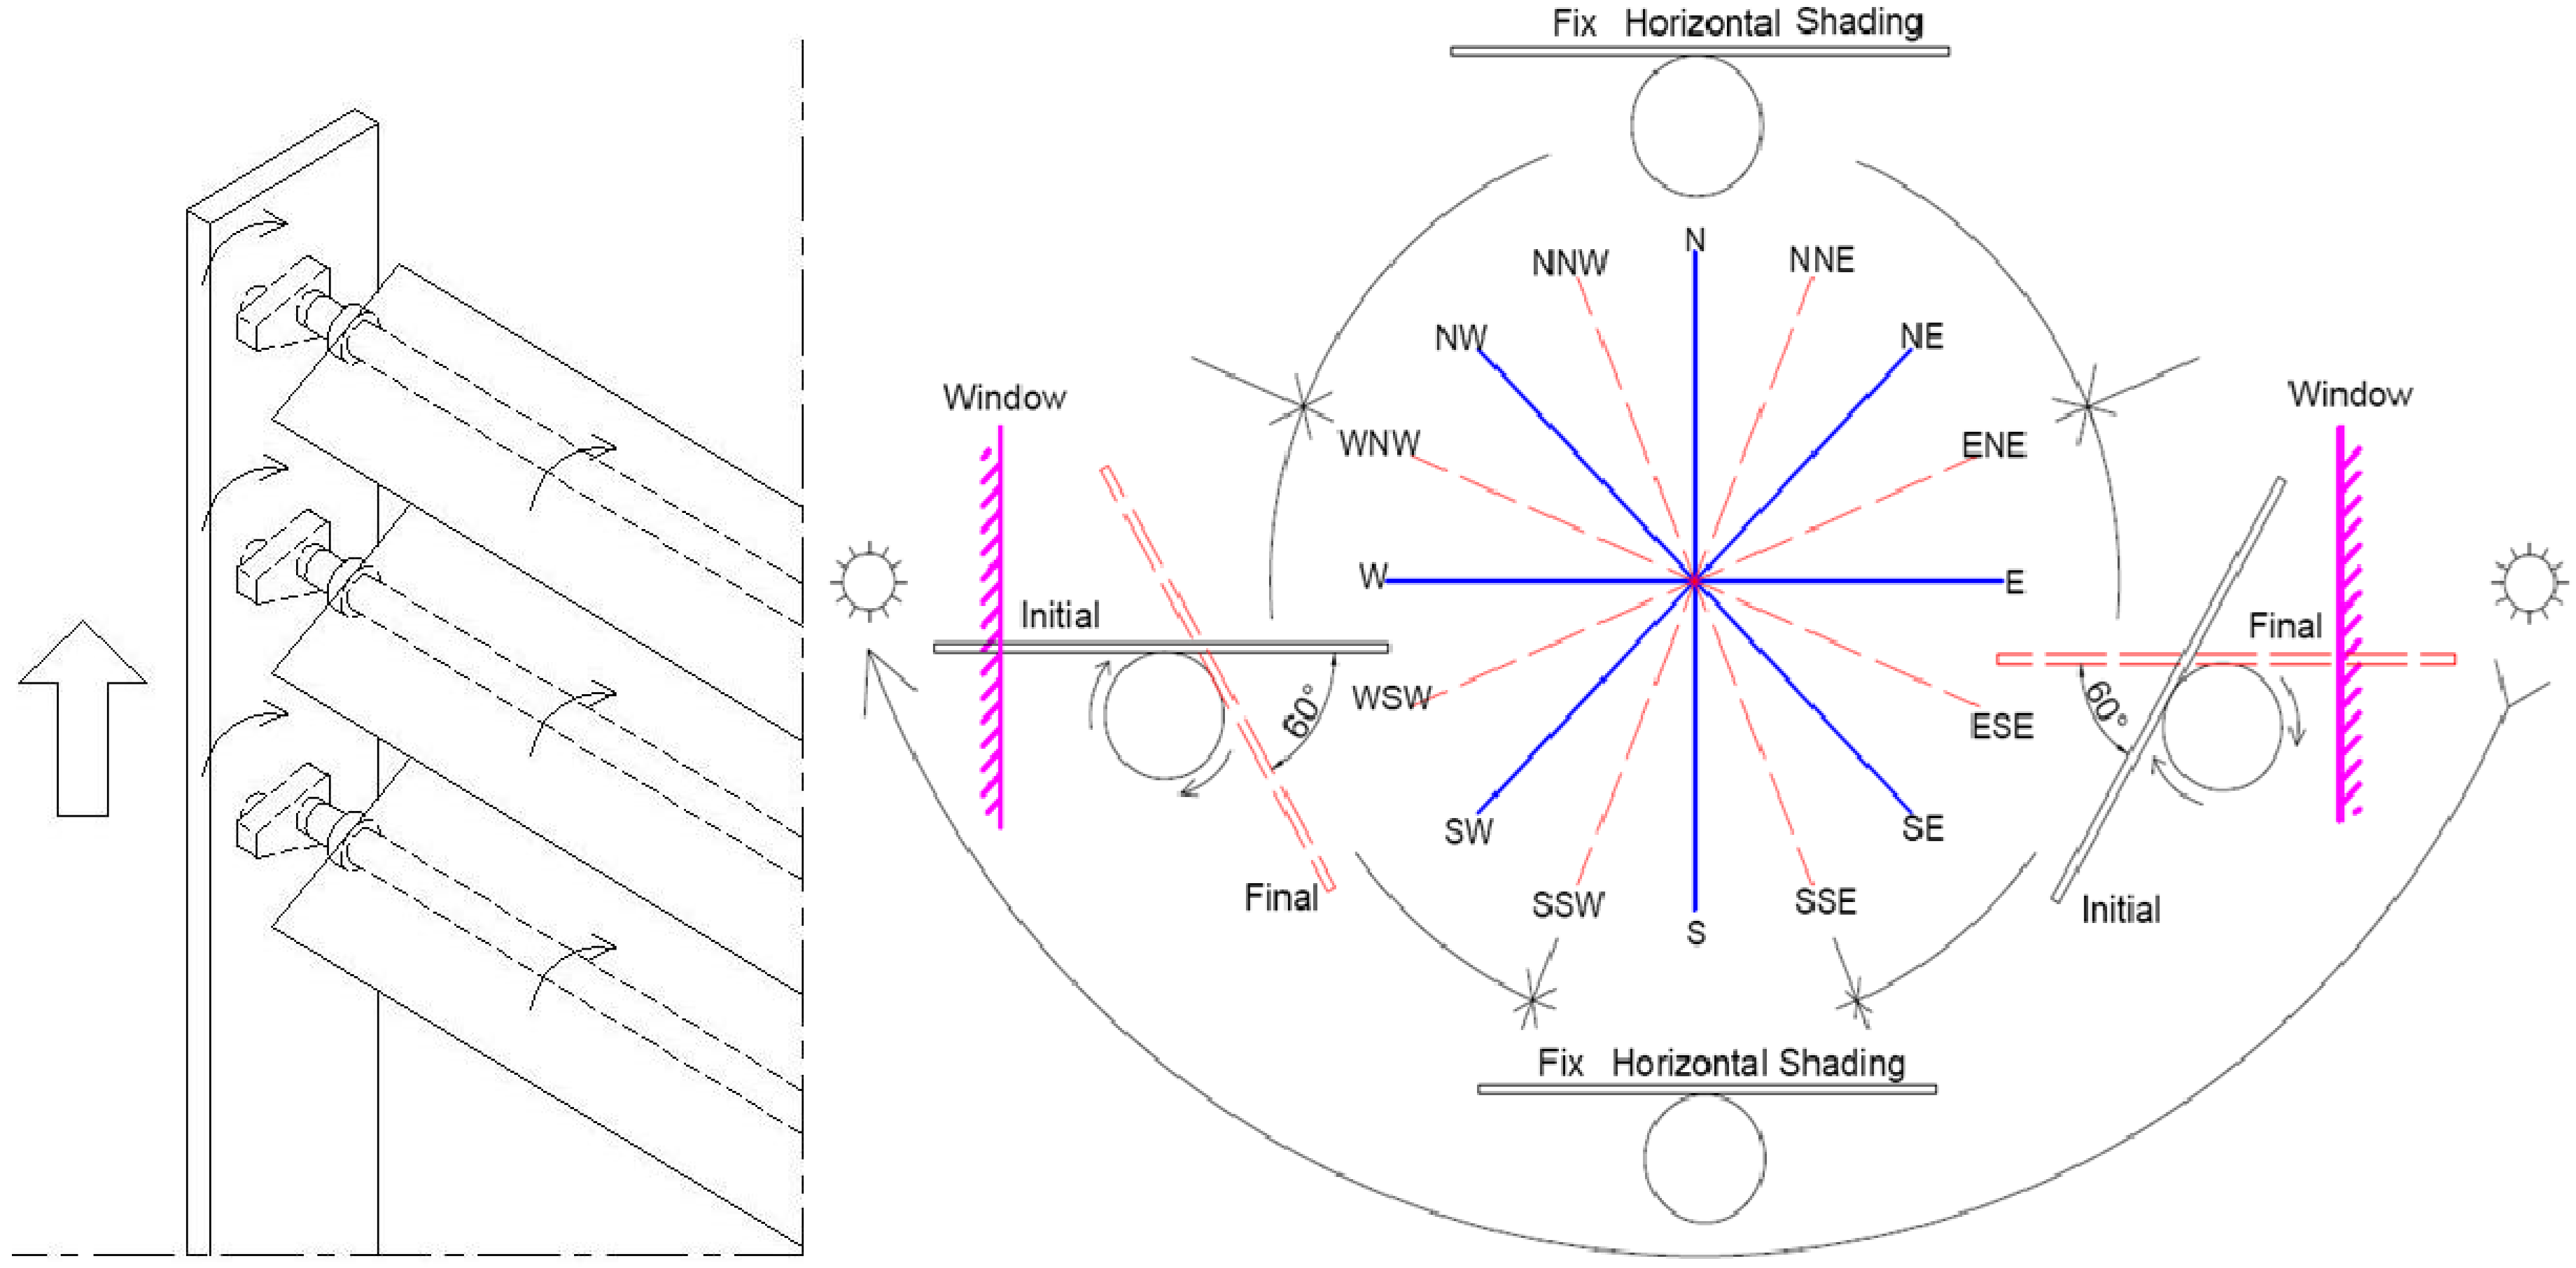
| Blind rotation mechanism | East: 0° (horizontal) to 60° from 06:00 to 12:00 and is fixed at 0° for the other hours. West: 0° (horizontal) to 60° from 12:00 to 18:00 and is fixed at 0° for the other hours. North and South: All day fixed at 0°. |
| Internal heat gain | Occupancy density = 0.2 person/m2; Lighting density = 15W/m2; Appliances power density = 10 W/m2; Weekday’s occupied hours = 08:00–17:00 |
| HVAC system | VAV system with chiller capacity of 3.93 kW, Nominal COP = 6.5; Economizer = none; Cooling setpoint = 24 °C (winter) & 28 °C (summer); Outside air flow rate = 9.4 L/s per person; Cooling hours: 08:00–17:00 |
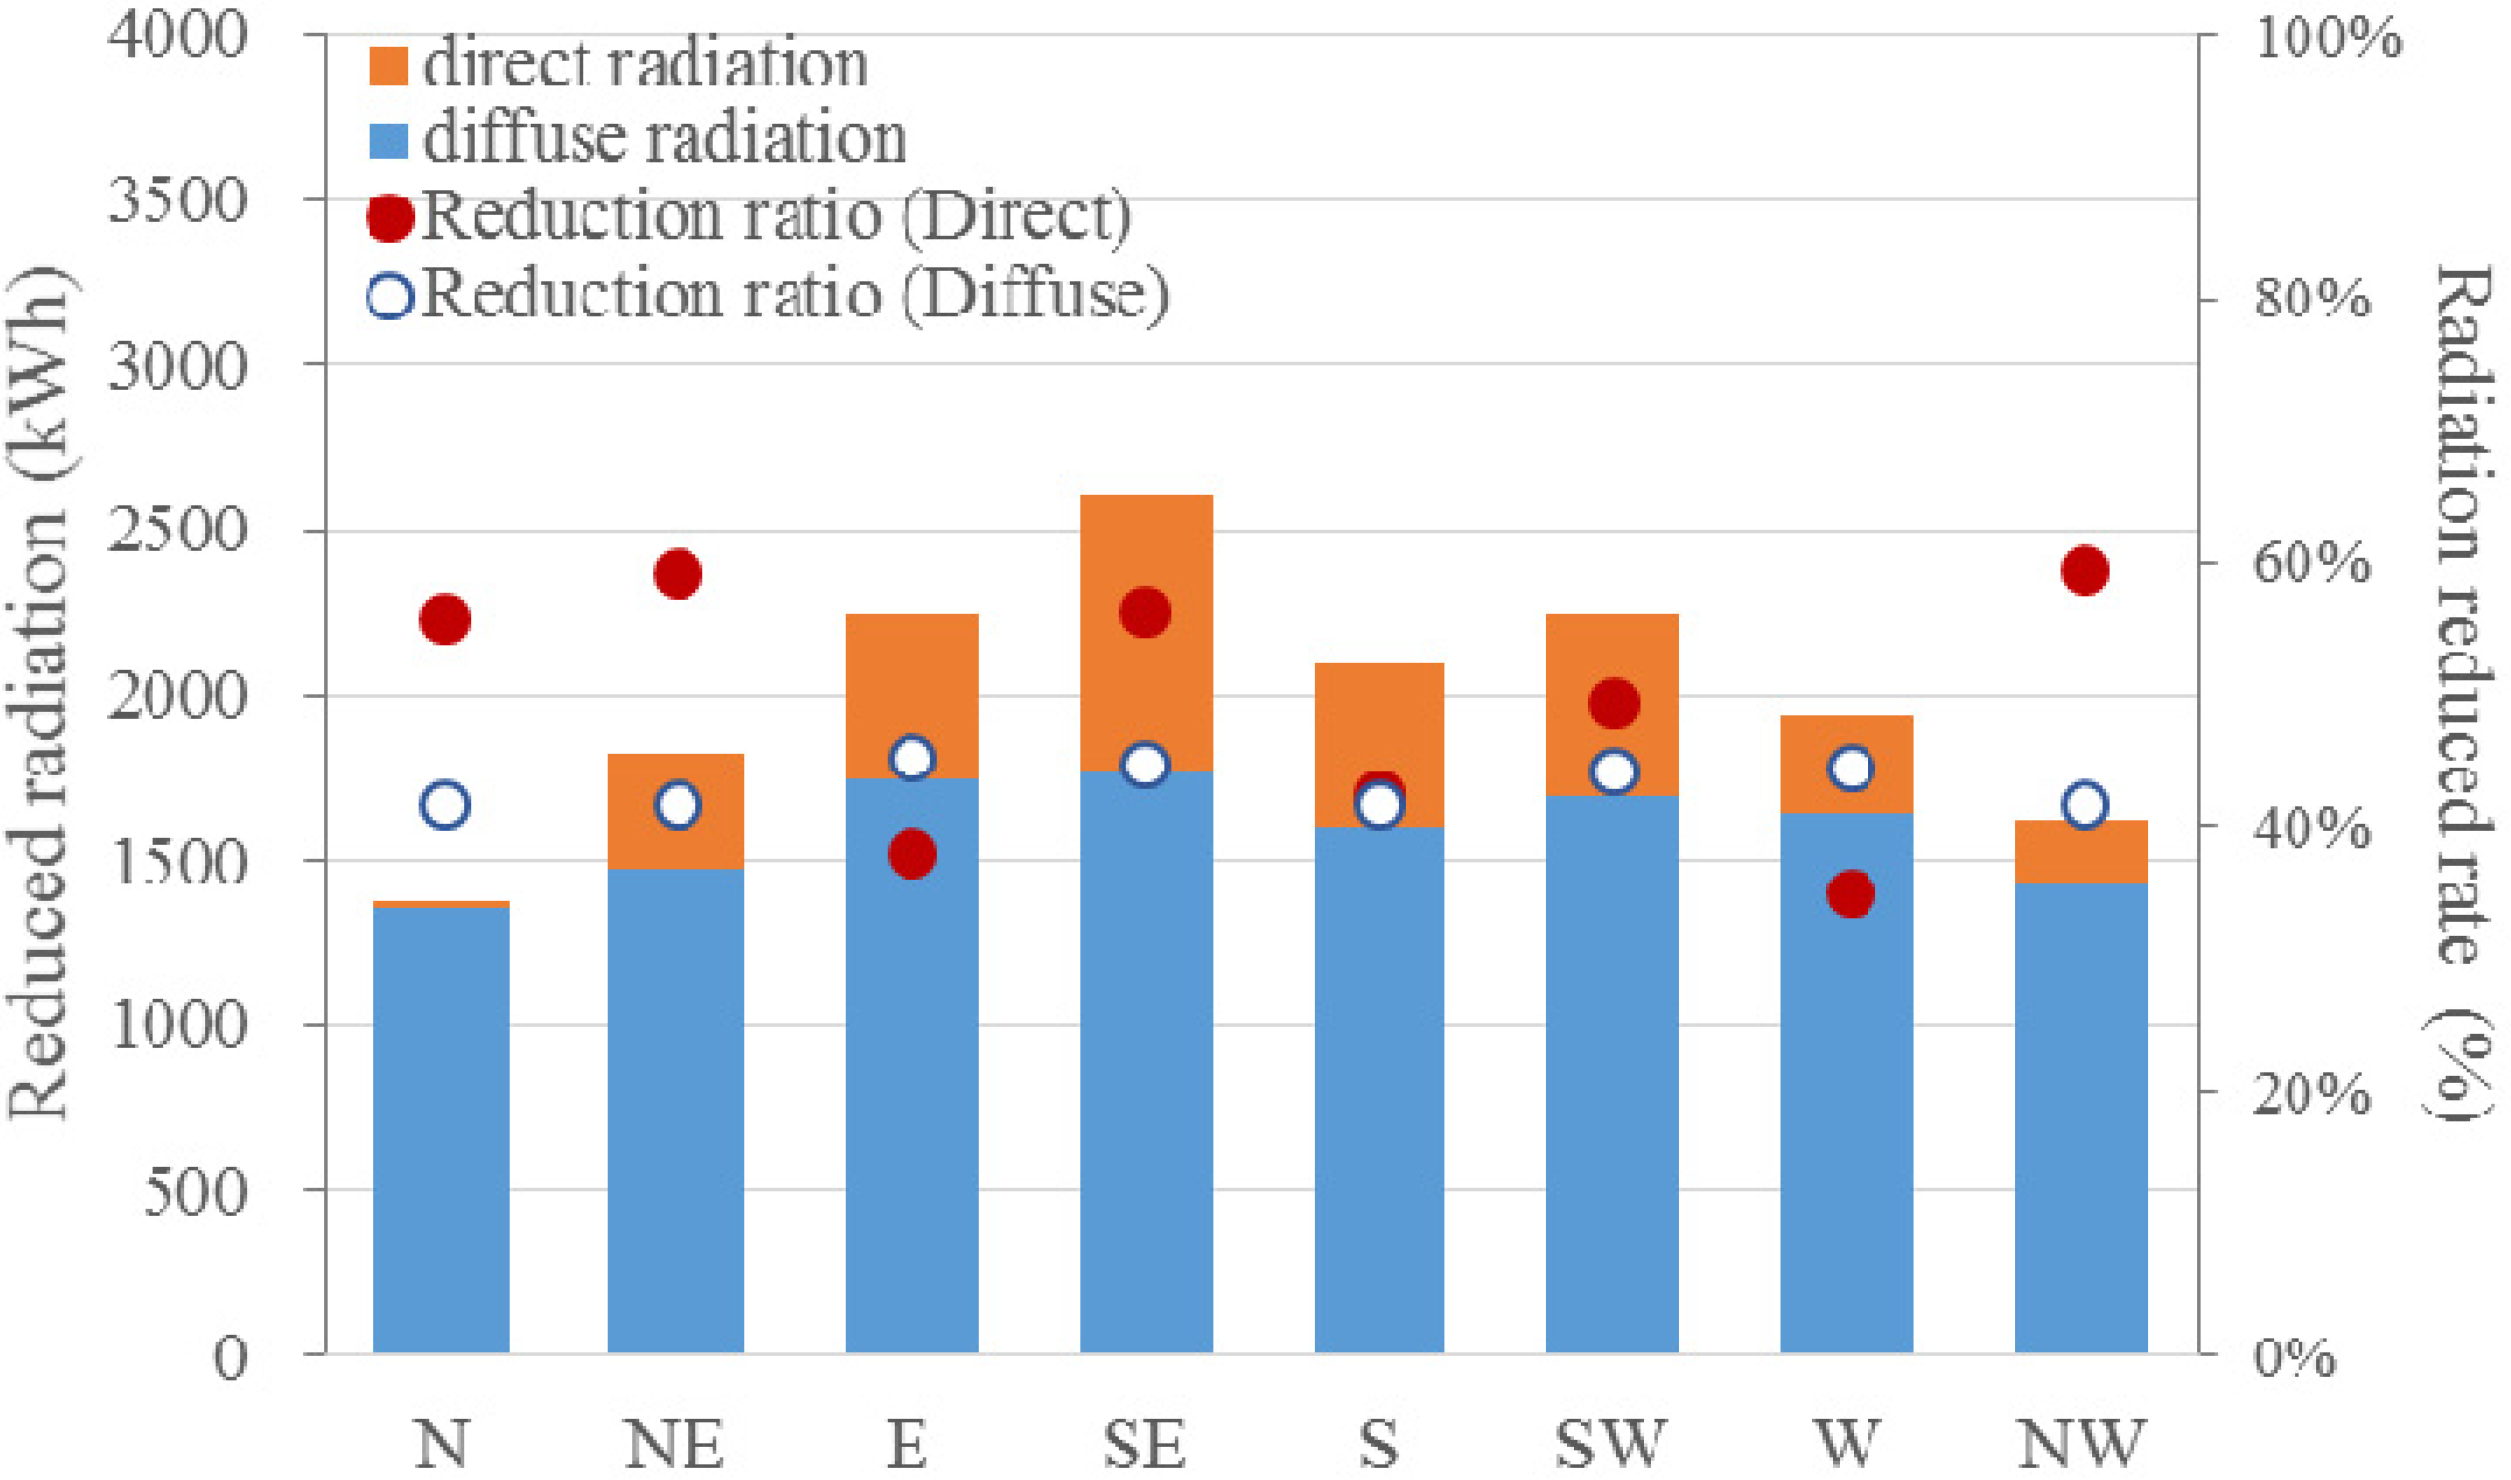
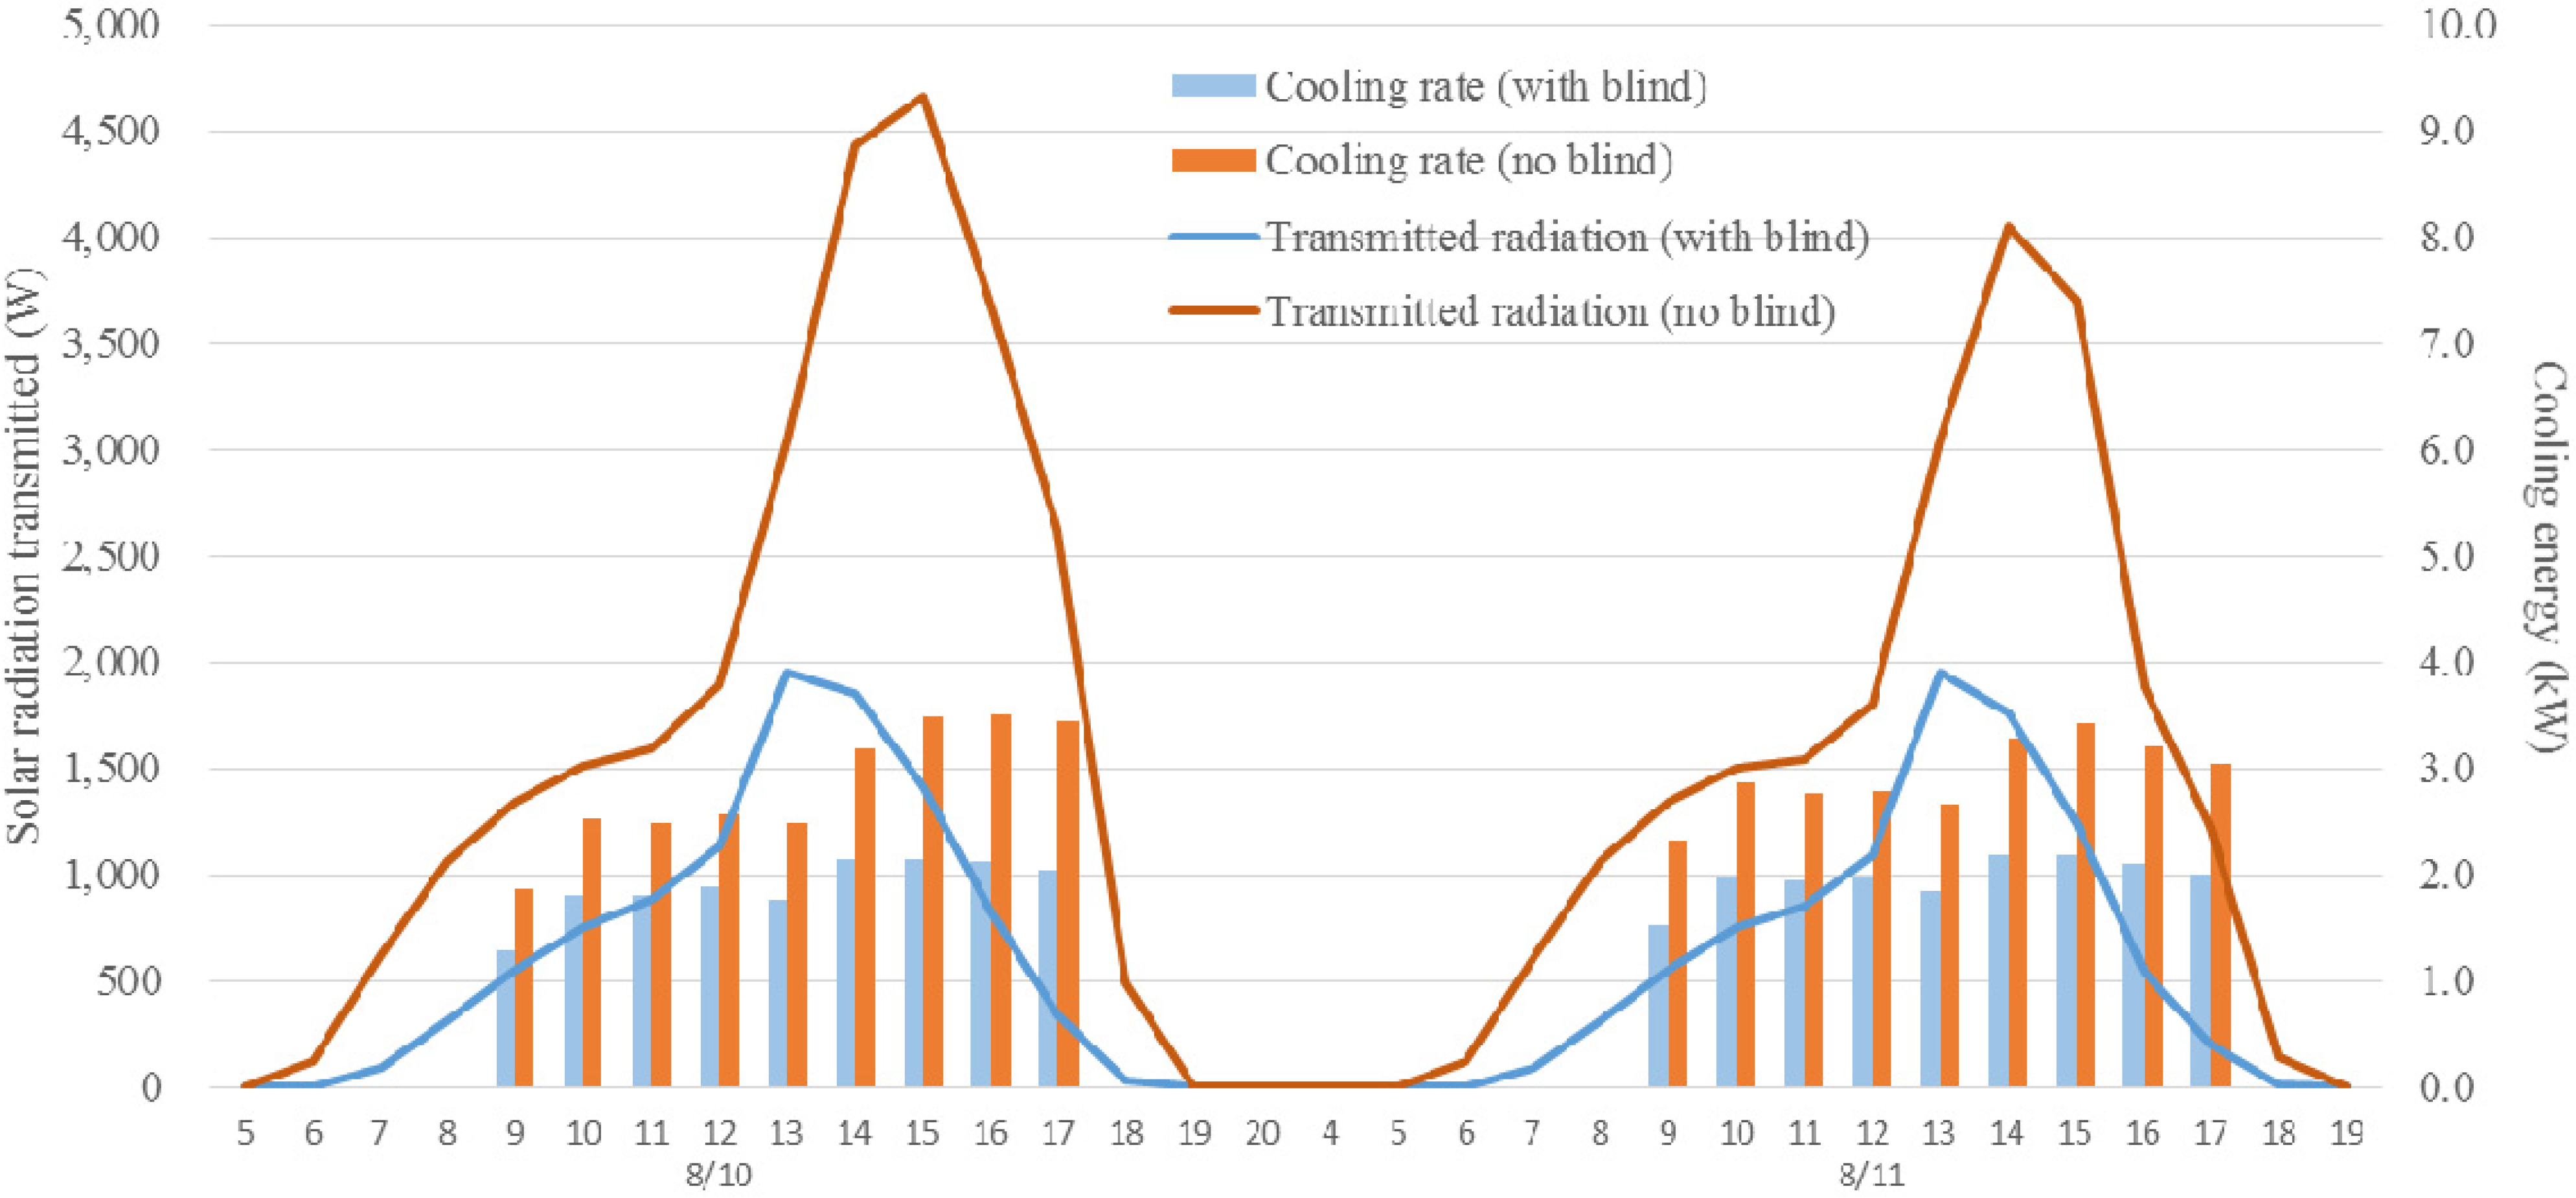
4.3. Impact on Energy Performance Results

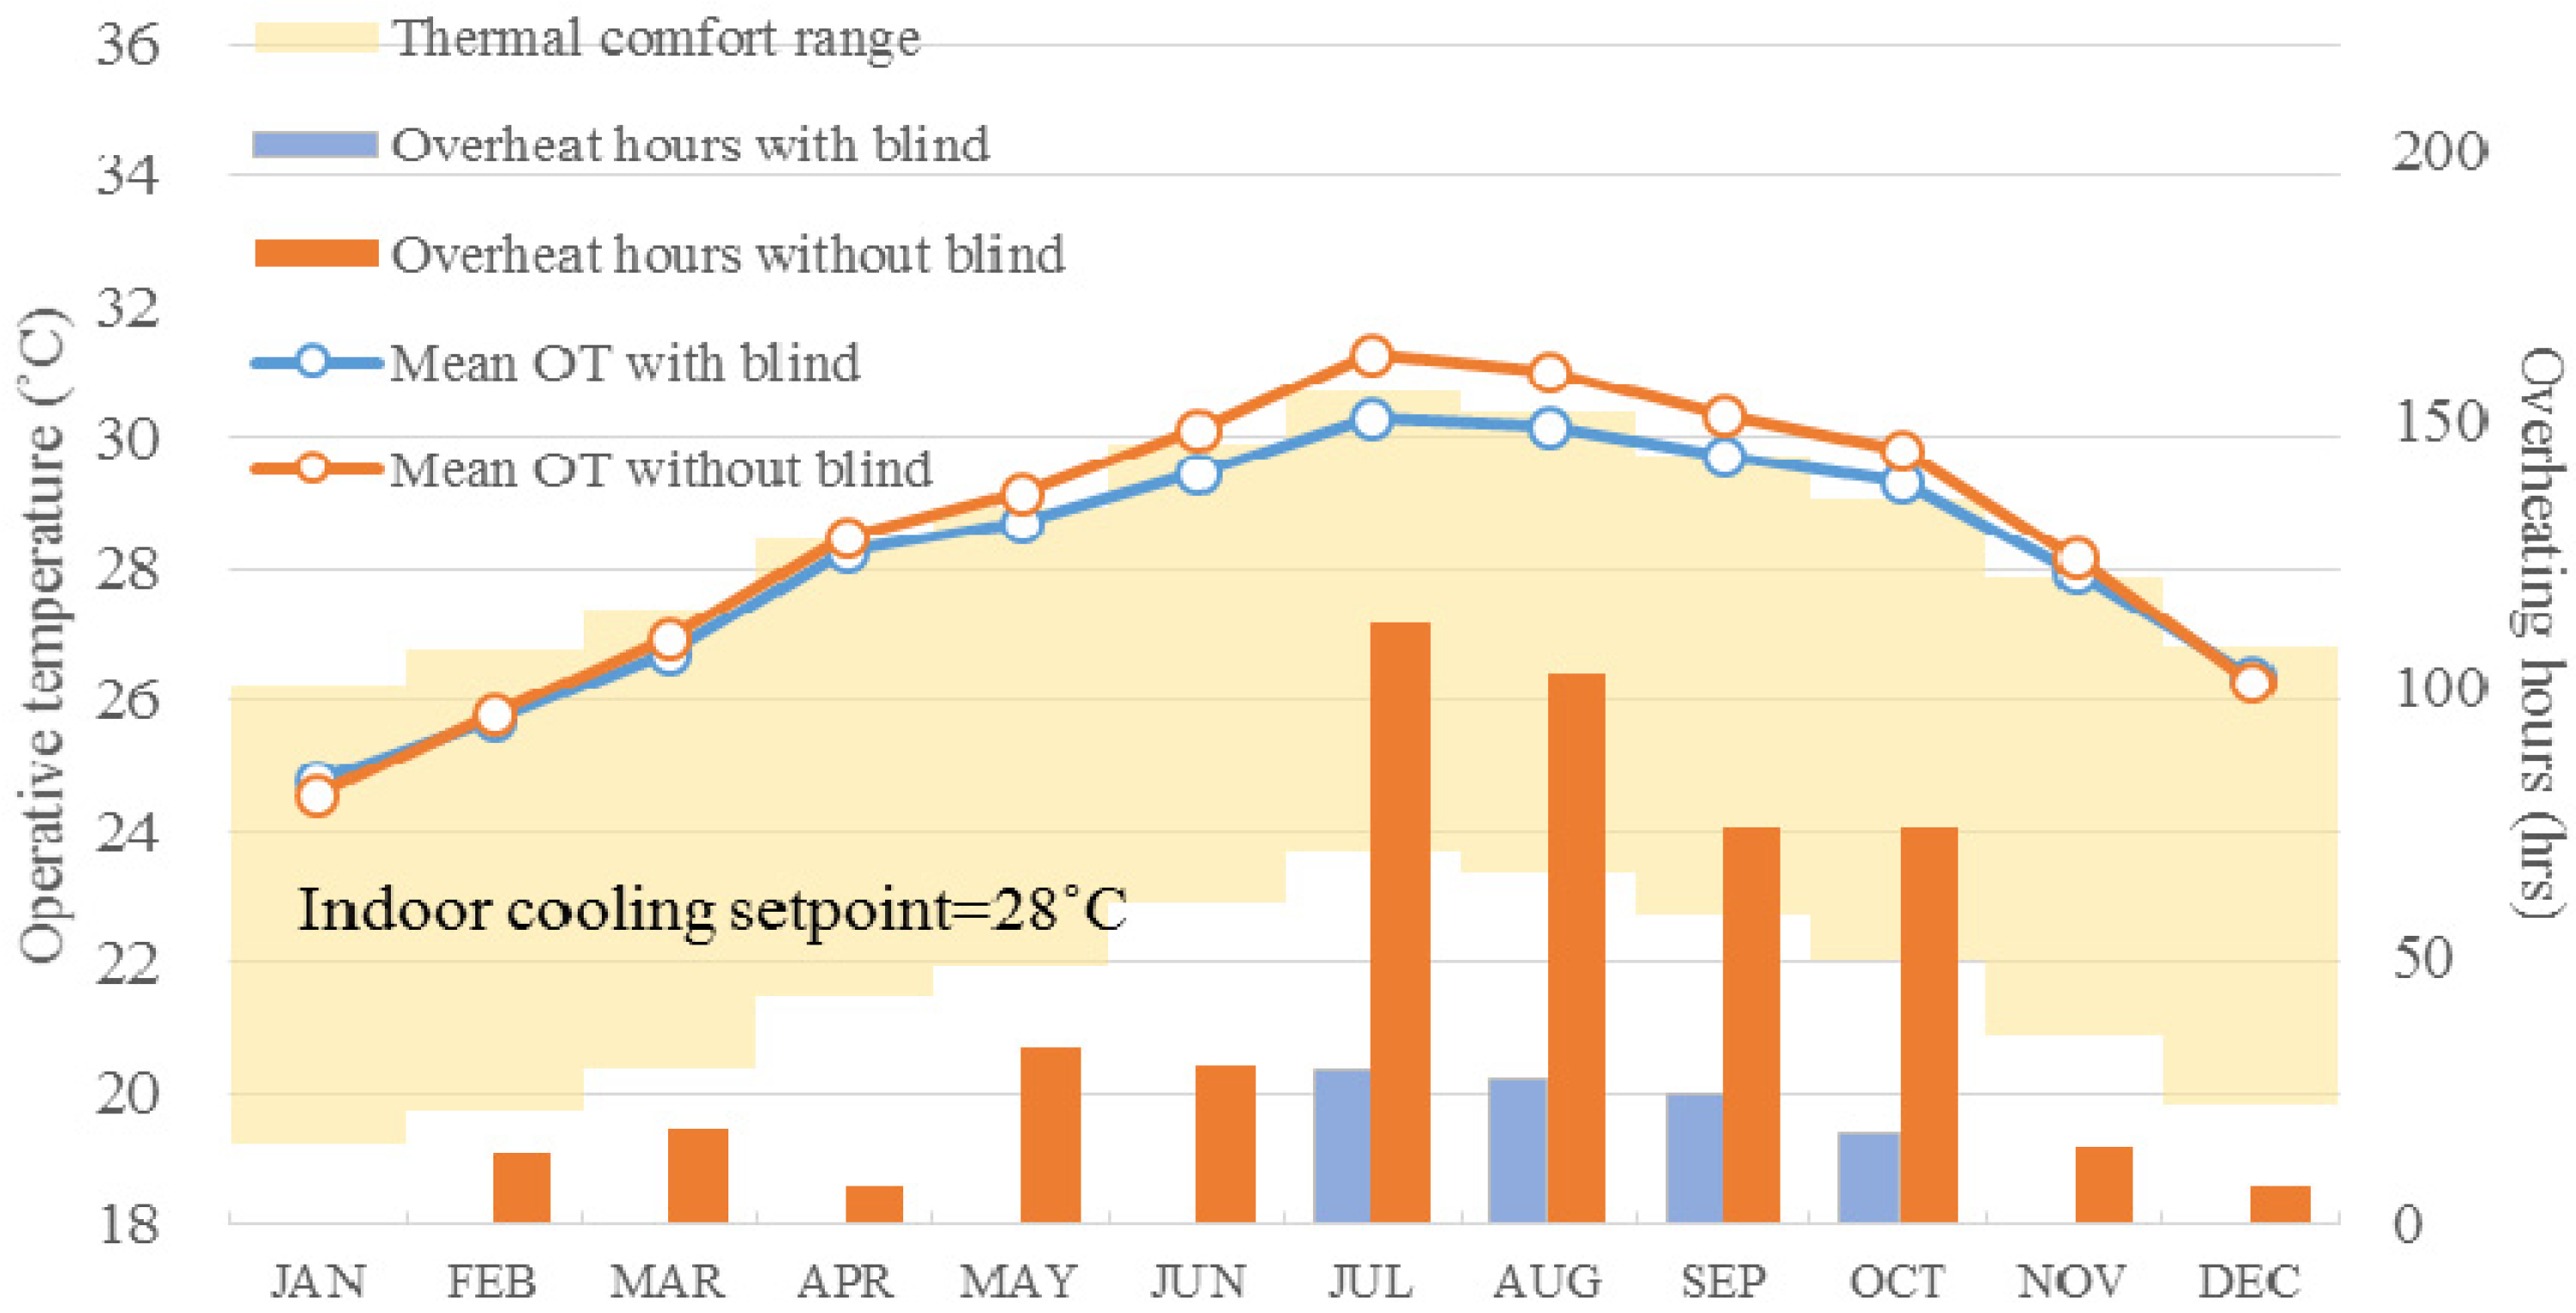
4.4. Impact on Indoor Thermal Comfort Results

4.5. Effectiveness of the Blind System with Various Thermal Properties of Glazing
| Location | Comparison Items | Reduction Ratio of the Proposed Blind As Compared to the Case Without Blind | Reduction Ratio of the Proposed Blind As Compared to Traditional Fixed Blind | |
|---|---|---|---|---|
| Taipei *1 | Overheating | frequency, ξ (h) | 24.5% | 5.7% |
| severity, I (K·h) | 31.1% | 7.5% | ||
| Overcooling | frequency, ξ (h) | 55.3% *3 | 10.5% *3 | |
| severity, I (K·h) | 53.1% *3 | 9.6% *3 | ||
| Sensible cooling energy (kWh) | 27.9% | 5.8% | ||
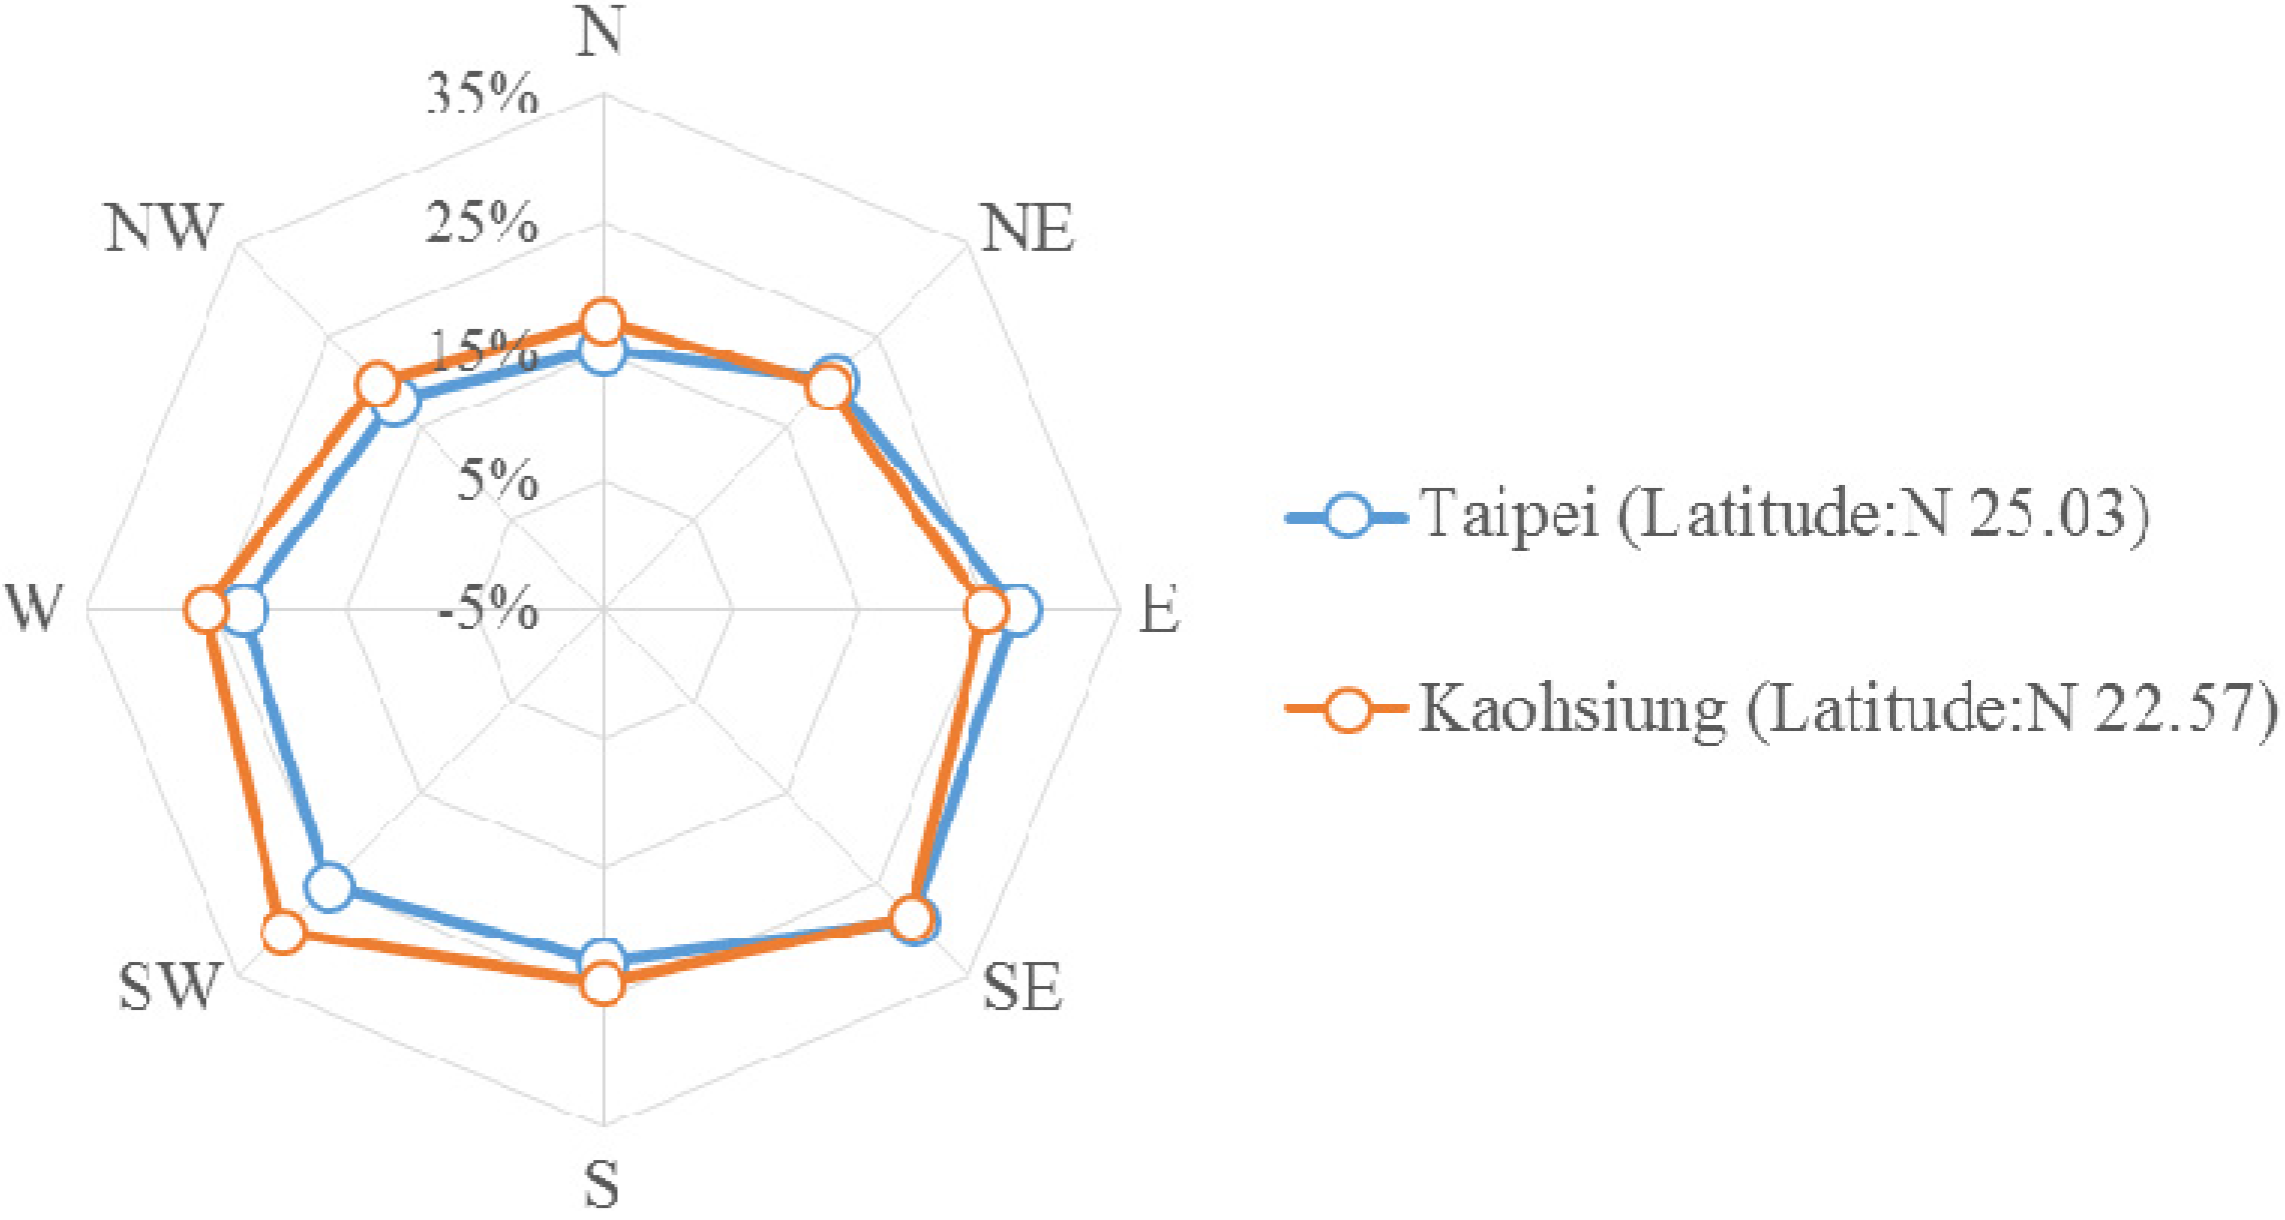
| Orientation sensitivity order for energy saving | SE > E > SW > W > S > NE > NW > N | |||
| Kaohsiung *2 | Overheating | frequency, ξ (h) | 11.9% | 3.5% |
| severity, I (K·h) | 25.4% | 7.9% | ||
| Overcooling | frequency, ξ (h) | N/A *4 | N/A *4 | |
| severity, I (K·h) | N/A *4 | N/A *4 | ||
| Sensible cooling energy (kWh) | 32.8% | 8.2% | ||
| Orientation sensitivity order for energy saving | SW > SE > W > E > S > NW > NE > N | |||
| SHGC | U-Value | |||||
|---|---|---|---|---|---|---|
| 5.78 (W/m2) | 4.4 (W/m2) | |||||
| Overheating Frequency | Overheating Severity | Cooling Energy | Overheating Frequency | Overheating Severity | Cooling Energy | |
| 0.82 | 24.5% (−) | 31.1% (−) | 27.9% (−) | 21.6% (−2.9%) | 29.6% (−1.5%) | 29.4% (+1.5%) |
| 0.5 | 22.6% (−1.9%) | 27.6% (−3.5%) | 20.8% (−7.1%) | 24.6% (+0.1%) | 30.0% (−1.1%) | 23.1% (−4.8%) |
4.6. Daylighting Performance Analysis
| Orientation | UDI100-2000 lux | DGI > 24 | ||||
|---|---|---|---|---|---|---|
| No Blind | Fixed Blind | Proposed Blind | No Blind | Fixed Blind | Proposed Blind | |
| N | 67.8% | 80.9% | 80.9% | 53.3% | 0.0% | 0.0% |
| E | 61.2% | 77.9% | 77.9% | 58.9% | 19.9% | 19.6% |
| S | 53.0% | 76.7% | 76.7% | 59.3% | 8.3% | 8.3% |
| W | 55.7% | 76.9% | 77.1% | 56.3% | 11.0% | 10.5% |
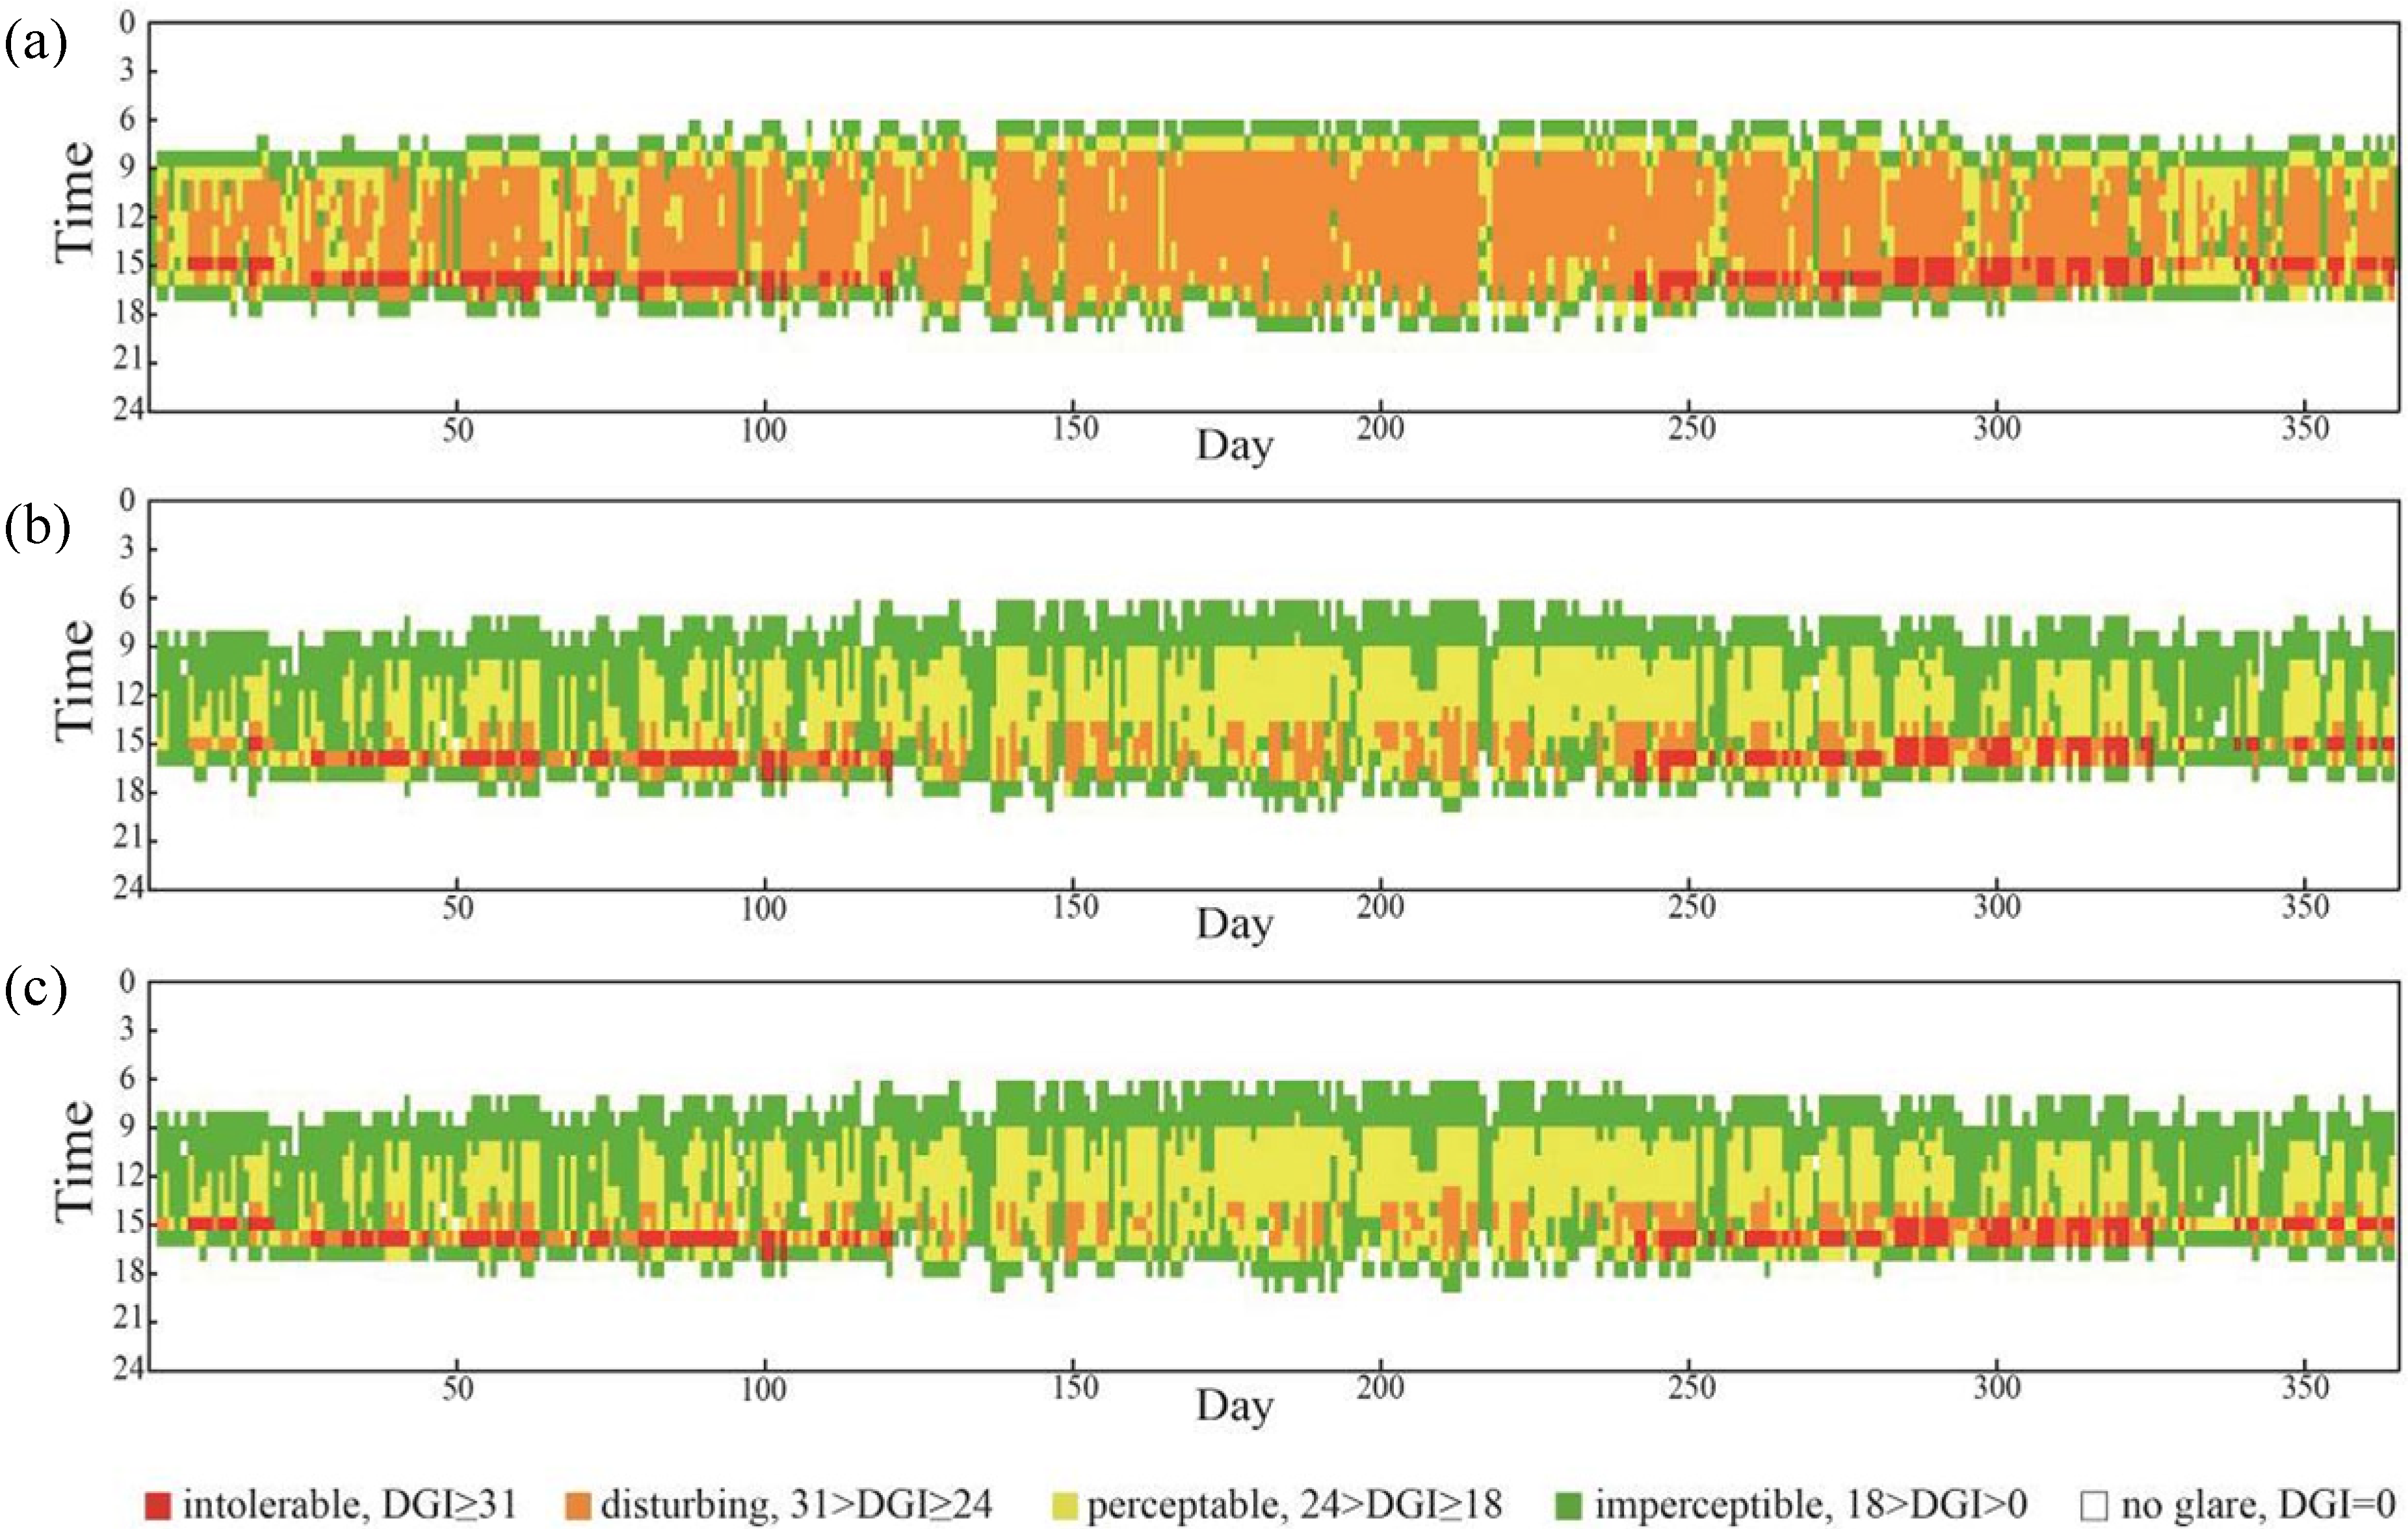
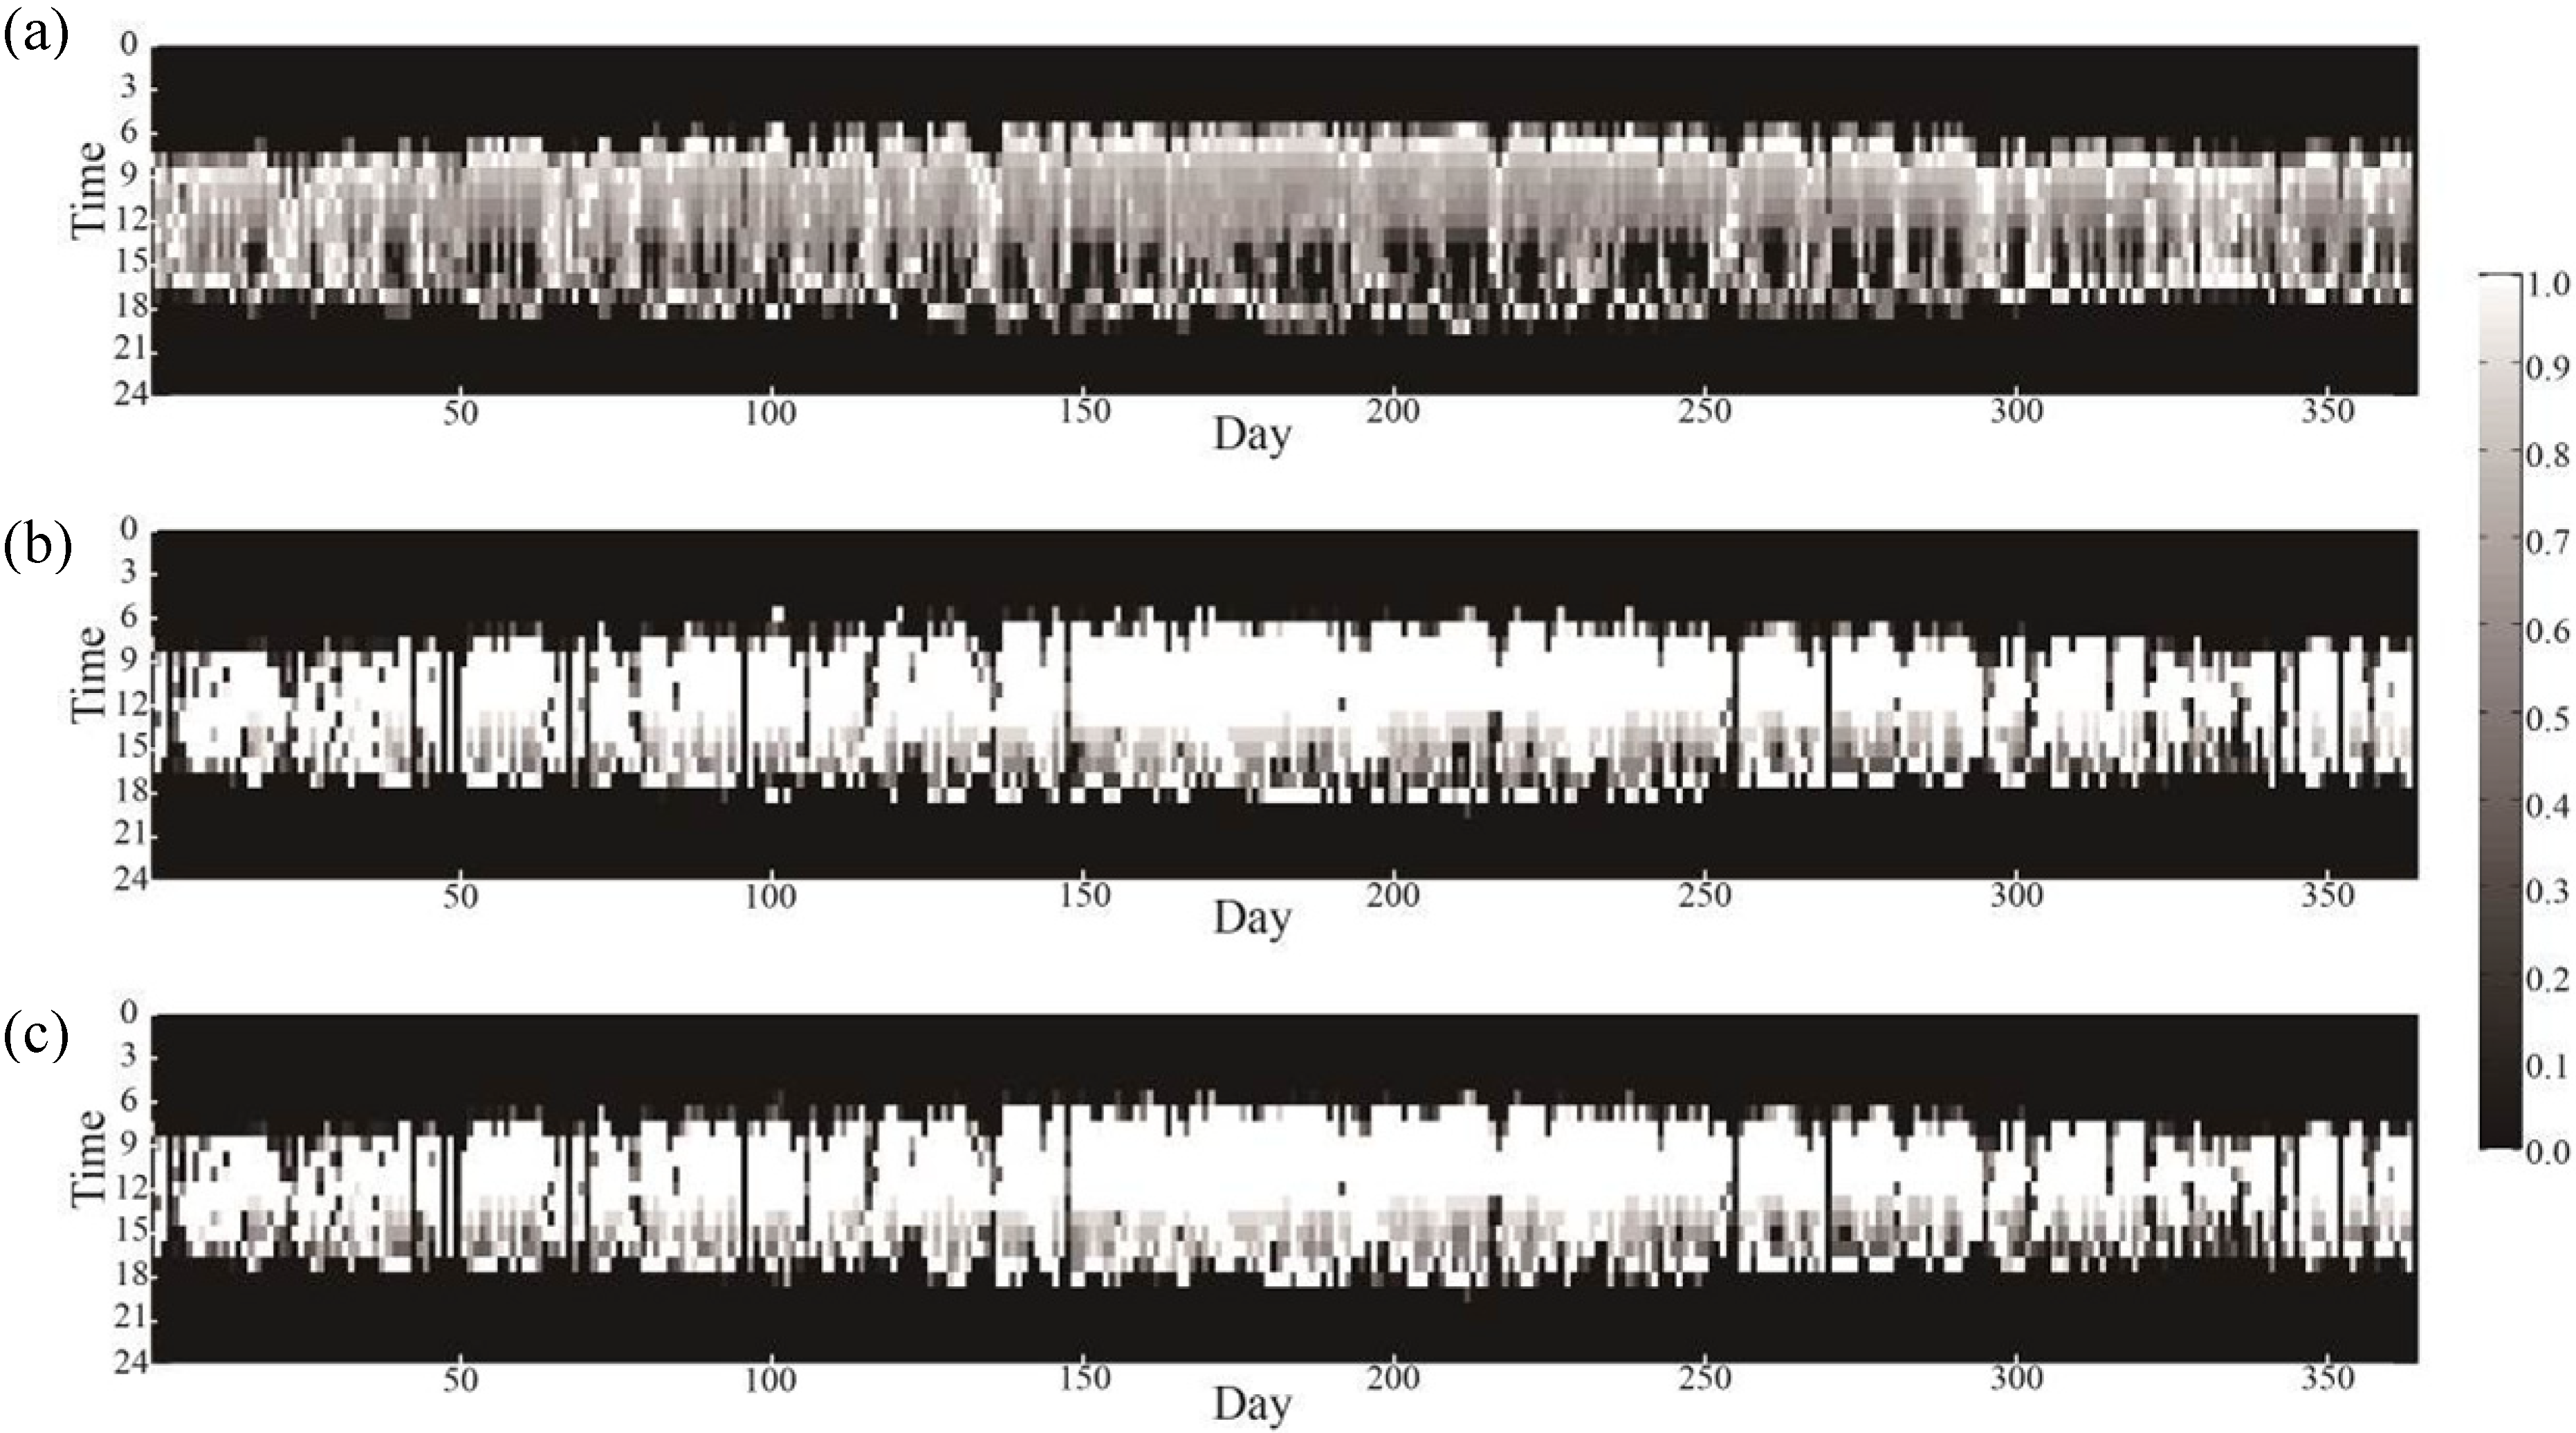
- Daylight glare index (DGI) was adopted to analyze the glare problem to address the visual comfort issue. The calculation of DGI is as Equation (6). Jakubiec and Reinhart suggested four levels of the degree of perceived glare and considered it intolerable when DGI > 31 and imperceptible when DGI < 18 [35]. Figure 15 illustrates the annual temporal distribution of the DGI categorized according to the four levels of a west facing space. From Figure 15 and Table 5, the blind system, either fixed or the proposed one, are capable of efficiently alleviating the glare problem and enhancing the visual comfort, regardless of orientation.where Lb is background luminance (cd/m2); Ls,i is the luminance of the glare source i (cd/m2); ωs,i is the solid angle of source i (sr).

5. Conclusions
- (1)
- In this paper the design considerations, design concept, and detailed design of the automatic buoyancy-shading device for building applications was presented. The choice of materials for the design creates the extra function, as discussed in above sections. The automatic shading device is unique in its driving and control mechanisms, it can be easily used and set up on typical windows in Taiwan.
- (2)
- Controllers for the panel positioning are often very complex and confusing. However, our design seems to satisfy user preferences and is convenient to use.
- (3)
- It is possible to improve user expectations and replace conventional shading devices with simplified and effective designs.
- (4)
- The effectiveness of the blind system was evaluated with regard to the improvement of indoor thermal comfort and the cooling energy saving. The results revealed that there was a 24.5% and 11.9% reduction in the occurrence of overheating when using the automated blind for the SW case in Taipei and Kaohsiung, respectively. The overheating severity alleviated by the blinds could also reach 31.1% and 25.4%, suggesting that blinds are a promising method for improving indoor thermal comfort.
- (5)
- The cooling energy saving potential was 27.9% and 32.8% for Taipei and Kaohsiung, respectively. This reveals that in a centrally air-conditioned space, there is efficient energy saving potential.
- (6)
- The cooling energy saving effectiveness of the blind system would decrease with the improvement of glazing’s solar radiation blocking ability (i.e., SHGC), but would increase with the improved glazing insulation property (i.e., U-value).
- (7)
- The proposed blind system is capable of both improving the usage of daylighting and also reducing the glare problem.
Acknowledgments
Author Contributions
Conflicts of Interest
References
- Chen, H.J.; Wang, D.W.P.; Chen, S.L. Optimization of an ice-storage air conditioning system using dynamic programming method. Appl. Therm. Eng. 2005, 25, 461–472. [Google Scholar] [CrossRef]
- Yang, K.H.; Hwang, R.L. Energy conservation of building in Taiwan. Pattern Recogn. 1995, 28, 1483–1491. [Google Scholar] [CrossRef]
- Kim, G.; Lim, H.S.; Lim, T.S.; Schaefer, L.; Kim, J.T. Comparative advantage of an exterior shading device in thermal performance for residential buildings. Energy Build. 2012, 46, 105–111. [Google Scholar] [CrossRef]
- Adriaenssens, S.; Rhode-Barbarigos, L.; Kilian, A.; Baverel, O.; Charpentier, V.; Horner, M.; Buzatu, D. Dialectic form finding of passive and adaptive shading enclosures. Energies 2014, 7, 5201–5220. [Google Scholar] [CrossRef]
- Yener, A.K. A method of obtaining visual comfort using fixed shading devices in rooms. Build. Environ. 1998, 34, 285–291. [Google Scholar] [CrossRef]
- Carbonari, A.; Rossi, G.; Romagnoni, P. Optimal orientation and automatic control of external shading devices in office buildings. Environ. Manag. Health 2002, 13, 392–404. [Google Scholar] [CrossRef]
- Datta, G. Effect of fixed horizontal louver shading devices on thermal perfomance of building by TRNSYS simulation. Renew. Energ. 2001, 23, 497–507. [Google Scholar] [CrossRef]
- Manzan, M.; Padovan, R.; Clarich, A.; Rizzian, L. Energy and daylighting optimization for an office with fixed and moveable shading devices. In Proceedings of the 2014 Building Simulation and Optimization Conference, London, UK, 23–24 June 2014.
- Hammad, F.; Abu-Hijleh, B. The energy savings potential of using dynamic external louvers in an office building. Energy Build. 2010, 42, 1888–1895. [Google Scholar] [CrossRef]
- Nielsen, M.V.; Svendsen, S.; Jensen, L.B. Quantifying the potential of automated dynamic solar shading in office buildings through integrated simulations of energy and daylight. Solar Energy 2011, 85, 757–768. [Google Scholar] [CrossRef]
- Atzeri, A.; Cappelletti, F.; Gasparella, A. Internal versus external shading devices performance in office buildings. Energy Procedia 2014, 45, 463–472. [Google Scholar] [CrossRef]
- Guillemin, A.; Molteni, S. An energy-efficient controller for shading devices self-adapting to the user wishes. Build. Environ. 2002, 37, 1091–1097. [Google Scholar] [CrossRef]
- Gugliermetti, F.; Bisegna, F. Daylighting with external shading devices: Design and simulation algorithms. Build. Environ. 2006, 41, 136–149. [Google Scholar] [CrossRef]
- Manzan, M. Genetic optimization of external fixed shading devices. Energy Build. 2014, 72, 431–440. [Google Scholar] [CrossRef]
- Tumer, J.S. Buoyancy Effects in Fluids; Cambridge University Press: New York, NY, USA, 1979. [Google Scholar]
- Royden, L.H.; Husson, L. Subduction with variations in slab buoyancy: Models and application to the banda and apennine systems. In Subduction Zone Geodynamics, Frontiers in Earth Sciences; Springer: Berlin, Germany, 2009; pp. 35–45. [Google Scholar]
- Spaeth, M.; Barthlott, W. Lotus-effect (R): Biomimetic super-hydrophobic surfaces and their application. Smart Textiles 2009, 60, 38–46. [Google Scholar]
- Prasad, C.V.; Rao, K.C.; Reddy, G.V.; Rani, T.S.; Yerriswamy, B.; Subha, M.C.S. Characteristic studies of ligno-cellulosic fabric grewia tenax. J. Nat. Fibers 2010, 7, 194–215. [Google Scholar] [CrossRef]
- Cheng, C.L.; Liao, L.M.; Chou, C.P. A study of summarized correlation with shading performance for horizontal shading devices in Taiwan. Sol. Energy 2013, 90, 1–16. [Google Scholar] [CrossRef]
- Pacheco, R.; Ordóñez, J.; Martínez, G. Energy efficient design of building: A review. Renew. Sustain. Energy Rev. 2012, 16, 3559–3573. [Google Scholar] [CrossRef]
- Cho, J.; Yoo, C.; Kim, Y. Viability of exterior shading devices for high-rise residential buildings: Case study for cooling energy saving and economic feasibility analysis. Energy Build. 2014, 82, 771–785. [Google Scholar] [CrossRef]
- Birnbaum, L.; Lieberman, H.; Horvitz, E.; Marks, J.; Kurlander, D.; Roth, S. Compelling intelligent user interfaces—How much AI. In Proceedings of the 1997 International Conference on Intelligent User Interfaces, New York, NY, USA, 6–9 January 1997.
- ANSI/ASHRAE Standard 140. Standard Method of Test for the Evaluation of Building Energy Analysis Computer Programs; American Society of Heating, Refrigerating and Air Conditioning Engineers: Atlanta, GA, USA, 2011. [Google Scholar]
- Henninger, R.H.; Witte, M.J.; Crawley, D.B. Analytical and comparative testing of EnergyPlus using lEA HVAC BESTEST E100-E200 test suite. Energy Build. 2004, 36, 855–863. [Google Scholar] [CrossRef]
- Lawrence Berkeley National Laboratory (LBNL). EnergyPlus Engineering Reference-The Reference for EnergyPlus Calculations; LBNL: Berkeley, LA, USA, 2007. [Google Scholar]
- Carletti, C.; Sciurpi, F.; Pierangioli, L. The energy upgrading of existing buildings: Window and shading device typologies for energy efficiency refurbishment. Sustainability 2014, 6, 5354–5377. [Google Scholar] [CrossRef]
- Shen, E.; Hu, J.; Patel, M. Energy and visual comfort analysis of lighting and daylight control strategies. Build. Environ. 2014, 78, 155–170. [Google Scholar] [CrossRef]
- Kim, D.W.; Park, C.S. Comparative control strategies of exterior and interior blind systems. Lighting Res. Technol. 2012, 44, 291–308. [Google Scholar] [CrossRef]
- Li, D.H.W.; Wong, S.L. Daylighting and energy implications due to shading effects from nearby buildings. Appl. Energy 2007, 84, 1199–1209. [Google Scholar] [CrossRef]
- Mettanant, V.; Chaiwiwatworakul, P. Automated vertical blinds for daylighting in tropical region. Energy Procedia 2014, 52, 278–286. [Google Scholar] [CrossRef]
- Seo, D.; Ihm, P.; Krarti, M. Development of an optimal daylighting controller. Build. Environ. 2011, 46, 1011–1022. [Google Scholar] [CrossRef]
- Kottek, M.; Grieser, J.; Beck, C.; Rudolf, B.; Rubel, F. World Map of the Köppen-Geiger climate classification updated. Meteorol. Z. 2006, 15, 259–263. [Google Scholar] [CrossRef]
- ANSI/ASHRAE Standard 55. Thermal Environmental Conditions for Human Occupancy; American Society of Heating, Refrigerating and Air-Conditioning Engineers: Atlanta, GA, USA, 2010. [Google Scholar]
- ISO Standard 7730. Ergonomics of the thermal environment—Analytical determination and interpretation of thermal comfort using calculation of the PMV and PPD indices and local thermal comfort criteria. International Organization for Standardization: Geneva, Switzerland, 2005.
- Jakubiec, J.; Reinhart, C. The “adaptive zone”—A concept for assessing discomfort glare throughout daylit spaces. Light. Res. Technol. 2012, 44, 149–170. [Google Scholar] [CrossRef]
© 2015 by the authors; licensee MDPI, Basel, Switzerland. This article is an open access article distributed under the terms and conditions of the Creative Commons Attribution license (http://creativecommons.org/licenses/by/4.0/).
Share and Cite
Huang, K.-T.; Liu, K.F.-R.; Liang, H.-H. Design and Energy Performance of a Buoyancy Driven Exterior Shading Device for Building Application in Taiwan. Energies 2015, 8, 2358-2380. https://doi.org/10.3390/en8042358
Huang K-T, Liu KF-R, Liang H-H. Design and Energy Performance of a Buoyancy Driven Exterior Shading Device for Building Application in Taiwan. Energies. 2015; 8(4):2358-2380. https://doi.org/10.3390/en8042358
Chicago/Turabian StyleHuang, Kuo-Tsang, Kevin Fong-Rey Liu, and Han-Hsi Liang. 2015. "Design and Energy Performance of a Buoyancy Driven Exterior Shading Device for Building Application in Taiwan" Energies 8, no. 4: 2358-2380. https://doi.org/10.3390/en8042358