1. Introduction
The Window to Wall Ratio (WWR) of buildings has increased through the modern advances in architectural design. As the window area increases, the performance of windows becomes more important. Most efforts to improve this performance have been based on thermal insulation and air-tightness, when actually the cooling load is affected by the solar radiation transmitted through windows in buildings.
The thermal insulation performance and air-tightness performance help reduce the energy consumption in buildings. In addition, energy labeling, which is regulated in Korea, was proposed to grade the performance of thermal insulation (U-value, W/m2·K) and air-tightness (flow rate, m3/h·m2). As a result, the performance of windows has been improved by the manufacturers. On the other hand, solar heat gain increases the cooling load in summer and decreases the heating load in winter. This must be controlled appropriately. The Solar Heat Gain Coefficient (SHGC) and shading were used to consider solar control. Studies of the SHGC and shading are ongoing, and shading has been studied according to the material and method of installation to determine the most efficient shading effect. Despite this, few studies have examined energy consumption through a comprehensive examination of the window orientation and climate.
A range of studies have examined energy consumption in terms of windows. The complex application of window elements was confirmed [
1], and the correlation between energy consumption and the impact of energy consumption was analyzed by simulation. On the other hand, they only confirmed energy consumption according to the variation of the window performance. Therefore, the present study confirmed the variation of the heating and cooling load by a similar review and a simulation of base modeling. In addition, the effects of heating and cooling energy consumption and lighting were confirmed by simulation of office buildings [
2]. This study confirmed the variation of energy consumption according to the window performance. A study of the energy performance confirmed the correlation with glazing and windows [
3]. The elements of this study were the U-value and G-value. Another study considered the elements of the windows for energy consumption and optical comfort [
4]. The present study confirmed the importance of the WWR. A study of the change in energy consumption by the influence of WWR was published [
5]. On the other hand, these studies did not consider the correlation between the elements of window performance and shading. Studies of a double-skin façade considered various shading factors. The intermediate space of the glass-skin is the installation position of shading, as the shading device is installed in this space. This study confirmed the effects of the shading device on the interior environment [
6,
7]. In addition, a study of the double skin façade design parameters confirmed that the design process changes according to the variations of the blind position and reflectance [
8]. Studies of the external horizontal shading confirmed the variation of solar radiation incidence caused by six types of shading in tropical climates [
9]. One study of the envelope design confirmed the effect of the various sunshields in Taiwan [
10]. For sustainable design guidelines, a design parameter affecting the energy performance of shading was proposed, and its contribution of shading and reflective surfaces on the cooling load was confirmed [
11]. Nevertheless, more studies of the variation of energy consumption according to the shading properties are needed.
The Korean government has provided guidelines and regulations for window installation. Shading is also defined by regulations in Korea. The guidelines and regulations for reducing the energy consumption in buildings are not perfect, and any study related to windows must adhere to the guidelines and regulations of the Korean government. The Building Energy Conservation in Korea defined shading as blocking solar radiation, and identified exterior shading, interior shading and between the glass shading as parameters [
12]. In addition, the Energy Performance Indicator (EPI) checks the exterior shading and admits just the auto controlled interior shading. Green building certification is the proposed standard for decreasing the level of greenhouse gas emissions [
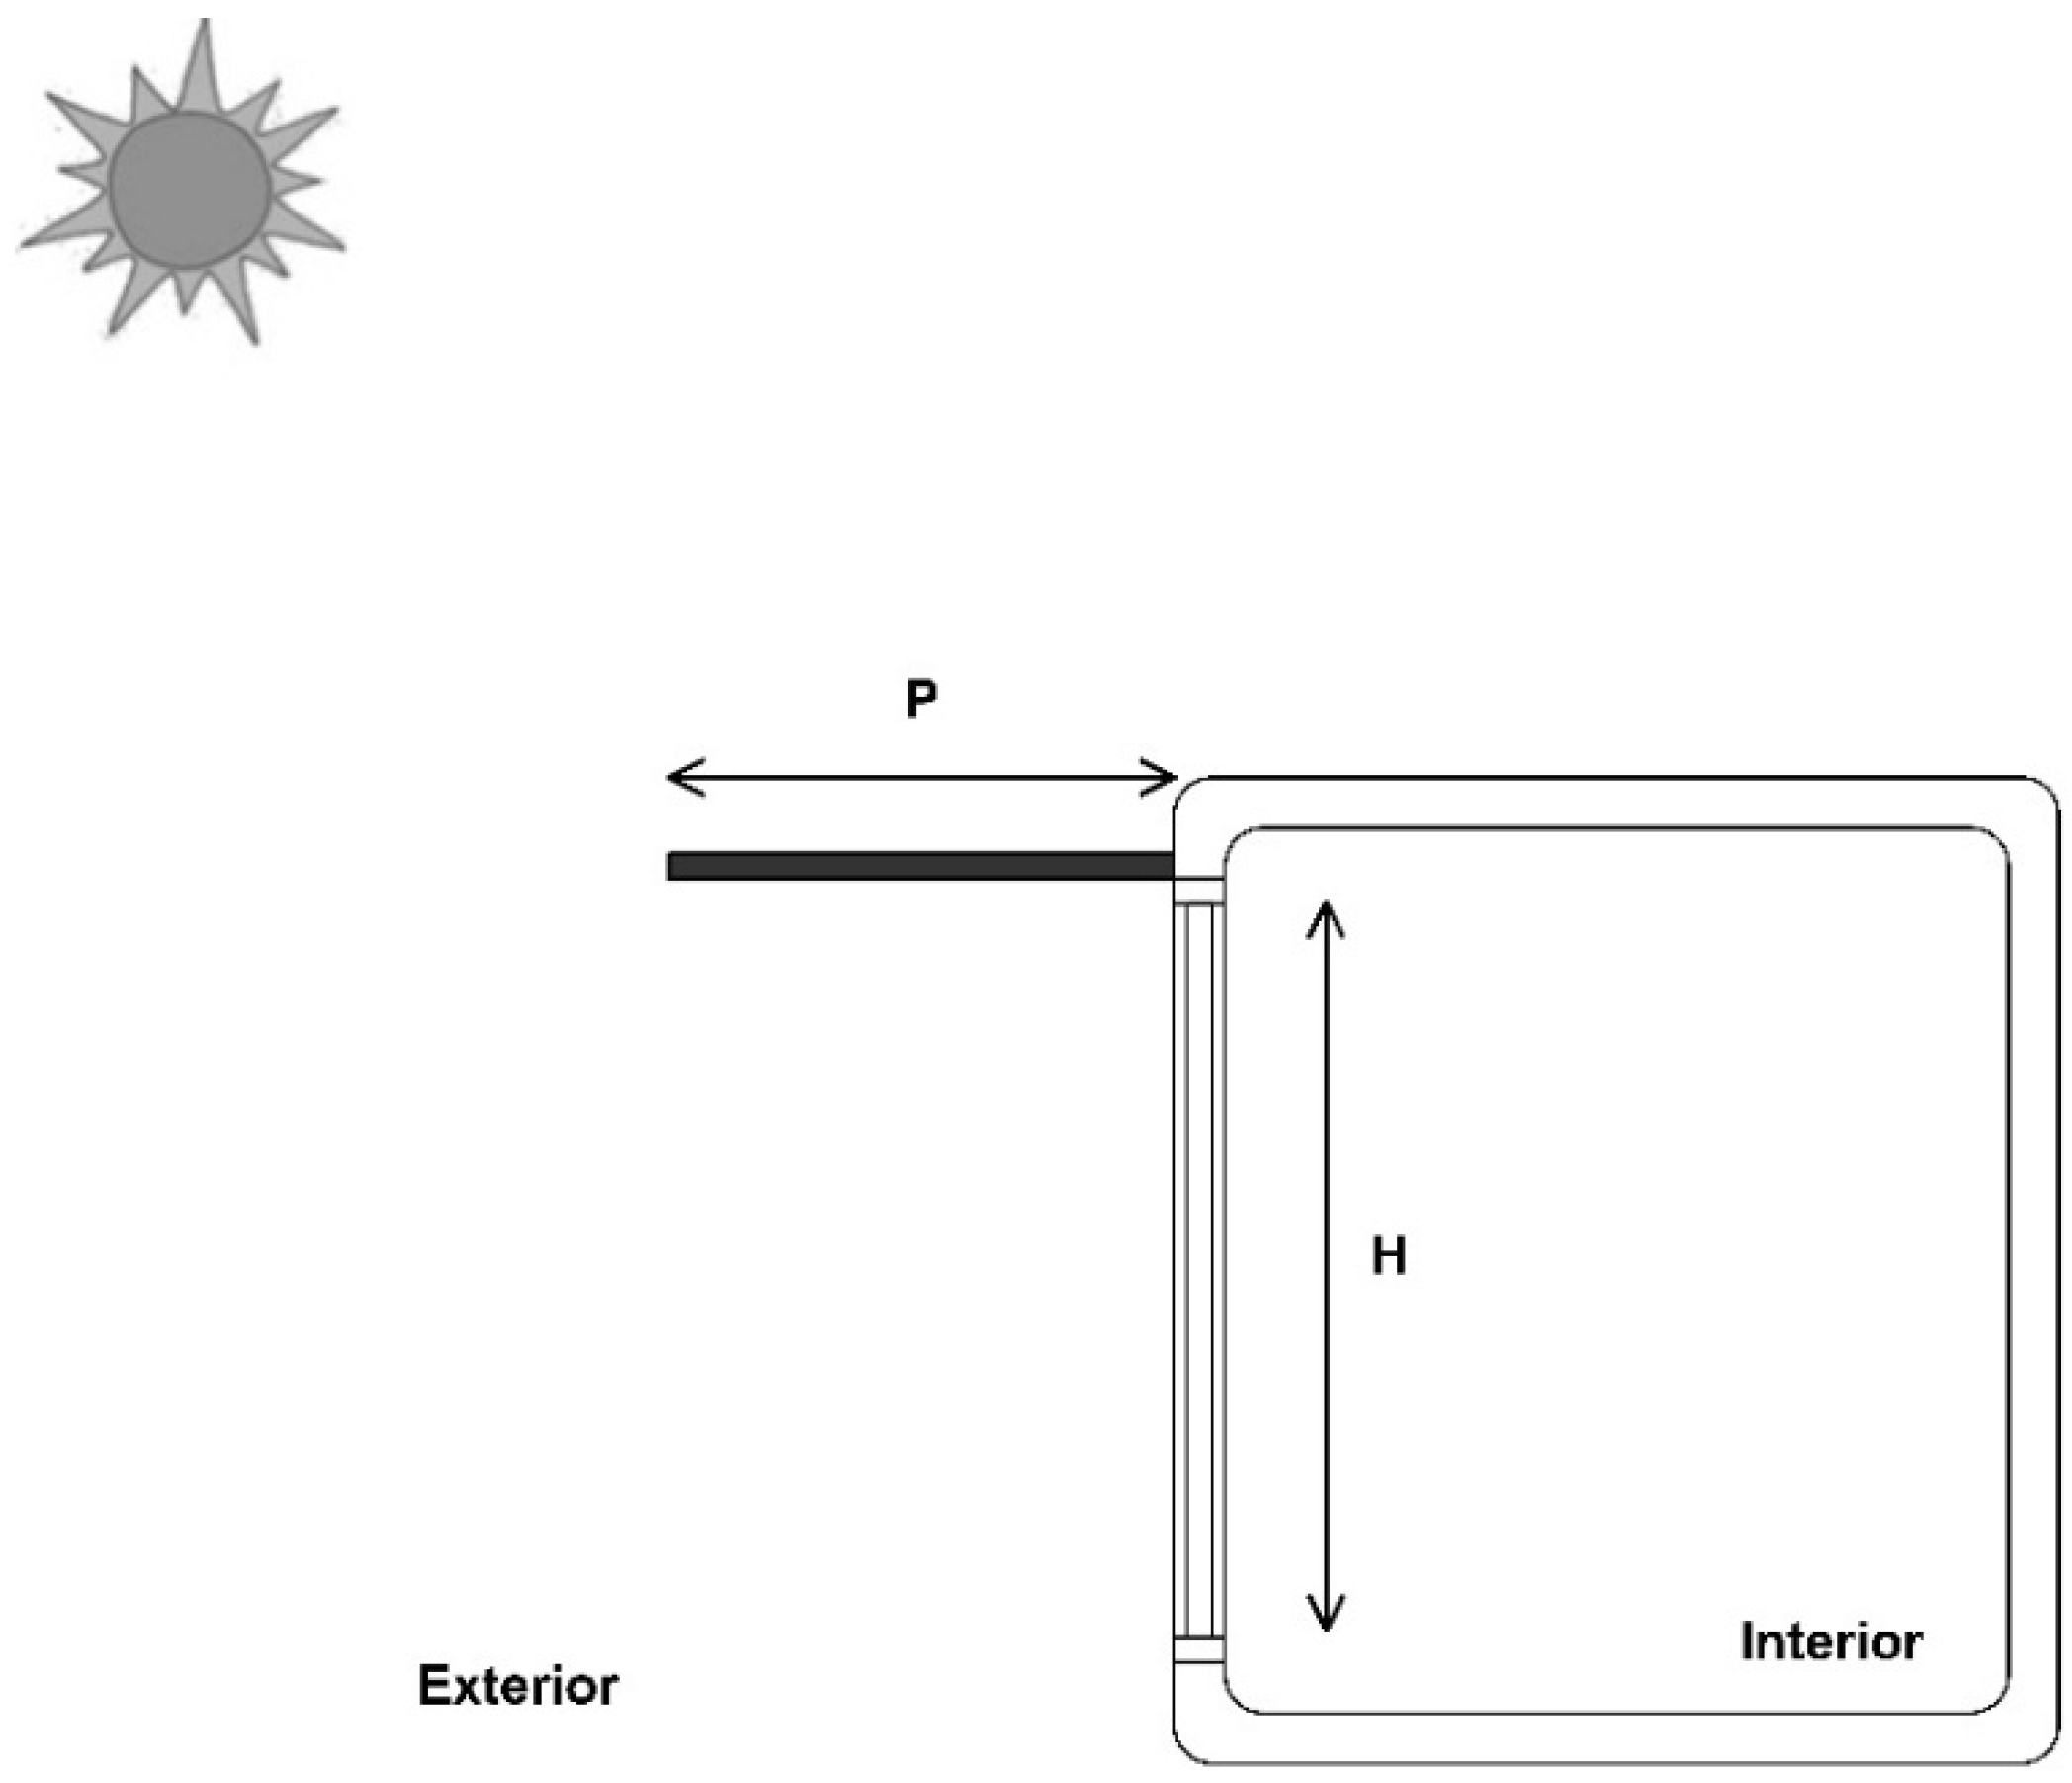
13]. This standard proposes the minimum length of horizontal shading to decrease glare and provide environmental improvements. The minimum length of horizontal shading was determined using Equation (1):
where
P is the length of horizontal shading,
H is the horizontal length to shading from the bottom of the window and
A is the meridian altitude in summer (90-latitude + 23.5).
Figure 1 presents the length of horizontal shading.
Figure 1.
Length of horizontal shading.
Figure 1.
Length of horizontal shading.
“The Window Design Guidelines for Energy-saving of Buildings” were published the Ministry of Land, Transport and Maritime Affairs [
14]. The purpose of these guidelines is to allow a variety of designs to consider the energy performance in building design. These guidelines confirmed the impact of the window design of office buildings on the energy consumption of buildings and proposed the orientation, WWR and types of windows in each region. In addition, these guidelines can be used to calculate the energy savings. The guidelines proposed the exterior shading for energy saving but it was just one case of a length of 600 mm.
Table 1 lists the regulation and guidelines for windows in Korea.
Table 1.
Regulation and guidelines for windows in Korea.
Table 1.
Regulation and guidelines for windows in Korea.
| Title | Section | Contents |
|---|
| Building Energy Conservation Design Standards | Design performance | WWR/Orientation |
| Window performance | Heat transmission coefficient (U-Value)/Air-tightness |
| Shading | Position: Exterior/Between Glazing/Interior |
| Green Building Certification | Design performance | WWR |
| Window performance | Heat transmission coefficient (U-Value)/Air-tightness |
| Shading | Proposed minimum length (P) of shading |
| The Window Design Guideline for Energy-saving of Buildings | Design performance | WWR/Orientation |
| Window performance | Heat transmission coefficient (U-Value)/Air-tightness/SHGC |
| Shading | Optional Exterior shading (600 mm) |
The aim of this study was to confirm the energy saving effect of shading installation. Because the remodeling or new buildings in Korea needs to install shading using the renewed Korean regulations, this study confirmed the energy saving effects and proposed basic research guidelines for shading design. In addition, this study referenced the regulations and guidelines in Korea. This study also confirmed the horizontal shading installation effect. The variation of heating and cooling load was confirmed by changing the length of horizontal shading. The results were compared according to the variation of SHGC. In addition, this study confirmed the correlation between the horizontal shading and the various venetian blind types through the variations of the heating and cooling load. This study confirmed the energy saving ratio of the various venetian blinds than the horizontal shading.
4. Analysis of the Heating and Cooling Load According to the Type of Venetian Blind
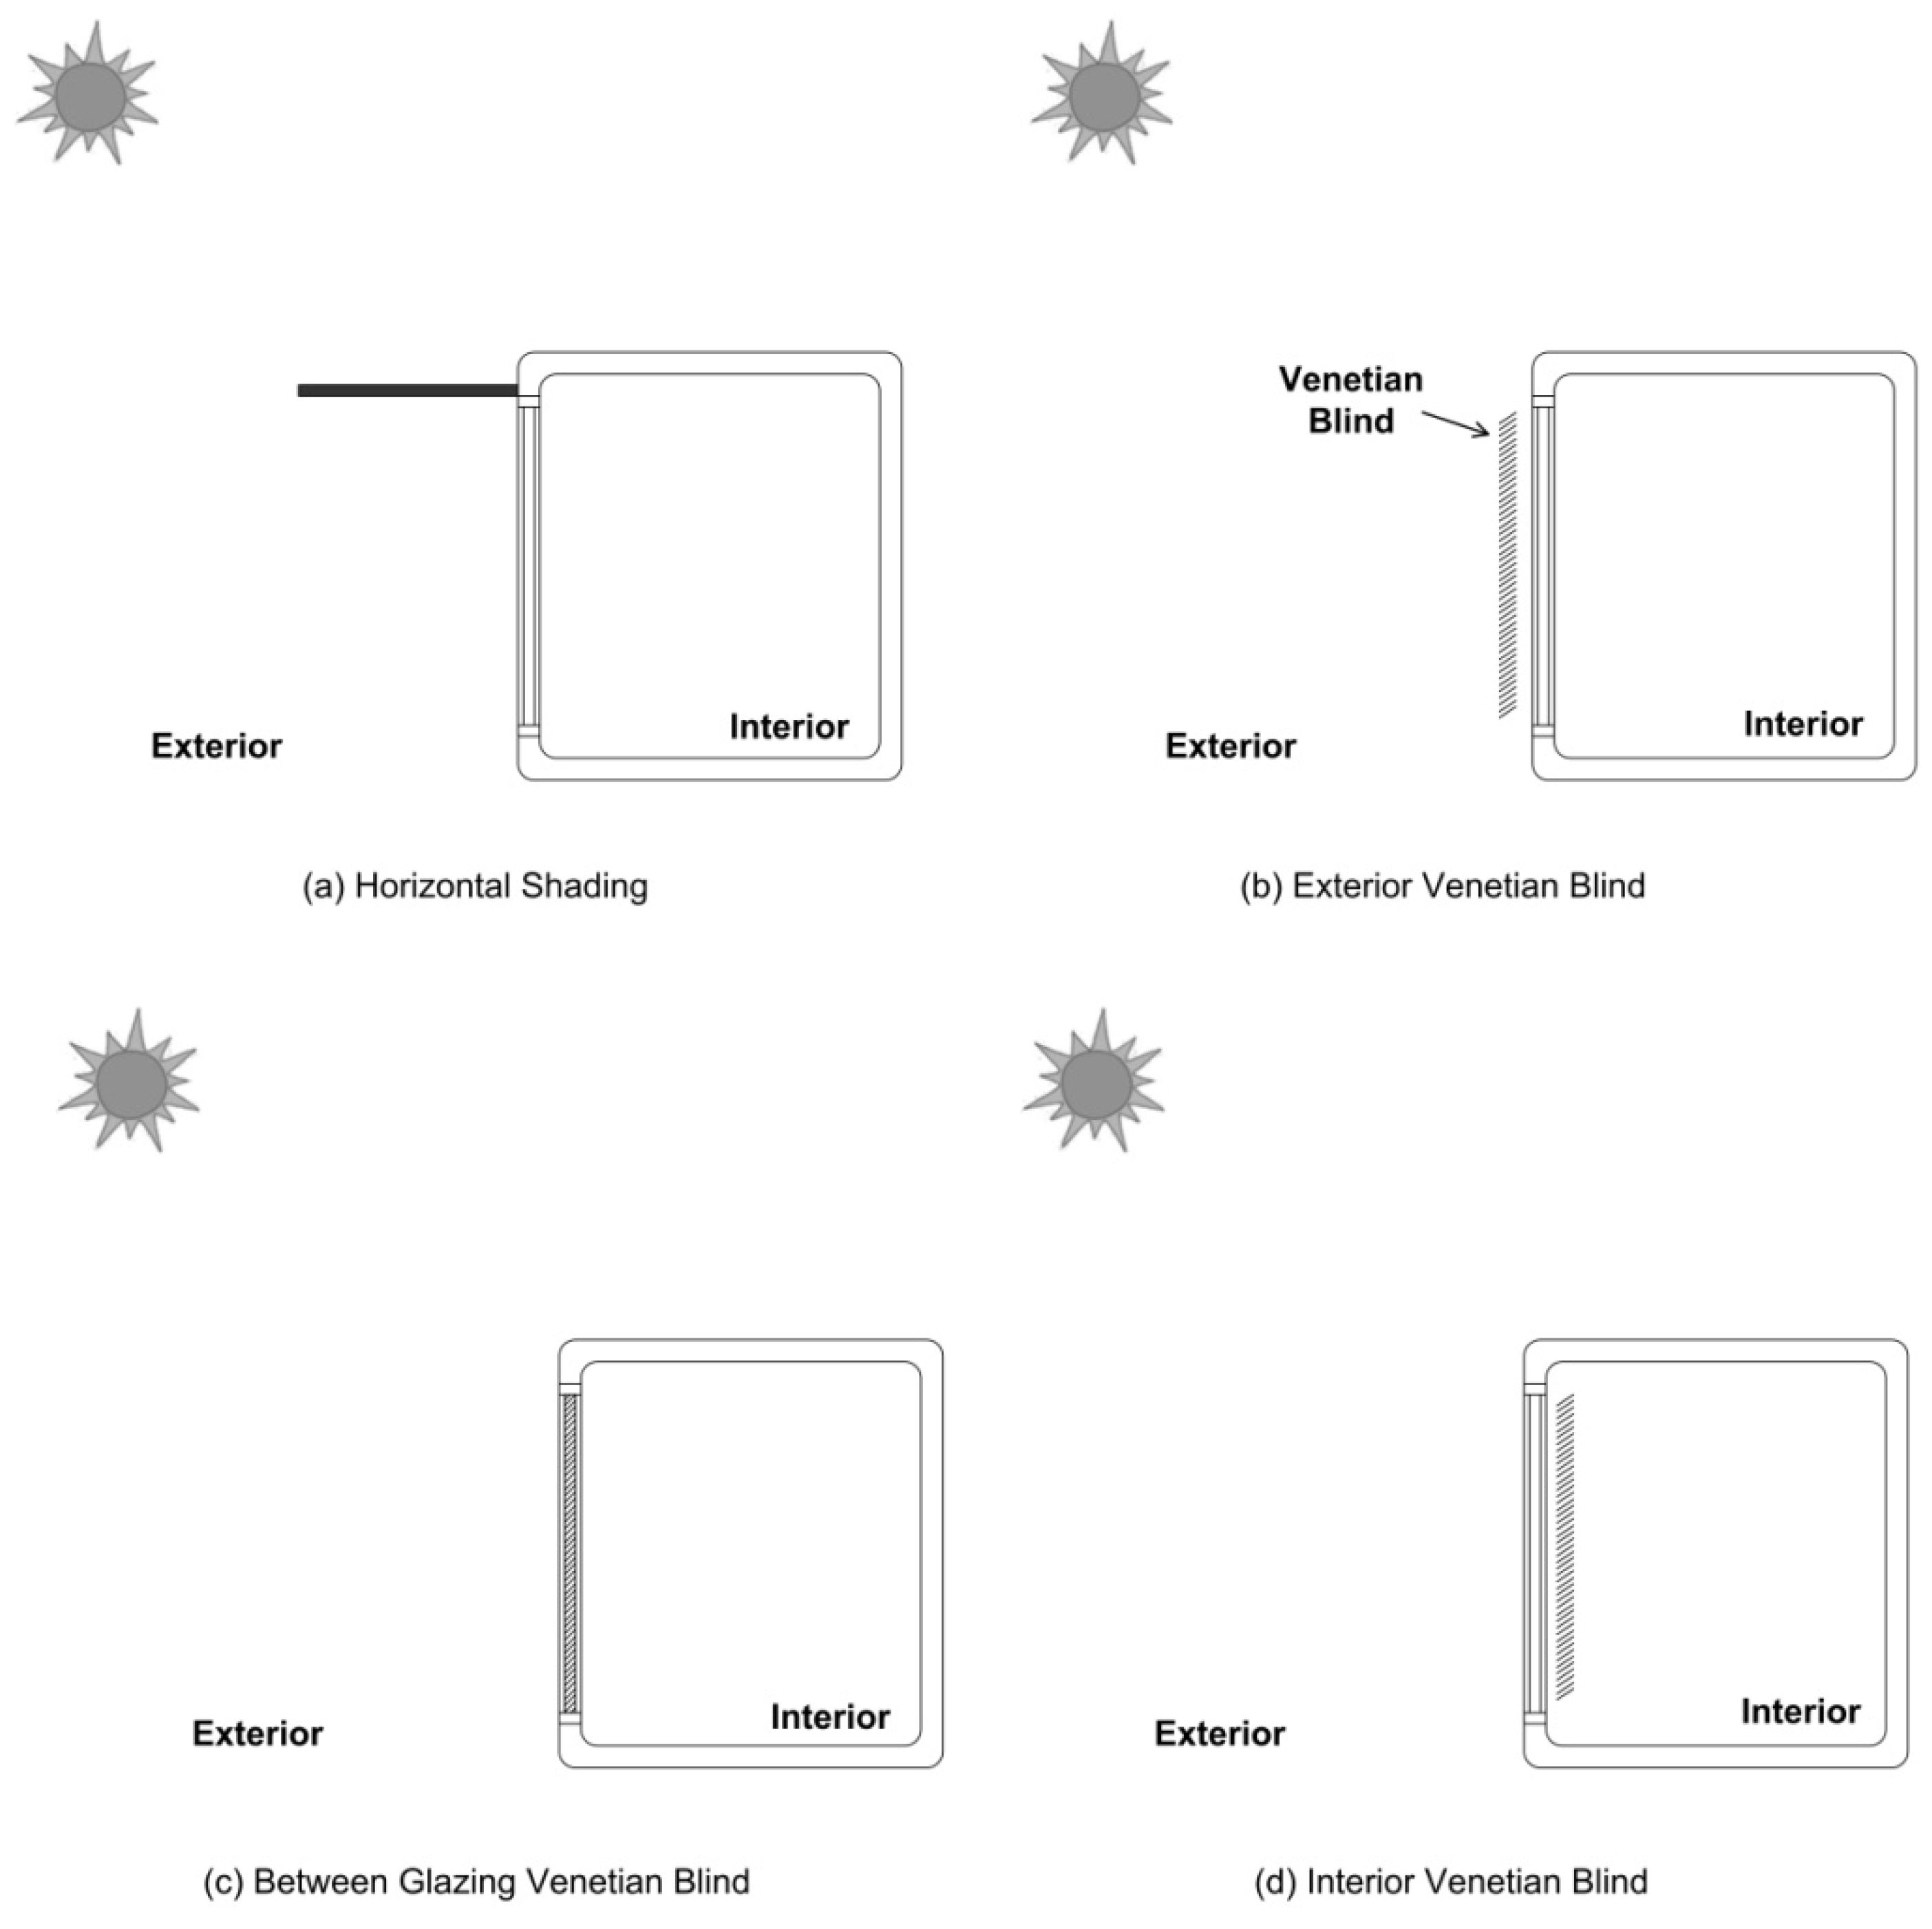
The Building Energy Conservation in Korea has proposed the position of shading. The guidelines for the venetian blind position vary. To confirm the variation of the heating and cooling load with venetian blinds, this study compared the case of horizontal shading with the case of the various venetian blind positions. The angle of the venetian blind was 45°. This study used the venetian blind types of the interior position/between glazing position/exterior position.
Table 5 lists the simulation case and venetian blind type.
Figure 9 shows the type of shading. In the case of WWR 60% and 80%, and SHGC 0.4 and 0.6 of the window, this study confirmed the heating and cooling load of a standard building.
Table 6 lists the results of the simulation.
Table 5.
Simulation parameter and details of various shading.
Table 5.
Simulation parameter and details of various shading.
| Section | Contents |
|---|
| Orientation | East/West/South/North |
|---|
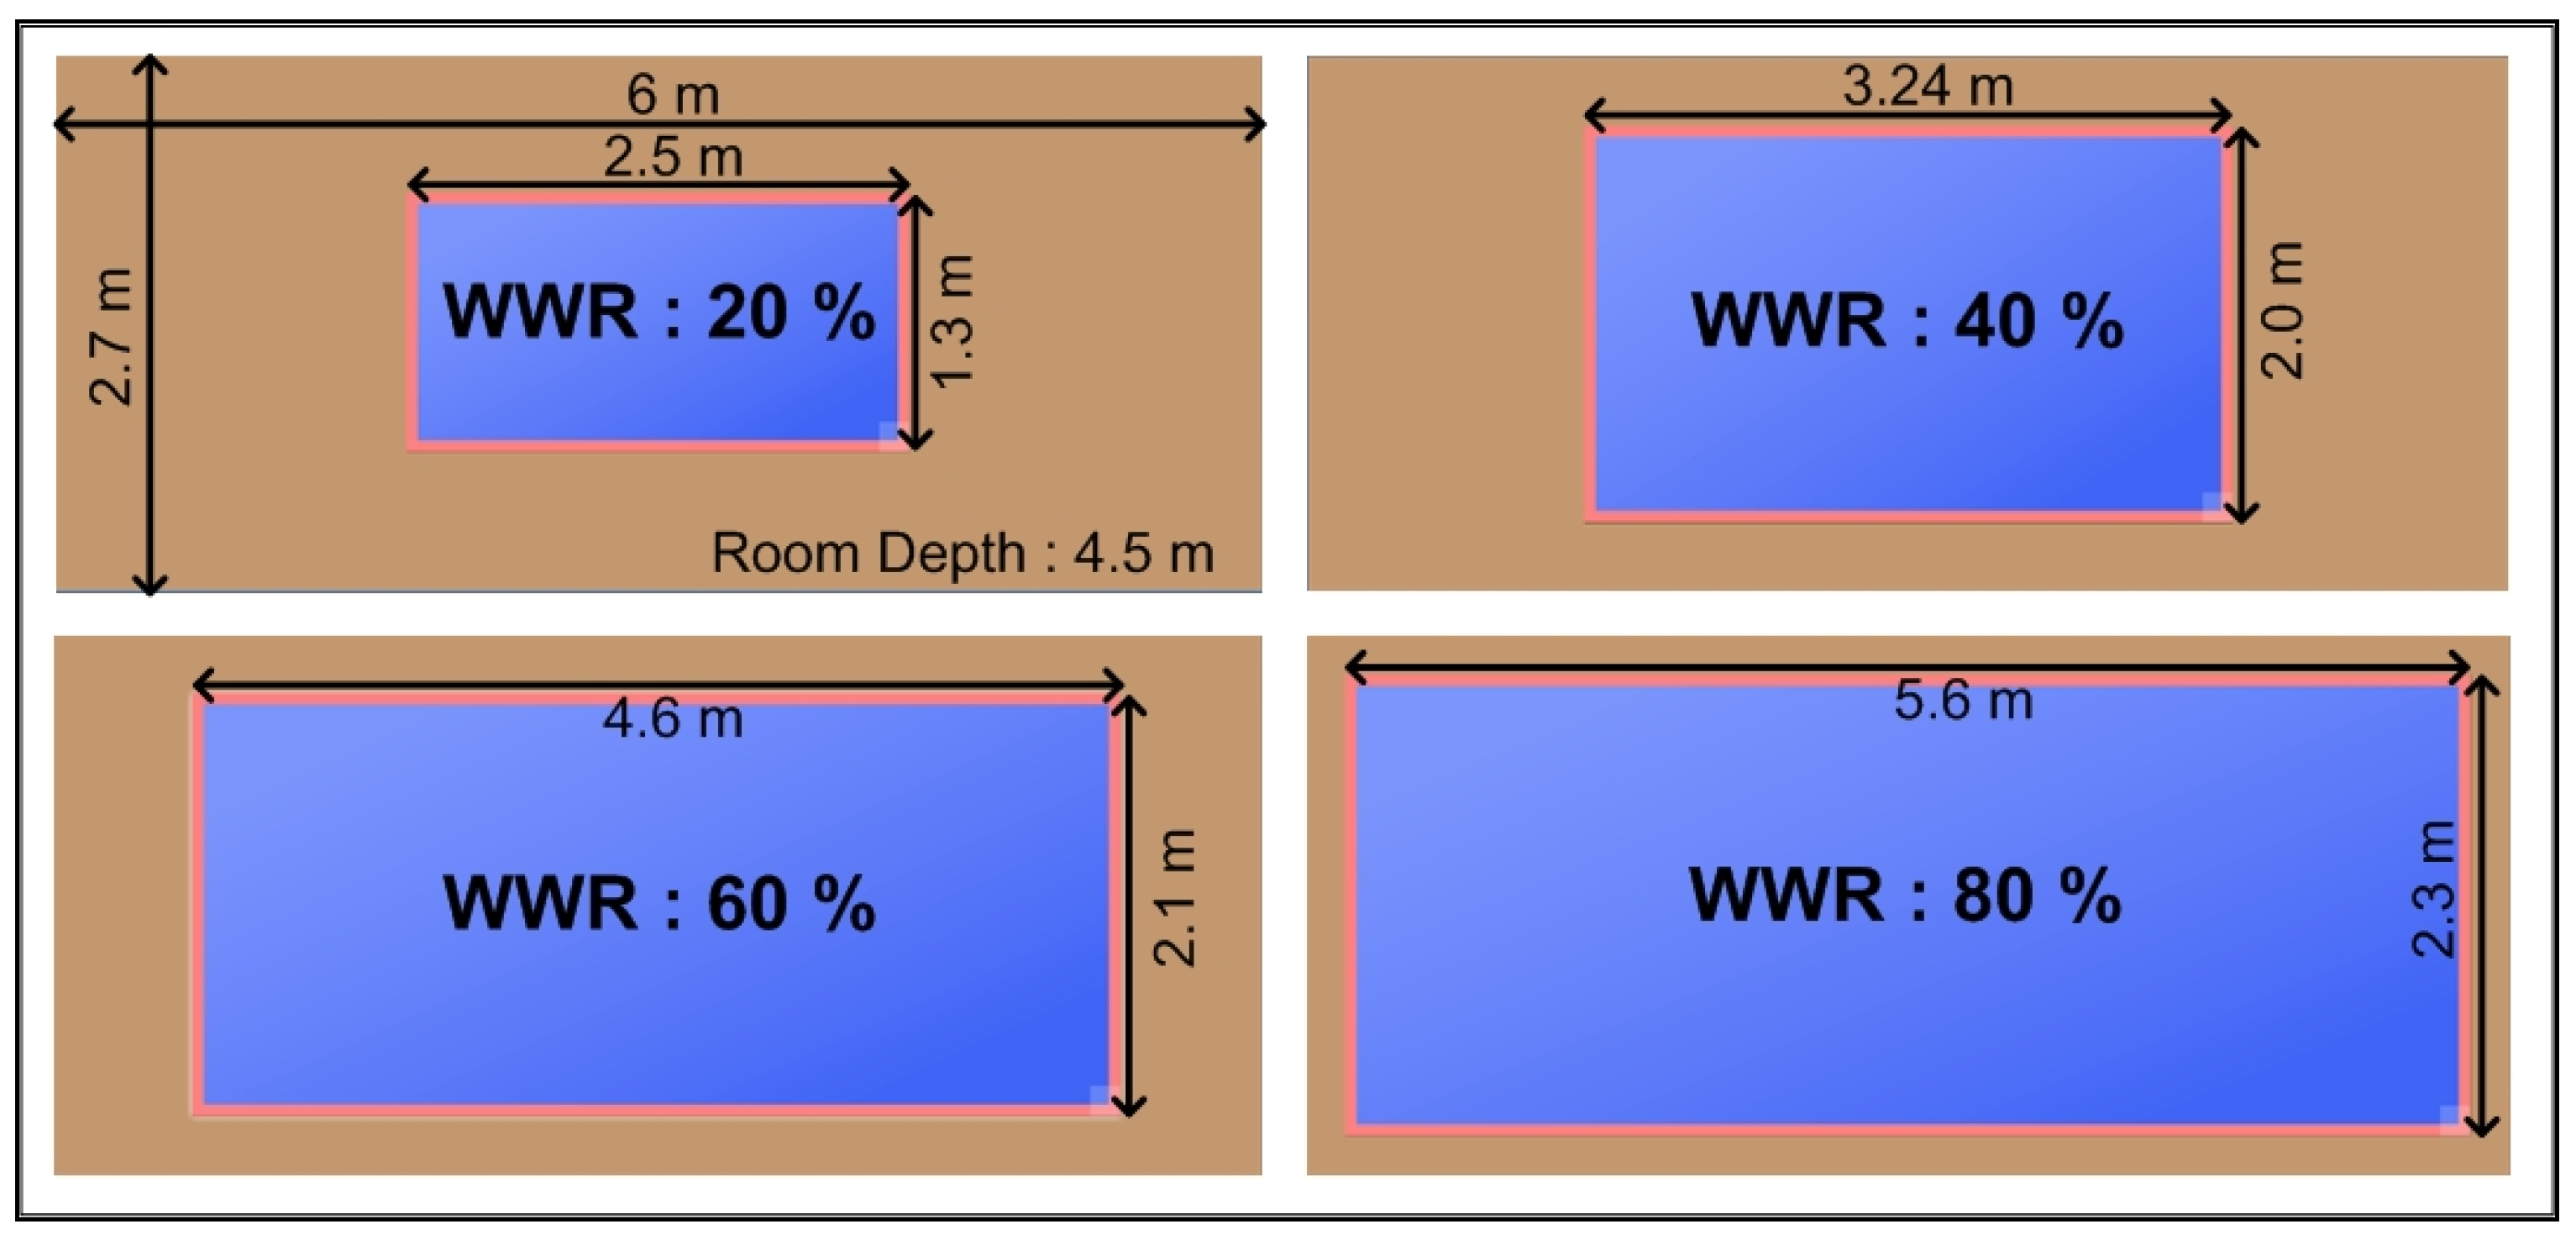
| WWR | ![Energies 08 01487 i002]() |
|---|
| Window Performance | U-Value | 2.1 |
| SHGC | 0.4/0.6 |
| CASE | Horizontal Shading | WWR (%) | 60 | 80 |
| Length (m) | 0.55 | 0.6 |
| Venetian Blind | Position | Angle (°) | Width of slat (mm) | Spacing (mm) | Thickness (mm) |
| Exterior | 45 | 76.96 | 70.1 | 1.02 |
| Between glazing | 4 | 7.62 |
| Interior | 25.4 | 20.07 |
Figure 9.
Type of shading and venetian blinds.
Figure 9.
Type of shading and venetian blinds.
Table 6.
Heating and cooling load variation with horizontal shading and venetian blinds.
Table 6.
Heating and cooling load variation with horizontal shading and venetian blinds.
| WWR | Window Performance | Shading Type | Position | Period | Heating and Cooling load (kWh/m2) |
|---|
| East | West | South | North |
|---|
| 60% | U-Value: 2.1 (W/m2·K) SHGC: 0.4 | Horizontal shading | Exterior | May–Oct | 57.5 | 58.2 | 40.7 | 59.5 |
| Nov–Apr | 74.3 | 76.2 | 60.0 | 48.8 |
| Venetian blind | Exterior | May–Oct | 55.7 | 55.5 | 50.1 | 57.9 |
| Nov–Apr | 49.5 | 49.5 | 48.6 | 44.4 |
| Between glazing | May–Oct | 51.2 | 51.7 | 45.4 | 54.7 |
| Nov–Apr | 59.9 | 58.9 | 60.7 | 54.1 |
| Interior | May–Oct | 58.6 | 60.1 | 47.0 | 57.9 |
| Nov–Apr | 83.4 | 85.1 | 72.3 | 50.4 |
| U-value: 2.1 (W/m2·K) SHGC: 0.6 | Horizontal shading | Exterior | May–Oct | 57.9 | 59.6 | 41.6 | 55.9 |
| Nov–Apr | 91.8 | 94.6 | 69.9 | 54.8 |
| Venetian blind | Exterior | May–Oct | 54.4 | 54.2 | 47.7 | 56.8 |
| Nov–Apr | 52.2 | 52.6 | 51.4 | 45.7 |
| Between glazing | May–Oct | 51.5 | 52.0 | 45.6 | 55.0 |
| Nov–Apr | 59.6 | 58.7 | 60.4 | 53.9 |
| Interior | May–Oct | 58.3 | 60.3 | 47.2 | 56.4 |
| Nov–Apr | 89.2 | 91.4 | 76.7 | 54.0 |
| 80% | U-value: 2.1 (W/m2·K) SHGC: 0.4 | Horizontal shading | Exterior | May–Oct | 66.1 | 67.5 | 46.6 | 68.8 |
| Nov–Apr | 85.7 | 88.2 | 66.0 | 51.7 |
| Venetian blind | Exterior | May–Oct | 64.0 | 63.8 | 57.1 | 66.9 |
| Nov–Apr | 51.7 | 52.2 | 50.7 | 44.4 |
| Between glazing | May–Oct | 58.0 | 58.9 | 51.0 | 62.4 |
| Nov–Apr | 65.1 | 64.4 | 66.4 | 58.3 |
| Interior | May–Oct | 68.6 | 71.1 | 56.3 | 67.1 |
| Nov–Apr | 98.2 | 100.4 | 82.9 | 54.3 |
| U-value: 2.1 (W/m2·K) SHGC: 0.6 | Horizontal shading | Exterior | May–Oct | 68.1 | 70.9 | 50.3 | 64.1 |
| Nov–Apr | 109.3 | 113.2 | 79.1 | 59.1 |
| Venetian blind | Exterior | May–Oct | 62.1 | 62.0 | 53.9 | 65.3 |
| Nov–Apr | 55.3 | 56.2 | 54.4 | 46.1 |
| Between glazing | May–Oct | 58.4 | 59.2 | 51.4 | 62.8 |
| Nov–Apr | 64.7 | 64.0 | 66.1 | 58.0 |
| Interior | May–Oct | 68.9 | 72.0 | 57.7 | 65.1 |
| Nov–Apr | 105.8 | 109.2 | 88.8 | 58.3 |
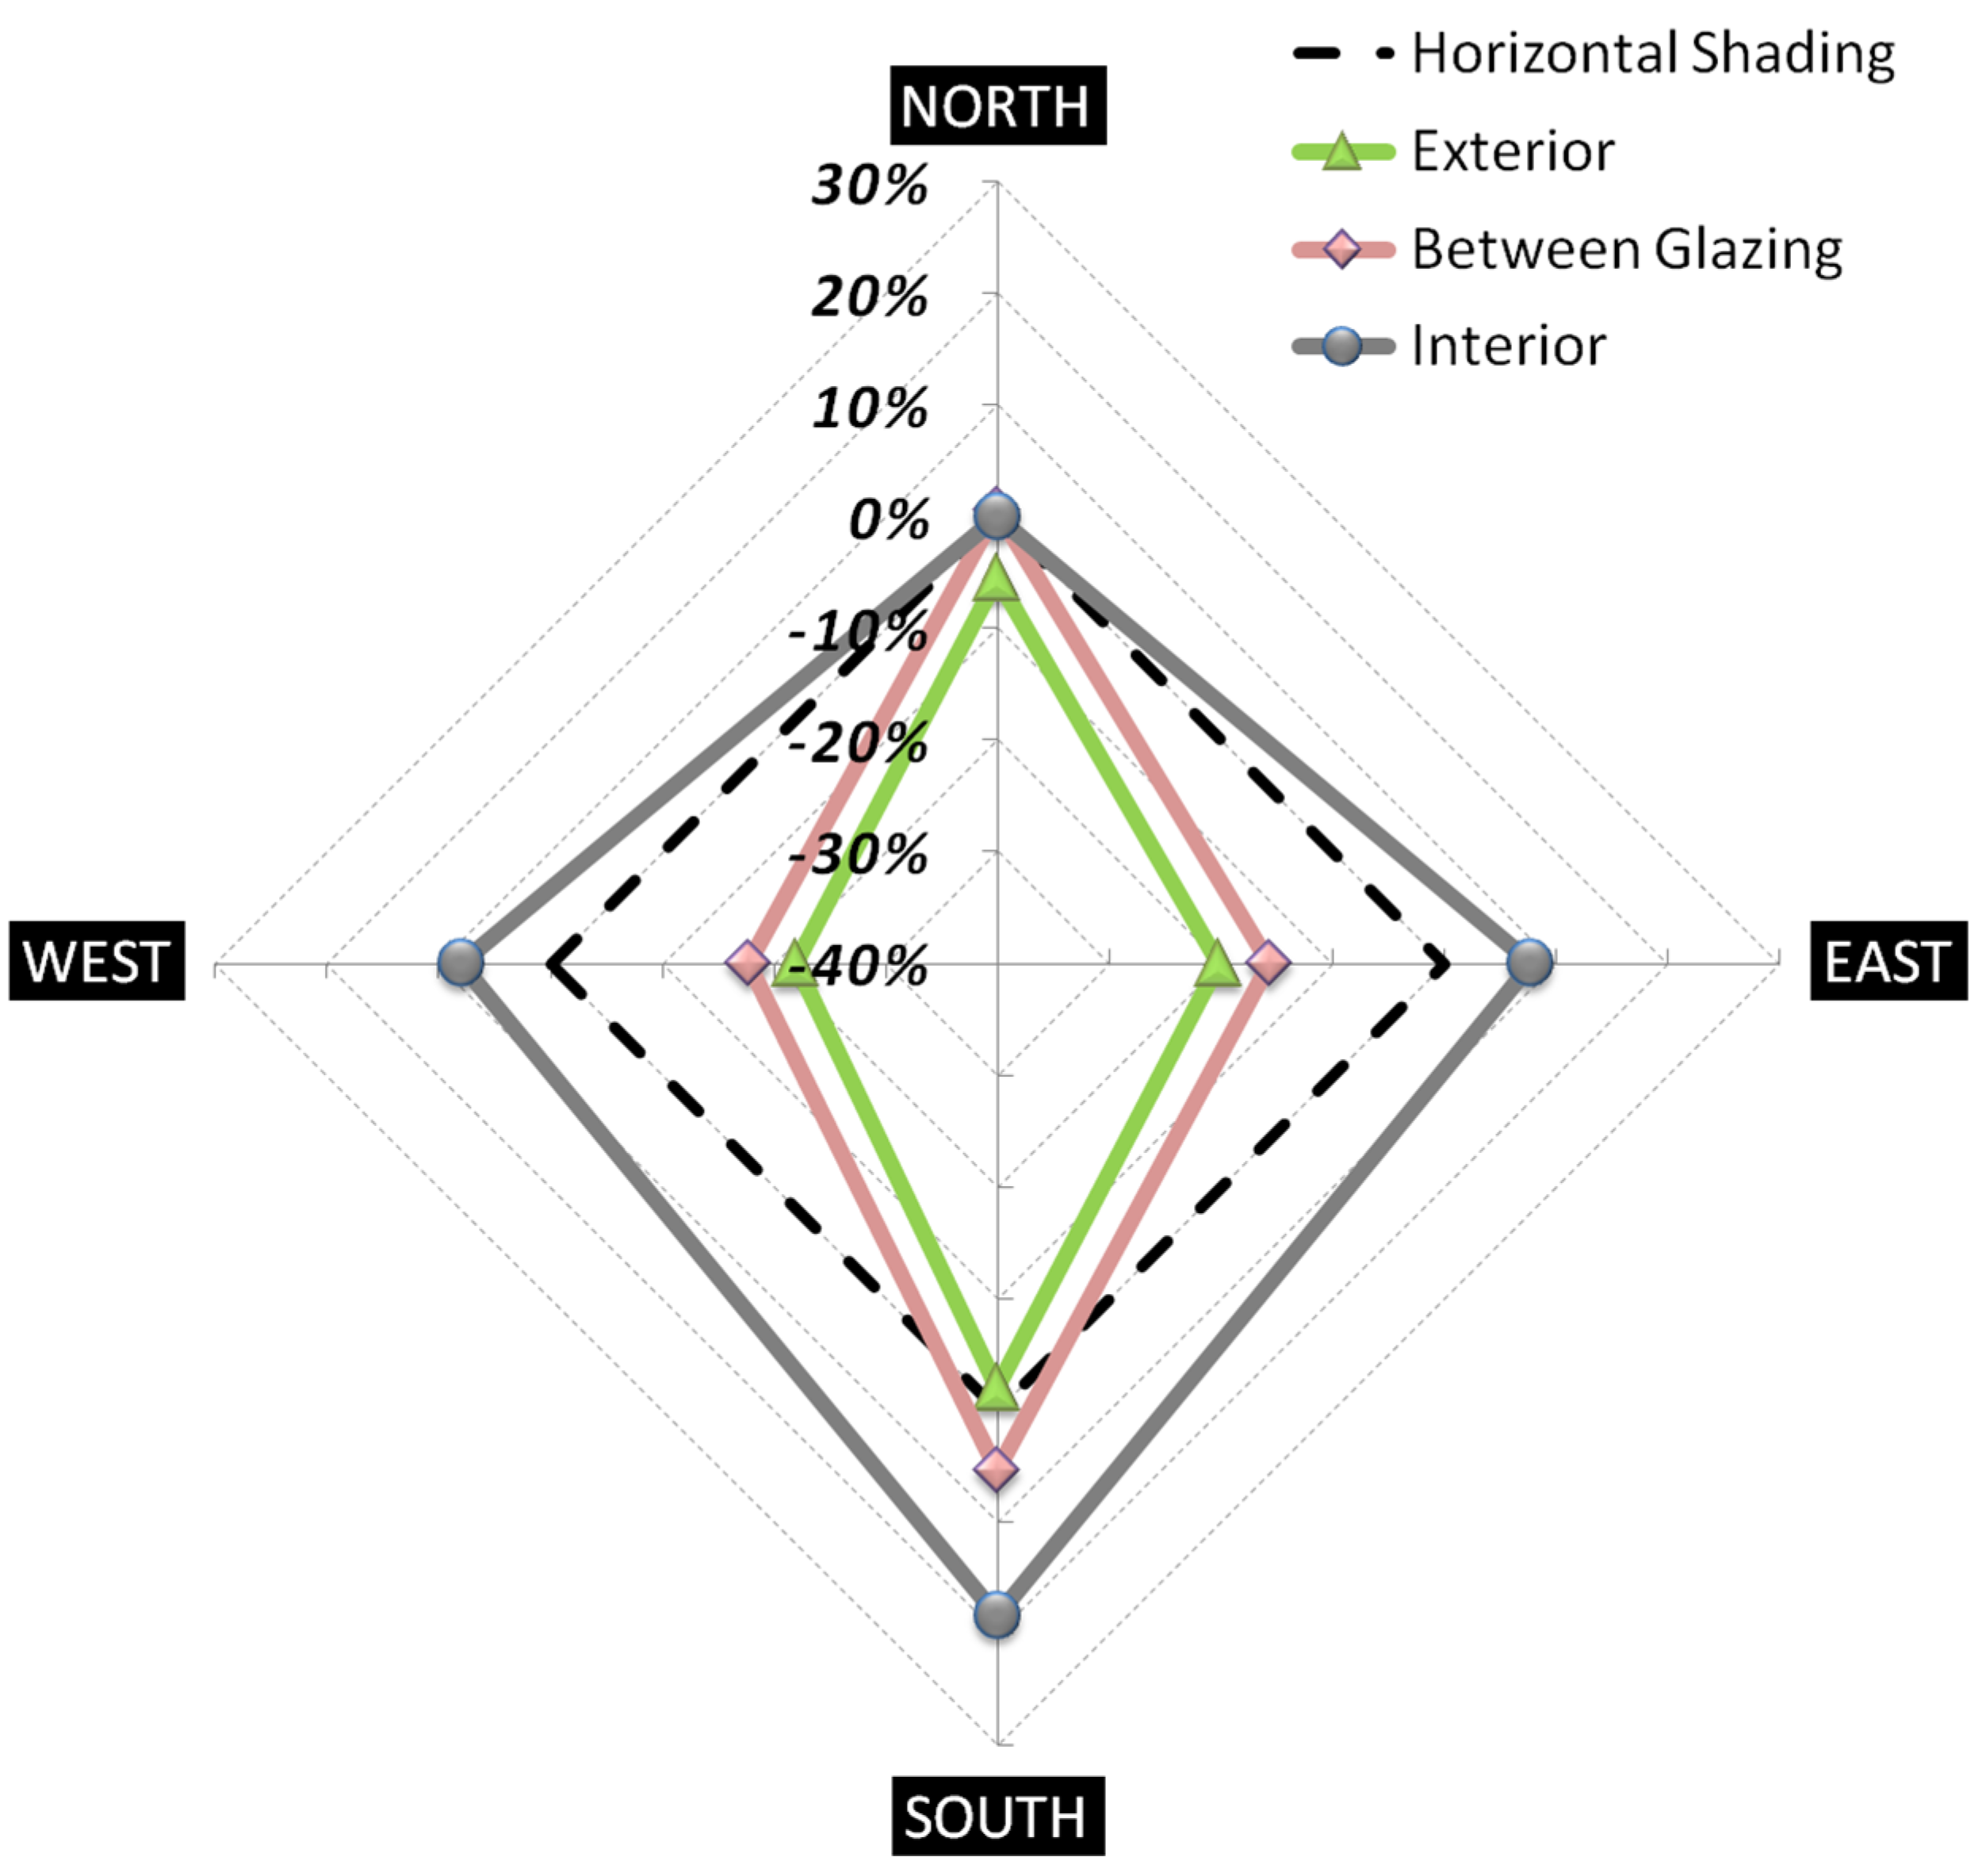
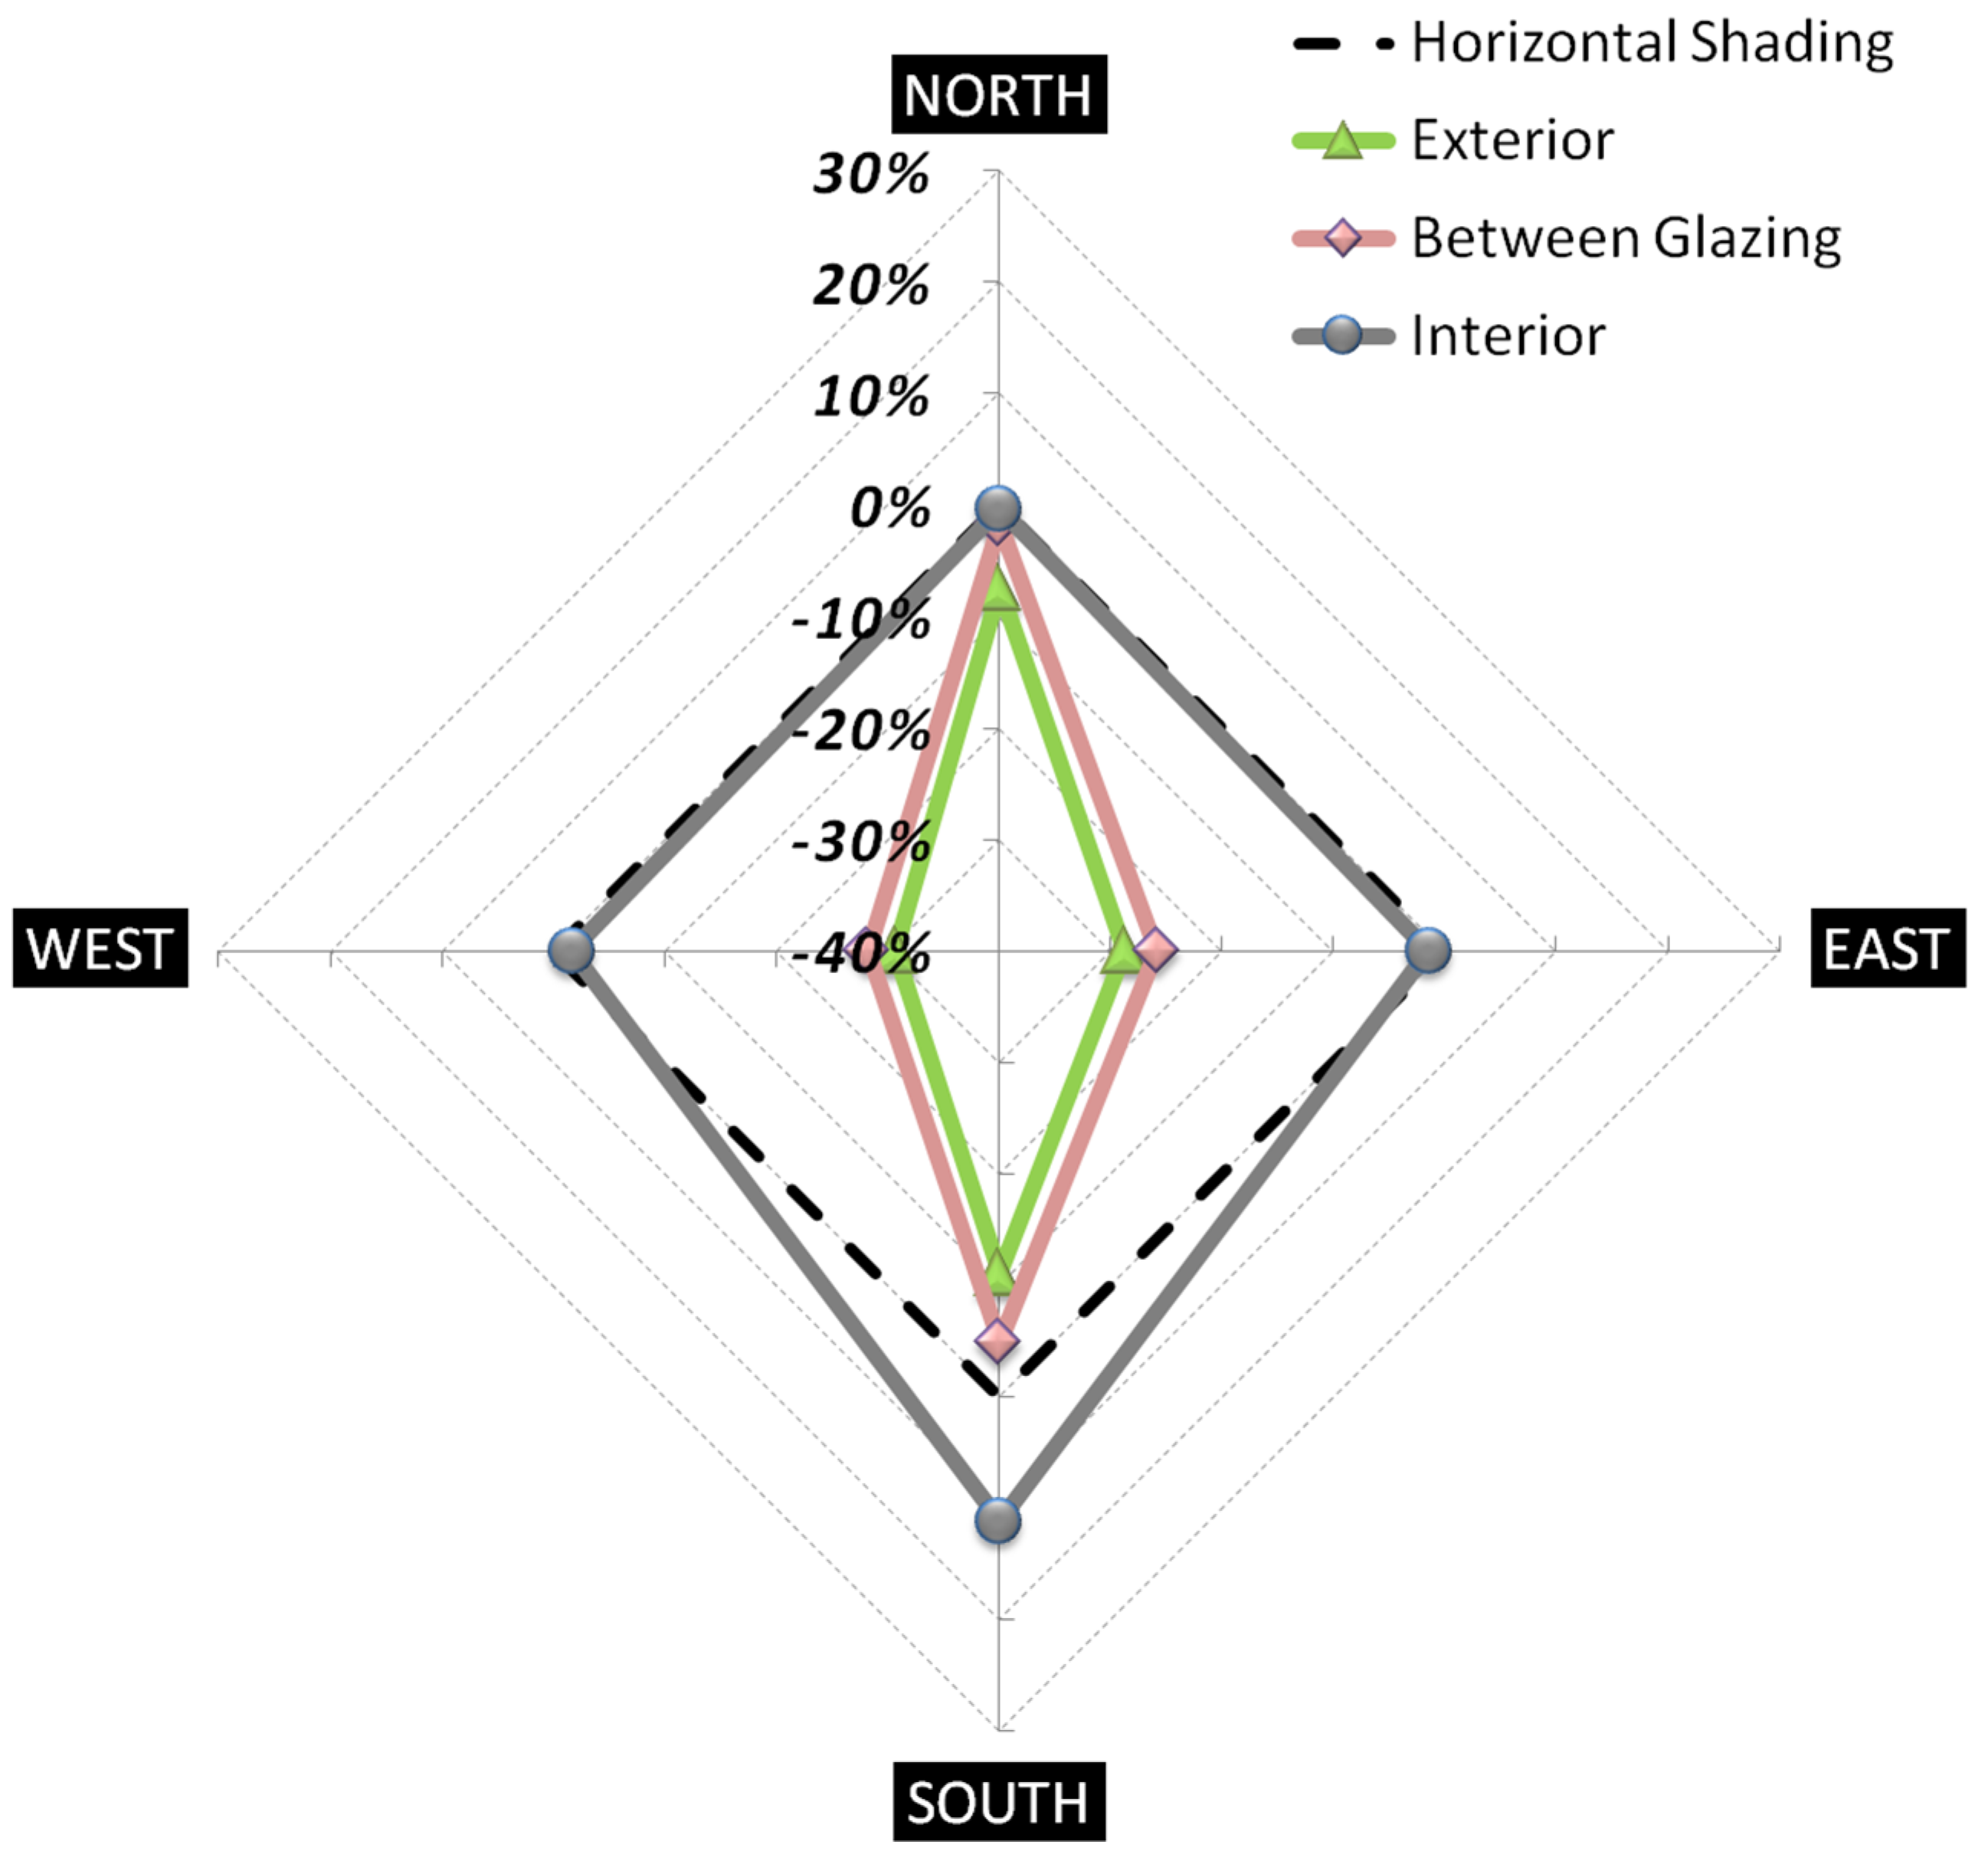
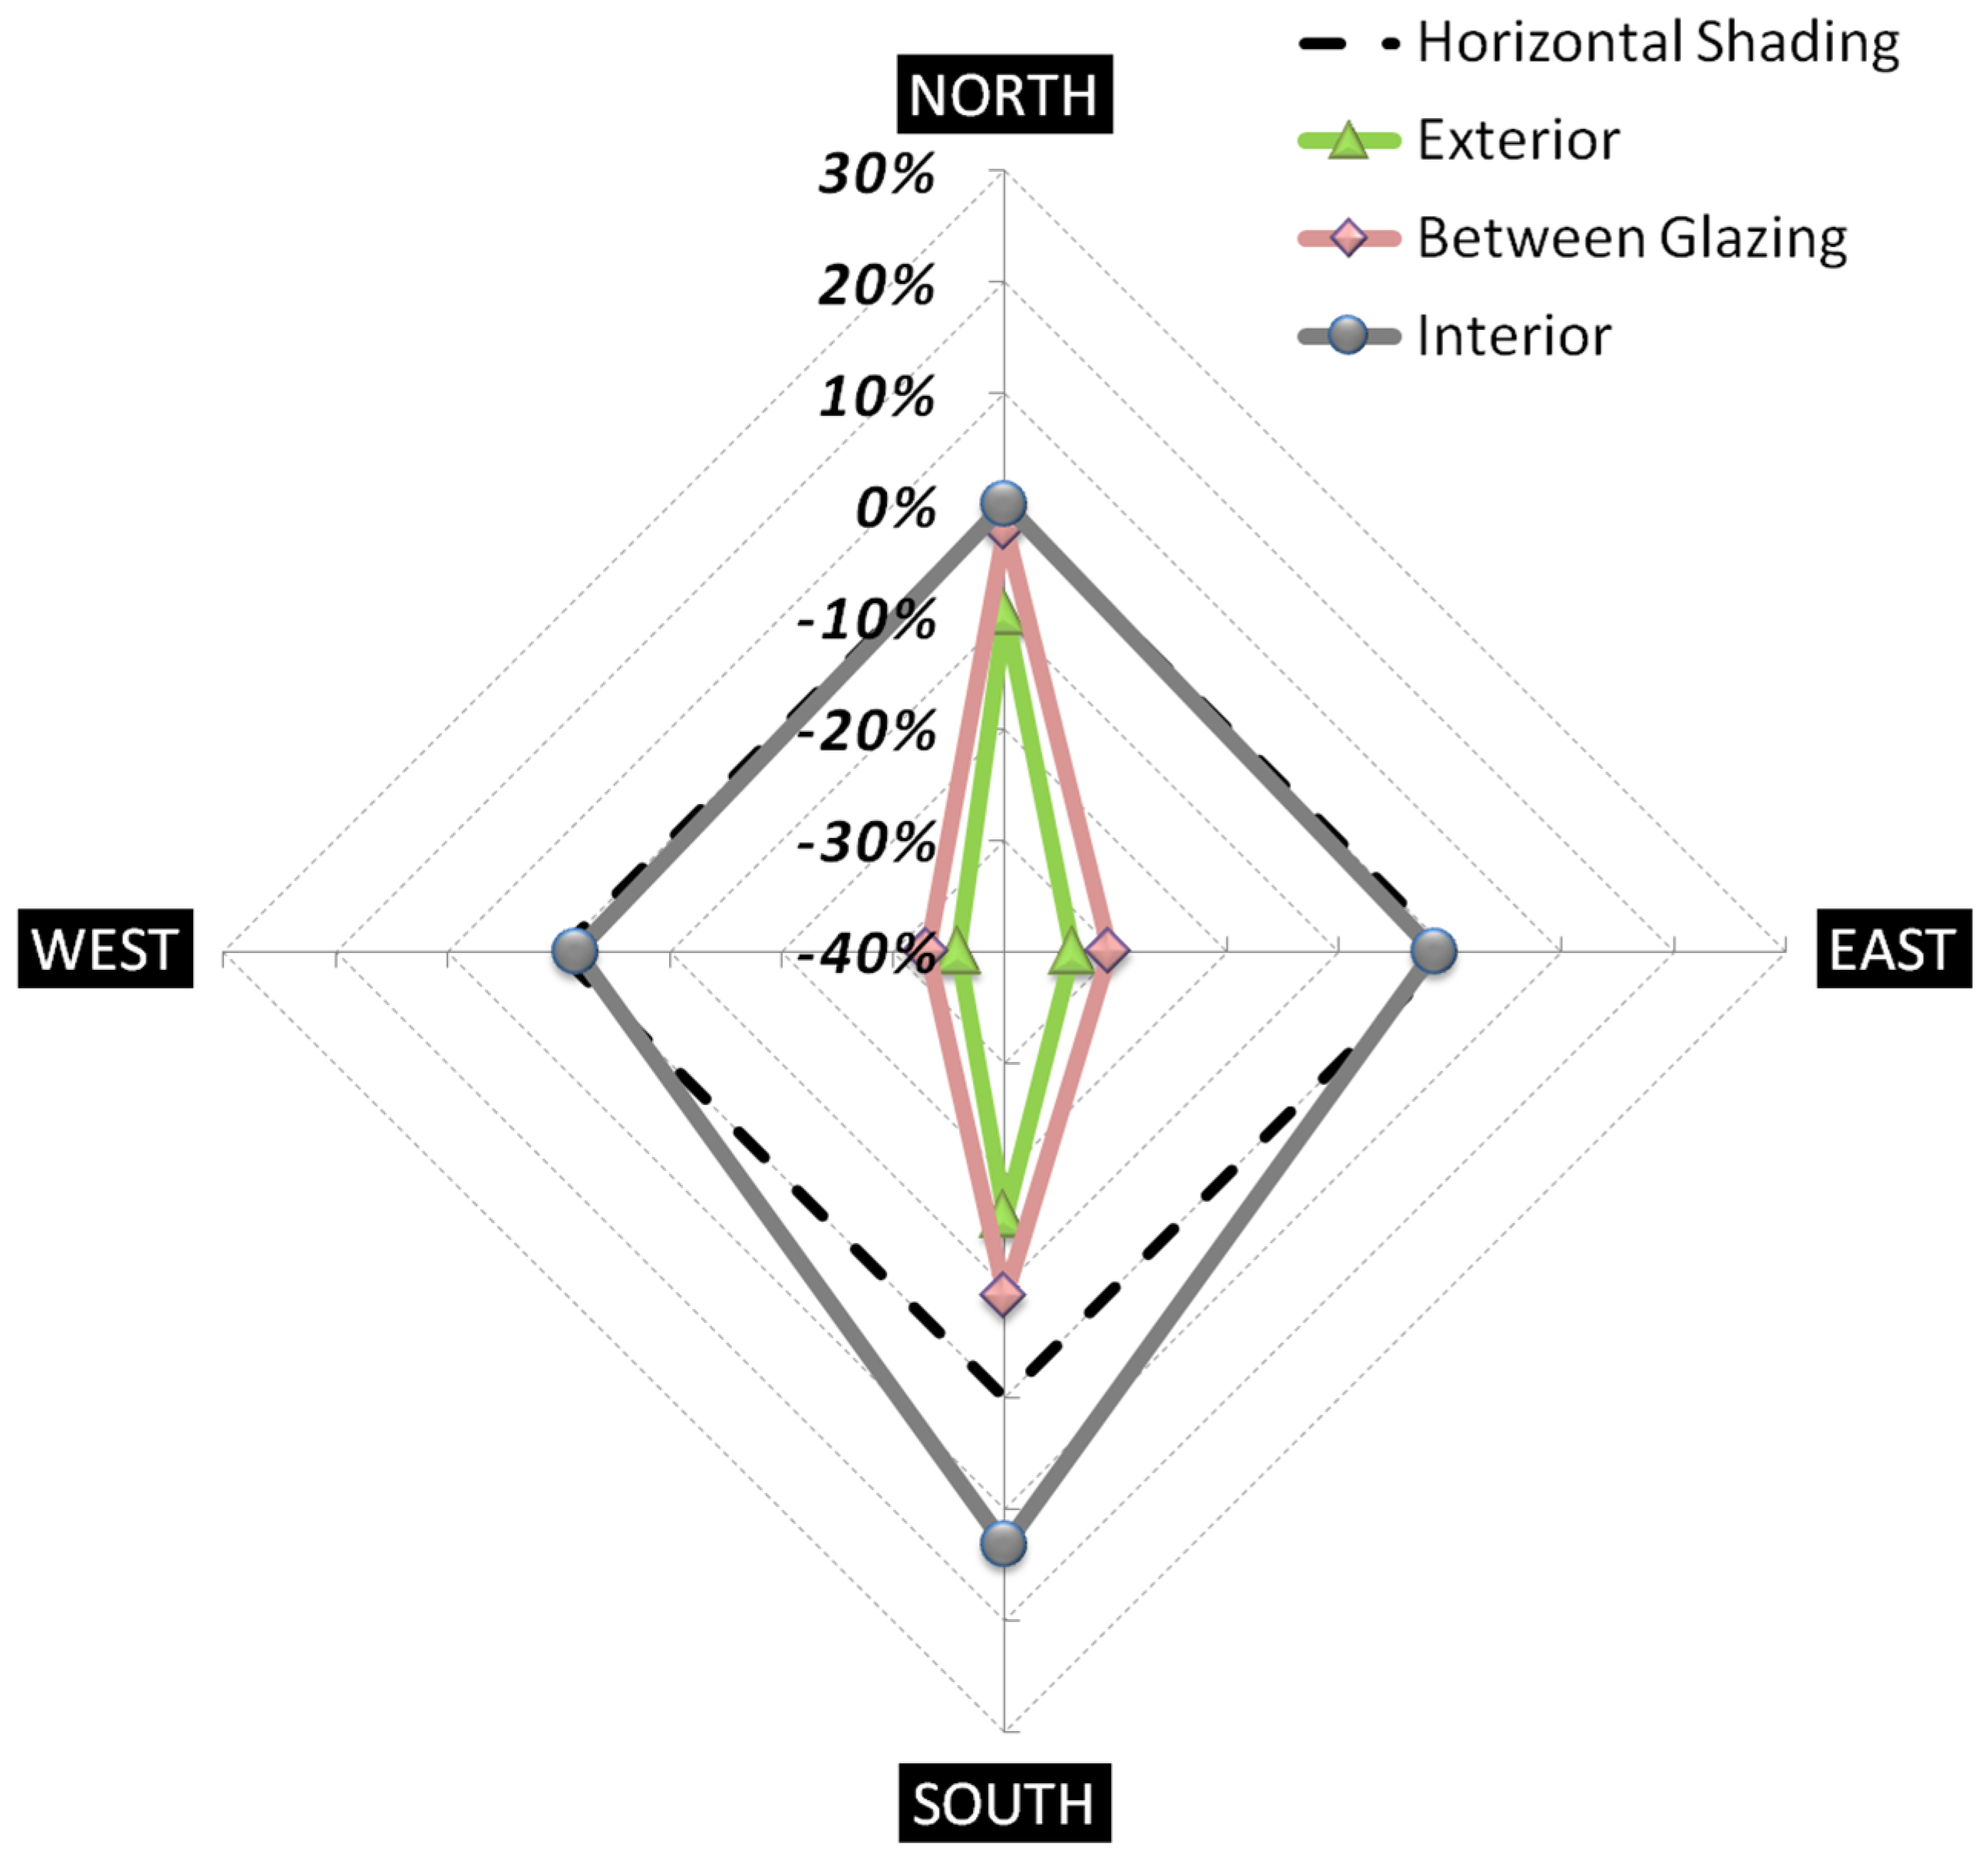
In case of WWR = 60% and SHGC = 0.4, the case of south façade, the energy consumption was decreased by 2% using the exterior venetian blind installation compared to horizontal shading installation. The energy consumption was increased 5% and 18% by between glazing and interior venetian blind installation, respectively, compared to horizontal shading installation. In the case of the east façade, the energy consumption was decreased 20% and 16% by exterior venetian blinds and between glazing venetian blind installation, respectively, compared to horizontal shading installation. The energy consumption was increased 8% by interior venetian blind installation compared to horizontal shading installation. In addition, in the case of the west façade, the energy consumption was decreased 22% and 18% by exterior venetian blinds and between glazing venetian blind installation, respectively, compared to horizontal shading installation. The energy consumption was increased 8% by interior venetian blind installation compared to horizontal shading installation. In the case of the north façade, the energy consumption was decreased 6% by exterior venetian blind installation compared to horizontal shading installation. The energy consumption was increased 1% by between glazing venetian blind installation compared to horizontal shading installation. In the case of interior venetian blind installation, the energy consumption was the same as case of horizontal shading installation.
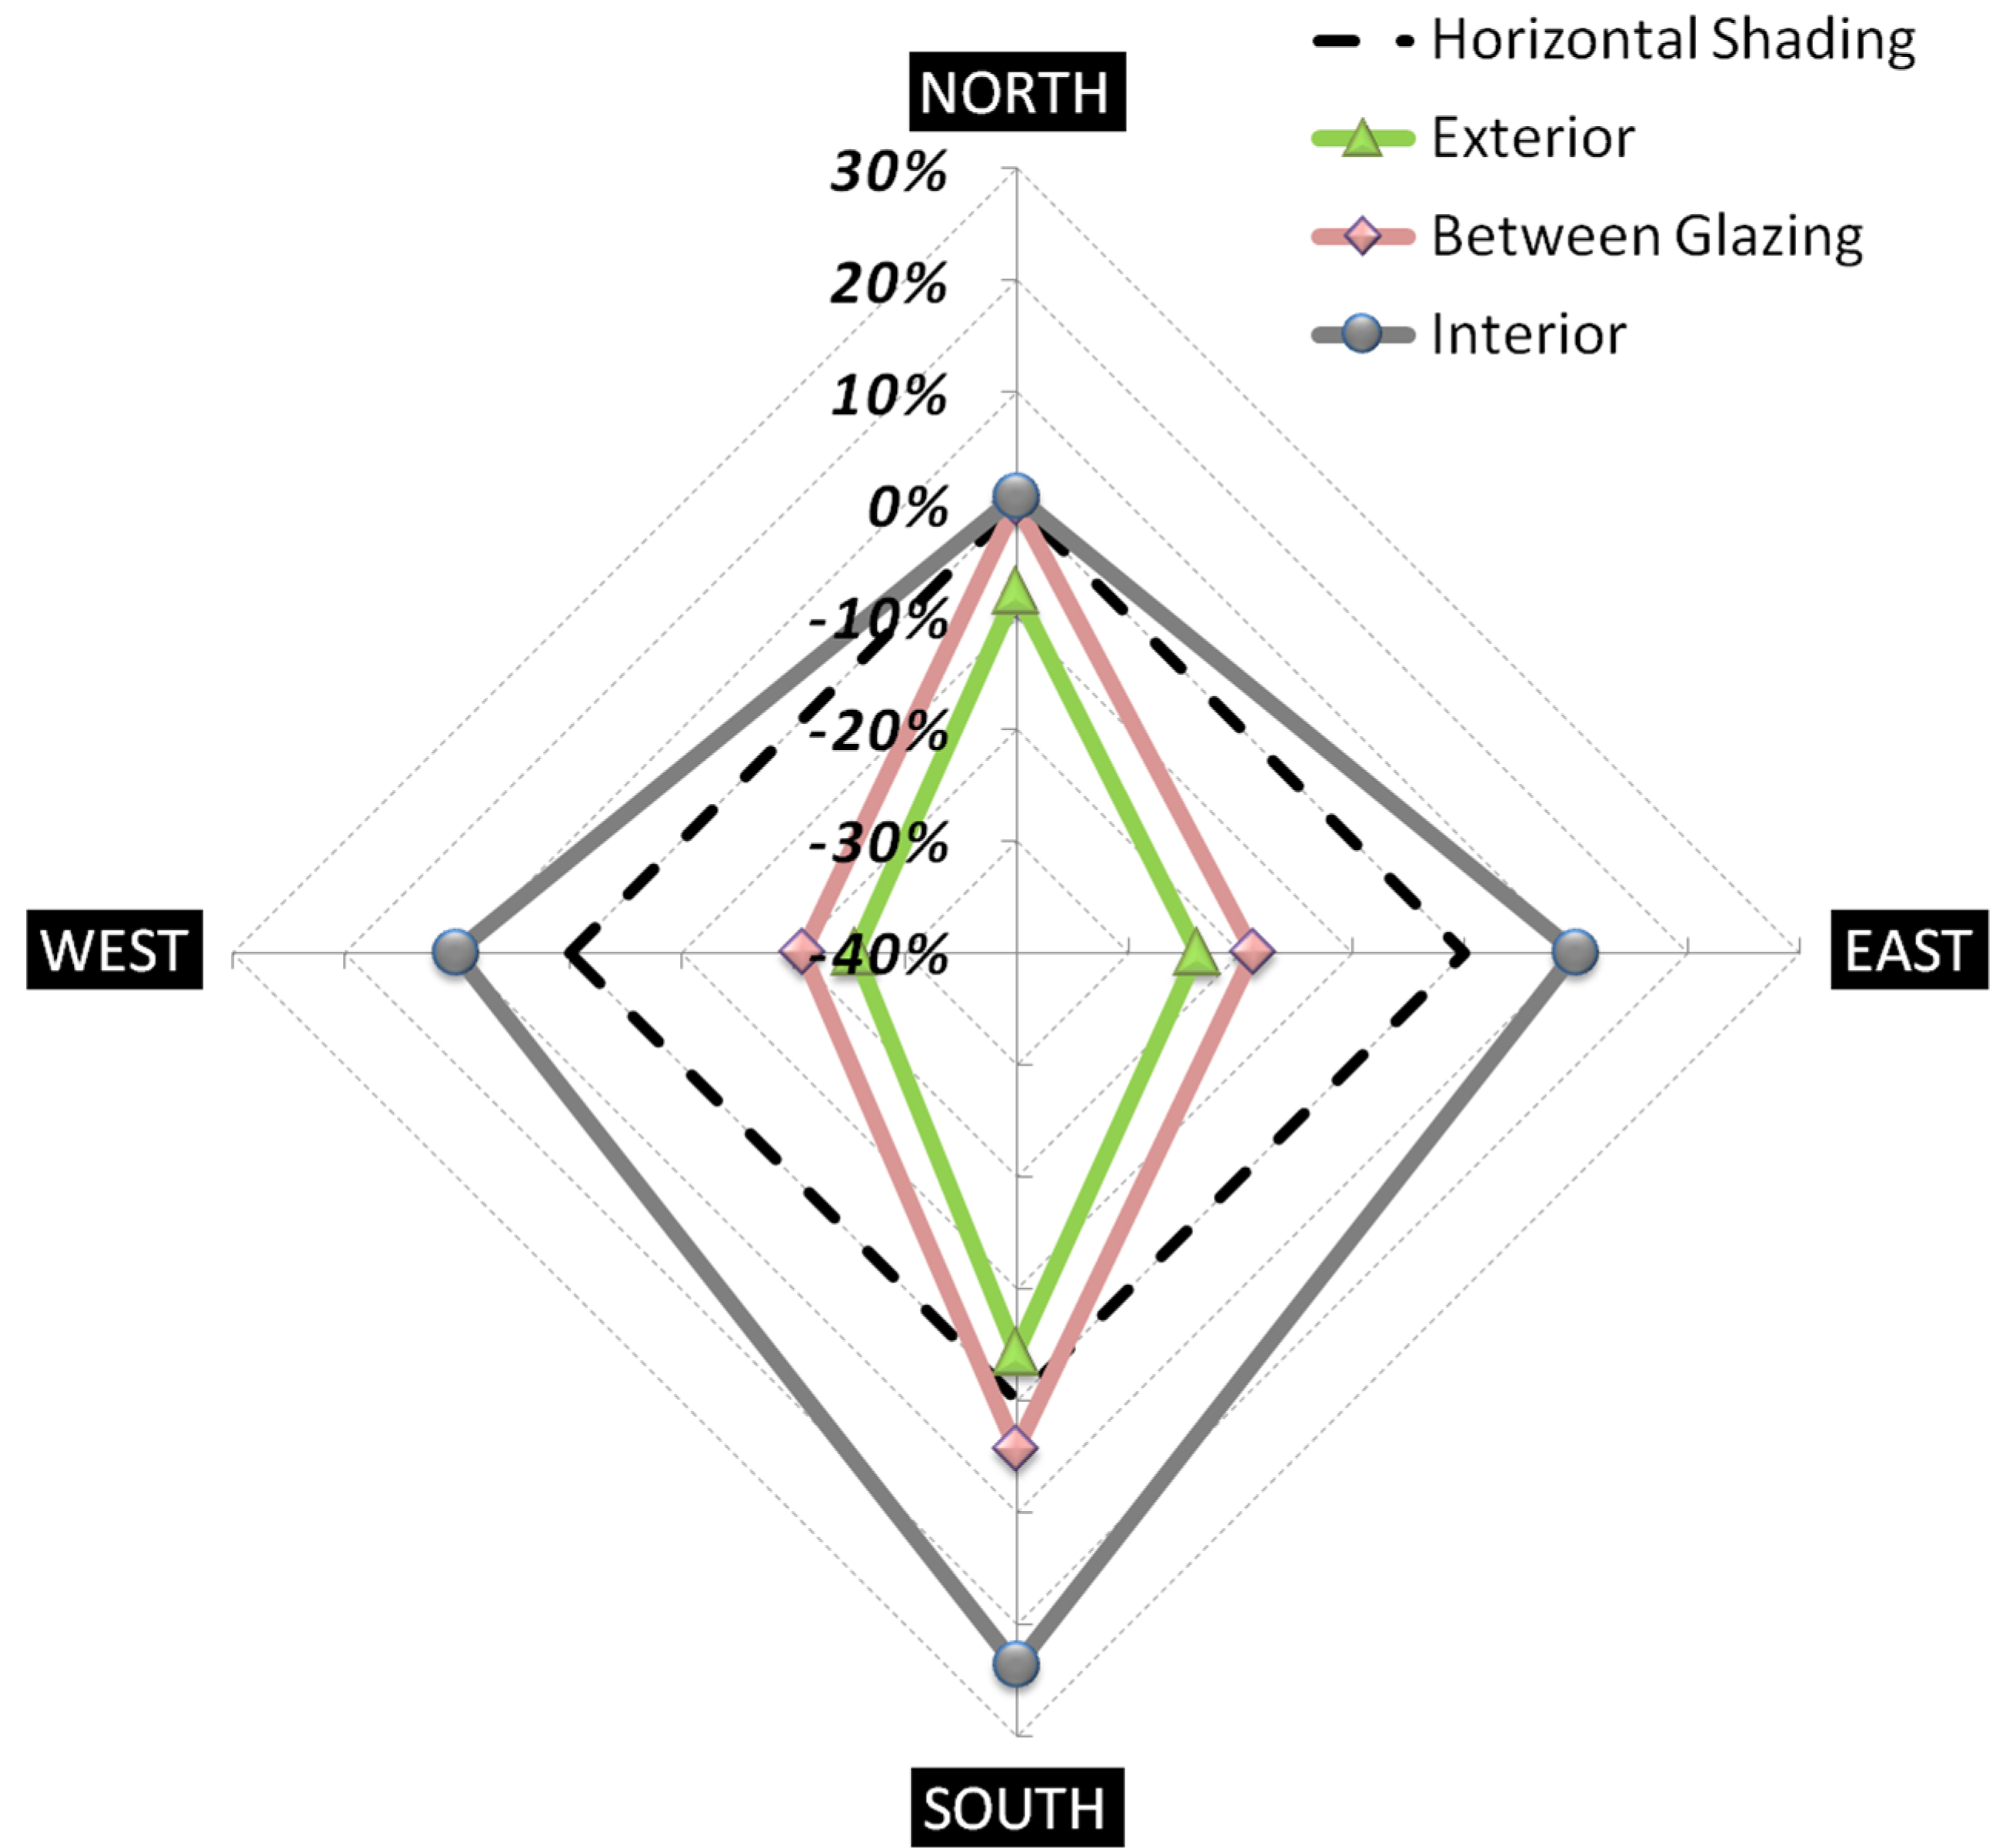
At WWR = 60% and SHGC = 0.6, in the case of the south façade, the energy consumption was decreased 11% and 5% by exterior venetian blind and between glazing venetian blind installation compared to horizontal shading installation. The energy consumption was increased 11% by interior venetian blind installation compared to horizontal shading installation. In the case of the east façade, the energy consumption was decreased 29%, 26% and 1% by exterior venetian blind, between glazing venetian blind and interior venetian blind installation, respectively, compared to horizontal shading installation. In addition, in the case of the west façade, the energy consumption was decreased 31%, 28% and 2% by exterior venetian blind, between glazing venetian blind and interior venetian blind installation, respectively, compared to horizontal shading installation. In the case of the north façade, the energy consumption was decreased 7% and 2% by exterior venetian blind and between glazing venetian blind installation, respectively, compared to horizontal shading installation. In the case of interior venetian blind installation, the energy consumption was the same as that of horizontal shading installation.
At WWR = 80% and SHGC = 0.4, in the case of the south façade, the energy consumption was decreased 4% by exterior venetian blind installation compared to the case of horizontal shading installation. The energy consumption was increased 4% and 24% by between glazing and interior venetian blind installation, respectively, compared to horizontal shading installation. In the case of the east façade, the energy consumption was decreased 24% and 19% by exterior venetian blind and between glazing venetian blind installation, respectively, compared to horizontal shading installation. The energy consumption was increased 10% by interior venetian blind installation compared to horizontal shading installation. In the case of the west façade, the energy consumption was decreased 26% and 21% by exterior venetian blind and between glazing venetian blind installation, respectively, compared to horizontal shading installation. The energy consumption was increased 10% by interior venetian blind installation compared to horizontal shading installation. In the case of the north façade, the energy consumption was decreased 8% by exterior venetian blind installation compared to horizontal shading installation. In the case of between glazing venetian blind installation, the energy consumption was the same as that of horizontal shading installation. On the other hand, the energy consumption was increased 1% by interior venetian blind installation compared to horizontal shading installation.
At WWR = 80% and SHGC = 0.6, in the case of the south façade, the energy consumption was decreased 16% and 9% by exterior venetian blind and between glazing venetian blind installation, respectively, compared to horizontal shading installation. The energy consumption was increased 13% by interior venetian blind installation compared to horizontal shading installation. In the case of the east façade, the energy consumption was decreased 34%, 31% and 2% by exterior venetian blind, between glazing venetian blind and interior venetian blind installation, respectively, compared to horizontal shading installation. In the case of the west façade, the energy consumption was decreased 36%, 33% and 2% by exterior venetian blind, between glazing venetian blind and interior venetian blind installation, respectively, compared to horizontal shading installation. In the case of the north façade, the energy consumption was decreased 10% and 2% by exterior venetian blind and between glazing venetian blind installation, respectively compared to horizontal shading installation. In the case of interior venetian blind installation, the energy consumption was the same as that of horizontal shading installation.
Figure 10,
Figure 11,
Figure 12 and
Figure 13 shows the saving ratio of heating and cooling energy consumption according to the type of shading. The result of the simulation showed generally low energy consumption in the case of the south façade. In the case of the north façade, the simulation showed little change. At WWR = 80% and SHGC = 0.6, the heating energy consumption was increased 11%–170% by exterior venetian blinds compared to horizontal shading. At WWR = 60% and SHGC = 0.4, the heating energy consumption was increased 8%–161% by exterior venetian blinds compared to horizontal shading. That reason for this is that venetian blinds tended to block more solar radiation in the winter season than horizontal shading.
Figure 10.
Saving ratio of heating and cooling load according to the type of shading (WWR 60%, U-value: 2.1, SHGC: 0.4).
Figure 10.
Saving ratio of heating and cooling load according to the type of shading (WWR 60%, U-value: 2.1, SHGC: 0.4).
Figure 11.
Saving ratio of heating and cooling load according to the type of shading (WWR 60%, U-value: 2.1, SHGC: 0.6).
Figure 11.
Saving ratio of heating and cooling load according to the type of shading (WWR 60%, U-value: 2.1, SHGC: 0.6).
Figure 12.
Saving ratio of the heating and cooling load according to the type of shading (WWR 80%, U-value: 2.1, SHGC: 0.4).
Figure 12.
Saving ratio of the heating and cooling load according to the type of shading (WWR 80%, U-value: 2.1, SHGC: 0.4).
Figure 13.
Saving ratio of the heating and cooling load according to the type of shading (WWR 80%, U-value: 2.1, SHGC: 0.6).
Figure 13.
Saving ratio of the heating and cooling load according to the type of shading (WWR 80%, U-value: 2.1, SHGC: 0.6).
In the case of the south façade, the interior venetian blind resulted in higher heating and cooling energy consumption because the heating load was increased by blocked solar radiation in winter. At WWR = 80%, the exterior venetian blind saved 4%–36% of the heating and cooling load than the horizontal shading. This means that the exterior venetian blind was more efficient at saving energy than horizontal shading in a large WWR. In the case of the east and west façades, the exterior venetian blinds and between glazing venetian blinds improved energy consumption compared to horizontal shading. The maximum saving ratio was 36% at WWR = 80%, exterior venetian blind and west façade. In the case of the east and west façades, the exterior venetian blind and between glazing venetian blind is more efficient than horizontal shading. Shading the north façade had little or no effect on heating and cooling load regardless of the type of shading.
5. Conclusions
This study confirmed the annual heating and cooling load of a standard building by simulation modeling. The results of this study are as follows:
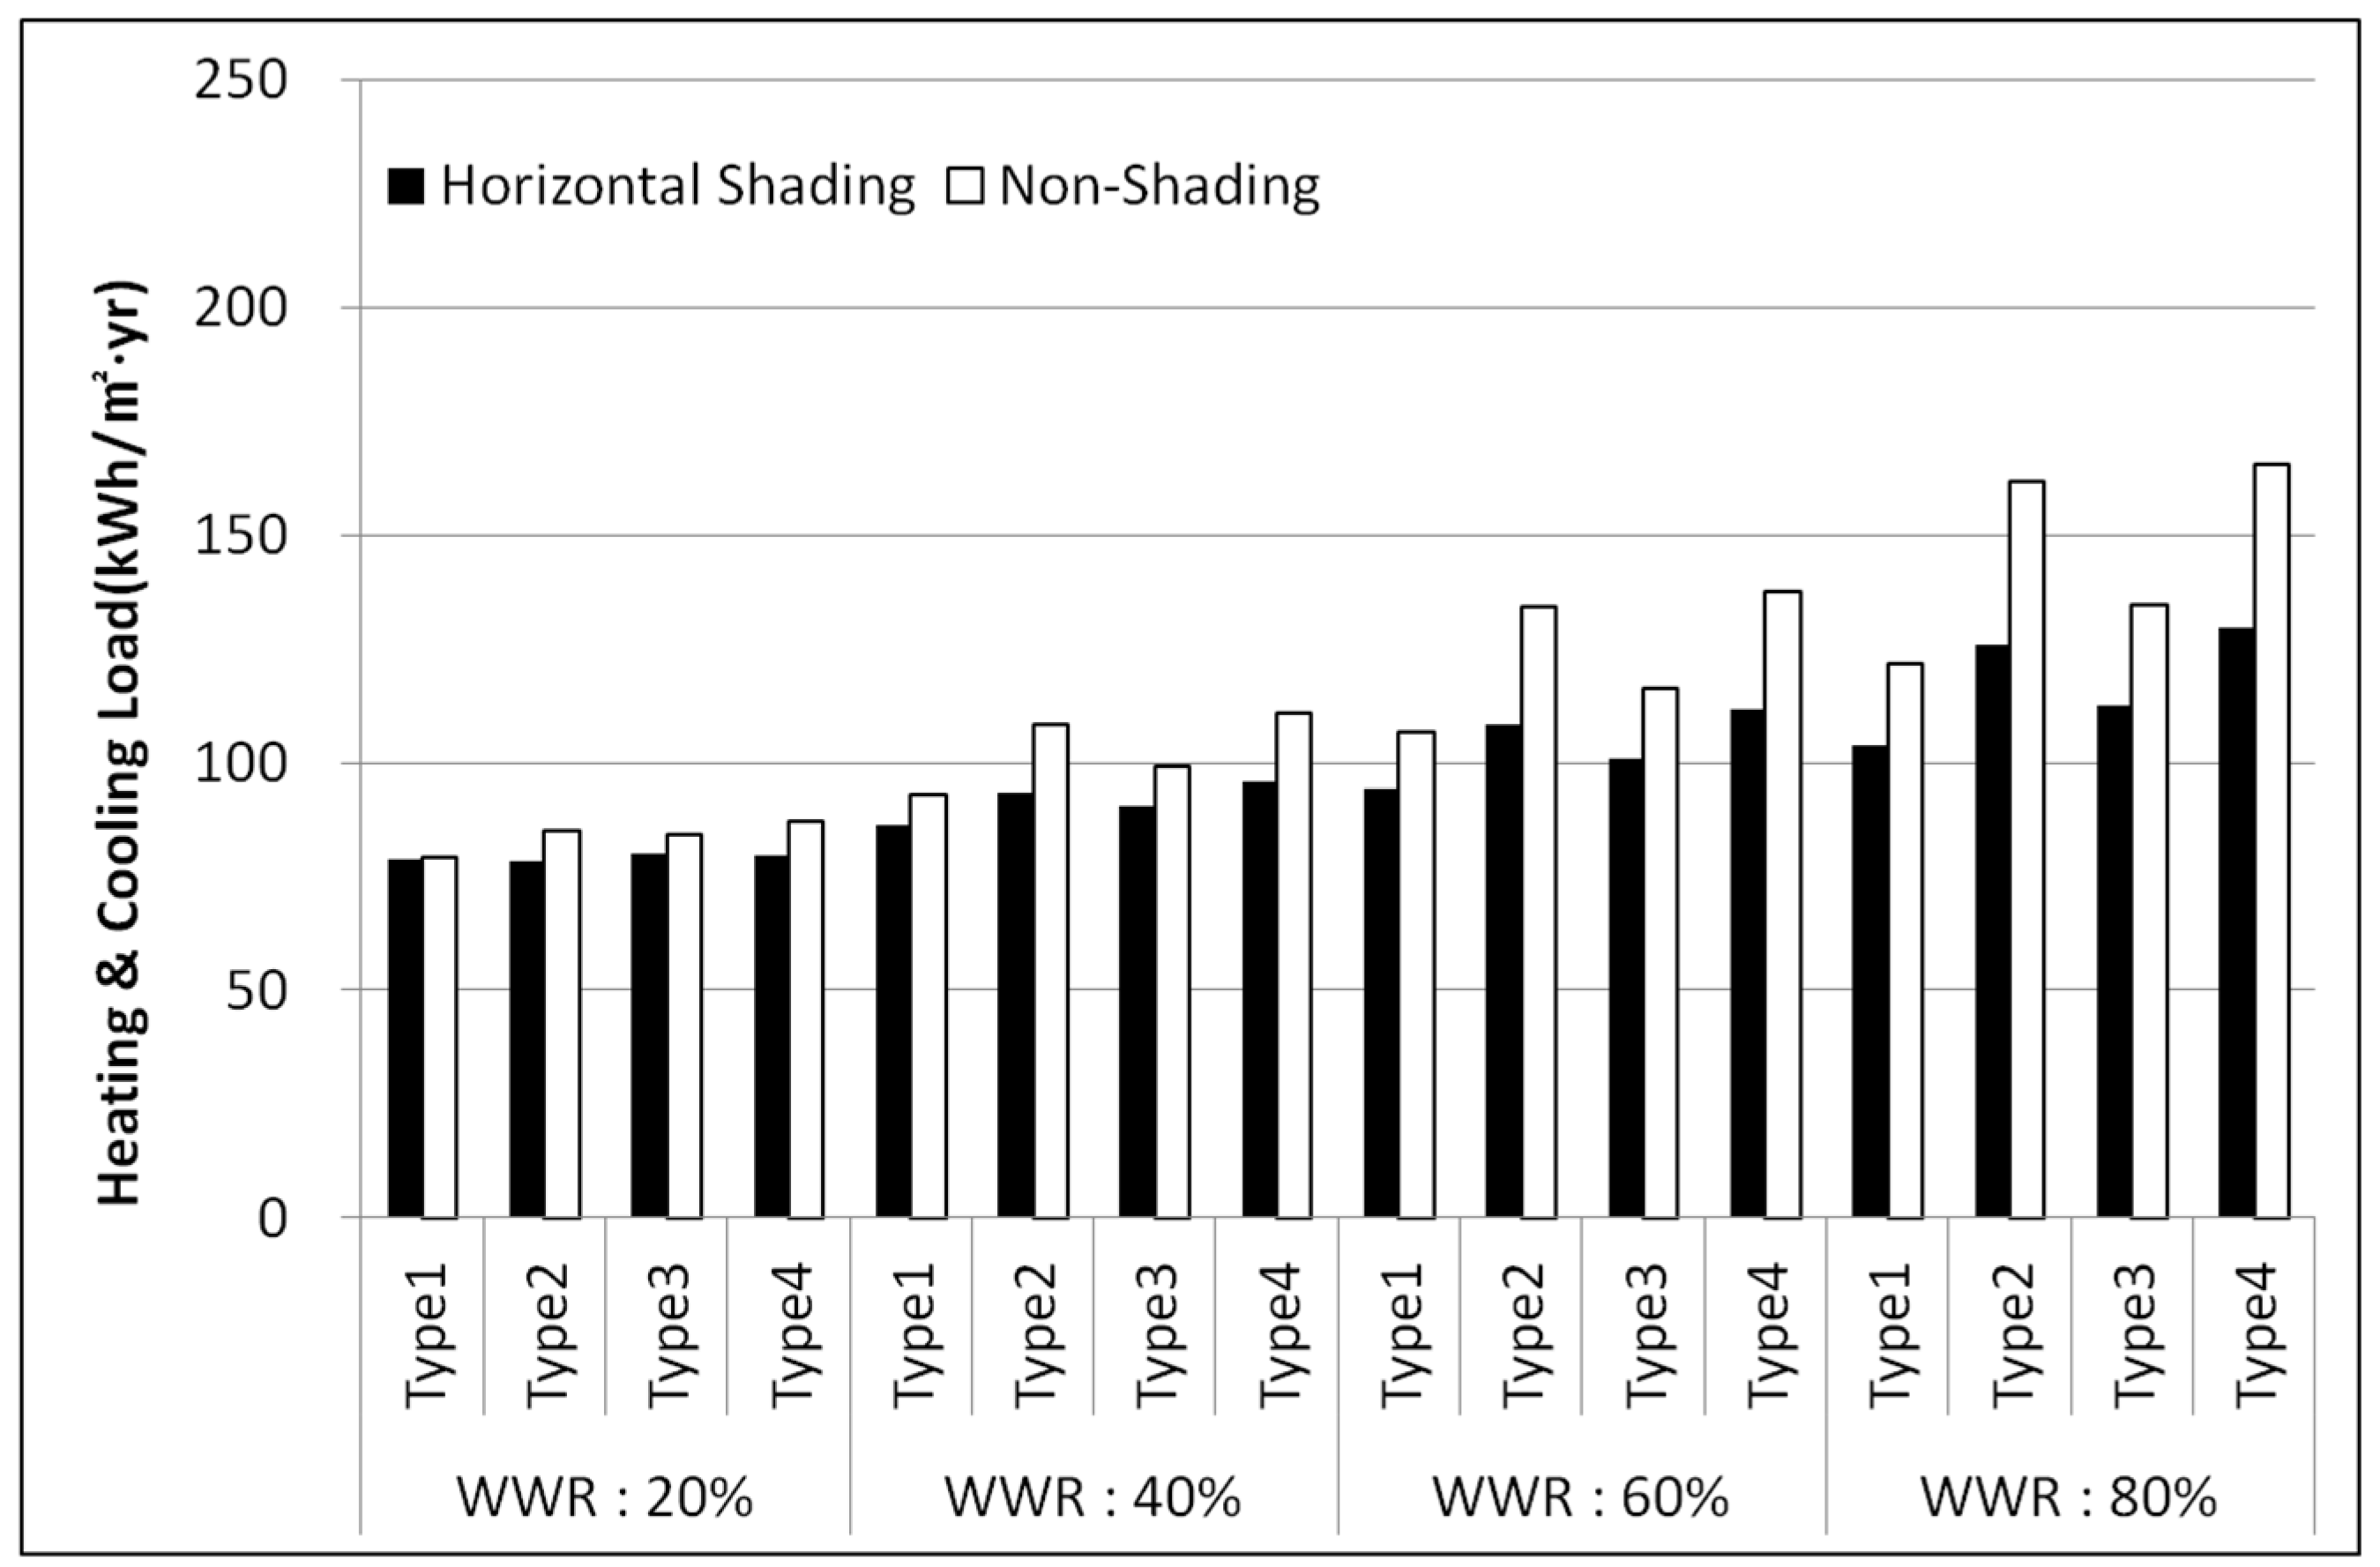
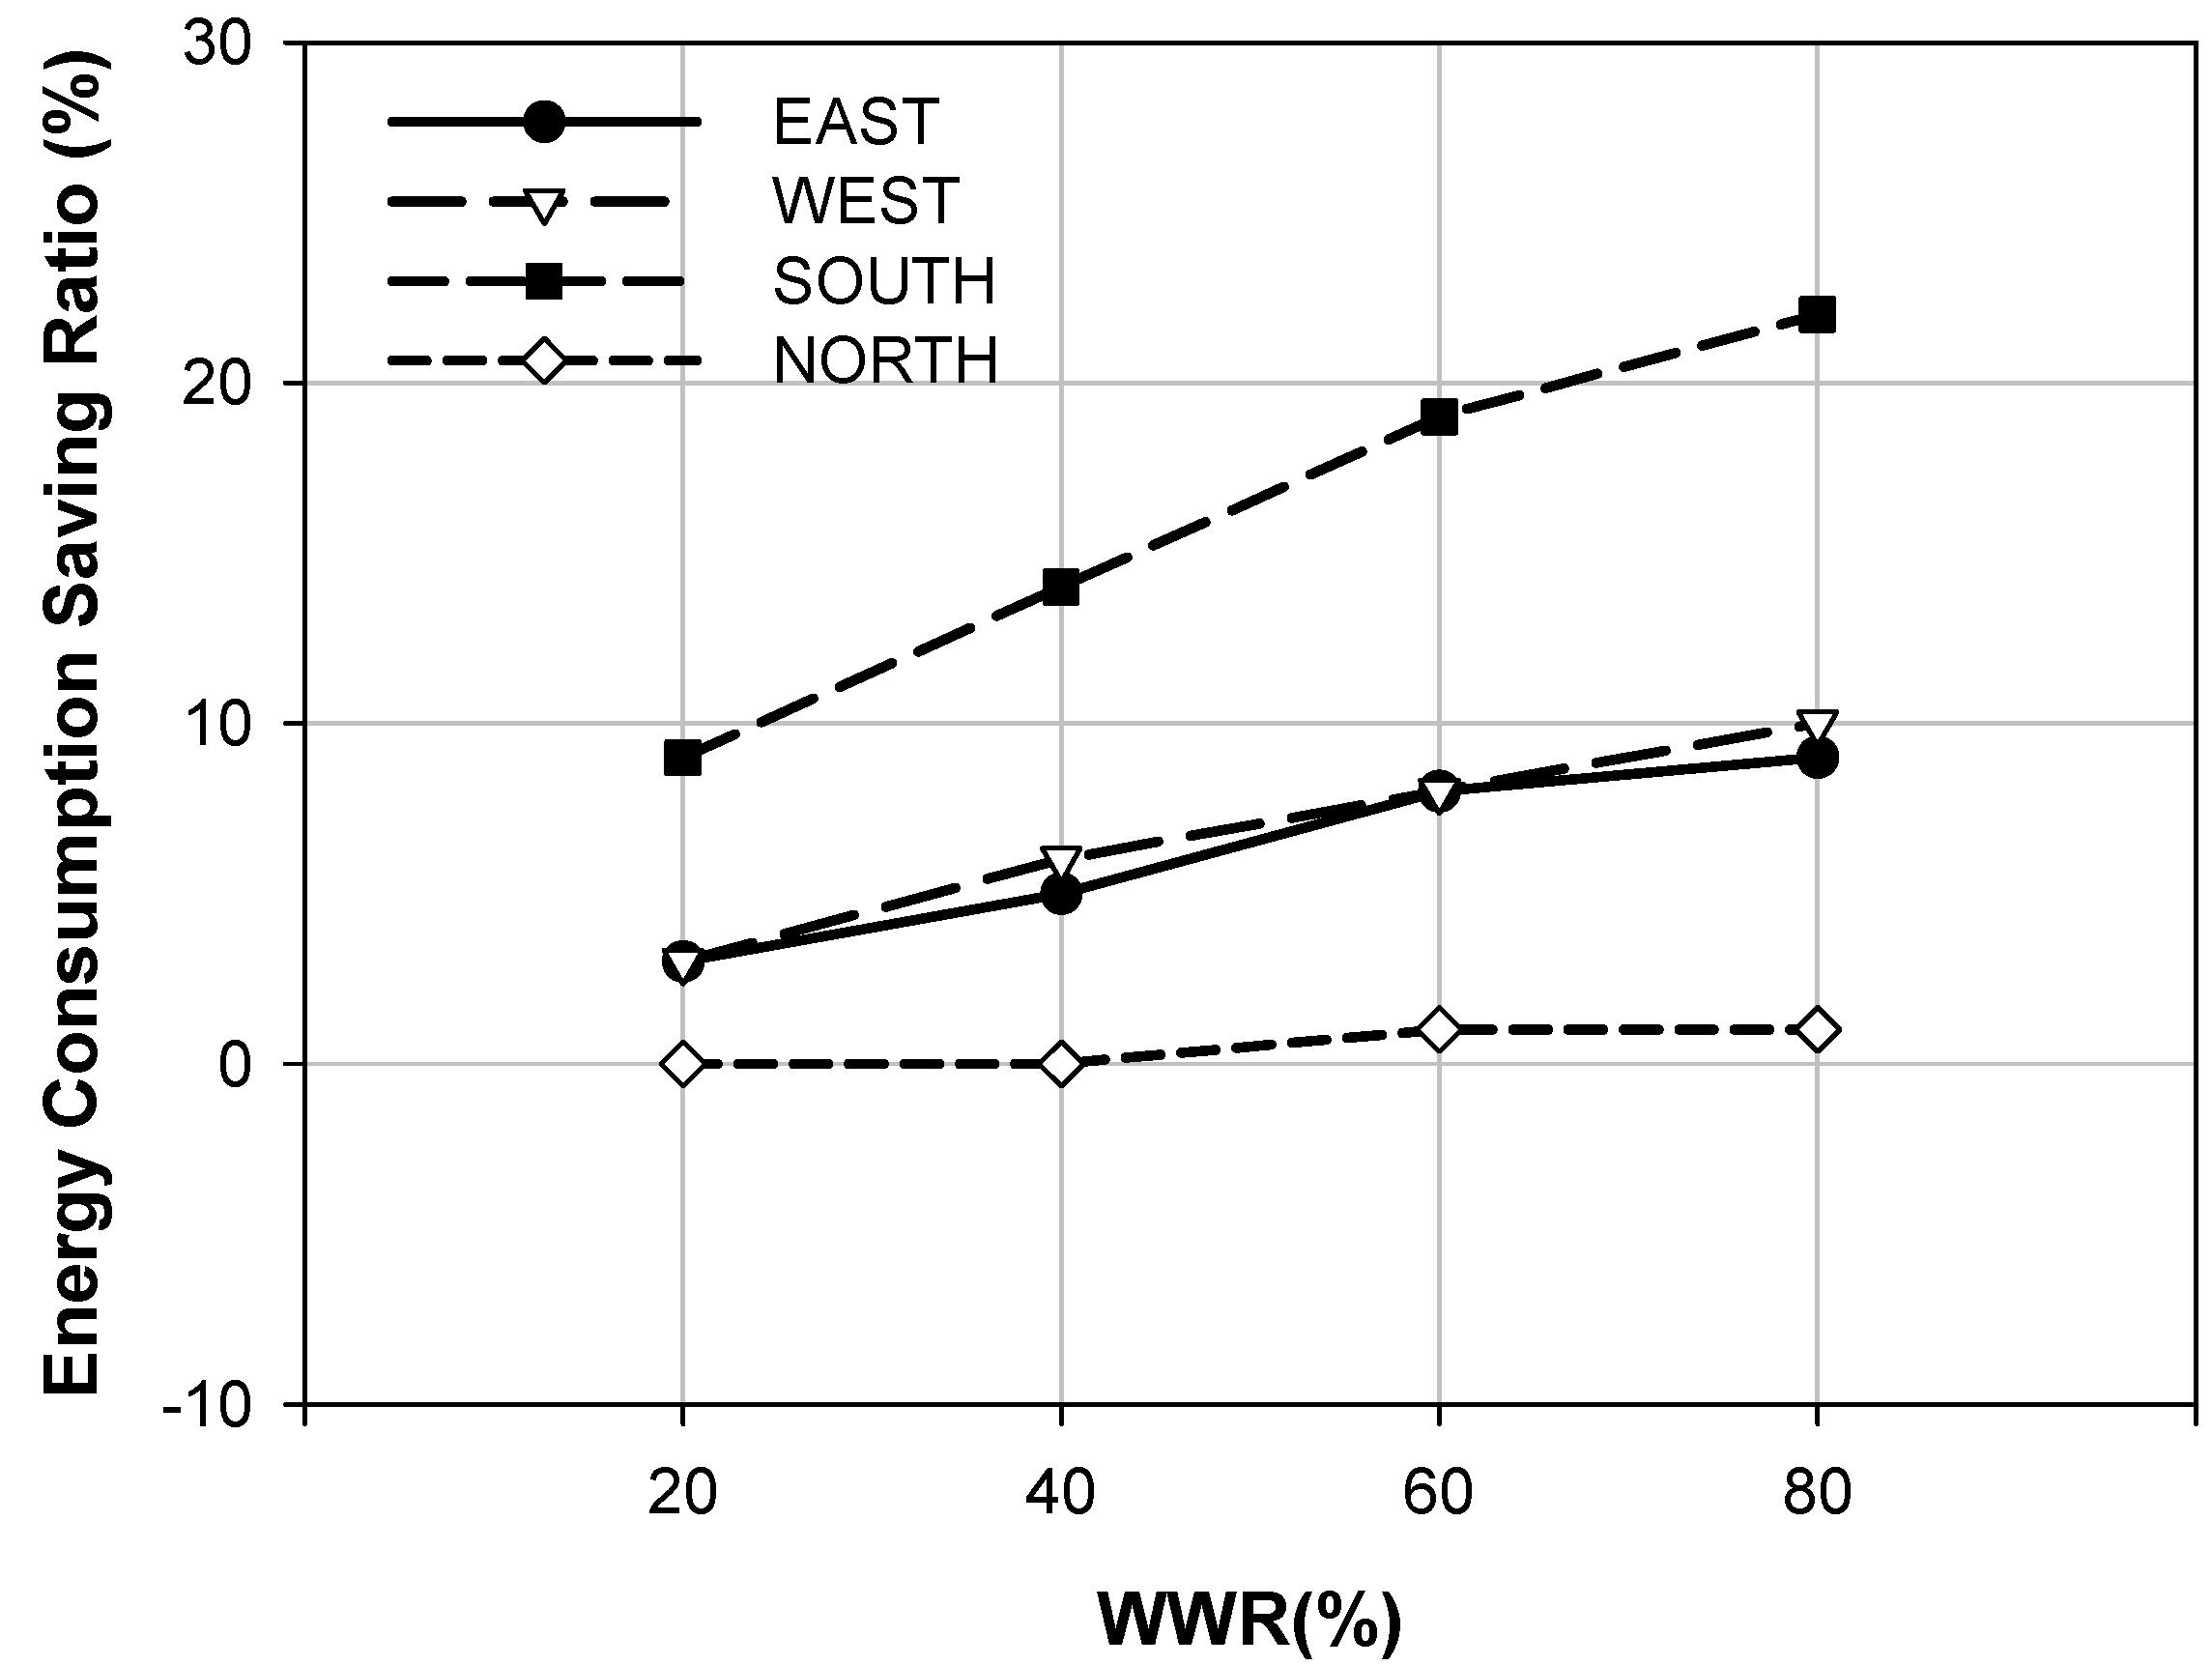
(1) In the case of horizontal shading installation, the heating and cooling load was lower than the case of no shading. The decrease in the heating and cooling load was most efficient in the south façade. Horizontal shading installation reduced the heating and cooling load by a maximum of 22% in the case of type 4 and WWR = 80%.
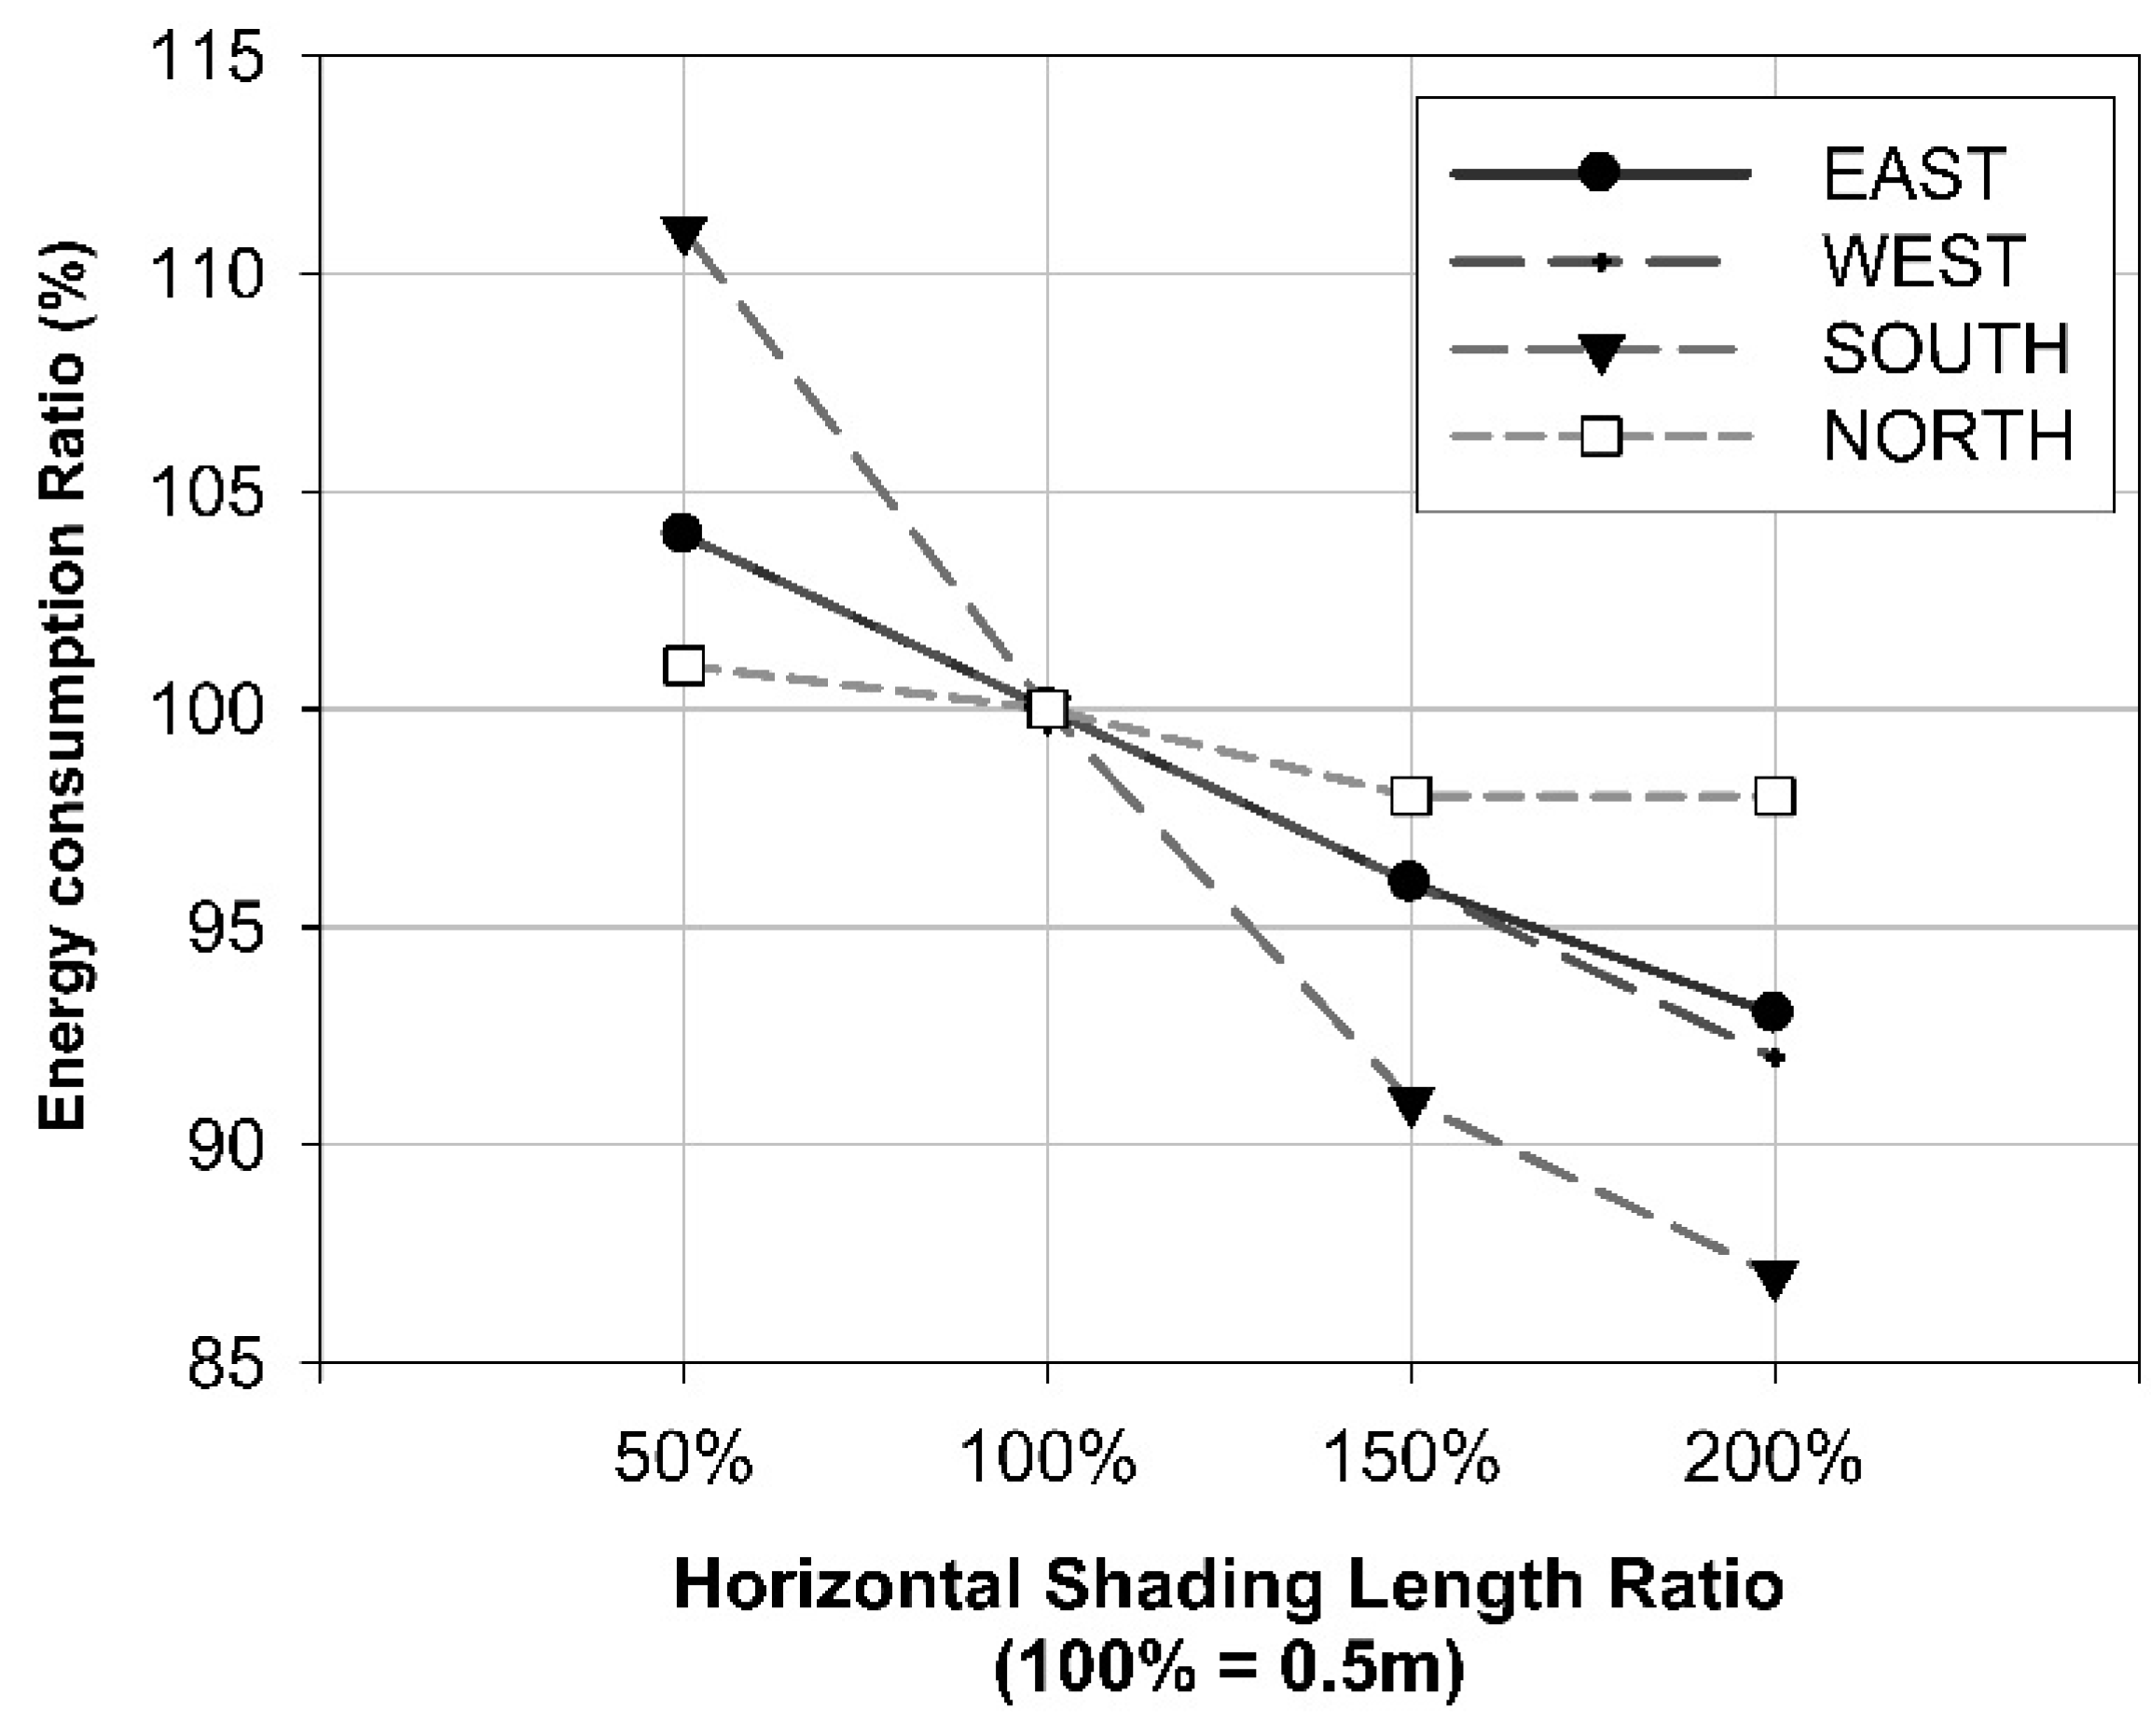
(2) Extended horizontal shading (1 m) compared to the regulation level (0.5 m) reduced the heating and cooling load. In the case of extending the length of horizontal shading, the south façade showed a maximum 13% decrease in heating and cooling load.
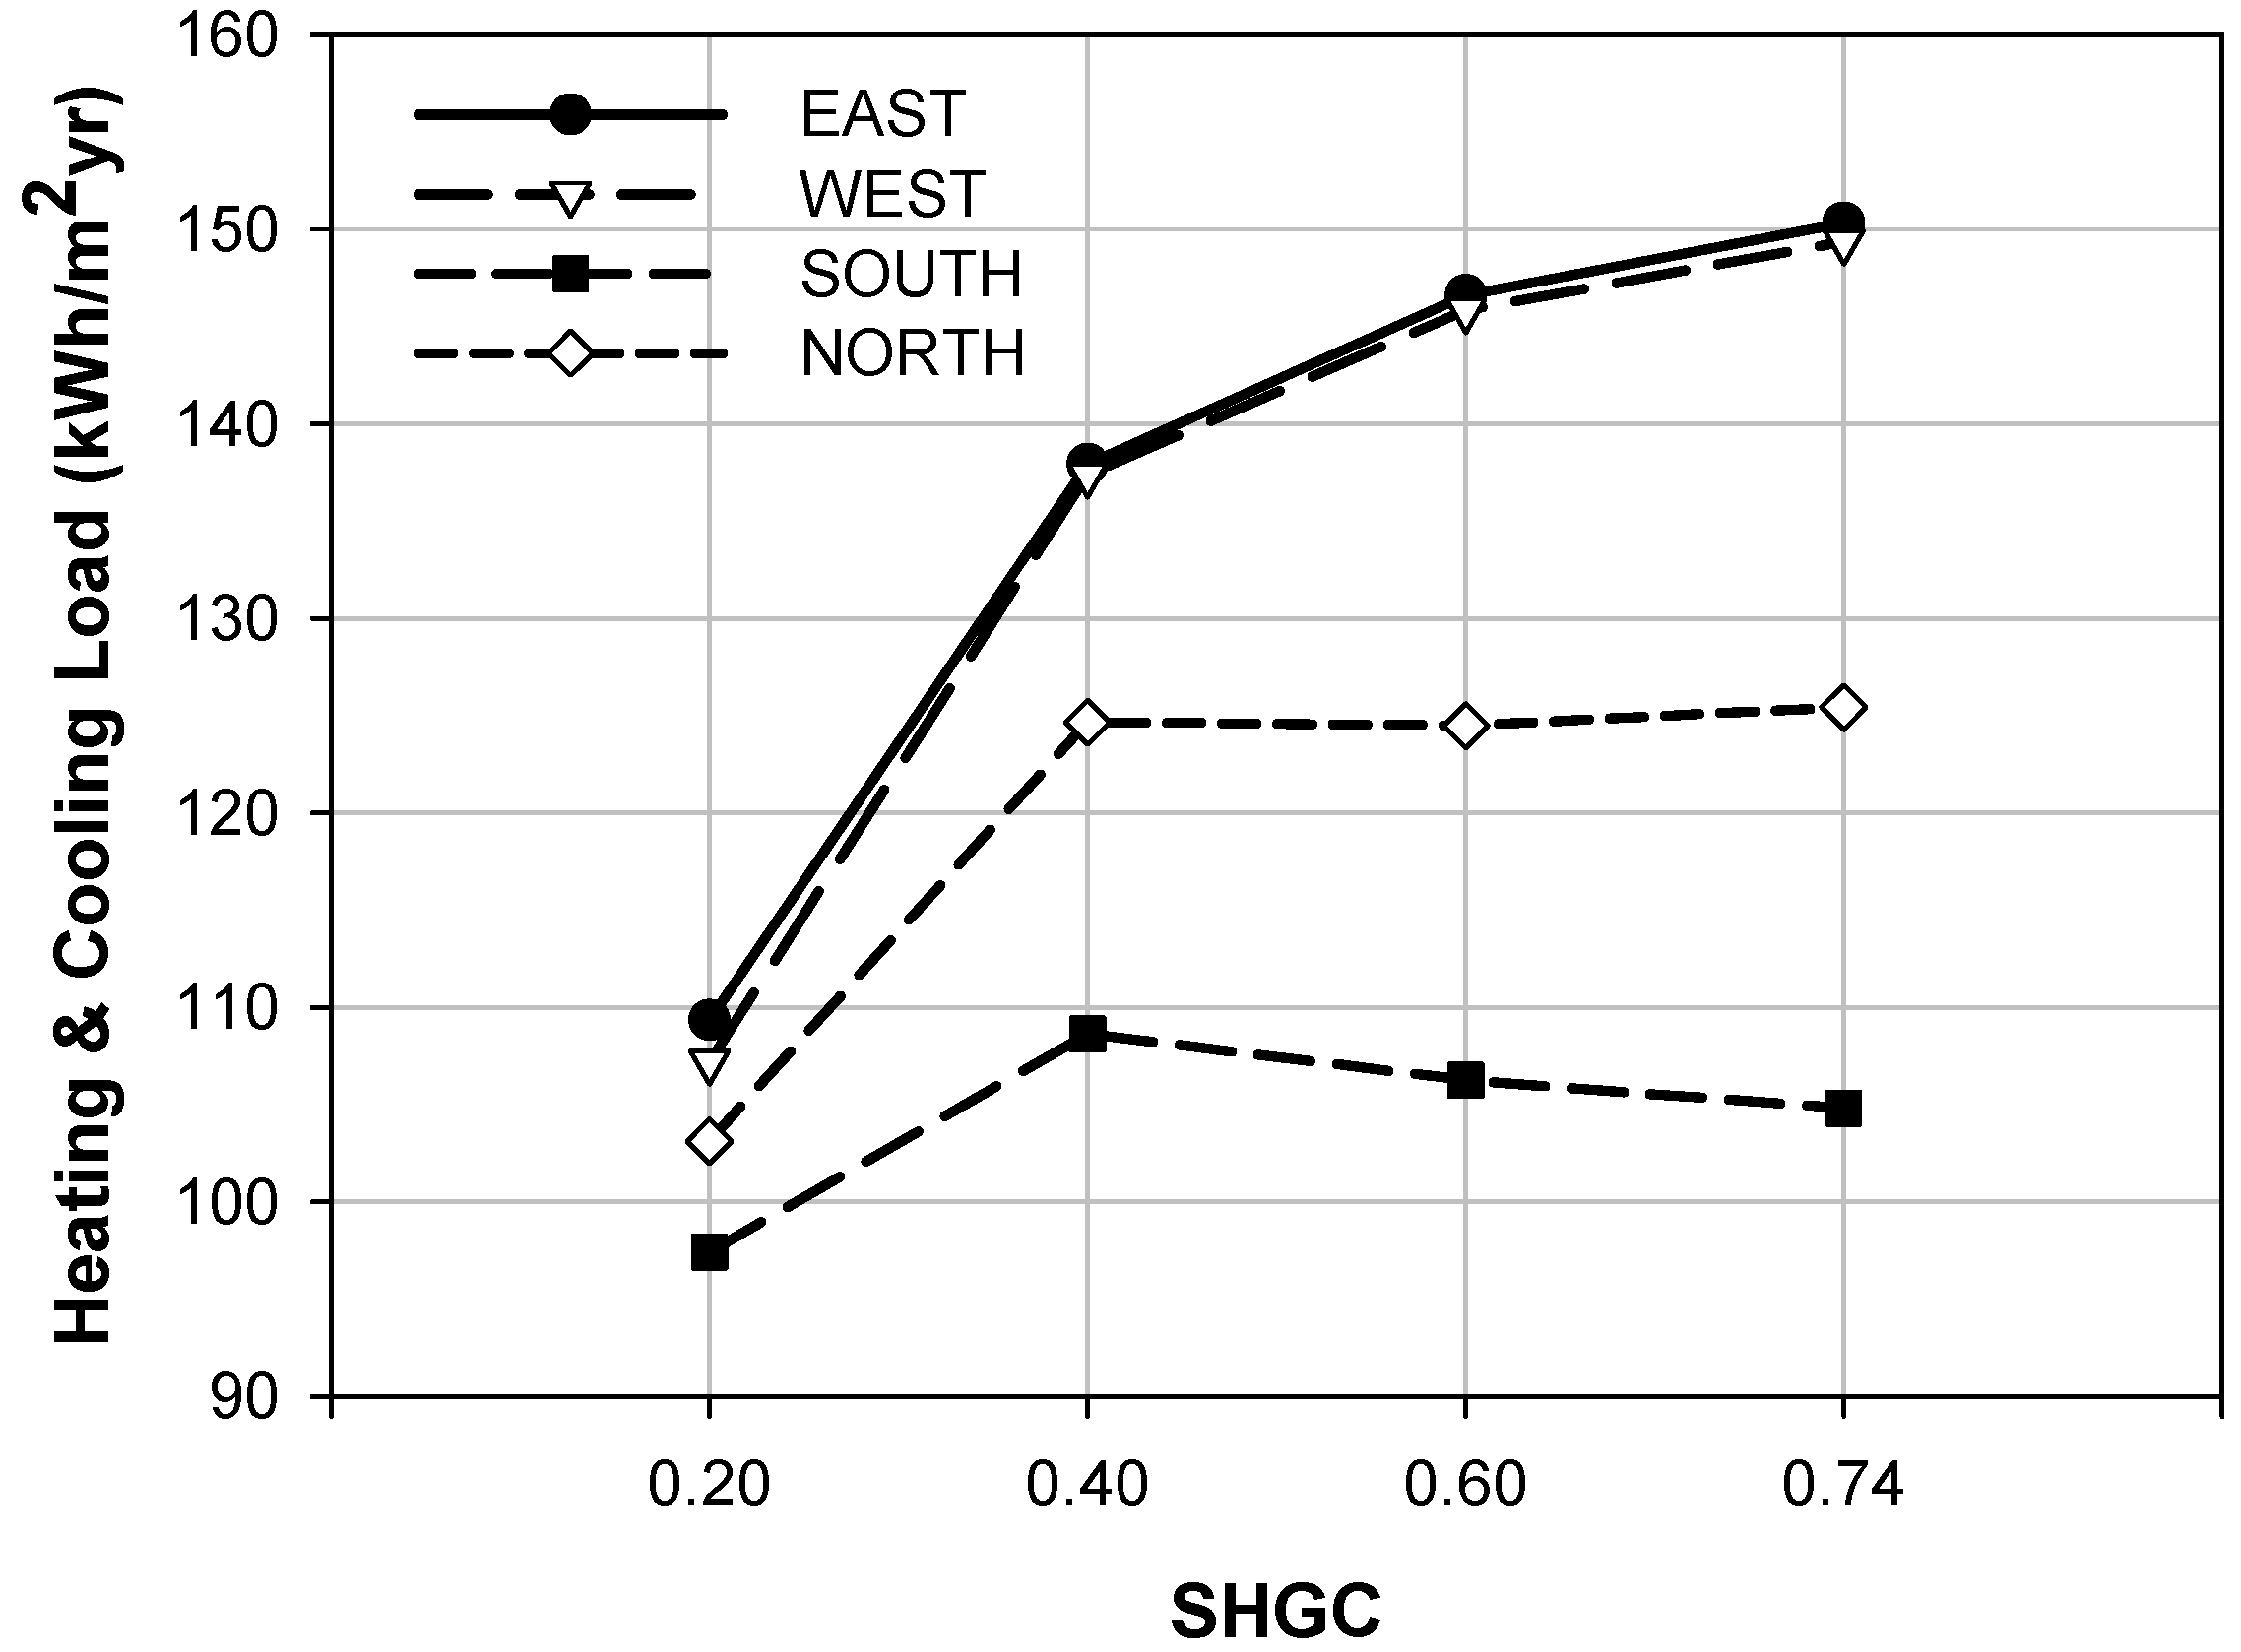
(3) This study confirmed the variation of heating and cooling load by the variation of the SHGC. In case of the south and north façades, the heating and cooling load was decreased at SHGC = 0.4. This means that the high SHGC and horizontal shading is more efficient in energy savings than the case of a low SHGC and horizontal shading.
(4) A comparison of horizontal shading with various venetian blind types showed that in the case of the west façade, the energy consumption was decreased 36% by exterior venetian blind installation compared to the case of horizontal shading installation.
The exterior venetian blinds and between glazing were unaffected by the SHGC. The exterior venetian blind was more effective in reducing the heating and cooling load than horizontal shading. In addition, the heating and cooling load of the interior venetian blind was higher than that of horizontal shading. From the results of this study, our next study will develop indicators and guidelines for the shading choice. These indicators or the guidelines for the shading design will be proposed to a designer.


