1. Introduction
The use of coal remains dominant in electricity generation in China, the world’s largest producer and consumer of coal [
1]. A major reason for coal’s domination of Chinese production and consumption is its low market price. China’s rapid economic growth is heavily dependent on cheap energy, with over 70% of its energy needs met by coal. Coal-fired power plants generate 78.6% of China’s electricity [
2]. However, this apparently cheap fuel has grave repercussions, as reliance on coal comes with heavy environmental and social costs. Every step in the process of coal-fired power generation, from mining to combustion, causes severe damage to China’s environment. The low price of electricity accounts for just a fraction of its true total costs; in fact, society pays the external costs of mining and burning coal. The burning of coal emits sulfur and nitrogen oxides (causing acid rain), particulates, mercury and other toxic metals [
3]. Moreover, the mining of coal injures and kills workers.
In China, biomass is an alternative energy to coal. Particularly in Northeast China, crop straw is an attractive alternative for two reasons. First, it is abundant in this region. The total crop straw production is approximately 96,283,700 tons [
4,
5,
6], which can produce 77,026,880,000 kWh of electricity (based on a case study in Wangkui, the crop straw electricity generation rate in 2014 was 800 kWh/ton). This quantity of electricity would meet 30.53% of Northeast China’s demand [
2]. Second, power generation using the renewable energy source of crop straw poses far fewer risks to national security, the economy, the environment and public health. Therefore, biomass power generation, particularly power generation using crop straw, has great potential and could replace many coal-fired power plants in Northeast China.
Currently, however, there are only five large biomass power plants (installed capacity ≥ 25 MW) in Northeast China. Barriers persist in promoting their development, such as in the collection of crop straw and technological innovation. Some biomass power plants have already gone bankrupt or switched to other industries. Compared with investors in coal-fired power plants using cheap coal, biomass power plant investors obtain considerably smaller profits. Without government subsidies, biomass power plants cannot survive.
The authors believe that a fundamental reason for the low popularity of biomass and corn straw power plants is the inaccurate perception of the external costs associated with coal-fired and biomass power generation. Most people, particularly policy makers, are aware of the sacrifices that are made to generate electricity with coal-fired power. However, the external costs, including environmental and social costs, are invisible in the short term. There is a strong possibility that the external costs associated with coal-fired power plants are undervalued. Therefore, biomass power plants are perceived as much less attractive than coal-fired power plants.
This study has three objectives: (1) to accurately estimate the external costs of coal-fired and biomass power generation in Northeast China; (2) to compare the two types of power generation plants with per kWh; (3) to discuss policy implications on the basis of the results of this comparison.
2. Literature Review
Life cycle costing can be tracked back to the literature reviews on neoclassical welfare economics. There are two highly influential works, Pigou (1920) and Coase (1960), contributed significantly. However, the issue of getting the price right is still as much debated by researchers and policy makers [
7,
8]. Including all social, environmental and other costs in energy prices would provide consumers and producers with appropriate information to decide about new investments and development [
9]. Hall emphasized in 1990 that even if the life cycle cost may not be accurately estimated, a mere investigation on this aspect would contribute to greater economic welfare [
10]. Thus, exploring energy life cycle cost prices would help policy making and national strategy formulation. One policy could be to introduce the internalization of external costs into the current electricity price, to truly reflect social and environmental impacts [
11].
For the electricity generation section, there are a number of researchers focusing on electricity external costs [
9,
12,
13,
14]. In summary, the main reasons for studying the external cost of power generation include: (a) to provide and diversify multiple technologies; (b) to propose future policy implication; (c) to emphasize the social and environmental impact of external costa. Rafaj internalized external costa in coal-fired power generation using the global multi-regional MARKAL model, which indicted that structural changes and fuel switching in the electricity sector result in significant reduction of emission of both local pollution and CO
2 on a global scale [
15]. Dimitrijević
et al. estimated the external costs from coal-fired thermal plants in Bosnia and Herzegovina, mainly focusing on sulphur dioxide emissions [
16]. In addition, the external cost of electricity generation mix is also highlighted by researchers, which are significant for further energy directions. Rentizelas incorporated life cycle external costs in optimization of the electricity generation mix. The results indicated that renewable energy, especially wind and biomass, should be the new generating capacity [
17]. Since biomass power generation project is still on the primary stage, external costs of biomass co-fired with coal power generation are estimated in many studies [
18,
19,
20,
21]. One of the insights from these studies is that fossil power generation, particularly coal-fired power generation, with adverse impacts and its high life cycle costs are widespread, and therefore policy and decisions need to be made in an energy diversity framework so that outcomes are socially acceptable, environmentally benign and economically viable.
The aim of this research is to stress the highly adverse impact of coal-fired power plants compared with biomass power plants in China with life cycle structures. Although many studies have demonstrated the externalities of coal-fired power plants, they didn’t integrate all stages and mainly focused on air pollutants. The National Research Council in the United States has studied the environmental and health costs of coal mining and transportation on a national scale [
22], but it has not taken the costs of coal mine construction into account. Nkambule
et al. [
23] emphasized the external costs of transporting coal to a power station in South Africa, rather than those throughout the lifecycle. Grausz [
24] calculated the social costs of coal using a lifecycle assessment. Mahapatra
et al. [
11] examined the environmental impacts of the coal combustion stage in the twin cities of Ahmedabad and Gandhinagar in Western India. Castelo Branco
et al. [
25] performed a lifecycle assessment for a coal-fired plant in Brazil, focusing only on carbon capture and storage (CCS), instead of the all pollutants. The Dutch research institute CE Delft [
26] evaluated the external costs, focusing on the coal combustion and coal mining stages on a global scale. This research includes all stages in coal-fired power generation combining the situation in China to monetize the external cost. In addition, to our best knowledge, few researchers have estimated the external cost of biomass power generation in China. In order to compare the two kind of power plant, the respective life cycle breakdown structures are proposed.
3. Methodology
Lifecycle analysis, examining all the stages of resource utilization, is central to measuring its full costs and critical to informing the public and guiding policy formulation. Many previous studies have examined the lifecycle stages of coal and oil, but without systematic quantification of all the lifecycle stages [
11,
27,
28,
29]. This paper intends to advance the understanding of the measurable and quantifiable costs of a 600 MW coal-fired generation power plant and 30 MW biomass power plant. In other words, costs at every stage of coal-fired generation, from coal mine construction to electricity generation were analyzed. This approach was undertaken because understanding the whole measureable and quantifiable cost structure at the lifecycle stages of the coal-fired generation power plant and the biomass power plant would be helpful for Chinese people to have a correct perception of the external costs of those two types of power plant.
This study uses a 600 MW coal-fired power plant with extensive flue gas cleaning to estimate the external costs because this 600 MW coal-fired power plant has high conversion efficiency and would emit less pollutants than other kinds of coal-fired power plant. This means that its estimated external cost is expected to be lower than that of ordinary types of coal-fired power plant.
To rigorously examine the different damage endpoints, this paper identifies and compares multiple lifecycle stages of a coal-fired and a biomass power plant using a framework of environmental externalities, or “hidden costs”. Externalities occur when the activity of one agent affects the well-being of another outside of any type of market mechanism. They are often not accounted for in decision making and, consequently, distort decision-making outcomes and harm social welfare [
30,
31,
32]. This work derives monetary values for these externalities with implications for policy making.
Literature reviews were conducted to identify the impacts of a 600 MW coal-fired power plant over its lifecycle to quantify those that are quantifiable and tabulate and monetize those that can be monetizable. Because there are certain variations in the monetization of damage, the optimal monetary value was derived on the basis of low and high values estimated in developed countries and by incorporating environmental and social realities in China. The monetizable impacts found are public health damage from NOX, SO2, PM, and mercury emissions; the public health burden associated with coal mining; and geological damage and groundwater drawdown loss. This study estimates the damage costs of pollutants through a combination of literature review data from developed and developing countries. The external costs per kWh of a coal-fired power plant and a biomass power plant are estimated on the basis of estimated pollutants’ values.
4. Damage Costs of Classical Pollutants
The Chinese government now imposes strict regulations to improve the abatement efficiency of pollutants discharged by coal-fired power plants. However, there is no criterion for the damage costs of classical pollutants. To estimate the external costs of pollutants, there are four approaches. The first is the top-down approach proposed by Hohmeyer [
33], which depends on the previous damage cost. This analysis is highly aggregated, being carried out at regional or national levels, with estimates of total quantities of pollutants emitted. However, this analysis is considered simplistic for policy use. The second is using pollution control as an agent for damages developed by Bernow and Marron [
34]. This estimates damages by the cost of reducing emissions of pollutants causing the damage, by arguing that the level of pollution abatement decided by policy makers is the economic optimum, however, this approach emphasizes that policy makers take the main role in providing information of costs and damages, which is an untenable point of view. The third one is a bottom-up approach suggested by Ottinger
et al. [
35], but this method doesn’t involve primary data. All these approaches have been considered to be insufficient for assessment of external costs. This paper uses the fourth approach that was developed by the ExternE (Externalities of Energy) program funded by the European Union (EU), which has been running since 1992 under the funding of the European Commission, using both a top-down and bottom-up approach and applying to all countries. This study determines the damage costs through literature reviews. In this paper, two types of damage cost factors were calculated to conduct the monetary valuation. Among the main pollutants, CO
2 relates to climate change, while SO
2, NO
X and PM
2.5 cause health damage. Regarding the damage costs of CO
2, studies performed by the EU using top-down and bottom-up approaches suggest that under a full-flexibility EU-wide allocation of CO
2 emission permits, the marginal abatement costs are approximately 20 Euros per tonne based on both top-down and bottom-up approaches [
36,
37]. However, because many reductions will be required to keep climate change impacts at the minimum acceptable level, CO
2 cost is likely to rise in the future. In this paper, future damage from CO
2 is not considered. For CH
4 emission, a factor of 34 times of CO
2 value is applied to reflect the relative impact of methane on global warming compared with that of CO
2 [
38,
39].
Regarding SO
2, NO
X and PM
2.5, the impacts of these increased air pollutants, that is, mortality and morbidity, are reflected in the large numbers of diseases and deaths. In the New Energy Externalities Development for Sustainability project, the final estimates of the damage costs per tonne for specific pollutants as well as mortality and morbidity effects are taken into account, which would not only include health but also quality of life effects [
40]. In the NEEDS (New Energy Externalities Developments for Sustainability) project which is part of the ExternE Project, the damage to health due to SO
2, NO
X and PM
2.5 emissions from coal-fired power plants is quantified using the dose-response model and monetized by the Value of Life Year (VOLY) questionnaire on willingness to pay for the extension of life expectancy and the improvement of quality of life throughout respondents’ lives [
40]. The European VOLY analysis was based on the situation of EU. In order to make universal estimates for VOLY, the NEEDS projects produced a global, average VOLY estimate. The final estimates of air pollutants are adjusted on the basis of the calculated Purchasing Power Parity (PPP), harmonized index of consumer price (HICP) and GDP in China (PPP factor for China is 3.84 and population is 1,320 million) [
26]. For CO, fly ash, furnace residue, gangue and polluted water, because few studies evaluate these damage costs, this paper takes data directly from the total sewage price (TSP) of China [
41]. The external cost factors of pollutants are summarized in
Table 1.
Table 1.
External cost factors of pollutants of coal-fired power in China.
Table 1.
External cost factors of pollutants of coal-fired power in China.
| Pollutants | External Cost Factor (US$/t) |
|---|
| CO2 | 27.410 |
| CH4 | 931.94 |
| SO2 | 4842.7 |
| NOx | 4459.4 |
| CO | 165.99 |
| PM2.5 | 19,471 |
| Fly ash | 23 |
| Furnace residue | 16.5 |
| Gangue | 1.2 |
| Contaminated water | 3.32 |
5. External Costs of a 600 MW Coal-Fired Power Plant
Past researchers have demonstrated that the entire coal fuel cycle is associated with dire impacts on both the environment and human health. They have called for the consideration of all the stages in the lifecycle of coal-fired electricity supply, including mining, processing, transportation and electricity generation [
28,
42,
43,
44,
45,
46]. Considering all the stages, rather than focusing on coal combustion, is a significant step toward revealing the true costs of coal-fired electricity generation. The results can affect public policies and private investments [
47,
48,
49,
50].
Figure 1.
External costs of a coal-fired power plant in its lifecycle.
Figure 1.
External costs of a coal-fired power plant in its lifecycle.
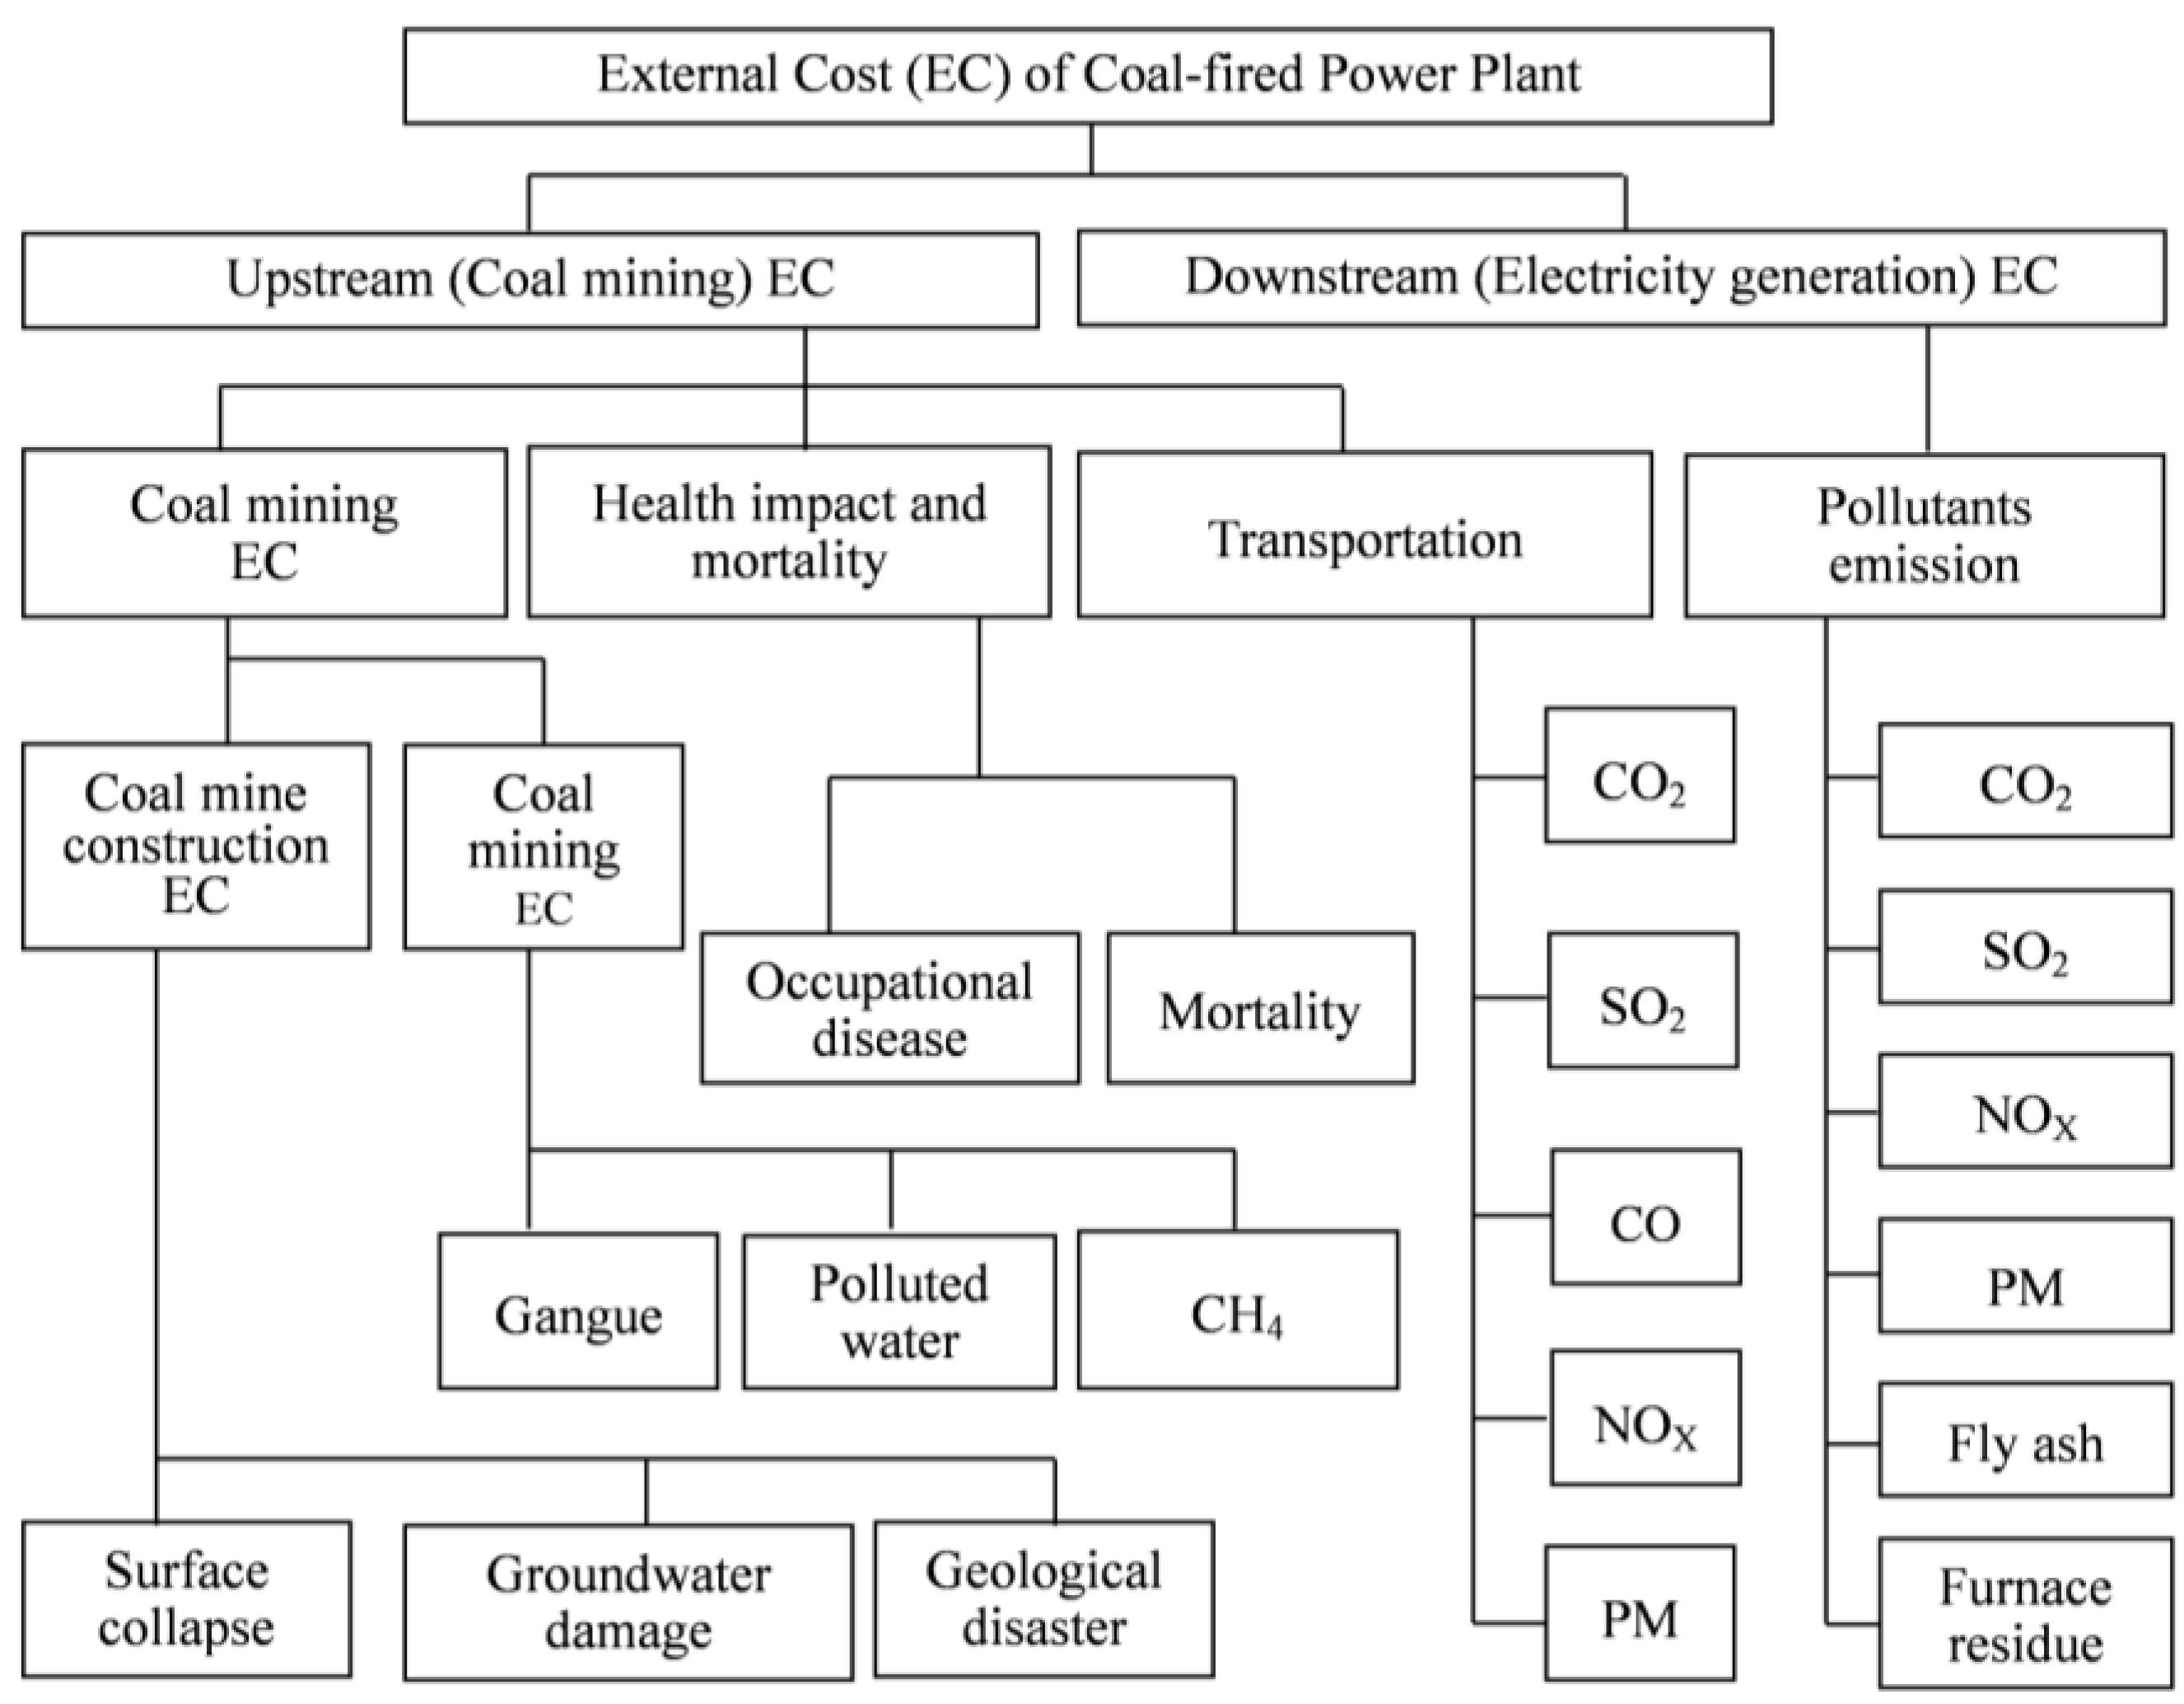
However, no research integrates all of stages of coal lifecycle in China. Coal mine construction, coal mining, transportation and coal combustion release many chemicals responsible for climate forcing. Coal also contains mercury, lead, cadmium, arsenic, manganese, beryllium, chromium and other toxic and carcinogenic substances [
28]. Coal mining, processing and washing releases large amounts of chemicals and particulate matter annually, which contaminate water and harm ecological systems and community public health [
51,
52,
53,
54,
55]. Coal transportation leads to CO
2, CH
4 and NO
X emissions. In addition, coal combustion results in emissions of NO
X, SO
2, particulates matter and mercury, all of which negatively affect air quality and public health [
56]. The structure of the external costs of coal-fired power plants is shown in
Figure 1. In this study, the considered 600 MW coal-fired plant is a modern power plant with coal conversion efficiency of 40%, which is the highest in China. The emissions are based on pulverized coal combustion plants equipped with extensive flue gas cleaning.
5.1. Coal Mine Construction
Each external cost factor is explained as follows:
5.1.1. Surface Collapse
Coal mine construction has significant impacts on land resources. Surface collapse is the main disaster caused by coal mine construction; it not only damages land ecosystems, but also leads to other serious ecological harm, such as forest and vegetation damage and farmland collapse [
57]. Until 2008, surface collapse caused by coal mining reached 800,000 ha, resulting in more than $9.7 billion of economic losses [
58]. The average cost of damages due to surface collapse is $1.4 × 10
4/ha. According to statistics by the National Bureau of Statistics of China [
59], mining 10,000 tons of coal will lead to 0.10–0.29 ha of surface collapse, with an average of 0.20 ha. In 2008, the total cost of surface collapse cost due to coal mining in China was approximately $640 million. At the end of 2008, 40 cities had suffered from mining collapse incidents, which caused 25 other serious disasters that year [
58].
5.1.2. Contaminated Underground Water
Coal mine construction is a complex process that produces several types of contaminated water, such as coal mineral water. These types of contaminated water are discharged in huge amounts and have complex chemical compositions. For example, in 2008, the total coal production was 7.9 × 10
7 tons; however, $12 million was lost due to declining underground water levels [
60]. Contaminated water seeping into the ground can pollute underground water, which threaten human health and biological survival.
5.1.3. Geological Disaster
Coal mine construction causes surface collapse as well as leads to frequent landslides, mudslides and avalanches because of damaged mountain stability. At the end of 2008, in Shanxi Province, which has the largest coal reserves in China, more than 2,940 ha had experienced geological disasters, involving over 1,900 villages and approximately 95,000 people that year. In the last 10 years, over 500 people have been injured in geological disasters. In Heilongjiang Province, 193 ha in Jixi city has undergone surface subsidence after 80 years of coal mining; in the Hegang coal mining area, 63–67 ha of land has undergone surface subsidence, with the deepest subsidence of up to 30 m. The expanding scale of coal mining in China, with an estimated annual cost of $3.2 billion is dramatically increasing various geological disasters [
61].
5.2. Coal Mining
5.2.1. Gangue
In the process of coal mining, solid wastes such as gangue, fly ash and slime are released. Gangue contains the main pollutants. Gangue from an open pit occupies a large land area and causes spontaneous combustion because of the harmful substances it contains, such as sulfur and carbonate, which emit large amounts of smoke, SO
2, CO, and H
2S. According to the Consultation Report on the Gangue Industry in China [
60], from 2008 to 2009, gangue emissions made up 10%–15% of the amount from coal mining. By the end of 2008, an accumulated 5 billion tons of gangue occupied the 120 ha of land, with disposal costs of $3.1 billion [
60].
5.2.2. Contaminated Water
In the coal mining stage, chemicals are directly and indirectly emitted into water supplies from mining and processing. Chemicals in the waste water contain ammonia, sulfur, sulfate, nitrates, nitric acid, tars, oils, fluorides, chlorides and other acids and metals, including sodium, iron, cyanide and additional unlisted chemicals [
62]. In 2008, the coal mining industry produced 2.559 billion tons of waste water, constituting 11% of total industrial waste water emissions and generating at least $1.08 billion in costs [
63]. If health damage in disability-adjusted life years due to these emissions were calculated, the costs would be appallingly similar.
5.2.3. Methane (CH4)
In the coal mining process, methane adds to explosion risks and mine fires. Methane is emitted during coal mining and is 34 times more potent than CO
2 during a 100-year timeframe (this is the 100-year global warming potential; a common metric in climate science and policy used to normalize different GHGs to carbon equivalence) [
64]. When methane decays, it can yield CO
2, which can accelerate global warming. Based on the statistical data from the National Bureau of Statistics of China [
65], mining one ton of coal emits 7–8 m
3 of CH
4. This paper uses the central value 7.5 m
3 (5.3 kg) as the calculation value [
65].
5.3. Health Impact and Mortality
The Chinese State Administration of Work Safety [
66] records occupational injuries and disabilities, chronic illnesses and mortality in miners in China. Black lung disease (or pneumoconiosis), leading to chronic obstructive pulmonary disease, is the primary illness in underground coal miners. In 2008, pneumoconiosis increased by 10,829 people, among whom were 9672 (89.32%) coal mining industry workers. Generally, miners contracted pneumoconiosis at a young age, with an average age of 37.5 [
67]. Because there is no effective treatment for pneumoconiosis, patients must undergo lung lavage surgery once a year to survive. By 2008, coal workers’ pneumoconiosis had killed 669 coal workers in China. Because coal mines refuse to provide afflicted mine workers with occupational disease diagnostic reports, workers have to incur costly medical expenses. Thus, the workers must suffer from physical and economic pain.
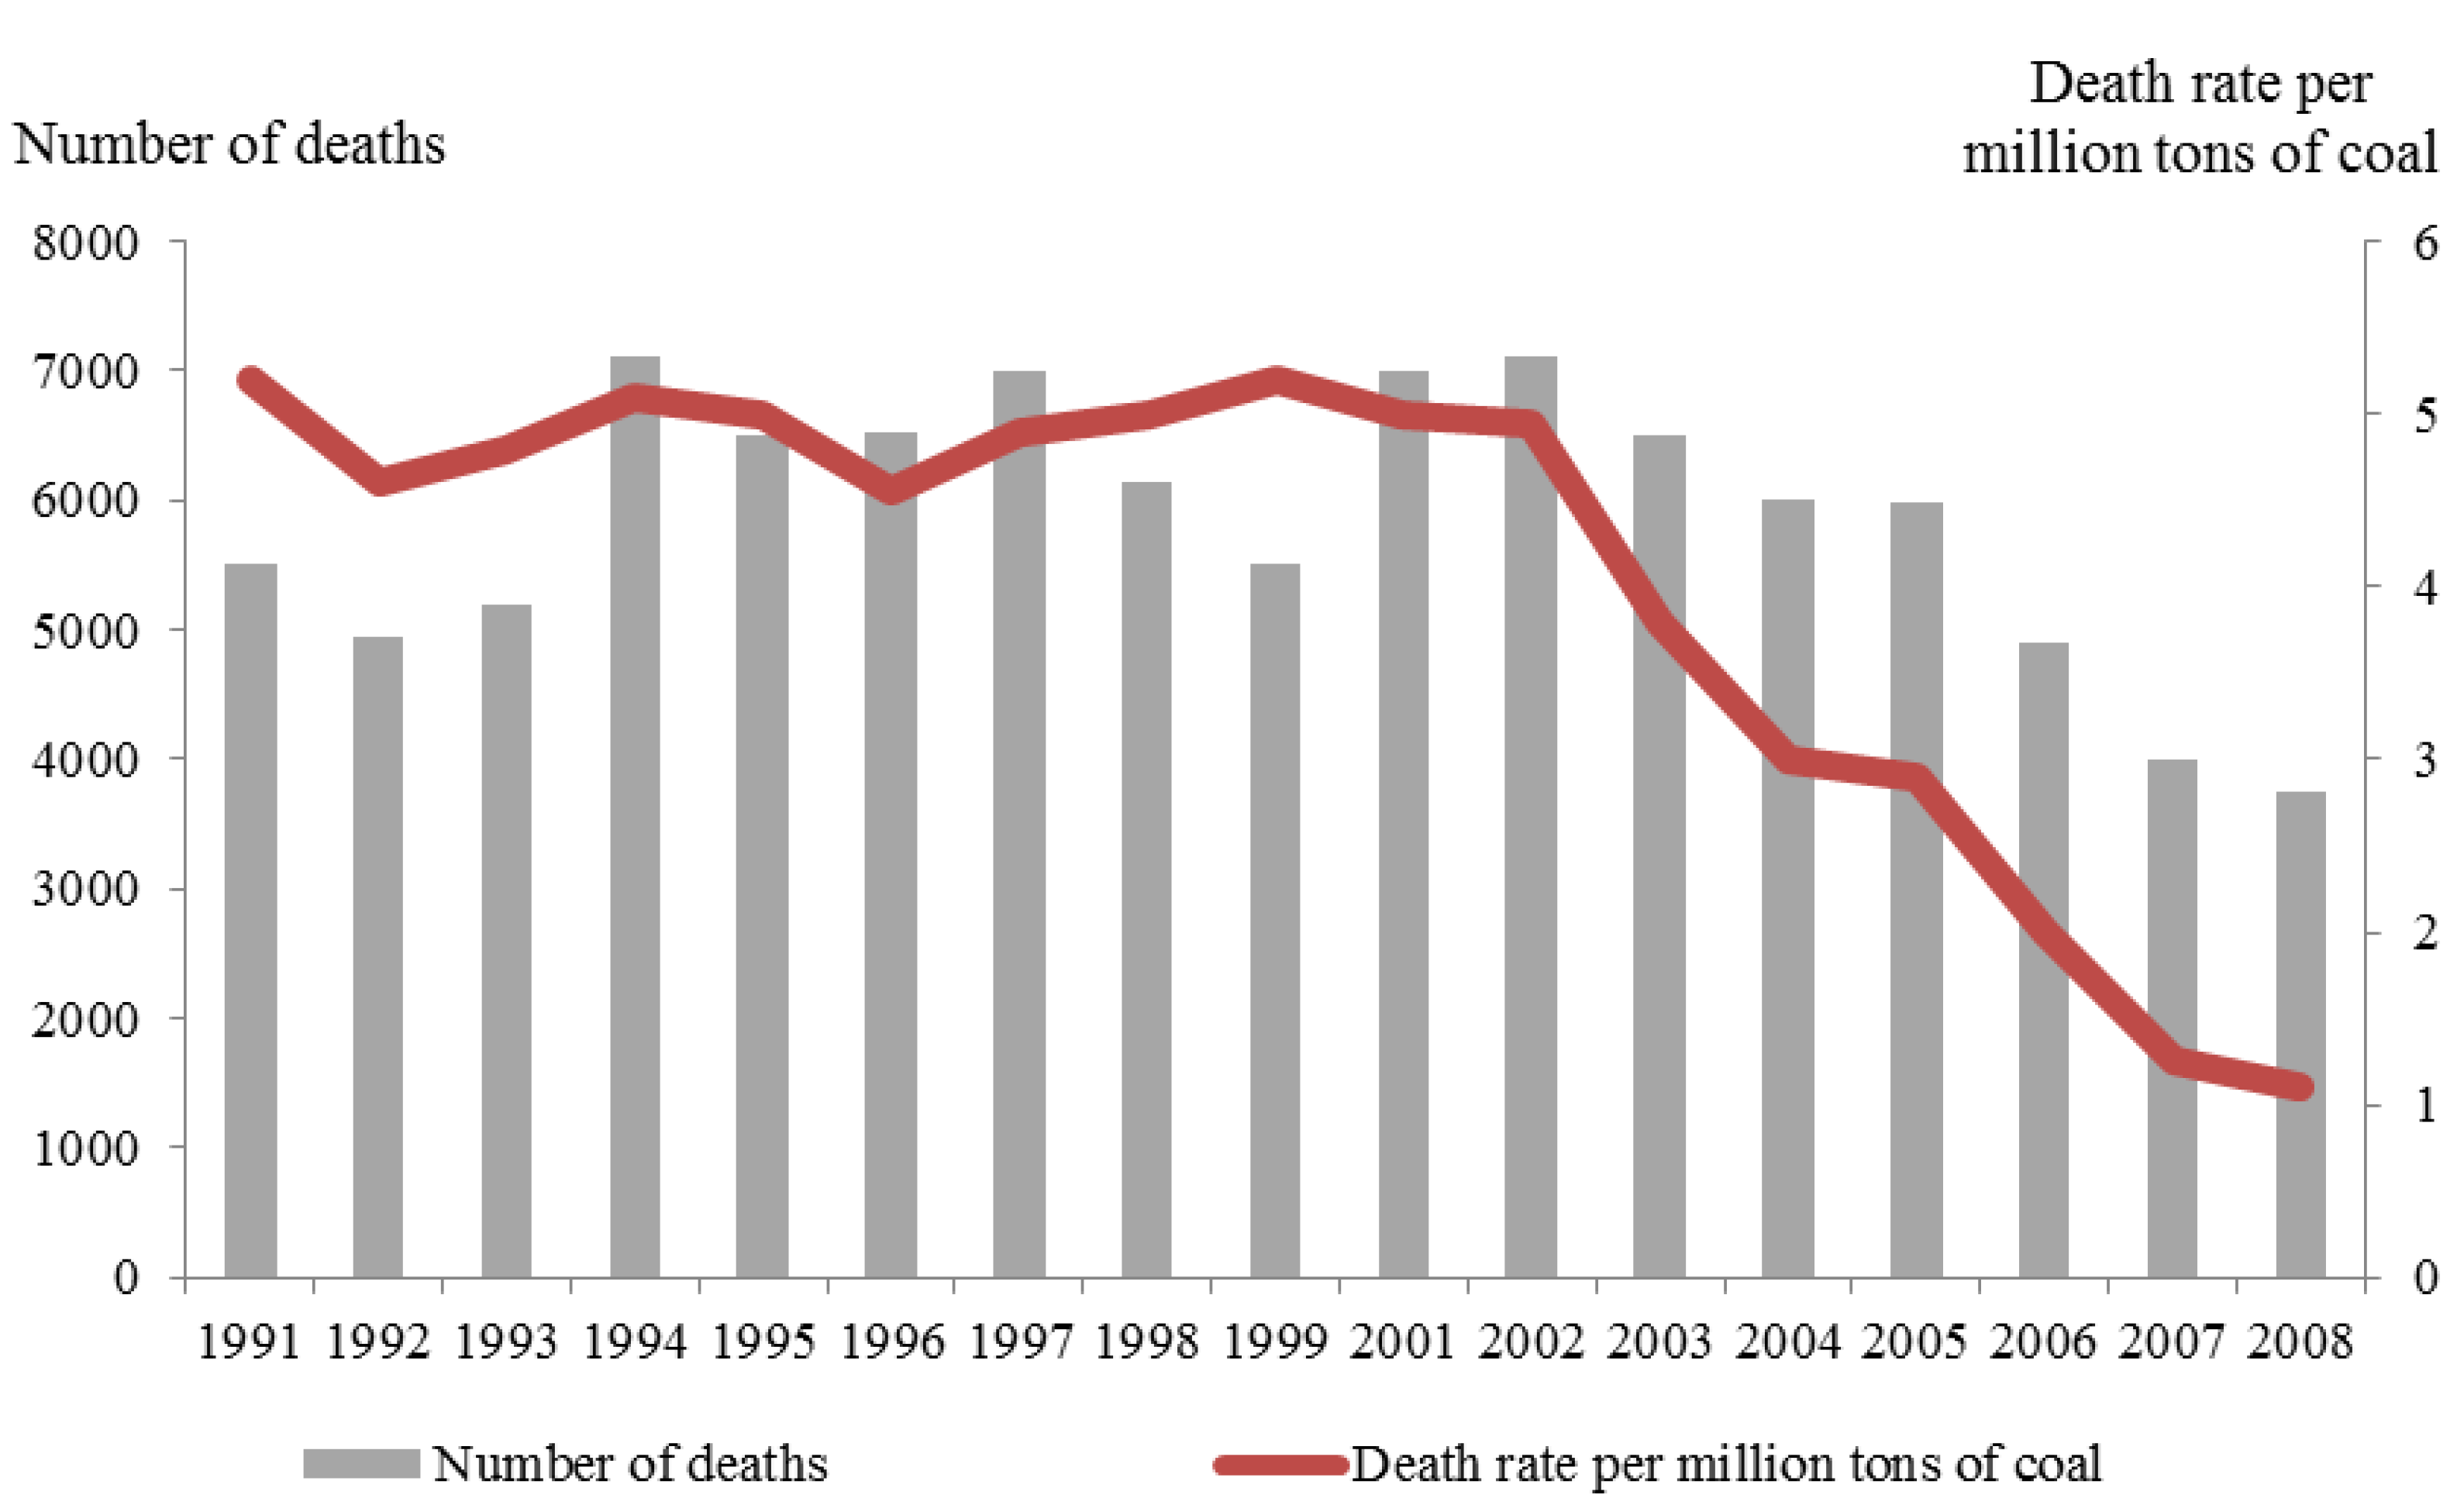
In China, underground mining accidents cause 3,800–6,000 deaths annually, although the number of mining-related deaths has decreased by one-half over the past decade [
68]. From 1991 to 2008, the country produced 28.26 billion tons of coal, with 103,633 people killed in coal accidents, that is, 3.68 average deaths per million tons of coal, as shown in
Figure 2 [
69]. In 2009, according to the Chinese State Administration of Work Safety, 2631 coal miners were killed by gas leaks, explosions or flooded tunnels [
70].
Figure 2.
Number of people killed in coal mine accidents and death rate per million tons of coal.
Figure 2.
Number of people killed in coal mine accidents and death rate per million tons of coal.
5.4. Transport
Coal transportation presents direct hazards. People in mining communities complain of road hazards and intense dust levels. Dust can prove fatal to those suffering respiratory and cardiovascular diseases. In many cases, the dust is so thick that it coats people’s skin and the walls and furniture in their homes. This paper will not focus on the cost of emission impact for lack of data, but rather on the costs of pollutant emissions.
Table 2 shows pollutant emission intensity in coal transport [
71,
72].
Table 2.
Pollutant emission intensity in coal transport.
Table 2.
Pollutant emission intensity in coal transport.
| Pollutant | CO2 | SO2 | NOx | CO | PM |
|---|
| Emission intensity (kg/million ton·km) | 13,757 | 80 | 67 | 25 | 54 |
To calculate emissions by transporting coal from the 600 MW coal-fired power plant in Harbin city, Heilongjiang Province, this study uses 550 km as the distance from the coal mine to the power plant, which is the shortest distance from Qitaihe coal mine to Harbin by train. The breakdown of external cost in various stages are described in detail in
Table 3.
Table 3.
External costs of coal power plant.
Table 3.
External costs of coal power plant.
| Item | Impact | Data | External Cost |
|---|
| Coal mine construction | Surface collapse | Mining 104 t coal causes 0.20 ha of surface collapse. The average cost of damage from surface collapse is $14,375/ha. A 600 MW coal-fired power plant combusts approximately 1.4544 × 10⁶ t coal annually. | |
| Contaminated underground water | The economic loss in Hebei Province in 2008 was $1.1550 × 10⁷. The total coal production in Hebei Province was 7.91479 × 10⁷ t. A 600 MW coal-fired power plant combusts approximately 1.4544 × 10⁶ t coal annually. | |
| Geological disaster | The economic cost of geological disasters due to coal mining is approximately $3.2226 × 10⁹ annually. In 2008, the total coal production was 2.802 × 10⁹ t [73]. A 600 MW coal-fired power plant combusts approximately 1.4544 × 10⁶ t coal annually. | |
| Coal mining | Gangue | Gangue occupies 10%–15% of coal production—with an average of 12.5%. A 600 MW coal-fired power plant combusts approximately 1.4544 × 10⁶ t coal annually. The damage cost of gangue is $1.2/t. | |
| Contaminated water | In 2008, the total coal production was 2.802 × 10⁹ tons. In 2008, the quantity of polluted water attributed to coal mining was 2.559 billion tons. A 600 MW coal-fired power plant combusts approximately 1.4544 × 10⁶ t coal annually. The damage cost of polluted water is $3.32/t. | |
| CH4 | CH4 emission is 5.3 kg CH4/t coal. A 600 MW coal-fired power plant combusts approximately 1.4544 × 10⁶ t coal annually. The damage cost of CH4 is $931.94/t. | |
| Health impact and mortality | Occupational disease | In 2008, 9672 people in the coal mining industry contracted pulmonary diseases. The average duration of medical treatment is 9.87 years [74]. People must undergo lung lavage surgery once every two years, with each surgery costing $3299.89 [75]. In 2008, the total coal production in China was 2.802 × 10⁹ ton. A 600 MW coal-fired power plant combusts approximately 1.4544 × 10⁶ t coal annually. | In 2008, the pulmonary disease cost:
Pulmonary of 600MW coal-fired power plant: |
| Mortality | The average deaths per million tons of coal was 3.68. The actual cost of mortality was $32,999/person [76]. A 600 MW coal-fired power plant combusts approximately 1.4544 × 10⁶ t coal annually. | |
| Transport | CO2 | The pollution emission intensity is 13.757 ton/106 ton·km. The CO2 value is $27.41/t. The distance between the coal mine and the power plant is 550 km. A 600 MW coal-fired power plant combusts approximately 1.4544 × 10⁶ t coal annually. | |
| SO2 | The pollution emission intensity is 0.08t/106 tons·km. The SO2 value is $4842.7/t. The distance between the coal mine and the power plant is 550 km. A 600 MW coal-fired power plant combusts approximately 1.4544 × 10⁶ t coal annually. | |
| Transport | NOX | The pollution emission intensity is 0.067 t/106 tons·km. The NOX value is $4459.4/t. The distance between the coal mine and the power plant is 550 km. A 600 MW coal-fired power plant combusts approximately 1.4544 × 10⁶ t coal annually. | |
| CO | The pollution emission intensity is 0.025 t/106 tons·km. The CO value is $165.99/t. The distance between the coal mine and the power plant is 550 km. A 600 MW coal-fired power plant combusts approximately 1.4544 × 10⁶ t coal annually. | |
| PM | The pollution emission intensity is 0.054 t/106 tons·km. The PM value is $19,471/t. The distance between the coal mine and the power plant is 550 km. A 600 MW coal-fired power plant combusts approximately 1.4544 × 10⁶ t coal annually. | |
| Coal combustion | CO2 | The pollution emission rate is 1,598 kg/t. The CO2 value is $27.41/t. A 600 MW coal-fired power plant combusts approximately 1.4544 × 10⁶ t coal annually. | |
| SO2 | The pollution emission rate is 16 kg/t. The SO2 value is $4842.7/t. A 600 MW coal-fired power plant combusts approximately 1.4544 × 10⁶ t coal annually. | |
| Coal combustion | NOX | The pollution emission rate is 7.8 kg/t. The NOX value is $4459.4/t. A 600 MW coal-fired power plant combusts approximately 1.4544 × 10⁶ t coal annually. | |
| CO | The pollution emission rate is 0.24 kg/t. The CO value is $165.99. A 600 MW coal-fired power plant combusts approximately 1.4544 × 10⁹ t coal annually. | |
| PM | The pollution emission rate is 0.39 kg/t. The PM value is $19,471/t. A 600 MW coal-fired power plant combusts approximately 1.4544 × 10⁶ t coal annually. | |
| Fly ash | The pollution emission rate is 0.102tflyash/tcoal. The fly ash value is $23/t. A 600 MW coal-fired power plant combusts approximately 1.4544 × 10⁶ t coal annually. | |
| Furnace residue | The pollution emission rate is 0.028 tfurnace/tcoal. The furnace residue value is $16.5/t. A 600 MW coal-fired power plant combusts approximately 1.4544 × 10⁶ t coal annually. | |
| Damage cost | |
5.5. Coal Combustion
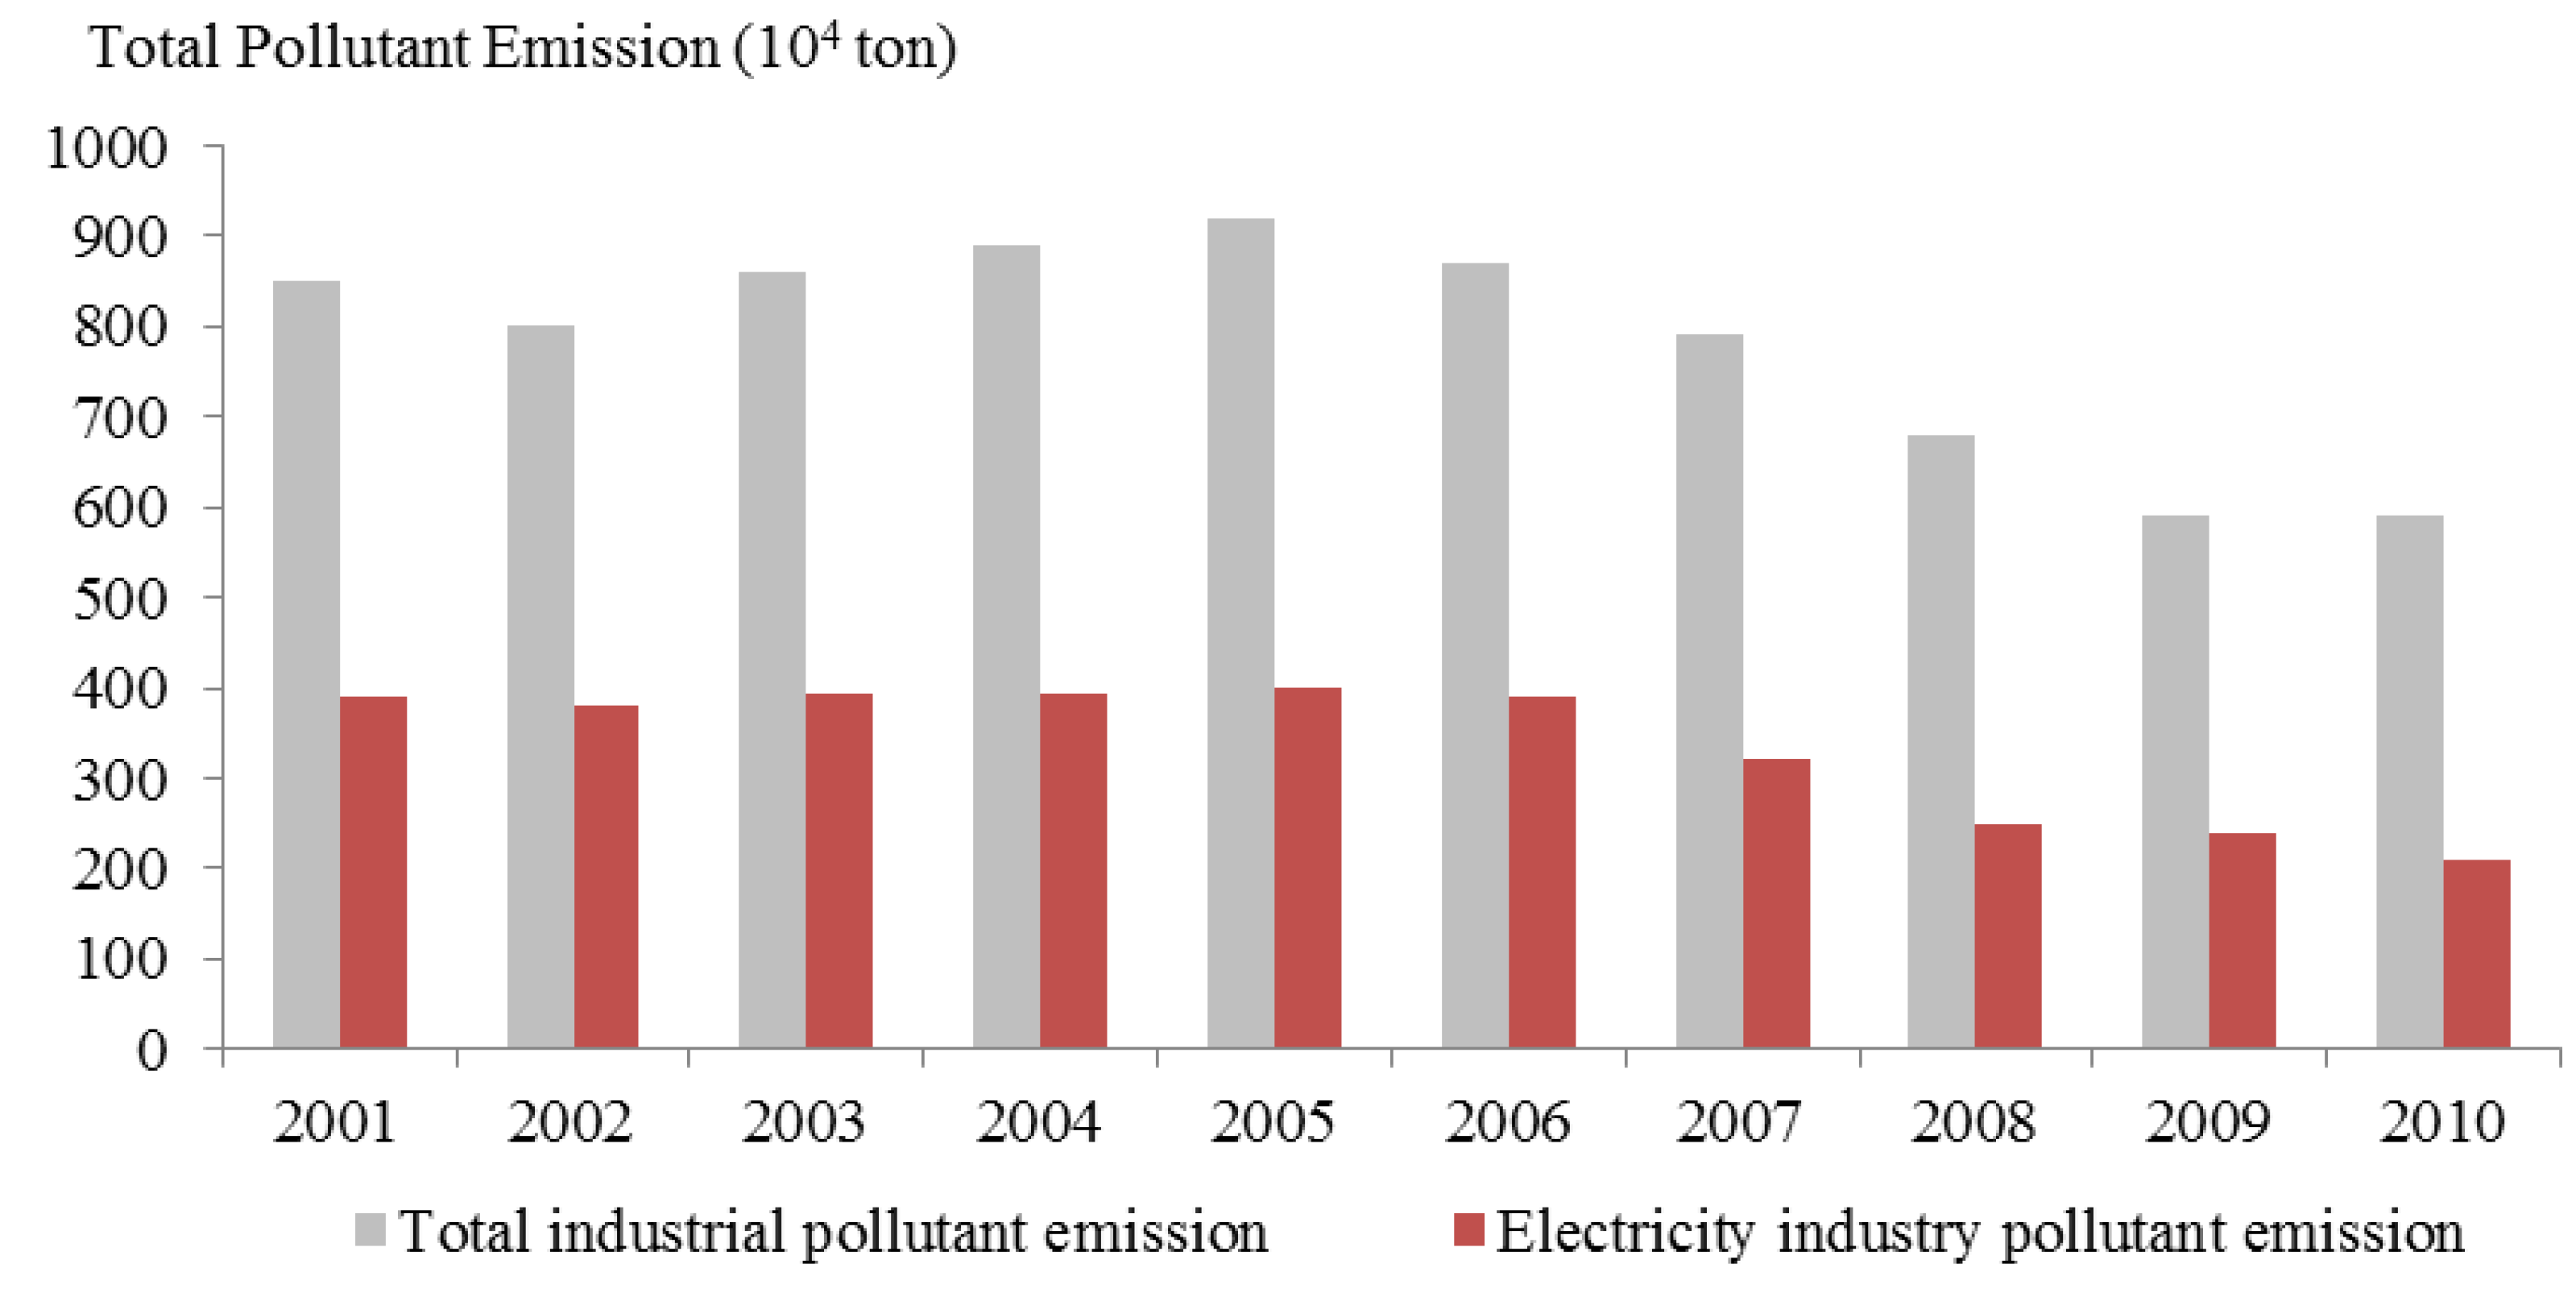
The last stage of the coal lifecycle is combustion to generate energy. This research focuses on a 30 MW coal-fired power plant. The by-products of coal combustion include CO
2, SO
2, NO
X, PM, fly ash and furnace residue. Data from China’s Environmental Protection Department demonstrate that the electricity industry is significantly responsible for China’s industrial pollution emissions (
Figure 3). Along with the primary emissions of PM, SO
2 and NO
X contribute to an increase in airborne particle concentrations through secondary transformation processes [
76,
77,
78,
79].
Figure 3.
Total industrial and electricity industry pollutant emissions in China (2001–2010).
Figure 3.
Total industrial and electricity industry pollutant emissions in China (2001–2010).
In recent years, China has recorded low air quality. Visibility is low even in the daytime, particularly in winter. People wear thick masks to protect themselves from the polluted air. Coal power plants are the main contributors to this pollution. Fly ash ponds and contaminants readily migrate into water supplied to household and agricultural use, contaminating the environment and threatening human health. This paper focuses on calculating the damage values of pollutants emitted by a 600 MW coal-fired power plant on the basis of the damage value per pollutant.
Table 4 shows the pollution emission rate of a 600 MW coal-fired power plant [
80,
81].
Table 3 summarizes the data in this study and calculates the external costs of a coal-fired power plant at each stage.
Table 4.
Pollutant emission rate for a 600 MW coal-fired power plant.
Table 4.
Pollutant emission rate for a 600 MW coal-fired power plant.
| Pollutant | CO2 | SO2 | NOX | CO | PM | Fly Ash | Furnace Residue |
|---|
| Emission rate (kg/t)kg/t | 1598.00 | 16.00 | 7.80 | 0.24 | 0.39 | 102.00 | 28.00 |
6. External Costs of a 30 MW Biomass Power Plant
To compare the external cost of a coal-fired power plant and a biomass power plant, the external costs of the National Bio Energy power plant in Wangkui are calculated. Most researchers study the multiple benefits of biomass energy displacing fossil fuel, such as improvements in the environmental, increase in the diversity of energy supply and reduction of the effects of energy price volatility on the economy and national economic security. However, while biomass power generation offers societal benefits, it also has environmental externalities throughout its lifecycle.
Figure 4 shows the lifecycle of a biomass power plant. This study analyzes the external costs at each stage of biomass power generation.
Figure 4.
Lifecycle system of biomass power plant.
Figure 4.
Lifecycle system of biomass power plant.
Because only a few corn straw-based power plants operate, the data sources are very limited. This paper has access to information from the National Bio Energy plant in Wangkui, which is the first corn straw-based power plant in China. Therefore, this section uses the National Bio Energy power plant as its empirical data source.
In Wangkui, many types of straws are produced, such as corn straw, soybean straw and rice straw. Corn straw, however, comprises the bulk of the county’s straw production. In the recent years, the annual production of straw has been approximately 2.516 million tons. Only 0.5% is used to feed livestock and 40% is burned in the field after harvest. The biomass power plant was established in Wangkui because of the region’s abundant corn straw produce. Annually, approximately 0.2 million tons of crop straw is used for electricity generation. The authors assess the external costs of the straw-based power plant in each phase—straw collecting, straw processing, straw transport and straw combustion—and compare the results with those of the coal-fired power plant.
Straw agents from different collecting stations use trucks to transport crop straw. Crop straw compressing and baling productivity depends on the collecting stations’ conditions. The baling size is regulated to 150 cm × 130 cm × 120 cm, and the bale weight is 400–450 kg. According to data from the National Bio Energy power plant in Wangkui, the emission factors of diesel are mainly CO
2, SO
2, CO, NO
X and PM. The collection and transportation emissions are calculated on the basis of diesel pollutant emission factors (
Table 5) and diesel consumption rates in different types of trucks (
Table 6) [
72]. Because crop straw ash can be used as fertilizer, this paper does not consider it a pollutant.
Table 5.
Emission factors of diesel.
Table 5.
Emission factors of diesel.
| Item | Value (g/L) |
|---|
| CO2 | 2753 |
| SO2 | 0.5850 |
| NOx | 0.1445 |
| CO | 0.09900 |
| PM | 0.01445 |
Table 6.
Diesel consumption rates in different types of trucks.
Table 6.
Diesel consumption rates in different types of trucks.
| Phase | Truck Type | Diesel Consumption Rate (L/km) |
|---|
| Straw collection | Heavy diesel truck | 0.37 |
| Straw transport | Medium-sized diesel truck | 0.10 |
The baled crop straw is delivered from different collecting stations to the biomass power plant using 16-tonne heavy-duty diesel trucks with an average round-trip distance of 20 km. From crop field to collecting stations, a 5-tonne medium-sized diesel truck is used with an average round-trip distance of 30 km. Diesel is the only fuel used in these processes. Annually, 200,000 tons of processed crop straw with less than 25% water content is needed for power generation. However, because of high water content after harvest, agents have to collect approximately 270,000 tons of crop straw to satisfy biomass power plant needs after crop straw becomes dry. In terms of straw processing stage, annual diesel consumption is 1.43 × 10
9 kJ, and one liter diesel emits 36,944.72 kJ. Diesel consumption in straw collection, transportation and process is calculated (
Table 7). With the assistance of the Wangkui National Bio Energy power plant manager, emission pollutants from biomass power plant are calculated (
Table 8).
Table 7.
Diesel consumption in straw pre-treatment stages.
Table 7.
Diesel consumption in straw pre-treatment stages.
| Phase | Diesel Consumption (L) |
|---|
| Straw collection | 162,000 |
| Straw process | 38,706.0 |
| Straw transportation | 92,500.0 |
Table 8.
Direct emissions generated by biomass power plant operations.
Table 8.
Direct emissions generated by biomass power plant operations.
| Item | CO2 | SO2 | NOx | CO |
|---|
| g/kWh | 0.019 | 0.0015 | 0.00060 | 0.00020 |
Table 8 shows that the utilization of crop straw increases pollutant emissions mainly because of the diesel fuel used in transportation. The combustion of crop straw also emits CO
2 into the atmosphere. However, because CO
2 is absorbed during plant growth, a sustainable balance is maintained between the CO
2 emitted and absorbed. Therefore, CO
2 and other greenhouse gas (GHG) emissions from crop straw, which is of biogenic origin, should be considered GHG neutral [
82]. The 30 MW biomass power plant generates 200 GWh annually. Factoring in the pollutants’ damage values, the total external costs of the 30 MW biomass power plant are shown in
Table 9.
Table 9.
External costs of a 30 MW biomass power plant.
Table 9.
External costs of a 30 MW biomass power plant.
| Phase | Emission Factor | Total Amount of Pollutants (ton) | Cost ($) |
|---|
| Straw collection | CO2 | 445.99 | 12,225 |
| SO2 | 0.0948 | 459.00 |
| NOX | 0.0234 | 104.35 |
| CO | 0.0160 | 2.6398 |
| PM | 0.0023 | 44.783 |
| Straw processing | CO2 | 106.56 | 2,920.8 |
| SO2 | 0.0226 | 109.42 |
| NOX | 0.0056 | 24.972 |
| CO | 0.0038 | 0.6270 |
| PM | 0.0006 | 11.682 |
| Straw transportation | CO2 | 245.65 | 6733.3 |
| SO2 | 0.0134 | 64.879 |
| NOX | 0.0092 | 41.026 |
| CO | 0.0541 | 8.9260 |
| PM | 0.0013 | 25.312 |
| Straw combustion | SO2 | 0.30 | 1452.52 |
| NOX | 0.12 | 535.12 |
| CO | 0.04 | 6.60 |
| Total cost | 24,771 |
7. Results and Discussion
7.1. Comparison of External Costs of a Coal-Fired Power Plant and Biomass Power Plant
The results obtained and expressed in cost per kWh of coal-fired power plant and biomass power plant in various stages are summarized in
Figure 5 and
Figure 6.
Figure 5 illustrates that the coal combustion stage contributes the majority of external costs. However, for a biomass power plant, straw collection causes most external costs. The coal-fired power plant is a 600 MW unit (3,600 GWh/year) and the biomass power plant is a 30 MW unit (200 GWh/year). The total external costs per kWh of coal-fired power plant and biomass power plant are $0.072/kWh and $0.00012/kWh, respectively. The external cost per kWh of the coal-fired electricity is 600 times as much as that of the biomass electricity. Environmental performance of biomass power plant is considerably higher than that of coal-fired power plant.
In previous research, Faaij [
83] and Sáez [
84] also studied the externalities of biomass-based electricity production compared with coal power plant in The Netherlands and Spain, respectively. Both external costs and benefits are included in those researches. The results show that on a total cost basis bio-energy could even be competitive with coal. However, the external costs gap between biomass and coal in life cycle is not as huge as the result in China. In Faaij and Sáez’s studies, soil erosion and fertilizer pollutants are considered as external cost resources. However, in China, biomass, mainly crop straw, is considered as agricultural waste. Biomass energy is by-product of crops instead of growing biomass energy crops. Thus, soil erosion and fertilizer pollutant are not considered. In addition, in those studies, the external costs in coal mine construction, coal mine, health impact are not included. Considering coal combustion rate and low effect of dedusting equipment in coal-fired power plant in China, the external cost associated with pollutant emission in coal-fired power plant in China is considerably higher.
Figure 5.
External costs of a 600 MW coal-fired power plant per kWh.
Figure 5.
External costs of a 600 MW coal-fired power plant per kWh.
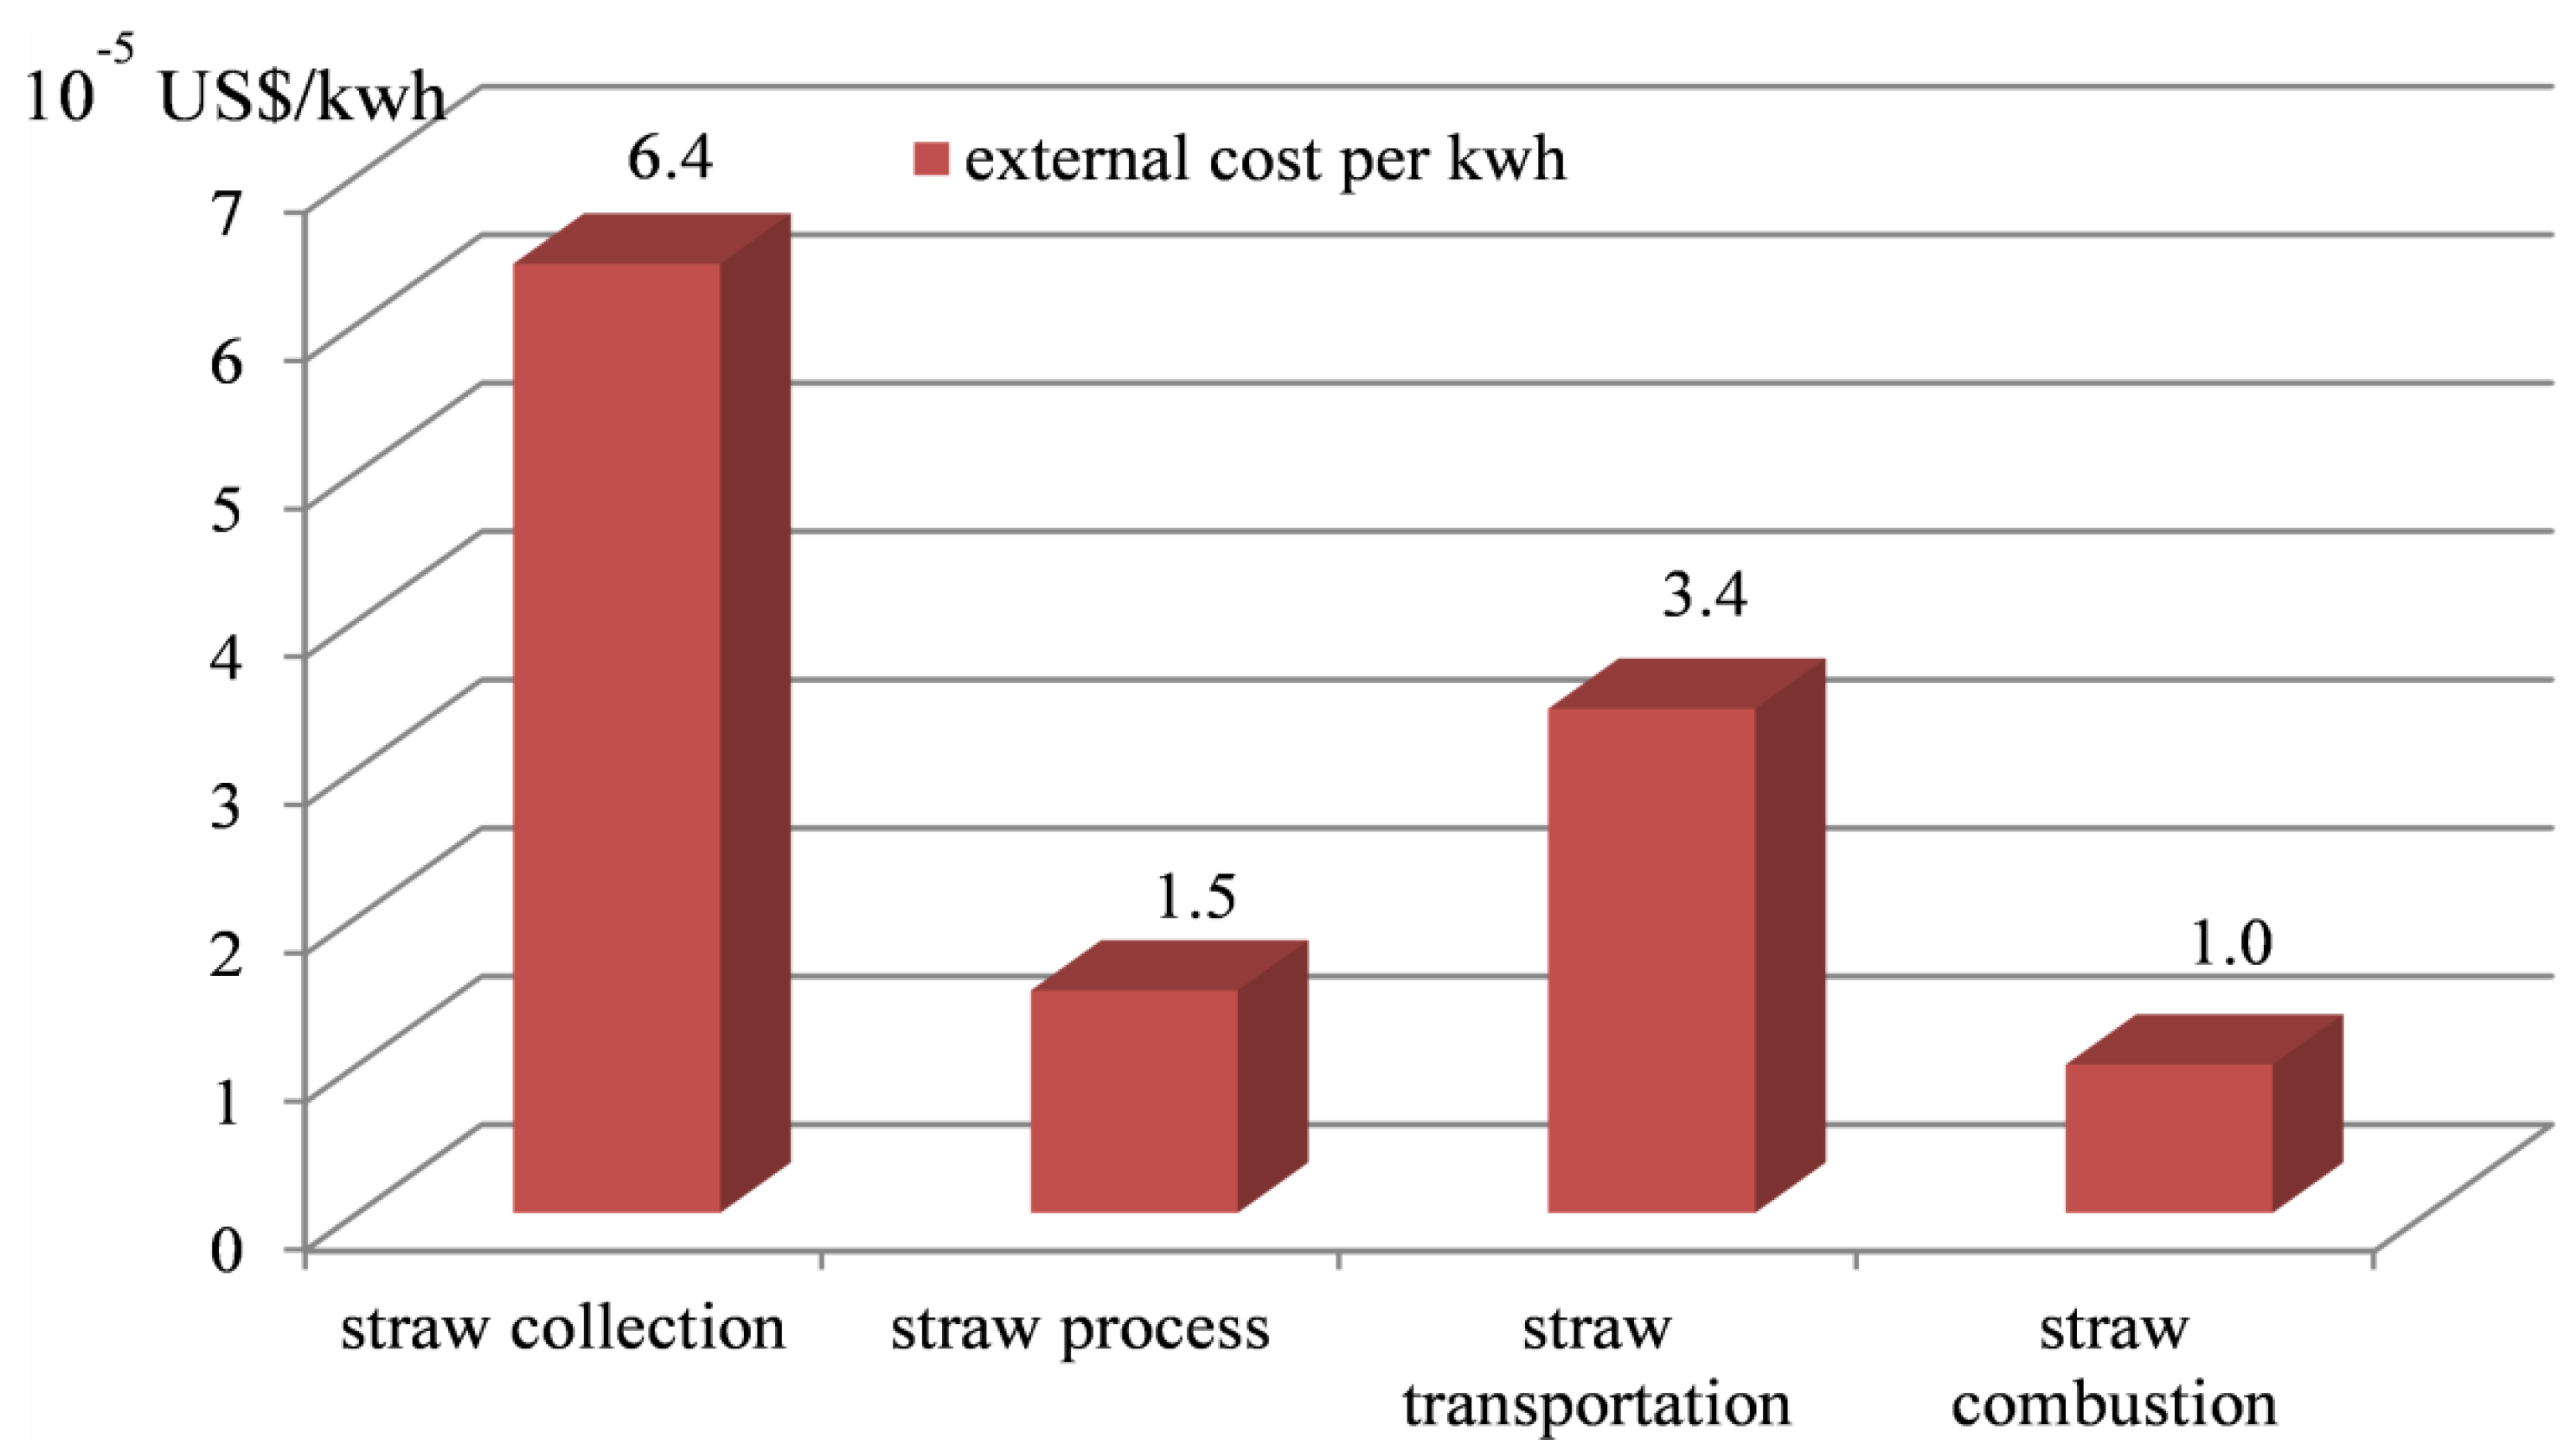
Figure 6.
External costs of a 30 MW biomass power plant per kWh.
Figure 6.
External costs of a 30 MW biomass power plant per kWh.
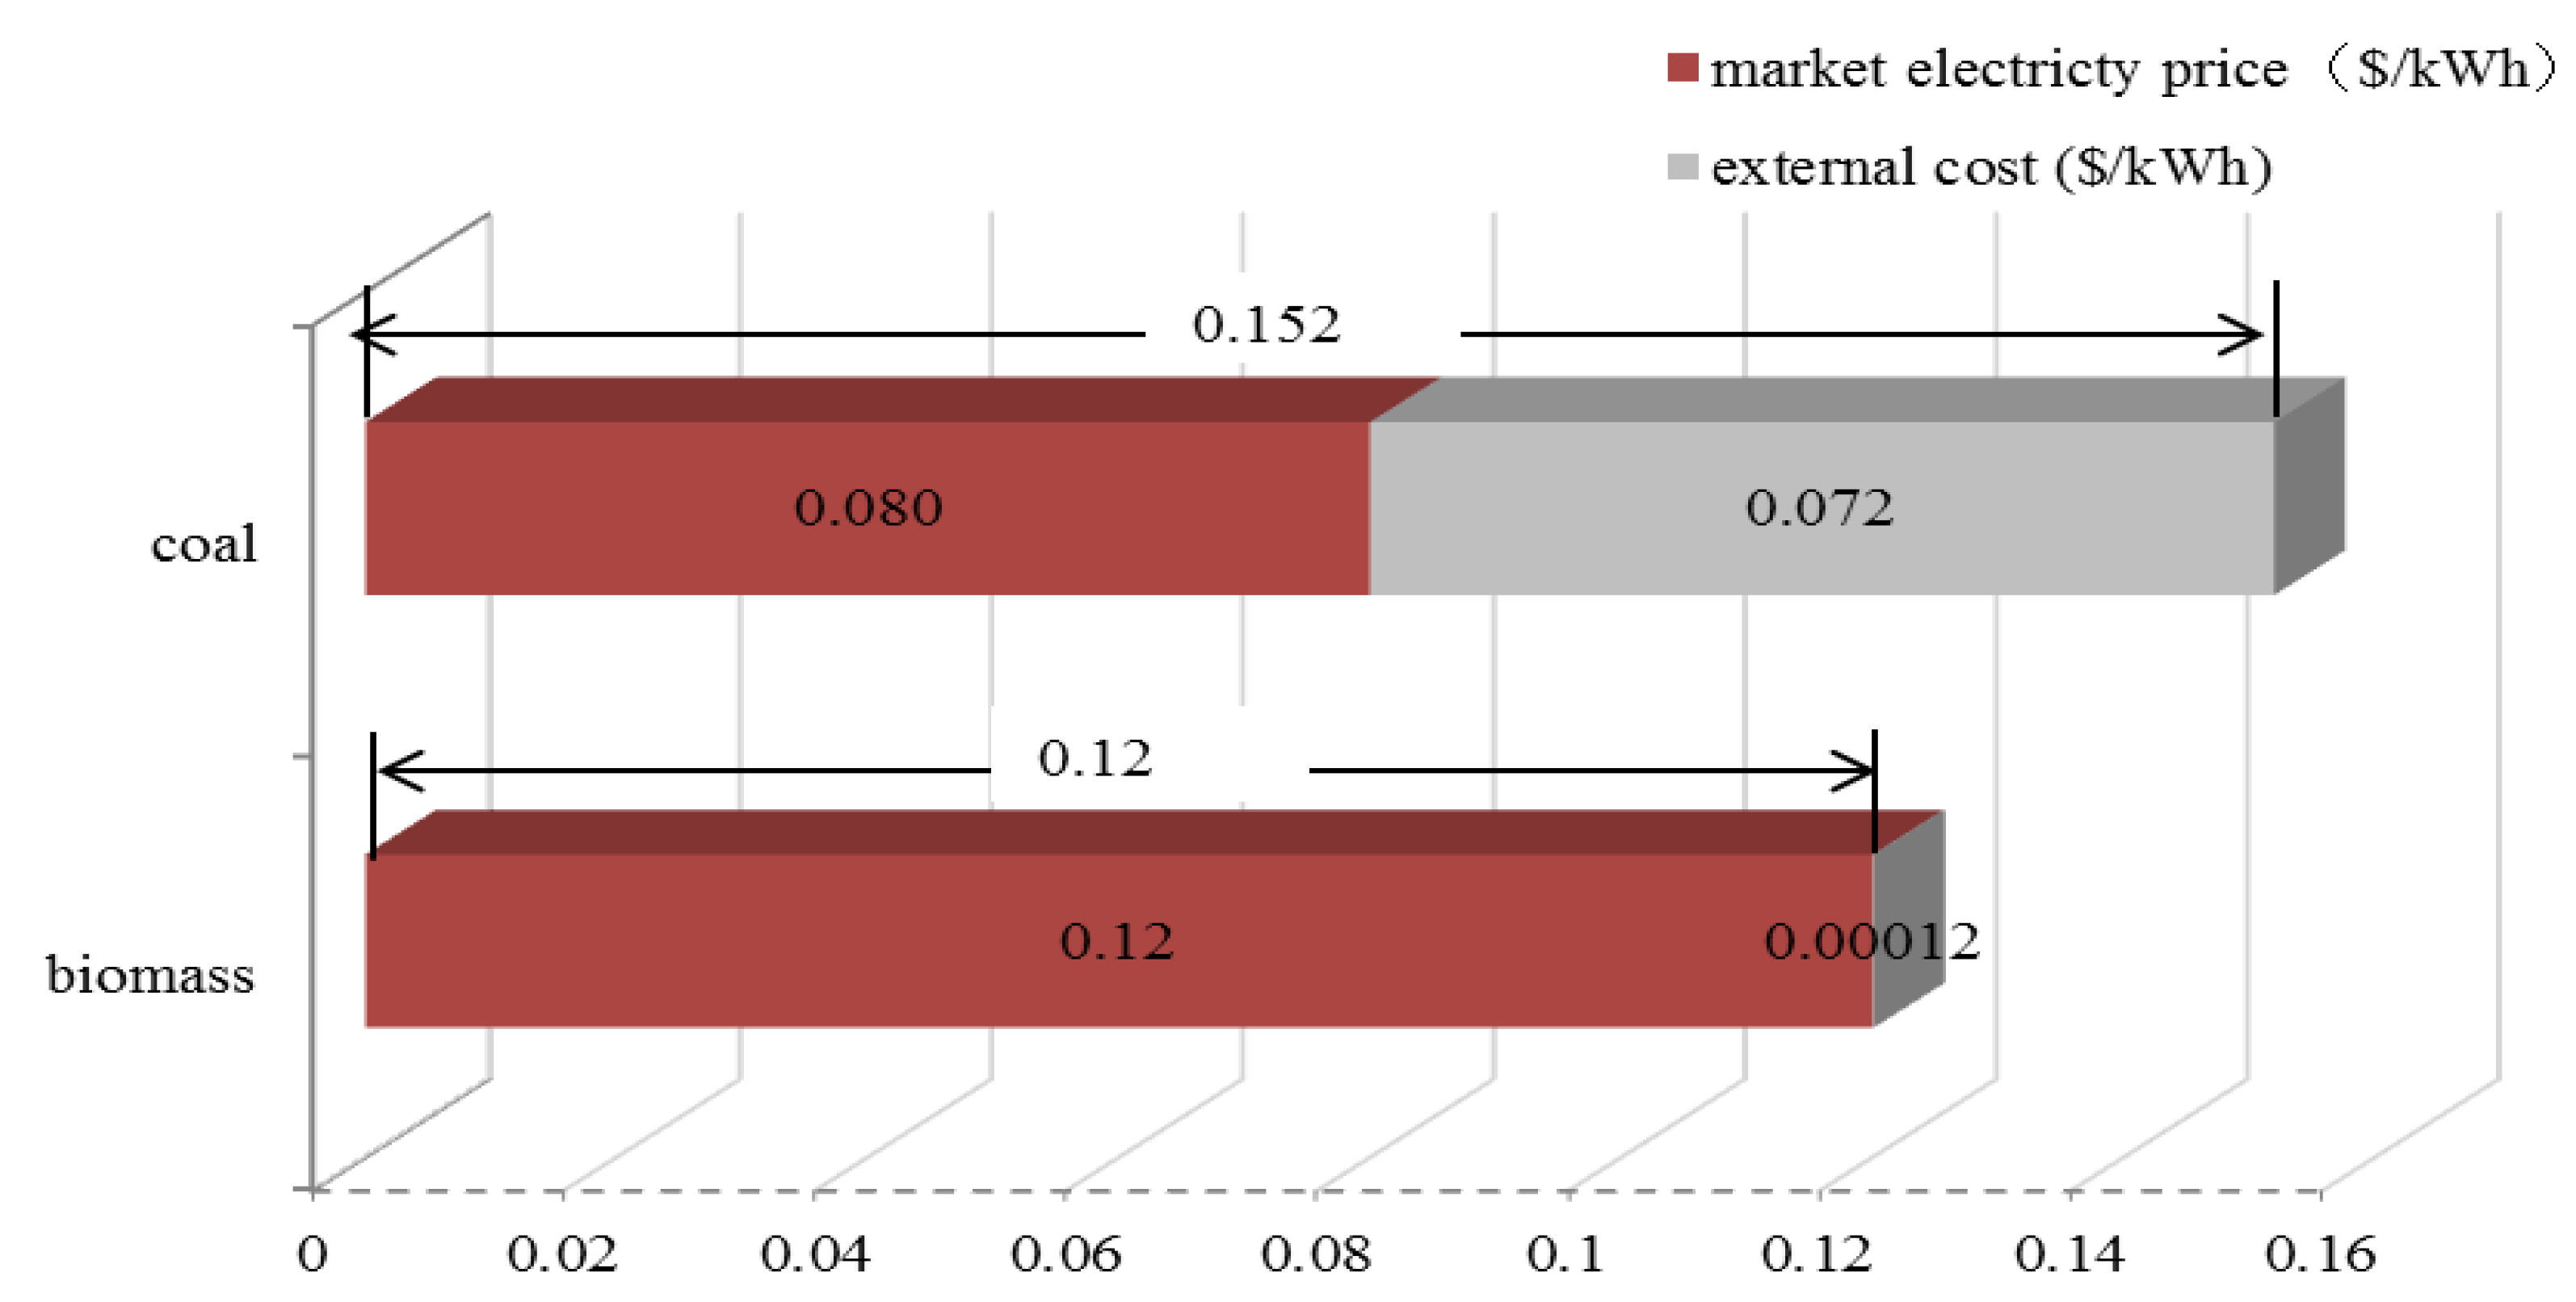
Comparing the external costs of a coal-fired power plant and biomass power plant with the current electricity prices, respectively, the external cost of coal-fired power plant is almost 90% of the current price of coal, while the external costs of biomass power plant is 1/1,000 of the current price of electricity generated by biomass power plants. The external cost of the 30 MW biomass power plant is almost negligible compared with that of the coal-fired power plant (
Figure 7). If the external cost of each power generation is added to each of the current electricity prices, the total price of coal electricity is 1.9 times higher than its original price, and considerably higher than that of biomass electricity (
Figure 7). Today, the primary reason biomass energy is less used and more difficult to promote is that coal is considered a more economical commodity. Results of the above analyses demonstrate that the coal is not economical, it is cheap. However, the apparently cheap coal actually sacrifices the natural environment, sustainable society and human happiness. The results also demonstrate that despite its lower generating capacity and higher raw material costs, a biomass power plant is not inferior to a coal-fired power plant.
Figure 7.
Comparison of external costs and total lifecycle cost of biomass power generation and coal-fired power generation.
Figure 7.
Comparison of external costs and total lifecycle cost of biomass power generation and coal-fired power generation.
It is noteworthy that reducing or eliminating the utilization of coal fuel is possible because China, especially Northeast China, is a large agricultural country with vast farmland that produces abundant biomass. Referring to total external costs of the coal-fired and biomass power plants in this study, as shown in
Table 3 and
Table 9, for the 600 MW (3600 GWh) coal-fired power plant, $260 million external cost would occur and the 30 MW (200 GWh) biomass power plant cost $ 24,771 external cost. Replacement part of coal-fired power generation with biomass power generation would potentially reduce a significant amount of external costs, particularly in abundant biomass resources areas.
Table 10 shows the estimated quantity of pollutant emissions and the external costs of the two power plants by pollutant. In the lifecycle of the 600 MW coal-fired power plant, 10 types of pollutants are emitted in considerably larger amounts in comparison to the biomass power plant. Among these pollutants, the quantity of CO
2, SO
2, NO
X, CO and PM emission from the coal-fired power plant is 162 times, 2,941 times, 4,013 times, 181 times and 8,095 times, respectively, that of the biomass power plant. External costs associated with SO
2, NO
X, and PM for the biomass power plant are particularly lower than those with coal-fired power plant. In addition, during the coal mine construction and coal mining phase, surface collapse and geological disasters would occur, causing high economic damage and destroying large areas of grassland and forest. The occupational disease and mortality costs are not as high as pollutant emission costs and disaster costs.
The external costs in coal mine construction, coal mining, heath impact and mortality, transport are extremely small and even can be neglected compared with those of coal combustion; however, it is necessary to be aware of the occurrence of those costs. Furthermore, there is much room for improvement of estimation of these costs. Besides, in this study, the CH
4 value is estimated based on Global-warming potential 100 (GWP 100) from IPCC 2013 [
63] which is 34. If GWP 20 of 72 is taken account, the external cost of coal mining stage would be $0.0055/kwh and the external cost of coal-fired power plant would increase to $0.074/kwh. This improvement issue is discussed in the next section.
Note that the biomass power plant has effects of reducing air pollution, that is, negative external costs, although they are not quantified in these analyses. If the crop straw cannot be recycled as resources, it is burned in the open field, which can seriously pollute the environment. Although the government imposes regulations on prohibiting burning crop straw in open fields, farmers have no other alternative to deal with large amounts of crop straw. A major factor causing the haze in Harbin in October 2013 was the burning of crop straw in open fields [
85]. The promotion of biomass power plant is expected to reduce this haze.
Table 10.
Comparison of a 600 MW coal-fired power plant and a 30 MW biomass power plant.
Table 10.
Comparison of a 600 MW coal-fired power plant and a 30 MW biomass power plant.
| Comparison Component | Comparison Item | Coal-Fired Power Plant | Biomass Power Plant |
|---|
| Quantity (g/kwh) | Cost (US$/kwh) | Quantity (g/kwh) | Cost (US$/kwh) |
|---|
| Pollutant | CO2 | 648.6 | 1.8 × 10⁻² | 4.0 | 1.1 × 10⁻⁴ |
| SO2 | 6.48 | 3.1 × 10⁻² | 0.0022 | 1.0 × 10⁻⁵ |
| NOX | 3.17 | 1.4 × 10⁻² | 0.00079 | 3.5 × 10⁻⁶ |
| CO | 0.103 | 1.7 × 10⁻⁵ | 0.00057 | 9.3 × 10⁻⁸ |
| PM | 0.170 | 3.3 × 10⁻³ | 0.000021 | 4.1 × 10⁻⁷ |
| CH4 | 2.14 | 2.0 × 10⁻³ | – | – |
| Fly ash | 41.2 | 9.5 × 10⁻⁴ | – | – |
| Furnace residue | 11.3 | 1.9 × 10⁻⁴ | – | – |
| Gangue | 50.5 | 6.1 × 10⁻⁵ | – | – |
| Contaminated water | – | 1.3 × 10⁻³ | – | – |
| Disaster | Surface collapse | – | 1.2 × 10⁻⁴ | – | – |
| Geological disaster | – | 4.6 × 10⁻⁴ | – | – |
| Health and mortality | Occupational disease | – | 2.3 × 10⁻⁵ | – | – |
| Mortality | – | 4.9 × 10⁻⁵ | – | – |
| Total | – | – | 0.072 | 4.0 | 1.2 × 10⁻⁴ |
7.2. Precision of Estimation of External Costs
Uncertainties persist in this study. It is imperative to accurately estimate the damage cost of each pollutant and disaster to fully comprehend the external costs. However, some estimations are made with insufficient precision. In this section, reasons for insufficient precision are discussed. First, referring to coal-fired power plants, most researchers focus on the existing adverse effects on air pollution, rather than the impact on water and land which can threaten the living environment in the long run. If adverse impacts on water, land and human health in coal mining area were determined with proper metrics, the external costs would be more reasonable. Second, among the pollutants, CO
2, SO
2, CO, NO
X, and PM have international damage cost standards calculated and estimated by European countries. However, regarding other pollutants such as fly ash, furnace residue, gangue and contaminated water, there are no international damage cost standards. Third, in the phases of coal mine construction and coal mining, surface collapse and geological damage destroy the ecological balance and take a considerable term to recover from. The long-term losses can be even higher than the external costs calculated in
Table 10. However, there is no research on the external costs of geological damage and recover cost. The calculation in this paper is based on national amendment compensation, which does not account for recovery and sustainable development costs. These factors influence the precision in estimating the external costs of coal-fired power plant. Fourth is about occupational disease and mortality costs.
Figure 5 shows that health impact and mortality costs constitute only a small part of the external costs of a coal-fired power plant in its lifecycle. However, the calculation is based on the unsound compensation system for occupational disease and mortality and coal mine owners’ improprieties to evade compensation to mine workers. Specifically, one reason for lower external costs is that the compensation from coal mine owners in China are significantly lower than that of developed countries [
86]. Second, some coal mine owners try to conceal their occupational disease and mortality records. Furthermore, a large amount of compensation is deducted by the local government; this deductive value is not counted or included in the health impact and mortality costs.
7.3. Direction of Sustainable Energy Policies and Overall Measures
This section first demonstrates that biomass is a sustainable energy source in Northeast China on the basis of the findings in the previous sections and second suggests overall measures to promote biomass power generation.
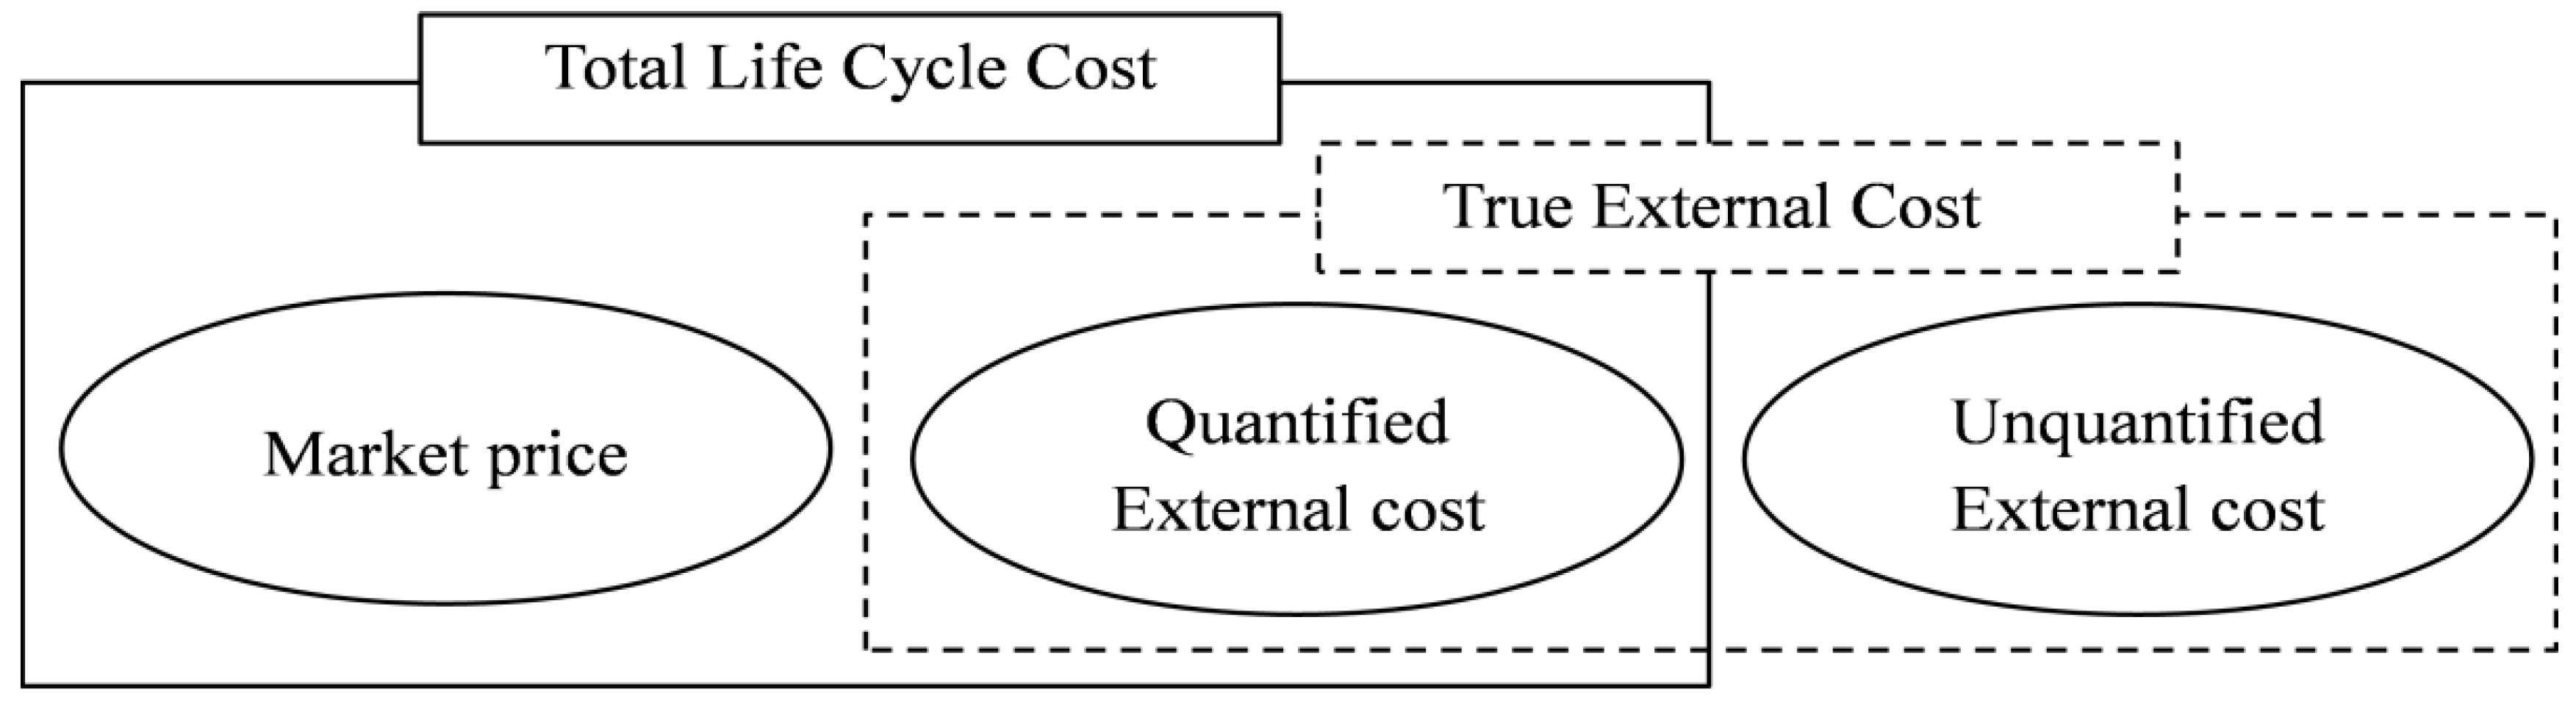
First, in the total lifecycle cost, biomass power plants are superior to coal-fired power plants. The total lifecycle cost in this research includes electricity market price and quantified external costs (
Figure 8). However, for coal-fired power plants, there is still a large part of unquantified external costs because of insufficient precision evaluation standards. Based on the results in the research, the total lifecycle costs of a coal-fired power plant are considerably higher than those of a biomass power plant, that is, the competitive cost of a biomass power plant are higher than that of a coal-fired power plant. As shown in
Figure 8, the total lifecycle cost of a biomass power plant and coal-fired power plant is $0.12 per kWh and $0.152 per kWh.
Figure 8.
Relationship of total lifecycle cost and true external cost.
Figure 8.
Relationship of total lifecycle cost and true external cost.
Second, in line with the external costs and quantity of pollutant emissions, the biomass power plant is far superior to the coal-fired power plant. In addition, biomass has negative externality. Recycling a large amount of crop straw as energy resources reduces the haze occurring from burning straw in open fields.
Third, the biomass power plant can accommodate social characteristics, such as an abundant straw crop in Northeast China. As mentioned in the Introduction, if the total crop straw production in Northeast China were used for electricity generation, theoretically, 30% of the demand could be supplied. However, less than 5% of electricity is now generated by biomass. The biomass power plant in Wangkui can generate approximately 200,002,600 kWh. That is, a single 30 MW biomass power plant can satisfy the electricity demand in the entire area. Thus, biomass is a sustainable energy source in Northeast China with higher economic competitiveness, environmental performance and better social accommodation.
Three overall measures are suggested and discussed to realize the energy policy direction: a market price mechanism to incorporate external costs, governmental subsidy systems and policy implications of the size and capacity of biomass power plants as compared to coal power plants. If the market price setting is based on the total lifecycle cost, the biomass electricity can be supported by the general public. Thus, incorporating the external costs of coal-fired and biomass power plants into the price of the electricity generated by each type can be a potentially effective policy step with regard to reducing their negative impacts and moving toward sustainable energy use. Strengthening the governmental subsidy systems is proposed because they are expected to financially and technically ease the operations of biomass power plants and sustainably develop the biomass power industry. In terms of sustainable energy supply and biomass power development, size and capacity of biomass and coal-fired power plants are proposed to enhance the efficiency of electricity generation and environmental performance.
8. Conclusions
This paper intends to advance the understanding of the measurable and quantifiable costs of a 600 MW coal-fired generation power plant and 30 MW biomass power plant. Concretely, the structures of external costs are built in line with coal-fired and biomass power plant life cycle activities. The external cost of coal-fired power plant and biomass power plant was compared, using the lifecycle approach. In addition, the external costs of a biomass power plant are calculated for each stage for comparison with those of a coal-fired power plant. This approach was undertaken because understanding the whole measureable and quantifiable cost structure at the lifecycle stages of the coal-fired generation power plant and the biomass power plant would be helpful for Chinese people to have correct perception of the true external costs of those two power plant types.
The results highlight that the external costs of a coal-fired plant are 0.072 US $/kWh, which are much higher than that of a biomass power plant, 0.00012 US$/kWh. The external cost of coal-fired power generation is as much as 90% of the current price of electricity generated by coal, while the external cost of a biomass power plant is 1/1,000 of the current price of electricity generated by biomass. If the current electricity price is combined with the external costs quantified in this study, the total lifecycle costs of coal-fired electricity and biomass power generation amount to $0.152/kWh and $0.12/kWh, respectively. In addition, for a biomass power plant, external costs associated with SO2, NOX, and PM are particularly lower than those of a coal-fired power plant. It should also be noted that the biomass power plant has the positive effect of reducing air pollution, that is, negative external costs though they are not quantified in these analyses.
Some estimations of external costs of coal-fired power plants are made with insufficient precision. First, proper metrics have not been developed to represent the impact on water and land which can threaten the living environment in the long run. Second, among pollutants such as fly ash, furnace residue, gangue and contaminated water, there are no international damage cost standards. Third, in the phases of coal mine construction and coal mining, the estimation does not account for recovery and sustainable development costs. Fourth, occupational disease and mortality costs are estimated based on the existing unsound compensation system.
Drawing on the present study, it is worth studying several critical issues related to localization in the future. Although crop straw is a promising alternative energy for fossil energy, several critical localization issues need to be addressed. First, to improve environmental conditions in area where fossil fuel electricity is generated, such as Shanxi Province, Hegang city and Shuang Yashan city in Heilongjiang Province, the full development and utilization of straw residues is significant to replace certain small fossil fuel power plants. Second, farmers’ willingness and risk of unwillingness to sell straw and agents’ interests should be investigated to build a close co-ordination mechanism among farmers, agents and power plants. Third, a cooperation mechanism with factories that use crop straw as feedstock is needed to fix a reasonable crop straw price to reduce vicious straw competition and guarantee sufficient crop straw supply. Meanwhile, a construction plan of biomass power plants should be regulated in detail and strictly implemented. These issues are critical for China to design policies to optimize energy structure, utilize agricultural waste and support biomass power development.
Acknowledgments
This study was funded by Kochi University of Technology, Tosayamada, Kami city, Kochi, Japan. The authors are grateful to Lifeng Wang, at the National Bio Energy power plant, China, Yu Sun, at Wangkui Conunty office, China, Zhiwei Li, at Kochi University of Technology, Japan, for their advice, comments and encouragement. We are particularly very much thankful to the reviewers of this paper, whose comments and suggestions were very helpful in improving the manuscript.
Author Contributions
Lingling Wang contributed to the study design, data acquisition and analysis, and drafted the manuscript. Tsunemi Watanabe was involved in data acquisition and analysis and revision of the manuscript. Zhiwei Xu worked on aspects of the study relating to the coal-fired power plant and data analysis. All authors have read and approved the final manuscript.
Conflicts of Interest
The authors declare no conflict of interest.
References
- Lovins, A.B. Rocky Mountain Institute. In Reinventing Fire; Chelsea Green Publishing: White River Junction, VT, USA, 2011; pp. 8–9. [Google Scholar]
- China Electric Power Committee. China Electric Power Yearbook 2013; China Electric Power Publishing House: Beijing, China, 2013. (In Chinese) [Google Scholar]
- Du, L.; He, Y.; Yan, J. The effects of electricity reforms on productivity and efficiency of China’s fossil-fired power plants: An empirical analysis. Energy Econ. 2013, 40, 845–857. [Google Scholar] [CrossRef]
- Statistical Yearbook of Heilongjiang Province; China Statistic Press: Beijing, China, 2010. (In Chinese)
- Statistical Yearbook of Jilin Province; China Statistic Press: Beijing, China, 2010. (In Chinese)
- Statistical Yearbook of Liaoning Province; China Statistic Press: Beijing, China, 2010. (In Chinese)
- Pigou, A.C. The Economics of Welfare; Macmillan: London, UK, 1920. [Google Scholar]
- Coase, R. The problem of social cost. J. Law Econ. 1960, 3, 1–44. [Google Scholar] [CrossRef]
- Viscusi, W.K.; Magat, W.A.; Dreyfus, M.; Gentry, W.; Carlin, A. Environmentally Responsible Energy Pricing. Available online: http://yosemite.epa.gov/ee/epa/eerm.nsf/vwAN/EE-0070B.pdf (accessed on 11 February 2015).
- Hall, D.C. Preliminary estimates of cumulative private and external costs of energy. Contemp. Econ. Policy 1990, 8, 282–307. [Google Scholar]
- Mahapatra, D.; Shukla, P.; Dhar, S. External cost of coal based electricity generation: A tale of Ahmedabad city. Energy Policy 2012, 49, 253–265. [Google Scholar] [CrossRef]
- Sundqvist, T. Power Generation Choice in the Presence of Environmental Externalities. Ph.D. Thesis, Division of Economics, Lulea University of Technology, Lulea, Sweden, February 2002. [Google Scholar]
- Schleisner, L. Comparison of methodologies for externality assessment. Energy Policy 2000, 28, 1127–1136. [Google Scholar] [CrossRef]
- Stirling, A. Limits to the value of external costs. Energy Policy 1997, 25, 517–540. [Google Scholar] [CrossRef]
- Rafaj, P.; Kypreos, S. Internalisation of external cost in the power generation sector: Analysis with global multi-regional MARKAL model. Energy Policy 2007, 35, 828–843. [Google Scholar] [CrossRef]
- Dimitrijević, Z.; Tatić, K.; Knezevic, A.; Salihbegović, I. External costs from coal-fired thermal plants and sulphur dioxide emission limit values for new plants in Bosnia and Herzegovina. Energy Policy 2011, 39, 3036–3041. [Google Scholar] [CrossRef]
- Rentizelas, A.; Georgakellos, D. Incorporating life cycle external cost in optimization of the electricity generation mix. Energy Policy 2014, 65, 134–149. [Google Scholar] [CrossRef]
- Shafie, S.M.; Mahlia, T.M.I.; Masjuki, H.H. Life cycle assessment of rice straw co-firing with coal power generation in Malaysia. Energy 2013, 57, 284–294. [Google Scholar] [CrossRef]
- Zuwata, J. Life cycle approach for energy and environmental analysis of biomass and coal co-firing in CHP plant with backpressure turbine. J. Clean. Prod. 2012, 35, 164–175. [Google Scholar] [CrossRef]
- Heller, M.C.; Keoleian, G.A.; Mann, M.K.; Volk, T.A. Life cycle energy and environmental benefits of generating electricity from willow biomass. Renew. Energy 2004, 29, 1023–1042. [Google Scholar] [CrossRef]
- Kimming, M.; Sundberg, C.; Nordberg, A.; Baky, A.; Bernesson, S.; Norén, O.; Hansson, P.A. Biomass from agriculture in small-scale combined heat and power plants—A comparative life cycle assessment. Biomass Bioenergy 2011, 35, 1572–1581. [Google Scholar] [CrossRef]
- National Research Council. The Hidden Costs of Energy: Unpriced Consequences of Energy Production and Use; National Academy Press: Washington, DC, USA, 2009. [Google Scholar]
- Nkambule, N.P.; Blignaut, J.N. The external costs of coal mining: The case of collieries supplying Kusile power station. J. Energy S. Afr. 2012, 23, 86–93. [Google Scholar]
- Grausz, S. The Social Cost of Coal: Implications for the World Bank; Climate Advisers: Washington, DC, USA, 2011. [Google Scholar]
- Castelo Branco, D.A.; Moura, M.C.P.; Szklo, A.; Schaeffer, R. Emissions reduction potential from CO2 capture: A life-cycle assessment of a Brazilian coal-fired power plant. Energy Policy 2013, 61, 221–1235. [Google Scholar] [CrossRef]
- Sevenster, M.; Croezen, H.; van Valkengoed, M.; Markowska, A.; Dönszelmann, E. Report of External Costs of Coal. Global Estimate; CE Delft: Delft, The Netherlands, 2008. [Google Scholar]
- Ghose, M.K. Generation and quantification of hazardous dusts from coal mining in the Indian context. Environ. Monit. Assess. 2007, 130, 35–45. [Google Scholar] [CrossRef] [PubMed]
- Epstein, P.R.; Buonocore, J.J.; Eckerle, K.; Hendryx, M.; Stout, B.M., III; Heinberg, R.; Clapp, R.W.; May, B.; Reinhart, N.L.; Ahern, M.M.; et al. Full cost accounting for the life cycle of coal. Ann. N. Y. Acad. Sci. 2011, 1219, 73–98. [Google Scholar] [CrossRef] [PubMed]
- Fox, J.F.; Campbell, J.E. Terrestrial carbon disturbance from mountaintop mining increases lifecycle emissions for clean coal. Environ. Sci. Technol. 2010, 44, 2144–2149. [Google Scholar] [CrossRef] [PubMed]
- Garg, A.; Pulles, T. Guidelines for National Greenhouse Gas Inventories, Volume 2: Energy. Available online: https://www.ipcc.ch/meetings/session25/doc4a4b/vol2.pdf (accessed on 11 February 2015).
- European Environment Agency. EMEP/CORINAIR Emission Inventory Guidebook-2006, 3rd ed.; European Environment Agency: Copenhagen, Denmark, 2006. [Google Scholar]
- Fankhauser, S. Global Warming Damage Costs: Some Monetary Estimates; CSERGE-GEC Working Paper; University College London and University of East Anglia: Norwich, England, UK, 1992; CSERGE GEC Working Paper 92-29. [Google Scholar]
- Hohmeyer, O. Social Costs of Energy Consumption; Springer: Berlin, Germany, 1988. [Google Scholar]
- Bernow, S.; Marron, D. Valuation of Environmental Externalities for Energy Planning and Operations; May 1990 Update (Tellus Institute Report 90-SB01); Tellus Institute: Boston, MA, USA, 1990. [Google Scholar]
- Ottinger, R.L.; Wooley, D.R.; Robinsson, N.A.; Hodas, D.R.; Babb, S.E. Environmental Costs of Electricity; Oceana Publications Inc.: New York, NY, USA, 1990. [Google Scholar]
- Bickel, P.; Friedrich, R. (Eds.) ExternE Externalities of Energy Methodology 2005; European Communities: Luxembourg, 2005.
- Climate Change 2001: The Scientific Basis, Contribution of Working Group I to the Third Assessment Report of the Intergovernmental Panel on Climate Change; IPCC TAR WG1 (2001); Houghton, J.T.; Ding, Y.; Griggs, D.J.; Noguer, M.; van der Linden, P.J.; Dai, X.; Maskell, K.; Johnson, C.A. (Eds.) Cambridge University Press: Cambridge, UK, 2001.
- Climate Change 2013: The Physical Science Basis; Contribution of Working Group I to the Fifth Assessment Report of the Intergovernmental Panel on Climate Change; Cambridge University Press: New York, NY, USA, 2013; Chapter 8; pp. 711–714.
- Preiss, P.; Friedrich, R.; Klotz, V. Report on the Procedure and Data to Generate Averaged/Aggregated Data; deliverable No. 1.1-RS3a, IP NEEDS, project no. 502687. Sixth Framework Programme: Brussels, Belgium, 2008. Available online: http://www.needs-project.org/index.php?Itemid=66 (accessed on 12 February 2015).
- European Commission. External Costs Research Results on Socio-Environmental Damages Due to Electricity and Transport External Cost. 2003. Available online: http://ec.europa.eu/research/energy/pdf/externe_en.pdf (accessed on 10 March 2013).
- National Bureau of Statistics of China (NBSC). China Environmental Statistical Year Book 2010; China Statistic Press: Beijing, China, 2010. (In Chinese) [Google Scholar]
- Bjureby, E.; Britten, M.; Cheng, I.; Kazmierska, M.; Mezak, E.; Munnik, V.; Nandi, J.; Pennington, S.; Rochon, E.; Schulz, N.; et al. The True Cost of Coal: How People and the Planet are Paying the Price for the World’s Dirtiest Fuel; Greenpeace: Amsterdam, The Netherlands, 2008. [Google Scholar]
- Mishra, S.K. Estimation of Externality Costs of Electricity Generation from Coal: An OH-MARKAL Extension; The Ohio State University: Columbus, OH, USA, 2009. [Google Scholar]
- IPCC. Climate Change 2007 Synthesis Report; The Intergovernmental Panel on Climate Change: Geneva, Switzerland, 2007. [Google Scholar]
- Spath, P.; Mann, M.; Kerr, D. Life Cycle Assessment of Coal-Fired Power Production; National Renewable Energy Lab.: Golden, CO, USA, 1999. [Google Scholar]
- Kathrin, V.; Christian, B.; Céline, B. Life cycle assessment of carbon capture and storage in power generation and industry in Europe. Int. J. Greenh. Gas Control 2013, 16, 91–106. [Google Scholar] [CrossRef]
- Roberto, T.; Alessio, B.; Thomas, A. Life cycle assessment (LCA) of electricity generation technologies: Overview, comparability and limitations. Renew. Sustain. Energy Rev. 2013, 28, 555–565. [Google Scholar] [CrossRef]
- Watson, R.T.; The Core Writing Team; IPCC. Third Assessment Report of the International Panel on Climate Change; Cambridge University Press: Cambridge, UK, 2001; pp. 21–22. [Google Scholar]
- Pretorius, K. Coal Mining and Combustion: Internalising the Cost for a Fair Climate Change Debate; Federation for a Sustainable Environment: Randburg, South Africa, 2009. [Google Scholar]
- Katzer, J.; Ansolabehere, S.; Beer, J.; Deutch, J.; Ellerman, A.D.; Friedmann, S.J.; Herzog, H.; Jacoby, H.; Joskow, P.; McRae, G.; et al. The Future of Coal: Options for a Carbon-Constrained World; Massachusetts Institute of Technology: Cambridge, MA, USA, 2007. [Google Scholar]
- Cai, W.; Wang, C.; Wang, K.; Zhang, Y.; Chen, J. Scenario analysis on CO2 emissions reduction potential in China’s electricity sector. Energy Policy 2007, 35, 6445–6456. [Google Scholar] [CrossRef]
- Palmer, M.A.; Bernhardt, E.S.; Schelsinger, W.H. Mountaintop mining consequences. Science 2010, 327, 148–149. [Google Scholar] [CrossRef] [PubMed]
- Hendryx, M.; Ahern, M. Relations between health indicators and residential proximity to coal mining in West Virginia. Am. J. Public Health 2008, 98, 669–671. [Google Scholar] [CrossRef] [PubMed]
- Hendryx, M.; Ahern, M. Mortality in Appalachian coal mining regions: The value of statistical life lost. Public Health Rep. 2009, 124, 541–550. [Google Scholar] [PubMed]
- Hendryx, M. Mortality from heart, respiratory, and kidney disease in coal mining areas of Appalachia. Int. Arch. Occup. Environ. Health 2009, 82, 243–249. [Google Scholar] [CrossRef] [PubMed]
- Trasande, L.; Landrigan, P.; Schechter, C. Public health and economic consequences of methylmercury toxicity to the developing brain. Environ. Health Perspect. 2005, 113, 590–596. [Google Scholar] [CrossRef] [PubMed]
- Hu, X.L. Chinese electricity generation and environmental problem. Chin. Energy 2005, 27, 10–17. [Google Scholar]
- Dan, M.; Dan, G. Study on ecological compensation mechanism in the development of mineral resources. Mod. Agric. Sci. 2009, 16, 59–61. (In Chinese) [Google Scholar]
- National Bureau of Statistics of China (NBSC), 1991–2008. China Statistical Yearbook 1991–2008; China Statistics Press: Beijing, China, 2008. (In Chinese) [Google Scholar]
- China Industry Research Reports. Consultation Report on Gangue Industry in China. 2008. Available online: http://www.chinairr.org (accessed on 14 February 2013). (In Chinese)
- Renfei, P. Study on Comprehensive Evaluation on Ecological Environment in Coal Mining and Ecological Compensation. Ph.D. Thesis, University of Mining, Beijing, China, 2010; pp. 45–46. [Google Scholar]
- Pope, C.A.; Dockery, D.W. Health effects of fine particulate air pollution: Lines that connect. J. Air Waste Manag. Assoc. 2006, 56, 709–774. [Google Scholar] [CrossRef] [PubMed]
- Shindell, D.; Lamarque, J.F.; Unger, N.; Koch, D.; Faluvegi, G.; Bauer, S.; Ammann, M.; Cofala, M.; Teich, H. Climate forcing and air quality change due to regional emissions reductions by economic sector. Atmospheric Chem. Phys. 2008, 8, 7101–7113. [Google Scholar] [CrossRef]
- Trasande, L.; Schechter, C.; Haynes, K.; Landrigan, P. Mental retardation and prenatal methylmercury toxicity. Am. J. Ind. Med. 2006, 49, 153–158. [Google Scholar] [CrossRef] [PubMed]
- National Bureau of Statistics of China (NBSC). China Statistical Yearbook 2008; China Statistics Press: Beijing, China, 2008. (In Chinese) [Google Scholar]
- State Administration of Work Safety. 2014. Available online: http://www.chinasafety.gov.cn/newpage/ (accessed on 24 March 2014). (In Chinese)
- Research Center of Obligation and Labor Union. Research Report on Occupational Disease in 2011; China Statistics Press: Beijing, China, 2011. (In Chinese) [Google Scholar]
- Yardley, J. As most of China celebrates New Year, a scramble continues in coal country. New York Times. 2 September 2008. Available online: http://www.nytimes.com/2008/02/09/world/asia/09iht-09china.9891162.html?pagewanted=all&_r=0 (accessed on 21 March 2014).
- China Statistic Yearbook from 1991 to 2008; State Administration of Work Safety: Beijing, China, 2008.
- Jacobs, A. Rescuers in China struggle to free 153 trapped miners. New York Times. 20 March 2010. Available online: http://www.nytimes.com/2010/03/30/world/asia/30china.html (accessed on 21 March 2014).
- Statistic Center of Railways Ministry. Railway Condensed Statistics; China Railway Press: Beijing, China, 2009. (In Chinese) [Google Scholar]
- Cai, H.; Xie, S.D. Determination of emission factors from motor vehicles under different emission standards in China. Acta Sci. Nat. Univ. Pekinensis 2010, 46, 319–326. (In Chinese) [Google Scholar]
- Statistical Yearbook of Coal Mine Industry in China; China Statistics Press: Beijing, China, 2008. (In Chinese)
- Chen, H. Research on the Unsafe Behaviors in China Coal Mine Accidents; Science Press: Beijing, China, 2006. (In Chinese) [Google Scholar]
- Chen, H.; Feng, Q.; Long, R.; Qi, H. Focusing on coal miners’ occupational disease issues: A comparative analysis between China and the United States. Saf. Sci. 2013, 51, 217–222. [Google Scholar] [CrossRef]
- Statistic of Ministry of Environmental Protection of China; China Statistics Press: Beijing, China, 2010.
- Levy, J.; Spengler, J. Modeling the benefits of power plant emission controls in Massachusetts. J. Air Waste Manag. Assoc. 2002, 52, 5–18. [Google Scholar] [CrossRef] [PubMed]
- Levy, J.; Baxter, L.; Schwartz, J. Uncertainty and variability in health-related damages from coal-fired power plants in the United States. Risk Anal. 2009, 29, 1000–1014. [Google Scholar] [CrossRef] [PubMed]
- Tunckaya, Y.; Koklukaya, E. Comparative prediction analysis of 600 MWe coal-fired power plant production rate using statistical and neural-based models. J. Energy Inst. 2015, 88, 11–18. [Google Scholar] [CrossRef]
- MEP; NDRC; NEA. Notification on Further Strengthening Management for the Environmental Impact Assessment about Biomass Power Generation Project. MEP Release No. 82. 2008. Available online: http://www.mep.gov.cn/gkml/hbb/bwj/200910/t20091022_174611.htm (accessed on 4 September 2008). [Google Scholar]
- China Meteorological Administration. Analysis of the Causes of Haze in China. Available online: http://www.cma.gov.cn/en2014/ (accessed 29 January 2013). (In Chinese)
- Editorial Board of China’s Rural Energy Yearbook; China Agricultural Press: Beijing, China, 2007. (In Chinese)
- Faaij, A.; Meuleman, B.; Turkenburg, W.; van Wijk, A.; Bauen, A.; Rosillo-Calle, F.; Hall, D. Externalities of biomass based electricity production compared with power generation from coal in the Netherlands. Biomass Bioenergy 1998, 14, 125–147. [Google Scholar] [CrossRef]
- Sáez, R.M.; Linares, P.; Leal, J. Assessment of the externalities of biomass energy, and a comparison of its full costs with coal. Biomass Bioenergy 1998, 14, 469–478. [Google Scholar] [CrossRef]
- Cai, Q.; Xu, Z.; Chang, H.; Shang, T. Several problems and countermeasures of coal resource exploitation in our country. Opencast Min. Technol. 2005, 5, 50–54. [Google Scholar]
- Zhao, X.; Liu, X.; Liu, P.; Feng, T. The mechanism and policy on the electricity price of renewable energy in China. Renew. Sustain. Energy Rev. 2011, 15, 4302–4309. [Google Scholar] [CrossRef]
© 2015 by the authors; licensee MDPI, Basel, Switzerland. This article is an open access article distributed under the terms and conditions of the Creative Commons Attribution license (http://creativecommons.org/licenses/by/4.0/).


