Article

Substitutability of Electricity and Renewable Materials for Fossil Fuels in a Post-Carbon Economy

by
Antonio García-Olivares
Spanish National Research Council (CSIC), Institute of Marine Sciences, Ps. Maritim de la Barceloneta 37-49, Barcelona 08003, Spain
Energies 2015, 8(12), 13308-13343; https://doi.org/10.3390/en81212371
Submission received: 7 September 2015 / Revised: 13 November 2015 / Accepted: 17 November 2015 / Published: 25 November 2015
(This article belongs to the Special Issue Economics of Bioenergy 2015)

Abstract

:
A feasible way to avoid the risk of energy decline and combat climate change is to build a 100% renewable global energy mix. However, a globally electrified economy cannot grow much above 12 electric terawatts without putting pressure on the limits of finite mineral reserves. Here we analyze whether 12 TW of electricity and 1 TW of biomass (final) power will be able to fuel a future post-carbon economy that can provide similar services to those of a contemporary economy. Contrarily to some pessimistic expectations, this analysis shows that the principle economic processes can be replaced with sustainable alternatives based on electricity, charcoal, biogas and hydrogen. Furthermore, those services that cannot be replaced are not as crucial so as to cause a return to a pre-industrial society. Even so, land transport and aviation are at the limit of what is sustainable, outdoor work should be reorganized, metal primary production should be based on hydrogen reduction when possible, mineral production should be increasingly based on recycling, the petrochemical industry should shrink to a size of 40%–43% of the 2012 petrochemical sector, i.e., a size similar to that the sector had in 1985–1986, and agriculture may require organic farming methods to be sustainable.

1. Introduction

It is not clear what level of energy consumption would allow a future 100% renewable energy (RE) mix. Some studies suggest that a RE mix would allow the onset of a new growth cycle based on green technologies until a final stationary state were reached with an input of energy larger or similar to the present one [1,2]. However, they also conclude that if the investment in electrification of the economy is not enough, the future stationary RE production could be under the present level. This scenario is close to the scenario of “energy decline” defended by [
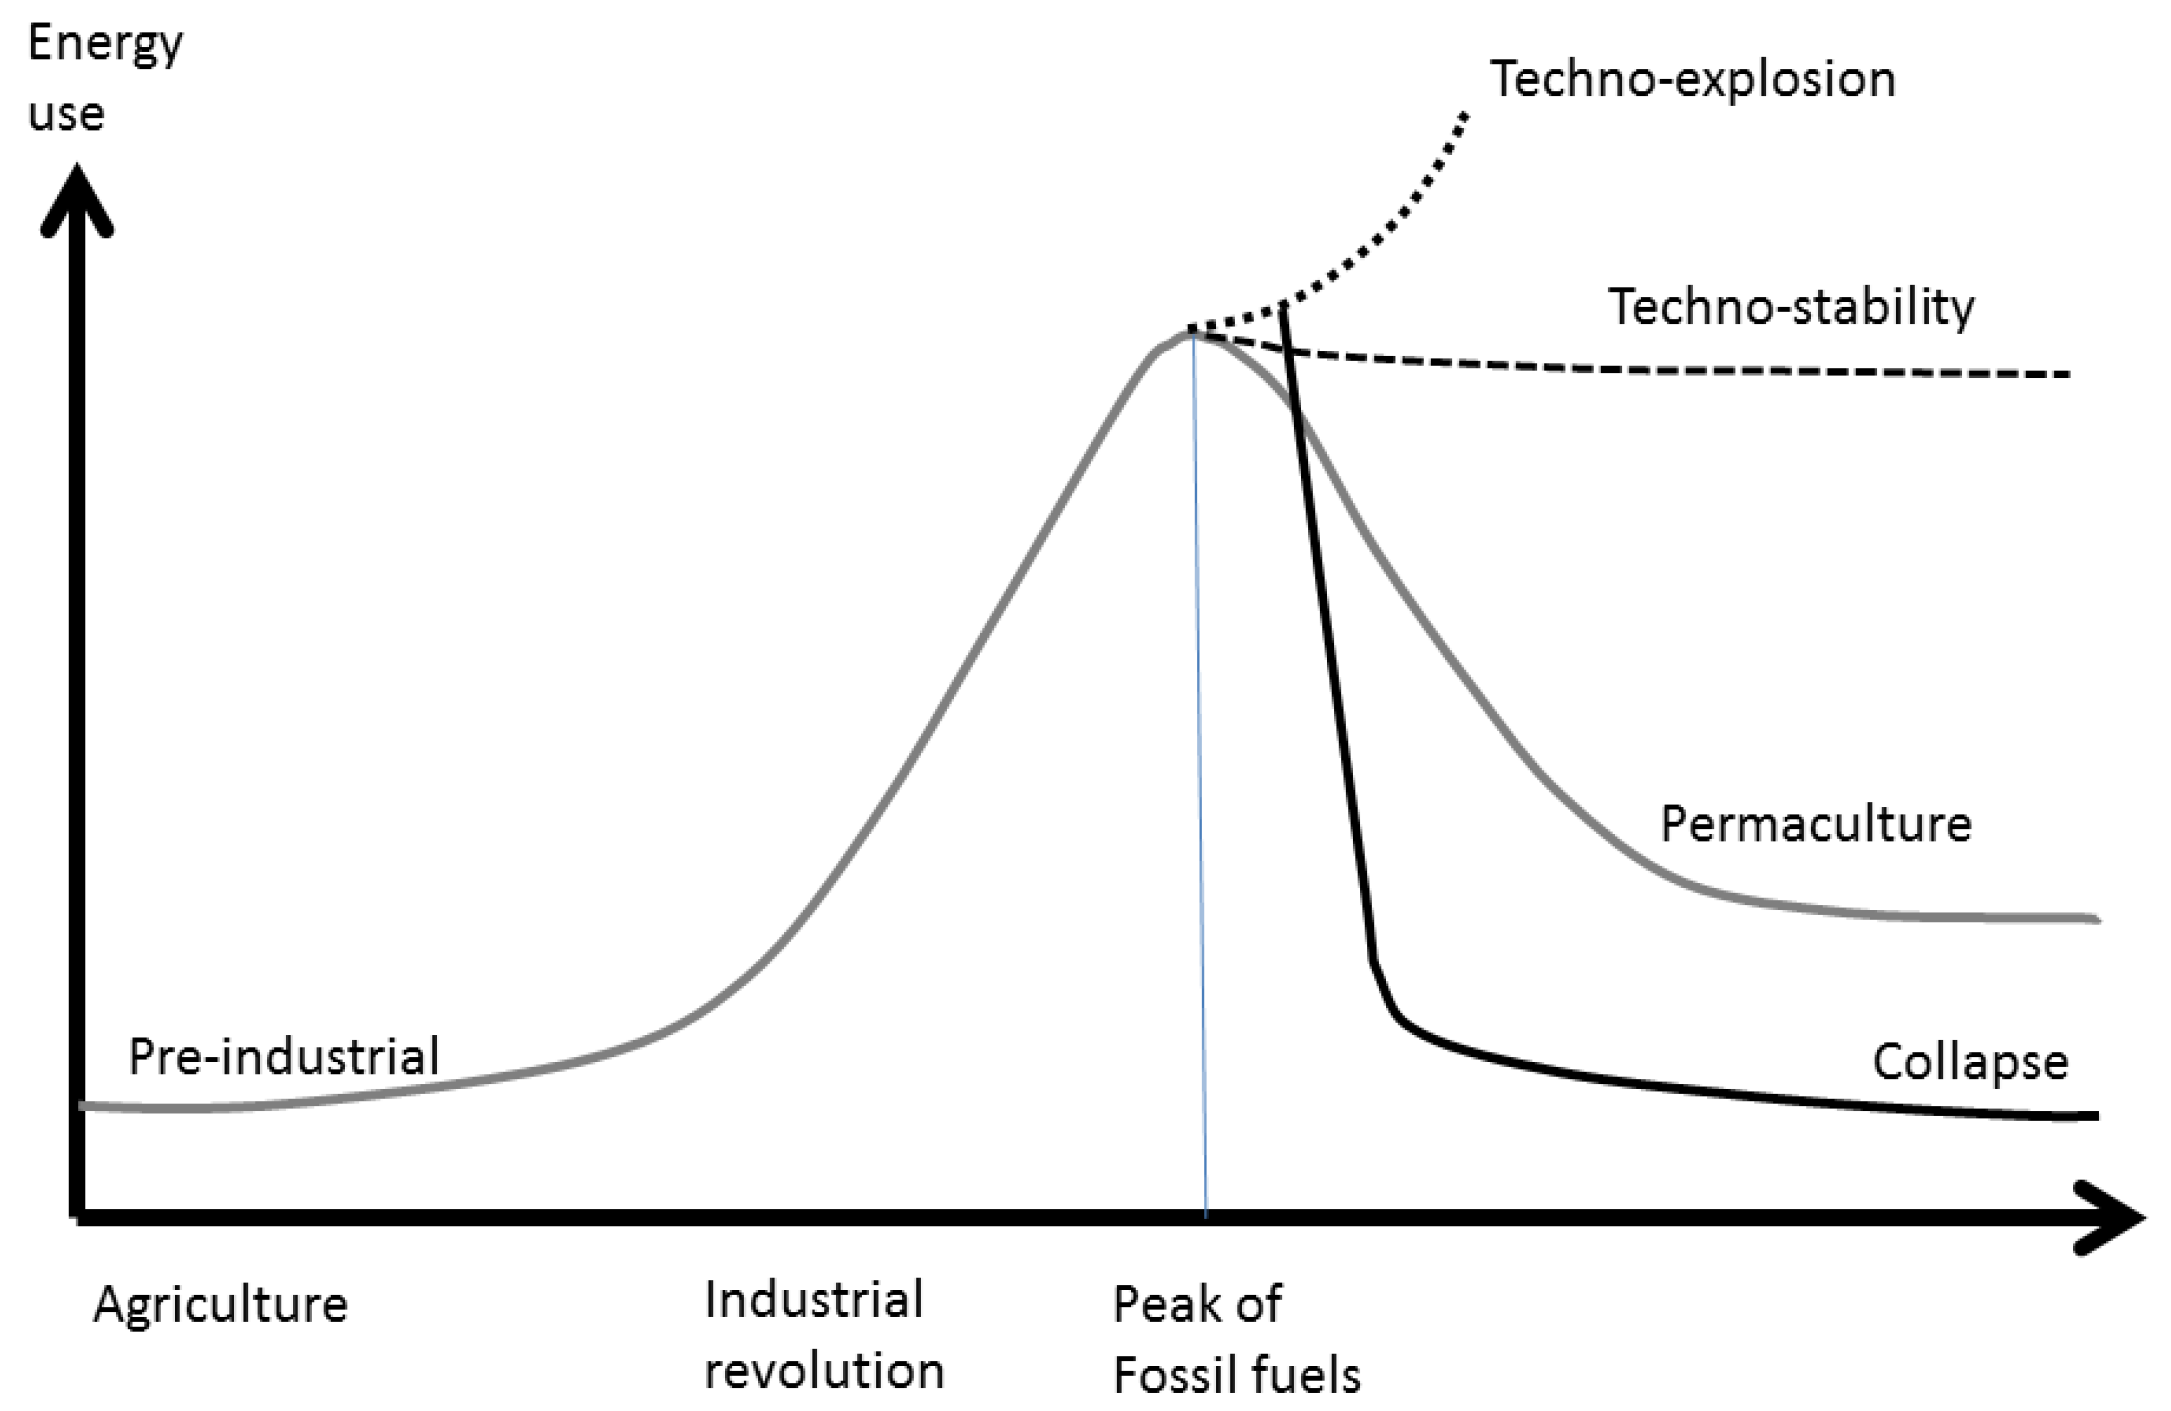
3]. Holmgren, like other members of the Permaculture Movement, assumes that the peak of fossil fuels will involve a reduction of energy input to the economy, because the substitution of renewables for fossil fuels will not be sufficient to maintain the enormous diversity of economic activities that were fueled by oil, coal and gas. He suggests that a lower energy density of RE will, over time, force a ruralisation of settlements and the economy, with less consumption of energy and resources, a progressive decline in human populations, and abandonment of high technology. He also outlines four potential ways in which our global society could respond and adapt to the fossil fuel peak and climate change (Figure 1): (i) techno-explosion; (ii) techno-stability; (iii) controlled energy descent; or (iv) collapse.
The techno-explosion scenario (i) would be related to the discovery of new energy sources that would allow a rising consumption of energy despite the fossil fuel decline; techno-stability (ii) would involve a deployment of RE sufficient to sustain stationary consumption of resources, population and economic activity, with new electric industrial processes able to maintain if not improve the quality of services currently available.
Figure 1. Four scenarios of energy consumption: techno-explosion, techno-stability, controlled energy descent (“permaculture”), and collapse, based on Holmgren [3].
Energies 08 12371 g001
The energy descent scenario (iii) would involve reduction of energy consumption and economic activity, adoption of “low technology” systems and permaculture farm techniques, and a final stationary energy consumption something over the pre-industrial level; finally, the collapse scenario (iv) would be an uncontrolled breakdown of economic and social systems close to the Duncan [4] projection. It would involve a major “die-off” of human population and a loss of the knowledge and infrastructure necessary for industrial civilization.
We consider implausible the techno-explosion scenario because new technologies and energy systems take about 50 years to diffuse throughout the economy [5]. Thus, the new energy systems that will replace fossil fuels in fifty years are most probably those that are currently being tested, i.e., renewables. However, RE deployment is very dependent upon a set of materials with limited reserves, especially copper [1,6]. Therefore, it is highly improbable that a 100% RE economy may continue the customary exponential growth of energy supply, as is discussed in Section 2.
We assume that our society has enough means and prudence to avoid the collapse scenario at any price. As was discussed by [6], RE technologies are presently available which allow the supply of about 12 TW of electricity globally without shrinking present reserves of copper, lithium and nickel. It is improbable that, having a global energy source available, knowledge and technology will not be developed to use it efficiently. We do not believe in the cornucopian myth according to which there would always be enough energy resources if only the stock of knowledge increased quickly enough, but, in line with an argument used by Greer [7] we do believe that, provided a new energy source has been found, human ingenuity will create technologies able to exploit it, especially if the alternative is collapse.
The two remaining scenarios (ii and iii) are both plausible and we think that the evolution of our economy will be closer to (ii) or to (iii) depending on the degree of substitutability of electricity for fossil fuels in the present economy sectors, and the extent to which irreplaceable processes are crucial for the working of the rest of the economy.
In this study we take as a reference a future stationary economy based on a 100% renewable mix, and we evaluate which present economic processes should be replaced by others based on electricity and renewable feedstocks, the concrete form that the new processes should adopt in terms of materials and energy flows, and the degree of substitutability of the main economic sectors. The objective is envisage if a post-carbon society would be compatible with an industrial economy similar to the present one, and what would be the main changes that the different economic sectors would suffer in such future society.
Some studies have quantified the monetary [8] and energetic costs ([9], submitted) that infrastructures would require in a 100% RE economy. Here we assume a scenario where this huge investment has already taken place, and we focus on the main features of the resulting post-carbon sustainable economy.
The manuscript is organized as follows: Section 2 discusses the level of power that a 100% RE mix would be able to supply. Section 3, Section 4, Section 5 and Section 6 discuss the substitutability of the current fuel-based economic processes by electricity in a future stationary post-carbon society. The economic sectors analyzed are, respectively: agriculture, forestry and fisheries (Section 3), transportation (Section 4), commercial and residential sectors (Section 5), and industry (Section 6). Special care is taken in analyzing the main material and energy inputs of the industrial sector and their future substitutes, and the technical details of this discussion are shown in the Appendix. Section 7 studies the inputs of biomass, charcoal and biogas that such an RE mix would require and the limits that these materials would impose on the economy. Finally, Section 8 summarizes the main conclusions resulting from the analysis.

2. Energy Supply in a 100% RE Economy

In previous works [1,6] we have argued that the fossil fuels peak could take place around 2030. In that context, a feasible way to avoid the risk of energy decline and to combat climate change is to build a worldwide 100% renewable energy mix. However, a globally electrified economy cannot grow much above 12 year-average electric terawatts (TWe) without putting pressure on the limits of copper reserves. A way to achieve RE up to 12 TWe would involve deployment of floating turbines over 10% of the continental shelves to depths of 225 m, land turbines over 5% of non-frozen continental areas, and installation of concentrating solar power farms over 5% of the areas of high insolation (deserts). New photovoltaic (PV) silicon panels do not use silver metallization or other scarce materials and could contribute up to 1 TW of decentralized residential power. Hydroelectricity has a potential of 1 TW but a fraction of this would have to be sacrificed for energy storage purposes. Hydro, concentrating solar power, wave energy and grid integration at continental scales may be sufficient to fit supply to demand while avoiding intermittency [6,10].
In 2005 1.47 TW of primary biomass was used for energy purposes, resulting in 1 TW of final energy after discounting losses in transport and processing [11]. This consumption has not changed significantly over the last few decades and we can assume that it will remain the same in a future post-carbon society. Therefore, the total renewable power (including biomass) consumed by end users may be 13 TW, and the contribution of biomass to the renewable mix would be 8%.
An RE mix such as the one proposed above would have an Energy Return on Energy Investment (EROEI) of about 15, 35% lower than the estimated EROEI of the present energy mix. That should be sufficient to sustain an industrialized economy in the second half of this century provided substitution of electricity for fossil fuels is feasible and intelligently made [10].
Could technological progress enable this cap of about 12 TW to be surpassed, and hence make indefinite exponential growth of energy production possible? The incorporation of fusion energy to the electric grid is expected at some date close to the end of this century [12]; however a fusion-based energy system has the same dependence that renewables have on copper-based devices, and thus the electrified economy that it makes possible is as copper-consuming as the one based on renewables. An energy production mix based on renewables and fusion could be scaled exponentially only if a major substitution of copper for aluminum (which is abundant), graphene, and high temperature superconductors (HTS) were successfully implemented in electricity generators, engines and wires. Most of the consumption of copper in a post-carbon economy will come from windings in generators and electric motors [1]. Squirrel-cage motors frequently use aluminum instead of copper for the conductive bars, however they are built for low and medium power (a few kW) and are outside the range required by a power generator (MW). Thus, the feasibility of this substitution is very uncertain [2] and, also, even if new aluminum-based generators and motors were developed in the future, technological innovations take 40–50 years to expand throughout the economy [5]. Thus, the scenario of a ceiling of 12 TW for a future 100% RE mix at the second half of this century seems more realistic and prudent than assuming major breakthroughs in the expected technological development.
World primary energy production was 496 EJ in 2005, which is equivalent to 15.7 TW of mean annual power. Primary energy includes the energy embodied in energy repositories such as oil (167.4 EJ), natural gas (99 EJ), coal (122.2 EJ), nuclear power (28.5 EJ), biomass (46.3 EJ), hydropower (30.1 EJ) and new renewable energies captured by solar panels, wind turbines, etc. (2.3 EJ). Due to conversion and distribution losses the final energy that fueled the global economy was 330 EJ, or equivalently, 10,460 GW of fuels and electricity. The expected error value is a few percent due to uncertainties in the statistical processing of the original data. The share of this power consumed by end-use sector in 2005 was: 27.7% transportation, 26.8% industrial, 9.5% commercial, 24.6% residential, 9.2% feedstocks, and 2.3% agriculture, forestry and fisheries ([11], Table 1.2 and Figure 1.5).
In what follows we analyze whether 12 TW of electricity and 1 TW of biomass (final) power will be able to fuel a future post-carbon economy that can sustain similar services to those of the 2005 economy, and what changes should be introduced into the main processes to maintain, as far as possible, the current economic services.

3. Agriculture, Forestry and Fisheries

Energy input to agriculture was 0.24 TW in 2005 (Table 5) (from [11], Table 1.2). We will assume that 8% of world biomass input of energy into the economy is also representative of the biomass consumption of agriculture. The share of fossil fuels in agriculture is highly variable between countries. In the USA 60% of energy input was fuel (diesel and gasoline), 5% gas and liquid petroleum, and 35% electricity in 2013 [13]. We will take this share as representative of all developed countries. However, western agriculture is an extreme case of high use of machinery and irrigation and low use of labor, while developing countries are closer to the opposite extreme. Direct energy inputs of a typical rainfed arable crop farm are probably close to this second extreme and, according to Sims ([14], see Figure 2.19) consist of 20% liquid fuels (diesel), 0% electricity and 80% feedstocks. We will take this latter share as representative of the fossil fuels used for agriculture in developing countries. According to Pimentel [15] roughly the same energy is used in developed and developing countries in agricultural production.
We assume that oil is used mainly for transportation, which will be electrified in the future. Tillage sometimes requires high power tractors that, in the future, could be powered by fuel cells. However, for other generic farm work, if a grid connection point is installed on the farm, a fleet of smaller electric tractors would have no problem doing the open field work, since the battery recharge could be as frequent as needed, and some electric tractors would be working while others are recharging. For small farmers, the minimal traction equipment required would consist of one tractor and two rechargeable batteries. Of course, in such a future system, full connection of farms to the electric grid will become necessary. If that connection was not available or the farmer could not afford to own a tractor, tillage would have to be based on human labor, as is the case currently with small farmers in developing countries. We will assume that electric battery vehicles will replace only 23% of the total oil consuming machines of the sector, and 77% of it will be replaced with fuel cells tractors. The former figure corresponds to the “miscellaneous” category in the diesel input of a typical arable farm (see Figure 2.20 in [14]).
We assume that gas is used for heating, which will be replaced by electric resistance heating that is 97% efficient [16]; and that biomass will be used in the future with the same efficiency, about 22% for heat production in rural stoves [17]. We assume that gas is used mainly for water and space heating with the typical efficiency of a condensing boiler (about 90%) [18]). Oil is assumed to be used for transport and tilling purposes with the efficiency of diesel motors (40%) (Table 1).
Given the above efficiencies, the 2005 power used in this sector (240 GW) will become 188 GW in a post-carbon economy. The expression used to make the calculation is the following:
pr = pf [0.5 (0.92 × 0.60 (0.23 edi/eba + 0.77 edi/efc) + 0.08 est/est + (0.92 × 0.05) ecb/eer + 0.92 × 0.35) + 0.5 (0.77 edi/efc + 0.23 edi/eba)]
where pr is the mean annual power demanded by a renewable agricultural sector; pf is the demand of the sector in 2005; and edi, eba, efc, est, ecb, eer are the efficiencies of diesel engines, battery motors, fuel cell motors, rural stoves, condensing boilers, and electric resistance, respectively. Similar expressions are used for each economic sector hereafter.
Appendix A7 of the Appendix analyzes the feasibility of producing ammonia and other agricultural feedstocks in a post-carbon society. While it seems feasible to produce ammonia renewably from biogas and hydrogen, renewable sources of phosphorous and potassium are not available to the present-day agriculture and this is a major problem that must be solved in a future post-carbon economy.
In the long term (from a few decades to a century) the world will run out of potassium and phosphorus, so the only available way to sustain productive agriculture will be to resort to organic farming [19]. A move to fully organic farming will require good knowledge of soil ecosystems, and must be fine-tuned to the local climate. Also, it could reduce the output of grains by 20%–30% in the short term. However, in the long term, organic soils hold up in quality and even improve, and they resist erosion better than standard farmed soils. Therefore, in a few decades organic soils may achieve productivities close to those of artificially fertilized soils. Some models indicate that organic agriculture could produce enough food for the current world population: 2640–4380 kcal/person/day [20,21,22]. In addition, in the majority of cases studied, organic systems are more profitable than non-organic ones due to lower input costs [23]. Use of plant, animal and human wastes for production of compost and natural fertilizers will allow recycling of phosphorous and other nutrients. This is the only available solution to the future decline of phosphorous mining that has been predicted for 2040–2050 [24,25].
Organic farming as a solution to the decline of fertilizer availability is, however, not compatible with an always rising population, since available arable land per capita has decreased from 0.5 to 0.24 ha between 1961 and 2005 [26]. There is not much room for additional decrease of arable land per capita, because the supply of the principle cereals is saturating at their biological limits: 7–8 tonnes/ha for wheat and 7 tonnes/ha for rice, despite the increasing input of fertilizers [27]. Depletion of groundwater basins must also be curbed, which requires putting a stop to population growth. About one third of the Earth's largest groundwater basins are being rapidly depleted by human consumption, which means that significant segments of the population are consuming groundwater without knowing when it might run out [28].
Renewable exploitation of forests will also be crucial in a post-carbon economy, not only for reasons of climate and biodiversity, but also because of their importance in renewable production of wood biomass and charcoal (see Section 7).
Regarding fisheries, fishing fleets consisted of about 4 million vessels in 2002, 1/3 decked and 2/3 undecked, with 65% of undecked boats not using mechanical propulsion systems [29]. This is equivalent to 1.32 million vessels with large motors and 0.23 million vessels with light motors; 0.005 and 4 × 10⁻⁴ times the number of large and light motors being used for the transportation sector, respectively. In principle, all these combustion engines could be replaced by fuel cell motors in a future post-carbon economy, as discussed in Section 4.

4. Transportation

Hydrogen has certainly been proposed as an energy source that is similar to oil and natural gas, and that could be used for transportation. However, present electrolytic systems require around 60 kWh to produce 1 kg of hydrogen [30], which implies an energy efficiency of 65% if we take HHV of hydrogen as output. This implies that hydrogen produced and consumed on-site has 1.53 times more electricity embedded than its own HHV content. If losses along the hydrogen conversion chain, i.e., containing, liquefaction, transport and handling are also taken into account, the result is that the production of hydrogen for consumption by a jet turbine or fuel cell requires 1.8 times its HHV energy content in the form of electricity [31] or, equivalently, 2.1 times its LHV content that is the metric that is being used in Table 4.
In addition, electrical motors are more efficient than fuel cell motors (Table 1) and, for both reasons, a fuel cell vehicle requires 3.6 times more integrated electricity consumption than an electric vehicle [31]. Also, the hydrogen produced is five times more expensive than the direct use of renewable electricity [32]. Thus, the direct use of electricity by motors is a cheaper and more efficient way to produce movement, and is the most promising option in future ground transportation [1]. The exception would be aircraft and other forms of transport that are not able to receive energy from the electric grid, as well as vehicles with specific requirements for both autonomy and power, such as ambulances, fire engines and police cars.
Efficient land transport should ideally be based on electric trains for freight and passengers between cities, and electric vehicles (EV) for short-distance transport between cities and villages [1,33]. However, we will assume, pessimistically, that future land transport will instead be based on the electrification of the present vehicle fleet.
About 600 million small vehicles, 205 million commercial (heavy) vehicles and 215 million motorcycles were circulating in 2005 if we linearly extrapolate the trend observed by [34] for the period 2000–2003. The number of commercial vehicles that will use fuel cells is very dependent of the future weight given to trains for long distance freight. We will assume that its number will be only 10% of the number of commercial vehicles, because with this percentage 99% of Pt reserves (and 22% of Pt and Palladium reserves) would have to be used in the fuel cell electrodes. Palladium is more abundant than Pt and it has been reported to be a possible substitute of Pt for fuel cells, although not with identical performance [35]. Lithium-ion batteries have the largest energy density and, for this reason, are the most used in current electric cars. Taking typical battery capacities and power for these three classes of vehicles (Table 1) and the density of metal used in their respective motors (Table 2), the quantity of lithium (Li) that such a fleet would require would be 7.8 Mt. Alternatively, nickel Na-NiCl2 (Zebra) batteries are technically feasible. If these batteries were used to renew the world fleet, 65 Mt of nickel would be used [1]. These figures amount to 58% and 80% of present reserves of Li and Ni, respectively [36]. If 50% of Li batteries and 50% of Ni batteries were used, 29% and 40% of the present reserves of Li and Ni would be used, respectively. Electrification of vehicles will be necessary, but given that reserves cannot be indefinitely expanded [2], the number of vehicles that a future post-carbon society could sustain is roughly the number we have currently. A larger number would endanger the availability of Li and Ni for other economic demands.
Table 1. Classes of electric vehicles (column 1), global number in 2005 (column 2), typical peak power of its battery (column 3) and battery capacity (column 5). The parameters used are discussed in [1].
Kind of EVNumber in 2011 (millions)Power (KW)Battery Capacity (KWh)
Light6006022.4
Heavy20517967
Motorcycle2153.61.2
Table 2. Values used for the estimation of metals required by the transport system. Density refers to the mass of metal used per unit of power or per unit of energy stored in engine, battery or fuel-cell. The parameters used were discussed in [1].
MetalDensityReserves (106 t)
Copper0.73 kg/kW680
Lithium0.3 kg/kWh13.5
Nickel2.5 kg/kWh81
Platinum0.004 kg/kW0.015 (0.07) a
a Reserves of Pt group metals (Pt, Pa, Rh, Ru, Ir, Os).
Marine shipping consists of about 87,500 ships, not including naval and fishing boats [37]. Naval ships are only a few thousand globally [38], therefore we can take 100,000 as an upper estimate of the number of non-fishing ships. Assuming that this kind of vessel uses four heavy engines, the total number of marine engines would be 1.72 × 10⁶ heavy and 0.23 × 10⁶ light engines. We will use 60 kW as a typical power for a light engine, and 179 kW as the power of a heavy engine [1].
To complete the number of light and heavy motors that would probably require fuel cells, we need to add the world number of heavy farm tractors, the number of ambulances, and the number of police cars and fire vehicles. Farm tractors were estimated to number about 28,570,900 in 2005 [39]. We will assume that 10% of these will be high power tractors that will need fuel cells. The number of ambulances per capita was about 1 per thirty thousand people in Turkey [40] and 1 per 4350 people in Australia ([41] Table 9A.39), figures that we will consider to be representative of an average developing country and a mean developed country, respectively. We will assume that the number of police cars is the same as the number of ambulances. Fire engines will be considered to be far fewer in number. Under these assumptions, and considering that developing countries included 81% of world population in 2005, we obtain a total number of 1,200,000 light engines and 4,577,000 heavy engines, which must be considered as orders of magnitude, and not precise estimates. Assuming that 0.2 kg of Pt or its substitute, palladium, is needed for a fuel cell of 50 kW [42], the mass of Pt or Pa necessary for such a fleet of fuel cell engines is 18,250 t. This is 28% of present reserves of platinum and palladium (66,000 t) ([36], platinum). Thus, fuel cell deployment could be sufficient in principle to meet the current requirements of special vehicles and 10% of commercial vehicles, even though not very scalable, except if palladium and new materials were developed to fully substitute for platinum in the fuel cell catalyzers.
Assuming that fuel cell vehicles will mainly be ambulance, police and 10% of commercial vehicles, and taking into account the energy required for producing electrolytic hydrogen, and the efficiencies given in Table 3, the power required for road transport would be 893 GW.
We assume that half of world train transport has already been electrified and that the other half uses diesel locomotives. Assuming that most of the energy consumption of train transport is for locomotive traction, and using the motor efficiencies shown in Table 1, we estimate that the power required for 100% electrified railroad transport is 52 GW. The energy demand of the transport system could be substantially reduced if current ground transportation based on cars were replaced with a substantial increase in rail transport. As an example, a typical intercity train transports eight times more seated passengers per MW than a car (204 people/MW vs. 25 people/MW) [10]. Therefore, if well organized, it has the potential to reduce the energy consumption of future road transport by a factor of eight.
Regarding marine transport, we assume that most of the energy consumed by the sector goes to vessels and mechanical motors. Under this assumption, we estimate that to produce the service obtained in 2005 with 285 GW, a post-carbon economy would require 830 GW. This factor of three increase in energy demand derives from the need to produce hydrogen for fueling the marine fuel cell engines. However, 10%–35% of this energy could be saved if wind systems were used in tandem with the motors of the vessel, such as the SkySails kite system [43]. In kite propulsion systems, high-altitude wind energy is directly converted into traction without intermediate conversion to electricity, and with the low cost and maintenance that is typical of low-technology systems.
About 89% of the transport system could possibly be electrified in a post-carbon society, since world air transport uses only 11% of the energy demanded by the transport system ([11], Table 1.2). To sustain the same volume of air traffic as in 2005, air transport would need 3% (11% of 27%) of 10.4 TW from fuel, or 0.32 TW from hydrogen (H2) and biofuels. If electrolysis were used to supply H2, about 696 GW of renewable electricity would be required. This result has been included in Table 5.
As we will see in Section 6 and Section 7, in a post-carbon economy demand for woody and non-woody biomass will be superior to the available renewable biomass production if we want to maintain the economic levels of industrialized economies such as those of 2005 or 2012. For this reason, hydrogen would be a more convenient fuel than biofuels in the long term. On the other hand, biofuel-oriented crops may compete with food crops for arable land and should be avoided wherever possible. However, as we will see in Section 7, about 98 GW of biogas could be saved if future agriculture becomes fully organic and ammonia is no longer industrially produced. A similar situation would result if ammonia were produced directly from hydrogen and air and not from biogas. This would make available a fraction of agricultural wastes able to produce around 98 GW of biofuels. Provided that the present structure of the transport system is not modified, this would amount to 11% of the future aviation demand.

5. Commercial and Residential Sectors

Energy consumption in this combined sector was between 3.6 and 3.8 TW in 2005. The fractions of biomass, electricity and central heat, gas, coal, oil and new renewables used by this sector have been calculated in Grubler et al. ([11], Figure 1.5).
The services required by this sector include food processing, hygiene (water heating), thermal comfort (air conditioning), illumination, mechanical work, and communication. All these services could, in principle, be supplied by electricity. However, we will assume that current level of use of biomass for heating and cooking will remain the same in a future post-carbon economy (about 1 TW).
About 1 TW could be produced by residential PV power if 12.5% of world populated areas were covered with PV panels [6]. This would meet 39% of residential needs, with the remaining 61% obtained from the grid.
Table 3. Current efficiencies of different motors and heating devices.
DeviceEfficiencyReference
Gasoline motor0.25–0.30[44]
Diesel motor0.40[45]
Battery-powered motor0.80[46]
Overhead line electric motor0.95[46]
Fuel cell motor0.50[47]
Coal braziers0.97
Coal cooking stoves0.22[17]
Electric resistance (air heating)0.97[16]
Electric resistance (cooking)0.74[48]
Heat pump3.0[49]
Condensing boiler0.90[50]
Gas hob0.40[48]
We assume that oil consumed by this sector goes entirely to internal combustion engines, which will be replaced by electric motors; that coal is used 50% in coal braziers and 50% in cooking stoves, where the former will be replaced by electric resistance and the latter will be replaced 50% by electric resistance and 50% by heat pumps. We assume that natural gas is used 50% for cooking and 50% for air heating, where the former will be replaced by electric resistance and the latter will be replaced 50% by condensing boilers and 50% by heat pumps. Table 3 shows the current efficiencies of different motors and heating devices.
Under these assumptions, 1 TW of biomass and 1.93 TW of electricity may be sufficient to supply the same services that the 2005 economy supplied to these sectors with 3.8 TW. The first lines of Table 5 summarize the energy consumed in 2005 by the transport, commercial and residential sectors, agriculture, forestry and fishery sector, and the energy that would be probably consumed by these sectors in a post-carbon society.

6. Industry

In 2005 the total energy used by industry was 88.2 EJ of fossil fuels and electricity and about 25 EJ of feedstocks,, which is equivalent to 3.59 TW of mean annual power ([11], Figure 1.5). Table 5 (column 2) shows the share of the industrial use of energy that year.
The industrial sector is strongly dependent on electricity, coal, gas and oil, in this order (see Table 4, based on [51], Table 8.22). However, oil is especially important in the petrochemical and construction sectors. Future decline of many feedstocks coming from oil and coal will force us to substitute these feedstocks for others coming from renewable sources, or to abandon the process.
The degree of substitutability of fossil fuels in the different industrial sub-sectors and their energy cost has been analyzed in detail in the Appendix. Expressions similar to Equation (A1) have been used for each industry to estimate the energy use in a post-carbon economy. The parameters of Table 3 have been used for the efficiency of different devices, and the efficiency of the central heating and electro-chemical processes of the specific industry, as well as other processes such as steam generation, have been estimated from the Sankey (energy flow) diagrams produced by the US-DOE for the specific industry [52], when available. The final result of this analysis is shown in Table 5, rows 10 to 24. As can be seen in that table, a post-carbon industry would use less energy than the present industry in all the sectors except iron and steel and non-ferrous metals. The energy saving would be specially high in nonmetallic minerals production due to the high heat loss of conventional kilns, which could be minimized by using electric and microwave assisted heating (see Appendix A6). Many industries, such as transportation equipment, machinery, textiles and others are partially electrified in their central processes and their full electrification should not be a major problem.
The work done in open terrain for wood extraction, construction and mining will have to be fully electrified. Indeed, mobile electric construction machines will have more limitations than fuel powered ones and therefore open field work will have to be planned in a different way. For instance, it will require the installation of temporary grid connections, fleets of (electric) vehicles with lower autonomy and power but in larger number than at present, and different design approaches for the extraction and transport of heavy loads. If we examine a map of the distribution of electricity sub-stations in Spain, which supply power to villages and factories, we can observe that even in less densely populated regions (La Mancha) no point is further than 40 km from a sub-station, and that villages with an electrical supply can be found at a maximum of about 20 km [53]. Thus, any mining or construction project outside of urban areas will have to include the building of a power connection (of up to 40 km in Spain, maybe longer in some developing countries) to the nearest power sub-station. Once the connection is installed, power shovels could be connected to the grid as do actually many dragline excavators and giant power shovels and bucket wheel excavators used presently in mining. Transport of moderate loads could be made by a fleet of electric vehicles, since the battery recharge could be as frequent as needed, and many electric vehicles would be working while others are recharging. Finally, transport of heavy loads on complex orography could use fuel cell powered vehicles.
Table 4. Energy input (GW) for the global industrial sector by industry and energy type in 2005 (based on [51], Table 8.22). Energy from fossil fuel feedstocks is excluded. A zero is displayed when the figure is under 0.05 GW.
IndustryCoal and DerivativesCrude, NGL, FeedstocksPetroleum ProductsNatural GasGeothermalSolar, Wind, OtherCombustible Renewables and WastesElectricityHeatTotal
Iron and steel250.8020.177.8008.5103.315.7476.3
Chemical and petrochemical58.10.180.9150.4003.0113.245.9451.6
Non-ferrous metals15.4010.319.2000.267.52.7115.3
Non-metallic minerals181.3048.266.7006.742.73.4349.0
Transport equipment4.804.013.400018.74.345.2
Machinery13.2015.027.9000.166.36.1128.6
Mining and quarring9.6018.112.800026.23.370.0
Food and tobacco25.20.134.443.40035.140.711.3190.2
Paper, pulp and printing25.2019.133.90.2065.653.96.7204.5
Wood and wood products2.804.53.80013.111.16.842.0
Construction6.8026.64.9000.26.81.646.9
Textile and leather14.3011.611.6000.325.17.670.5
Non-specified industry75.04.9133.7108.00.20.2105.4130.430.6588.3
Total (GW)682.45.2426.4573.80.40.2238.2706.0145.92778.4
Iron and many non-ferrous metals require carbon as a reducing agent in their production, which could be obtained from renewable charcoal in a post-carbon economy. However, demand for charcoal by the petrochemical industry will saturate in a future post-carbon economy (see Appendix A8) and also its future renewable production will probably not be sufficient to supply the large quantities of coke needed for iron reduction (see Table 6). Fortunately, sponge iron produced by the direct reduction process is a proven technology that is becoming increasingly popular due to the shortage of high-quality coking coals [54,55]. In the process of producing sponge iron, hydrogen is frequently employed as the reductive gas, through the following aggregate reaction:
3Fe2O3 + 9H2 → 6Fe + 9H2O
and this process could be the best suited to a future post-carbon economy. Then, crucible steel may be produced by diffusion of charcoal, a process that is known in the industry as “carburization” [56].
Other metals that could be primarily produced by direct reduction with hydrogen are copper, tin and nickel (see Appendix A5). Some metals and ferro-alloys require coal as reducing agent, however, as we will see in Section 7, present levels of ferro-alloy production could be supplied through the future use of renewable charcoal or methane. Secondary production of the main metals (recycling) already involves the use of electric arc furnaces which can be, in principle, fully electric.
Table 5. Energy consumed by the transport, commercial and residential sectors, agriculture, forestry and fishery and industrial sectors, in 2005 (column 2) and in a post-carbon economy (column 3). Industrial energy use in 2005 is based on Figure 8.1 in [51]. The energy required for future hydrogen production in some sectors is included in the corresponding box of column 3. An important fraction of energy consumed by the chemical and petrochemical sectors (759 GW) is embedded in feedstocks, as well as 34 GW of coal for chemicals, graphite and steel production, which have been implicitly accounted in “Chemicals and Petrochemicals” (26 GW), or explicitly included in “Non-ferrous metals” (1 GW) and “Iron and steel” (4.8 GW).
Energy end useFinal energy in 2005 (GW)Final energy in post-carbon economy (GW)
Road2100893
Rail7352
Shipping285830
Air330696
Pipelines900
Total transport29002471
Residential and commercial38002954
Agriculture, forestry, fishery240188
Wood and wood products4235.8
Transport equipment45.239.2
Machinery128.6110.7
Construction46.927.1
Mining and quarrying7214
Textiles and leather7264.1
Renewable feedstocks->541 to >596 *
Non-ferrous metals115 + 1115 + 1 + 1.6 + 0.2
Food and tobacco190162.6
Paper, pulp and print216173.2
Non-metallic minerals350236
Iron and steel476 + 4.8720 + 4.8
Chemicals and petrochemicals1057628 to 785 **
Others588.3424.5
Total Industry34053292 to 3504
Total10,3438912 to 9124
* This power is embedded in the raw materials used for producing charcoal and biogas and it does not add to the electrical power produced by a post-carbon economy. The range depends on the use or not of best available technologies (BAT) for charcoal production; ** The first (second) value corresponds to 15% (the same as in 2005) production of ammonia and 49% (45%) of HVCs production of 2005, respectively.
The chemical and petrochemical sector is the most energy demanding of the industries, 1057–1075 GW in 2005, including the embedded feedstock ([51,57], (Table 5)). About 50% of this energy, 544 GW, was used to produce high value chemicals (HVC), mainly olefins (ethylene, propylene and butylene) and aromatics (benzene, toluene and xylenes). An important fraction was also used for ammonia production (188 GW), and for methanol production (37 GW). From these primary chemicals, a large number of secondary chemicals and end-products are produced, by processing and polymerization, which consumes 4% of the sector energy (44 GW).
The HVC production is currently based on naphtha, one of the main derivatives of petroleum, which may be replaced by charcoal in the coal to olefins process (see Appendix A8 for details). However, for obtaining the level of HVCs production of 2004 we would precise 3.7–4.6 times the renewable potential of charcoal production estimated in Section 7. This suggests that maintaining the current level of petrochemical production may be unfeasible in a post-carbon economy, and that we will have to reduce our present consumption. Appendix A8 of the Appendix details the parameters used in the estimation of energy consumed by the chemical and petrochemical sectors, which is showed in Table 5. Some biological substitutes for the principle petrochemical products are also suggested.

7. Biomass, Charcoal and Biogas Production in a Post-Carbon Economy

Charcoal and biogas will have to be produced in larger quantities in a post-carbon economy than they are at present, in order to compensate for the decline of fossil coal, oil and gas. That increased production should be obtained from renewable biomass production. Governments will have to force this to happen with laws forbidding plant cultivation for biofuels and biogas production, and nonrenewable logging. If they do not enforce this, it is probable that production of biological feedstocks will compete with agriculture, as is presently happening in the USA, Indonesia, Africa and other regions [58,59]. Clearing of tropical rainforests for rapeseed and palm oil production is currently destroying biodiversity and releasing 17 to 420 times more CO2 than the greenhouse reduction that these biofuels would provide by displacing fossil fuels [58].
The post-carbon stationary economy that we suggested in the Introduction would avoid these problems since the exploitation of wood and agricultural waste (needed for producing charcoal and biogas) would be stationary and sustainable, and would use agricultural crops to produce biogas. If we focus exclusively on the sustainable exploitation of temperate and tropical forests, up to 3 t/ha/year of woody biomass could be extracted from these forests whilst maintaining stationarity [60]. The carbon content of tropical wood is 47.3% on average [61] and similar in temperate wood [62]. Forests occupied 4000 million Ha in 2012 [63], assuming that 10% of this extent were sustainably exploited for wood extraction and that 5 t of wood are needed to produce 1 t of charcoal [64], 240 million tons per year of charcoal could be produced, almost 5 times the present production.
An alternative estimate can be made from the potential of renewable biomass, which is about 103.8 EJ/year, 40% of it coming from woody biomass [65]. World biomass consumption for cooking, heating, and industrial wood-related activities was 46.3 EJ/year in 2005, 75% of it in developing countries and 25% in developed countries. Assuming that these end-uses are inflexible, and taking into account that 40% of biomass used comes from wood, 18.5 EJ/year of wood consumption must be reserved for these end-uses and 23 EJ/year of wood would be available for other industrial uses, which is equivalent to 1.2 × 10⁹ t/year of dry wood if we take 19,000 kJ/kg as the heat content of dry wood. Assuming again 5 tons of wood for 1 t of charcoal produced, 1.2 × 10⁹ t/year of wood could be sufficient to produce 240 × 106 t/year of charcoal, the same result as in our previous estimation.
Mass yields from a Casamance kiln and a well-managed traditional mound kiln are somewhat higher than the world average, about 25% [64], therefore the previous potential could be increased to 300 × 106 t/year if future governments encouraged the use of best available technologies. Finally, this figure could be increased by an additional 6% if governments of North America and Europe would force the replacement of wood fuel with electric heating (see Table 3 of [65]).
Methane obtained from biogas could be an alternative source of a reducing agent for ferro-alloys and other metals. In the future, energy crops will probably compete with food production for soils and so should be avoided, however biogas could be obtained from crop residues and urban wastes. Current global production of methane from biogas is only 20–26 × 106 t/year, but global potential has been estimated at approximately 900 × 109 m3 [66] or, equivalently, 600 × 106 t/year. If only the European Union, USA and China were able to make the investments needed to develop the new biogas infrastructure, the potential for CH4 production would be approximately 215 × 106 t/year.
As a consequence, present levels of tin, lead, zinc and ferro-alloy production could be supplied through the use of charcoal or methane by a small expansion of the present level of woody biomass and biogas production. This is apparently feasible in both cases.
Charcoal and natural gas production do not involve rock grinding or underground digging and ventilation, both of which are very energy consuming. Therefore, the energy needed to supply the reducing carbon from charcoal should not be larger than that currently needed to extract it from mining.
HVCs production is the most demanding sector regarding charcoal and natural gas and the route from methane to olefins via methanol and dimethyl-ether is the most efficient (see Appendix A8). After discounting 65.6 × 10⁶ t of natural gas needed for ammonia production, 149.4 × 10⁶ t of CH4 remain, which would allow production of 92.6 × 10⁶ t of HVCs using that process. If we need to produce 287 × 106 t of HVCs (Appendix A7), 194 × 106 t should be produced from charcoal. Given that 4.1 t of carbon are needed to produce 1 t of HVCs (Appendix A8) and assuming 75% carbon content in charcoal [67], we find that 1063 × 106 t of charcoal would be required.
Table 6 summarizes the new production of charcoal, hydrogen and biogas required for the different sectors if a post-carbon society had to reach the same production level as in 2005. The global production of charcoal and biogas that is probably obtainable in a renewable way is also indicated. High quality industrial charcoal has 75% carbon content [67], and a factor 1.33 has been used to translate carbon required for charcoal used in each sector. All the energy requirements of the marine and aviation sectors in 2005 are assumed to go to propulsion, in the form of hydrogen, and the same efficiency to produce movement is assumed for the energy of hydrogen and kerosene in aviation jets.
Table 6. New production of charcoal, hydrogen and biogas required for the different sectors if a post-carbon society had to reach the same production levels as in 2005. The second figure in the third column represents the electrical power required to produce the hydrogen.
End-Use SectorCharcoal (103 t/year)/(GW)Hydrogen (103 t/year)/(GW)Biogas (103 t/year)/(GW)
Vehicles fuel cells * 17,000/138
Marine fuel cells 60,048/411
Aviation 85,902/588
Iron and steel 64,000/440
Copper reduction 600/4
Tin reduction40or 5/0.03
Nickel reduction 81.8/0.6
Lead reduction710
Zinc reduction1600
Ferro-alloys30,100
Graphite1334
Ammonia 24,706/169or 65,634
High value chemicals1,063,230 149,366
Total1,097,010252,343/1,751215,000
Global potential240,000/221 to 300,000/276Not applicable215,000/320
Percent of global potential366 to 457%Not applicable100%
* We suppose that 10% of commercial (heavy) vehicles use fuel cells.
As can be seen in this table, charcoal needed for a future post-carbon economy is about 4 times above the global potential. This implies that, if the charcoal demand of metal industries is respected, only 45%–49% of the HVCs produced in 2004 could be produced in such a future economy, 92.6 × 10⁶ t from biogas and 37.7–48.7 × 10⁶ t from charcoal.
The routes from carbon and natural gas to HVCs are also more energetically expensive: 45 GJ per ton of HVC produced and 29 GJ per ton of HVC produced, respectively, to be compared with 18 GJ per ton of HVCs produced with the conventional naphtha route (embedded energy not included). If we take into account these factors, the quantities of available charcoal and biogas and the quantities of charcoal and gas to be used for HVC production (Table 6), and compare with the energy used in 2004 to produce HVCs ([51], Table 8.5) we find that 544 GW would be required, to be added to the energy cost of producing ammonia, ethanol and all the petrochemical products. We will assume that, in a post-carbon economy, ammonia production will initially be the same as in 2005 (177 GW); but that it will decrease to 15% of this figure following the implementation of a future organic agriculture. 15% of ammonia is expected to continue to be necessary for textile fiber processing, nitric acid production, refrigeration for bulk food storage, water purification, antimicrobial agents, rubber production, metal plating, and other uses [68,69]. We will assume also that other petrochemical activities different from HVC and ammonia production will diminish in the same proportion (45%) as the decrease of HVCs. With these assumptions, the total consumption of a future petrochemical sector amounts to 785 GW, decreasing to 628 GW when full organic agriculture is implemented.

8. Discussion and Conclusions

A future post-carbon economy is the only sustainable solution to the present challenges of energy security and rising environmental impacts. Such a future economy should be based on a mix of decentralized and centralized renewable sources. Some studies have warned of the necessity and difficulty of the transition to such a society, and others argue that such a transition is incompatible with the maintenance of an industrial society.
The present analysis shows that a future post-carbon society seems capable of sustaining an industrial developed economy, if the investments needed to implement the appropriate process substitutions are done. Actually, a post-carbon economy based on direct use of renewable electricity is able to provide similar services to those of the 2005 economy.
However, global electrification would put the finite supplies of copper, nickel, lithium and platinum under rising stress. Therefore, a post-carbon economy will have to adapt, sooner rather than later, to a stationary consumption of energy and materials. Further growth in the throughput of that future economy will be dependent on improvements in efficiencies of charcoal and biogas production, as well as on dematerialization of processes.
About 10.3–10.4 TW of final energy was required in 2005 for all the economic end uses. As can be seen in Table 5, the conclusion of our analysis is that a 100% RE economy trying to provide the same services as the economy of 2005 would require initially about 9.1 TW, and 8.9 TW after BAT in charcoal production and implementation of full organic agriculture. Thus, a 100% renewable economy would require 87% of the energy consumed in 2005 to provide similar services, except for the petrochemical sector, which would be similar to the one of 1985. No savings due to efficiency improvement have been assumed, however demand-side energy-conservation measures could allow savings of about 5%–15% of energy demand [31], which would amount to 0.5–1.3 TW in a post-carbon economy.
Once we have obtained these general figures, a comparison with the recent or near future economy becomes easier. As an example, total final consumption of energy in 2012 was 8979 Mtoe [70], which is equivalent to 11.9 TW. If a post-carbon economy would require 87% of that energy, 10.4 TW would supply similar services to those supplied by that recent economy. Thus, 12 TW of renewable electricity and feedstocks and 1 TW of biomass (that is the maximum supply compatible with a prudent use of the mineral reserves) would be more than sufficient to supply similar services than the present economy, except for the petrochemical sector. On the other hand, economic growth of developing countries is expected to increase the world energy consumption in the next decades, which has been estimated in 460 to 520 EJ/year in 2030 [71]. This range is equivalent to 14.6–16.5 TW, or 12.7–14.4 TW if the services were supplied for a post-carbon economy. If we accept that a sustainable level of final energy supply is not much above 12 TW of electricity and new feedstocks and 1 TW of traditional biomass, the conclusion is that in 2030 the economy may be on the limit of what is sustainable.
On the other hand, world's population continues increasing and, in a future globalized society, industrial economy will have to grow accordingly to world's population in order not to get a per capita decline. The medium variant of World Population Prospects of the UN [72] estimates that world population will increase from 6520 million in 2005 to 8500 million in 2030, 9725 million in 2050 and 11200 million in 2100. In order to maintain the same amount of energy per capita than in 2005 to this higher number of people, energy production would have to be 13.4 TW, 15.4 TW and 17.7 TW in 2030, 2050 and 2100, respectively or, in RE equivalents, 11.7 TW, 13.4 TW and 15.4 TW. Thus, even maintaining a constant energy use per person, expected population growth may take us to unsustainable levels of energy production after 2050. Under present growth expectations, if some technological alternatives to copper do not appear on time, RE might probably not be enough to maintain an industrial society as we presently understand it in the long term, and all these over-shoot scenarios mentioned above would imply a forced de-growth in a future post-carbon economy.
Over the scale of several decades to one century we cannot discard technological innovations that enable replacement of copper and lead to a possibly larger energy supply, and even unexpected techno-explosions. However, even in that case, we cannot know if such technological surprises will permit sustained exponential energy growth, linear growth or only logistic growth in the long term. Therefore, in a post-carbon economy we should be prepared to work under all the range of possibilities, from stationary energy supply to exponential growth. Such an economy would adapt its growth to the availability of new energy sources and feedstocks, and not the opposite, and in this context any improvement in economic efficiency would allow the energy available (e.g., 13 TW) to satisfy a larger service demand. This will probably require structural transformations of capitalism such as we know it [73]; it is high time to stop considering any change in capitalism as the end of the world.
Provided that future economy is able to adapt to a stationary energy supply and that population can be limited to less than 9700 million, the above analysis shows that the main economic processes can, in principle, be replaced by sustainable alternatives based on electricity, charcoal, biogas and hydrogen. And contrarily to the most pessimistic expectations, those services that cannot be replaced are not as crucial as to cause a return to a pre-industrial society.
RE are physical energies and in many economic sectors, such as transport, people demand essentially physical services as well. Conversion of RE into chemical energy and then back again into physical energy wastes an important fraction of the initial RE produced, and should be avoided through direct use of electricity in transport [31]. This implies avoiding the use of hydrogen in transport except where connection to the grid or battery use are impossible, e.g., in aviation, shipping, and specialist (emergency) vehicles.
Even so, if land transport at present levels were based on a fleet of electric cars, trucks and motorcycles, and 50% of batteries were made of lithium (Li) and 50% of nickel (Ni), 29% and 40% of the present reserves of Li and Ni would be used, respectively, as well as 22% of platinum-palladium reserves. The limited reserves of these metals constraints the number of trucks that could be powered by fuel cells to a fraction not much above 10%. Given that reserves cannot be indefinitely expanded [2], the viability of the present level of land freight transport may depend on future development of high capacity batteries and higher use of rail freight. Electrification of the entire global fleet is a feasible option, but the number of vehicles that a future post-carbon society may sustain is roughly the number we have currently. A larger number would endanger the availability of Li and Ni for other economic sectors. Given that demand for vehicles will probably increase in the future due to demographic and economic growth, especially in developing countries, the present land transport might not be fully sustained. However, a reorganization with a larger emphasis on rail transport, would alleviate the increased demand on these metals and thereby probably maintaining sufficient mobility for people and freight.
The energy demand of transport in a future post-carbon economy will be very similar to the present one. On one side, aviation and shipping will notably increase energy use due to the necessity to produce electrolytic hydrogen to be consumed in jet engines and fuel cells, respectively. But this enhanced demand will be compensated for savings coming from road transport, since electric motors have greater efficiency than combustion ones. Actually, future aviation would have energy consumption larger than trains and close to that of road transport, if present transport structure remained in a post-carbon economy. Given that aviation is less energy efficient than vehicles and trains for the transport of people and goods, the use of jet aircraft may diminish in importance in the future. Thus, present levels of air transport may not be fully sustained. A similar mechanism could enhance the use of rail transport in a substitution of cars and trucks.
Fishing and mercantile activities frequently require long periods of navigation, which make battery-based motors inappropriate. Fuel cells may be the best solution in these circumstances. They are a relatively inefficient way to use electricity, however the size of the fishing and merchant fleets is small in comparison with that of land vehicles, and they would not imply an insurmountable problem in terms of energy demand.
Open field work in farming, mining and construction sometimes requires high power tractors that should also be supplied by fuel cell vehicles, while other generic farm work could be done using many smaller electric tractors which would recharge their batteries in the grid. Thus, full connection of farms to the electric grid would become necessary in the future economy. For similar reasons, any project involving open field construction will have to plan for the building of a connection to the grid. This reorganization of open field work does not necessarily create an insurmountable problem.
Mining in a post-carbon economy seems sustainable in the short and medium term, but is unsustainable in the long term due to the decline of ore grades [74]. Thus, a fully sustainable post-carbon economy should increasingly base its mineral production on recycling. The form that this transition may take is a crucial subject that would require discussion in a separate paper.
The future industrial sector will initially demand more energy than the present one to deliver the same services (see Table 5), due to the increased use of charcoal, biogas and hydrogen. However, if we subtract the energy embodied in future feedstocks (see Table 6), we find that the electricity needed for industry is 2751–2908 GW, which is smaller than the 2005 industrial energy demand (3403 GW). A post-carbon industry would use similar or less energy than the present industry in all the sectors except iron and steel and non-ferrous metals. The energy savings would be especially high in nonmetallic minerals production due to the severe heat loss associated to flue gases in high temperature furnaces, which could be minimized by using electric heating.
To make these estimations, the efficiency of electricity for machinery, vehicles and heating has been assumed to be equal as reported in current systems. When Sankey (energy flow) diagrams are available and fuels are the main energy input for heating in an industry, the present efficiency of industrial heating has been calculated from these Sankey diagrams. When this method is not applicable, the reported efficiency of current furnaces is used. A similar procedure has been used to estimate the efficiency of steam production in different industries. Actually, the different industrial and economic sectors are complex and the precise form and efficiency that their processes will have in a post-carbon economy remain uncertain. For these reasons, the energy demand calculations made here cannot be considered as precise projections but as indicative estimates that should be improved through continuous research.
To compensate for the withdrawal of coal, oil and gas, charcoal and biogas will have to be produced in larger quantities than currently. Most of this demand will originate from the production of High Value Chemicals (HVC) required by the petrochemical industry.
To achieve economic activity similar to that of 2005, 240–300 million tonnes of charcoal per year should be produced from woody biomass. This will require governments to encourage people to abandon the use of wood for heating and cooking purposes, at least in developed countries, where electric alternatives will exist. 215 million tonnes of biogas will also be required for ammonia production, at least until organic agriculture is fully developed. This quantity can be obtained through the current production by developed countries and China alone, given that many developing countries may need their biogas for rural self-consumption.
Use of direct iron reduction with hydrogen in steel production will alleviate an important fraction of the future carbon (and therefore charcoal) demand (Table 6). Even so, the estimated potential of renewable charcoal production is insufficient to maintain the services that the world economy produced in 2005. If 100% of the biogas renewable potential were used to produce 100% of ammonia and 32% of the HVCs consumed in 2005, and all the available charcoal is used for the coal to olefins process (after setting aside the demands of the metal sectors), 130 to 141 × 106 t of HVCs could be produced. This amounts to 45%–49% of HVC production of 2004.
Olefin production was 220 × 106 t in 2012 [75], 10.9% higher than in 2004 ([51], Table 8.5). If HVC production had the same relative increase, 318 Mt were produced in 2012. If the calculations of Table 6 are made with this value, only 40%–43% of HVCs produced in 2012 can be produced in a post-carbon economy. This range could be increased by a few percent if ammonia were produced from hydrogen (Appendix, Equation (A6)) and not from biogas. In any case, the present growth in HVC demand takes us progressively away from what is sustainable from a post-carbon perspective.
Given the limitations of the renewable production of natural gas and charcoal, systematic utilization of these products as fuel should be legally discouraged in the future, since electricity is a more efficient energy supply for end uses, and these products are critical for supplying feedstocks to the petrochemical industry.
The petrochemical industry cannot be fully maintained at its present size in a post-carbon economy and, to a first approach, should shrink to a size of 40%–43% of that of the 2012 petrochemical sector, which is the size that the sector had in 1985–1986 [76]. Fortunately, many of the products currently provided by the petrochemical industry can be replaced with similar products based on natural feedstocks although their supply rate must adapt to their natural availability. Substitution of natural feedstocks such as those mentioned in Table A2 (Appendix) for HVC consumption would allow an increase of the size of the petrochemical sector above the mentioned 40%–43% factor. In particular, there is a global potential of non-woody biomass that is not fully utilized. Starch and non-woody biomass are rich in xylenes and glucose, sugars required for the production of polylactic acid (PLA). Thus, production of polystyrene from PLA would alleviate the demand for charcoal, saving a fraction of it that could be used for olefin production.
Polyurethanes, polyesters, sealants, many pharmaceutical drugs and some dyes cannot be replaced by natural substitutes and should be produced from HVC and, ultimately, from charcoal. However, given the insufficient availability of renewable charcoal, these products would be produced at a lower rate than at present; up to 2.5 times lower, making them scarce in a future post-carbon society. The services that these products offer include cushioning foams, foams that do not melt when heated, and some synthetic fibers with special qualities.
More critical can be some pharmaceutical drugs whose lack would affect quality of life. Scarcity of these drugs may worsen the treatment of some specific health conditions, although it will probably not affect life expectancy. Indeed, the main factor influencing life expectancy is the incidence of infectious diseases, which are mainly related to poor basic hygiene and poverty [77] and not to specific drugs.
While electricity, charcoal and biogas may be the base of a sustainable transport and industry, they will be necessary but not sufficient for future sustainable farming. Agriculture is not sustainable at present given its dependence on fossil fuels and minerals such as phosphorous and potassium. In a post-carbon economy, organic farming may be the only sustainable solution able to (almost) fully recycle these essential nutrients. A detailed discussion of future sustainable farming would require another paper. However, sustainable farming will be one of the key elements of a future post-carbon society.

Acknowledgments

This work has been partially supported through the project “Vade Retro” (CTM2014-56987-P) of the Research and Development Spanish program. I thank two anonymous reviewers for their detailed comments which helped improve the article.

Conflicts of Interest

The authors declare no conflict of interest.

Appendix. Energy Demand of Industry in a Post-Carbon Economy

A1. Transportation Equipment and Machinery

We have taken the energy share of liquid oils, gas, coal, renewables, wastes, electricity and heat consumed by the transportation equipment sector from Table 4. Given the absence of global statistics we have taken the energy and carbon analysis of the US-DOE for this sector as representative of the efficiency of use of fuels and electricity by this industry in the world [52]. Finally, we have calculated the energy cost of a possible substitution of fuel inputs with electricity. The expression used is the following:
pr = pf (f1 esp/eer + f2 ecb/eer + fo3 ein/eel + fo5 ein/eba + fg4 0.5 (ecb/eer + ecb/ehp) + fh + fe)
where pr is the mean annual power demanded by a post-carbon transportation equipment sector; pf is the demand of the sector in 2005; f1, f2, are, respectively, the fractions of fuel inputs to steam generation and process heating, relative to the total energy input to the sector; fo3, is the fraction of fuel (assumed to be oil derivative) used for machine drive, fo5, is the fraction of fuel (assumed to be oil derivative) used for onsite transportation; fg4 is the fraction of fuel (assumed to be natural gas) used for facility HVAC (heating, ventilation and air conditioning); fh and fe are the fractions of heat and electricity consumed by the sector, respectively; and esp, ein, eel, eba, ecb, ehp, ecb, are the efficiencies of steam production, internal combustion engine, motor connected to the electric grid, battery motors, condensing boilers, heat pump, and industry heating process (conventional boiler), respectively. For onsite transportation we assume a future substitution of electric vehicles for internal combustion vehicles, with an efficiency ein intermediate between those of gasoline and diesel vehicles (0.30) (Table 3). The efficiency of electric resistance for heating and steam production, er, is assumed to be 0.97 (see Table 3 and [78]), the efficiency of conventional heating in the industrial process, ecb, has been assumed to be 0.83, that is a typical value for a conventional gas boiler (see [79], p. 18), given that the use of condensing boilers in industry is not yet extended. Steam production efficiency, esp (0.81), as well as the fractions f1, f2, fo3, fg4, fo5, fh and fe were estimated from the Sankey diagrams of the US industry ([52], “Transportation equipment”). We assume that heat imported from other industries will have the same efficiency of production than at present, which is probably a conservative assumption. Under these assumptions, the present consumption of the sector, 45.2 GW, would become 39.2 GW (Table 5).
Similar expressions have been used to estimate the power required in other post-carbon industrial sectors. A similar analysis can be made for the machinery sector, by using Table 4 and [80]. The present consumption by that sector, 128.6 GW, would become 110.7 GW (Table 5).

A2. Wood Products, Mining, Construction

The timber sector consumed 42 GW in 2005. Fractions of fossil fuels, biomass and electricity used by this sector are taken from Table 4. An expression similar to Equation (A1) is used to make the energy demand estimation. Coal, biomass and gas are assumed to be used for onsite generation of steam, which will be replaced by electric resistance; oil for onsite transportation, which will be replaced by electric locomotion; gas for process heating and HVAC, which will be replaced with electric resistance and heat pumps, respectively. HVAC and gas heating are assumed to be 83% efficient, and the efficiency of onsite steam generation (72%) is estimated from [81]). Assuming an efficiency of 0.3 for the present conversion of oil energy to mechanical work (Table 3), and a future substitution of electric locomotion for combustion locomotion, we obtain a demand of 36 GW for a post-carbon economy.
In a post-carbon economy the mining and quarrying sectors would decrease or eliminate their activity related to energy producing materials (fossil fuels) which currently contribute most of their added value. It is difficult to estimate the mean energy consumption of energy producing mining because of its great variability. However, the consumption of goods and services related to energy-producing mining is 79% of the one made by the entire mining and quarrying sector ([82], Table 2.4). Assuming that this fraction is a good estimate of the fraction of energy consumed by energy producing mining, all this fraction of energy would be saved in a future mining and quarrying sector, which would comprise only 0.4% of industry’s energy usage (14 GW) instead of the present 2% (72 GW).
The fractions of oil, coal, gas, electricity and biomass consumed by the construction sector in 2005 are taken from Table 4. No Sankey diagram is available from the US DOE for this sector, and the following expression is used for the calculation of future energy demand:
pr = pf ((fc + fb) esp/eer + fo ein/eba + fg 0.5 (ecb/eer + ecb/ehp) + fh + fe)
where pr is the mean annual power demanded by a post-carbon construction sector; pf is the demand of the sector in 2005; fc, fb, fo, fg, fh and fe are the fractions of coal, biomass, oil, gas, heat and electricity consumed by the sector, respectively; and esp, ein, eba, ehp, ecb, are the efficiencies of steam production, internal combustion engine, battery motors, heat pump, and industry heating process (conventional boiler), respectively. Given the lack of information on the distribution of the different fuels between the main industry processes, the expression assumes that all the coal and biomass energy is used for steam production and conventional boilers (83% efficient), the totality of oil is used in internal combustion engines, and the totality of gas is used in conventional boilers and process heating (83% efficient) and will be replaced with 50% of electric resistance power and 50% of power based on heat pumps.
Under these assumptions, the energy consumption of 2005 (46.9 GW) would become 27.1 GW. A similar expression to Equation (A2) is used for other sectors where no Sankey diagram is available.

A3. Textiles, Paper Pulp, Food and Tobacco

The textile chain consists of the production or harvest of man-made and natural fibres; conversion to yarns; weaving, knitting, or other mechanical processes; printing, coating, washing and drying to produce end products such as clothes, carpets, knitwear, etc. [83]. The energy consumed in the chain is mainly related to mechanical processes done with electric engines. The electricity consumption rate in the total consumed energy for individual textile production stages is 93% for spinning, 85% for weaving, 43% for wet processing, and 65% for clothing manufacture [84]. The main constraints that this industry may suffer in a post-carbon society relates to shortage of feedstocks that are based on oil, such as oil-derived polymers, oil-derived organic detergents and oil-derived dyes. However, as will be commented on in Appendix A8, many of these petrochemical products have substitutes.
Thus, energy use for textile and leather production can, in principle, be completely electrified. The expression used to estimate it is similar to Equation (A1).
Steam production efficiency, esp (0.81), as well as the fractions f1, f2, fo3, fg4, fo5, fh and fe were estimated from the Sankey diagrams of the US industry ([52], “textiles”). Under these assumptions, the 72 GW consumed in 2005 in a future post-carbon economy would become 64 GW.
Paper pulp is made by grinding and cooking wood chips in an aqueous solution of chemicals (mainly lime and chlorine dioxide) and by recycling fibers. Paper manufacture involves pressing and heating the pulp, drying and coating, and packaging the sheets. None of these processes are required to use fossil fuels. No Sankey diagram is available from the US DOE for this sector, and an expression similar to Equation (A2) is used for the calculation of future energy demand.
Under these assumptions and using Table 4, the 216 GW consumed in 2005 would become 173 GW in a future post-carbon economy. A similar analysis can be made for the food and tobacco processing, which involve essentially human work and mechanical processes that can be electrified. From 190 GW consumed in 2005, a future post-carbon economy would require 163 GW.

A4. Iron and Steel

Iron and steel is produced using basic oxygen coal blast furnaces (70%) and recycling of scrap in electric arc furnaces (29%) [85]. In the first process, 0.6 t of coke are needed to produce 1 t of steel; in the second process no coal is needed. Thus, the effective coke input is 0.42 t of coke per tonne of steel produced. The production of raw steel was 1 × 10⁹ t in 2005 ([36], steel), which required 420 million tonnes of coke. A proven alternative is direct reduction from hydrogen.
The production of iron was 7.47 × 10⁸ t/year in 2005, and using an efficiency of hydrogen electrolysis of 65% [30], we find that about 275 GW power would be consumed in the hydrogen synthesis needed for iron production. On the other hand, direct reduction processes use about 11 GJ per metric ton of iron produced ([86], Section 10.1). Thus, about 261 GW would be needed for global iron reduction.
The sponge iron produced in this way can be used to produce crucible steel by diffusion of charcoal, a process that is known in the industry as “carburization” [56], leading to typical concentrations of around 0.5% carbon in steel. Thus, to produce 1.65 × 10⁹ t/year of steel (the production of steel in 2014) [36] we would need 8.3 × 10⁶ t/year of carbon, a supply that would consume 23% of the present charcoal production. The 0.4 GJ/t of energy needed for carburization is that required to maintain a constant melting furnace temperature [87], and it would amount to 13.8 GW to cover the production of steel in 2005. In total, 550 GW would be needed for iron production and subsequent carburization to produce steel. The figure would probably be slightly larger if pumping and other small electrical consumptions were considered in the estimation. In the US “iron and steel” sector of 2010 ([88], “Iron and Steel”), the fraction of energy used in non-process (HVAC, lighting, facility support, onsite transportation and other non-processes), process cooling and refrigeration, machine driving and other process uses was 31% in relation to the main process energy use (process heating and electro-chemical). If we assume the same fraction to be approximately valid for a direct reduction completely-electrified steel production, 31% of 550 GW should be added to our estimate. The final result is 720 GW required for iron and steel production in a post-carbon economy, 51% more energy power than at the present.

A5. Non-Ferrous Metals

The non-ferrous metals are mainly copper, aluminum, lead and tin, zinc and cadmium, precious metals, ferro-alloys, nickel and cobalt and carbon and graphite electrodes. A large proportion of energy consumption in metal production is associated with milling operations, responsible for approximately 40% albeit with great variations, followed by dewatering, ventilation and transfer of materials after grinding. However, these processes are essentially mechanical and can be electrified. Smelting and refining consumes about 50% of the energy, with large variations depending on the metal. In this process, metal reduction is a necessary step that frequently uses fossil coal. We will analyze if that coal can be replaced by other materials or be obtained renewably.
Generating primary aluminum is extremely energy intensive, however, essentially it involves calcination of high alumina containing bauxite and electrolysis of alumina ([74], pp. 184–185). The latter process is electricity based and the former can be done with an electric furnace. Thus, future aluminum production is expected to use a similar amount of power as that used at present.
Copper production involves chalcopyrite grinding, floatation, filtering, roasting, smelting and electro-refining ([74], pp. 187–188). Roasting and smelting consist of strongly heating chalcopyrite with silicon dioxide and oxygen-enriched air in a furnace. Part of the process is auto-thermal due to the high exergy content of chalcopyrite, and does not necessarily require fossil fuels. The other steps can also be electricity-based. Methane is frequently used as a reducing agent, through the reaction:
4CuO(s) + CH4(g) → 4Cu(s) + 2H2O(l) + CO2(g)
However a much more efficient reducing agent is hydrogen [89] through the reaction:
CuO(s) + H2(g) → Cu(s) + H2O(l)
which is also environmentally clean. In a post-carbon economy hydrogen reduction would be a good choice for production of primary copper given the relative scarcity of methane (see Section 7), and the probable decreasing costs of a future hydrogen economy. Production of copper was 14.9 ×10⁶ t/year in 2005 ([36], copper). If hydrogen were used, copper reduction would require 0.6 × 10⁶ t/year of hydrogen for reaction Equation (A4). Taking into account the efficiency of hydrogen electrolysis [30], about 3.2 GW would be consumed using the electrolytic hydrogen production process. This energy expenditure is almost two times the energy content of the stoichiometric methane required in Equation (A3), which amounts to 1.7 GW for the 2005 copper production. All things being equal, changing from Equation (A3) to Equation (A4) adds 1.6 GW to energy demand, as explicitly included in Table 5.
Hydrogen requires cooling, compression and confining, expenditure that is hard to quantify but also avoid energy costs that are related to process Equation (A3), such as carbon capture energy for avoiding CO2 emissions. Hereafter, we will assume that, aside from the energy differences discussed above, other energy costs related to hydrogen reduction of non-ferrous metals are similar to those of conventional coke or methane reduction.
Extraction of tin involves concentration from cassiterite (SnO2) mixed with other minerals, fusion reduction, and electric furnace treatment. Fusion reduction involves the reduction of SnO2 using carbon as the reducing agent:
SnO2 + C → Sn + CO2
This process normally uses coal. Given that a fraction of carbon is directly oxidized, about 2 t of CO2 is generated to produce 1 t of tin [90]. To produce 296,000 t/year, which was the world tin production in 2014 ([36], “Tin”), we need 161,455 t/year of carbon.
An alternative is direct reduction with hydrogen:
SnO2 + 2H2 → Sn + 2H2O
which is favorable at temperatures between 823 and 1023 K [91]. The power needed to electrolytically produce the hydrogen would be 0.03 GW.
Nickel production involves mining, floatation, drying up, and flash furnace heating. Even though coke is normally used as a reducing agent, the reduction can be done with hydrogen, for similar reasons to those discussed above for iron, through the following reaction:
NiO + H2 → Ni + H2O
The 2005 production of Ni was 1.5 × 10⁶ t/year [36]. The hydrogen necessary to reduce that nickel amounts to 51,107 t, which could be electrolytically produced by using 0.35 GW in a post-carbon economy. Given that 0.165 GW of carbon can be saved, the net cost increase for using hydrogen reduction will be 0.18 GW, demand that has been explicitly included in Table 5.
Precious metals (silver, gold and platinum) can be obtained as byproducts from the processing of anode slimes from copper production, leach residues and crude metal from zinc and lead production [74]. Their quantities are marginal, therefore their reduction reactions do not require any significant mass of charcoal in comparison with the estimates made above.
Lead production involves mining of galena (PbS), concentration via crushing, grinding, floatation and sintering, extraction of metal via smelting, and refining. During the smelting process (in a vertical blast furnace) the galena is roasted (reaction with O2) to remove the sulfur [91]:
2PbS + 3O2 → 2PbO + 2SO2
The formed lead oxide is reduced by coke to metallic form:
2PbO + C → 2Pb + CO2
With some help of the parallel reaction:
2PbO + PbS → 3Pb + SO2
The coke rate for reduction in lead primary production is typically 130 kg of coke per tonne of lead produced [92].
Secondary production of lead from recycled scrap amounts to 50% of world production [93]. An Ausmelt/ISASMELT furnace uses 5000 t of coke and coal in order to produce 125,000 t of secondary lead bullion, and a QSL plant uses 15,000 t of coal to produce 135,000 t of lead bullion ([94], Tables 5.5 and 5.6). Assuming that 50% of present systems for secondary production use the former system, while the other 50% use the latter with its associated coal and coke efficiencies, we estimate that 591,500 t of coke-equivalent are needed to obtain the current production of lead (5.46 × 10⁶ t/year according to [36], “lead”). Using the relative contents of carbon in charcoal (0.75) and coke (0.90), this is equivalent to 709,800 t of charcoal.
This reducing coal is essential for the process and cannot be replaced with electricity. The others steps in the chain of production could, in principle, be electrified.
Early blast furnaces used charcoal as fuel because coke was not well known and not available in sufficient quantities [95], and carbon as a reduction agent could be supplied again from renewable charcoal in a future post-carbon economy. Another feasible alternative would be hydrogen reduction, in a process similar to the one commented above for iron.
Zinc production involves mining of sphalerite (ZnS), concentration via crushing, grinding, floatation, sintering, roasting, leaching and electro-winning. Again, the reduction of the sphalerite with coal is the step that cannot be replaced with electricity. The smelting itself can be done with an electric arc [96], or by using the heat given off by the combustion of a fraction of the carbon supplied. The reduction reaction is:
2ZnO + C → 2Zn + CO2
To obtain the current production of zinc (13.3 × 10⁶ t/year according to [36], “zinc”) we would need 1.2 × 10⁶ t/year of carbon which, in principle, could be supplied from renewable charcoal production (see Section 7).
Regarding ferro-alloys, ferro-chrome, along with ferro-nickel, are the major alloys in the production of stainless steel. Silicon metal, ferro-silicon, ferro-manganese, ferro-nickel and silicon-manganese are used as additives and alloys in important industrial products. Ferro-vanadium, ferro-molybdenum, ferro-tungsten, ferro-titanium, ferro-boron, ferro-niobium, and other alloys are also produced in small quantities.
Ferro-niobium reduction occurs as an alumino-thermic process, ferro-molybdenum reduction most commonly uses a silico-thermic process and ferro-titanium is usually reduced through a metallothermic process. Thus their production does not involve coal as reducing agent [94]. Table A1 shows the annual production of the main ferro-alloys in 2005, their consumption of carbon per ton produced, and the carbon needed per year for their production.
Table A1. Annual production of the main ferro-alloys in 2005, their consumption of carbon per ton produced, and the carbon needed per year for their production. Sources: [94], Tables 8.5 to 8.10; [36], year 2005.
Ferro-AlloyProduction (Mt/year)Reducing Carbon (kg/t)Carbon (Mt/year)
Ferro-chrome6.65503.6
Ferro-silicon5.411506.2
Silicon metal0.713000.9
Ferro-manganese4.65002.3
Silicon-manganese6.95503.8
Ferro-nickel1.140004.4
Others (Fe-Bo,Fe-Ti,Fe-Va…)2.3 1.4
Total ferro-alloys27.6 22.6
We have assumed that half the alloys grouped in the “others” category will need carbon as reducing agent at a rate of 600 kg/t. The total flow of carbon required to produce the components listed in Table A1 is then almost 23 × 106 t/year, a substantial part of the annual charcoal currently produced. Given that some furnaces use a fraction of carbon for heating, perhaps 10% of this figure could be saved if electric arc furnaces were the only technology used. An alternative source of reducing agent for ferro-alloys could be methane obtained from biogas.
Carbon electrodes are usually manufactured from graphite, however fabrication of a carbon electrode is possible by using activated carbon [97], which can easily be obtained from charcoal. Graphite electrodes are used for melting scrap iron and steel (and sometimes directly-reduced iron) in electric arc furnaces, which comprise the vast majority of furnaces for recycling steel scrap. World production of synthetic primary graphite was 1.5 Mt/year in 2011 after growing 5% per year since 2001 [98], therefore synthetic primary graphite production was about 1 Mt/year in 2005.
In a post-carbon economy, graphite could be produced following these steps: wood → charcoal → coke → baking → graphitizing. Charcoal production does not require energy inputs except for transportation and milling. Charcoal to coke process (“coking”) is exothermic due to the production of coke oven gas [99]. We will assume 1.33 t of charcoal per metric ton of graphite produced if charcoal has 75% carbon content [67]. Energy input for baking is up to 11 GJ/t and graphitizing requires 9–20 GJ/t [94].
In a post-carbon economy, the 2005 level of synthetic primary graphite production could be maintained by using 3.6 × 10⁶ t/year of biomass, which is 0.3% of the sustainable biomass potential (Section 7). The energy consumed in that process would be about 1 GW, as explicitly included in Table 5.

A6. Non-Metallic Minerals

The industry for non-metallic mineral products is made up of the cement, ceramics, glass and lime sectors. These are all traditional, well-established manufacturing sectors characterized by the transformation of naturally occurring minerals such as limestone, silica, and clays, through an energy-intensive process [100]. World production of cement was 2540 million tonnes in 2006 [101]. Energy use for cement production is about 3.3 GJ/t in India, which has the most efficient cement industry in the world [51].
The main constituents of the raw materials required for cement production are calcium oxide (CaO, coming from lime), silicon dioxide (SiO2), aluminum oxide (Al2O3) and iron oxide (Fe2O3). The process consists of the crushing of raw minerals, calcination, clinkering and final milling [101]. Calcination can be forced by electric heating, and clinkering is a complex set of chemical reactions at 1400–1500 °C where belite ((CaO)2SiO2) is formed from the raw materials and alite ((CaO)3SiO2) is formed from belite and calcium oxide through the following reaction:
(CaO)2SiO2 + CaO ↔ (CaO)3SiO2
Fossil fuels are normally used to heat the furnace, however clinkering is also possible to do in an electric furnace provided that the lime is melted down from the surface of the bath before it comes into contact with the carbon electrode of the arc furnace, so avoiding the production of calcium carbide [102]. Crushing, milling and calcination can be also done by electrical means, hence cement production can, in principle, be electrified. The same is true for lime production, which involves similar steps as cement but without the clinkering process.
It is difficult to know what efficiency will have future electric industrial furnaces because presently the practical totality of furnaces is partial or totally fuel-fired. However, most of the heat loss of an industrial furnace comes from the warm flue gases released by chimneys. In a gas based furnace with a typical oxygen excess of 5%, 36% of heat is lost for furnace temperatures of 800 °C (80% for temperatures of 1600 °C) [103]. Flue gases are therefore under the low efficiency of high-temperature furnaces such as cement kilns.
A future 100% electric furnace could highly improve efficiency by avoiding the release of hot gases. Internal recirculation of hot gas, which is useful to homogenize temperature, can be made with electric fans which make possible a minimum gas release outside the furnace. Home electric furnaces use presently that principle and are able to reach high annual fuel utilization efficiencies, from 95% to almost 100% [104]. The main difference of these furnaces and future industrial electric furnaces will be the larger size of the latter. But a larger size increases the volume to surface ratio of the furnace, which decreases skin losses and tends to increase its efficiency. Thus, in our calculations we have used an efficiency of 97% for future electric industrial furnaces, a figure that is equal to that reported for air heating with electrical resistance (Table 3).
In ceramics production, raw materials are mixed and cast, pressed or extruded into shape. Water is used for a thorough mixing and shaping. This water is evaporated in dryers and the products are either placed by hand in the kiln or placed onto carriages that are transferred through continuously operated kilns. In most cases, the kilns are heated using natural gas, but liquefied petroleum gas, fuel oil, coal, petroleum coke, biogas/biomass or electricity are also used [105]. All these steps could be done with electricity, in principle.
In glass production, silica sand, process cullet, or post-consumer cullet with a set of intermediate and modifying materials (such as soda ash (Na2CO3), dolomite (CaCO3.MgCO3) and other inorganic salts) and colouring/decolouring agents (such as iron oxide (Fe2O3), carbon or pyrite) are mixed with a fluxing agent, normally sodium oxide, heated in a furnace to 1350–1500 °C and melted. Essentially, the silica from the sand combines with the sodium oxide and with other batch materials to form silicates [106]. Heating in an electric furnace is one of the techniques commonly used in this industry, which could be completely electrified, in principle.
The energy consumed in the production of non-metallic mineral products was 350 GW in 2005 (Table 5), of which 51.9% was for coal, 13.8% petroleum products, 19.1% natural gas, 1.9% biomass, 12.2% electricity and 1% heat (Table 4). We will assume that 0.4% of power is for heating, ventilation and air conditioning (HVAC) [107] by gas and will be converted by heat pumps, that 1% is for onsite transportation using oil and being converted to electrical transport, that electricity uses (machine power, lighting and HVAC) stays the same, and that the remaining fuels are used for clinkering and other energy processes, which will be electrified. The efficiency of coal, gas and oil heating in clinkering is estimated to be 0.61 from the reference above. Under these assumptions, the power needed to provide a similar quantity of products than in 2005 is 236 GW (Table 5).

A7. Refineries and Feedstock

Refining is a very energy-intensive sector, amounting to 8% of global primary energy supplied by oil [11]. In a post-carbon economy the input of energy to the refining sector would no longer be necessary. However, this energy is currently used to produce fuels and electricity that feed end-uses and is not accounted for in Table 5.
Feedstock refers to non-energy uses of energy, where energy carriers serve as a raw material. For instance, methane used for the manufacture of ammonia, naphtha used as an input for the manufacture of high value chemicals (HVCs), and coke used for manufacturing graphite electrodes. Feedstocks coming from oil are mainly produced in refineries. The feedstock sector consumed 958 GW in 2005, 75% coming from oil, 21% from natural gas and 4% from coal, and produced 793 GW of energy embedded in the feedstocks produced. It is important to note that most of the energy embodied in the chemicals produced in the “feedstock” sector is embodied in the primary chemicals produced by the chemical and petrochemical sectors, because they derive from the transformation of those feedstocks. For this reason, to avoid double counting of the energy, the present (2005) “feedstocks” sector does not appear in Table 5. About 1.2 EJ were used in 2005 to produce 1 EJ of coal-based feedstocks ([11], Figure 1.5). Coal-tar production in 1987 was about 15–17 × 106 t [108]. Assuming that the 2005 production was not very different from the upper limit of this range, that steel has a mean grade of 0.5% of carbon [109], and using the data for steel and synthetic graphite production from Sections A4 and A5, the energy content of coal feedstock embedded in steel, graphite and coal-tar production can be estimated to be 85% of the total carbon-based feedstocks reported by [11], and the total coal energy used to produce these feedstocks is 4.8 GW, 1.0 GW and 20.6 GW, respectively. The two first quantities have been explicitly added to the corresponding sectors in Table 5. We will assume that the remaining 15% unaccounted feedstock consists of other chemicals and are implicitly included, as well as coal tars, in the energy input corresponding to the “Chemical and petrochemical” sector in Table 5.
In a post-carbon economy, production of graphite and coal-based products would continue, but coal would be obtained from renewable charcoal, and renewable biogas would substitute fossil natural gas as a feedstock for ammonia production. As discussed in Section 7 and Appendix A8, a fraction of the HVCs currently coming from naphtha will have to be produced from charcoal in order to meet the demand from the petrochemical industry. And, more importantly, the rate of production of natural gas and HVCs will be limited by the global renewable potentials of biogas and charcoal, which as we discuss in Section 7, is 215 × 106 t/year and 240–300 × 106 t/year, respectively. This is equivalent to, respectively, 320 GW and 221–276 GW of power embedded in the new feedstocks (total of 541–596 GW) to be compared with 793 GW of feedstock production in 2005. This 68%–75% of energy embedded in future feedstocks will probably be insufficient in providing the same services that present feedstocks do, and this is confirmed by our analysis of the petrochemical sector (Appendix A8).
The energy required to produce charcoal and biogas in a future post-carbon society has not been calculated, but we assume that it is supplied by the raw materials used (woody biomass and organic wastes, respectively). The precise figure is not important for our discussion given that it does not add to the electrical power that a future post-carbon economy must produce. Thus, in Table 5, it appears as “>541 to >596”, expressed in GW.

A8. Petrochemical Industry

Regarding HVC, the conventional production process is based on naphtha, however there is a rising production based on coal, mainly in China [75]. 84% of the input energy is embodied in the final organic products, and 16% of it is used in the production process [110]. The second fraction could to some extent be electrified, but the first one is based on oil derivatives or coal. Best Available Techniques (BAT) for this process would allow a saving of 6.5% of the current input.
In 2004, 494 GW were used to produce all the olefins and aromatics ([51], Table 8.5). This table allows us to estimate the weights for the production of different HVCs, ammonia, methanol, other chemicals, as well as HVC processing and polymerization in the energy consumption of this sector. Electricity consumed by the sector (see Table 4) has been assumed to be distributed between the different processes in proportion to the corresponding weight. Statistics from 2004 were used for this calculation because they are more detailed than the ones we found for 2005, however a rough estimation made with less data for 2005 showed that the result obtained for 2004 is between the range of error of the result obtained for 2005.
In a post-carbon economy, coal to olefins processing would be the only alternative to oil depletion. However, this process consumes 4.1 t of coal per metric ton of olefins produced [75]. The HVCs production was 287 × 106 t in 2004 ([51], Table 8.5) and, in a post-carbon economy, this level of production would require about 1100 × 106 t of renewable charcoal. However, this figure is 3.7–4.6 times the renewable potential of charcoal production estimated in Section 7.
An alternative route is from natural gas to olefins. Ren et al. [111] studied the existing technologies and concluded that methane to olefins via methanol and dimethyl-ether, patented by the UOP Company, is the most efficient route. It consumes 1.61 t of methane and 29 GJ of additional energy per metric ton of HVCs produced. This same study estimates the energy cost of the naphtha to HVCs route (18 GJ per metric ton of HVCs) and the coal to HVCs route (about 45 GJ per metric ton of HVCs). Feedstock energy is excluded.
The total energy expenditure to produce HVCS in a post-carbon economy similar to that of 2004 (2005) was estimated by the following expression:
wr = wfs (tg + tc)/to + (wfu + wel) [(29/18) (tg/to) + (45/18) (tc/to)]
where wr is the power (Watts) demanded in a post-carbon economy; wfs, wfu, wel is the power embedded in the production process as feedstock, fossil fuel, and electricity, respectively, in 2004; tg, tc are the mass of HVCs that may be obtained from biogas and charcoal in a post-carbon economy, respectively; and to is the total mass of HVCs produced in 2004. Similar expressions are used to estimate the energy expenditure to produce ammonia, methanol, other chemicals, processing of HVCs and polymerization.
Potash, phosphates and ammonia are the three main fertilizers. Ammonia is produced essentially from air, water and natural gas with a large use of energy. Ammonia production was 140 × 106 t in 2005 ([36], “Nitrogen”). Phosphate feedstocks are water and phosphate rocks. Potash production requires natural potassium salts.
In a post-carbon economy ammonia production could be based on the steam reforming of renewable natural gas. The synthesis process can be described by the following formulae:
0.88 CH4 + 1.26 Air + 1.24 H2O → 0.88 CO2 + N2 + 3 H2
N2 + 3 H2 → 2 NH3
Natural gas normally contains up to 5 mg S.Nm-3 as sulphur compounds that must be removed. This is normally done using hydrogen with a cobalt molybdenum catalyst and then zinc oxide. The hydrogen is normally recycled during the synthesis reaction Equation (A6). An alternative synthesis is from hydrogen and air, directly with reaction Equation (A6).
Reforming of natural gas requires 22.1 GJ of natural gas and 7–9 GJ of energy (units are Low Heating Value or LHV) per metric ton of NH3 produced [112]. Therefore, 65.6 million t/year of natural gas and 35.5 GW of electricity should be produced to meet the 2005 ammonia production levels.
If the direct process of Equation (A6) were used no natural gas would be consumed, but 169 GW of electricity would be required to electrolytically produce the hydrogen feedstock and this would be added to the energy costs for pumping, cooling and heating, etc.
In the estimation of the total energy demand by a future petrochemical sector, we assume that olefin processing and polymerization decreases in the same proportion as the use of HVCs, fhvc, where fhvc = (tg + tc)/to.
Here tg is calculated from the total biogas potential available after subtracting the mass required for ammonia production, and tc is calculated from the total charcoal potential available after subtracting the mass required for the industrial processes shown in second column of Table 6.
We also assume that in a post-carbon economy ammonia production remains equal initially to its value in 2004–2005, but it decreases in the long term to 15% of that value, since this percentage of ammonium production is required for uses outside agriculture, and must remain in a future organic farming economy. The two final results (628 and 785 GW) are shown in Table 5.
From HVCs, the petrochemical industry manufactures a set of important products that are described below. Some potential substitute products that are not based on HVCs are also suggested.
Polystyrene, one of the most widely used plastics (e.g., in bottles, containers, cases and packing materials), achieved a world production of 14.6 million tonnes in 2014 [113] and is one of the main sources of persistent solid wastes. In a post-carbon economy it could be obtained from polylactic acid (PLA) which is normally produced from sugar derived from maize, sugar cane and other plants. World sugar production was 180 million tonnes a year in 2014 [114]. If about 1.1–1.8 tonnes of sugar are required to produce 1 tonne of lactic acid [115,116] and the conversion of lactic acid to polylactic acid had a similar efficiency, a substantial fraction of edible plants would be required, which would have undesirable effects on food prices. However, fermentation from lignocellulosic biomass is also possible [115] and, due to its large mass, could be a reliable source of lactic acid. The efficiency can be as high as 0.89 g of lactic acid per gram of xylan that, with a content of xylanes of 23%, which is typical of corn stover [117], would yield 1 t of lactic acid per 5 t of stover. Zia-ul-Haq [118] reports a similar yield ratio (5.3:1) for the entire process from starch and Corn Steep Liquor solids to PLA. In Section 7 we comment that woody biomass will probably be fully committed to traditional heating and cooking, and charcoal industrial demand. In 2005, 46.3 EJ of biomass were produced worldwide; of this 75% (34.7 EJ) is produced in developing countries [65] and fulfills traditional heating and cooking necessities. If we subtract this consumption from the potential of no-woody biomass (62.2 EJ/year), 27.5 EJ/year remains (about 876 Mt/year) which would be sufficient to match the demand of 175 Mt/year for PLA.
Regarding other hydrocarbons (HC) for the chemical industry, the Fischer-Tropsch process and related synthesis reactions are able to produce HC of different carbon contents, ranging from methane to waxes, and from carbon monoxide and hydrogen [119,120].
Dyes are organic molecules normally produced from petrochemical feedstocks, and have a large variety. However many of their feedstocks can also be obtained from coal, such as, e.g., naphthalene and benzene, the main feedstocks of anthraquinone [121] as well as aniline [122]. Other dyes are directly obtained from biological sources. Thus, the variety and production rates of dyes will probably decrease in a post-carbon economy, although it will not completely disappear.
Paint is composed of pigments, solvents, resins, and various additives. The pigments give the paint color; solvents make it easier to apply; resins help it dry; and additives serve to give special properties to the paint. Hundreds of different pigments exist, many of them inorganic molecules. Solvents include petroleum mineral spirits and aromatic solvents such as benzol, alcohols, esters, ketones, and acetone. The most commonly used synthetic resins are alkyds, acrylics, epoxies, and polyurethanes. However, many natural resins can also be used as an alternative to these: linseed, coconut, and soybean oils. Additives serve many purposes and many are inorganic molecules, such as calcium carbonate and aluminum silicate, which simply give the paint body and mass without changing its properties [123,124]. Polyurethane-based resins are currently obtained from petroleum, however many other resins could be used in the place of polyurethane without radically changing the paint’s performance [125,126]. Polyurethane-based synthetic fibers can be substituted by natural fibers, but the latter lack the special properties of the former, for instance, the exceptional elasticity of spandex. Polyurethane seals, gaskets, automotive suspension bushings, electrical potting compounds and hard-plastic parts for electronic instruments can probably be replaced with biological materials such as rubber, cork, and polylactic acid plastics. But there is no clear alternative to other services provided by polyurethane, such as: high-resilience foam seating; rigid foam insulation panels; durable elastomeric wheels and tires; condoms; and hoses [127].
Surfactants are usually produced from petrochemical feedstocks such as benzene, however environmentally friendly surfactants have recently been produced from renewable raw materials such as fatty alcohols from vegetable oils and D-glucose from starch [128].
Alternative non-petrochemical feedstocks are hard to find for some sub-sectors such as pharmaceutical products; there are partial substitutes for other sectors, such as hydrocarbons for the chemical industry; and more may be available for others. Nearly 99% of pharmaceutical feedstocks and reagents are derived from petrochemicals. There are so many pharmaceutical drugs that use petrochemical feedstocks that the substitutability of all of them is uncertain, and this could lead to specific health risks. However, the good news is that pharmaceuticals represent a relatively small proportion of total petroleum usage (about 3%), therefore, the supply of petrochemical feedstocks could be available over a long period after oil were abandoned as the dominant feedstock source, giving us some room to search for other substitutes. Alternative synthesis processes should be most urgently found for analgesics, antidepressants, antihyperlipidemics, antidiabetic agents, antiemetics, and antihistamines, since these are the most commonly used drugs [129].
Other oil-derived products are relatively less important for quality of life, for instance cosmetics. The shortage of some specific cosmetics is probable but their general function, enhancing the appearance and odor of the human body, can be produced by using natural cosmetics and other substitutes.
Table A2 (based on [130]) shows a list of the main petrochemical products and their possible substitutes in a post-carbon economy. An asterisk is added for the products with only partial substitutes; two asterisks are added for the products without known substitutes that are able to provide a similar service.
Table A2. The principle petrochemical products and their possible substitutes in a post-carbon economy.
ProductSubstitute
MethaneBiological methane (from urban and crop wastes)
HVC and organics for industry *CTO, Fischer-Tropsch synthesis, catalytic synthesis (from charcoal derived from woody biomass)
AsphaltBioasphalt (from biomass) [131]
Polystyrene (plastic #6)Biofoam from polylactic acid [132] (from biomass)
Epoxy resinsVegetable oil epoxy resins [133] (from vegetable oils)
Polyethylene, polypropylene, common plasticsGlass (from sand), casein plastic (from milk), keratin plastic (from chicken feathers), liquid wood (from lignin of biomass), polyhydroxyalkanoate (PHA) polyesters (from sugars of biomass), Polylactic acid (from sugars of biomass) [134]
Vinyls, acrylicsAlkyd resins from fatty acids and triglyceride oils (from vegetable oils) [135]
Polycarbonate *Ecozen (from aromatics and corn extract) [136]
PesticidesBiopesticides, biological pest control, composted yard waste, polyculture, natural acids (vinegar, lemon juice), magnesium sulfate [137]
Plastic bags, packagingPaper bags, starch based polymers, bioplastic
FertilizersCompost, recycled animal and human faeces, wood ash, leguminous plants. Organic farming
Food preservativesLactic acid, nitrates, nitrites, sulfur dioxide, sulfites, sorbic acid, ascorbates, tocopherol, citric acid, hops, salt, sugar, vinegar, alcohol
Polyurethanes *Tung oil (from tung tree), Linseed oil (from flax plants), Bioshield Hard Oil (from conifers, tung, flax, and castor plants), Hardwood Floor Oil (tree resins and vegetable oils), cotton
Polyester *Cotton, wool
Polyamide resinsNatural polyamides
NylonsRayon, silk, nylon from charcoal benzene
LubricantsVegetable oils, hydrogenated polyolefins, esters, silicones, grease
GlycerinVegetable glycerin
Organocatalysts Synthetic organocatalysts
Adhesives and sealants *Bioadhesives
PaintsPolyurethane free paints
Corrosion control chemicals Tannins, organic amino acids, alkaloids, and organic dyes of plant origin [138]
CosmeticsNatural cosmetics
Pharmaceutical drugs **Unknown for many drugs. Possible synthetic production of analgesics, antidepressants, antihyperlipidemics, antidiabetic agents, antiemetics, and antihistamines
Inks, dyes, printing supplies *Natural dyes, inorganic pigments, charcoal-based feedstocks
Surfactants and cleaning agentsSurfactants from agricultural co-products
An asterisk (*) is added for the products whose substitutes are only partial; two asterisks (**) are added for the products without known substitutes that are able to provide a similar service.

A9. Other Industry Sectors

This sector groups together other industrial activities that have not been analyzed so far, such as biotechnology, defense, furniture, healthcare, information and communication technologies, and space. We have taken the energy share of oil liquids, gas, coal, renewables, wastes, electricity and heat consumed by this sector from Table 8.22 of [51] (see Table 4). We have used an expression similar to Equation (A2) to calculate the energy cost of a possible substitution of fuel inputs with electricity, and the efficiencies associated to that expression. The result appears included in Table 5.

References

  1. García-Olivares, A.; Ballabrera, J.; García-Ladona, E.; Turiel, A. A global renewable mix with proven technologies and common materials. Energy Policy 2012, 41, 561–574. [Google Scholar] [CrossRef]
  2. García-Olivares, A.; Ballabrera-Poy, J. Energy and mineral peaks, and a future steady state economy. Technol. Forecast. Soc. Chang. 2014, 90, 587–598. [Google Scholar] [CrossRef]
  3. Holmgren, D. Future Scenarios; Chelsea Green Publishing: White River Junction, VT, USA, 2009. [Google Scholar]
  4. Duncan, R.C. Evolution, technology and the natural environment: A unified theory of human history. In Proceedings of the American Society for Engineering Education (ASEE), St. Lawrence Section, Annual Meeting, Binghamton, NY, USA; 1989. [Google Scholar]
  5. Fouquet, R. The slow search for solutions: Lessons from historical energy transitions by sector and service. Energy Policy 2010, 38, 6586–6596. [Google Scholar] [CrossRef]
  6. García-Olivares, A. Substituting silver in solar photovoltaics is feasible and allows for decentralization in smart regional grids. Environ. Innov. Soc. Transit. 2015. [Google Scholar] [CrossRef]
  7. Greer, J.M. The Archdruid Report. Available online: http://thearchdruidreport.blogspot.com.es/2015/02/as-night-closes-in.html (accessed on 5 September 2015).
  8. Delucchi, M.A.; Jacobson, M.Z. Providing all global energy with wind, water, and solar power, part II: Reliability, system and transmission costs, and policies. Energy Policy 2011, 39, 1170–1190. [Google Scholar] [CrossRef]
  9. Solé, J.; García-Olivares, A.; Turiel, A.; Ballabrera-Poy, J.; García-Ladona, E. Renewable transitions and the net energy from oil liquids: A scenarios study. Energy Policy 2015. submitted. [Google Scholar]
  10. García-Olivares, A. Energy for a sustainable post-carbon society. Sci. Mar. 2015, in press. [Google Scholar]
  11. Grubler, A.; Johansson, T.B.; Mundaca, L.; Nakicenovic, N.; Pachauri, S.; Riahi, K.; Rogner, H.-H.; Strupeit, L. Chapter 1—Energy primer. In Global Energy Assessment—Toward a Sustainable Future; Cambridge University Press: Cambridge, UK; New York, NY, USA; The International Institute for Applied Systems Analysis: Laxenburg, Austria, 2012; pp. 99–150. [Google Scholar]
  12. Llewellyn, C.; Ward, D. Fusion. Energy Policy 2008, 36, 4331–4334. [Google Scholar] [CrossRef]
  13. Beckman, J.; Borchers, A.; Jones, C.A. Agriculture’s supply and demand for energy and energy products. In Economic Information Bulletin 112; U.S. Department of Agriculture, Economic Research Service: Washington, DC, USA, 2013. [Google Scholar]
  14. Sims, R.E.H. Global energy resources, supply and demand, energy security and on-farm energy efficiency. In Sustainable Energy Solutions in Agriculture; Brundschuh, J., Chen, G., Eds.; Chemical Rubber Company Press (CRC): Cleveland, OH, USA, 2014. [Google Scholar]
  15. Pimentel, D. Energy inputs in food crop production in developing and developed nations. Energies 2009, 2, 1–24. [Google Scholar] [CrossRef]
  16. Delucchi, M.A. A Life Cycle Emissions Model (LEM): Life Cycle Emissions from Transportation Fuels, Motor Vehicles, Transportation Modes, Electricity Use, Heating and Cooking Fuels, and Materials; Main Report, UCD-ITS-03–17; Institute of Transportation Studies, University of California: Davis, CA, USA, 2003. [Google Scholar]
  17. Ballard-Tremeer, G.; Jawurek, H.H. Comparison of five rural, wood-burning cooking devices: Efficiencies and emissions. Biomass Bioenergy 1996, 11, 419–430. [Google Scholar] [CrossRef]
  18. Wikipedia. Available online: https://en.wikipedia.org/wiki/Condensing_boiler (accessed on 5 September 2015).
  19. Grantham, J. GMO Quarterly Letter, July 2012. Welcome to Dystopia! Entering a Long-Term and Politically Dangerous Food Crisis. Available online: http://www.commodityintelligence.com/images/2012/aug/8th/J-grantham-letter.pdf (accessed on 5 September 2015).
  20. Badgley, C.; Moghtader, J.; Quintero, E.; Zakem, E.; Chappell, J.; Avilés-Vázquez, K.; Samulon, A.; Perfecto, I. Organic agriculture and the global food supply. Renew. Agric. Food Syst. 2007, 22, 86–108. [Google Scholar] [CrossRef]
  21. Halberg, N.; Alroe, H.F.; Knudsen, M.T.; Kristensen, E.S. Global Development of Organic Agriculture: Challenges and Prospects; Centre for Agriculture and Biosciences International (CABI) Publishing: Wallingford, UK, 2007. [Google Scholar]
  22. El-Hage Scialabba, N. Organic Agriculture and Food Security, International Conference on Organic Agriculture and Food Security (FAO), Rome, Italy, 3–5 May 2007. Available online: http://www.fao.org/organicag/oa-publications/pub-cat/sustainability-and-perspectives/en/ (accessed on 18 November 2015).
  23. Nemes, N. Comparative Analysis of Organic and Non-Organic Farming Systems: A Critical Assessment of Farm Profitability; Food and Agriculture Organization of the United Nations, Natural Resources Management and Environment Department: Rome, Italy, 2009. [Google Scholar]
  24. Steen, I. Phosphorus availability in the 21st century: Management of a non-renewable resource. Phosphorus Potassium 1998, 217, 25–31. [Google Scholar]
  25. Cordell, D.; Drangert, J.-O.; Neset, T.S.S. The story of phosphorus: Global food security and food for thought. Glob. Environ. Chang. 2009, 19, 292–305. [Google Scholar] [CrossRef]
  26. Roberts, T.L. Global potassium reserves and potassium fertilizer use. In Proceedings of the Symposium—Global Nutrient Cycling, 2008 Joint Annual Meeting, Houston, Texas, USA, 6 October 2008.
  27. Food Outlook, Global Information and Early Warning System; Food and Agriculture Organization of the United Nations, 2012; Available online: http://www.fao.org/docrep/016/al993e/al993e00.pdf (accessed on 18 November 2015).
  28. Richey, A.S.; Thomas, B.F.; Lo, M.-H.; Reager, J.T.; Famiglietti, J.S.; Voss, K.; Swenson, S.; Rodell, M. Quantifying renewable groundwater stress with GRACE. Water Resour. Res. 2015. [Google Scholar] [CrossRef]
  29. Fishing Fleet. Wikipedia. Available online: https://en.wikipedia.org/wiki/Fishing_fleet (accessed on 18 November 2015).
  30. Ivy, J. Summary of Electrolytic Hydrogen Production, Milestone Completion Report; NREL/MP-560–36734; National Renewable Energy Laboratory: Golden, CO, USA, 2004.
  31. Bossel, U. On the way to a sustainable energy future. In Proceedings of the European Fuel Cell Forum, Oberrohrdorf, Switzerland, 16–21 October 2005.
  32. CellKraft, Fact Sheet: Fuel Cell Systems, 2006. Available online: http://cellkraft.se/fuelcells/products-2/ (accessed on 5 September 2015).
  33. Jacobson, M.Z.; Delucchi, M.A. Providing all global energy with wind, water, and solar power, part I: Technologies, energy resources, quantities and areas of infrastructure, and materials. Energy Policy 2011, 39, 1154–1169. [Google Scholar] [CrossRef]
  34. Walsh, M.P. Motor Vehicles: Overview, Alternatives, Issues. Air Pollution as Climate Forcing: Alternative Scenarios—Their Benefits and Costs. Available online: http://www.walshcarlines.com/mpwdocs.html (accessed on 5 September 2015).
  35. Antolini, E.; Zignani, S.C.; Santos, S.F.; Gonzalez, E.R. Palladium-based electrodes: A way to reduce platinum content in polymer electrolyte membrane fuel cells. Electrochim. Acta 2011, 56, 2299–2305. [Google Scholar] [CrossRef]
  36. USGS, US Geological Survey. Commodity Statistics and Information, 2015. Available online: http://minerals.usgs.gov/minerals/pubs/commodity/ (accessed on 5 September 2015).
  37. How Many Ships Are There in the World, Wikipedia. Available online: https://shippingresearch.wordpress.com/2012/07/31/how-many-ships-are-there-in-the-world/ (accessed on 5 September 2015).
  38. Navy Ships. Wikipedia. Available online: http://www.globalfirepower.com/navy-ships.asp (accessed on 5 September 2015).
  39. EconStats, World Bank, World Development Indicators, Agricultural Production, Agricultural Machinery Tractors. Available online: http://www.econstats.com/wdi/wdiv___1.htm (accessed on 18 November 2015).
  40. Özata, M.; Toygar, S.A.; Yorulmaz, M.; Cihangiroğlu, N. Comparative analysis of using 112 emergency ambulance services in Turkey and the province of Konya. Eur. J. Gen. Med. 2011, 8, 262–267. [Google Scholar]
  41. SCRGSP (Steering Committee for the Review of Government Service Provision) 2014. Report on Government Services 2014. Vol. D, Emergency Management, Chapter 9, Fire and Ambulance Services. Canberra: Productivity Commission. Available online: http://www.pc.gov.au/research/ongoing/report-on-government-services/2014/emergency-management/fire-and-ambulance-services (accessed on 18 November 2015).
  42. Yang, C.-J. An impending platinum crisis and its implications for the future of the automobile. Energy Policy 2009, 37, 1805–1808. [Google Scholar] [CrossRef]
  43. SkySails. Wikipedia. Available online: https://en.wikipedia.org/wiki/SkySails (accessed on 5 September 2015).
  44. Engine Efficiency. Wikipedia. Available online: https://en.wikipedia.org/wiki/Engine_efficiency#Gasoline_.28petrol.29_engines (accessed on 5 September 2015).
  45. Diesel Engine. Wikipedia. Available online: https://en.wikipedia.org/wiki/Diesel_engine#Basic_types (accessed on 5 September 2015).
  46. Gagnon, L. Civilisation and energy payback. Energy Policy 2008, 36, 3317–3322. [Google Scholar] [CrossRef]
  47. USDOE Fuel-Cell, US Department of Energy. Hydrogen and Fuel Cell Technologies Program: Fuel Cells. EERE Information Center, 2010. Available online: http://energy.gov/eere/fuelcells/types-fuel-cells (accessed on 18 November 2015). [Google Scholar]
  48. Green Building Advisor. Energy Solutions. Efficient Cooking. Available online: http://www.greenbuildingadvisor.com/blogs/dept/energy-solutions/efficient-cooking (accessed on 18 November 2015).
  49. Heat Pump. Wikipedia. Available online: https://en.wikipedia.org/wiki/Heat_pump#Efficiency (accessed on 5 September 2015).
  50. Condensing Boiler. Wikipedia. Available online: https://en.wikipedia.org/wiki/Condensing_boiler (accessed on 5 September 2015).
  51. Banerjee, R.; Cong, Y.; Gielen, D.; Jannuzzi, G.; Maréchal, F.; McKane, A.T.; Rosen, M.A.; van Es, D.; Worrell, E. Chapter 8—Energy end use: Industry. In Global Energy Assessment—Toward a Sustainable Future; Cambridge University Press: Cambridge, UK; New York, NY, USA; The International Institute for Applied Systems Analysis: Laxenburg, Austria, 2012; pp. 513–574. [Google Scholar]
  52. US-DOE, Energy Gov., Office of Energy Efficiency and Renewable Energy. Manufacturing Energy and Carbon Footprints (2010 MECS), 2014. Available online: http://energy.gov/eere/amo/manufacturing-energy-and-carbon-footprints-2010-mecs (accessed on 18 November 2015).
  53. Red Eléctrica Española, Mapas de la red, 2015. Available online: http://www.ree.es/es/actividades/gestor-de-la-red-y-transportista/mapas-de-la-red (accessed on 18 November 2015).
  54. Baolin, H.; Zhang, H.; Hongzhong, L.I.; Zhu, Q. Study on kinetics of iron oxide reduction by hydrogen. Chin. J. Chem. Eng. 2012, 20, 10–17. [Google Scholar]
  55. Haywood, R. Process optimization and design of a belt furnace for nickel oxide reduction. In Proceedings of the Third International Conference on CFD in the Minerals and Process Industries, Melbourne, Australia, 10–12 December 2003.
  56. Crucible Steel. Wikipedia. Available online: http://en.wikipedia.org/wiki/Crucible_steel#Methods_of_crucible_steel_production (accessed on 5 September 2015).
  57. International Energy Agency (IEA). Tracking Industrial Energy Efficiency and CO2 Emissions, in Support of the G8 Plan of Action; International Energy Agency, Head of Communication and Information Office: Paris, France, 2007. [Google Scholar]
  58. Giampietro, M.; Mayumi, K. The Biofuel Delusion: The Fallacy of Large Scale Agro-biofuels Production; Earthscan: London, UK, 2009. [Google Scholar]
  59. Matondi, P.B.; Havnevik, K.; Beyene, A. Biofuels, Land Grabbing and Food Security in Africa; Zed Books: London, UK, 2011. [Google Scholar]
  60. Reijnders, L. Conditions for the sustainability of biomass based fuel use. Energy Policy 2006, 34, 863–876. [Google Scholar] [CrossRef]
  61. Martin, A.R.; Thomas, S.C. A reassessment of carbon content in tropical trees. PLoS ONE 2011, 6, e23533. [Google Scholar] [CrossRef] [PubMed]
  62. Biomass Burn Characteristics. Fact Sheet. Ontario Ministry of Agriculture, Food and Rural Affaires, 2014. Available online: http://www.omafra.gov.on.ca/english/engineer/facts/11-033.htm (accessed on 18 November 2015).
  63. Food and Agriculture Organization of the United Nations. State of the World’s Forests; ISBN 978–92–5-307292–7. Food and Agriculture Organization of the United Nations: Roma, Italy, 2012. [Google Scholar]
  64. Girard, P. Charcoal Production and Use in Africa: What Future? FAO Corporate Document Repository, 2003. Available online: http://www.fao.org/docrep/005/y4450e/y4450e10.htm (accessed on 18 November 2015).
  65. Parikka, M. Global biomass fuel resources. Biomass Bioenergy 2004, 27, 613–620. [Google Scholar] [CrossRef]
  66. Biogas—An Important Renewable Energy Source. WBA Fact Sheet. World Bioenergy Association: Holländargatan 17, SE 111 60 Stockholm, Sweden, 2013. Available online: http://www.worldbioenergy.org/content/wba-launches-new-fact-sheet-biogas-%E2%80%93-important-renewable-energy-source (accessed on 18 November 2015).
  67. Industrial Charcoal Making. Food and Agriculture Organization of the United Nations: Rome, Italy Chapter 2. Available online: http://www.fao.org/docrep/x5555e/x5555e00.htm#Contents (accessed on 18 November 2015).
  68. Greener Industry, Ammonia, Main Uses. Available online: http://www.greener-industry.org.uk/pages/ammonia/2AmmoniaMU.htm (accessed on 5 September 2015).
  69. Wikipedia, “Ammonia”. Available online: https://en.wikipedia.org/wiki/Ammonia#Uses (accessed on 5 September 2015).
  70. International Energy Agency. Key World Energy Statistics; International Energy Agency: Paris, France, 2014; p. 28. [Google Scholar]
  71. World Energy Council. World Energy Scenarios: Composing Energy Futures to 2050; World Energy Council: London, UK, 2013; p. 150. Available online: https://www.worldenergy.org/publications/2013/world-energy-scenarios-composing-energy-futures-to-2050/ (accessed on 18 November 2015).
  72. World Population Prospects of the UN (2015 Revision). Available online: http://esa.un.org/unpd/wpp/DataQuery/ (accessed on 18 November 2015).
  73. García-Olivares, A.; Solé, J. End of growth and the structural instability of capitalism-from capitalism to a symbiotic economy. Futures 2014, 68, 31–43. [Google Scholar] [CrossRef]
  74. Valero, A.; Valero, A. Thanatia: The Destiny of the Earth’s Mineral Resources; World Scientific: London, UK, 2015. [Google Scholar]
  75. Xiang, D.; Qian, Y.; Man, Y.; Yang, S. Techno-economic analysis of the coal-to-olefins process in comparison with the oil-to-olefins process. Appl. Energy 2014, 113, 639–647. [Google Scholar] [CrossRef]
  76. Chang, T. Worldwide Ethylene Capacity Grows in Spite of Warnings. Oil Gas J. 2008. Available online: http://www.ogj.com/articles/print/volume-96/issue-13/in-this-issue/general-interest/worldwide-ethylene-capacity-grows-in-spite-of-warnings.html (accessed on 18 November 2015). [Google Scholar]
  77. WHO 2014. Global Health Observatory (GHO) Data. Available online: http://www.who.int/gho/publications/world_health_statistics/2014/en/ (accessed on 5 September 2015).
  78. Malek, M. Boiler Design. In Power Boiler Design, Inspection and Repair; McGraw-Hill: New York, NY, USA, 2005; Available online: https://en.wikipedia.org/wiki/Electric_steam_boiler (accessed on 5 September 2015).
  79. Kohler, S.; Lücke, A. Energy Modernisation of Industrial Heating Systems; Dena, German Energy Agency: Berlin, Germany, 2011. [Google Scholar]
  80. US-DOE Machinery, Energy.Gov., Office of Energy Efficiency and Renewable Energy. Machinery (2010 MECS), 2014. Available online: http://energy.gov/eere/amo/downloads/machinery-2010-mecs (accessed on 5 September 2015).
  81. US-DOE Forest Products, Energy.Gov., Office of Energy Efficiency and Renewable Energy. Forest Products (2010 MECS), 2014. Available online: http://energy.gov/eere/amo/downloads/forest-products-2010-mecs (accessed on 5 September 2015).
  82. EuroStat Archive: Mining and Quarrying Statistics—NACE Rev. 1.1, 2009. Available online: http://ec.europa.eu/eurostat/statistics-explained/index.php/Archive:Mining_and_quarrying_statistics_-_NACE_Rev._1.1 (accessed on 18 November 2015).
  83. European Commission. BAT Textile, Integrated Pollution Prevention and Control (IPPC). Reference Document on Best Available Techniques for the Textiles Industry; European Commission: Brussels, Belgium, 2003. [Google Scholar]
  84. Palamutcu, S. Electric energy consumption in the cotton textile processing stages. Energy 2010. [Google Scholar] [CrossRef]
  85. World Coal Association. Coal and Steel. Available online: http://www.worldcoal.org/coal/uses-of-coal/how-steel-produced (accessed on 18 November 2015).
  86. Iron, B.A.T.; Remus, R.; Monsonet, A.A.; Roudier, S.; Delgado Sancho, L. Best Available Techniques (BAT) Reference Document for Iron and Steel Production; Industrial Emissions Directive 2010/75/EU; European Commission Joint Research Center: Brussels, Belgium, 2012. [Google Scholar]
  87. Process and Apparatus for Continuously Reducing and Melting Metal Oxides and/or Pre-Reduced Metallic Materials. U.S. Patent 4380469 A. Available online: http://www.google.es/patents/US4380469 (accessed on 18 November 2015).
  88. US-DOE Iron and Steel, Energy.Gov., Office of Energy Efficiency and Renewable Energy. Iron and Steel (2010 MECS), 2014. Available online: http://energy.gov/eere/amo/downloads/iron-and-steel-2010-mecs (accessed on 5 September 2015).
  89. Luidold, S.; Antrekowitsch, H. Hydrogen as a reducing agent: State-of-the-art science and technology. JOM 2007, 59, 20–26. [Google Scholar] [CrossRef]
  90. Kim, B.-S.; Lee, J.-C.; Yoon, H.-S.; Kim, S.K. Reduction of SnO2 with hydrogen. Mater. Trans. 2011, 52, 1814–1817. [Google Scholar] [CrossRef]
  91. Base metal smelting. Chemical Reactions of Lead Smelting. Available online: http://siddikabasemetalsmelting.weebly.com/lead-smelting.html (accessed on 18 November 2015).
  92. Errington, B.; Arthur, P.; Dong, Y. The ISA-YMG lead smelting process. In Proceedings of the PbZn 2005 Conference, Kyoto, Japan, 17–19 October 2005.
  93. International Lead Association. Lead Production & Statistics. Available online: http://www.ila-lead.org/lead-facts/lead-production--statistics (accessed on 18 November 2015).
  94. European Commission; Joint Research Center. BAT Non-Ferrous, Best Available Techniques (BAT) Reference Document for the Non-Ferrous Metals Industries. GC/EIPPCB/NFM Final Draft; Industrial Emissions Directive 2010/75/EU; European Commission; Joint Research Center: Brussels, Belgium, 2014. [Google Scholar]
  95. Blast Furnaces, Early. Available online: http://www.encyclopedia.com/doc/1G2-3401800481.html (accessed on 18 November 2015).
  96. Zinc. Available online: http://www.mechanicalebook.com/topics/topicz/zinc.htm (accessed on 18 November 2015).
  97. Choi, J.-H. Fabrication of a carbon electrode using activated carbon powder and application to the capacitive deionization process. Sep. Purif. Technol. 2010, 70, 362–366. [Google Scholar] [CrossRef]
  98. Graphite Supply and Demand, Graphite Uses and Future Demand. Alabama Graphite. Available online: http://alabamagraphite.com/graphite-supply-demand/ (accessed on 5 September 2015).
  99. Coking: Energy Consumption Statistics, Metals Advisor. Available online: http://www.heattreatconsortium.com/metalsadvisor/iron_and_steel/process_descriptions/raw_metals_preparation/coking/coking_energy_consumption_stats.htm (accessed on 18 November 2015).
  100. Non-Metallic Products and Industries, Growth. European Commission: Brussels, Belgium. Available online: http://ec.europa.eu/growth/sectors/raw-materials/industries/non-metals/index_en.htm (accessed on 18 November 2015).
  101. Schorcht, F.; Kourti, I.; Scalet, B.M.; Roudier, S.; Sancho, L.D. Best Available Techniques (BAT) Reference Document for the Production of Cement, Lime and Magnesium Oxide; Industrial Emissions Directive 2010/75/EU; European Commission; Joint Research Center: Brussels, Belgium, 2014. [Google Scholar]
  102. Karl, G.W. Process for Producing Cement of Liquid Slags in Electric Furnaces. U.S. Patent 1343948 A, 22 June 1920. [Google Scholar]
  103. Tucker, B. Energy Efficient Design and Operation of Fuel-Fired Furnaces, 2008. Available online: http://www.vesma.com/tutorial/furnaces.htm (accessed on 18 November 2015).
  104. USDOE Furnaces, 2015, US Department of Energy, Furnaces and Boilers. Available online: http://breakingenergy.com/2015/01/21/furnaces-and-boilers/ (accessed on 18 November 2015).
  105. European Commission. Integrated Pollution Prevention and Control (IPPC). Reference Document on Best Available Techniques in the Ceramic Manufacturing Industry; European Commission: Brussels, Belgium, 2014. [Google Scholar]
  106. JRC Reference Report. In Best Available Techniques (BAT) Reference Document for the Manufacture of Glass. Industrial Emissions Directive 2010/75/EU (Integrated Pollution Prevention and Control; European Commission: Brussels, Belgium, 2013.
  107. Energy.Gov., Office of Energy Efficiency and Renewable Energy. Cement (2010 MECS). Available online: http://energy.gov/eere/amo/downloads/glass-and-glass-products-2010-mecs (accessed on 18 November 2015).
  108. Worsham, P.R. Feedstocks, Coal Chemicals. Kirk-Othmer Encyclopedia of Chemical Technology; John Wiley & Sons, Inc.: Hoboken, NJ, USA, 2000. [Google Scholar]
  109. West York Steel. Carbon Steel. Available online: http://www.westyorkssteel.com/carbon-steel/ (accessed on 1 June 2015).
  110. Head of Communication and Information Office. Energy Technology Perspectives in Support of the G8 Plan of Action. Scenarios and Strategies to 2050; OECD/IEA 2008; Head of Communication and Information Office: Paris, France, 2008. [Google Scholar]
  111. Ren, T.; Patel, M.K.; Blok, K. Steam cracking and methane to olefins: Energy use, CO2 emissions and production costs. Energy 2008, 33, 817–833. [Google Scholar] [CrossRef]
  112. European Fertilizer Manufacturers Association. Production of Ammonia, Best Available Techniques for Pollution Prevention and Control in the European Fertilizer Industry; Booklet N° 1; European Fertilizer Manufacturers Association: Brussels, Belgium, 2000. [Google Scholar]
  113. The Essential Chemical Industry Online, Poly(phenylethene) (polystyrene). Available online: http://www.essentialchemicalindustry.org/polymers/polyphenylethene.html (accessed on 5 September 2015).
  114. SUCDEN. World Sugar Production. Available online: http://www.sucden.com/statistics/1_world-sugar-production (accessed on 18 November 2015).
  115. Yang, X.; Lai, Z.; Lai, C.; Zhu, M.; Li, S.; Wang, J.; Wang, X. Efficient production of L-Lactic acid by an engineered thermoanaerobacterium aotearoense with broad substrate specificity. Biotechnol. Biofuels 2013, 28, 124. [Google Scholar] [CrossRef] [PubMed]
  116. Ghaffar, T.; Irshad, M.; Anwar, Z.; Aqil, T.; Zulifqar, Z.; Tariq, A.; Kamran, M.; Ehsan, N.; Mehmood, S. Recent trends in lactic acid biotechnology: A brief review on production to purification. J. Radiat. Res. Appl. Sci. 2014, 7, 222–229. [Google Scholar] [CrossRef]
  117. Rollin, J.A.; del Campo, J.M.; Myung, S.; Sun, F.; You, C.; Bakovic, A.; Castro, R.; Chandrayan, S.K.; Wu, C.-H.; Adams, M.W.W.; et al. High-yield hydrogen production from biomass by in vitro metabolic engineering: Mixed sugars coutilization and kinetic modeling. Proc. Natl. Acad. Sci. USA 2015, 112, 4964–4969. [Google Scholar] [CrossRef] [PubMed]
  118. Department of Chemical Engineering Nfc Institute Of Engineering & Fertilizer Research. Zial-ul-Haq, 1000 TPD Production of PLA (Polylactic Acid); Final Project Report; Department of Chemical Engineering Nfc Institute of Engineering & Fertilizer Research: Faisalabad, Pakistan, 2013. [Google Scholar]
  119. Probstien, R.F.; Hicks, R.E. Synthetic Fuels; McGraw-Hill Book Company: New York, NY, USA, 1982. [Google Scholar]
  120. Dry, M.E. The fischer–tropsch process: 1950–2000. Catal. Today 2002, 71, 227–241. [Google Scholar] [CrossRef]
  121. Baptista, R.J. The chemistry and manufacture of vat dyes. Colorants Industry History. Available online: http://www.colorantshistory.org/ (accessed on 18 November 2015).
  122. Colorants History. National Aniline and Chemical Company: Buffalo, NY, USA. Available online: http://www.colorantshistory.org/NationalAniline.html (accessed on 18 November 2015).
  123. How Products are Made, Paint. Available online: http://www.madehow.com/Volume-1/Paint.html (accessed on 5 September 2015).
  124. Flick, E.W. Handbook of Paint Raw Materials, 2nd ed.; William Andrew Publishing/Noyes: New York, NY, USA, 1989. [Google Scholar]
  125. Green Living Ideas, 5 Nontoxic Alternatives to Polyurethane. Available online: http://greenlivingideas.com/2014/07/28/5-nontoxic-alternatives-polyurethane/ (accessed on 5 September 2015).
  126. Reclaimed Home. Polyurethane Alternatives, 12 January 2010. Available online: http://reclaimedhome.com/2010/01/12/polyurethane-alternatives/ (accessed on 5 September 2015).
  127. Polyurethane. Wikipedia. Available online: https://en.wikipedia.org/wiki/Polyurethane (accessed on 5 September 2015).
  128. Bouxin, F.; Marinkovic, S.; le Bras, J.; Estrine, B. Direct conversion of xylan into alkyl pentosides. Carbohydr. Res. 2010, 345, 2469–2473. [Google Scholar] [CrossRef] [PubMed]
  129. Hess, J.; Bednarz, D.; Bae, J.; Pierce, J. Petroleum and health care: Evaluating and managing health care’s vulnerability to petroleum supply shifts. Am. J. Public Health 2011, 101, 1568–1579. [Google Scholar] [CrossRef] [PubMed]
  130. Petrochemical. Wikipedia. Available online: http://en.wikipedia.org/wiki/Petrochemical (accessed on 5 September 2015).
  131. Iowa State University. Bioasphalt Developed at Iowa State to be Used, Tested on Des Moines Bike Trail. Available online: http://www.news.iastate.edu/news/2010/oct/Bioasphalt (accessed on 5 September 2015).
  132. United States Department of Agriculture. From Lubricants to Packaging Materials, ARS Scientists Just Say“No”to Petroleum; United States Department of Agriculture, AgResearch Magazine: Washington, DC, USA, 2009. [Google Scholar]
  133. Bertomeu, D.; García-Sanoguera, D.; Fenollar, O.; Boronat, T.; Balart, R. Use of eco-friendly epoxy resins from renewable resources as potential substitutes of petrochemical epoxy resins for ambient cured composites with flax reinforcements. Polym. Compos. 2012, 33, 683–692. [Google Scholar] [CrossRef]
  134. Trimarchi, M.; Giuggio, V.M. Top 10 Eco-Friendly Substitutes for Plastic. How Stuff Works. 2014. Available online: http://science.howstuffworks.com/environmental/green-tech/sustainable/5-plastic-substitutes.htm#page=0 (accessed on 5 September 2015).
  135. Alkyd, Wikipedia. Available online: http://en.wikipedia.org/wiki/Alkyd (accessed on 5 September 2015).
  136. Ecozen, An Alternative to Polycarbonate, BPA Substitutions, Institut National de l’Environnement Industriel et des Risques (INERIS), Service National d’assistance on the Substitution of Bisphenol A. Newsletter N° 4, Verneuil-en-Halatte, France, 2014. Available online: http://www.ineris.fr/substitution-bpa/en/newsletters/archive (accessed on 18 November 2015).
  137. Biological Pest Control, Wikipedia. Available online: https://en.wikipedia.org/wiki/Biological_pest_control (accessed on 5 September 2015).
  138. Patni, N.; Agarwal, S.; Shah, P. Greener approach towards corrosion inhibition. Chin. J. Eng. 2013. [Google Scholar] [CrossRef]

