1. Introduction
The increasing demands on fuels have encouraged the researchers and industry to focus on renewable alternative fuels. Diesel engine emission is another factor pushing towards the development of alternative fuels. The fuel mixture with less engine emission giving a comparable power and/or enhancing the combustion efficiency using renewable resources is favorable. Rinaldini and Mattarelli [
1] highlighted a current increased pressure on the engine manufacturer to limit the CO
2 and other emissions from the diesel engine, which can only be achieved by enhancing the engine technology to increase the energy efficiency and/or reduce the carbon to hydrogen ratio. Renewable oxygenated fuels such as alcohol and vegetable oil are proposed to reduce diesel engine emission.
Diesel engines can be operated using vegetable oil without or with minor modifications. Microalgae oil has the potential to overcome the problems associated with vegetable oil production for fuel that lead to increasing human food prices [
1,
2,
3]. One of the concerns of using vegetable oil directly in diesel engines is the high viscosity. Viscosity is an important factor that affects the atomization process of the fuel in the combustion [
4]. High viscosity was reported to reduce the fuel flow rate, which makes the engine starve for fuel under certain operating conditions, especially at low temperatures [
5]. Transesterification is the most common method used to reduce oil viscosity. However, vegetable oil has a higher viscosity and pour point and lower volatility compared to PD [
6]. Microalgae biodiesel 20% was tested in diesel engines by Rinaldini and Mattarelli [
1]; the results showed a slight reduction in the engine torque at high load and slight increase in SFC. The NO
x was found to be 20% higher than diesel fuel at low speed with high load. The CO
2 also dropped at low to mid speed. Similarly, Al-lwayzy and Yusaf [
2] reported no significant difference in tractor diesel engine performance parameters with microalgae biodiesel 20% compared to PD, and a significant reduction in CO, CO
2 and NO
x emission was found when microalgae 20% was used.
Ethanol is a promising renewable alternative fuel that has been used as an additive to PD to run the diesel engine and reduce the engine emission [
7]. The mixture of ethanol and PD fuel is called diesohol or e-diesel [
8]. Bioethanol as fuel can increase the farmers income when it is locally produced from the agricultural waste material [
9]. The main drawback of ethanol in diesel engine is the low cetane number, low viscosity and low density. Moreover, it is immiscible in diesel at wide range of temperature and depend on its water content [
9].
The stability of ethanol in PD depends on the carbon structure, water content and temperature [
8,
10]. It has been reported that anhydrous ethanol (ethanol containing less than 1% water) should be blended with diesel for better fuel properties [
8,
11]. The low viscosity of ethanol increases the fuel leakage in the fuel injection pump that reduces the injection fuel pressure and amount injected to the combustion chamber. Several studies have been conducted aiming to increase the cetane number of the blend of ethanol with diesel fuel [
9].
Adding biodiesel to the blend of ethanol and PD, the stability of the mixture was enhanced at a wide range of temperatures and enhances other fuel properties, some of them even better than the PD [
11]. Recently, Shahir
et al. [
8] stated that among the renewable alternative fuels, the blend of biodiesel, ethanol and PD is getting more and more attractive due to the presence of biodiesel improving the mixture fuel properties and engine performance. Using a mixture of biodiesel and alcohol with diesel fuel produces less CO, PM and UHC [
9]. The cold flow has been improved by adding ethanol to the Mahua biodiesel and the CO emission reduced. The reduction in the NO
x emission was due to the high latent heat of ethanol which reduced the overall combustion temperature [
12].
Kannan and Anand [
6] have compared the engine performance end exhaust gas emission of diesel fuel with biodiesel, and diestrol fuel of diesel biodiesel with ethanol water emulsion. The results showed that the in-cylinder pressure of the diestrol was dependent on the load. At medium and high loads, the in cylinder pressure was identical to diesel. The engine emission of CO, CO
2, HC and NO
x were found to be lower than PD at all loads. The ternary blend of ethanol-biodiesel-diesel fuel physical properties and emission of NO
x, HC, CO and CO
2 were found to be very close to PD depending on the operating conditions of the test [
8]. Adding ethanol and biodiesel to PD fuel has the advantage of reducing the sulphur content in the fuel. In addition, the lower freezing point of ethanol enhance the biodiesel blend at low temperature conditions [
13]. Shahir
et al. [
8] concluded that there is a need to study the performance of ternary fuel of ethanol biodiesel and PD and the best blend ratio.
Based on the work reviewed above, the ternary mixture of ethanol, biodiesel has several advantages. In this work, microalgae oil will be used instead of biodiesel to eliminate the cost of the transesterification process and further improve the mixture properties. The main objectives of this work are to:
Use up to 20% of renewable oxygenated fuel of microalgae oil and ethanol as an alternative to the commonly used fossil fuel.
Enhance the fuel properties by adding 10% of microalgae oil and along with 10% of ethanol to 80% PD. The blending process aims to overcome the problems of high viscosity of microalgae oil and low viscosity of ethanol and the high latent heat of evaporation of the ethanol.
Reduce the exhaust gas emission such as CO, CO2, NOx and HC and maintain the engine BP and torque.
3. Results and Discussion
Table 2 presents the chemical concentration profile of microalgae
Chlorella protothecoides oil which provided by the oil supplier (Soley institute, Istanbul, Turkey) [
14]. The highest component is the saturated palmitic acid of 51% and 2% of stearic acid. The higher percentage of palmitic acid (C16) that might cause a problem at cold flow conditions was overcome by adding ethanol, which reduces the viscosity of the mixture. The rest of the components are unsaturated. The highest percentage is oleic acid of 39%.
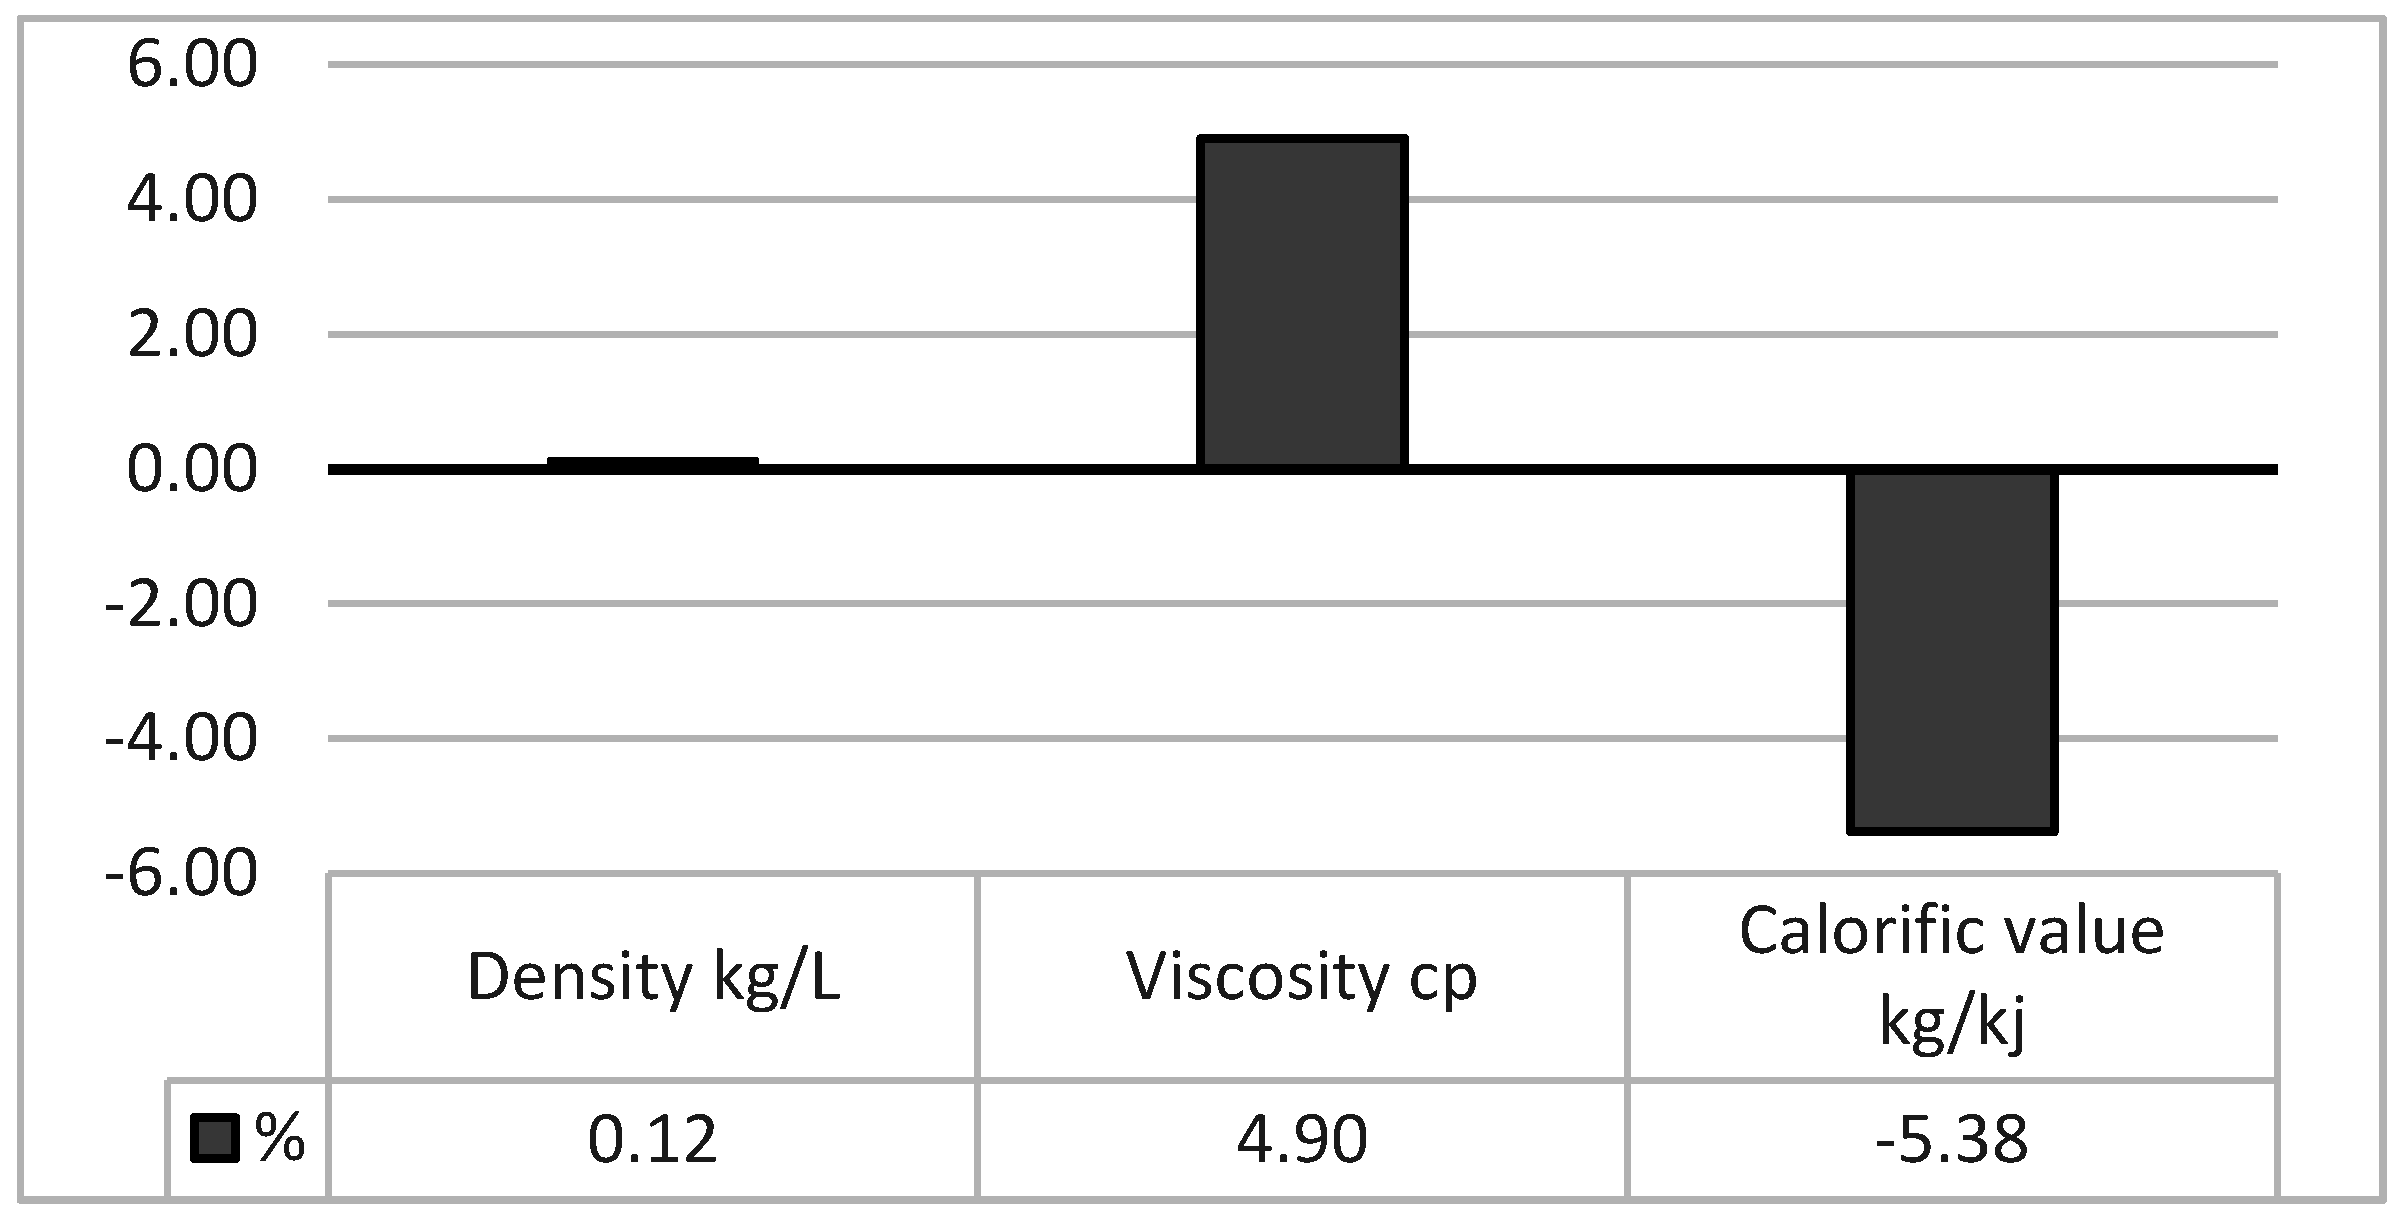
Table 3 shows the properties of the PD, ethanol, microalgae oil and the mixtures. It is shown that the density of the MEO-20 is relatively close to that of PD. This is due to the lower density of the ethanol 0.785 kg/L compensated by the higher density of 0.908 kg/L of microalgae oil. The differences in the density of MOE20% compared to PD is negligible as shown in
Figure 2. The viscosity of all fuels was measured at 15 °C that resulted in higher values of the viscosity. The viscosity of the MOE20% is 3.5 mm
2/s which is higher than that of the PD (3.34 mm
2/s) by about 4.9%. The calorific value of the MOE20% is lower than PD by 5.38%, as shown in
Figure 2. This is due to the lower heating value of the ethanol and microalgae oil.
Table 2.
Summary of the fatty acid composition of
Chlorella protothecoides oil (%) [
14].
Table 2.
Summary of the fatty acid composition of Chlorella protothecoides oil (%) [14].
| Fatty Acid | Fatty Acid | Fatty Acid | % |
|---|
| Palmitic | C 16:0 | C16H32O2 | 51 |
| Stearic | C 18:0 | C18H36O2 | 2 |
| Oleic | C 18:1 | C18H34O2 | 39 |
| Linoleic | C 18:2 | C18H32O2 | 7 |
| Others | - | - | 1 |
Table 3.
The fuel properties for the fuels used.
Table 3.
The fuel properties for the fuels used.
| Fuel | Density kg/L@15 °C | Viscosity (mm2/s) @15 °C | Calorific Value kJ/kg | Chemical Formula | Molecular Weight g/mole | H/C Ratio |
|---|
| Microalgae oil | 0.908 ± 0.015 | 56.3 | 35,800 | C16.94H32.86O2 | 268.57 | 1.94 |
| Ethanol | 0.785 ± 0.015 | 1.94 | 29,700 | C2H5OH | 46 | 2.5 |
| Diesel | 0.821 ± 0.015 | 3.34 | 44,800 | C12H23 [15,16,17] * | 167 | 1.92 |
| MOE50-50 | - | | - | C9.4H19.43O1.5 | 156.5 | 2.06 |
| MOE20% | 8.22 ± 0.015 | 3.5 | 42,390 | C11.48H22.29O0.3 | 164.85 | 1.94 |
Figure 2.
The percentage of the differences of microalgae oil, ethanol and petroleum diesel (MOE20%) specification than PD.
Figure 2.
The percentage of the differences of microalgae oil, ethanol and petroleum diesel (MOE20%) specification than PD.
The combustibility extent of ethanol depends on a number of parameters such as time, temperature and the availability of oxygen. Hydrogen to carbon ratio H/C significantly affects the energy released from the combustion reaction.
Table 3 shows that the highest H/C ratio was for ethanol (2.5) while the lowest H/C ratio was for diesel (1.92). The higher H/C ratio in the fuel led to more energy release from combustion. Adding ethanol to the fuel helps in reducing the amount of carbon entered to the combustion chamber, which results in less total carbon emitted and increases the H/C ratio. However, adding MO increases the carbon amount in the fuel chemical structure (16.94). The presence of MO, which has a molecular weight of 268.57 g/mol, increases the molecular weight of MOE20% to 164.85 g/mol. This molecular weight is very close to that of diesel 167 g/mol. MO has a high number of carbons in the chemical structure (around 16.94). This makes the carbon content of MOE20% close to or slightly less than that of PD with slightly higher H/C ratio. This can enhance the combustion process along with the presence of oxygen from ethanol and biodiesel.
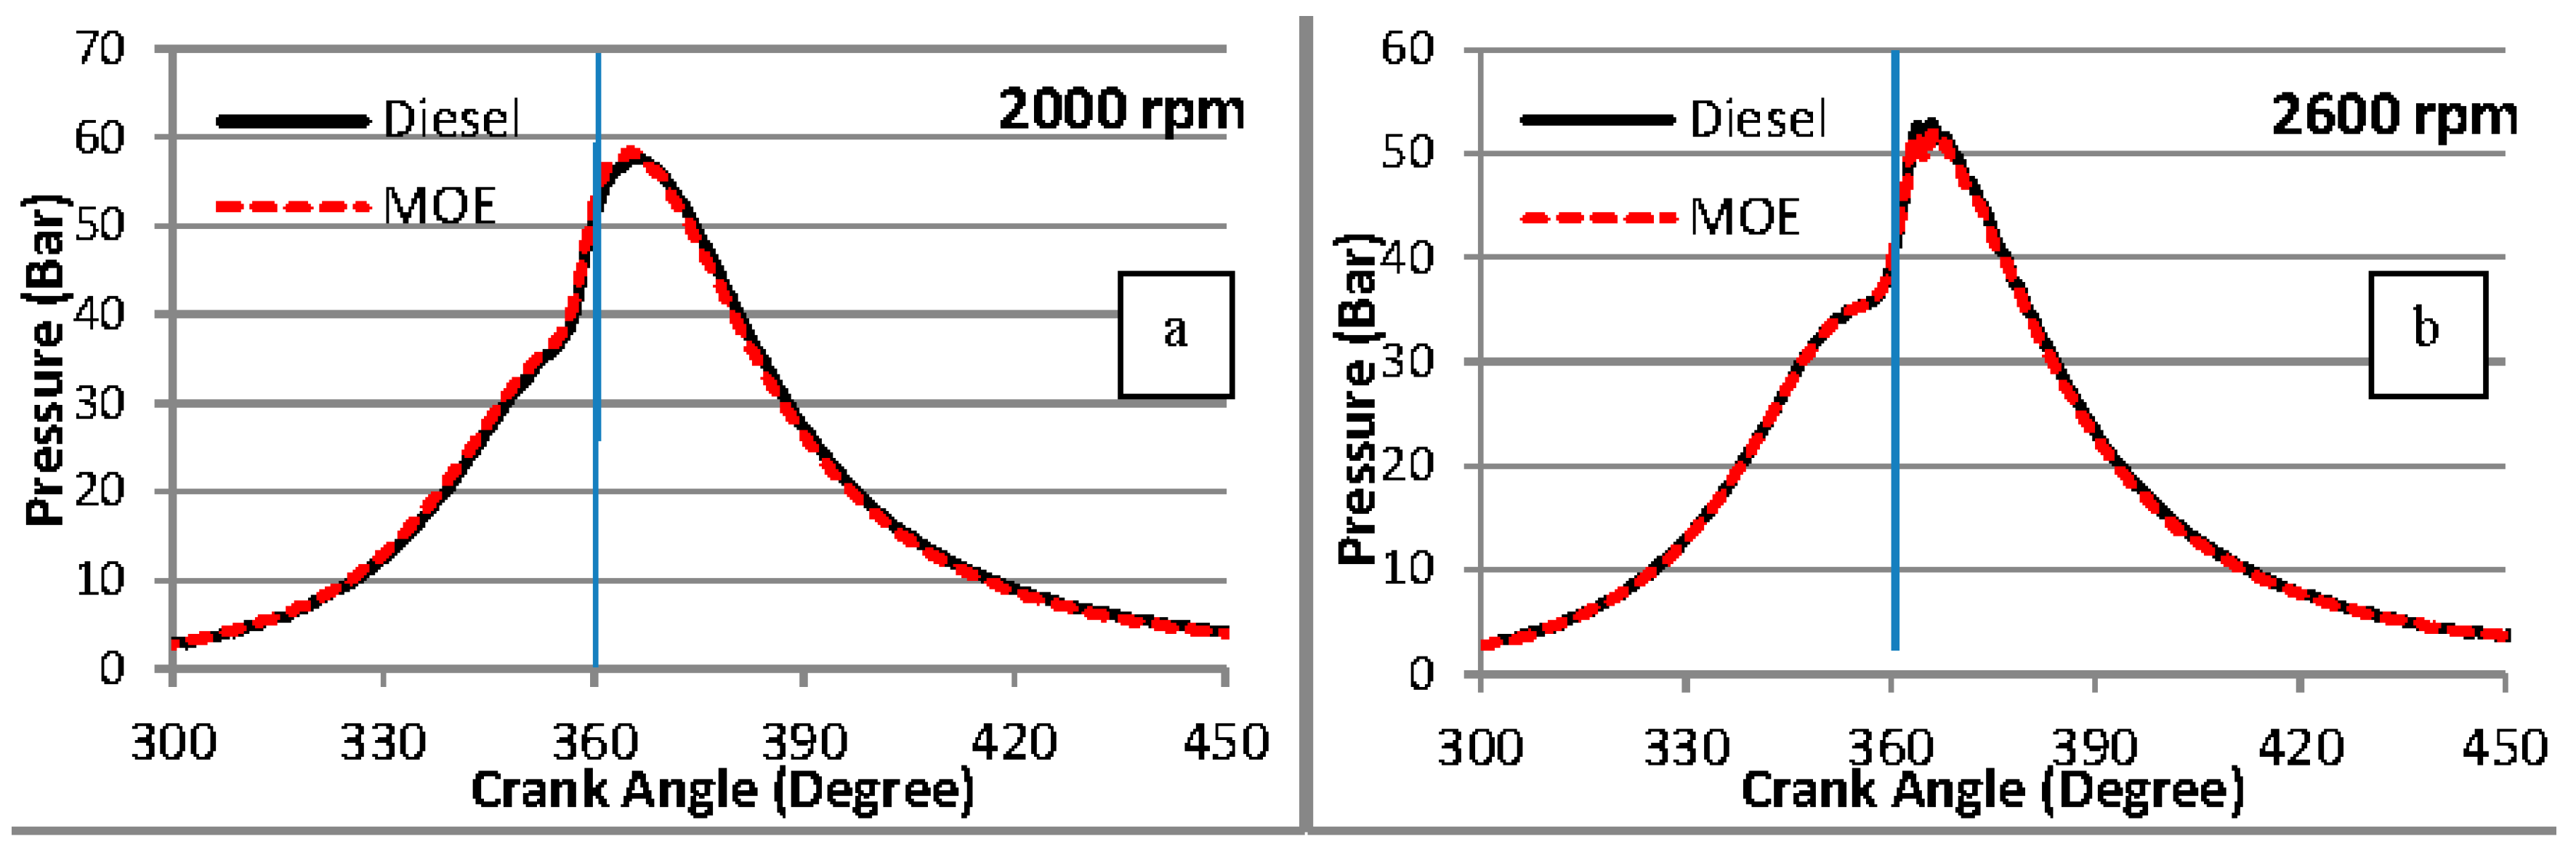
3.1. In-Cylinder Pressure
The results of the engine performance using MOE20% and PD are presented in this section at a compression ratio of 18:1. The in-cylinder pressure results for the engine speeds of 2000 and 2600 are given in
Figure 3a,b respectively. These figures revealed almost the same results for PD and MOE20% at all the studied engine speeds. This is in line with the hypothesis that the studied blend properties, which are close to those of PD, result in the same output at the combustion chamber. The fuel properties of density, viscosity and heating value are presented in
Figure 2. Kannan and Anand [
6] and Kannan and Anand [
18] reported similar findings with diestrol fuel as the in-cylinder pressure at high (up to 100% load) to medium load is identical to that of PD.
Figure 3.
In-cylinder pressure at engine speed (a) 2000 rpm; and (b) 2600 rpm when the engine fuelled with MOE20% and PD.
Figure 3.
In-cylinder pressure at engine speed (a) 2000 rpm; and (b) 2600 rpm when the engine fuelled with MOE20% and PD.
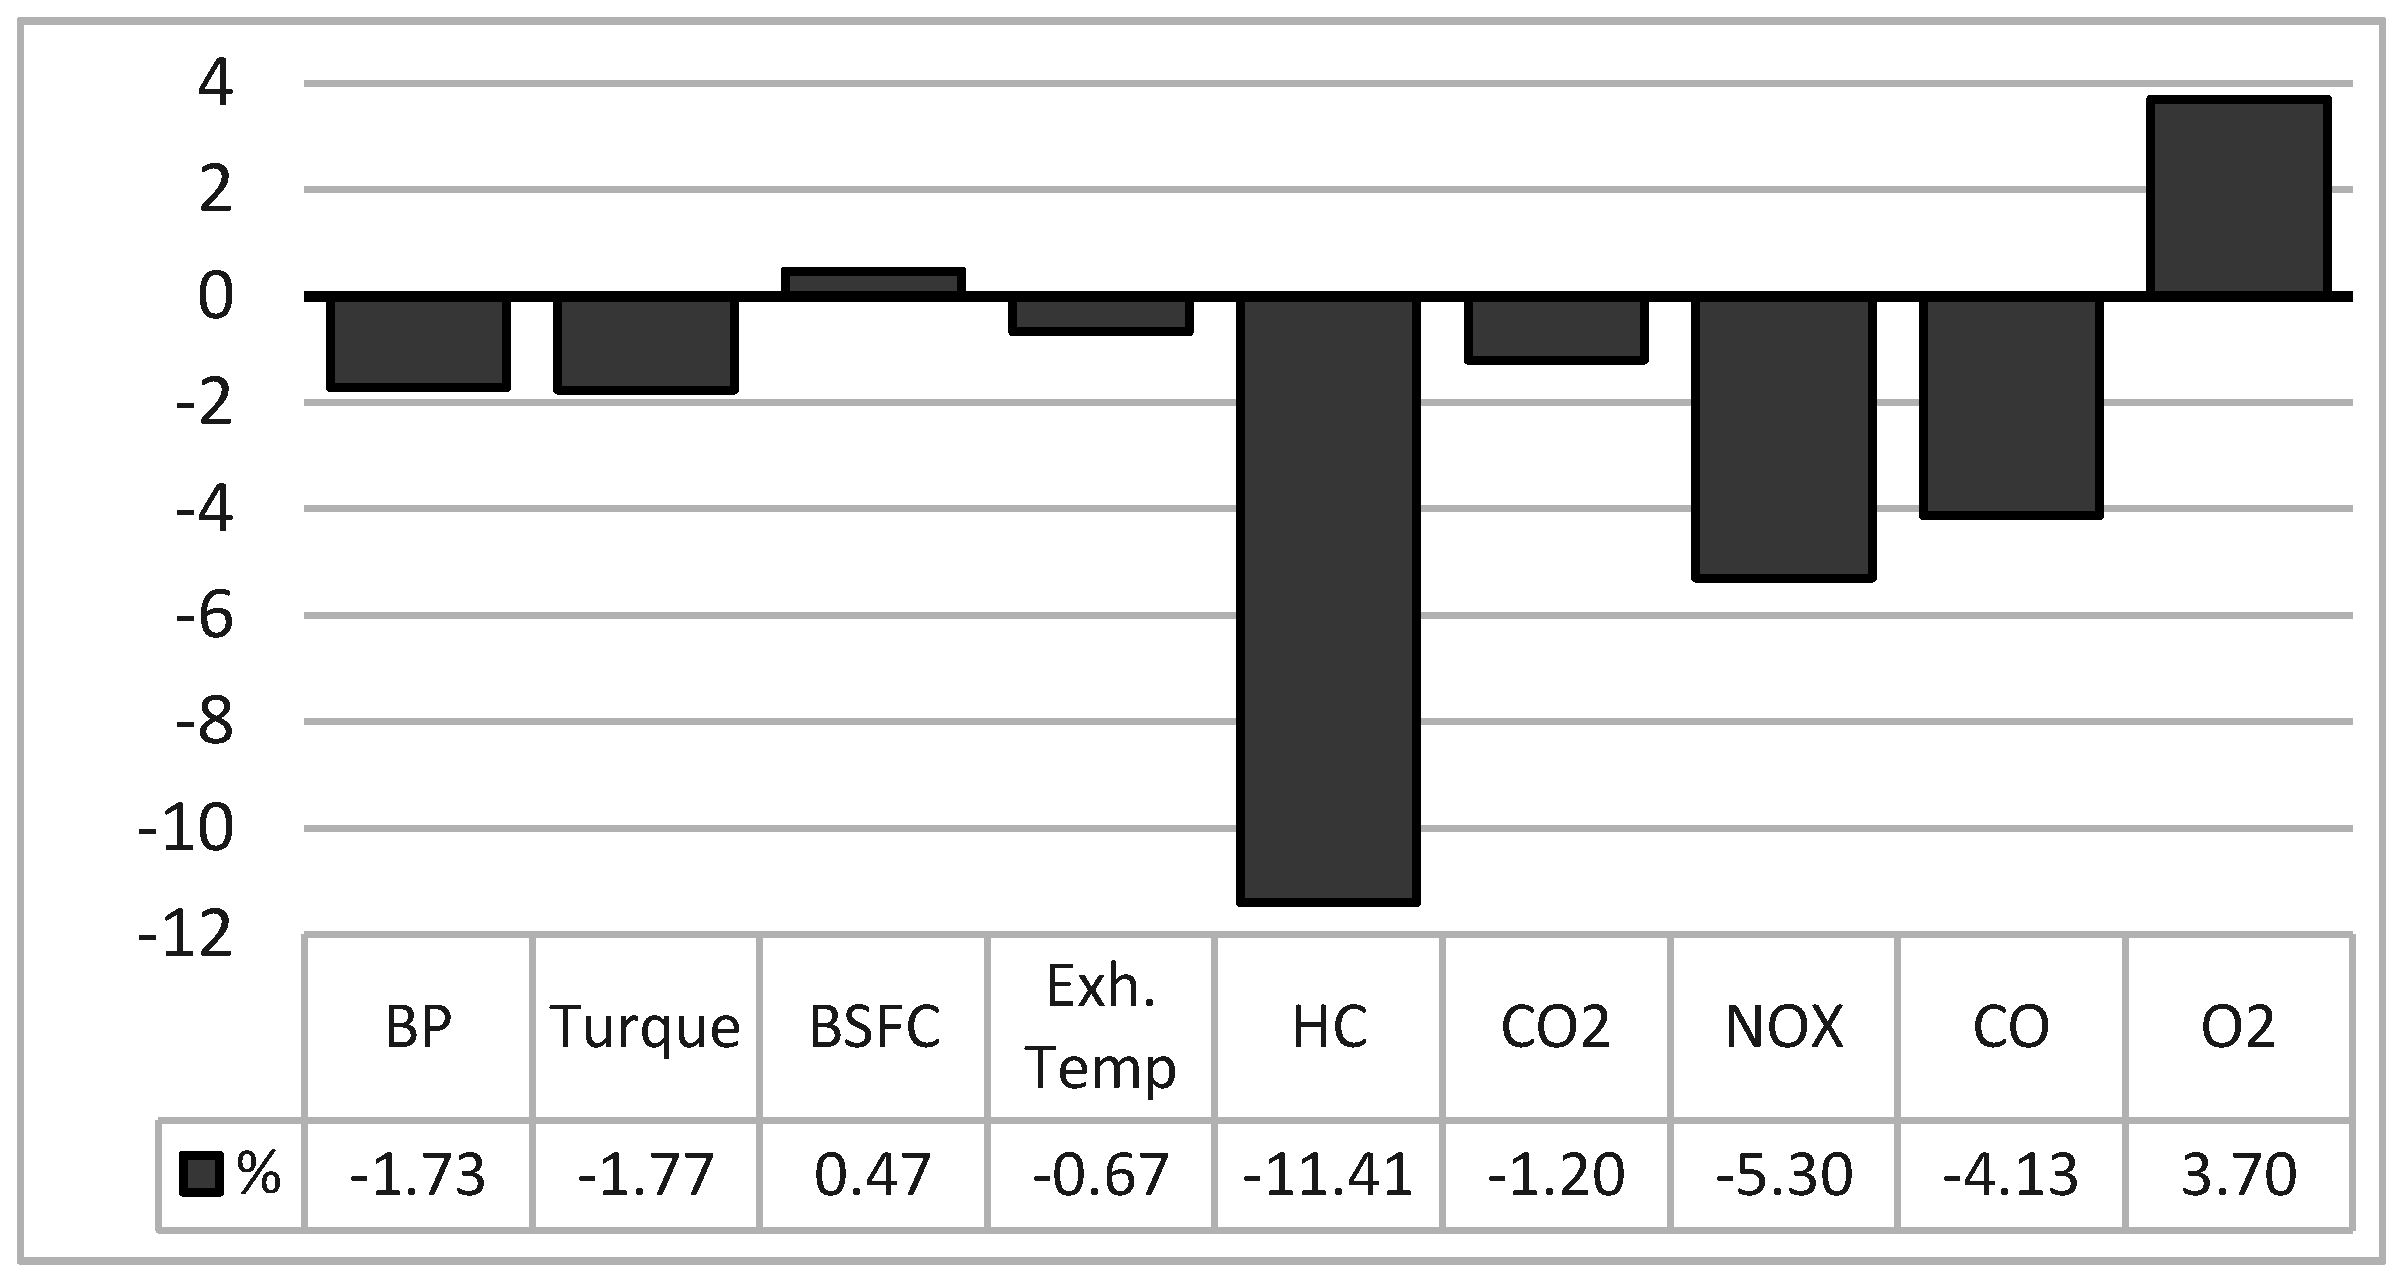
3.2. Engine Performance and Emissions
The overall variations between the engine test parameters of MOE20% than PD for the average results obtained at the engine speeds of 1700, 2000, 2300, 2600 and 2900 are illustrated in
Figure 4. This figure shows that in comparison to PD, using MOE20% slightly reduced torque, exhaust gas temperature and CO
2 by 1.73, 1.77, 0.67 and 1.2%, respectively, while the BSFC increased by only 0.47%. This BSFC increase is regarded negligible due to the experimental error and the results averaging from different engine speeds. This demonstrates that, generally, MOE20% is relatively similar to PD in the performance parameters. However, substantial reductions by 11.41, 5.3 and 4.13 in the emission parameters of HC, NO
x and CO, respectively were recorded for MOE20% compared to PD. The reduction in the CO indicates that the combustion is more complete in the case of MOE20% as opposed to PD due to the presence of oxygen and the higher H/C ratio in the MOE20%. Discussions of the test parameters at individual engine speeds are addressed in the next sections.
Figure 4.
The overall variation in the engine test parameters at average of all tested speed when the engine fuelled with MOE20% compared to PD.
Figure 4.
The overall variation in the engine test parameters at average of all tested speed when the engine fuelled with MOE20% compared to PD.
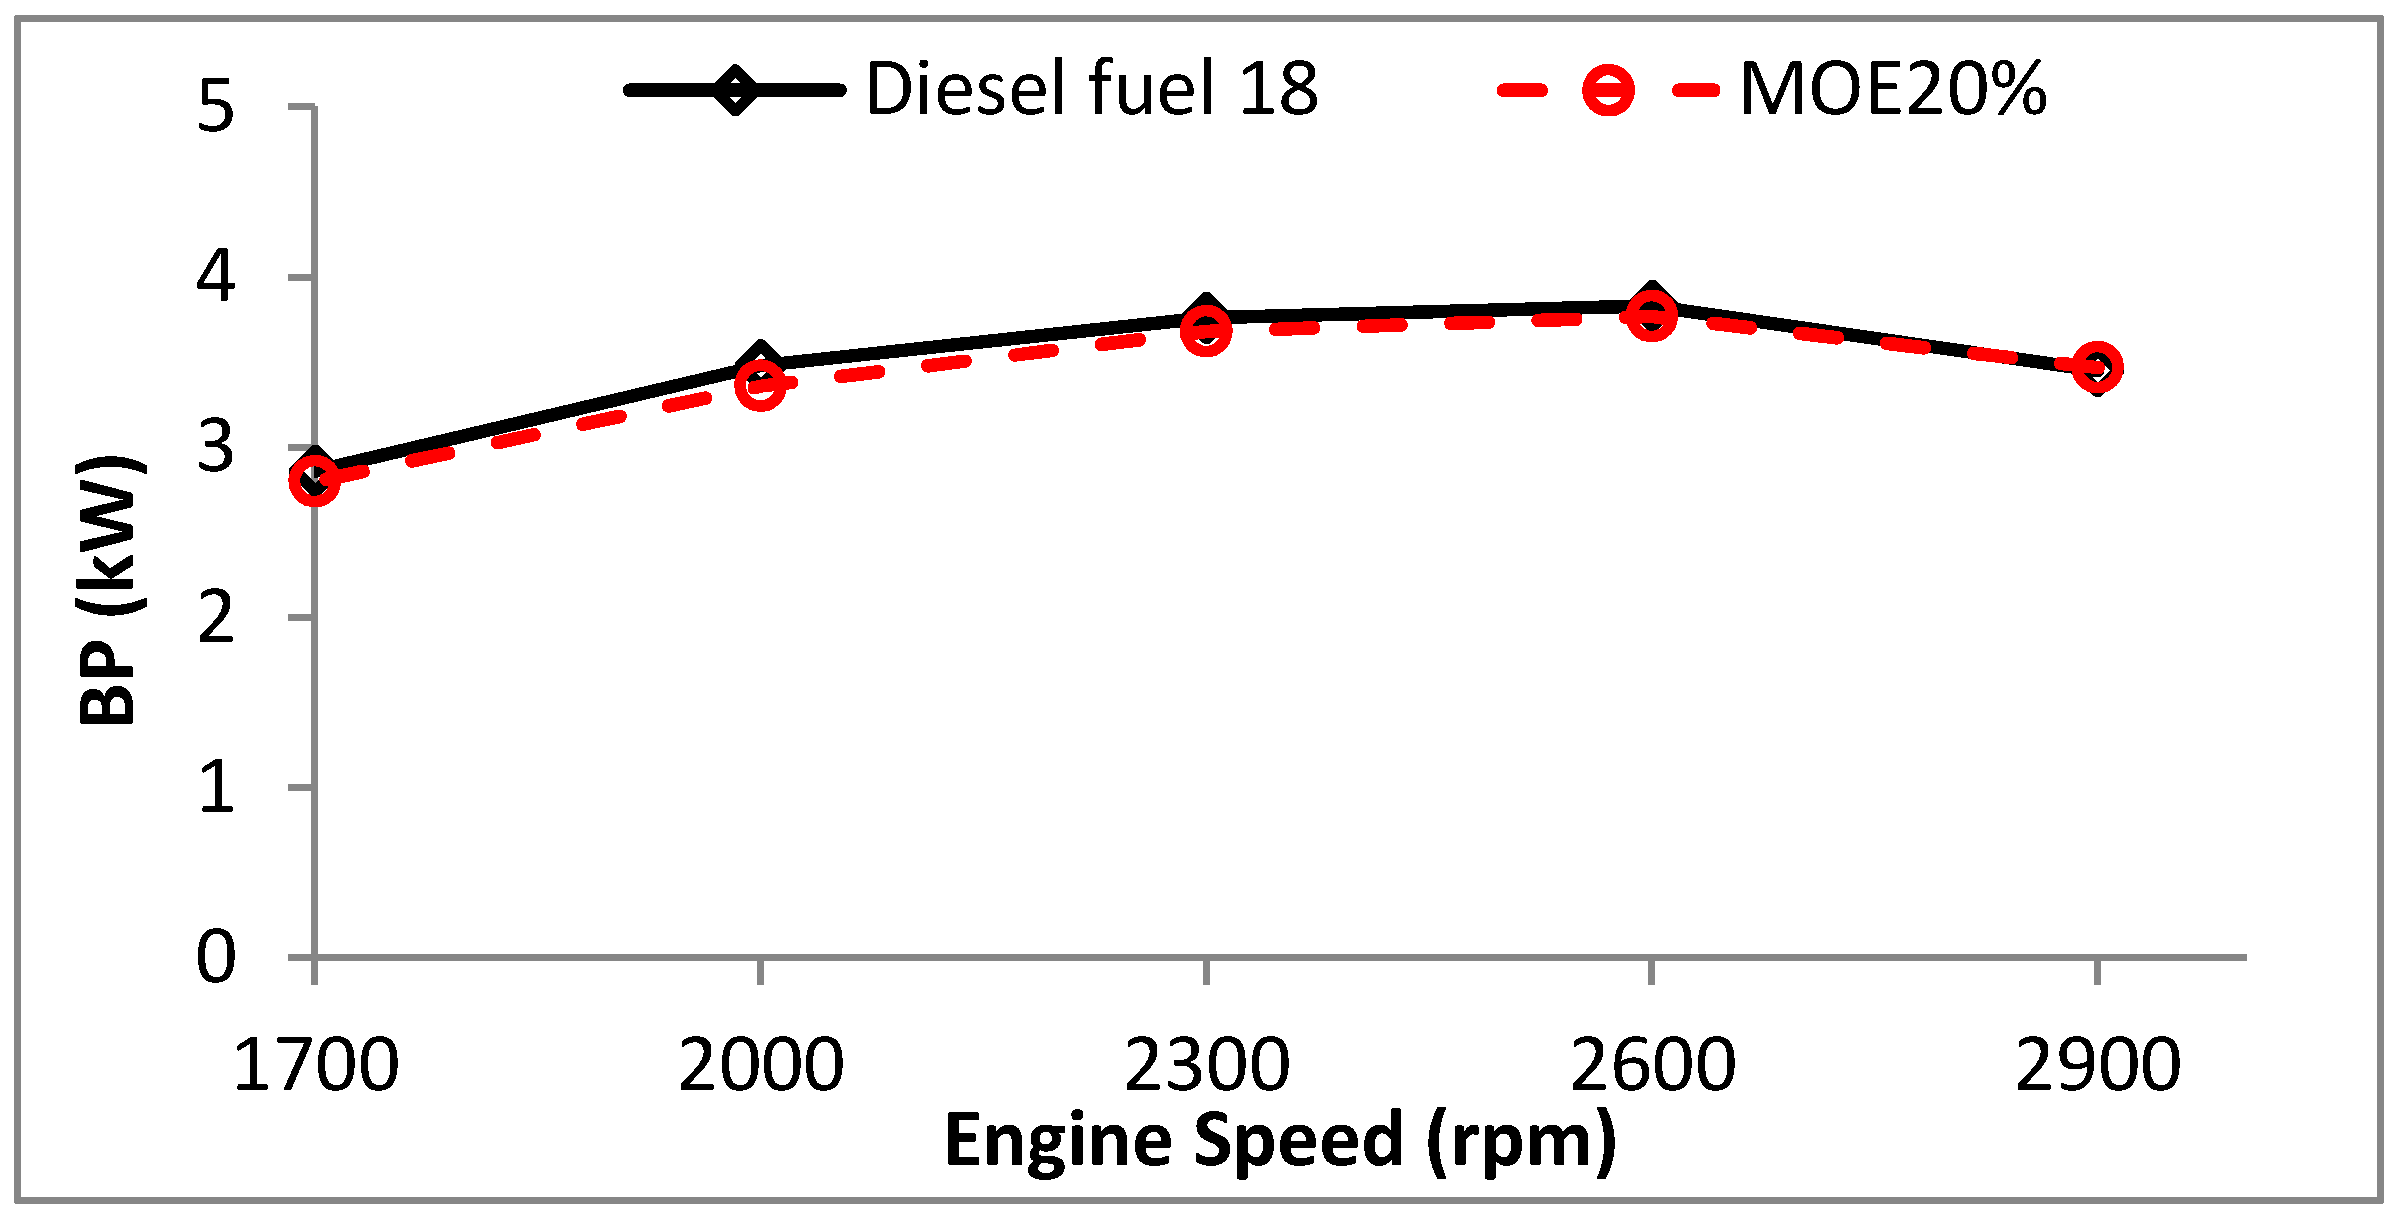
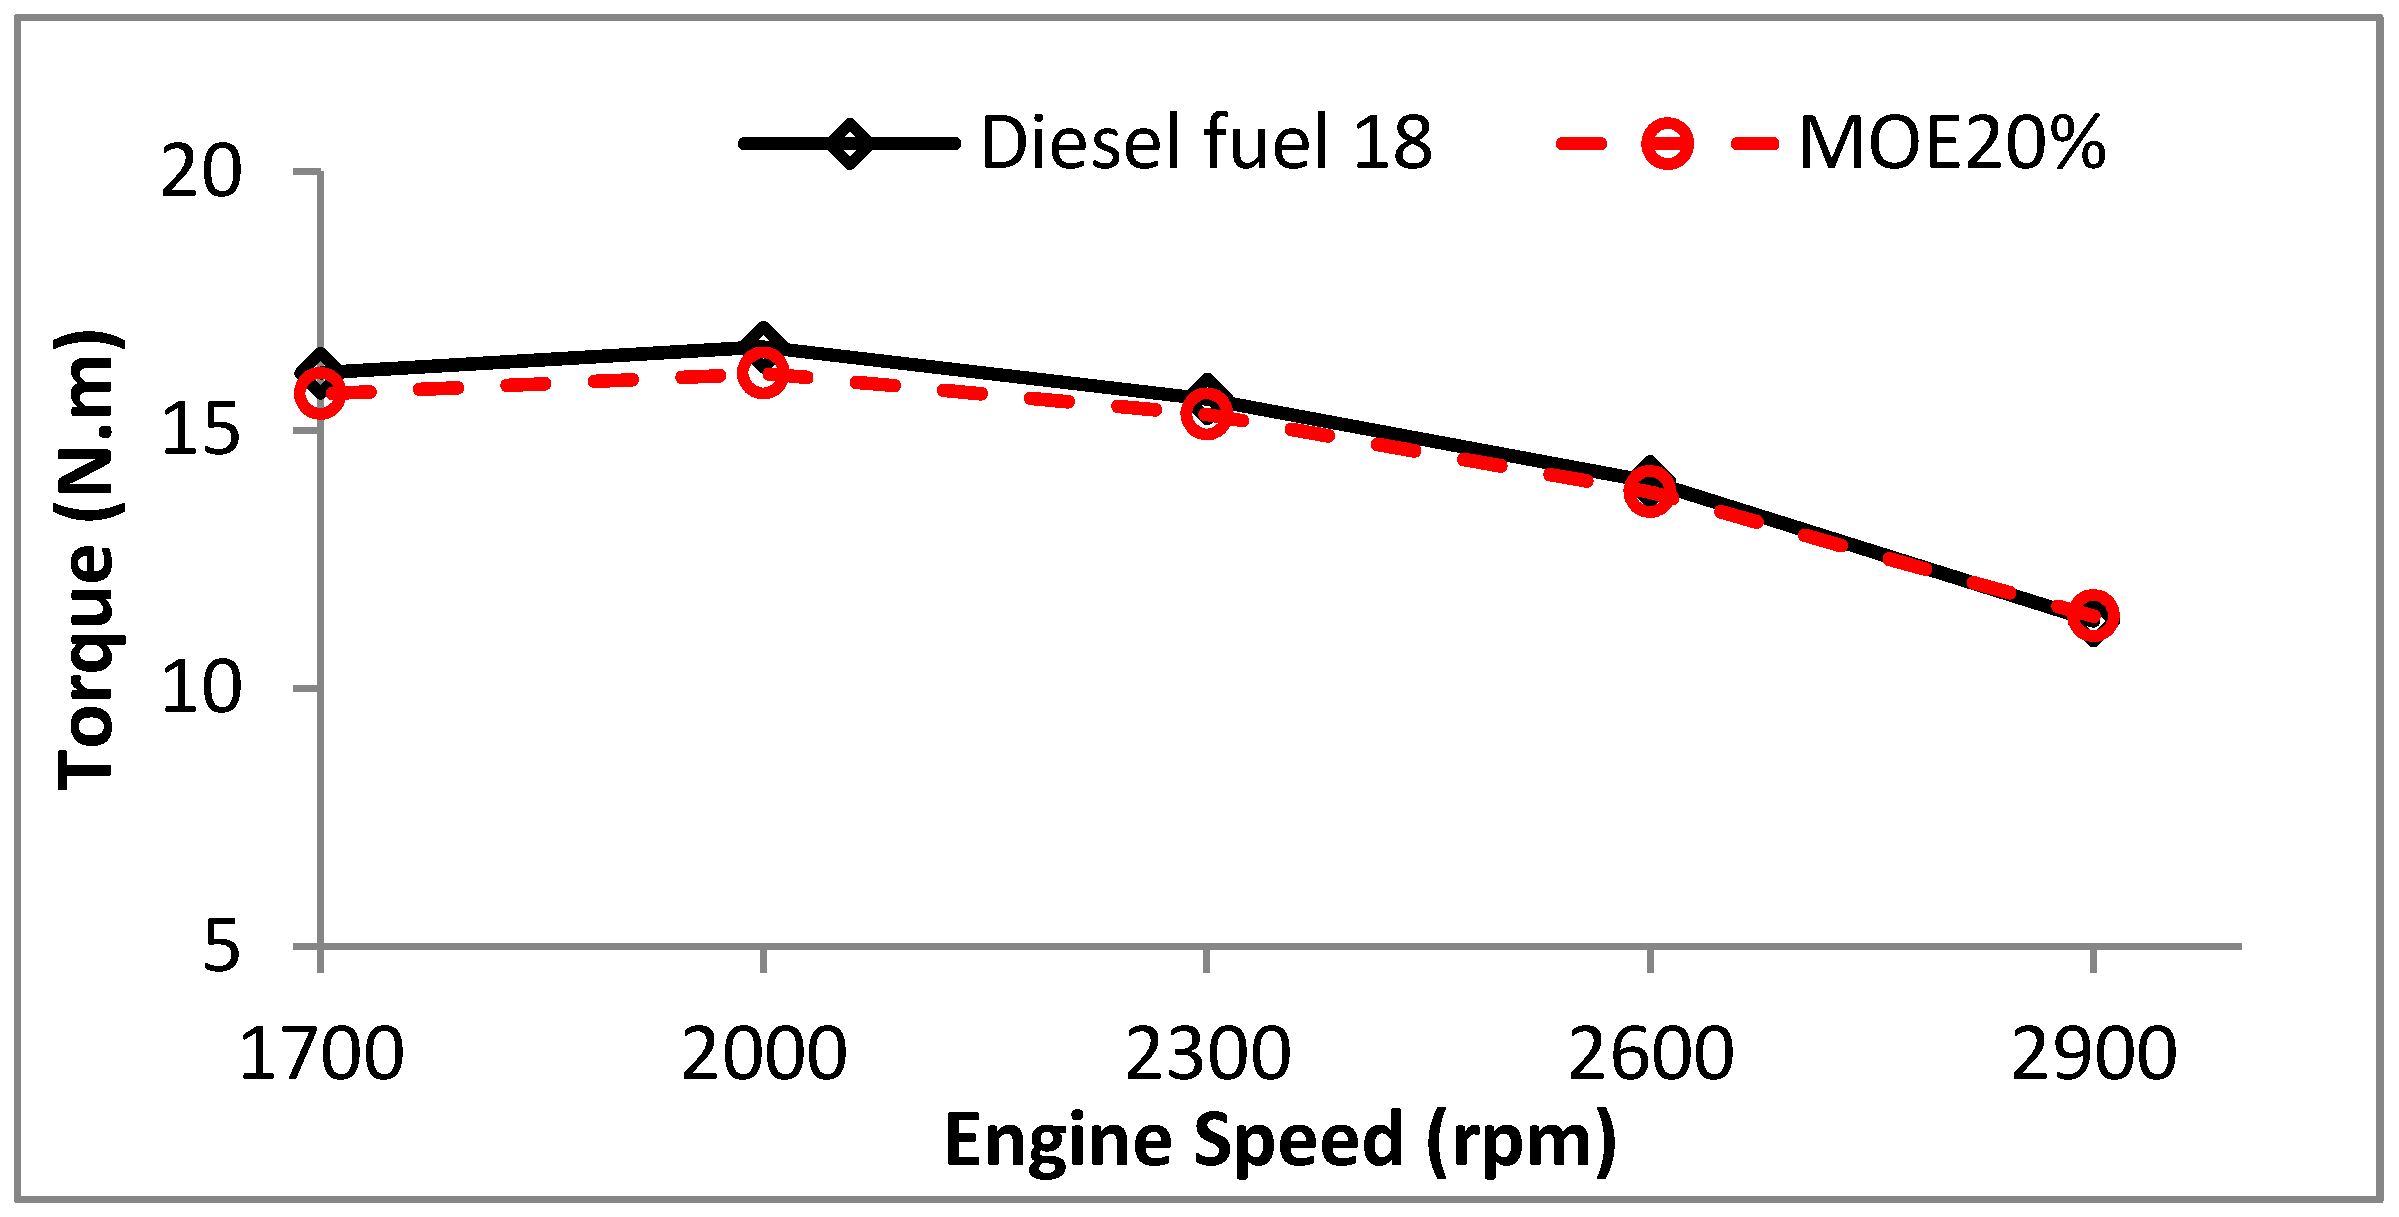
3.3. Brake Power (BP) and Torque
Figure 5 and
Figure 6 manifest the relationship between engine speeds and the engine BP and engine torque, respectively, when the engine is fueled with PD and MO20%. The engine BP and torque curves have the same pattern for both fuels at all engine speeds. The maximum BP for both fuels is obtained at the engine speed of 2600 rpm for both fuels. The maximum difference between the fuels is about 3.45% in the engine BP and 3.01% for the engine torque at the engine speed of 2000 rpm. At all other speeds, the BP and torque are relatively close. Although the heating value of the MOE20% is lower than the PD by 5.38%, the maximum reduction in the BP and torque is less than this percentage due to the extra oxygen in the MOE20% and higher H/C ratio. These results can be predicted from the results of the in-cylinder pressure that showed relatively similar results at all the engine speeds. This finding is in agreement with [
13] who reported comparable power and torque from diestrol fuel and PD. The agreement between the two studies is due to the comparable fuel properties [
8]. The differences between the fuels in the BP and torque are insignificantly higher at low engine speed (high load) than high engine speed. The fuel injected in the combustion chamber is the same for both fuels but less than the injected fuel at high engine speed which makes the engine BP and torque more sensitive to the fuel calorific value.
Figure 5.
The engine BP (kW) at different engine speeds using PD and MOE20%.
Figure 5.
The engine BP (kW) at different engine speeds using PD and MOE20%.
Figure 6.
The torque (N.m) at different engine speeds using PD and MOE20%.
Figure 6.
The torque (N.m) at different engine speeds using PD and MOE20%.
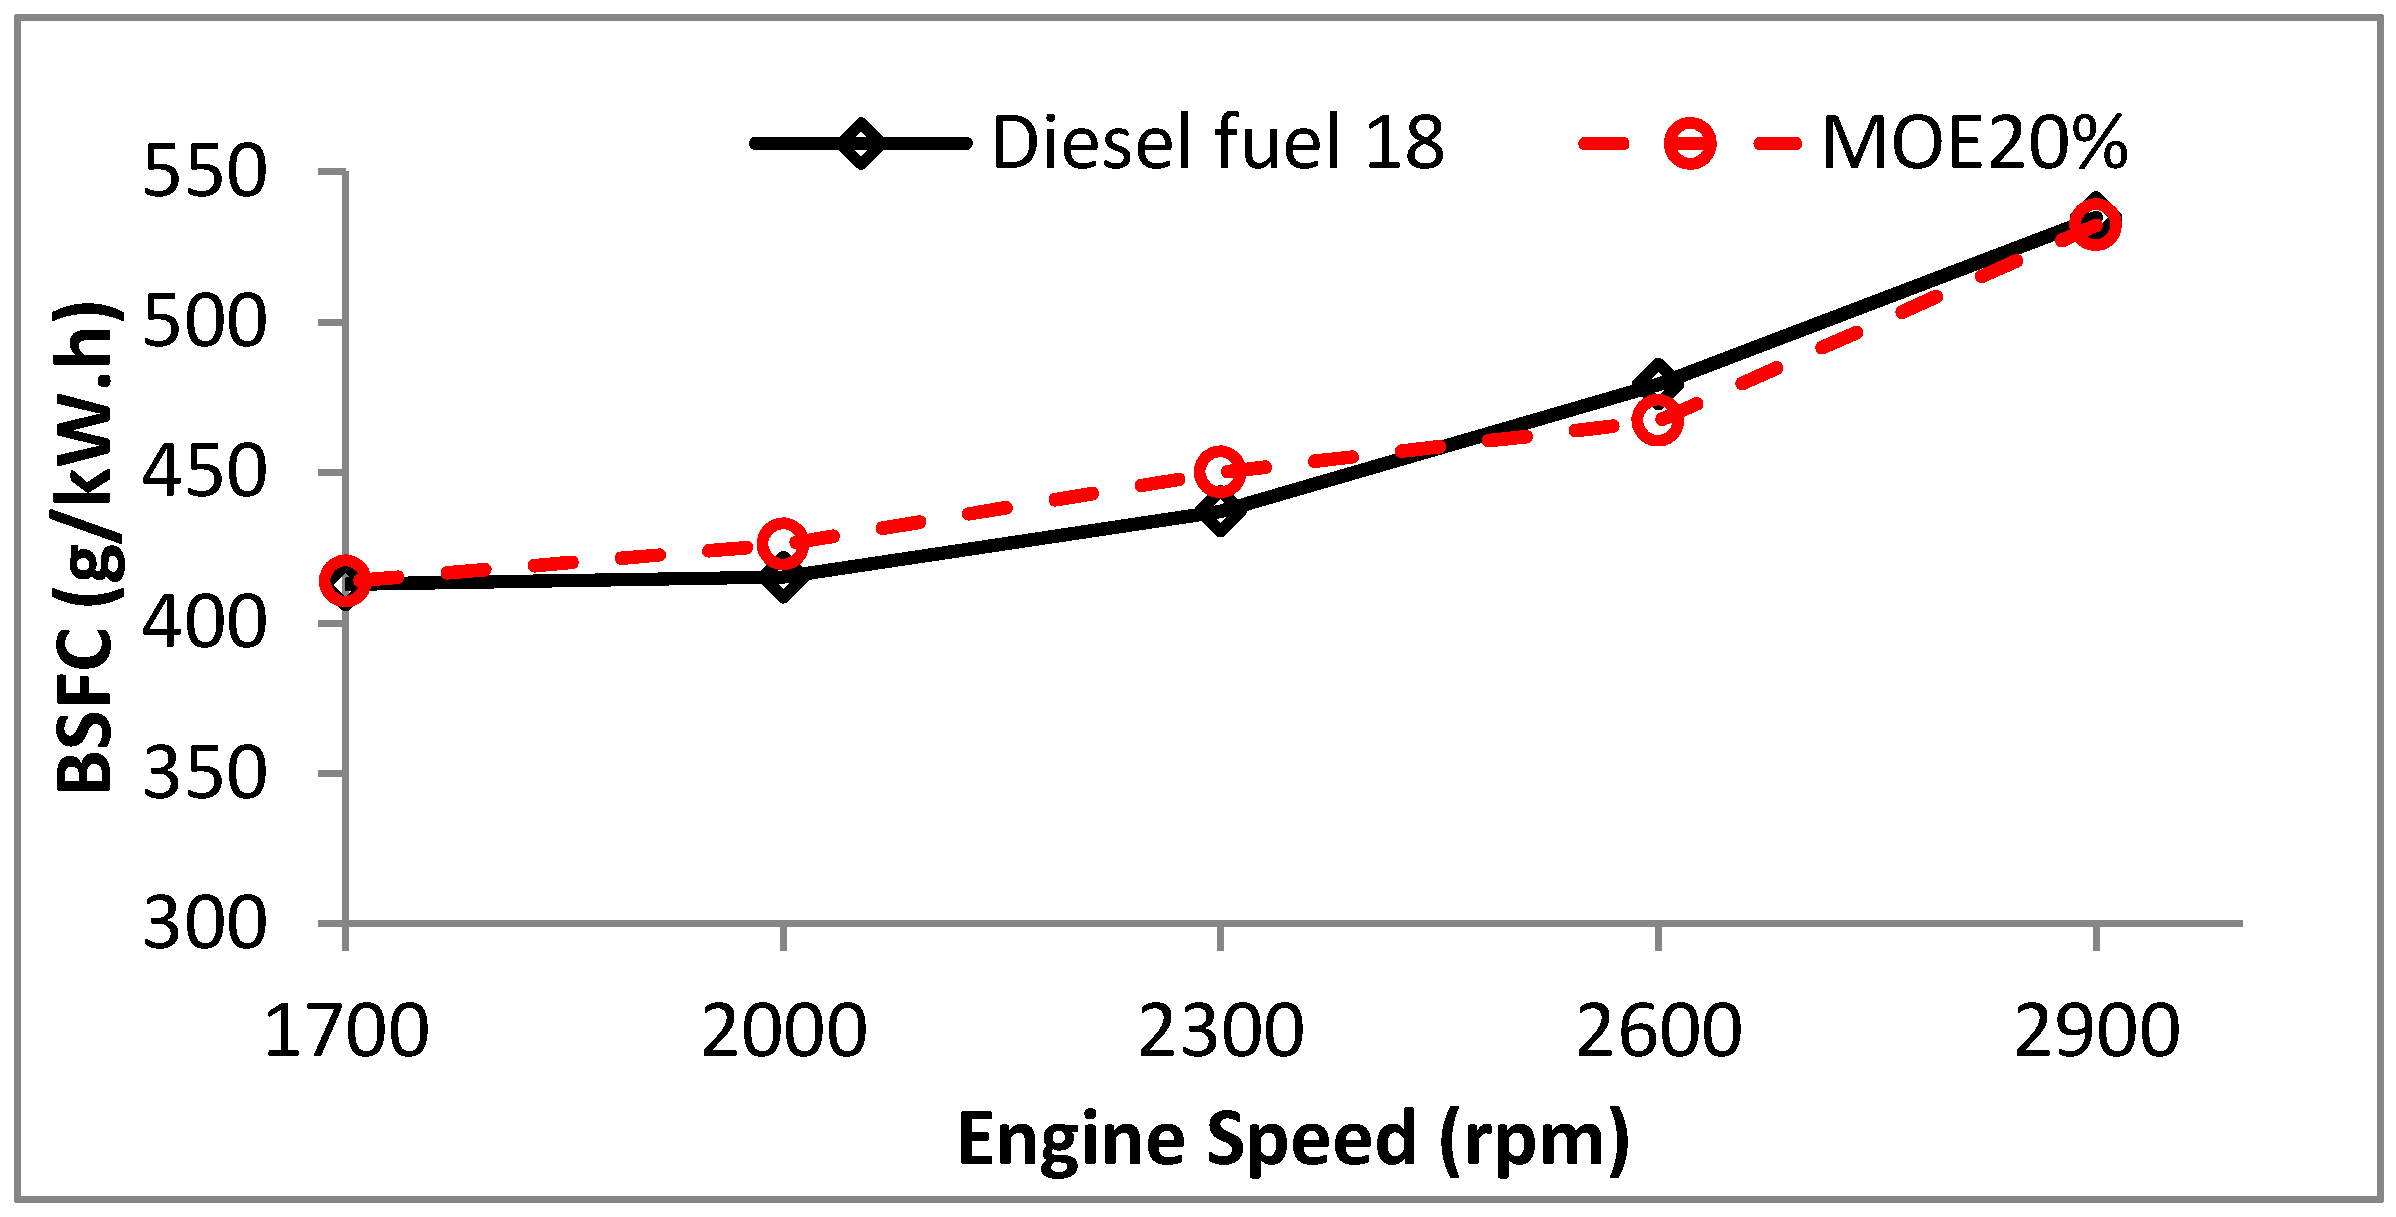
3.4. Brake Spesific Fuel Consumption (BSFC)
Figure 7 illustrates the variation of BSFC as a function of engine speed for MOE20% and PD. The figure shows that, for the tested engine speed, the BSFC increases as the engine speed increases. It can be seen that both fuels have the same pattern and almost same results of BSFC. This finding is in agreement with Ali, Yusaf [
19] and Shi, Yu [
20] who reported that the difference in the heating value of the mixture of PD, ethanol and biodiesel from Soyate is less than PD by only 3%, which resulted in a negligible BSFC. Shahir
et al. [
8] calculated the BSFC variation of ternary fuel of PD, ethanol and biodiesel of others researchers such as [
21] and reported that, for variation at a constant load and variable speeds, the maximum increase in BSFC was in the range of 2%–5%.
Figure 7.
The engine BSFC (g/kW.h) at different engine speeds using PD and MOE20%.
Figure 7.
The engine BSFC (g/kW.h) at different engine speeds using PD and MOE20%.
The fuel properties of viscosity, density and heating value are relatively close to PD, as given in
Figure 2. However, there is a minor increase in BSFC at engine speed of 2000 rpm and 2300 rpm with MOE20%, which can be expected due to the lower heating value than that of PD by 5.38%. This finding is not in agreement with Shahir
et al. [
8] who found that BSFC was very high compared to PD using ternary fuel of ethanol, biodiesel and PD. The difference in BSFC depends on the ratio of the ethanol and biodiesel in the mixture. In addition, MOE20% contains microalgae oil rather than biodiesel, which has slightly higher density and viscosity than biodiesel to compensate the lower density, viscosity and heating value of ethanol.
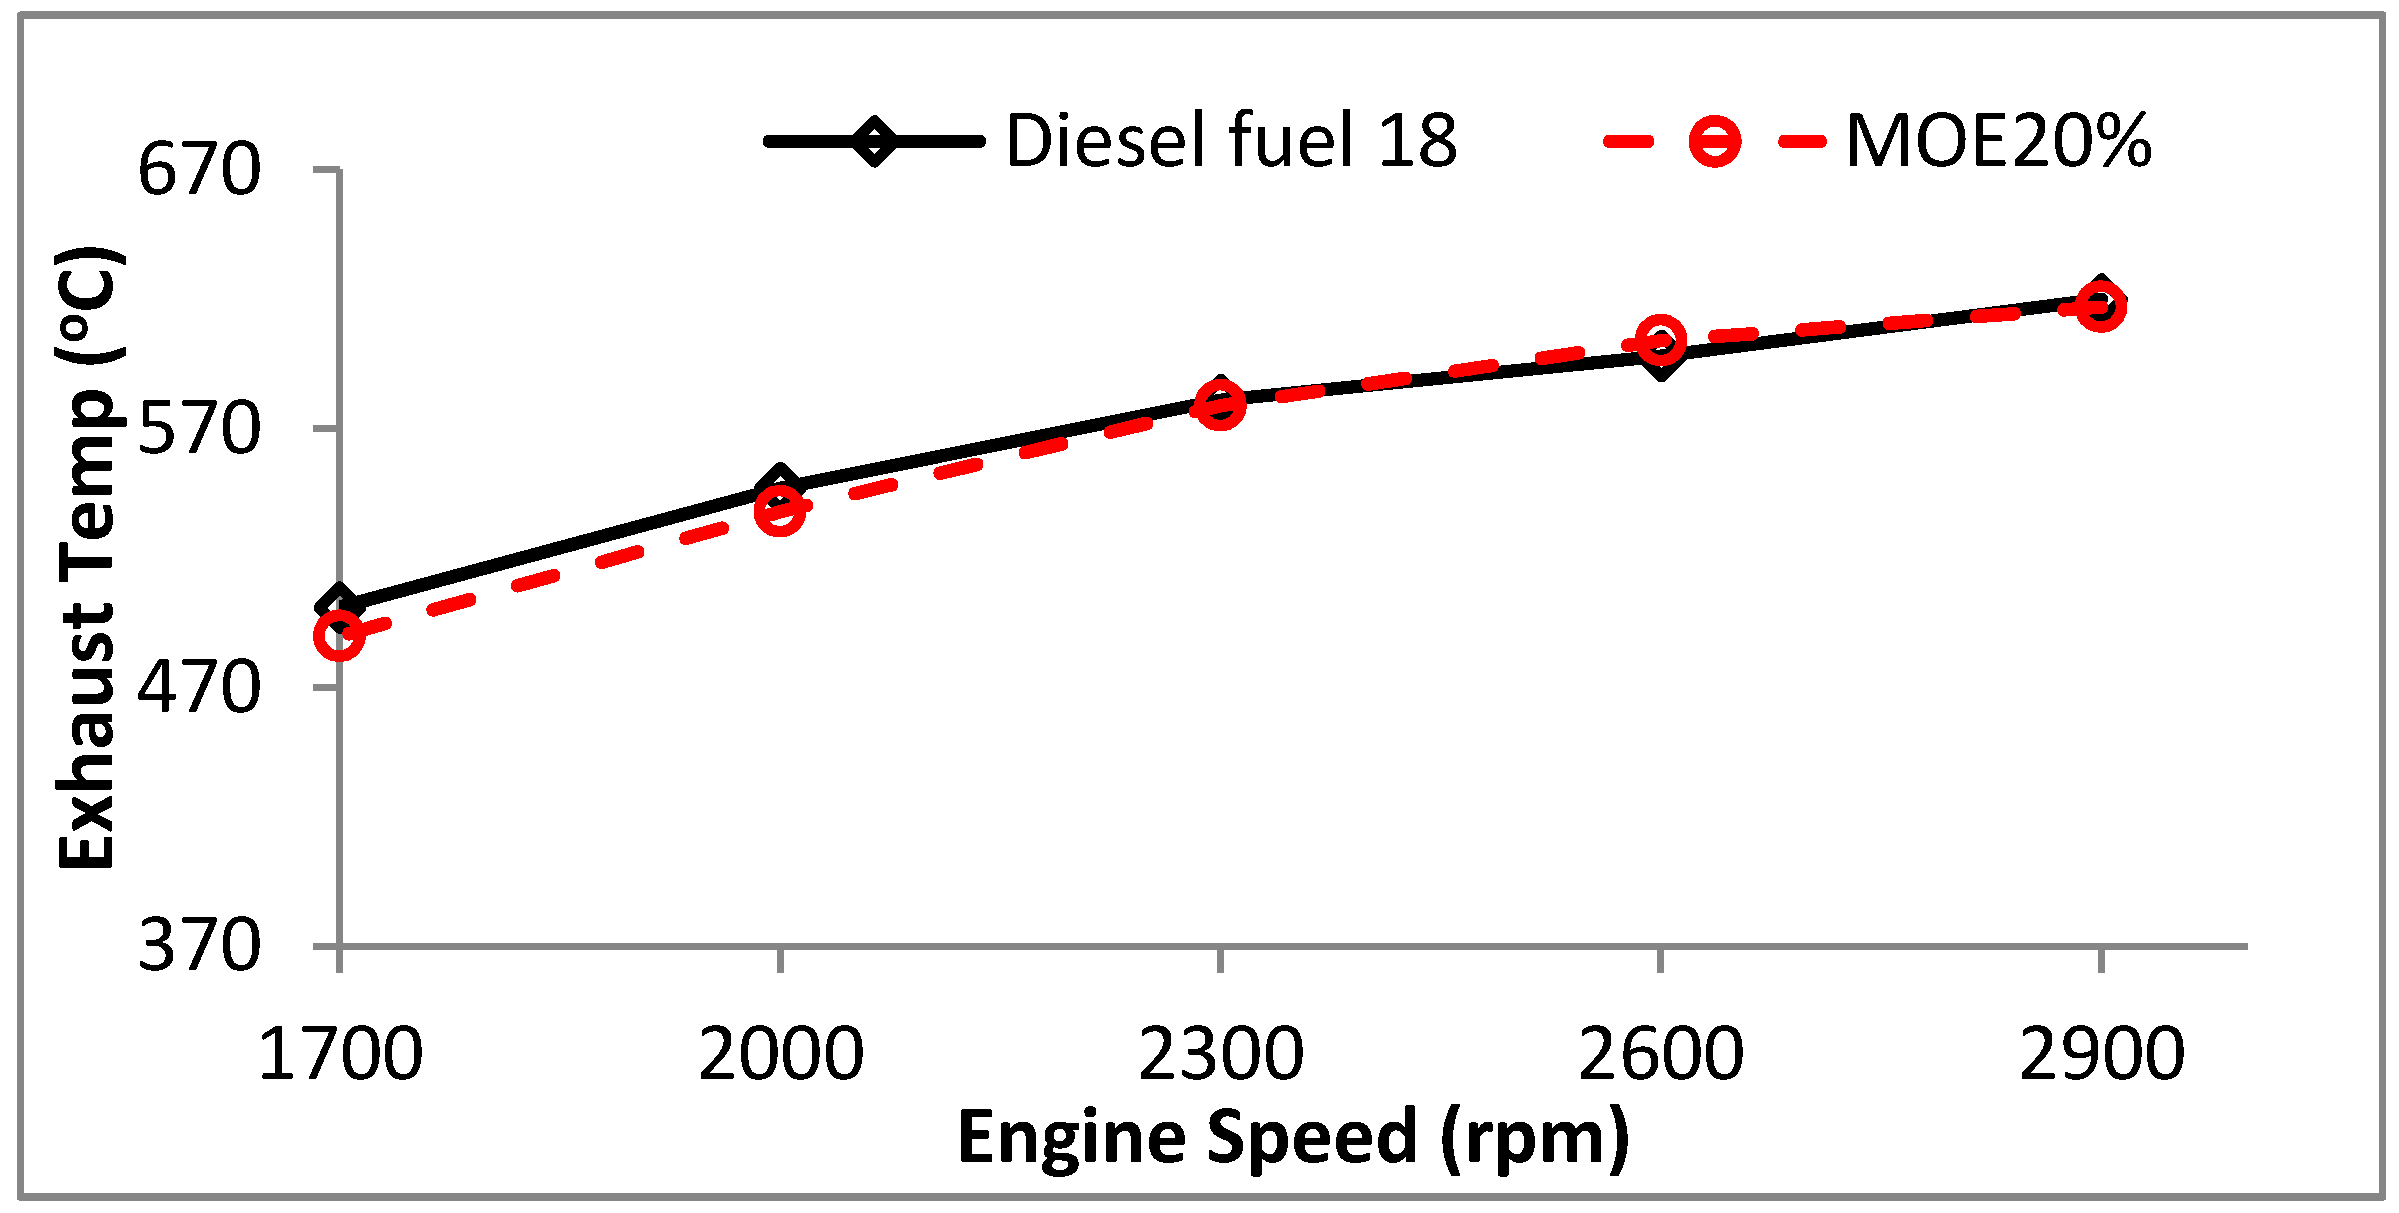
3.5. Exhaust Gas Temperature and NOx
The exhaust gas temperature variation with engine speed for MOE20% and PD is presented in
Figure 8. The exhaust gas temperature increased with increasing the speed for both fuels. The variation in the exhaust gas temperature is minor at all engine speeds. The maximum variation is found at low engine speed of 1700 and 2000 rpm of 2.2% and 1.65%, respectively, while at the 2600 rpm, the exhaust gas temperature of MOE20% is slightly higher. This variation is small due to the minor variation in the experimental test conditions and experimental error.
Figure 8.
The exhaust gas temperature (°C) at different engine speeds using PD and MOE20%.
Figure 8.
The exhaust gas temperature (°C) at different engine speeds using PD and MOE20%.
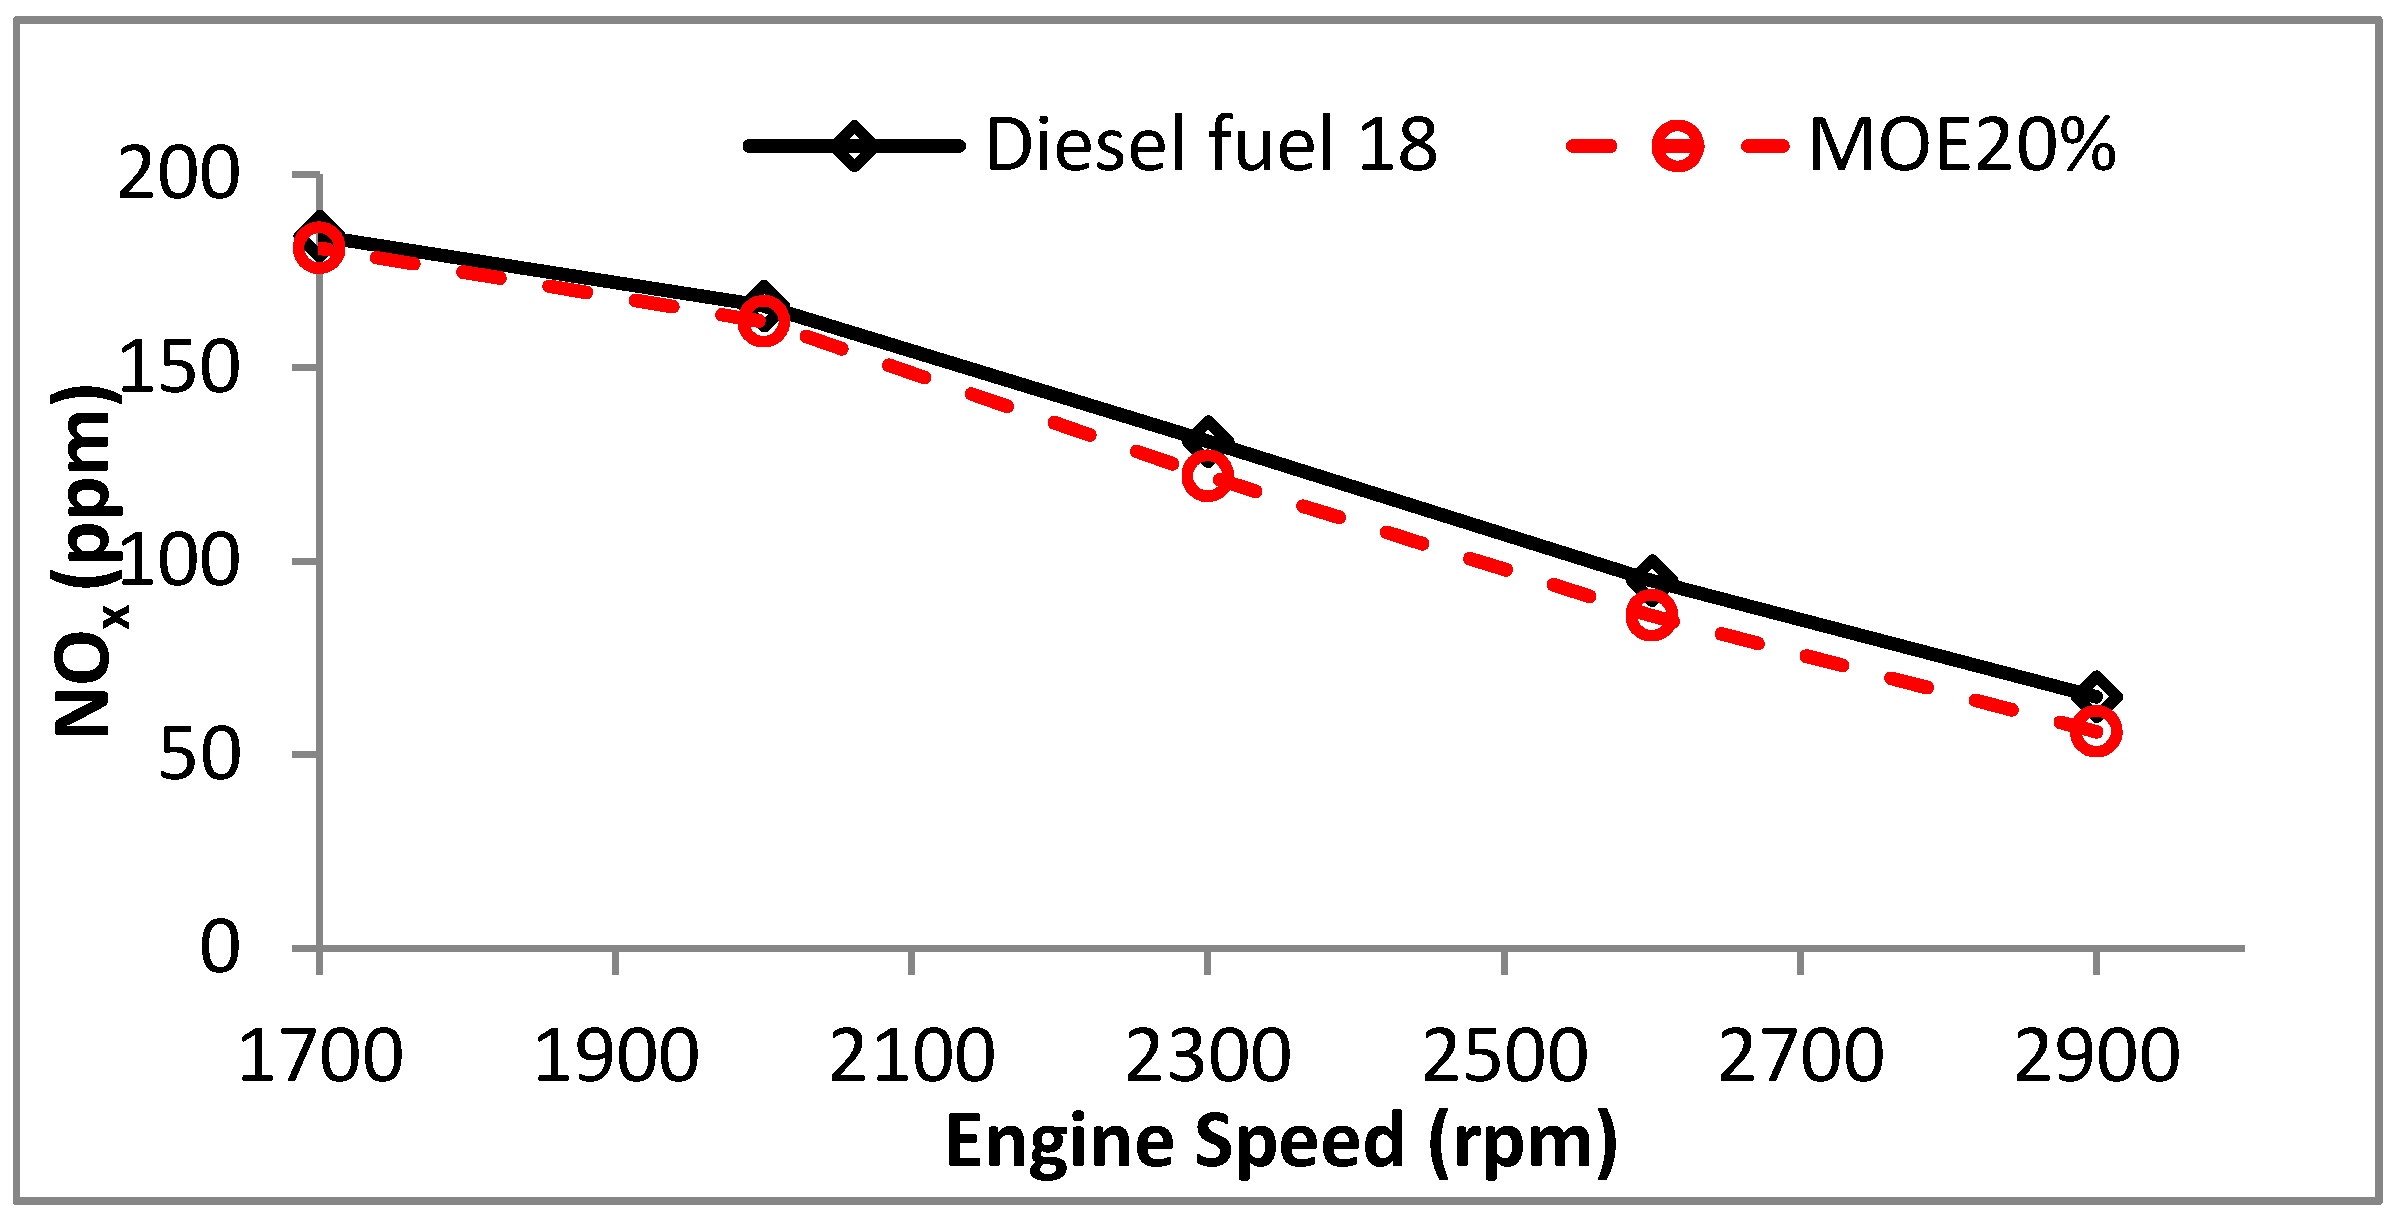
Figure 9 presents the relationship between the NO
x emission and the engine speed when the engine is fuelled with PD and MOE20%. The NO
x emission of MOE20% was found to be substantially lower than PD as elucidated in
Figure 4. This finding is relatively in agreement with Kannan and Anand [
6] and Kannan and Anand [
18] who reported lower NO
x from diestrol water emulsion by 19.72% compared to that of PD due to the higher latent heat of vaporization of ethanol that reduced the combustion temperature and produced less NO
x emission. The variation between PD and MOE20% fuel in producing NO
x increased as the engine speed increases, with a difference of 6.87% at 2300 rpm, 9.47% at 2600 rpm and 13.85% at the 2900 rpm. The reduction in NO
x emission can be ascribed to the higher latent heat of the evaporation of ethanol (904 kJ/kg compared to 254 kJ/kg) [
22] and lower calorific value that reduces combustion temperature and consequently NO
x emission.
Figure 9.
The engine NOx (ppm) at different engine speeds using PD and MOE20%.
Figure 9.
The engine NOx (ppm) at different engine speeds using PD and MOE20%.
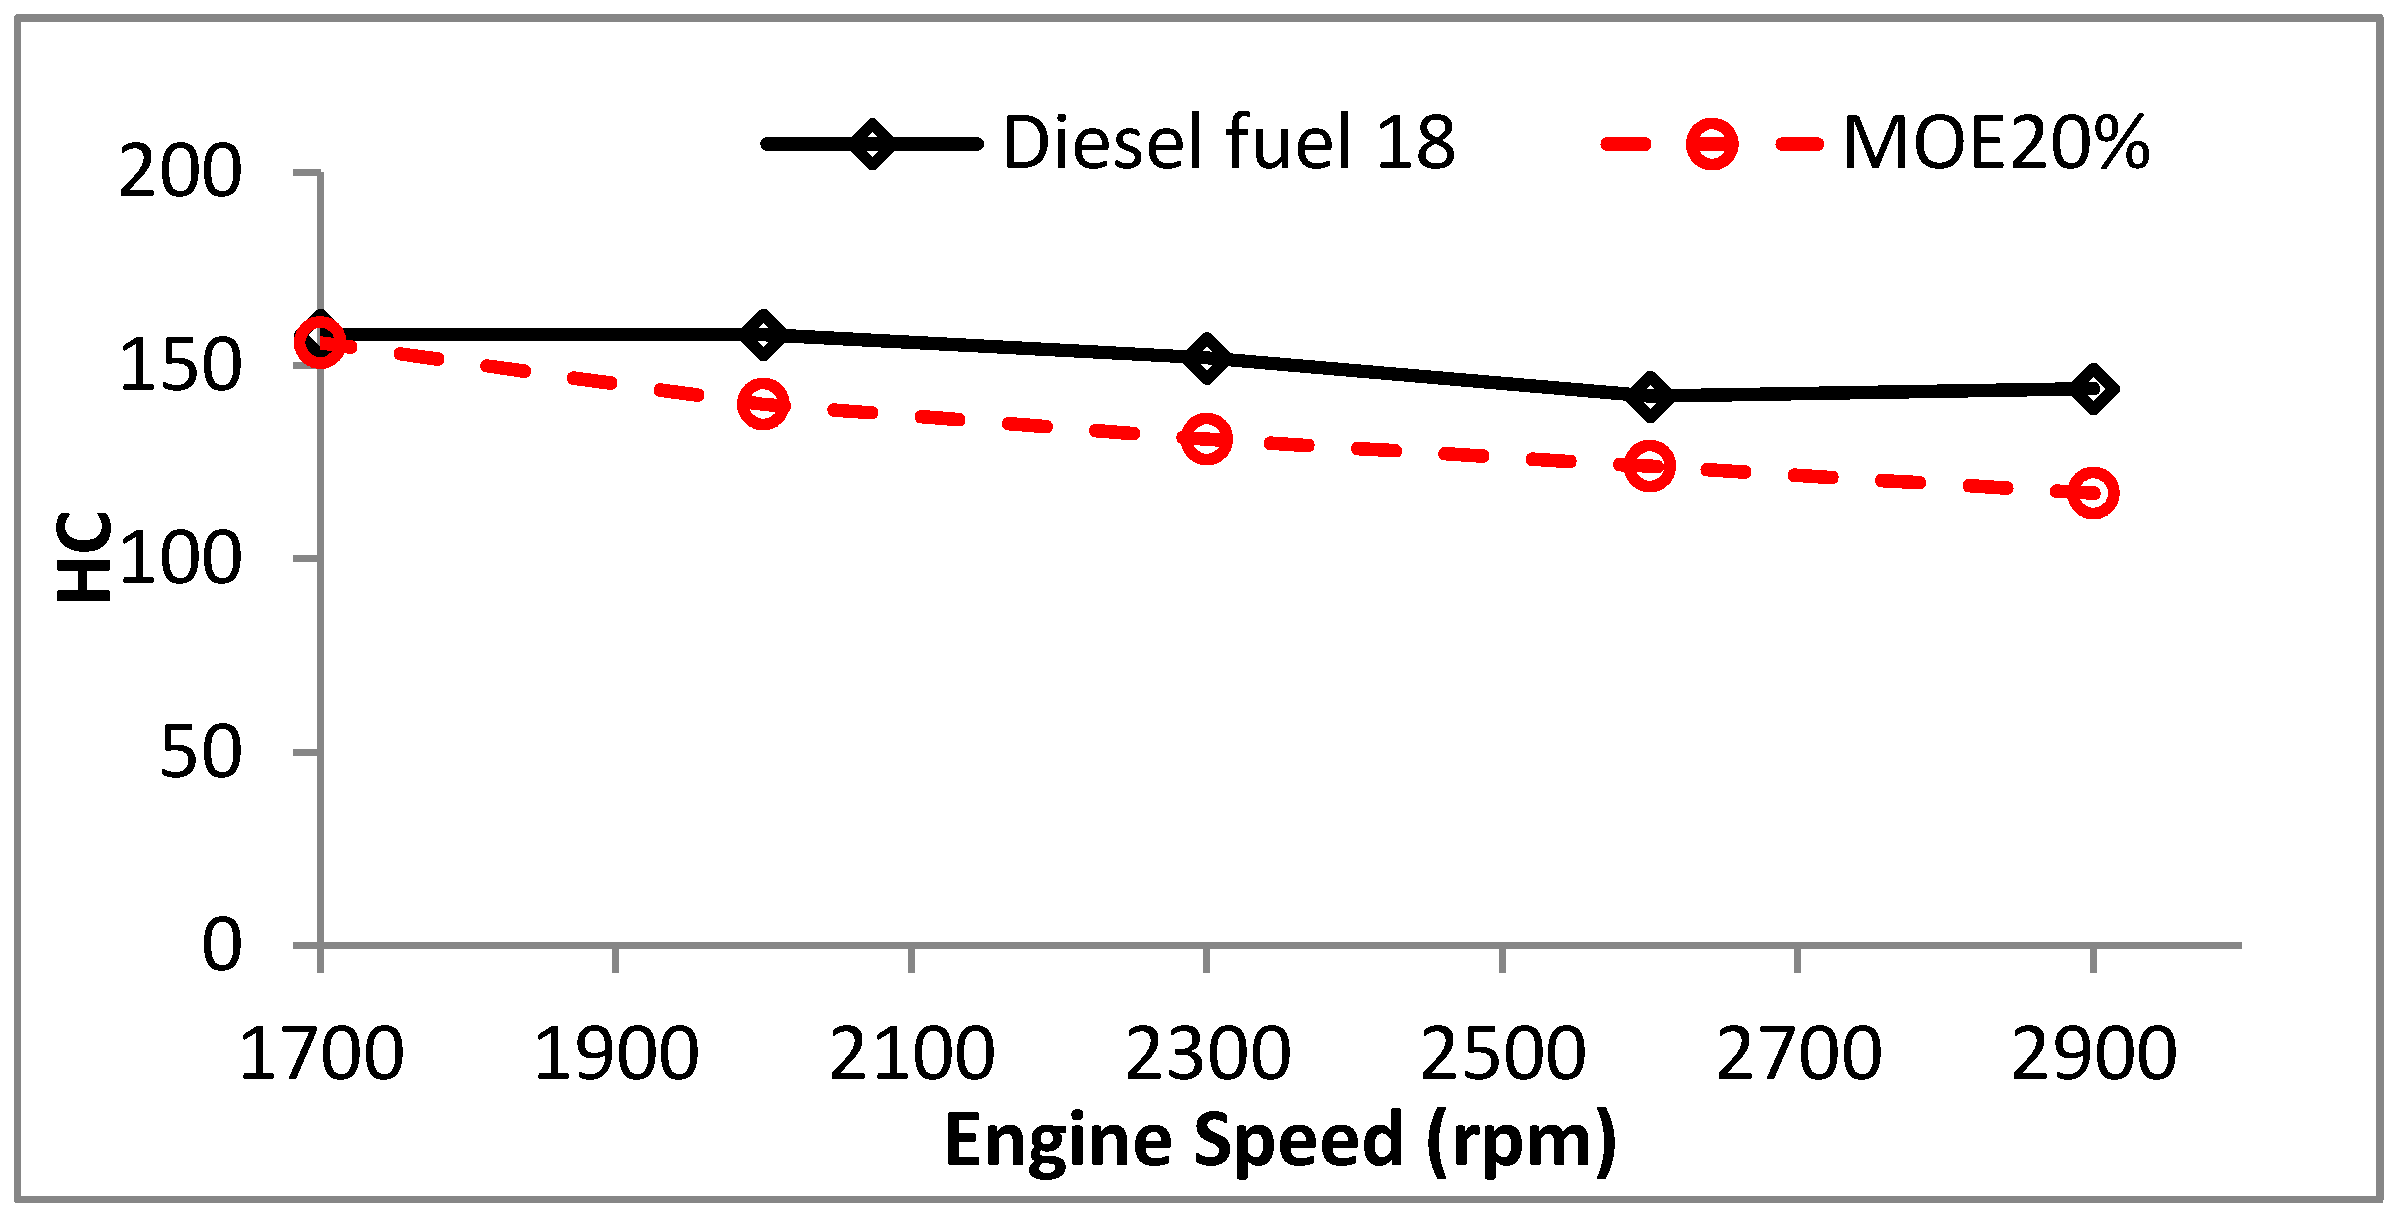
3.6. Hydrocarbon (HC) (%)
The hydrocarbon content of the exhaust gas emission
versus the engine speed for PD and MOE20% is shown in
Figure 10. The HC produced from MOE20% is considerably lower than that of PD at most of the tested speeds. The maximum variation between the fuels was observed at the engine speed of 2900 with 18.75% reduction compared to PD. This is due to the better combustion of the microalgae biodiesel and ethanol, the lower carbon content in the MOE20% and the higher H/C ratio. Subbaiah and Gopal [
21] reported a reduction of 34.3% in the HC at the exhaust when 10% ethanol was blended with biodiesel and PD at full load condition. Similarly, Rahimi and Ghobadian [
13] found that the HC from diestrol was lower than that of PD. This reduction is due to the extra oxygen from microalgae biodiesel and ethanol that enhances the combustion.
Figure 10.
The engine HC (%) at different engine speeds using PD and MOE20%.
Figure 10.
The engine HC (%) at different engine speeds using PD and MOE20%.
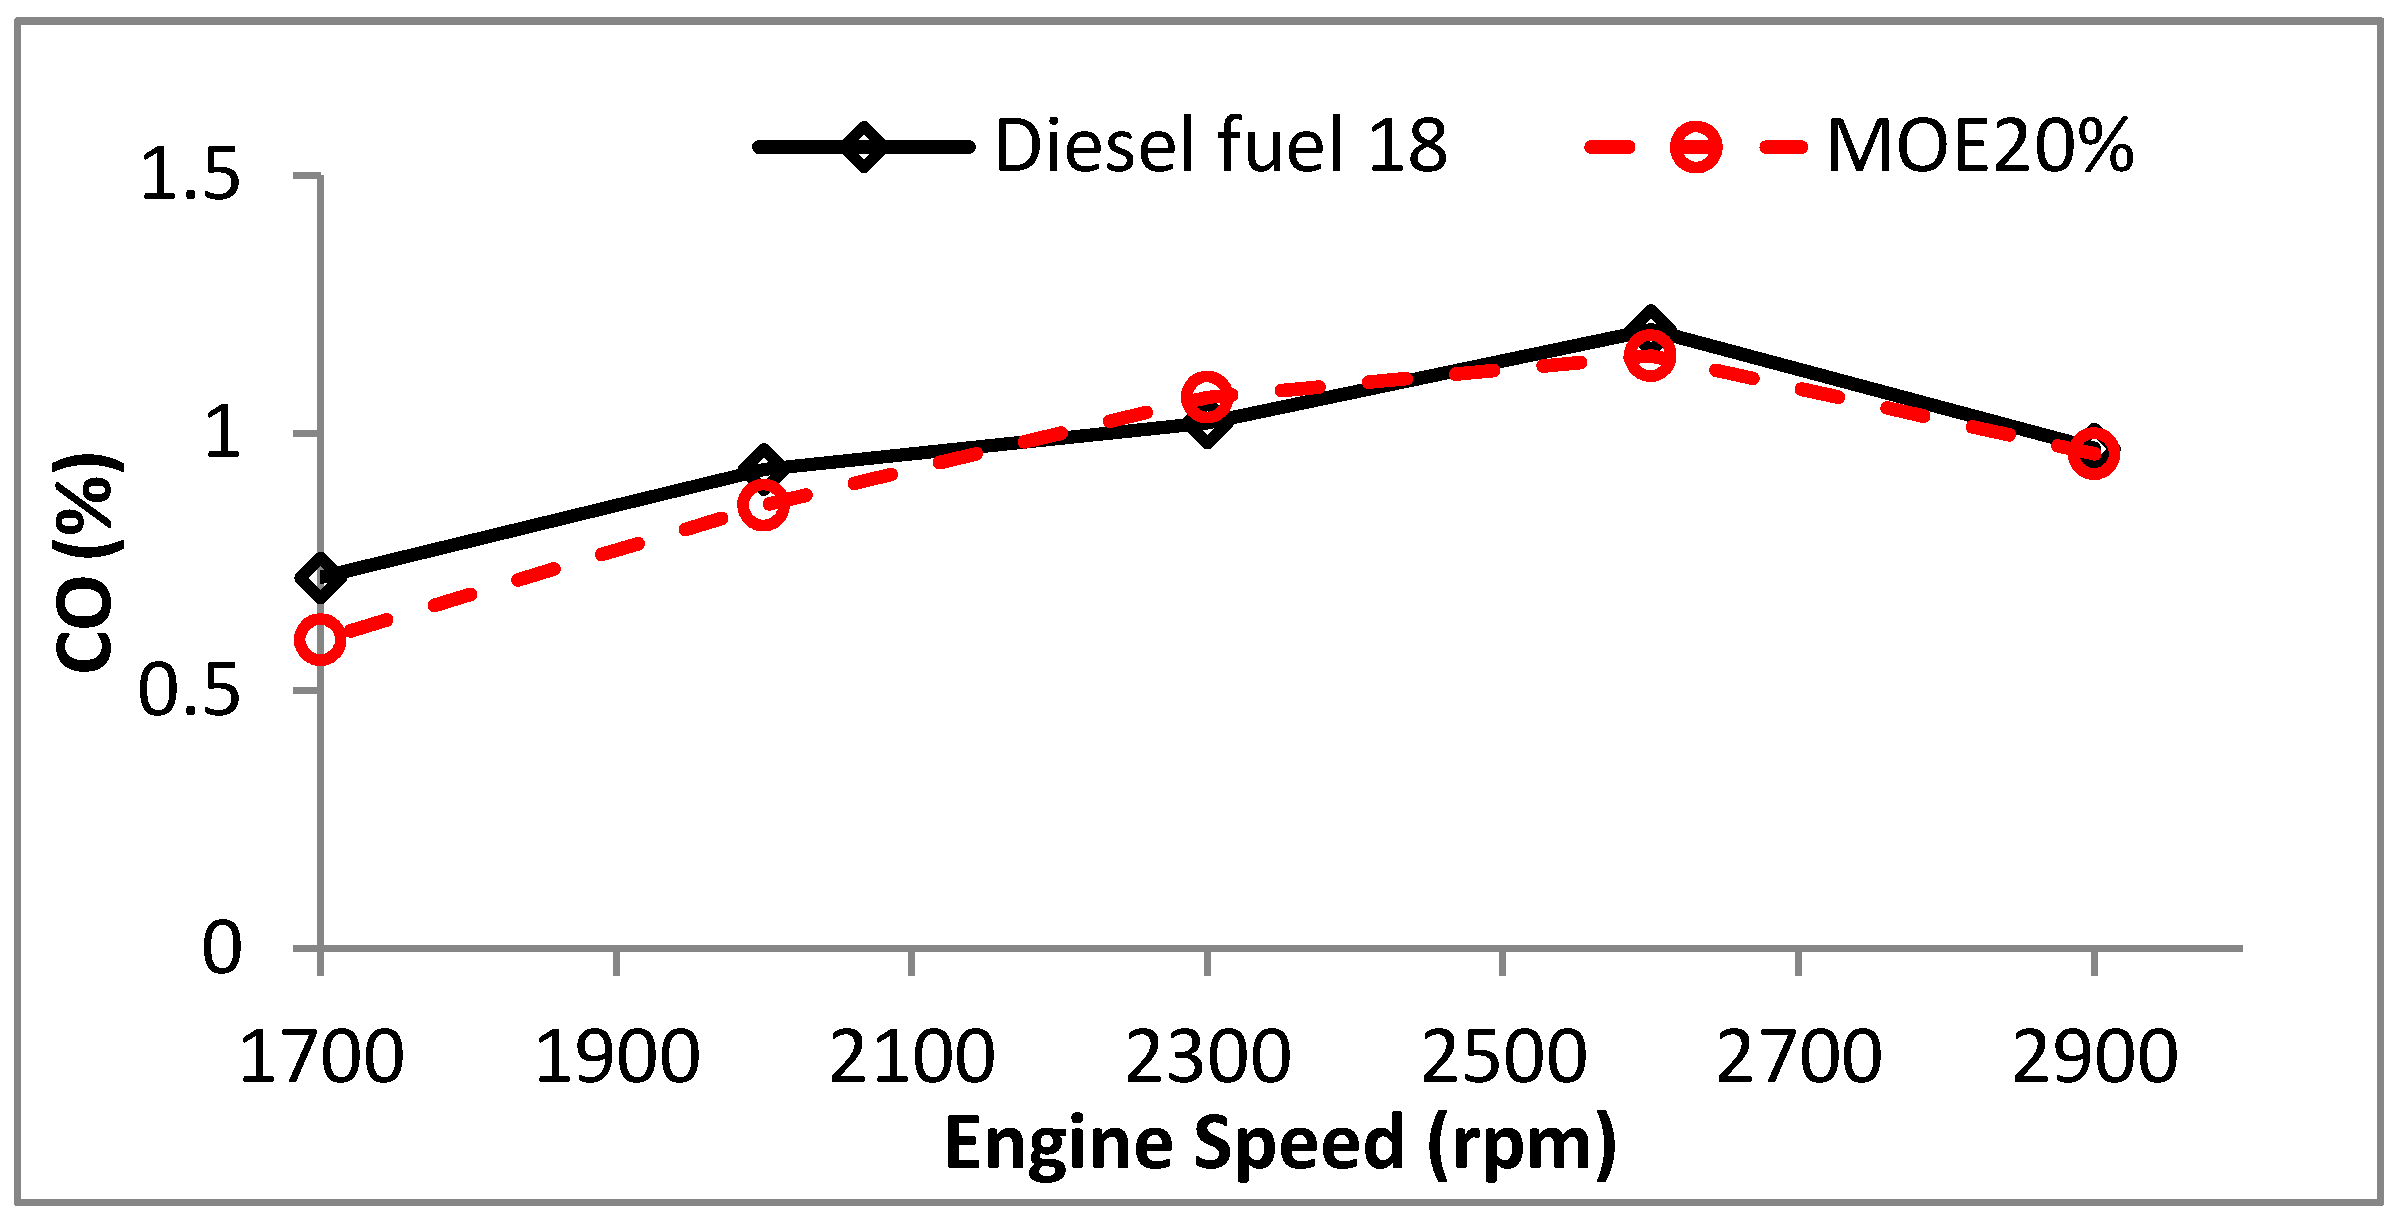
3.7. Carbon Monoxide and Carbon Dioxide CO and CO2 (%)
CO emission is an indication of the complete combustion.
Figure 11 presents the CO emission at different engine speeds for PD and MOE20%. The figure shows that the CO emission of MOE20% is lower than PD at low engine speeds of 1700 rpm and 2000 rpm and almost the same as that of PD at high engine speed. The use MOE20% resulted in a maximum reduction parentage of CO level 16.7% at 1700 rpm as compared to the standard PD at the same speed. The CO level at 1700 for PD is 0.72% and 0.6% for MOE20%. The difference between the readings is 0.12% This finding is in agreement with Bhale, Deshpande [
12] who reported an average reduction of 50% in CO when 20% ethanol was added to biodiesel. However, at 2300 rpm, the CO emission from MOE20% is higher than that from PD by about 4.9%. This could be due to the experimental error. The lower CO emission with MOE20% is due to the higher oxygen content and H/C ratio.
Figure 11.
The engine CO (%) at different engine speeds using PD and MOE20%.
Figure 11.
The engine CO (%) at different engine speeds using PD and MOE20%.
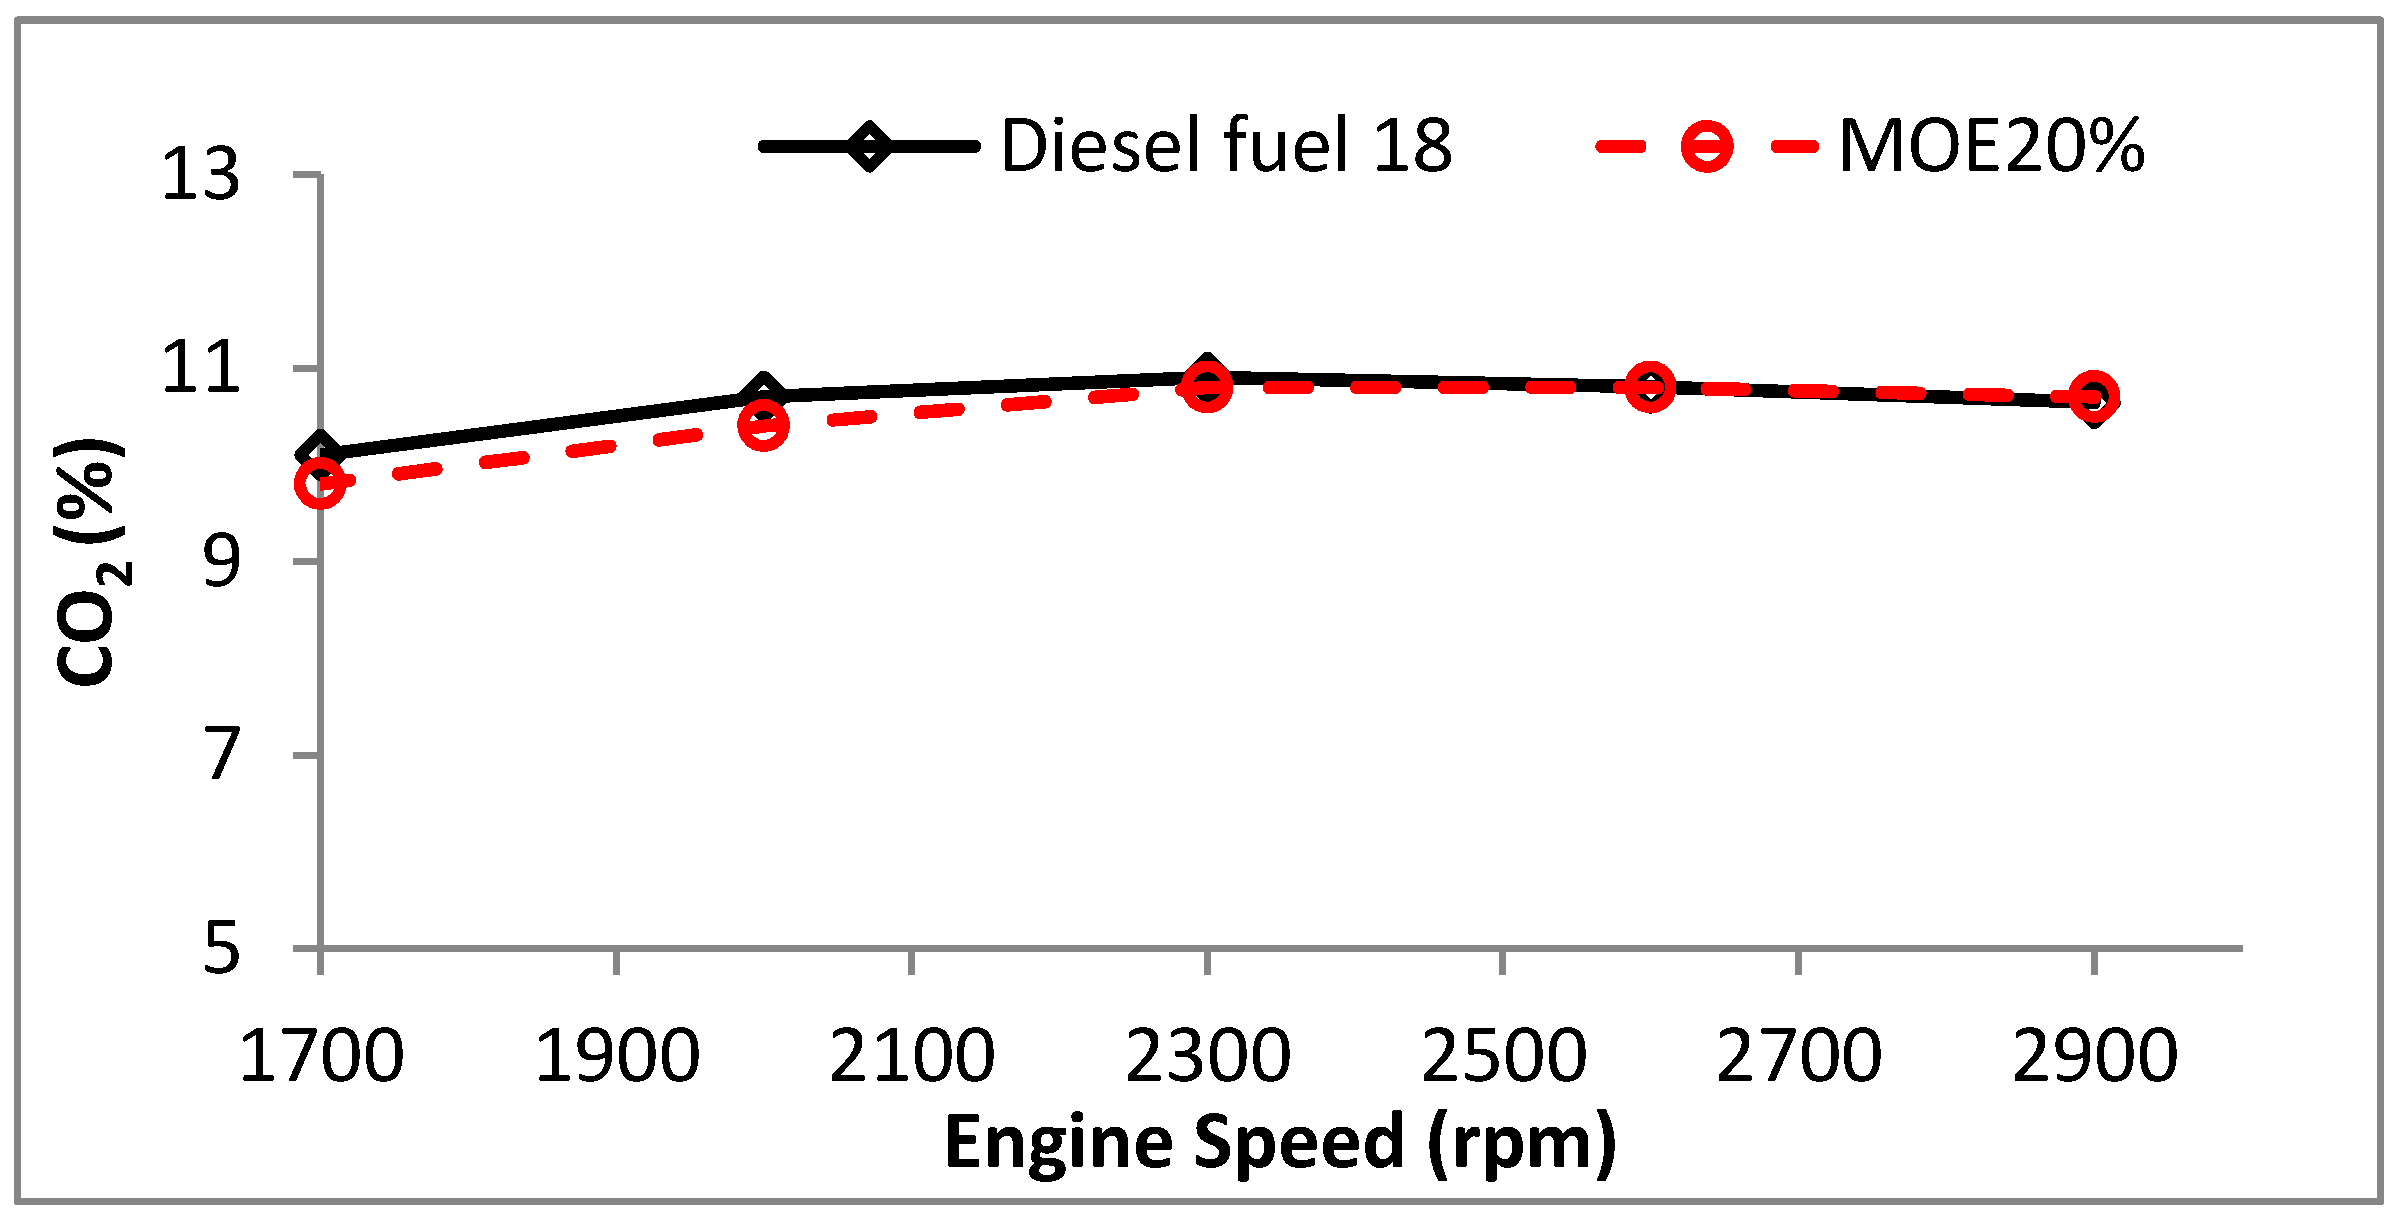
Figure 12 presents the CO
2 level at different engine speeds for PD and MOE20%. The emission of CO
2 is almost constant with the engine speed for both fuels. There is a marginal difference in the CO
2 emission at medium and high engine speeds. A negligible reduction of 2.93% and 2.8% is depicted at low engine speeds of 1700 rpm and 1900 rpm, respectively. The maximum difference between the readings of CO
2% for PD and MOE20% is 0.3% at 1700 rpm (10.1% for PD and 9.8% for MOE20%). However, the reduction in the CO and CO
2 level especially at low engine speed could be due to the lower H/C ratio of the MOE20% (1.94) compared to 2.01 for PD (see
Table 3). This means that the amount of carbon that enters the combustion chamber is less with MOE20% compared to PD as the amount of fuel injected is the same. This justifies the lower CO and CO
2 of MOE20% compared to PD (less by 1.2% for CO and 4.13% for CO
2 as given in
Figure 4).
Figure 12.
The engine CO2 (%) at different engine speeds using PD and MOE20%.
Figure 12.
The engine CO2 (%) at different engine speeds using PD and MOE20%.


