
Development of an Active Power Reserve Management Method for DC Applied Wave-Wind Combined Generation Systems


Abstract
:1. Introduction
- -
- The designed HGS utilizes a doubly-fed induction generator (DFIG). In the simulation, the DFIG adapts power factor control logic regarding the reactive power generation.
- -
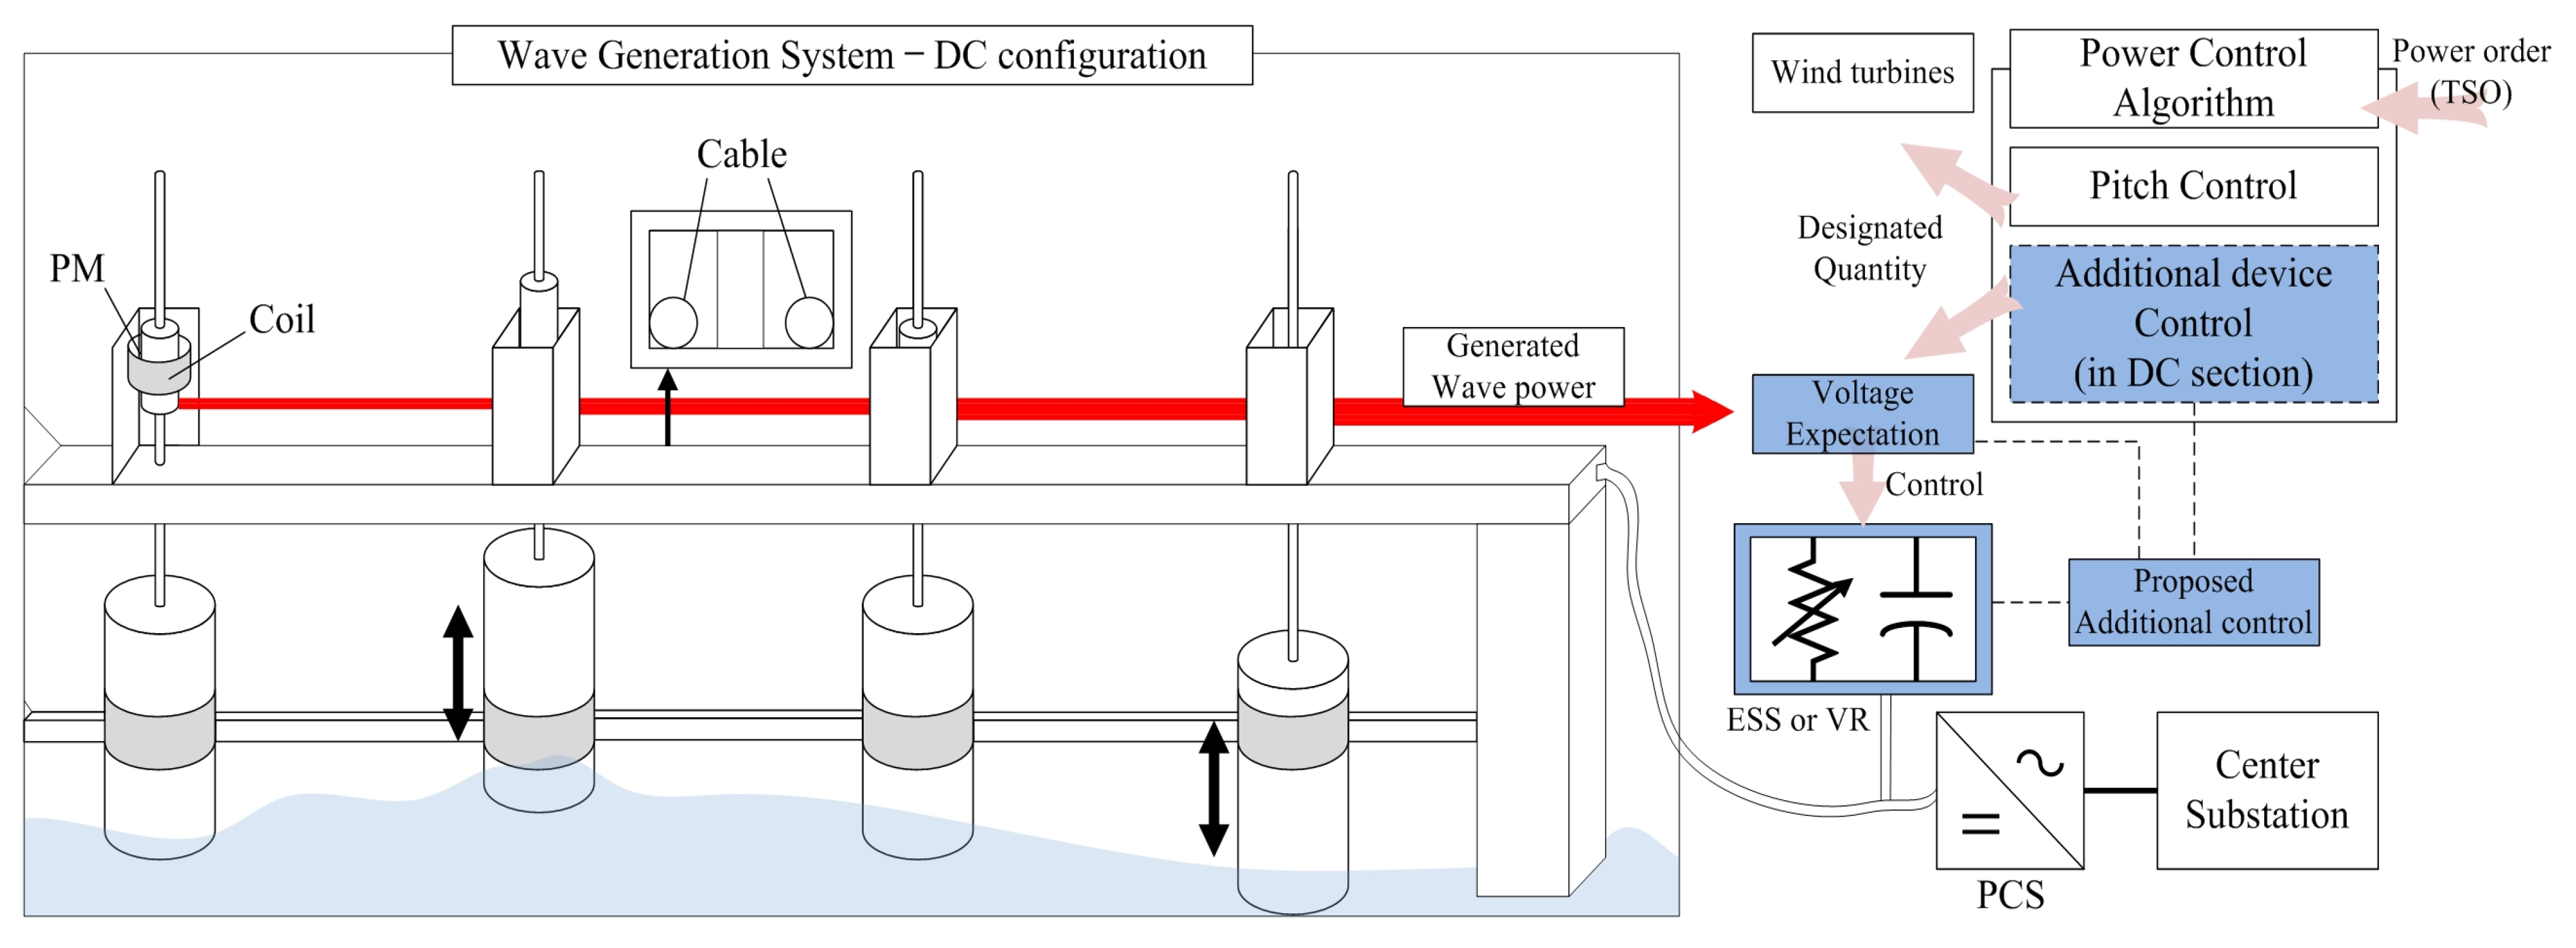
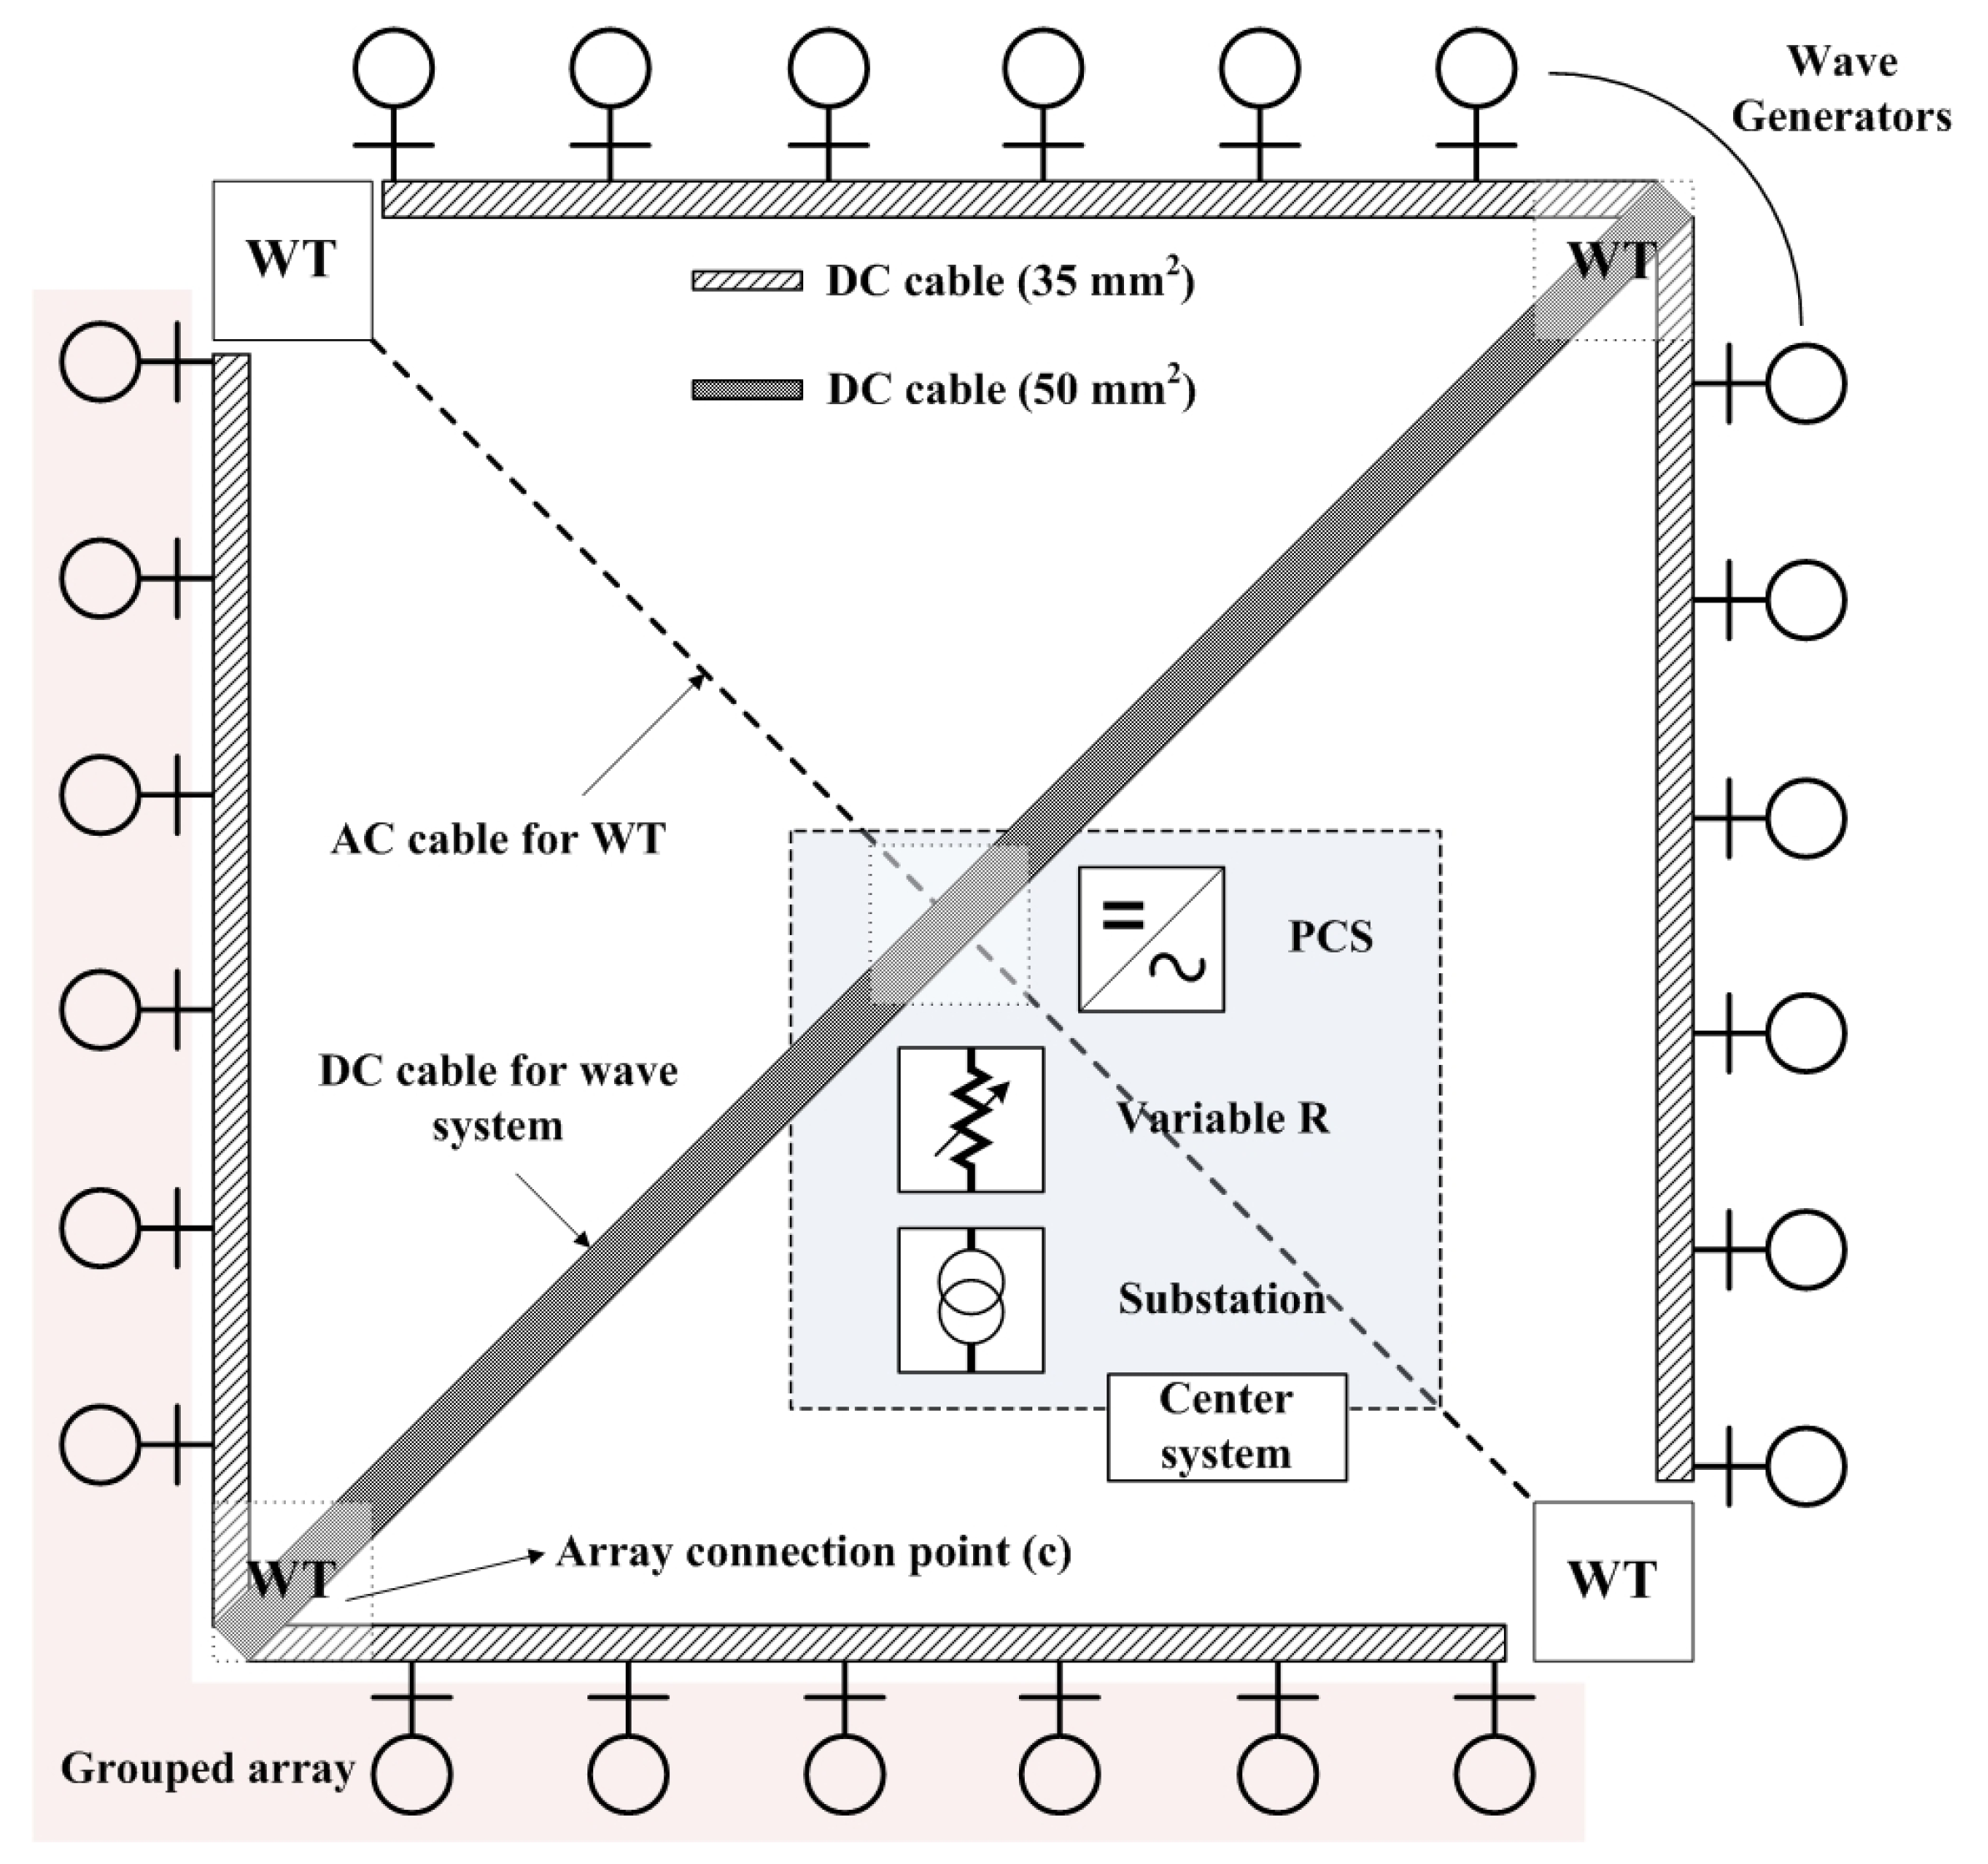
- The DC section’s power limitation method and logic with a controllable device will mainly be checked in this paper because the present system does not adopt real power control and the entire output profile of HGS could be limited by wind turbines. By considering the voltage variation of the inner system, a variable resistance operation plan will be formulized. The conceptual plan is represented in Figure 1 and the variable resistance can be replaced with other controllable devices such as ESS. We utilize the device to check the availability of the power control scheme in DC section.Figure 1. Applied wave generation system and the concept of the proposed power control algorithm. PM: permanent magnet; VR: variable resistance; PCS: power conversion system.Figure 1. Applied wave generation system and the concept of the proposed power control algorithm. PM: permanent magnet; VR: variable resistance; PCS: power conversion system.
![Energies 08 12321 g001]()
- -
- Reactive power control would be executed according to the system order. If the TSO wants to maximize the available reactive power due to a system constraint such as low voltage conditions, the operation mode can be changed with the proposed method.

2. System Description
2.1. Wave-Offshore Hybrid System

2.2. Doubly-Fed Induction Generator (DFIG) Wind Generation System
2.3. Reactive Power Reserve of the Wave System
2.4. DC Model with Wave Generators

3. Power Control Algorithm
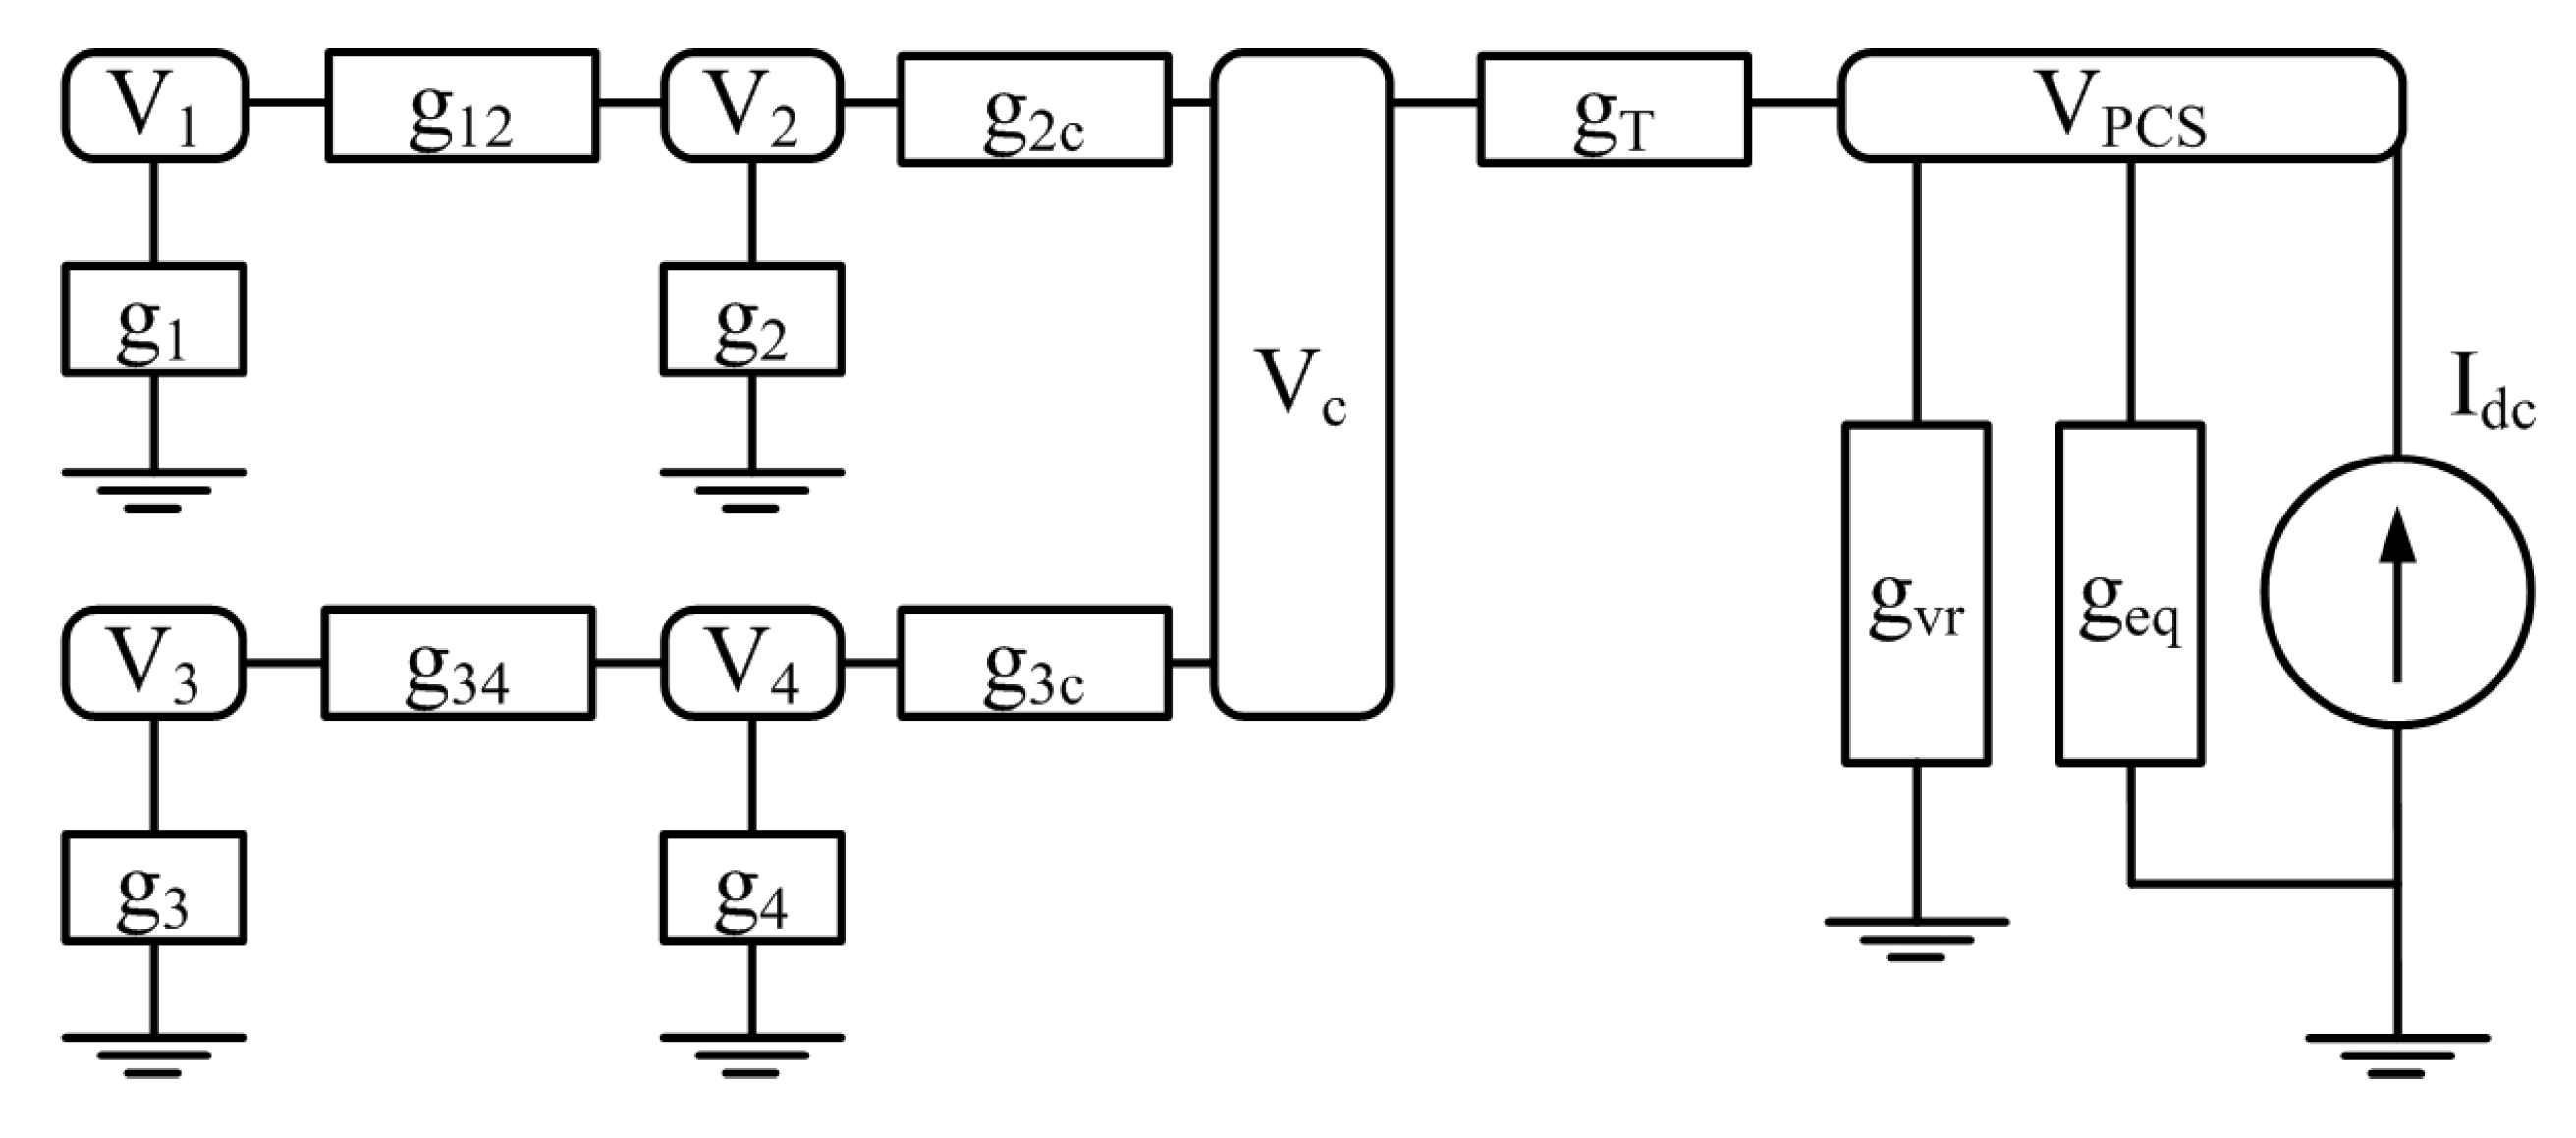
3.1. DC Circuit Analysis


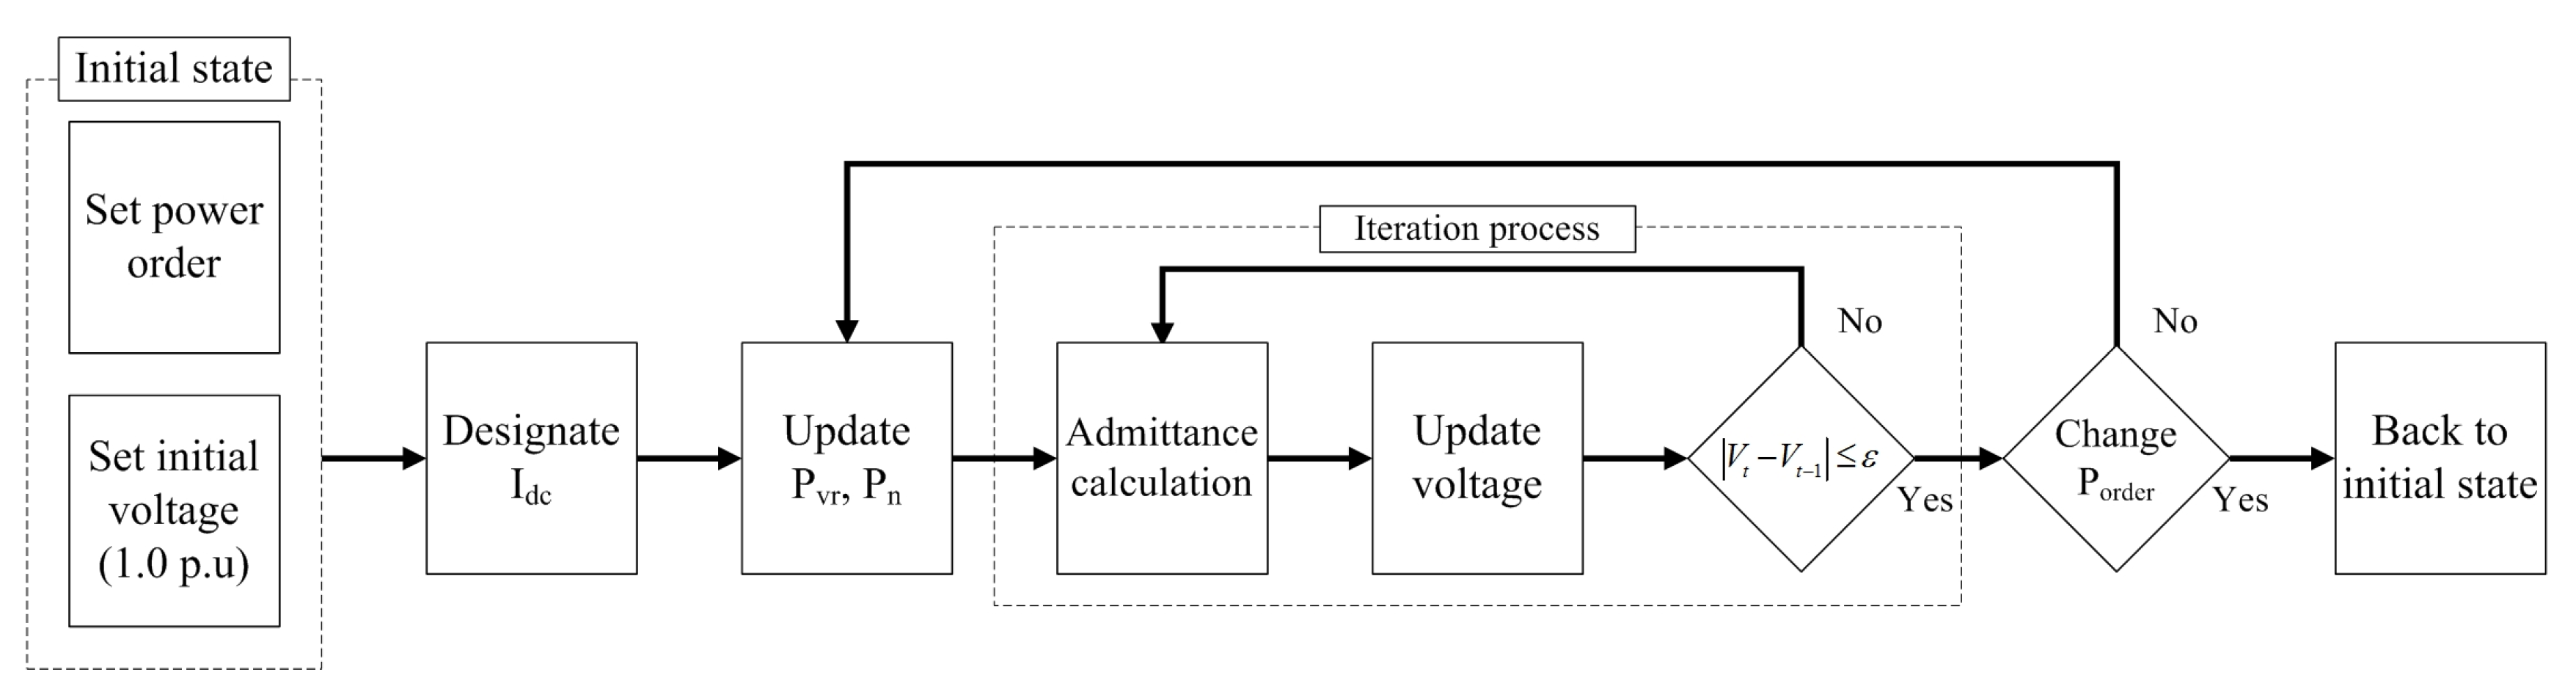
3.2. Power Assignment Strategy

4. Simulation
4.1. Simulation Configuration

| Specific data | Value | Unit |
|---|---|---|
| Distance between wind turbines | 171.6 | m |
| Distance between wave generators | 28.6 | m |
| Distance from point of common coupling | 300 | m |
| Rated AC voltage of inner system | 22.9 | kV |
| Rated DC voltage for wave system | 0.75 | kV |
| Number of wind turbines | 4 | - |
| Number of wave generators | 24 | - |
| Rated power of wind turbine | 2 | MW |
| Rated power of wave generator | 0.1 | MW |
| Short circuit ratio of utility grid | 15 | - |
| X/R ratio of utility grid | 15 | - |
| Variable resistance time interval | 0.05 | Second |
| Voltage [kV] | Size [m2] | Allowable current [A] | Conductor resistance [Ω/km] | Inductance [mH/km] | Capacitance [µF/km] |
|---|---|---|---|---|---|
| 22.9 | 70 | 363 | 0.277 | 0.26 | 0.08 |
| 0.75 (DC) | 35 | 228 | 0.565 | 0.277 | 0.08 |
| 50 | 289 | 0.393 | 0.266 | 0.09 | |
| 154 | 120 | 508 | 0.164 | 0.248 | 0.18 |
| Case | Order interval [s] | First order [MW] | Second order [MW] | RPR control [s] |
|---|---|---|---|---|
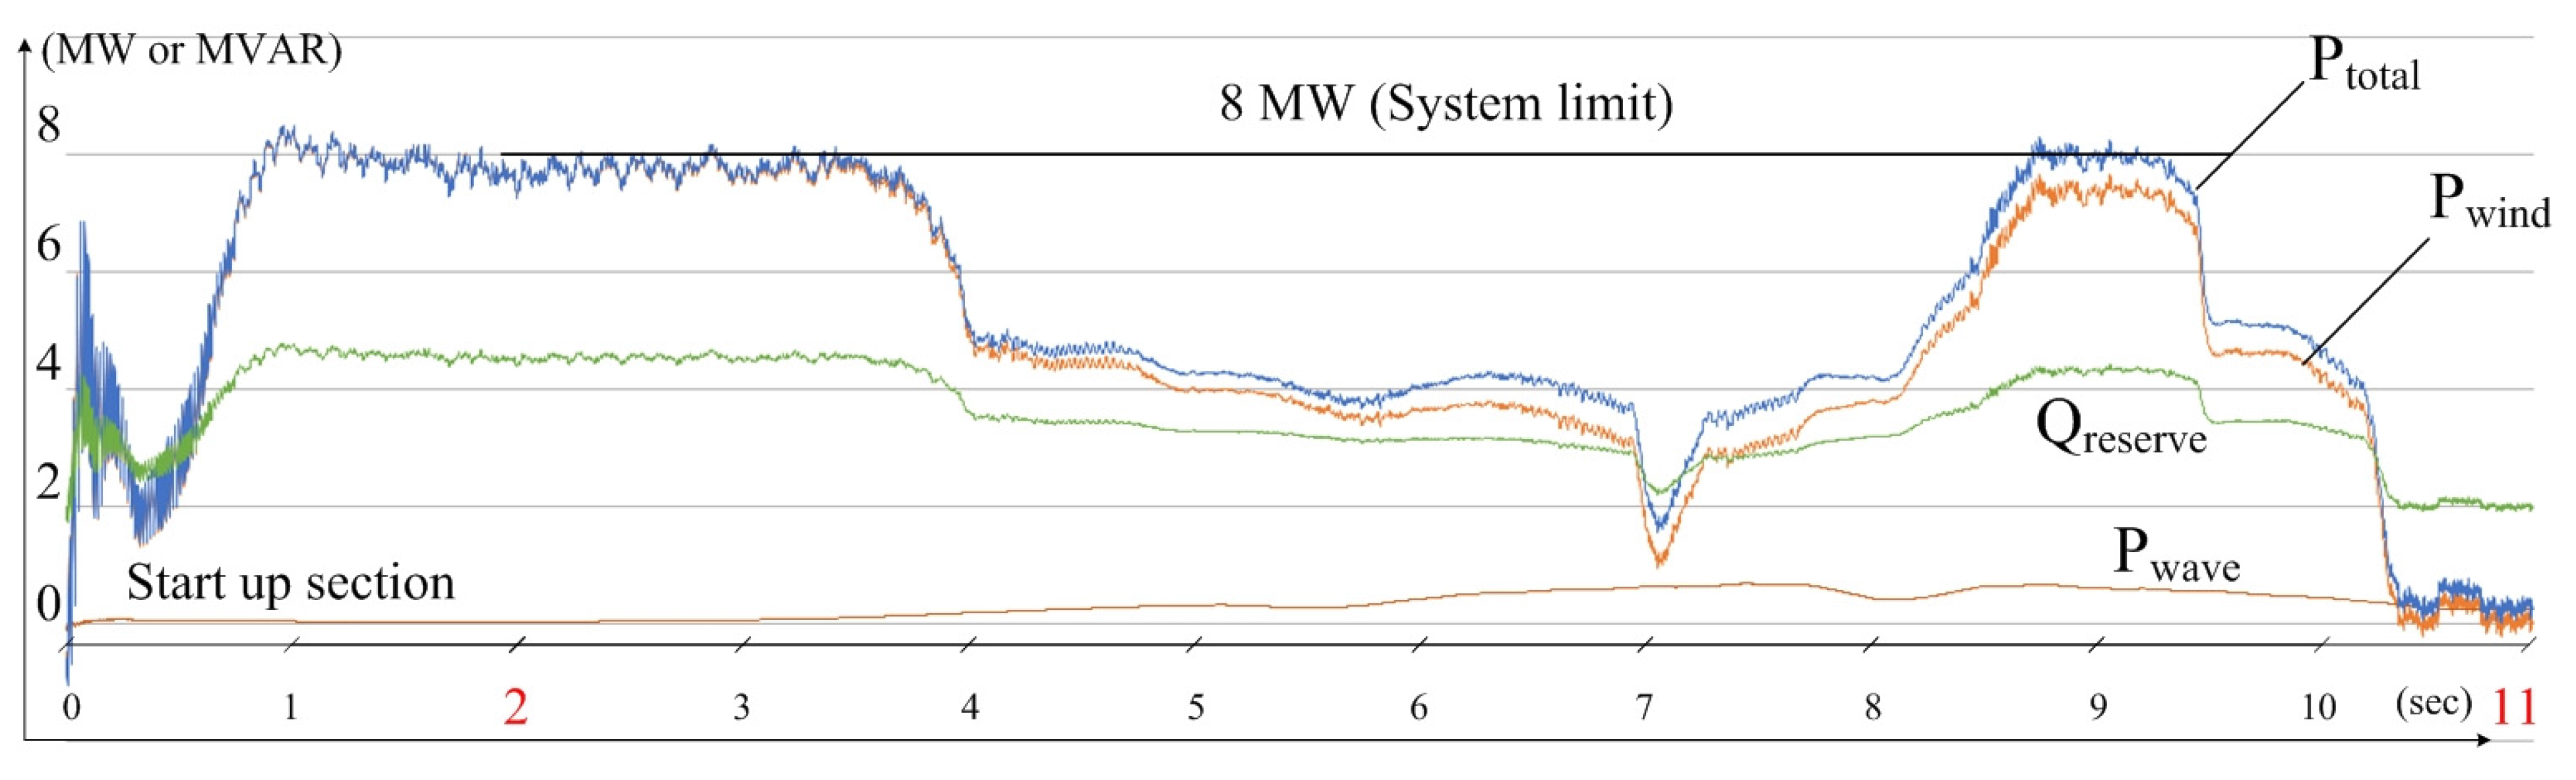
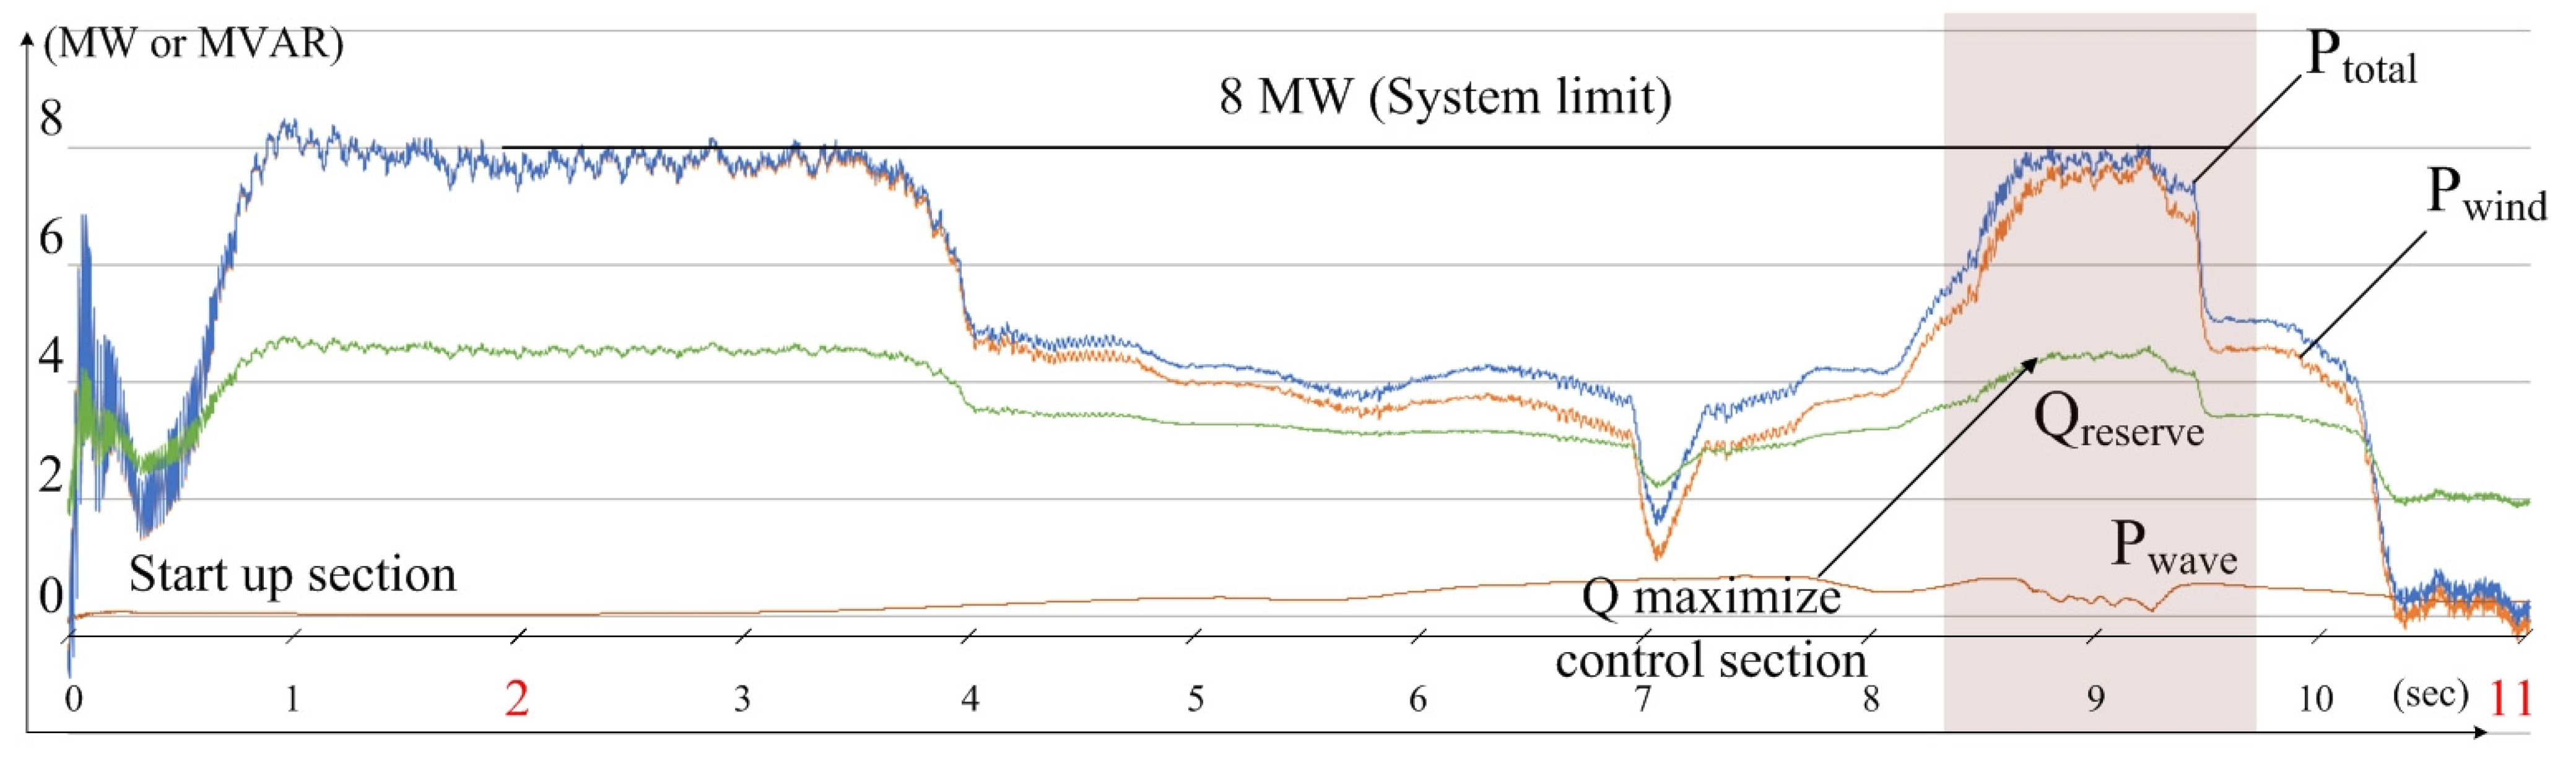
| November | 10 | 8 (2 s) | - | 8.5~10 |
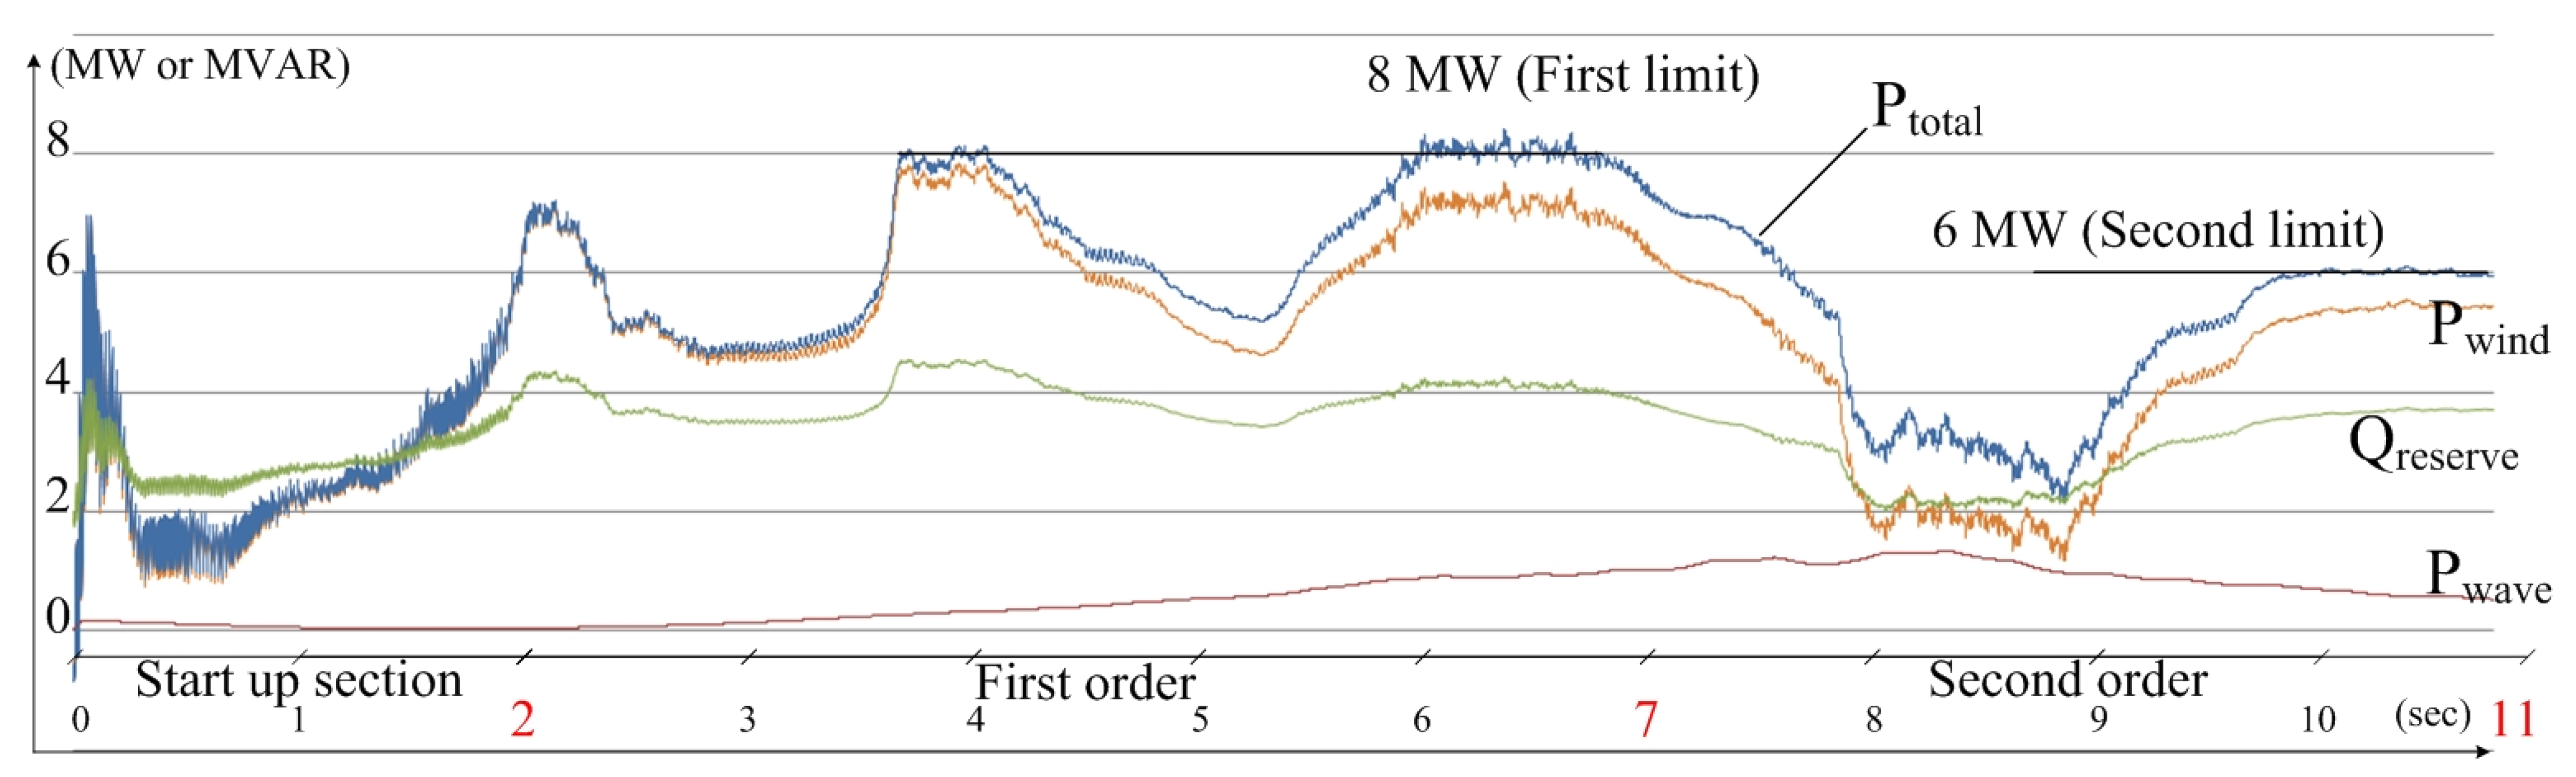
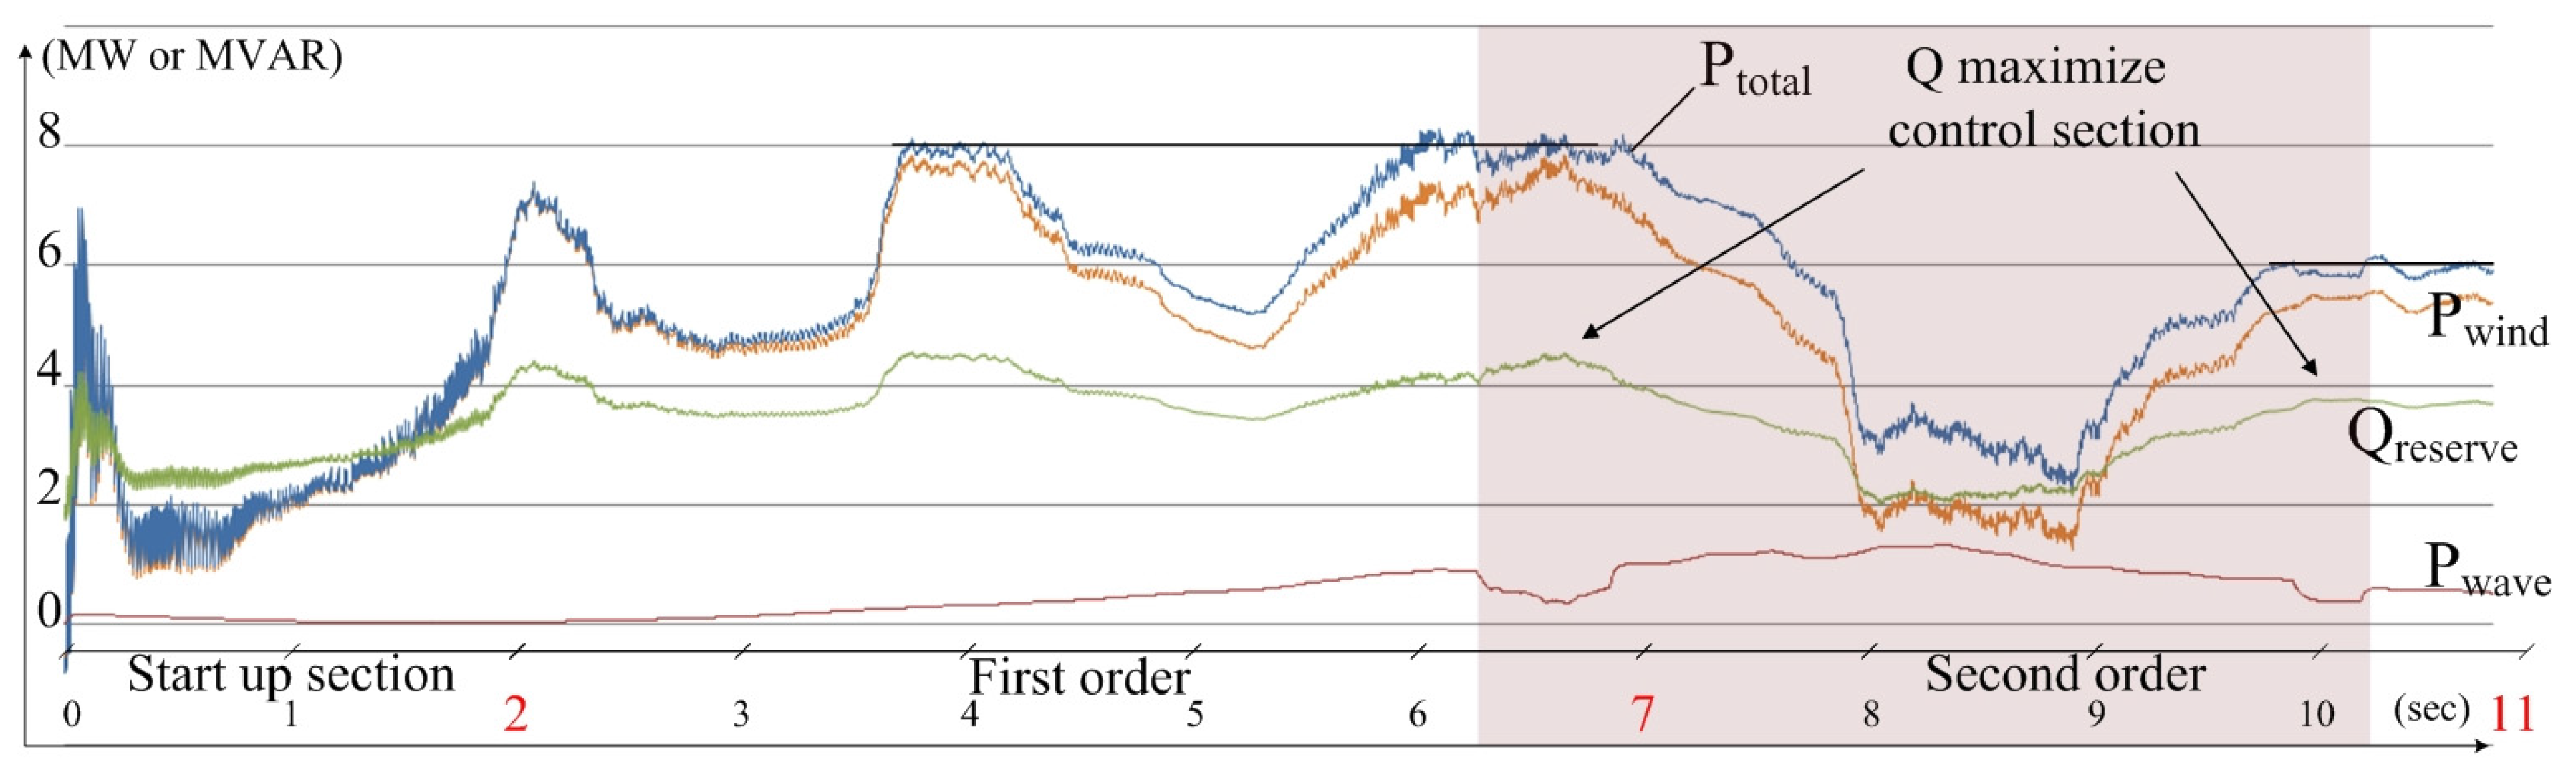
| February | 5 | 8 (2 s) | 6 (7 s) | 6.5~10.5 |
4.2. Simulation Results


| Case | Control section [s] | Average RPR [MVAR] | Control error [Wh] | Maximum controlled power [kW] | Maximum admittance value [Ʊ] | |
|---|---|---|---|---|---|---|
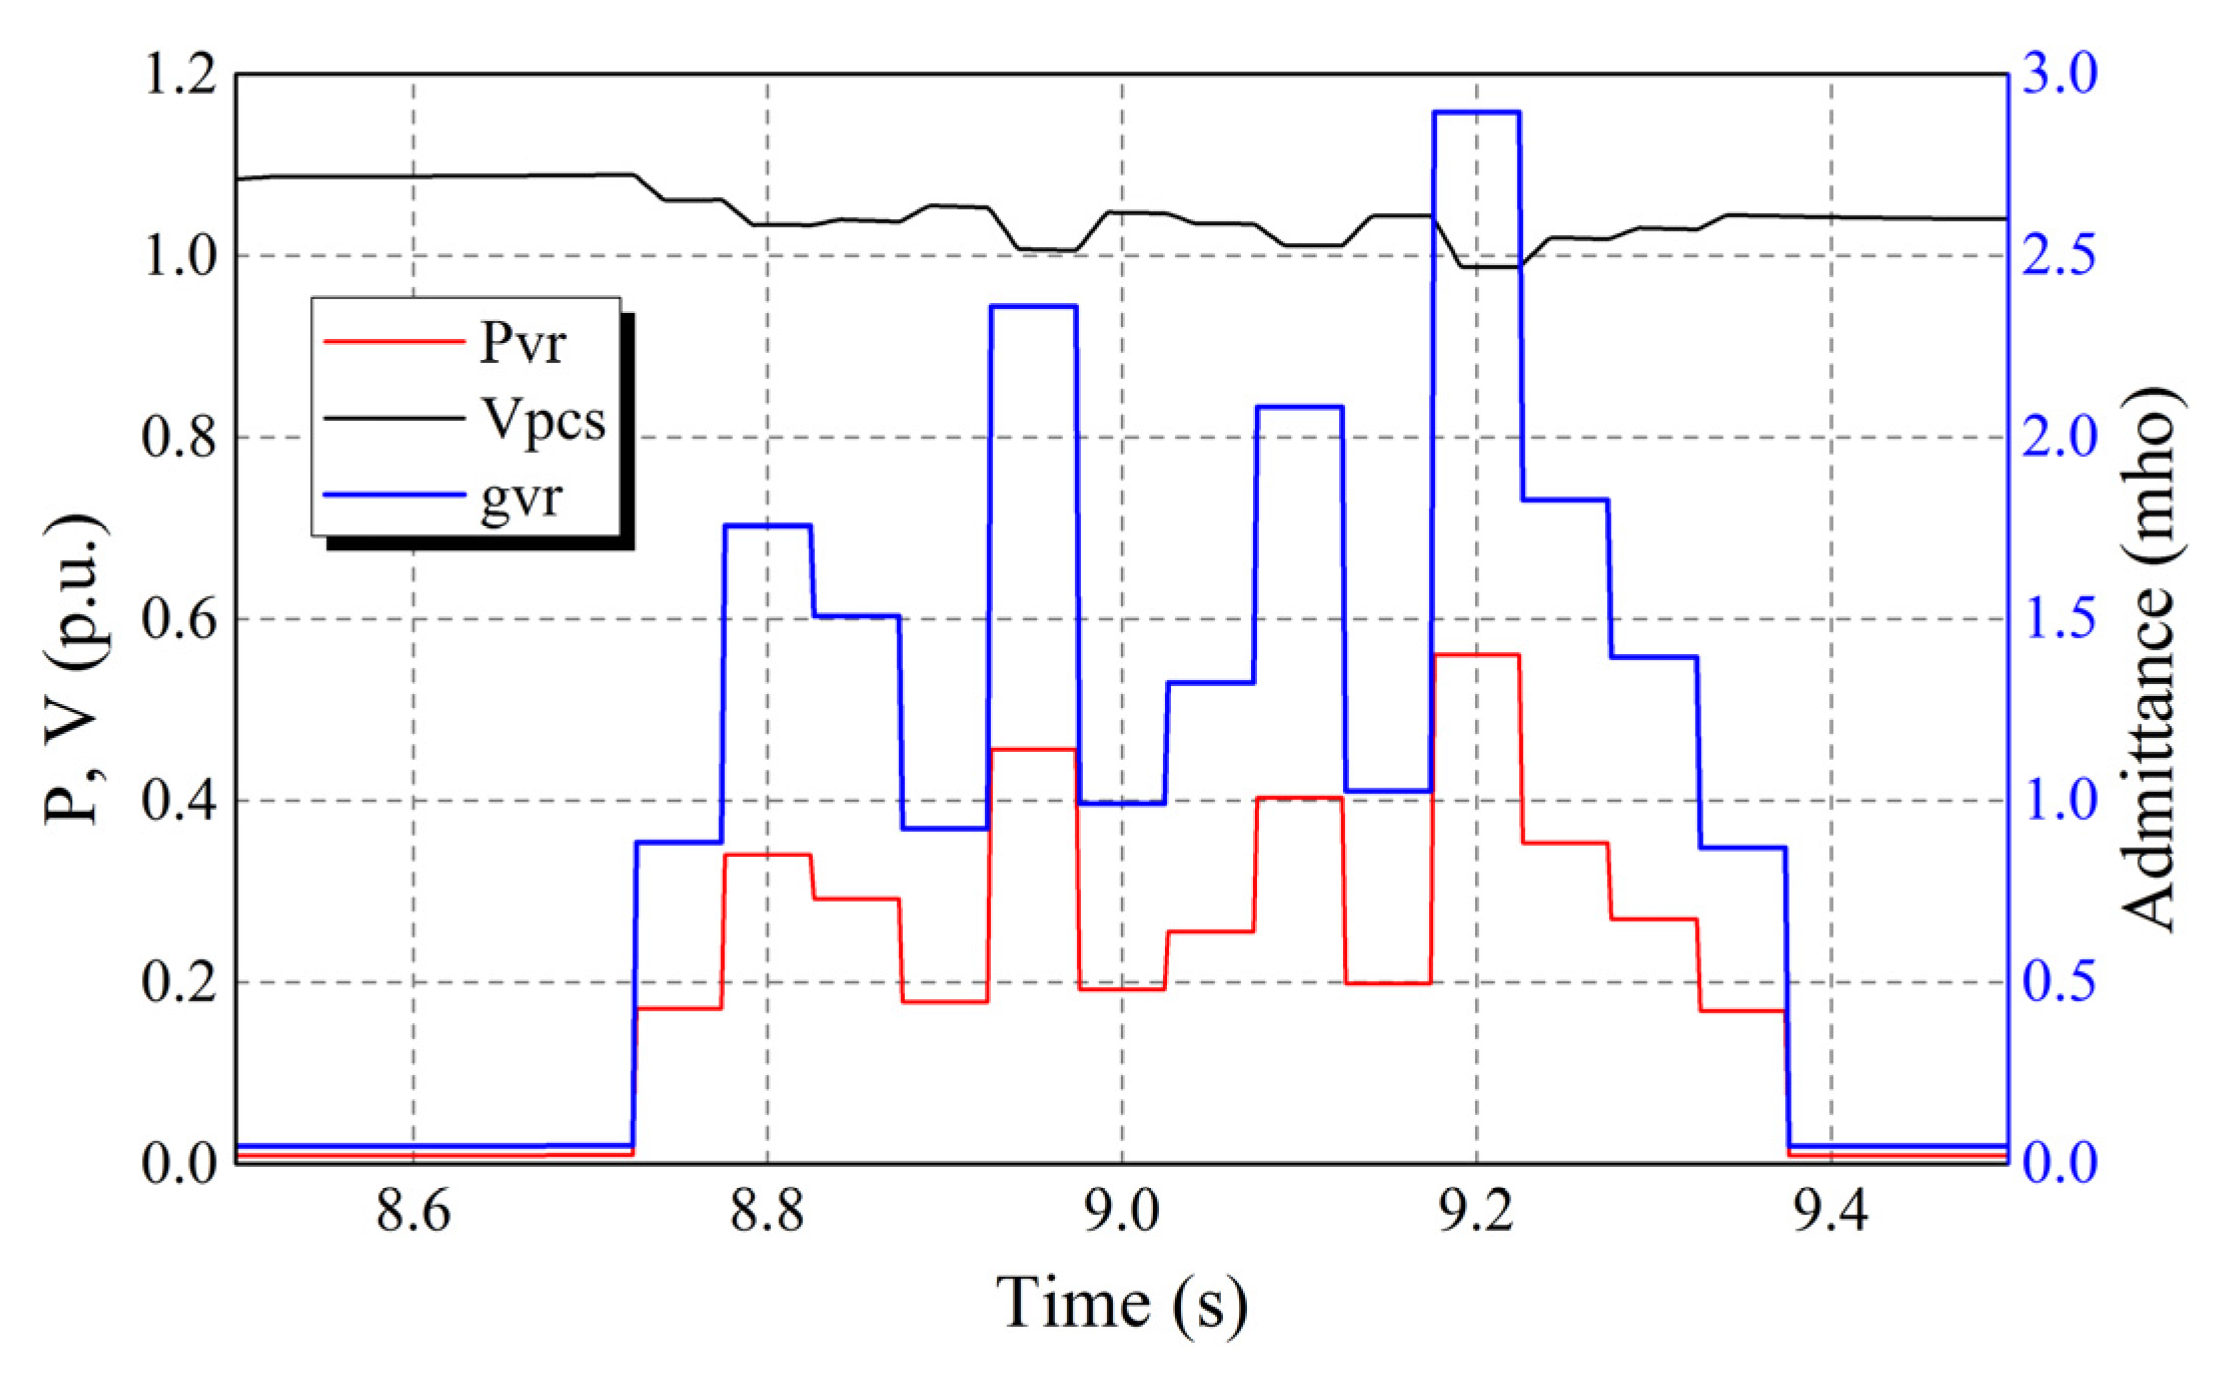
| 1 (November) | Previous | 8.75–9.33 | 4.2795 | 21.6 | - | - |
| Adopt | 8.75–9.33 | 4.4206 | 4.6 | 560.48 | 2.8951 | |
| Improvement | 0.1411 | −17 | - | - | ||
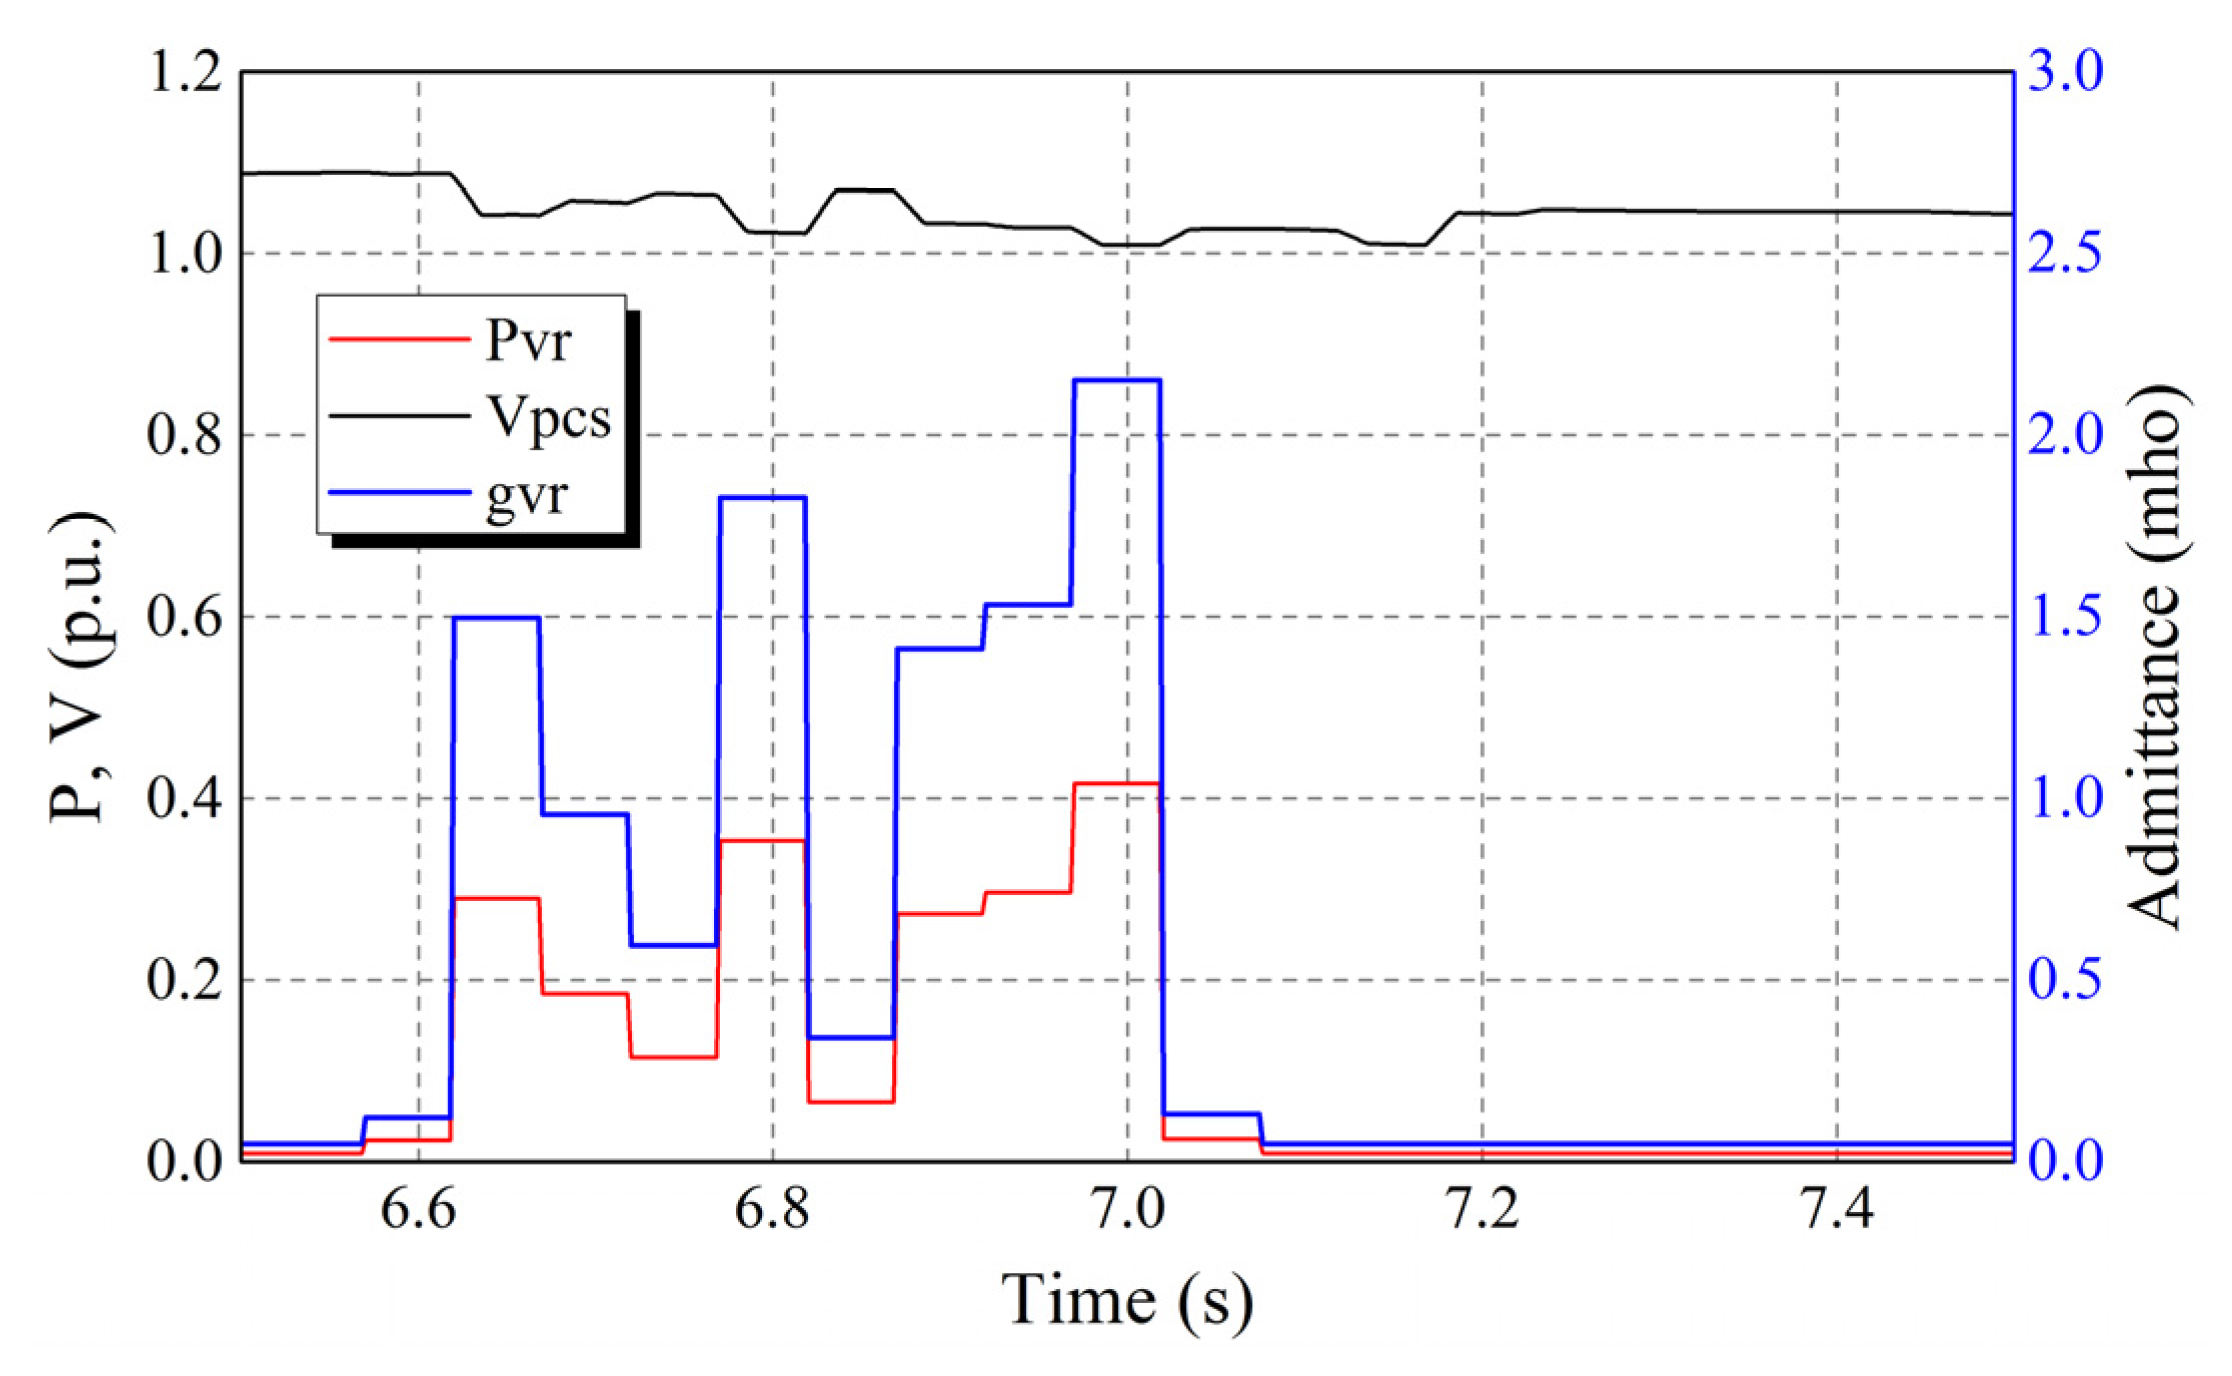
| 2 (February) | Previous | 6.2–6.8 | 4.3015 | 20.6 | - | - |
| Adopt | 6.2–6.8 | 4.51 | 4.7 | 416.5 | 2.1512 | |
| Improvement | 0.2085 | −15.9 | - | - | ||
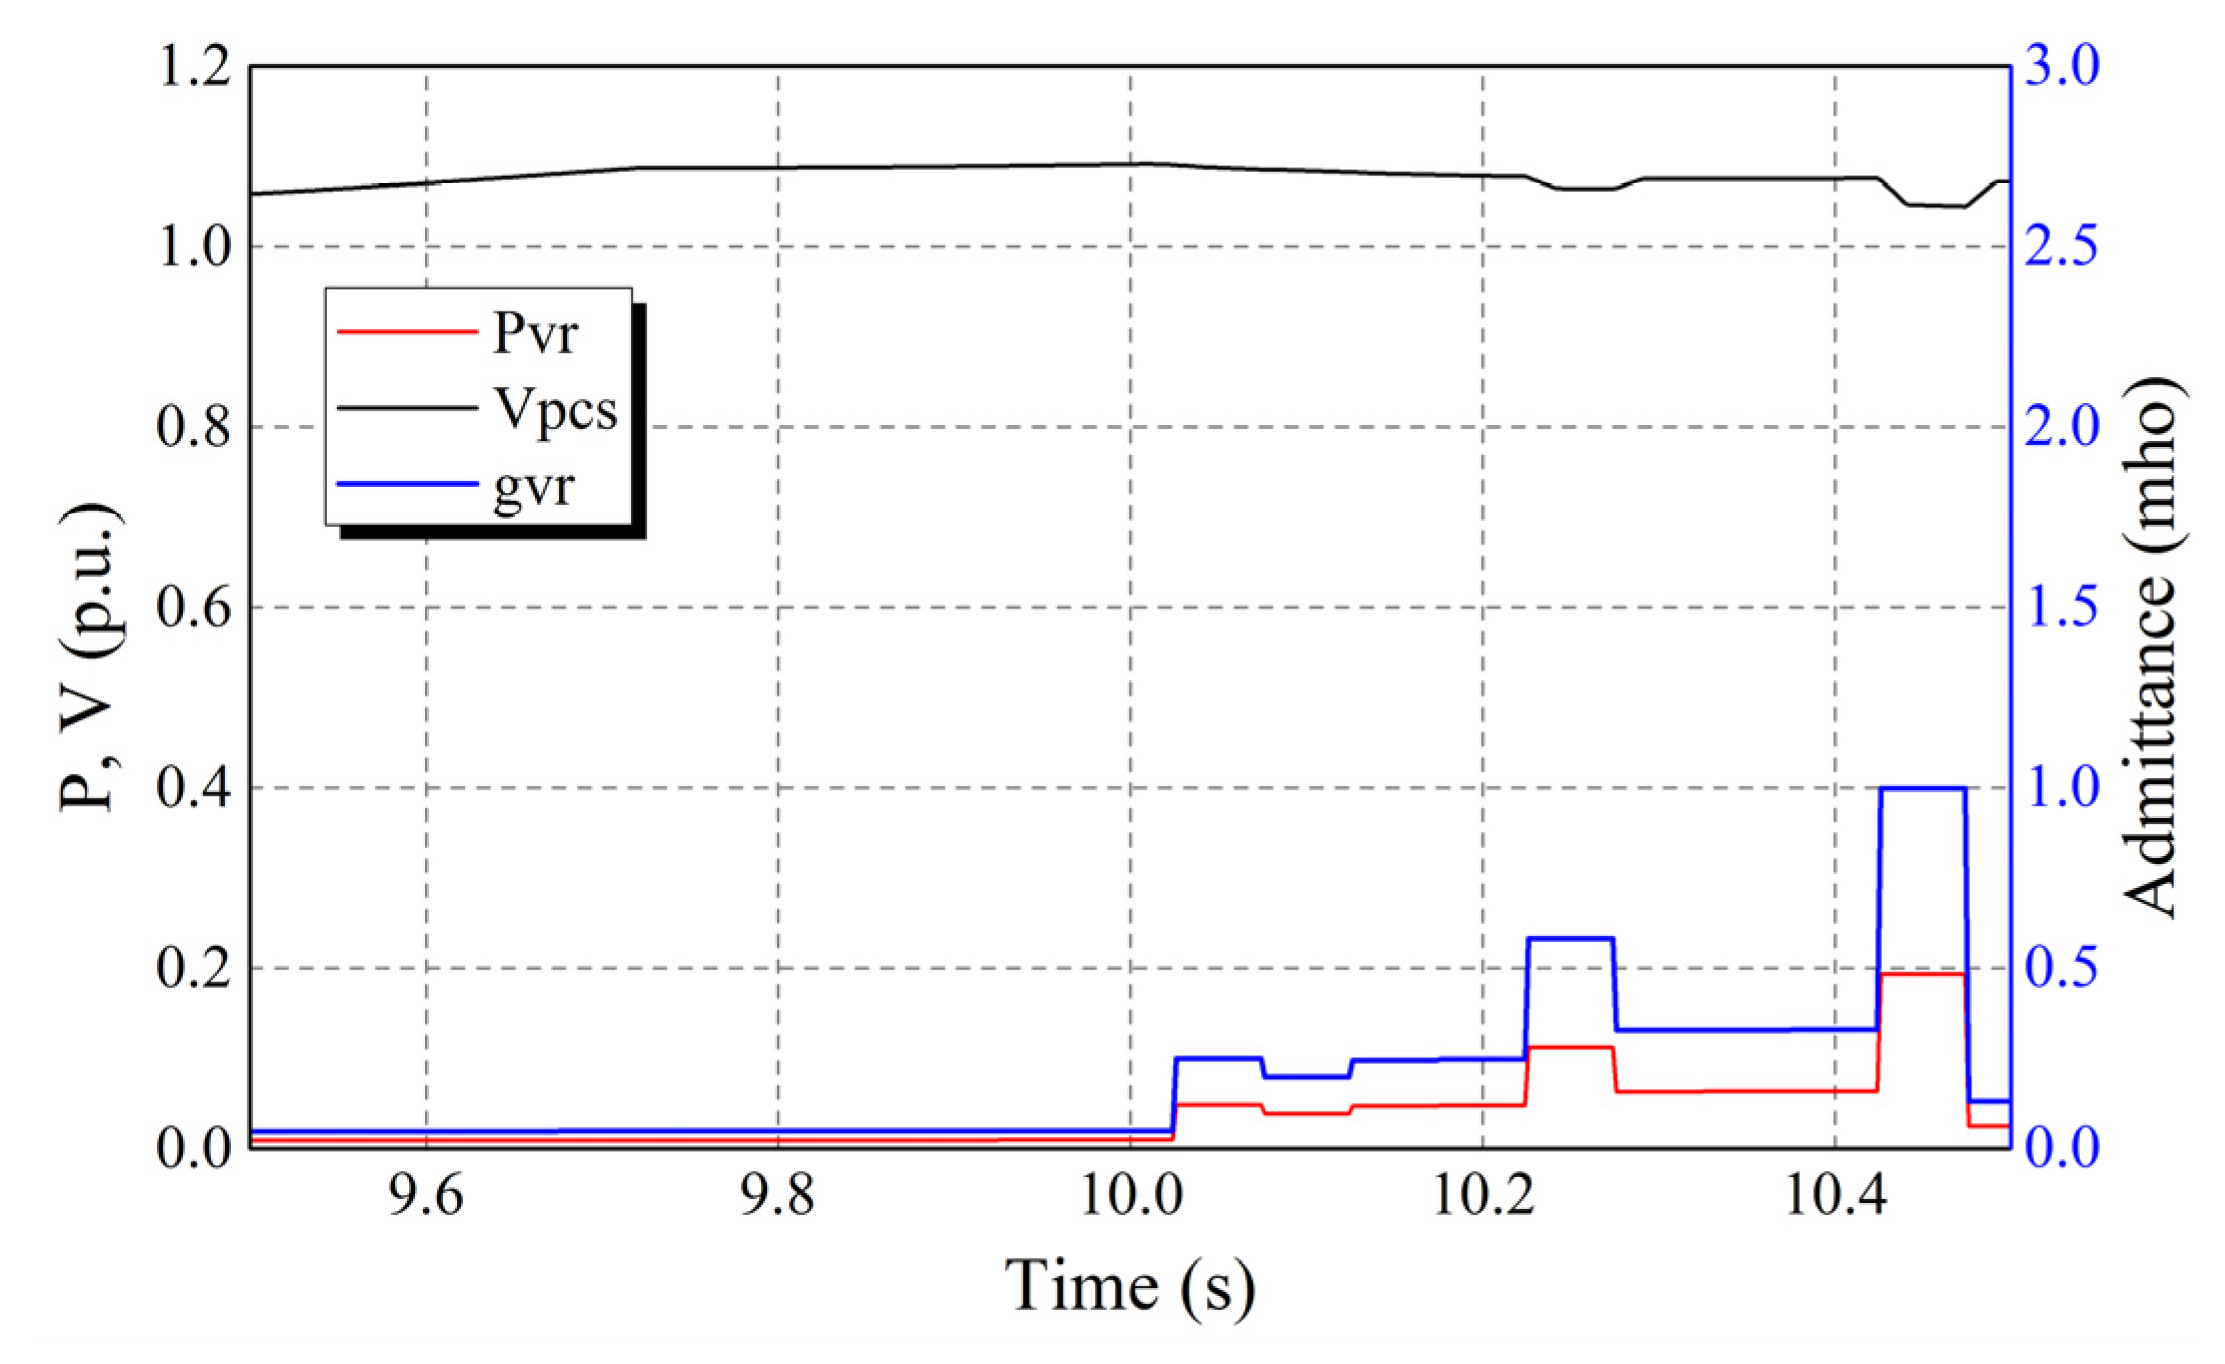
| Previous | 10.55–11 | 3.8404 | 20 | - | - | |
| Adopt | 10.55–11 | 3.924 | 15 | 193.31 | 0.9985 | |
| Improvement | 0.0836 | −5 | - | - | ||
5. Conclusions
Acknowledgments
Conflicts of Interest
References
- Kusiak, A.; Zheng, H.; Song, Z. Short-Term prediction of wind farm power: A data mining approach. IEEE Trans. Energy Convers. 2009, 24, 125–136. [Google Scholar] [CrossRef]
- Morales, A.; Robe, X.; Sala, M.; Prats, P.; Aguerri, C.; Torres, E. Advanced grid requirements for the integration of wind farms into the Spanish transmission system. IET Renew. Power Gener. 2008, 2, 47–57. [Google Scholar] [CrossRef]
- Dvorak, M.J.; Archer, C.L.; Jacobson, M.Z. California offshore wind energy potential. Renew. Energy 2010, 35, 1244–1254. [Google Scholar] [CrossRef]
- Ullah, N.R.; Bhattacharya, K.; Thiringer, T. Wind farms as reactive power ancillary service providers—Technical and economic issues. IEEE Trans. Energy Convers. 2009, 24, 661–672. [Google Scholar] [CrossRef]
- Liang, L.; Jianlin, L.; Dong, H. An optimal energy storage capacity calculation method for 100 MW wind farm. In Proceedings of the International Conference on Power System Technology, Hangzhou, China, 24–28 October 2010; pp. 1–4.
- Hartmann, B.; Dan, A. Cooperation of a Grid-connected wind farm and an energy storage unit—Demonstration of a simulation tool. IEEE Trans. Sustain. Energy 2012, 3, 49–56. [Google Scholar] [CrossRef]
- Dicorato, M.; Forte, G.; Trovato, M. Voltage compensation for wind integration in power systems. In Proceedings of the 3rd IEEE International Symposium on Power Electronics for Distributed Generation Systems (PEDG), Aalborg, Denmark, 25–28 June 2012; pp. 464–469.
- Wang, L.; Li, H.W.; Wu, C.H.T. Stability Analysis of an integrated offshore wind and seashore wave farm fed to a power grid using a unified power flow controller. IEEE Trans. Power Syst. 2013, 28, 2211–2221. [Google Scholar] [CrossRef]
- Stoutenburg, E.D.; Jacobson, M.Z. Reducing offshore transmission requirements by combining offshore wind and wave farms. IEEE J. Ocean. Eng. 2011, 36, 552–561. [Google Scholar] [CrossRef]
- Beerens, J. Offshore hybrid wind-wave energy converter system. Master’s Thesis, Delft University of Technology, Delft, The Netherlands, 26 February 2010. [Google Scholar]
- Hansang, L.; Hanmin, L.; Changmu, L.; Gilsoo, J.; Gildong, K. Energy storage application strategy on DC electric railroad system using a novel railroad analysis algorithm. J. Electr. Eng. Technol. 2010, 5, 228–238. [Google Scholar] [CrossRef]
- Kim, K.H.; Lee, K.; Sohn, J.M.; Park, S.W.; Choi, J.S.; Hong, K.Y. Conceptual design of 10 MW class floating wave-offshore wind hybrid power generation system. In Proceedings of the 25 International Offshore and Polar Engineering Conference, Kona, HI, USA, 21–26 June 2015.
- Bunjongjit, K.; Kumsuwan, Y.; Sriuthaisiriwong, Y. An implementation of three-level BTB NPC voltage source converter based-PMSG wind energy conversion system. In Proceedings of the TENCON 2014—2014 IEEE Region 10 Conference, Bangkok, Thailand, 22–25 October 2014; pp. 1–5.
- Aubry, J.; Ben Ahmed, H.; Multon, B. Sizing optimization methodology of a surface permanent magnet machine-converter system over a torque-speed operating profile: Application to a wave energy converter. IEEE Trans. Ind. Electron. 2012, 59, 2116–2125. [Google Scholar] [CrossRef]
- Rabiee, A.; Soroudi, A. Stochastic multiperiod OPF model of power systems with HVDC-connected intermittent wind power generation. IEEE Trans. Power Deliv. 2014, 29, 336–344. [Google Scholar] [CrossRef]
- Shin, H.J.; Choi, J.Y.; Park, Y.S.; Koo, M.M.; Jang, S.M.; Han, H. Electromagnetic Vibration Analysis and Measurements of Double-Sided Axial-Flux Permanent Magnet Generator with Slotless Stator. IEEE Trans. Magn. 2014, 50. [Google Scholar] [CrossRef]
- Van Cutsem, T.; Vournas, C. Voltage Stability of Electric Power Systems; Kluwer Academic Publisher: Norwell, MA, USA, 1998. [Google Scholar]
- Mousavi, O.A.; Bozorg, M.; Ahmadi-Khatir, A.; Cherkaoui, R. Reactive power reserve management: Preventive countermeasure for improving voltage stability margin. In Proceedings of the IEEE Power and Energy Society General Meeting, San Diego, CA, USA, 22–26 July 2012; pp. 1–7.
- Cardenas, R.; Pena, R.; Wheeler, P.; Clare, J.; Asher, G. Control of the reactive power supplied by a WECS based on an induction generator fed by a matrix converter. IEEE Trans. Ind. Electron. 2009, 56, 429–438. [Google Scholar] [CrossRef]
- Jasinski, M.; Dariusz, S.; Kazmierkowsk, M.P. Direct active and reactive power control of AC/DC/AC converter with permanent magnet synchronous generator for sea wave converter. In Proceedings of the International Conference on Power Engineering, Setubal, Portugal, 12–14 April 2007; pp. 78–83.
- Zhang, L.; Sun, K.; Xing, Y.; Feng, L.; Ge, H. A modular grid-connected photovoltaic generation system based on DC bus. IEEE Trans. Power Electron. 2011, 26, 523–531. [Google Scholar] [CrossRef]
- Eriksson, M.; Waters, R.; Svensson, O.; Isberg, J.; Leijon, M. Wave power absorption: Experiments in open sea and simulation. J. Appl. Phys. 2007, 102. [Google Scholar] [CrossRef]
- Wang, W.; Cheng, M.; Wang, Y.; Zhang, B.; Zhu, Y.; Ding, S.; Chen, W. A novel energy management strategy of onboard supercapacitor for subway applications with permanent-magnet traction system. IEEE Trans. Veh. Technol. 2014, 63, 2578–2588. [Google Scholar] [CrossRef]
- Pujante-López, A.J.; Gómez-Lázaro, E.; Fuentes-Moreno, J.A.; Molina-García, A.; Vigueras-Rodríguez, A. Performance comparison of a 2 MW DFIG wind turbine model under wind speed variations. In Proceedings of the European Wind Energy Conference and Exhibition, Marseille, France, 16–19 March 2009.
- Nayak, O.B.; Gole, A.M.; Chapman, D.G.; Davies, J.B. Dynamic performance of static and synchronous compensators at an HVDC inverter bus in a very weak AC system. IEEE Trans. Power Syst. 1994, 9, 1350–1358. [Google Scholar] [CrossRef]
© 2015 by the authors; licensee MDPI, Basel, Switzerland. This article is an open access article distributed under the terms and conditions of the Creative Commons by Attribution (CC-BY) license (http://creativecommons.org/licenses/by/4.0/).
Share and Cite
Jung, S.; Yoo, Y.; Kim, H.; Lee, J.-H.; Yoon, M.; Jang, G. Development of an Active Power Reserve Management Method for DC Applied Wave-Wind Combined Generation Systems. Energies 2015, 8, 12488-12504. https://doi.org/10.3390/en81112321
Jung S, Yoo Y, Kim H, Lee J-H, Yoon M, Jang G. Development of an Active Power Reserve Management Method for DC Applied Wave-Wind Combined Generation Systems. Energies. 2015; 8(11):12488-12504. https://doi.org/10.3390/en81112321
Chicago/Turabian StyleJung, Seungmin, Yeuntae Yoo, Hyunwook Kim, Jae-Hyeong Lee, Minhan Yoon, and Gilsoo Jang. 2015. "Development of an Active Power Reserve Management Method for DC Applied Wave-Wind Combined Generation Systems" Energies 8, no. 11: 12488-12504. https://doi.org/10.3390/en81112321