Article

Mapping and Measuring European Local Governments’ Priorities for a Sustainable and Low-Carbon Energy Future

1
Institute for Housing and Urban Development Studies (IHS), Erasmus University Rotterdam (EUR), Burgemeester Oudlaan 50, Rotterdam 3062PA, The Netherlands
2
Department of Industrial Management and Technology, University of Piraeus, Karaoli and Dimitriou 80,18534 Piraeus, Greece
3
Dutch Research Institute for Transitions (DRIFT), Erasmus University Rotterdam (EUR), Burgemeester Oudlaan 50, Rotterdam 3062PA, The Netherlands
*
Author to whom correspondence should be addressed.
Energies 2015, 8(10), 11641-11666; https://doi.org/10.3390/en81011641
Submission received: 6 August 2015 / Accepted: 8 October 2015 / Published: 16 October 2015

Abstract

:
The main objective of this article is to assess the priorities of local governments (LGs) in Europe regarding climate change mitigation technologies evaluation in the electricity sector and to provide important insights for energy policy design. The study applies a hybrid weighting methodology to elicit LGs’ preferences in a constructive and iterative way regarding the evaluation criteria of low-carbon energy technologies. Furthermore, the study employs three data collection and preference elicitation methods, namely: survey, workshop, and webinar. The study was conducted across thirty one (31) European LGs that were categorized according to three variables: population size, geographical region and gross domestic product (GDP) per capita. The analysis shows that “CO2 emissions” is the most important criterion among European LGs, followed by “mortality and morbidity” and “ecosystem damages”. The results illustrate the potential synergies of climate and energy policies for addressing both CO2 emissions and air pollution. It was also found, based on a correlation analysis, that LGs with higher GDP per capita tend to provide higher weights to criteria related to security of energy supply and technological innovation. The current study provides insights on the actual LGs’ priorities that are important to consider during low-carbon energy technologies evaluation and energy policy design. Interestingly, the results of the European LGs’ preferences clearly show that the EU climate policy objectives have reached different levels of governance—and at this particular case, the local level. Furthermore, the developed methodology could be applied at different geographical regions to map other regions’ LG priorities, but also at a group decision making context to elicit relevant stakeholders’ preferences regarding low-carbon energy technologies and policy objectives.

1. Introduction

The dominant policy paradigm for global climate change in the last decade has, to a large extent, adopted a top-down approach. State, regional, and local governments (LGs) develop and carry out climate change policies, programmes, and actions developed through dialogues at the international, supra-national, and national policy levels. There is considerable evidence, however, that many LGs are agenda setters, front runners, and pioneering innovators in terms of climate change initiatives [1]. In the long run, LGs, which can establish and implement climate change mitigation action plans in their own jurisdictions, will play substantial roles to reverse the rise of global greenhouse gas (GHG) emissions [2,3].
The concentration of GHG emissions in the atmosphere should be limited to 450 ppm to remain within the safe threshold of global average temperature of no more than 2 degrees centigrade [4]. The global climate change policy architecture, which was built under this assumption, led to binding agreements wherein the main emitters commit to limit their GHG emissions by certain levels according to their historic responsibilities and capacities to mitigate.
The European Union (EU) climate change policy, with its sustainability targets, has been considered as the most ambitious among the main emitters so far. The so called “20-20-20” targets for 2020 aim to reduce GHG emissions, increase renewable energy production, and increase energy efficiency by 20% in 2020. The EU 2030 Strategy aims to achieve even more ambitious climate change mitigation targets, such as 40% GHG emissions reduction compared to 1990 levels [5]. As outlined in its roadmap to a low-carbon economy, the European Union aims to reduce GHG emissions by 80%–95% by the year 2050 compared with 1990 levels [5].
Important policy and investment decisions should be made regarding the current and future energy technologies that will be deployed in the coming years and decades [6]. At the local level, cities and municipalities have come up with their own energy initiatives and low-carbon strategies [7]. The Covenant of Mayors (CoM), a network of local and regional authorities committed to the implementation of sustainable energy policies, has been established and more than 4000 signatories have pledged their commitments and outlined their specific actions through their Sustainable Energy Action Plans [8].
Centralized power supply is the conventional way of delivering electricity services. Large-scale power plants fueled by coal, natural gas, or nuclear technology are constructed to provide high voltages into the electricity grid [9]. With the advancement of renewable energy technologies, discussions on whether cities can become more independent from distant energy sources or whether they could produce their own energy have arisen [10].
Low-carbon energy technologies, which range from solar photovoltaics to carbon capture and storage, vary in technological maturity, industry status, and market potential. Each one has its corresponding advantages and disadvantages as well as constraining and facilitating factors in development and implementation [11]. Also, a wide range of technologies are in the process of research, development, and demonstration.
Prior to implementation, there are several techno-economic approaches, which provide quantitative cost results, for assessing low-carbon energy technologies and policies [12,13,14,15]. A number of studies and projects which investigate the externalities of energy, attempt to quantify emissions of electricity technologies, and monetize their respective external costs have emerged. In these undertakings, several methods were developed and systematic efforts were made to assess the environmental impacts of electricity production expressed in monetary units [16,17].
There is also an emerging load of studies focusing on the assessment of abatement potentials combined with estimated costs of certain electricity technologies [14,18,19]. Although techno-economic studies provide useful information on abatement costs of mitigation technologies, they do not consider other important factors relevant to policy implementation, such as socio-political and public acceptance issues, security of energy supply, stakeholders’ preferences, and local communities’ priorities. Despite the conduct of detailed research towards the evaluation and assessment of climate abatement technologies, there are still major gaps in reconciling and quantifying other local co-benefits or co-impacts [20].
An important challenge for climate policy would be the alignment and coordination of climate policies and priorities at the local, national and international levels [21]. It is important to consider local communities’ preferences and perceptions when designing climate and energy policies. The acceptance or rejection of these policies or actions, to a large extent, will depend on the consideration of local priorities and their contribution to local sustainability and resilience [22]. It has been found that there is a clear contradiction between the EU and national renewable electricity policies and the responses at the local level due to context-specific conditions and interests that pose barriers to the implementation of climate policies [23].
As energy policy and planning aims at achieving different sustainability objectives, it becomes necessary to integrate economic, environmental and social dimensions in the process [24,25]. Furthermore, many authors underline the importance of considering energy resilience aspects as a component of a sustainable energy future [26,27]. An ideal future energy system should be able to reduce the negative impacts on the environment and natural resources, create opportunities for economic and social development, enhance its capacity to absorb external disruptions [6], consider a long-term perspective [28], increase participation [29], and contribute to greater sustainability.
In the above-mentioned framework, it is considered essential to be able to identify and assess LGs’ priorities within a sustainable energy planning context. Therefore, it is necessary to involve the LGs and other relevant actors and to consider their preferences in the energy planning process [30,31]. In this respect, the legitimacy of the process is significantly improved and better chances of actual implementation can be achieved [32].
Various studies have demonstrated that the multi-attribute model, one of the main multiple criteria decision analysis practices, provides a normative and practical method in supporting people to understand and construct their preferences among alternatives [32,33,34]. Differences in respondents’ priorities could be explained by the relative importance (weight) they assign on each impact criterion. The current study developed and applied a methodology for eliciting criteria weights that reflect LGs’ sustainability priorities regarding the deployment of future low-carbon energy technologies.
Although different authors have emphasized the importance of considering LGs’ views [30,35], no empirical evidence exists in the literature regarding any measurement of European LGs’ priorities and preferences. In this context, the main objective of this article is to assess the European LGs’ priorities that would provide important insights for energy policy with regard to climate change mitigation in the electricity sector. The results of this study would provide insights on LGs’ priorities that should be considered during the development, planning and implementation of climate mitigation and energy policy. The study aims at addressing the following questions:
-
Which are the main priorities of European LGs regarding low-carbon energy technologies assessment and planning?
-
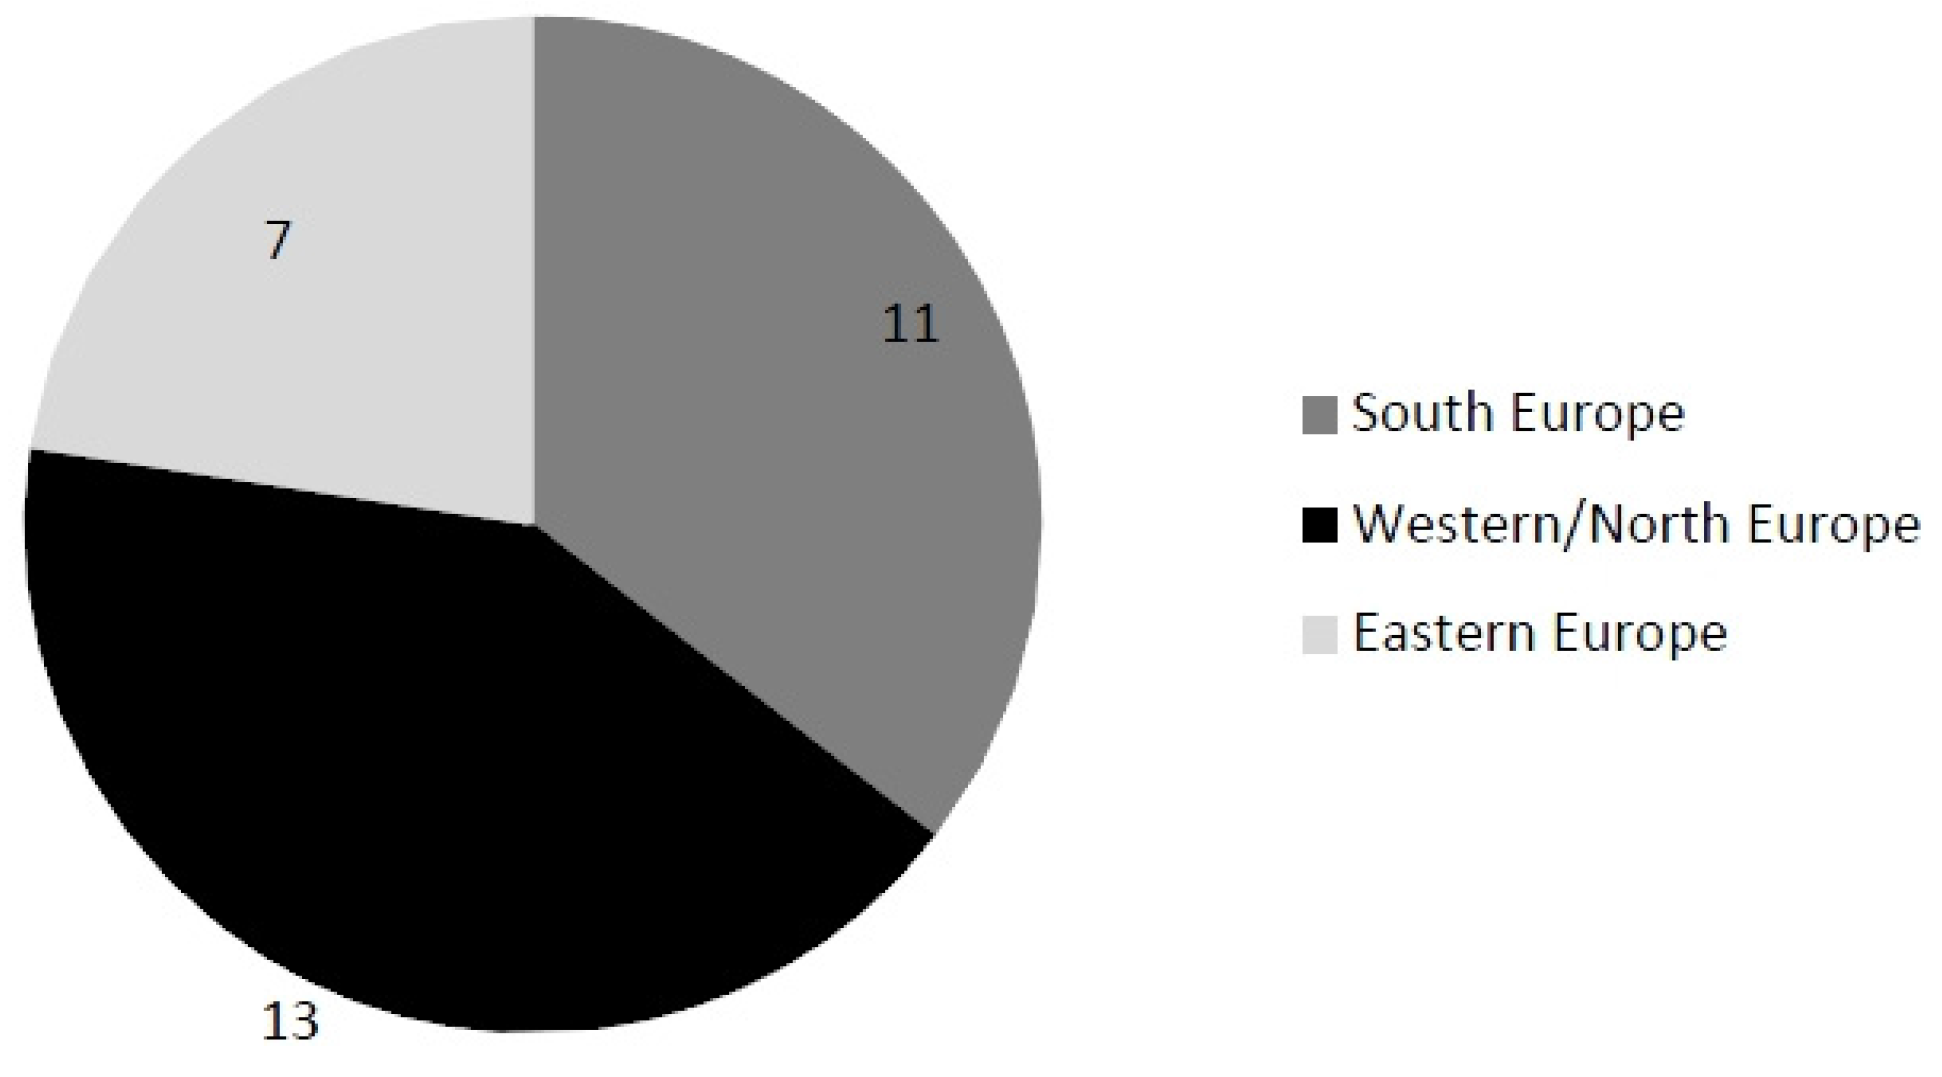
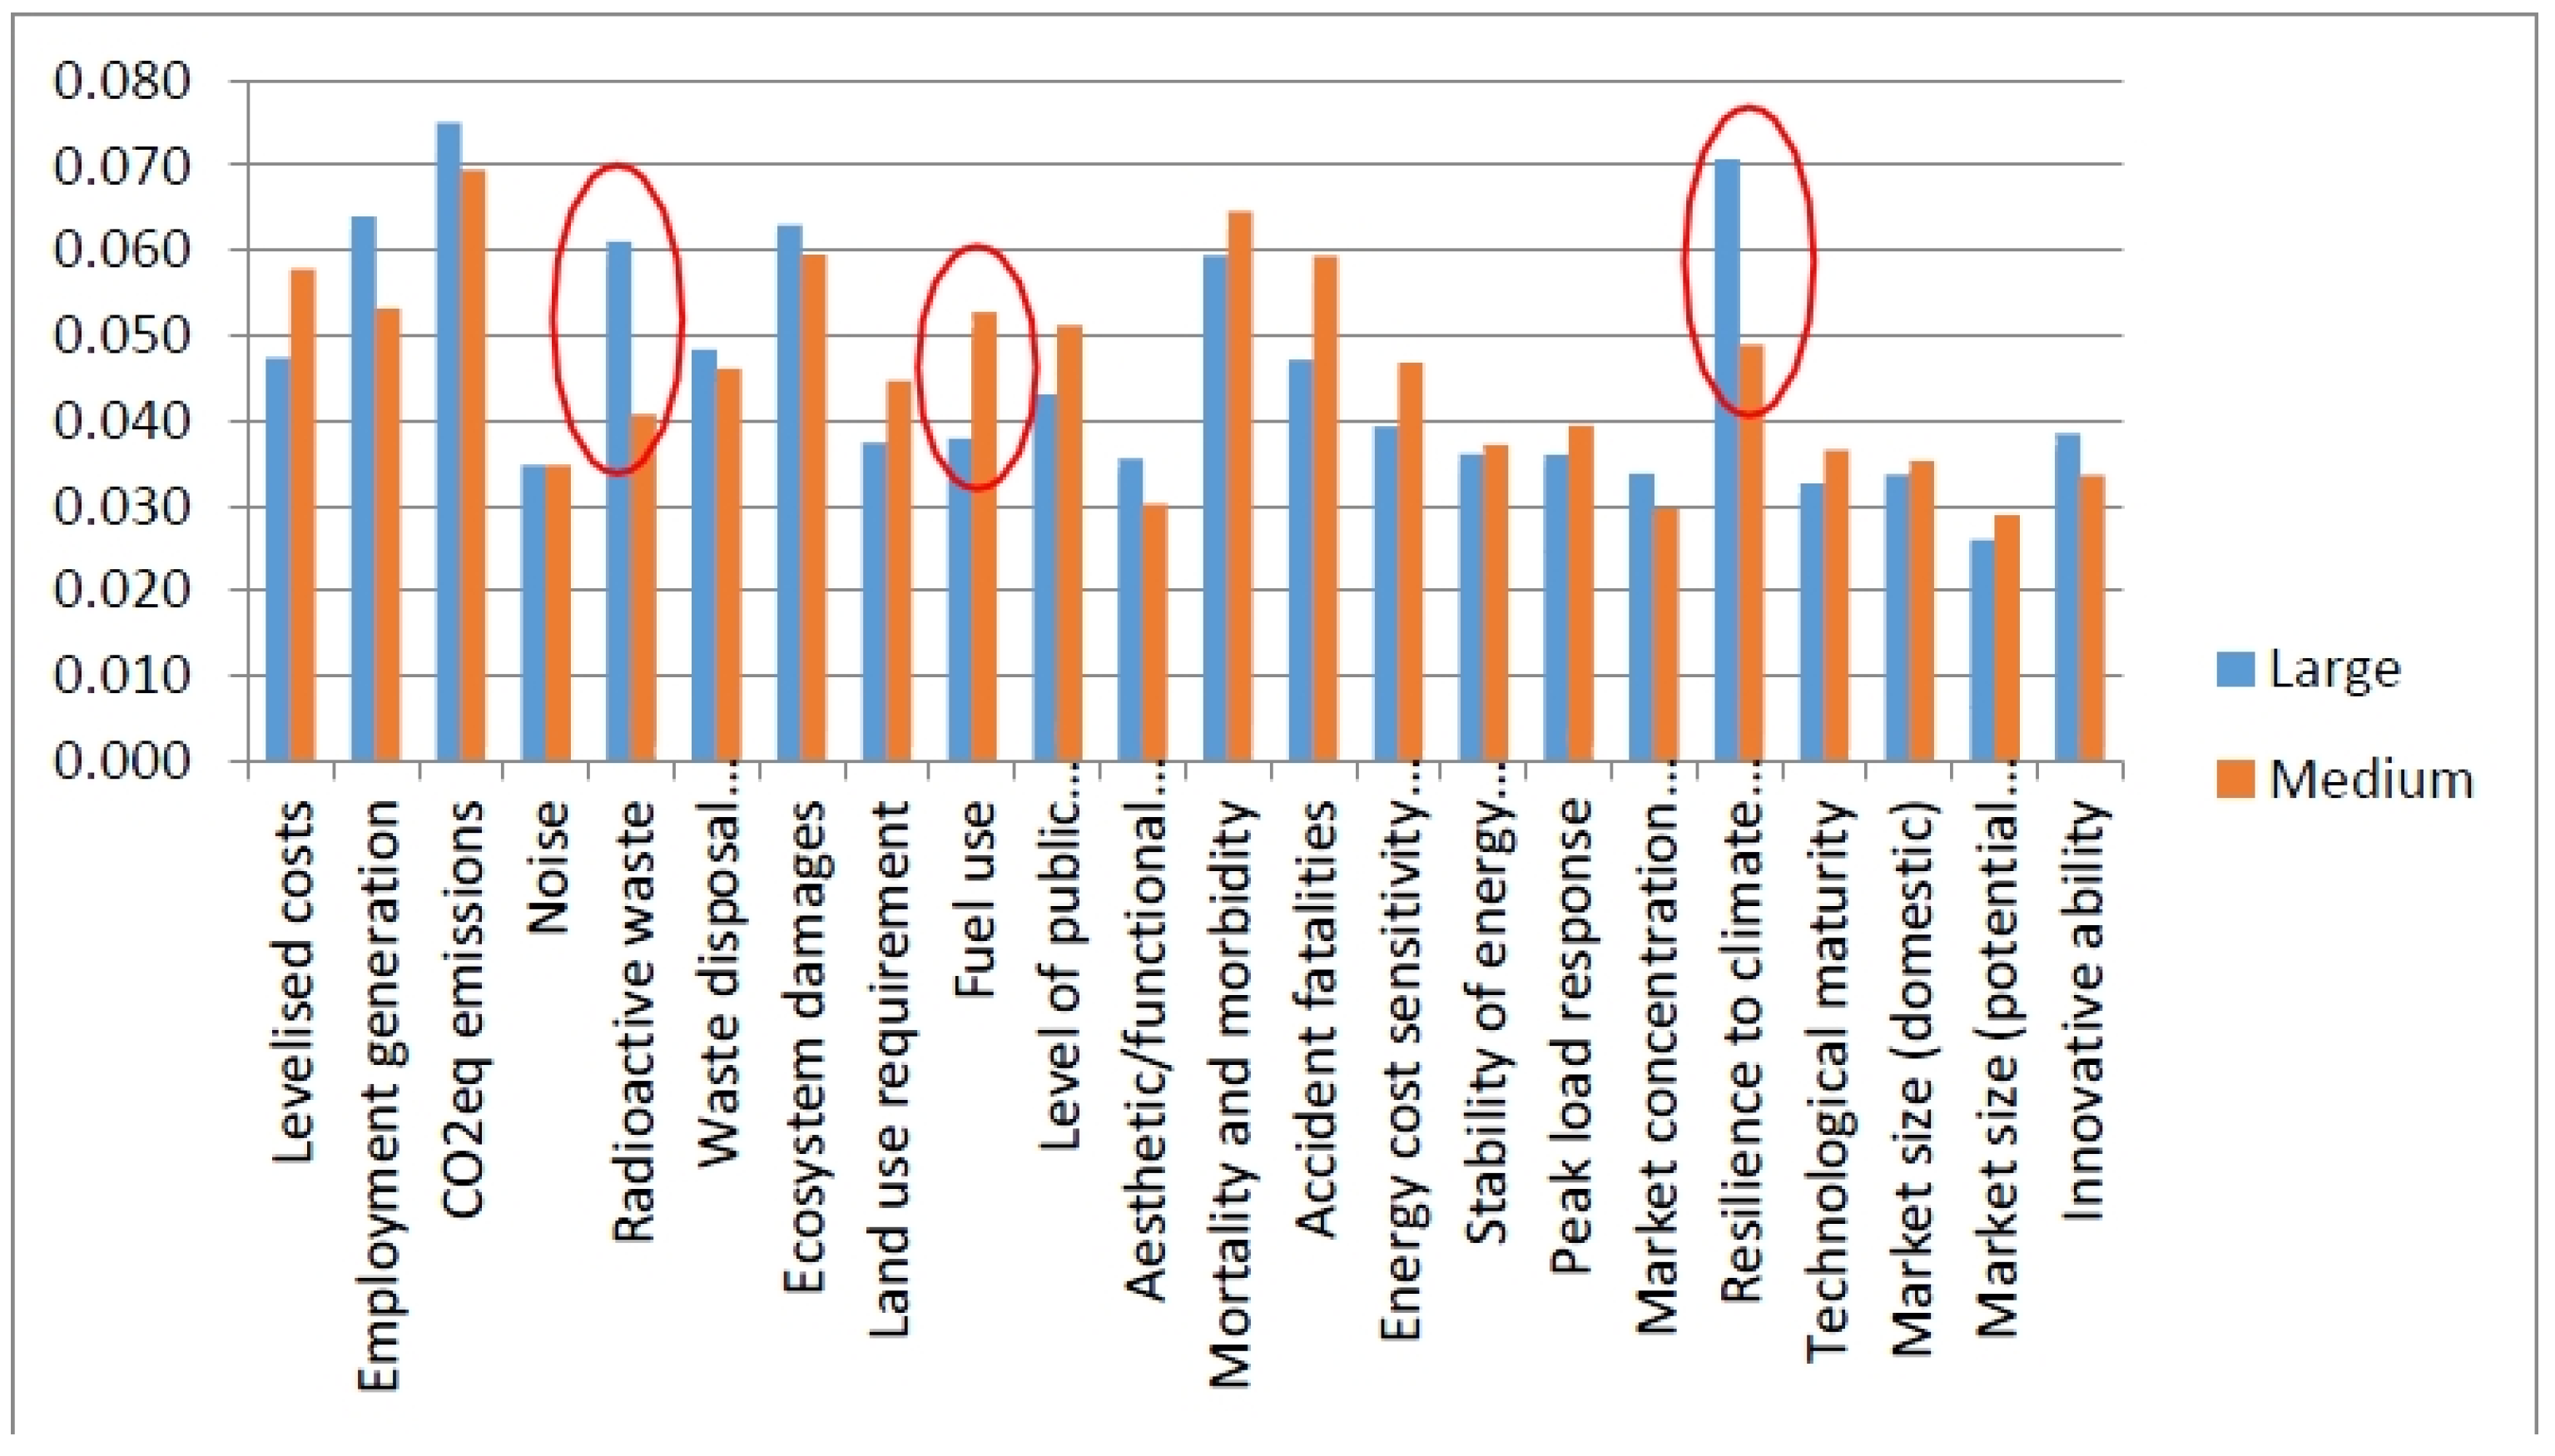
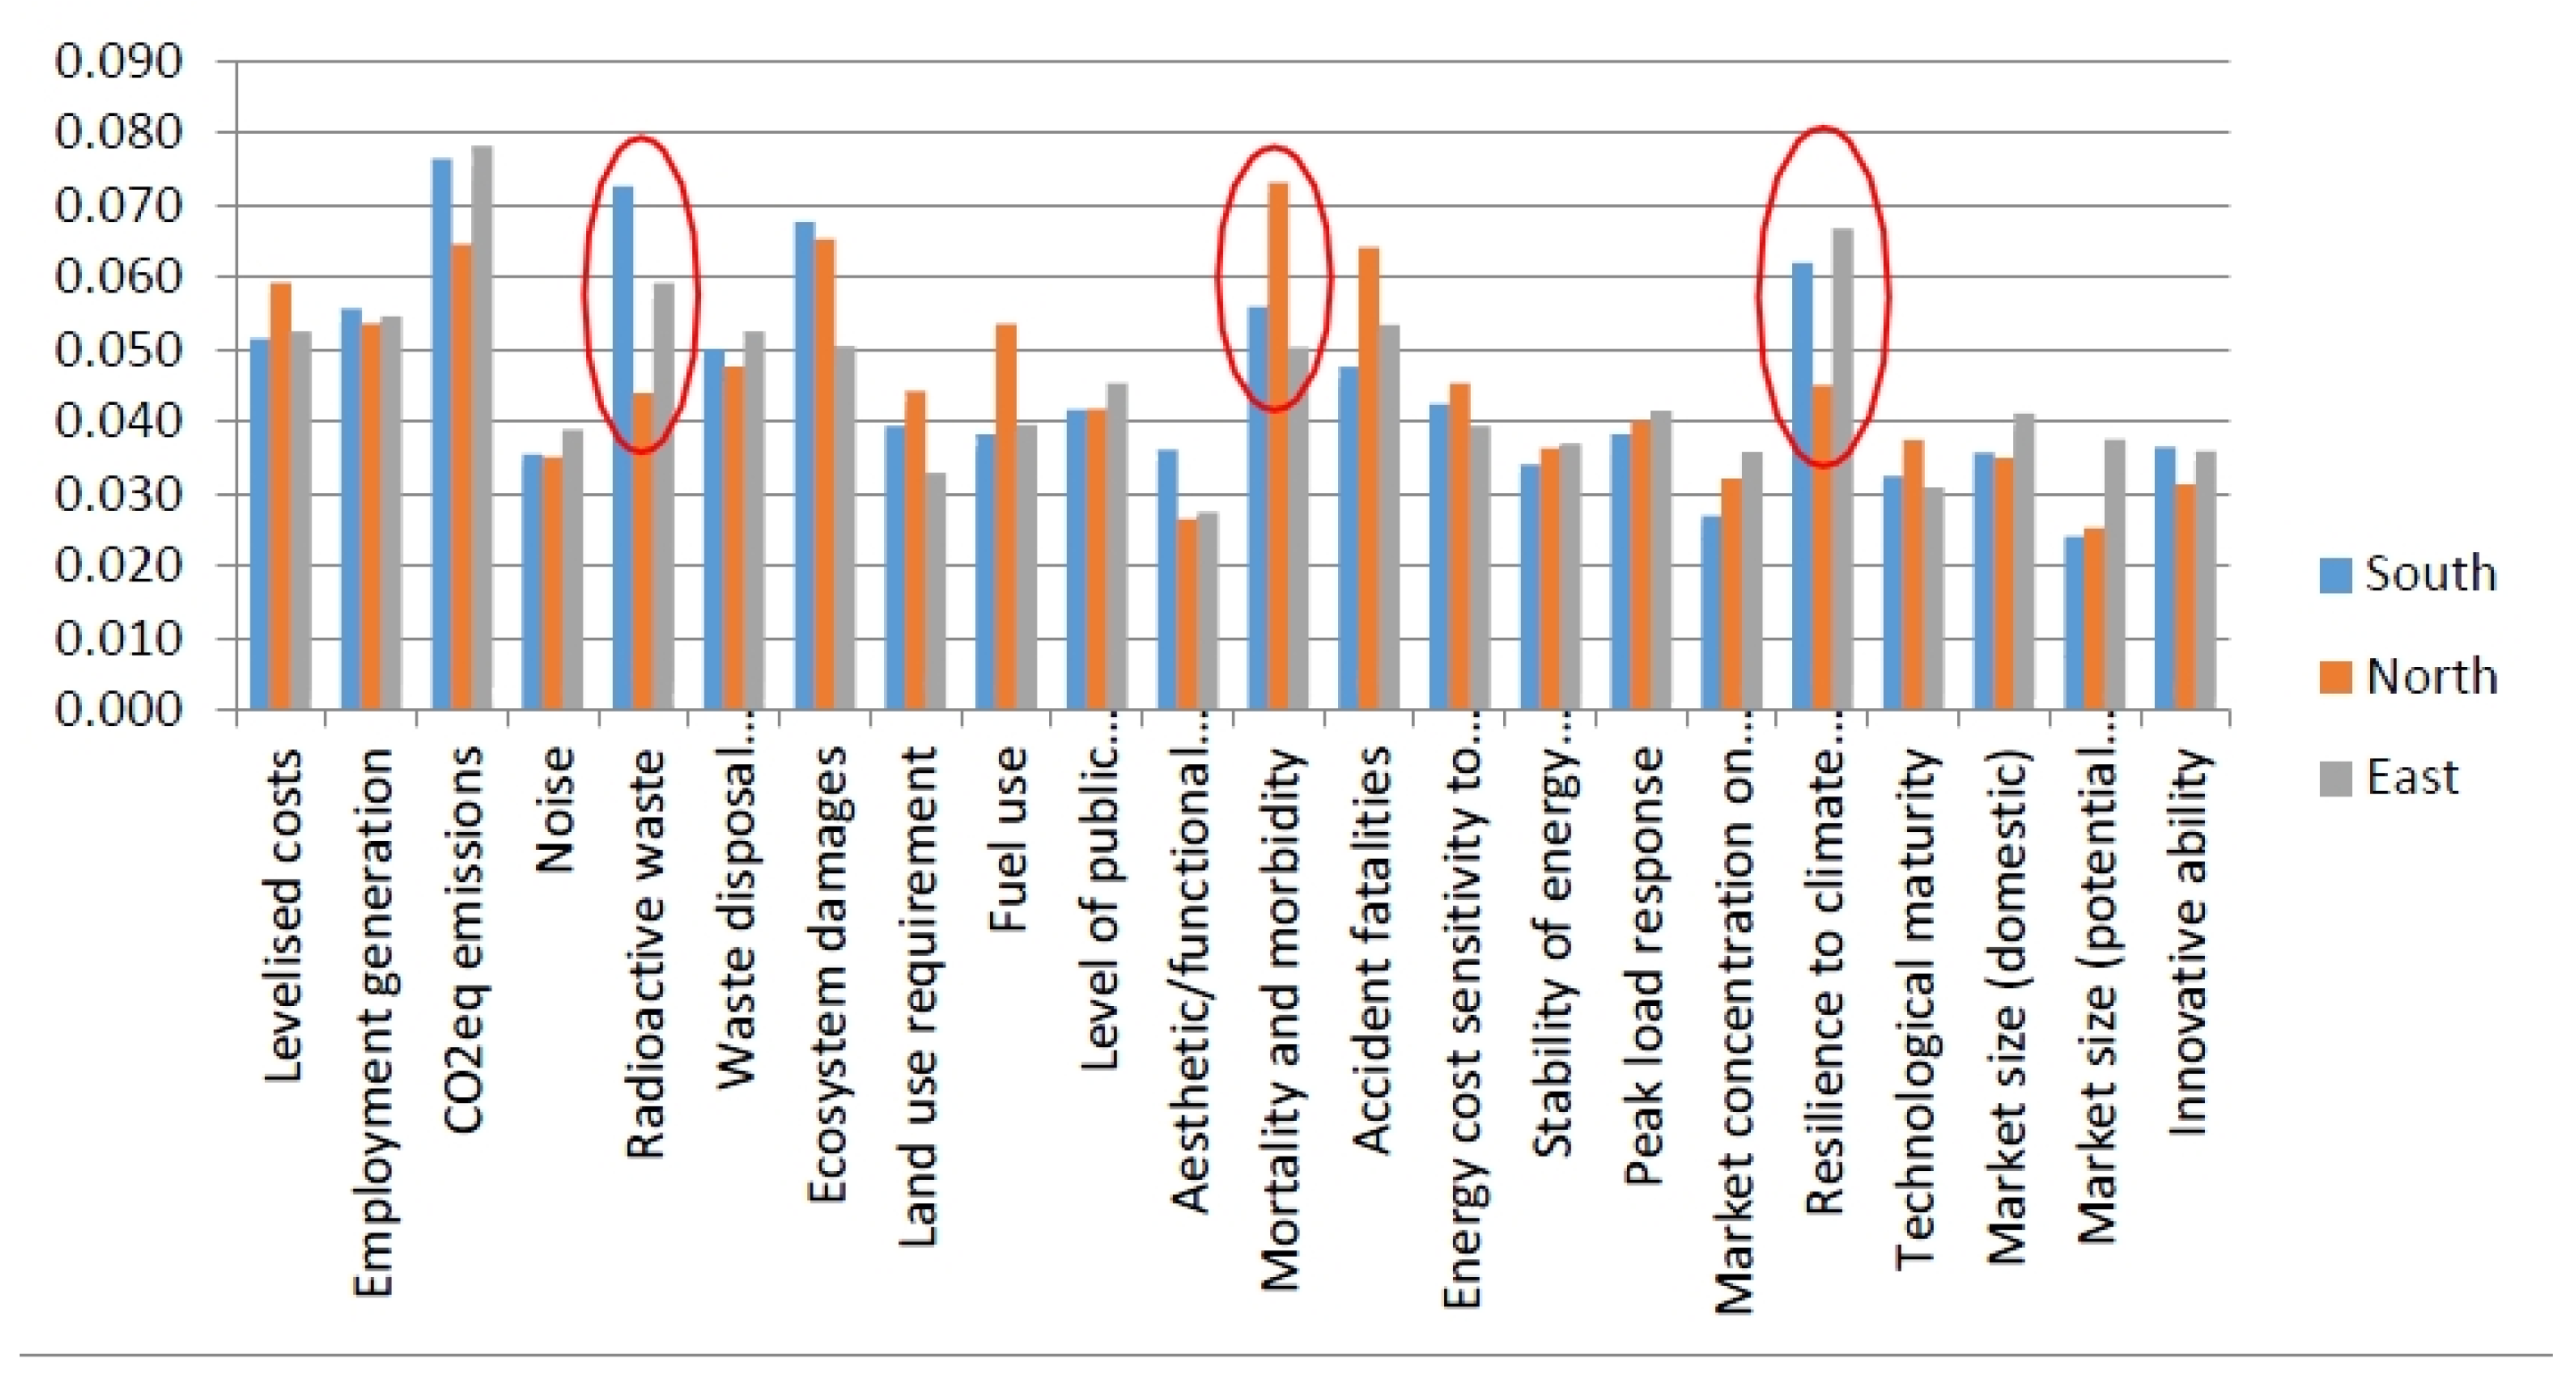
Which are the most important sustainability criteria (priorities) of European LGs according to population size and geographical region?
-
What is the relationship between different LGs priorities but also between LGs priorities and their GDP per capita?
The article is structured as follows: Section 2 discusses the context of assessment that consists of the energy technologies under investigation and the selected evaluation criteria (priorities). Section 3 focuses on the methodological tools that were employed in the study to collect and analyse empirical data. Section 4 presents the results of the study regarding the LGs’ priorities and energy options that meet these priorities. Furthermore, Section 4 presents how the priorities of LGs differ between various evaluation criteria categories. Section 5 discusses the results’ implications for climate and energy policy and future research directions as well.

2. Defining the Assessment Problem

For this study, the ten (10) reference electricity generation technologies (see Appendix A) under investigation for the year 2030 in Europe are as follows: integrated gasification combined cycle (IGCC) coal, IGCC coal with carbon capture and storage (CCS), gas turbine combined cycle (GTCC), GTCC with CCS, Nuclear European Pressure Water Reactor (EPR), wind onshore, wind offshore, solar photovoltaics (PVs), hydropower, and biogas combined heat and power (CHP). These energy technologies under investigation were selected from a review of current and future energy technologies that could reduce carbon emissions in Europe [36].
The assessment of different reference electricity technologies that would be employed by the year 2030 in Europe requires the consideration of different aspects, impacts, costs and benefits that the implementation of technologies would cause to multiple actors. These impacts could range from global, such as GHG emissions, to local, such as health impacts due to air pollution.
Multiple actors and stakeholders that might be affected by the decision of certain energy technologies should be involved in the decision making process and their preferences and priorities should be considered and incorporated for the evaluation of energy technologies. This type of complex, multi-factor, multi-agent assessment problem is congruous with a multiple criteria decision analysis process.
Multiple Criteria Analysis (MCA), particularly using multi-attribute models, has been widely applied in environmental, energy, and risk decision making. However, even though it is recognized as a valid and sound decision making analysis approach [37], its application in the field of climate change policy assessment remains relatively limited albeit its increasing use [21,35]. Recently, other authors provided a more detailed review of MCA applications in climate change policy [37,38].
Two main features of MCA makes this approach adequate for analyzing LGs’ priorities regarding sustainability objectives of future energy systems. Firstly, MCA allows the simultaneous consideration of multiple criteria (attributes) that are relevant to a set of alternative options—or energy options in our case. The multiple criteria could span from broad sustainability objectives to local and national priorities related to energy planning. Secondly, MCA facilitates the active engagement of relevant stakeholders through the process of criteria selection and weighting. It is particularly the systematic and structured weighting process that allows the elicitation of respondents’ priorities and preferences. Combined use of different methods and provision of technical support during the entire process result into minimization of potential biases, enhance appropriate use of the MCA methods, and facilitate confident expression of respondents’ preferences [38,39]. It is this specific process of criteria weights elicitation of LGs that our study focuses on.
The study followed five (5) stages for selecting and validating the evaluation criteria:
-
Literature review
-
Screening of initially selected indicators
-
Self—validation (desk study and internal peer review)
-
Scientific validation (survey of external experts’ views)
-
Stakeholders’ validation (survey of local stakeholders’ views)

2.1. Literature Review of Sustainability Evaluation Criteria and Initial Screening

The selection of evaluation criteria and indicators was based on an extensive literature review of studies in the field of energy planning and integrated sustainability assessment of energy options. During the selection process, the evaluation criteria had to meet certain conditions, such as operationality, value relevance, decomposability, reliability, measurability, non-redundancy, minimum in size, completeness, understandability, preferential independence, comprehensiveness, directness and unambiguousness, geographical coverage, local context and data availability [38,40,41].

Selection of Evaluation Criteria

One of the main features of MCA assessment process is the selection of evaluation criteria relevant to the problem at hand. In our context of the evaluation of low-carbon energy technologies, we select criteria that have been identified in the literature. The weights of evaluation criteria that are elicited by the LGs reflect their priorities regarding the evaluation of low-carbon energy technologies.

Economic Category

Investment cost is a commonly used economic criterion that has been presented in many studies. Many studies also support the inclusion of job creation in the evaluation of energy projects [42,43], particularly in the local context [23,35]. The creation of employment opportunities is a key priority in the European context since high unemployment rates have become a concern among many European countries and cities after the financial crisis of 2008. Various studies [44,45] have also emphasized the importance of low energy prices as it is important to maintain the standard of living of citizens.

Environmental Category

The significance of SOx and NOx emissions reductions, land requirements, waste creation and disposal, including hazardous waste, and landscape impact have been highlighted by different authors [45,46,47,48,49] as important environmental aspects to be taken into account. CO2 emissions is an important criterion due to its contribution to global climate change, but also due to the risk component regarding the potential for development of carbon pricing. It is therefore important to be able to account for the vulnerability of energy technologies to increase in energy prices due to the potential for uptake of carbon prices [27].

Social Category

The NEEDS Project aimed to identify relevant social indicators through participative procedures [50,51,52]. Mortality and morbidity, accident fatalities, public opposition risk, and aesthetic/functional impact have been highlighted as prominent social criteria.

Energy System Resilience Category

In several studies, energy criteria focus on resilience aspects of the energy systems [27,45], such as energy price stability, security for energy supply, low energy prices, stability of energy generation and peak load response [53]. Energy price stability should be taken into account as the electricity sector is vulnerable to price fluctuations due to various factors, such as production outputs, policy matters, natural disasters, and unstable geopolitics. Security of energy supply could be increased by taking advantage of local renewable energy sources [12]. The issue of climate resilience hasn’t been addressed yet by any sustainability framework for the evaluation criteria of energy technologies. However, it has been highlighted as a major issue by recent studies [54,55].

Technological—Market Category

The potential for commercialization has been considered in the assessment. Studies (e.g., [56]) have underlined the significant role of potential market size in industrial competitiveness. The market size—whether domestic or international—needs to be taken into account. A larger market size would naturally attract investments which would facilitate industrial development. Table 1 shows the selected evaluation criteria and their description.
Table 1. Final set of selected and validated evaluation criteria and indicators.
Criteria CategoriesIndicatorsDescription
EconomicECO1: Levelized costs (including capital, operations and maintenance, fuel costs)Levelized costs of energy (LCOE): investment costs, operational and maintenance costs, capacity factor, efficiency, material use.
ECO2: (Local) employment generationThe extent to which the application of the technology can create jobs at the investment, operation and maintenance stage. Furthermore, the criterion of employment reflects partly the extent of the impact that the technology has to the local economic development by providing jobs and generating income.
EnvironmentalENV1: CO2eq emissionsThe indicator reflects the potential impacts of global climate change caused by emissions of GHGs for the production of 1 kwh.
ENV2: Noise pollutionThis indicator is case sensitive and could have been measured as a factor of the noise generation by the energy technology estimated in dB multiplied by the number of people affected by the noise. However, since we are investigating different energy technologies and systems at a European scale we cannot measure precisely this indicator and therefore we will use an ordinal relevant scale to measure the perceived noise.
ENV3: (Radioactive) wasteAmount of (radioactive) waste generated by the plant divided by energy produced.
ENV4: Waste disposal (infrastructure)Waste generation during the life cycle of the fuel and technology or availability of waste disposal infrastructure.
ENV5: Ecosystem damagesThis criterion quantifies the impacts of flora and fauna due to acidification and eutrophication caused by pollution from the production of 1 kWh electricity by the energy system and technology.
ENV6: Land use requirementThe land required by each power plant and technology to be installed.
ENV7: Fuel useAmount of fuel use per kWh of final electricity consumption.
SocialSOC1: Level of public resistance/oppositionEnergy system induced conflicts that may endanger the cohesion of society (e.g., nuclear, wind, CCS). Opposition might occur due to the perceptions of people regarding the catastrophic potential or other environmental impacts (aesthetic, odor, noise) of the energy technology/system. This indicator also integrates the aspect of participatory requirement for the application of the technology. The higher the public opposition, the higher the participatory requirement is.
SOC2: Aesthetic/functional impactPart of population that perceives a functional or aesthetic impairment of the landscape area caused by the energy system. The aesthetic impairment is judged subjectively and therefore this criterion fits in the social category rather than the environmental one. In addition this is also a very location specific indicator and therefore an average metric will be determined measured in relative ordinal scale.
SOC3: Mortality and morbidityMortality and morbidity due to air pollution caused by normal operation of the technology. This indicator is considered as an impact and composite indicator since it integrates all human health impacts caused from air pollution emissions as NOx, SO2, and PM.
SOC4: Accidents and fatalitiesLoss of lives of workers and public during installation and operation. Surrogate for risk aversion. This criterion partly integrates the catastrophic potential of the energy system/technology.
Energy system resilienceENE1: Energy cost stability/sensitivity to fuel price fluctuationThe sensitivity of technology costs of electricity generation to energy and fuels prices fluctuations. The fraction of fuel cost to the overall electricity generation cost.
ENE2: Stability of energy generationStability of output of electric power generated depending on the technology used. This reflects whether the energy supply is being interrupted. The presence of these interruptions impacts the electricity network stability. This criterion reflects whether the energy supply faces any interruptions due to the type of energy technology.
ENE3: Peak load responseTechnology specific ability to respond swiftly to large variation of demand in time/% representing the possibility to satisfy the required load.
ENE4: Market concentration on supply The market concentration on the supply of primary sources of energy that could lead to disruption due to economic or political reasons.
ENE5: Resilience to climate changeThe degree of resilience of the energy technology to the future climactic changes and extreme weather events.
Technological/marketTEC1: Technological maturityThe extent to which the technology is technically mature. The criterion refers to the level of technology’s technological development and furthermore the spread of the technology at the market.
TEC2: Market size (domestic)Demand for final products (of energy technologies) and potential market size domestically. The potential market size plays an important role to establish industrial competitiveness and stimulate economic growth.
TEC3: Market size (potential export)Demand for final products (of energy technologies) and potential market size internationally.
TEC4: Innovative abilityFlexibility and potential of the technology to integrate technological innovations.

2.2. Three Stages of Validation of Evaluation Criteria

A set of 33 criteria was derived after self-validation (desk study and internal peer review) by the authors. For scientific validation (survey of external experts’ views), ten (10) European experts in energy planning were involved for refinement and feedback of the criteria. These experts have published in scientific journal publications, and were personally invited through e-mail communication to carry out the scientific validation. After the completion of the refinement, the set of criteria was cut down to 23.
For the final stage of validation, which was a stakeholders’ validation (survey of local stakeholders’ views), local governments, energy industry representatives, researchers and academics, staff of energy utility companies, etc., were asked to improve the set of evaluation criteria and indicators under investigation. These local energy stakeholders, which were drawn from online databases, mailing lists, and energy networks, were invited through e-mail communication. In total, thirty (30) local energy stakeholders from different European countries participated.
The results of the stakeholders’ validation established the wide acceptance of the indicator set among the local stakeholders who participated in the process [36]. The final stage of validation provided a final list of 22 evaluation criteria which is presented in Table 1. For the criteria that data was available, quantifiable indicators were defined. On the other hand, for criteria that data was not available, a relative ordinal scale was developed [36].

3. Methodology

The overall applied methodology consists of: (i) the hybrid weighting process that was developed for systematic and constructive elicitation of respondents’ preferences and (ii) the methods that were employed for the collection of empirical data.

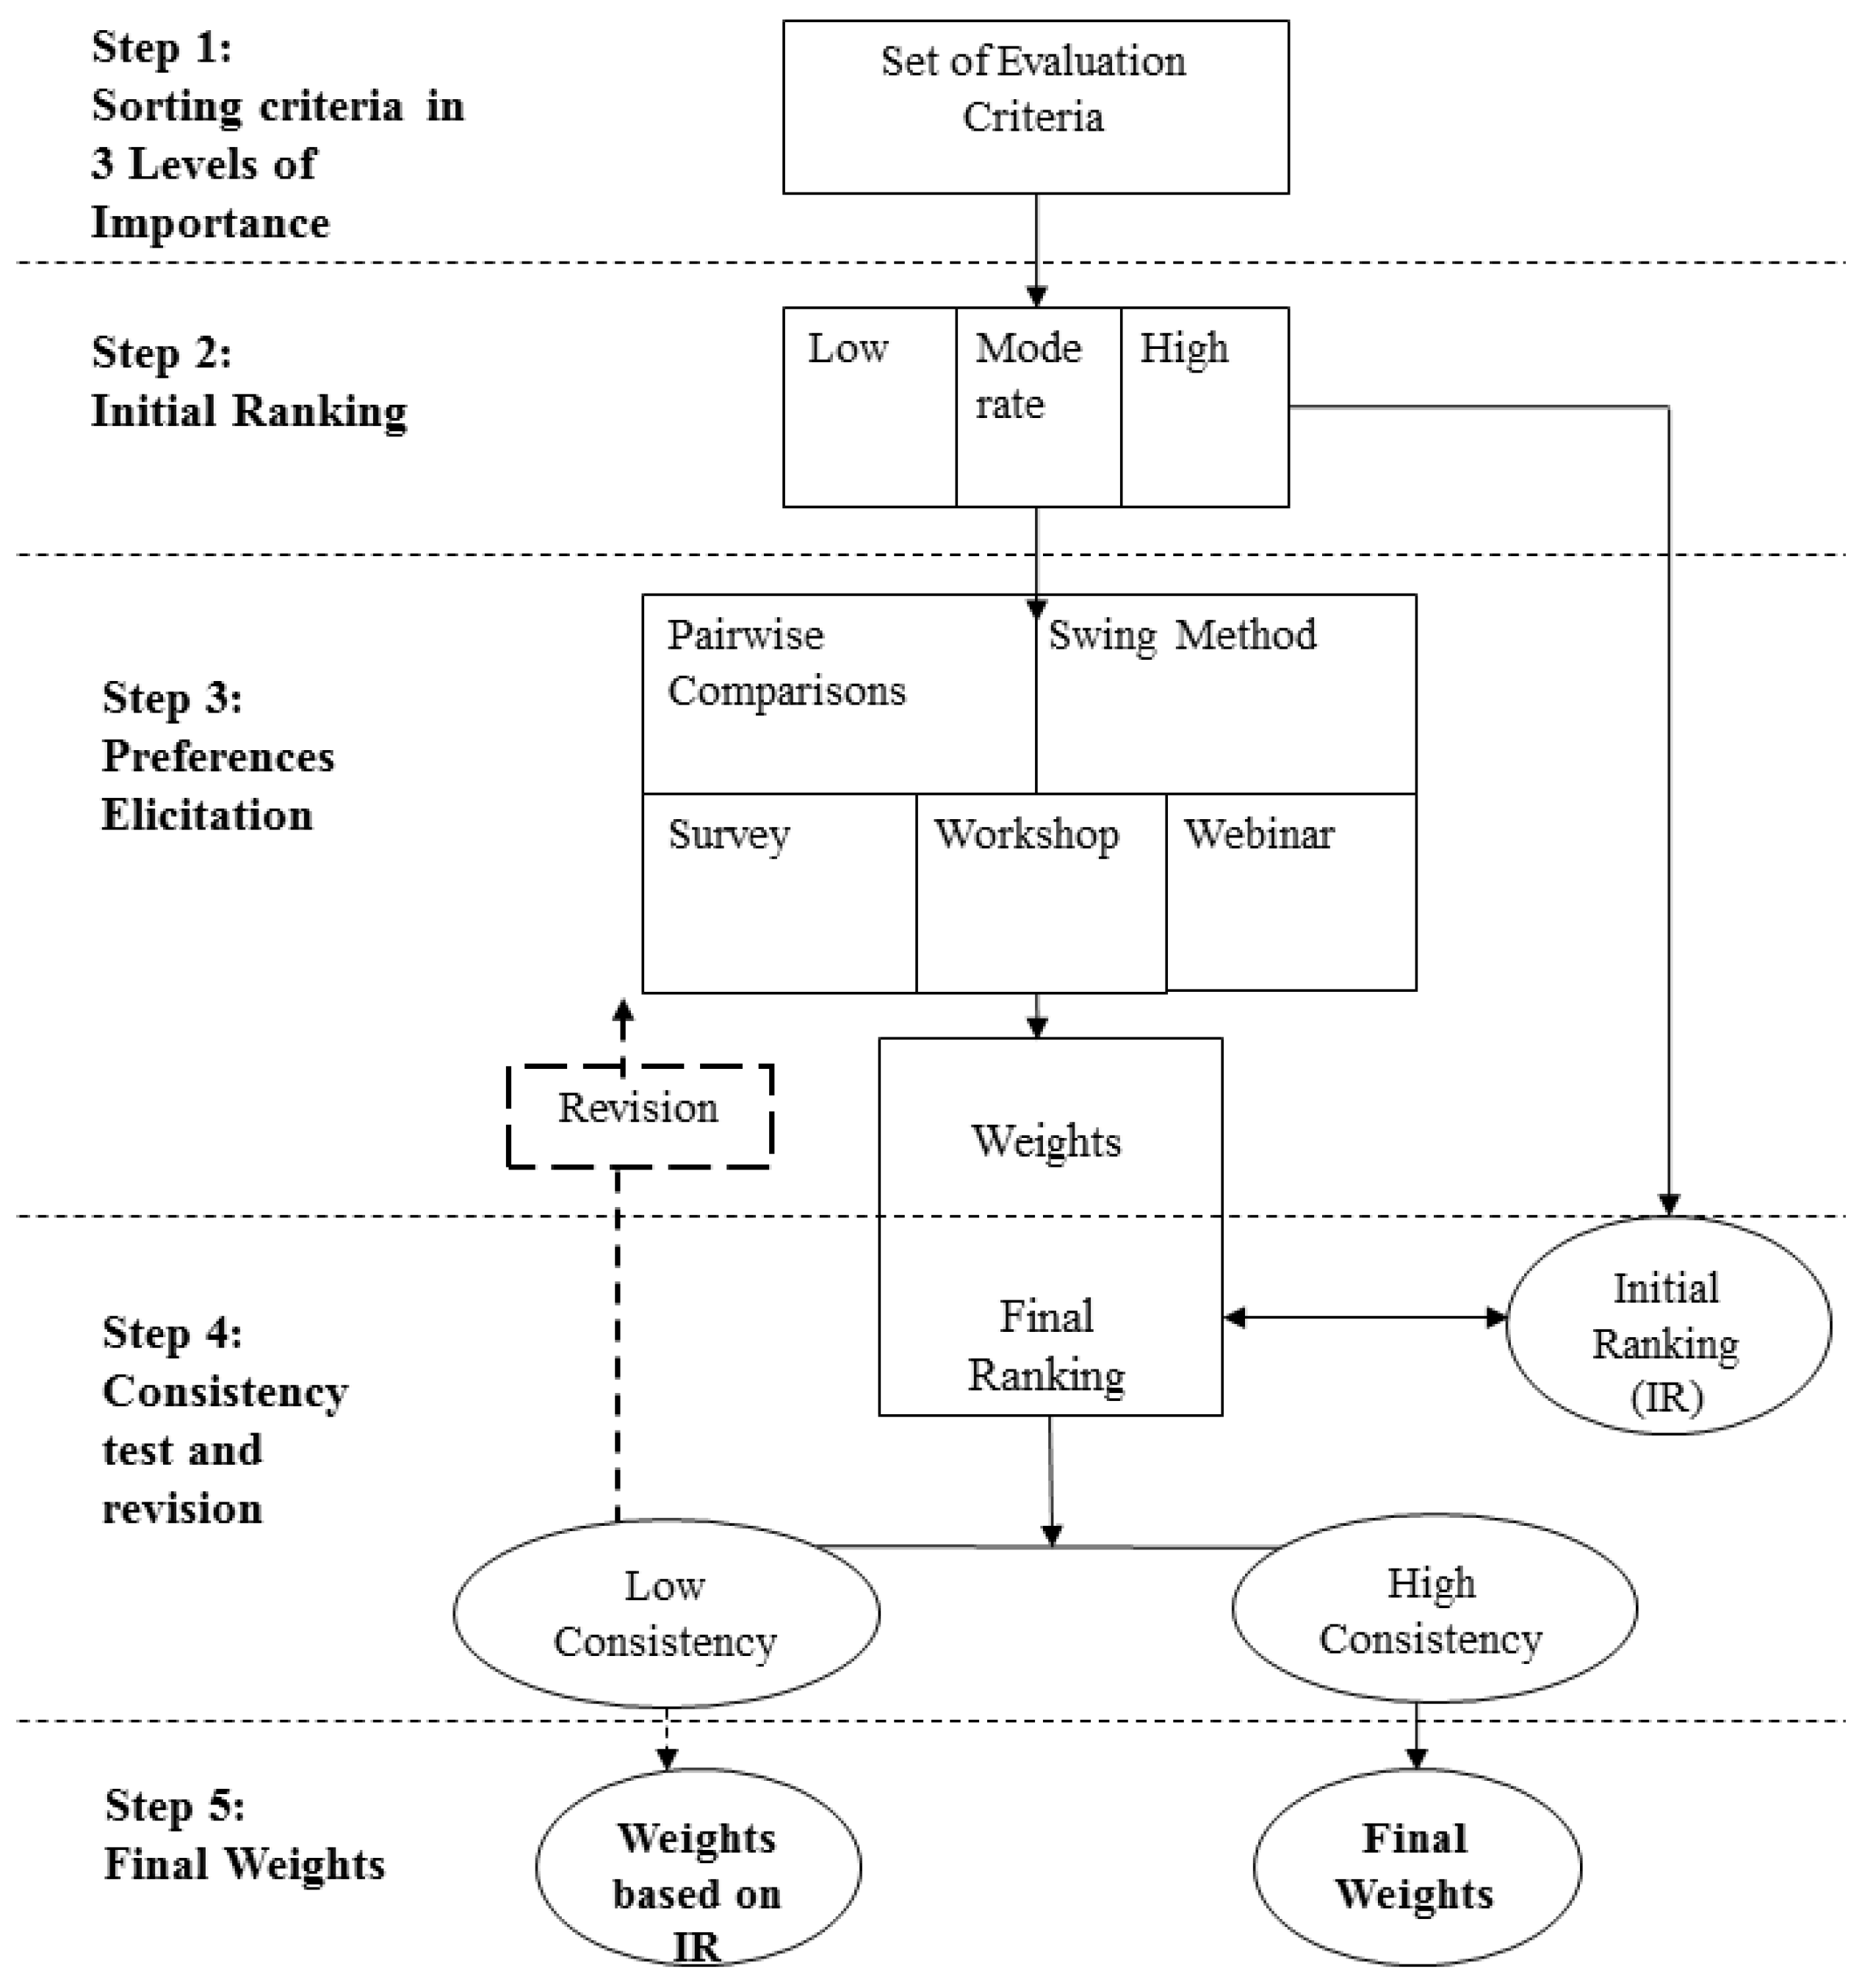
3.1. Weighting Preferences Elicitation Approach

A hybrid constructive weighting methodology, which combined different ranking and weighting methods, was employed to elicit and analyze stakeholders’ preferences. The different elements of the hybrid weighting methodology have been developed and explained in recent publications by the authors [36,38]. The current hybrid methodology strengthens the flexibility of the preferences elicitation approach by applying the appropriate method according to the different context, while at the same time utilizes a systematic iterative process. The hybrid weighting preferences elicitation process consists of the following steps (Figure 1):
  • Step 1: Criteria Sorting: The respondents were asked to rate and distribute the evaluation criteria according to their level of importance in three groups: low, moderate, and high. The aim of this step was to break down the large number of criteria in three manageable sub-groups to gradually reduce the cognitive burden of the respondents.
  • Step 2: Initial Ranking: The second step introduces a simple initial ranking step for stakeholders to get familiar with the notion of criteria importance. For each level (group) of importance, the respondents carried out direct ranking by assigning numbers (1 as the most important criterion; 2 as the second most important criterion, and so forth till the least important criterion). The criteria were presented to the respondents by highlighting the worst and best performance of each criterion and the impact range (the difference between the worst and best performance). The criteria rankings of the three (3) different levels of criteria importance were consolidated in one overall criteria ranking.
  • Step 3: Weighting Preferences Elicitation: The weighting preferences elicitation process utilized two identical and compatible MCA weighting techniques that are both consistent with Multi-Attribute Value Theory (MAVT) which treats weights as scaling factors [40]. Respondents might feel more comfortable by using one weighting technique in favor of another, therefore the provision of the different weighting elicitation techniques enhances the flexibility of process according to respondents’ preferences [39]. The techniques that were used are:
    • Pairwise comparisons: A series of pair-wise comparisons based on an abbreviated format (i.e., a–b, b–c, c–d, etc.) [36,38] was utilized. The respondents expressed their preferences in three steps for a smooth and gradual elicitation of their preferences: (a) verbally; (b) numerically as well as (c) graphically. The values obtained from the pairwise comparisons are normalized in criteria weights (percentages).
    • Swing method: As the worst and best scores based on the selected evaluation criteria for each alternative energy technology were presented, respondents carefully look at the potential gains from moving from worst to best performance and then decide which of the criteria they want to first shift to best performance. As the first swing is valued at 100 units on a hypothetical value scale, the stakeholders assign a value (<100) to the second criterion they want to move to its best performance, then to the third and so forth until the last criterion is moved to its best performance. Likewise, the values obtained from this swing weighting process are normalized in criteria weights (percentages).
The weighting survey tool enabled the generation of criteria weights as well as a final ranking based on the weighting results. Survey respondents were able to observe the relative scores and weighting factors as well as their graphical representation and visualization.
  • Step 4: Consistency Test and Revision: The elicitation of weighting preferences included a consistency test and possibility for revision. The ranking derived from the weighting preferences’ elicitation step (either through pairwise comparisons or swing method) was compared with the initial ranking. A consistency check, which is based on Spearman’s rank order correlation coefficient, was generated. The survey respondents were asked to revise their preferences should the consistency index is below the consistency threshold value (0.7). If the consistency index equaled to or exceeded the threshold value, the weighting process was completed (step 5). Otherwise, the respondents had to revise the initial ranking or the weighting preferences elicitation to achieve high consistency [36].
  • Step 5: Final Weights Elicitation: The weights of the respondents who have achieved high consistencies as well as those who have preferred the weights elicitation process were retained and considered as final weights. In cases where respondents achieved low consistency, and they expressed preference of the initial ranking, the elicitation of weights was determined taking into account only the initial ranking. The initial ranking that has been preferred by the respondent was used to obtain numerical weights from the rank order using the rank sum method [57].
Figure 1 illustrates the main steps of the hybrid weighting preferences elicitation methodology that was employed to obtain respondents’ priorities.
Figure 1. Schematic representation of the hybrid weighting preferences’ elicitation methodology.
Energies 08 11641 g001
The study utilized the linear weighted summation method expressed in the aggregation additive rule to determine the overall value of each energy technology. The selection of aggregation procedure is consistent with the weighting methods used which utilizes the criteria weights as scaling factors [40,58].

3.2. Data Collection Methods

A computer-aided excel tool was developed to enable and guide the LGs to provide their preferences for the evaluation criteria. The respondents were able to see automatically-generated graphs of the weighting results and were requested to indicate the level of their actual preferences’ representation by the results. Different data collection methods were utilized to obtain empirical data from LGs:
-
Survey: LGs that were participating in the Covenant CapaCITY project were included in the list of potential participants. In addition, through an extensive review of SEAP-related databases, such as the CoM of the European Commission and the Carbonn of ICLEI, major European cities were identified and their LGs contacted either by email or phone. LG representatives were offered the option to fill in the excel tool with guidance and support from the research team. Twenty (20) LGs responded out of 100 that were contacted (20% response rate) and one of these was a representative of a LGs’ association.
-
Face to face workshop: A face to face workshop was conducted within the framework of the Covenant CapaCITY project, wherein LG representatives from different cities were invited to participate. In total, 18 participants filled out the excel tool under close guidance by the research analysts. Seven (7) out of the 18 participants were LG representatives.
-
Webinar: Furthermore, as part of the Covenant CapaCITY project activities, a two-stage webinar was organized for European energy local stakeholders and LGs to participate in the survey and to discuss the results interactively. In total, twenty five (25) participants were involved in the interactive webinar, wherein five (5) were LG representatives.
The study was participated in by a total of 32 respondents. Thirty one (31) respondents were representatives of European LGs, while one (1) respondent was a representative of an LG association. The study was supported by the Intelligent Energy Europe (IEE) project, Covenant CapaCITY, and the ICLEI—Local Governments for Sustainability, European Secretariat (ICLEI Europe).
For the analysis, the European LGs were categorized according to their population size (large, medium-sized), geographical region (Western, Eastern, Northern, and Southern Europe), and GDP per capita. Secondary data on the GDP per capita and population size were obtained from the Eurostat (EU-28) and the World Bank (non EU countries). Due to the fact that data on GDP per capita was not available at the local level, we obtained and used data for the same indicator at the regional level.

4. Results

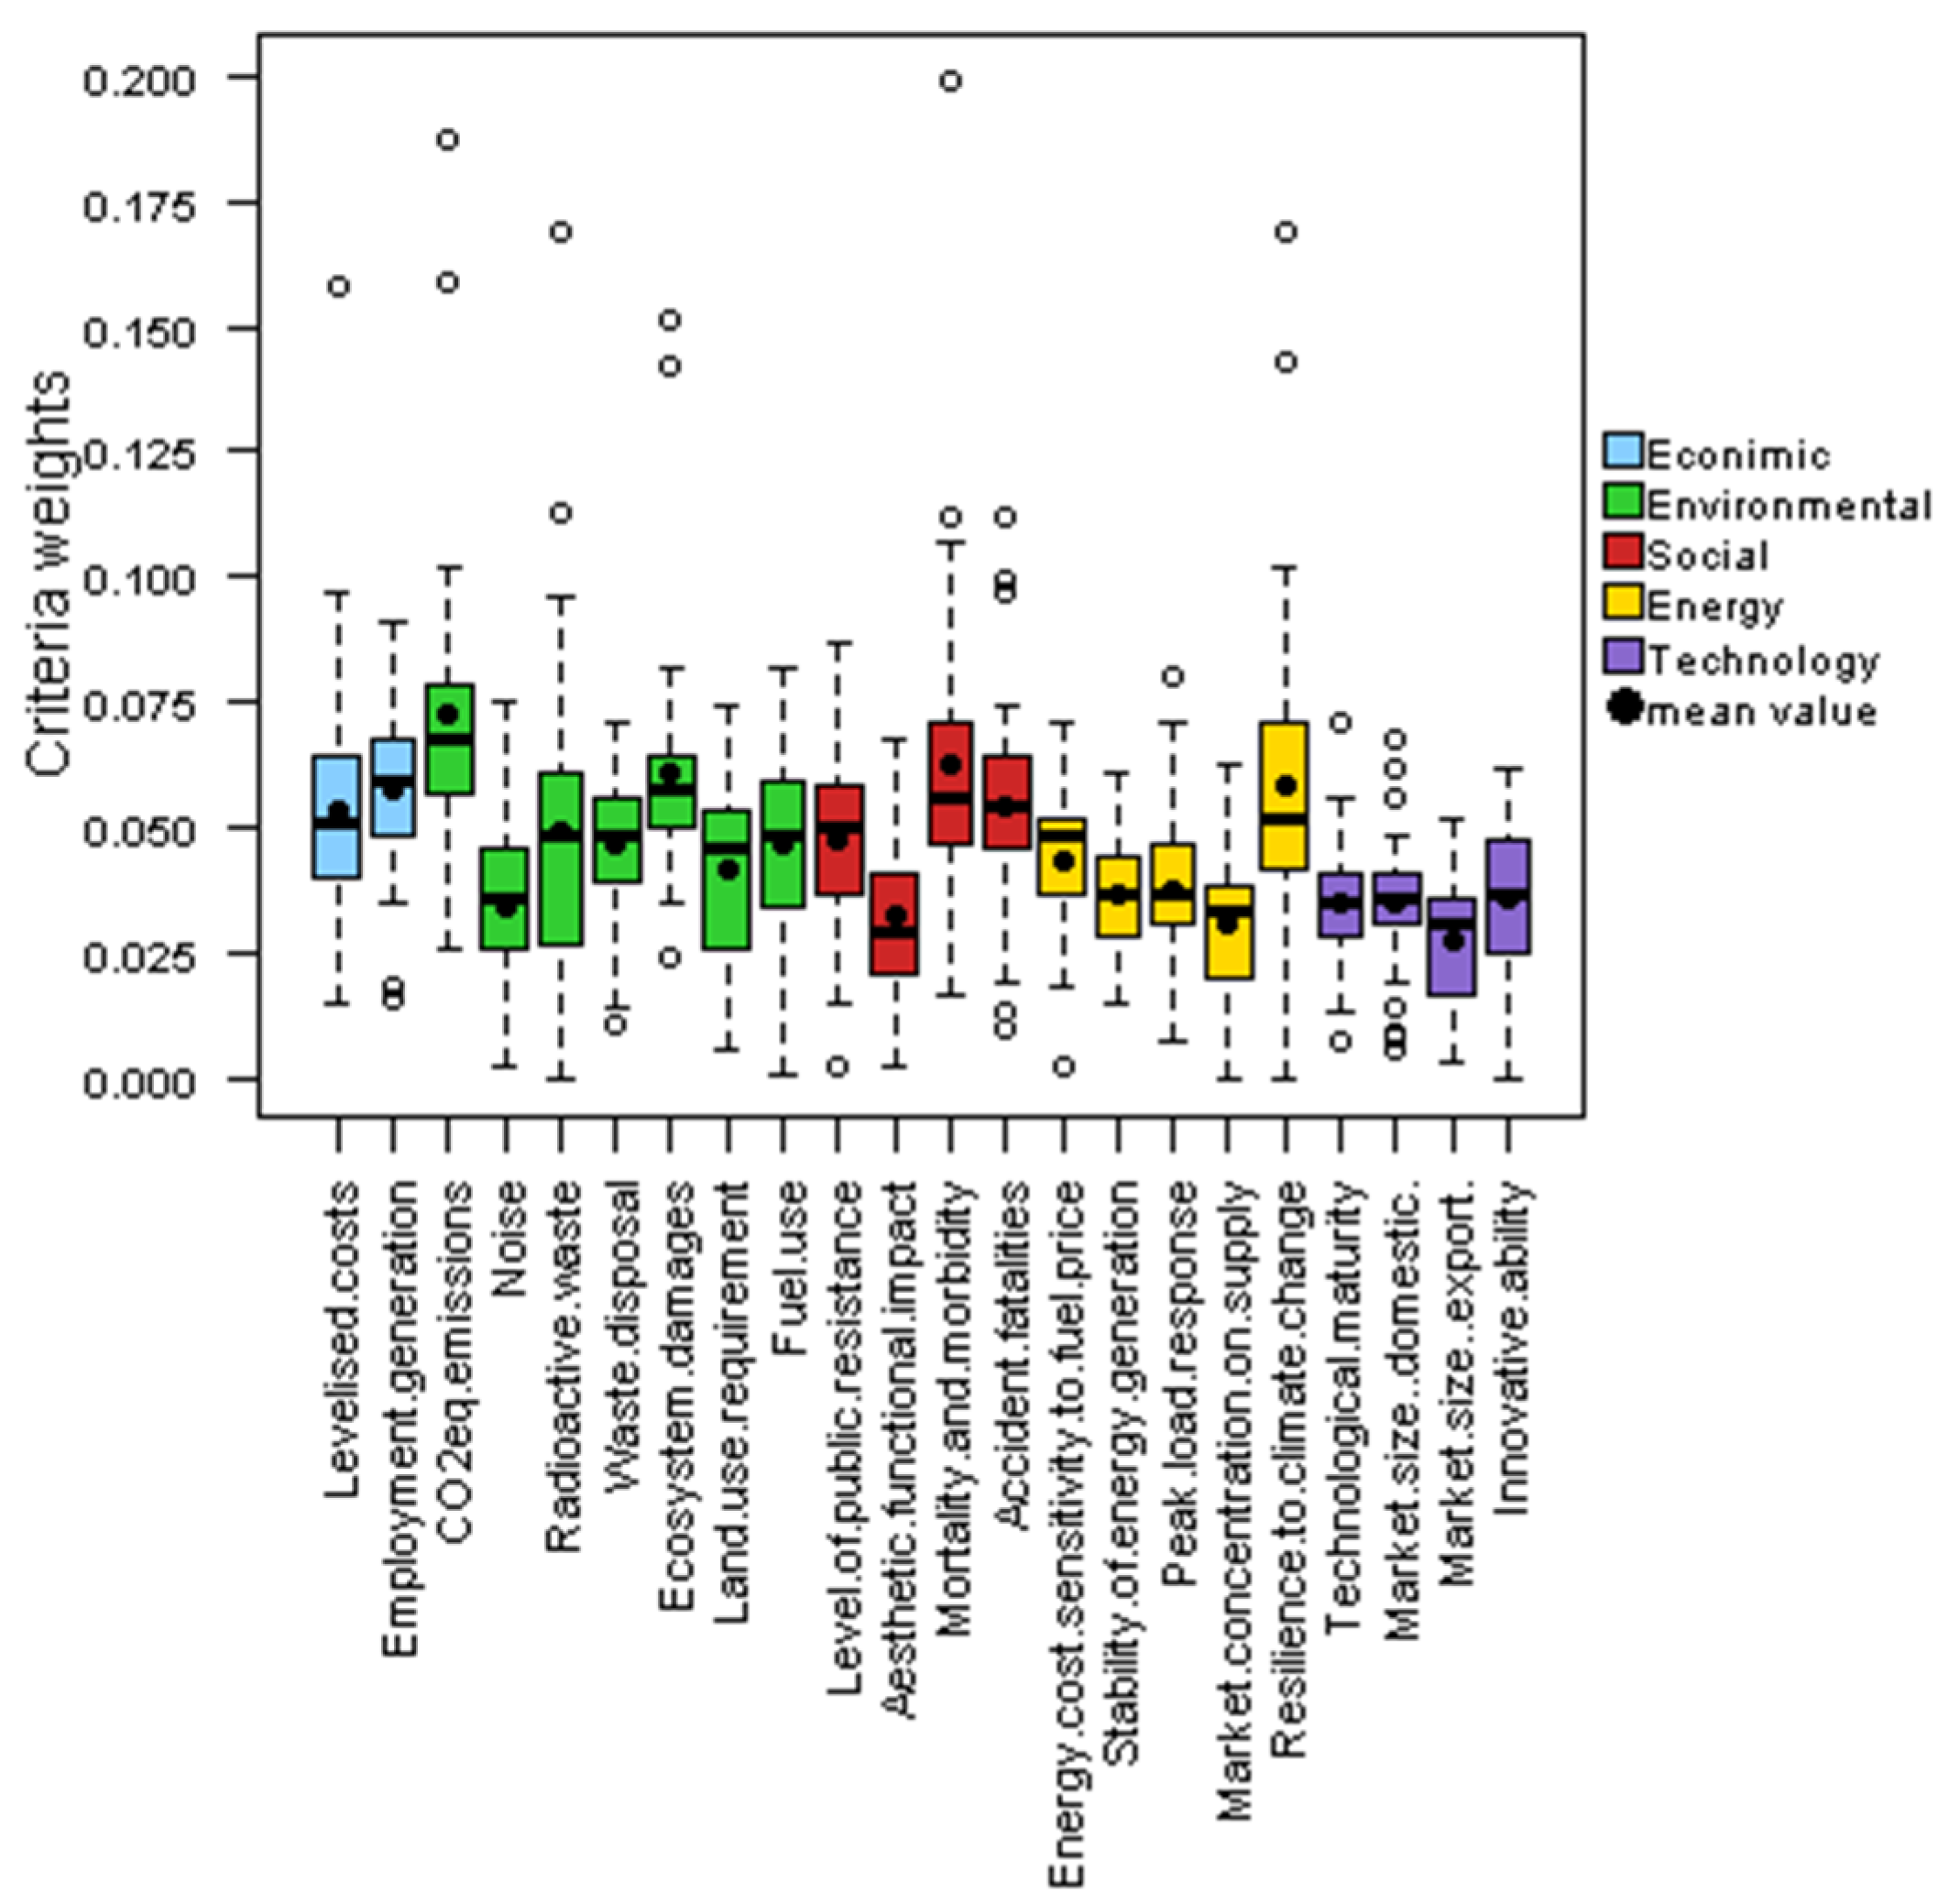
4.1. Overall Priorities

For the analysis of this study, we considered the 31 representatives of European LGs. The LGs which participated in the survey consisted of 16 large and 15 medium-sized cities. Furthermore, thirteen (13) LGs were from Western/North Europe (France, Austria, Finland, the Netherlands, Switzerland, United Kingdom, Belgium and Denmark), eleven (11) from South Europe (Italy, Spain, and Greece), and seven (7) from Eastern Europe (Romania, Poland, Turkey, Serbia, Georgia, Bosnia and Herzegovina, and Croatia) (Figure 2).
Figure 2. Geographical distribution of European LGs.
Energies 08 11641 g002
The overall list of LGs that participated in the survey along with their population size, geographical region, and level of GDP (in euros) per capita can be found at Appendix B. All the participating cities had developed SEAPs and submitted them either on the CoM of the European Commission or the Carbonn online Registry of ICLEI. We recognise the limitations of the relatively small sample size which does not allow representation of all European LGs and therefore any attempt for generalization of the results should be carefully considered.
According to the LGs’ responses, the most important criterion, based on the average weights, is the criterion of “CO2 emissions” (ENV1) (Figure 3). “CO2 emissions” is followed by “mortality and morbidity” (SOC3), “ecosystem damages” (ENV5), “resilience to climate change” (ENE5), “employment generation” (EC2), “accident fatalities” (SOC4), “levelised costs” (EC1), and “radioactive waste” (ENV3) (see also Table 2 and Figure 3). Figure 3 presents the boxplot of the average and median values of criteria weights along with the distribution of weights around the median value as was estimated using the R studio statistical software.
Table 2. Final average weights of criteria, final ranking and standard deviation.
CriteriaAverage WeightRankStDev
ENV1: CO2eq emissions0.07310.032
SOC3:Mortality and morbidity0.06320.034
ENV5: Ecosystem damages0.06130.025
ENE5: Resilience to climate change0.05940.034
EC2: Employment generation0.05850.018
SOC4: Accident fatalities0.05460.023
EC1: Levelised costs0.05470.027
ENV3: Radioactive waste0.04980.034
SOC1:Level of public resistance/opposition0.04890.018
ENV4:Waste disposal (infrastructure)0.047100.015
ENV7: Fuel use0.046110.020
ENE1: Energy cost sensitivity to fuel price fluctuation0.044120.014
ENV6: Land use requirement0.041130.018
ENE3: Peak load response0.038140.015
ENE2:Stability of energy generation0.036150.012
TEC4: Innovative ability0.036160.015
TEC1: Technological maturity0.035170.013
TEC2: Market size (domestic)0.035180.014
ENV2: Noise0.034190.017
SOC2: Aesthetic/functional impact0.032200.017
ENE4: Market concentration on supply0.031210.013
TEC3: Market size (potential export)0.028220.013
Figure 3. Boxplot with mean values of criteria weights and outliers.
Energies 08 11641 g003
Variability in the weights is measured by the interquartile range (IQR) which is illustrated by the boxplot. The IQR is equal to Q3–Q1, the difference between the 75th percentile (Q3) and the 25th percentile (Q1), the distance covering the middle 50% of the weighting values. The larger the IQR (the boxplot), the higher the distribution of the weighting values is, which further means that there is high disagreement between the LGs on the weights assigned on the particular criterion. The median is shown by the line that cuts through the box. The average is shown by the black bullet in the box. The boxplot also shows whether the elicited weights are symmetric (roughly the same on each side when cut down the middle) or skewed. A symmetric distribution of weights shows the median roughly in the middle of the box. A smaller section of the boxplot indicates the weights are more concentrated, whereas a wider section indicates that the weights in that section are more spread out.
We can observe that from the top one third of the highest weighted criteria, the criterion of “resilience to climate change” has the largest boxplot which means the highest distribution of weights and therefore the greatest divergence between the LGs’ preferences. There are also two outliers or extreme values that pull the average weight of this criterion at a higher level. This observation is also confirmed by the high standard deviation that is estimated for this criterion (see Table 2).
Interestingly, the weighting values of the 3rd highest weighted criterion, “ecosystem damages” (ENV5), result to a relatively small boxplot indicating a concentration of weights around the median and high degree of agreement between the different LGs. A couple of outliers that have been observed for this criterion tend to increase the standard deviation (0.025).
The lowest standard deviation (0.018)—highest convergence—of the LGs weighting preferences, of the top one third highest weighted criteria, was observed for “employment generation” (EC2), whereas the highest standard deviation (0.034)—lowest convergence–was observed for “mortality and morbidity” (SOC3) and “resilience to climate change” (ENE5) (see Table 2). We can observe outliers, extreme weighting values, in both criteria, which to a large extent resulted to the high standard deviation (Figure 3).
The top one-third most important criteria as weighted by the LGs included three (3) environmental, two (2) economic, two (2) social, and one (1) energy criteria. None of the criteria from the technological category were considered of high importance by the LG representatives.

4.2. Priorities of Different LG Groups

Comparing the criteria weighting results of LGs based on the size of the population, we can observe that large cities highly prioritize (more than 20%) “resilience to climate change” (ENE5) and “(radioactive) waste” (ENV3) (Figure 4). Four criteria were weighed at the top one third of the most important criteria in both population size groups of LGs. “CO2 emissions” (ENV1) was weighted 1st by both large and medium population size LGs. “Employment generation” (EC2), “ecosystems damages” (ENV5), and “mortality and morbidity” (SOC3) were also weighted at the top one third of the most important criteria of both LG groups (Figure 4).
Figure 4. Average values of large and medium LGs’ priorities.
Energies 08 11641 g004
Similarly the largest, more than 20%, differences between the criteria weights of different groups of LGs can be observed for “(radioactive) waste” (ENV3) and “resilience to climate change” (ENE5), that were weighted significantly higher by Southern and Eastern European LGs in comparison to Western/Northern European LGs. On the contrary, Western/Northern European LGs prioritized the criterion of “mortality and morbidity” (SOC3) significantly higher than the other European LGs (Figure 5).
Three criteria were weighed at the top one third of the most important criteria in all three groups of LGs. “CO2 emissions” (ENV1) was weighted 1st by the groups of Eastern and Southern European LGs and 3rd by the group Western/Northern European LGs. “Levelised costs” (EC1) and “employment generation” (EC2) were also weighted at the top one third of the most important criteria of all LG geographical groups (Figure 5).
Figure 5. Average values of LGs’ priorities from different geographical European regions.
Energies 08 11641 g005

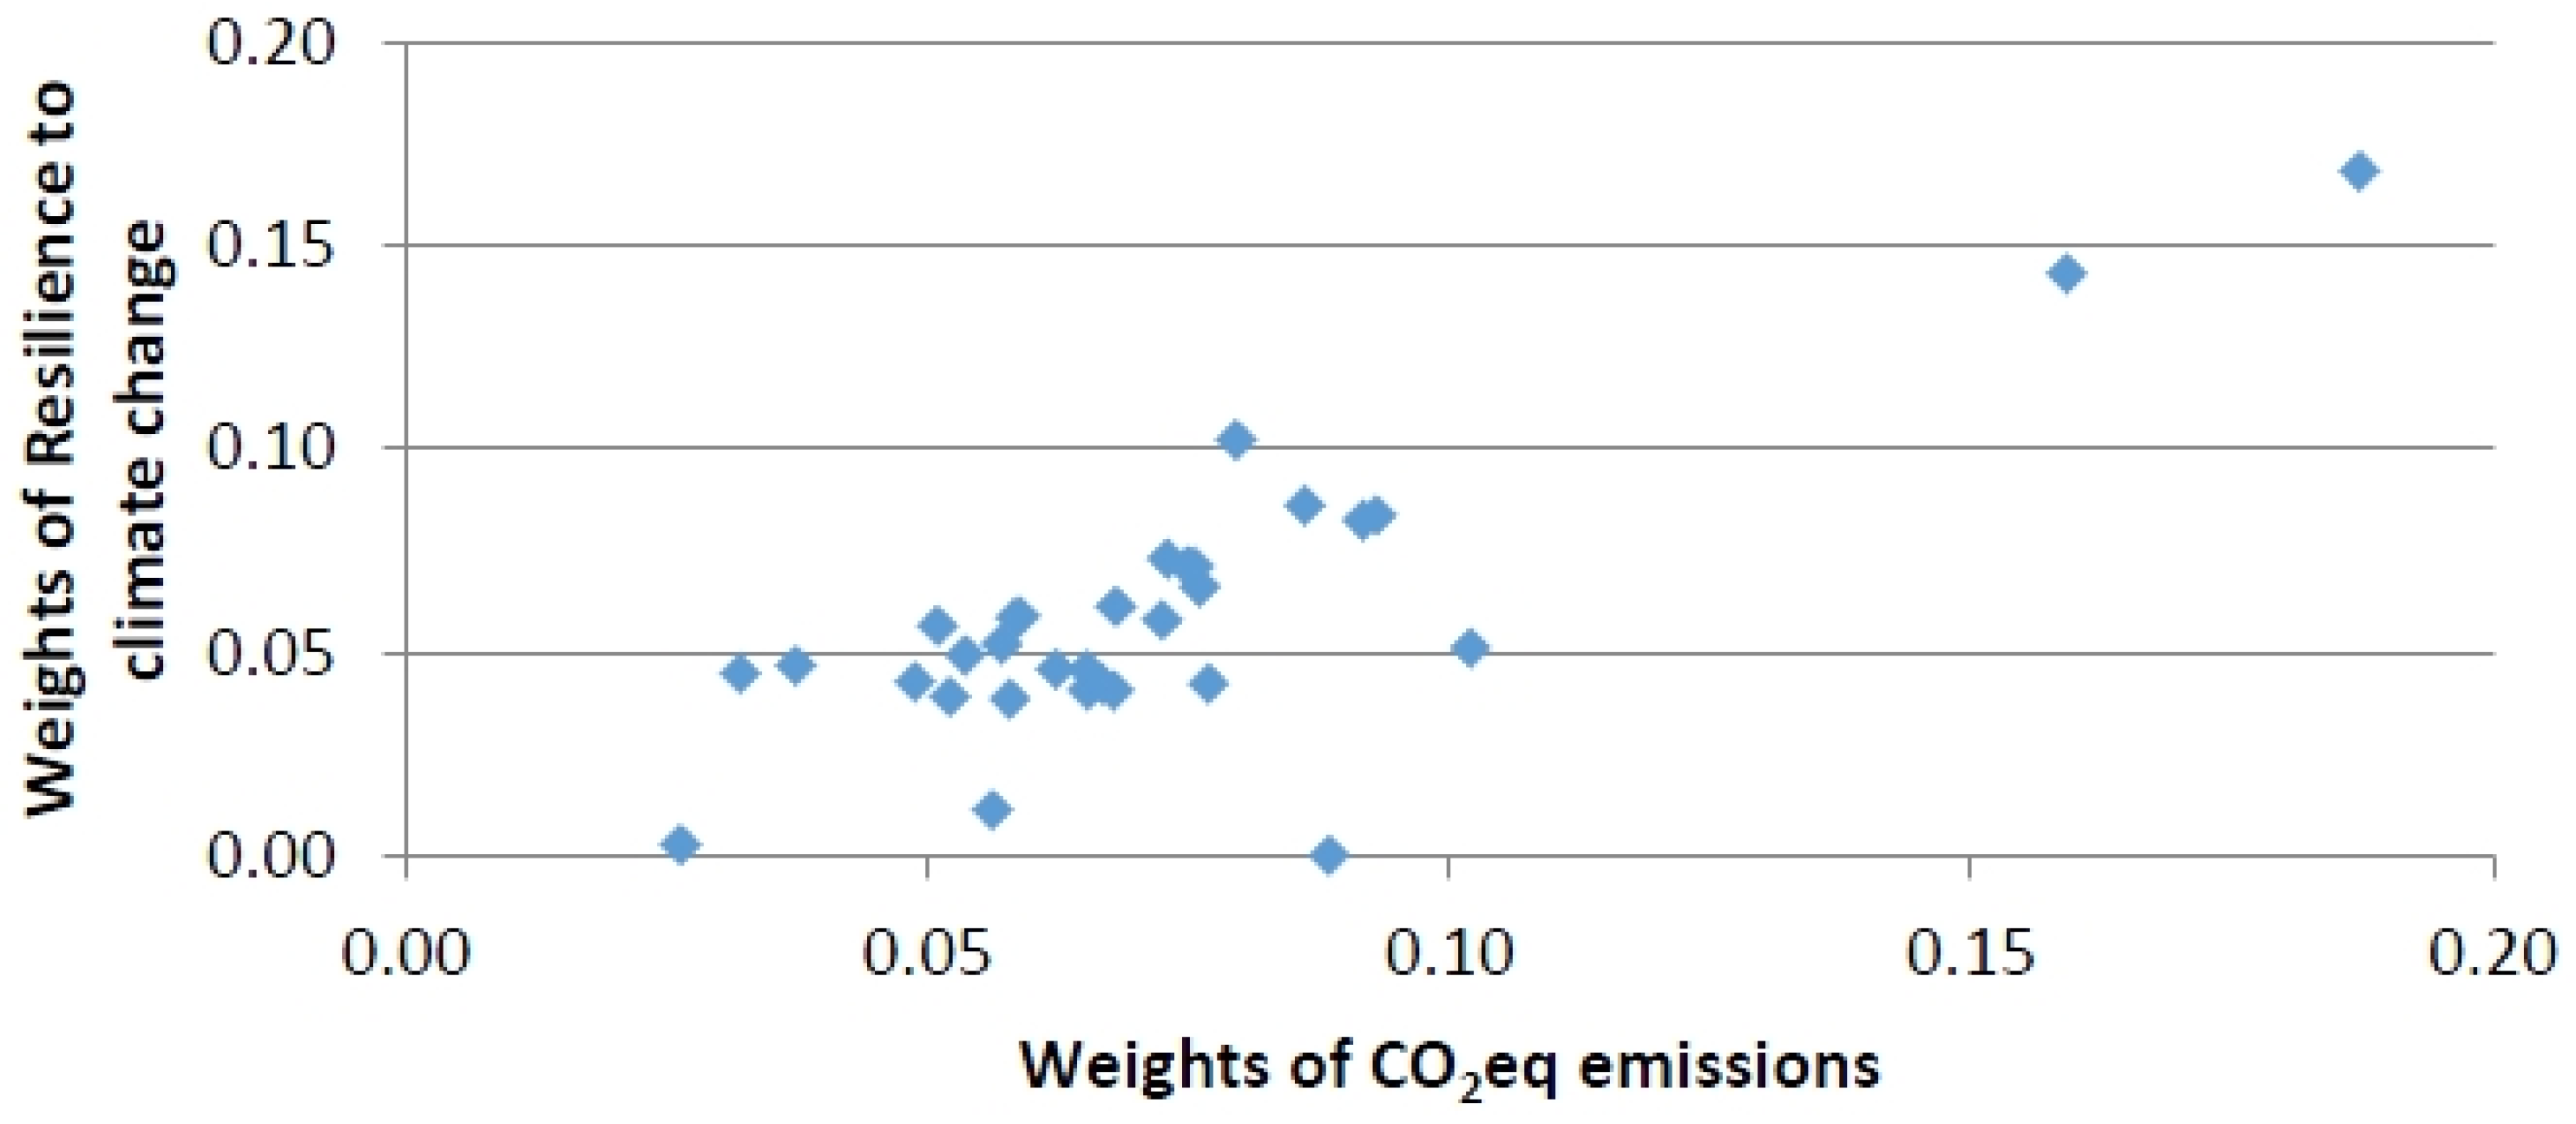
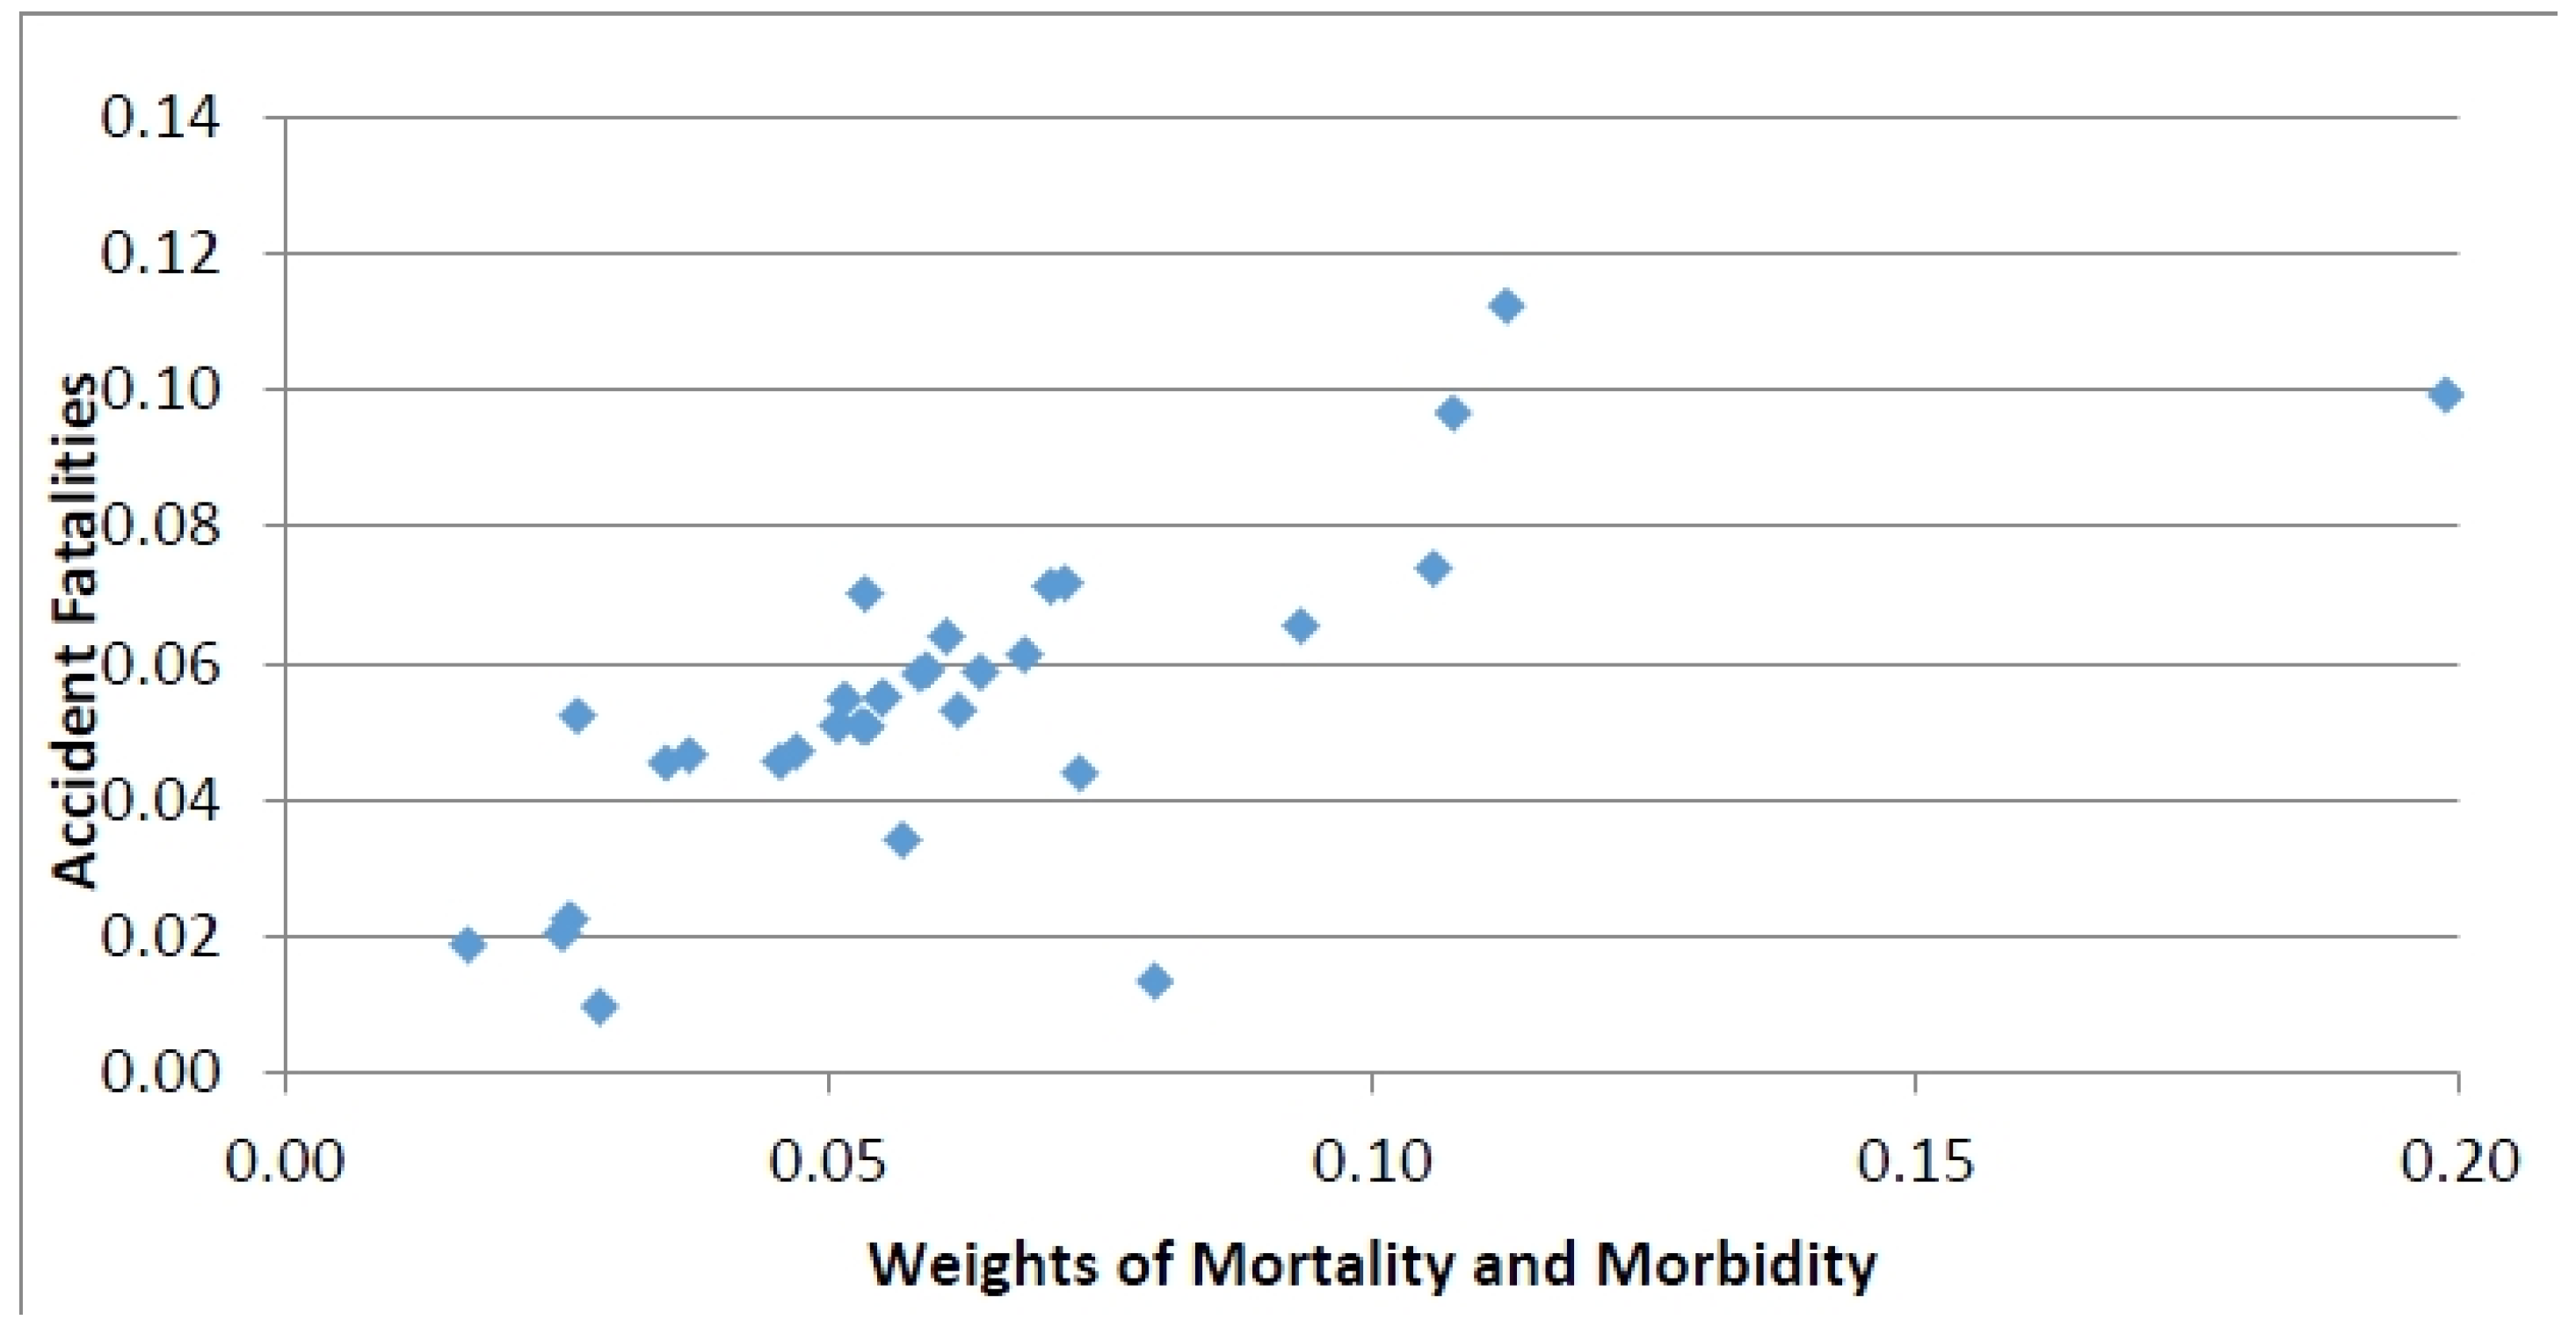
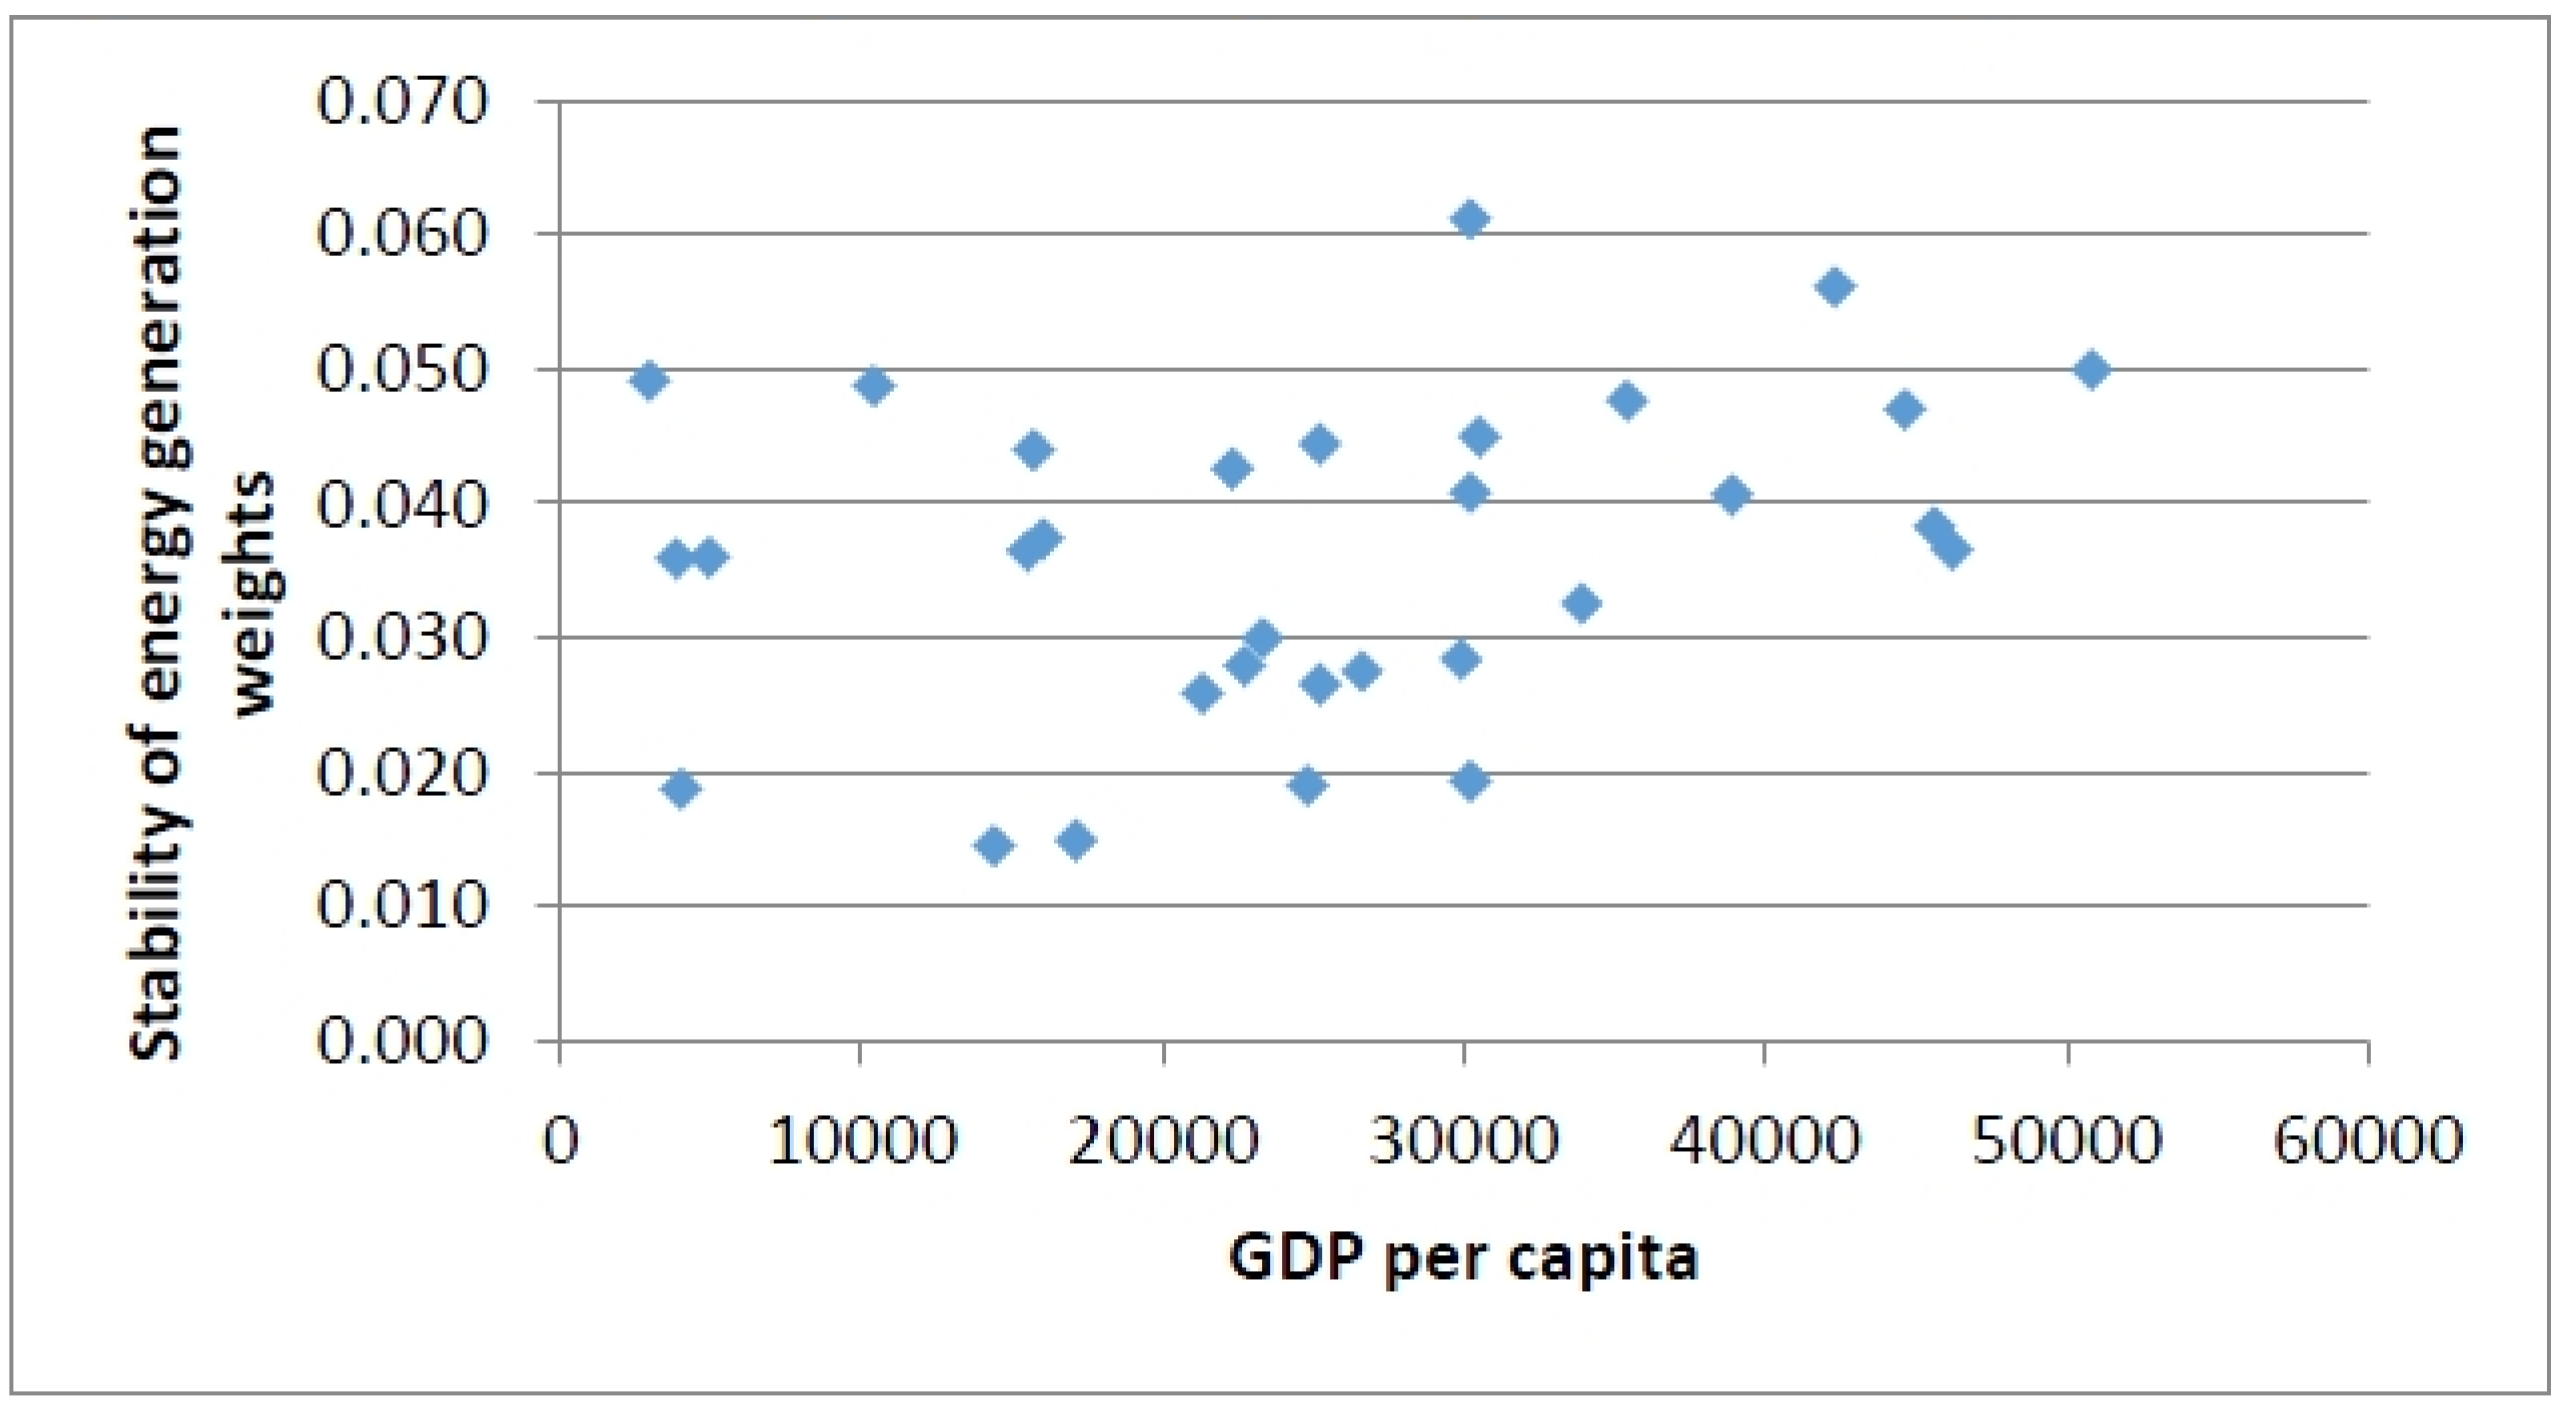
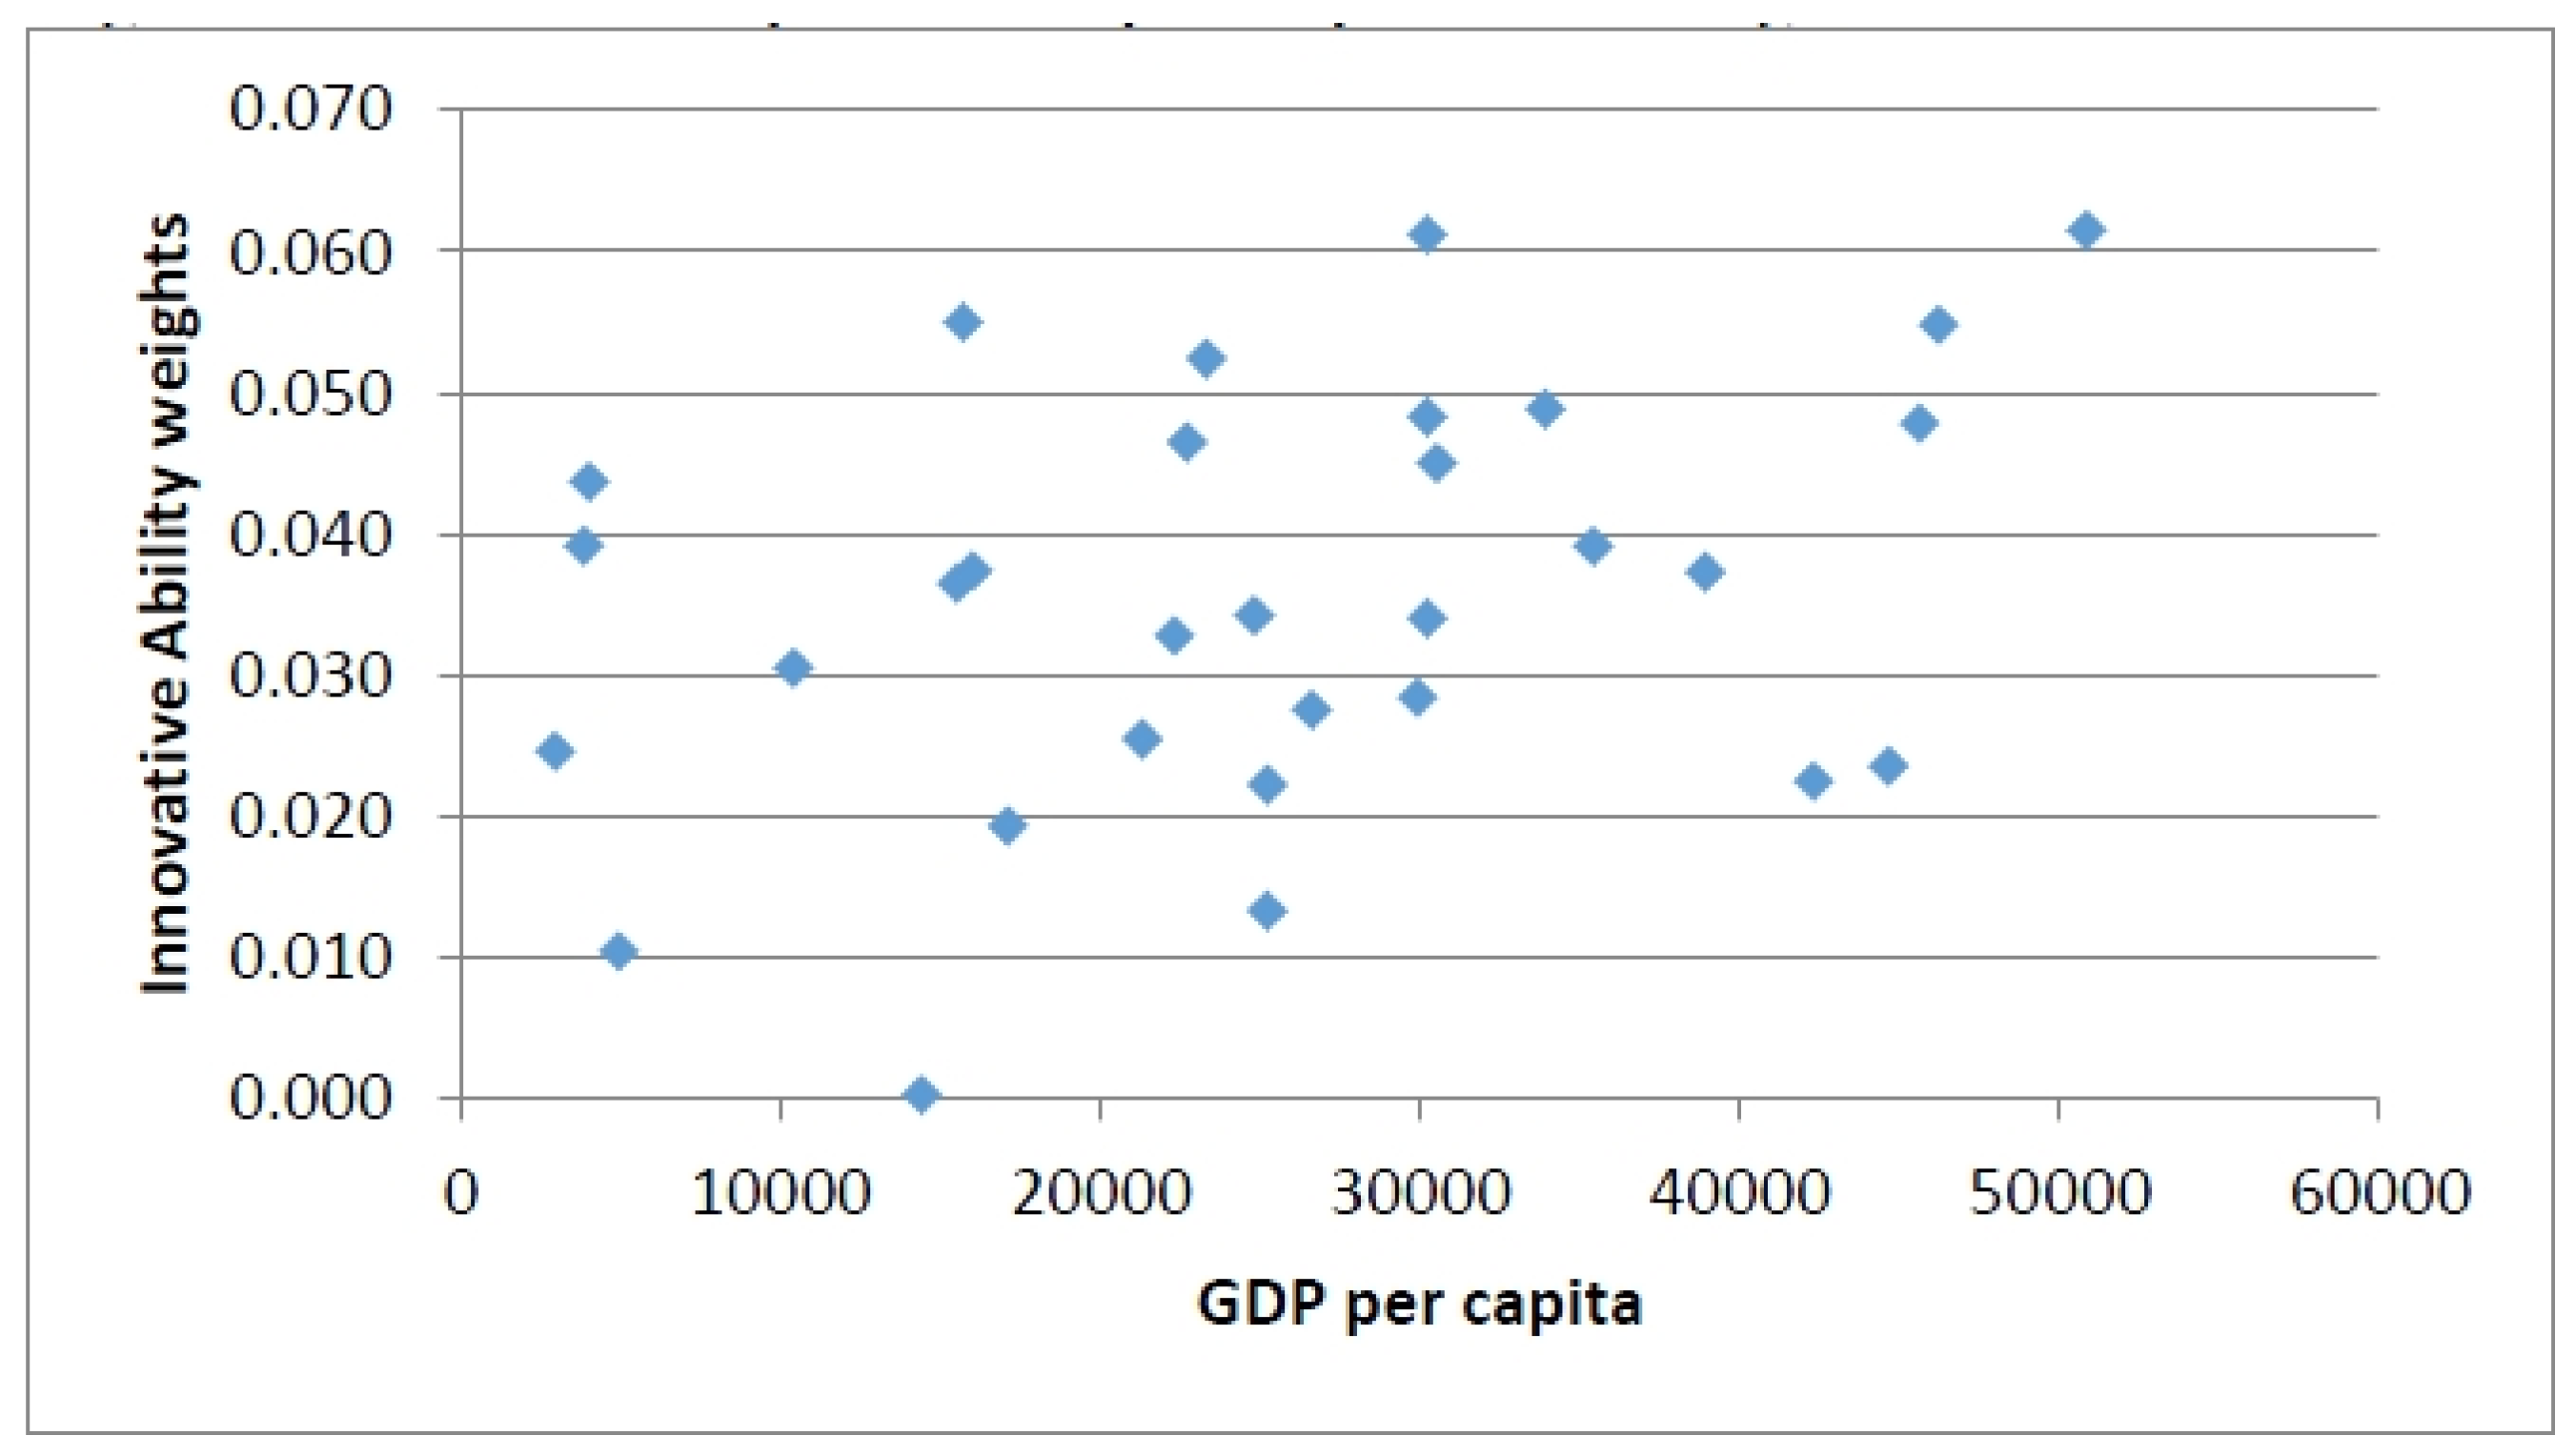
4.3. Relationships of Criteria Weights

We conducted a Pearson correlation analysis for all possible pairs of criteria weights given by the 31 respondents to explore if there are any significant relationships between them. Here, we present the strongest positively correlated criteria weights with “r” higher than 0.7 which indicates very strong relationship. The weights of “CO2eq emissions” (ENV1) were very strongly correlated (r = 0.8) with the weights of “resilience to climate change” (ENE5) (Figure 6).
Figure 6. Relationship of weights of “CO2eq emissions” and “resilience to climate change”.
Energies 08 11641 g006
Furthermore, it was estimated that the weights of “mortality and morbidity” (SOC3) were strongly correlated (r = 0.73) with the weights of “accident fatalities” (SOC4) (Figure 7). Both criteria refer to different health-related issues caused by electricity generation operations. “Mortality and morbidity” (SOC3) refers to direct health impacts from air pollution due to burning of fossil fuels whereas, “accident fatalities” (SOC4) refers to the risk of fatal accidents that could occur during the operation of certain energy systems.
It was also observed that there is strong negative correlation (r = −0.57) between “mortality and morbidity” (SOC3) and “innovative ability” (TEC4). This implies that when LGs highly prioritize health-related issues, they put less emphasis on technological innovation—and vice versa.
Figure 7. Relationship of weights of “morbidity and mortality” and “accident fatalities”.
Energies 08 11641 g007
Moreover, it was found that there is a moderate positive relationship (r > 0.3) between the variable of GDP per capita and the weights of the criteria “stability of energy generation” (ENE2) (r = 0.36), “innovative ability” (TEC4) (r = 0.35), “land use requirement” (ENV6) (r = 0.34), “technological maturity” (TEC1) (r = 0.32) and “energy cost sensitivity to fuel fluctuation” (ENE1) (r = 0.3) (Figure 8 and Figure 9).
Figure 8. Relationship of GDP per capita and weights of “Stability of energy generation”.
Energies 08 11641 g008
Figure 9. Relationship of G56DP per capita and weights of “Innovative ability”.
Energies 08 11641 g009

5. Discussion

According to the LGs’ responses, the most important criterion, based on the average weights, is the criterion of “CO2 emissions” (ENV1), followed by “mortality and morbidity” (SOC3), “ecosystem damages” (ENV5), “resilience to climate change” (ENE5), “employment generation” (EC2), “accident fatalities” (SOC4), “levelised costs” (EC1), and “radioactive waste” (ENV3).
“CO2 emissions”, as the most important criterion among LG representatives and across different geographical regions, clearly shows that the EU climate change mitigation policy objectives have reached the local level [23]. Although this is considered more of an international and European-level priority issue, this can be attributed to the growing importance placed on climate change mitigation by European LGs and their conscious attempts to reduce emissions in their own localities as evidenced by their participation in the development and implementation of SEAPs [8].
Interestingly, the second (“mortality and morbidity”) and third most important criteria (“ecosystems damages”) are both related to air pollution from burning of fossil fuels. These criteria are also the two most common energy externalities highlighted in the literature [51,59,60]. According to the results of this study, these issues were affirmed as highly important impacts from a European LGs’ perspective. By combining these two highly weighted criteria, the issue of air pollution reduction is becoming the most important co-benefit of low-carbon electricity generation for LGs. This further indicates that climate change mitigation policies should seek how to maximize local air pollution reduction co-benefits as was also underlined by other authors [20].
“Resilience to climate change”, the fourth most important criterion, is a relatively new aspect that was not considered until the recent years in energy systems assessments. It is also a relatively new concept and objective for LGs. This could mean that there are well informed LGs on this issue, while others are still relatively ignorant. This situation is also reflected in the large divergence of LGs preferences that we observe in this study.
Different LGs, on the other hand, show a high degree of agreement for “ecosystem services”. This could be explained by the fact that LGs have high familiarity with the concept of ecosystem services and have clear objectives on preserving the urban and peri-urban ecosystem services for improving local communities’ quality of life.
The high convergence between the different LGs on the “employment generation” could be explained by the fact that creation of jobs has a very strong local perspective, which in current times of European economic crisis is becoming more prominent among the European LGs.
For this study, we also ran a correlation analysis of all evaluation criteria. The results showed very strong positive correlation (r higher than 0.7) between “CO2 emissions” and “resilience to climate change” as well as between “mortality and morbidity” and “accident fatalities”. Moreover, the results showed moderate positive correlation (r higher than 0.4) between GDP per capita and criteria related to energy security of supply and innovative ability.
Largely populated cities, in particular, prioritize resilience to climate change which suggests the need to develop strategies to cope with future climatic shocks and stresses. Moreover, large cities place emphasis on (radioactive) waste which implies the need for cleaner electricity generation sources and the importance of reduced environmental impacts. This can also be explained by the fact that the issue of climate resilience has been recognised as an important issue in the last years by many European LGs, and that there is an increasing number of LGs that are conducting local climate change adaptation plans [58].
It is also evident that larger cities with accumulated populations and assets are potentially more vulnerable in cases of energy system disturbances or failure due to climate extremes. This can be explained by the fact that both criteria concern the two sides of the issue of climate change, namely mitigation and adaptation. Moreover, reduction of carbon emissions as well as developing climate resilience both address the actual and potential impacts of climate change in the long-run. Evidently, European LGs are aware about this relationship which is reflected on the way they weight these two criteria.
Based on the positive relationship between GDP per capita and awareness on issues related to energy security of supply and technology innovation, wealthy cities tend to prioritize technological innovation at a high level, which could possibly drive further their competitiveness with regard to low-carbon energy technologies. At the same time wealthy cities give high priority to issues related to energy security supply, enhancing their resilience to any energy supply disturbances while minimizing any negative effects to their economy, as it has been also discussed by other authors [10,26]. It needs to be further studied, if there is any causality in these relationships.

6. Conclusions

This study, to the best of our knowledge, is the first attempt to map and measure priorities of European LGs on the sustainability evaluation of low-carbon energy technologies. It is critical to consider LGs’ priorities as this could further enhance implementability, alignment and coordination of sustainable and low-carbon energy policies at different levels.
This study applied a hybrid weighting methodology which combined two weighting elicitation techniques (pairwise comparisons and swing method) for the elicitation of LGs’ priorities. It was carried out through three different means (survey, face to face workshop, webinar) of exploring the preferences of LG representatives.
Further research on comparing different approaches will provide useful insights on how to best elicit LGs’ priorities. It would also be useful to further explore how this methodology can be applied in different group decision making contexts to map stakeholders’ priorities and further facilitate participation, deliberation, learning and adaptive decision making during low-carbon energy policy and planning processes.
Our study, which targeted LG representatives explored the specific, categorical, and overall priorities as well as analysed preferences based on three variables: population size (large, medium-sized cities), geographical region (northern/western, southern, and eastern European countries) and GDP per capita.
With LGs that have prepared SEAPs and are signatories to transnational European networks as respondents, our study was able to elicit preferences among large and medium sized cities that as it seems highly prioritize European climate change mitigation objectives. In that respect, we could conclude that European climate change policy has succeeded to engage LGs in the broader international discourses on tackling global climate change.
While our study may not provide a definitive representation and generalized results for all LGs, we recommend an extensive application of the methodology to a larger sample of European LGs. Moreover, it is deemed necessary to conduct a similar study for other geographical regions (e.g., Asia, North and South America) and compare the priorities of LGs from different regions. Furthermore, a similar approach could be also applied for eliciting LGs’ preferences regarding the most important criteria and barriers regarding the actual development and planning of local SEAPs.

Acknowledgments

This research study was supported by the Covenant CapaCITY, a project co-funded by the Intelligent Energy Europe programme, and supported by the ICLEI—Local Governments for Sustainability, European Secretariat (ICLEI Europe), Duration of the project: 2011–2014. Furthermore, the authors would like to thank Carsten Rothballer, Giorgia Rambelli and Maryke van Staden, energy and climate officials of ICLEI, for their continuous support during this study. In addition, the authors would like to thank all 31 European Local Governments that found the time to participate in this study. The authors would like also to express their gratitude to Alexandra Tsatsou, climate change specialist, for her support on contacting different European local governments and Spiros Stavropoulos and Elpida Kanellaki, statisticians, for providing valuable comments regarding the statistical analysis.

Author Contributions

Stelios Grafakos: Selection and validation of the evaluation criteria, development of the integrated weighting methodology, analysis of results and writing of the manuscript.
Elena Marie Enseñado: Survey of local stakeholders’ views, elicitation of local stakeholders’ preferences, analysis of results and writing of the manuscript.
Alexander Flamos: Selection and validation of the evaluation criteria, development of the integrated weighting methodology, and analysis of results.
Jan Rotmans: Development of the integrated weighting methodology and detailed review of the manuscript.

Conflicts of Interest

The authors declare no conflict of interest.

Appendix A: Reference European Electricity Generation Technologies under Investigation in 2030

Low-Carbon Energy TechnologiesDescriptions
1Integrated Gasification Combined Cycle (IGCC) coalFuture reference technology for 2030 is an IGCC power plant. IGCC technology is an emerging advanced power generation system having the potential to generate electricity from coal with high efficiency and lower air pollution (NOx, SO2, CO and PM10) than other current coal-based technologies.
2IGCC coal with Carbon Capture and Storage (CCS)IGCC technology lends itself very well to carbon capture and storage (CCS) due to the higher pressure of the gas stream and the possibility to achieve the highly concentrated formation of CO2 prior to combustion. For this to be possible then after having been cleaned of particulates the syngas enters a shift reaction unit in which the methane is reacted with steam to produce hydrogen and CO2. The preferred technique for CO2 separation in applications at higher pressure (i.e., IGCC) is currently physical absorption using solvents commonly used in commercial processes. Once captured, the CO2 can then be treated in the same way as for the other technologies incorporating CCS. The resulting power plant net efficiency for this technology scenario is 48.5%. CO2 transport and storage is modelled in the same way as for Pulverized Coal power plants.
3Gas Turbine Combined Cycle (GTCC)GTCC power plant involves the direct combustion of natural gas in a gas turbine generator. The waste heat generated by this process is then used to create steam for use in a steam generator, in a similar manor to that of IGCC technologies. In this combined cycle power plant around two-thirds of the overall plant capacity is provided by the gas turbine. Reference technology for large natural gas power plants is a 500 MW Combined Cycle (CC) unit. The analysis focuses on a base load power plant. Technology development until 2030 is taken into account with higher power plant efficiencies.
4GTCC with CCSThe electricity generation aspect of this technology is exactly the same as the GTCC without CCS. The flue gas from the GTCC then enters the same CO2 separation, stripping, drying, transportation and sequestration process to that used for coal and lignite CO2 capture.
5Nuclear European Pressure Water Reactor (EPR)This “Generation III” design of nuclear reactor uses either uranium oxide enriched to 4.9% fissile material (uranium-235) or a mix of uranium-235 and mixed uranium plutonium oxide (MOX), with pressurized water as the moderator and cooling agent. The heat from the reaction is used to produce steam to drive a steam turbine generator. It features not only superior reliability and safety over its current “Generation II” counterparts but also higher efficiency. This results in less high-level radioactive waste per unit of electricity generated that requires either reprocessing or long term storage in geological repositories.
6Wind onshoreThe exploitation of wind energy has increased exponentially during the last decades, and there is still large unexploited wind energy potential in many parts of the world—both onshore and offshore. However, the success story of onshore wind energy has led to a shortage of land sites in many parts of Europe, particular in north-western Europe. Vestas’ V80 2 MW turbine serves as current reference technology for onshore wind power in Germany The capacity factor for a generic optimal site near to the coast of the North Sea is assumed to be 0.29. Future wind turbines in 2030 with higher capacities are assumed to be located at the same or similar sites.
7Wind offshoreThe shortage of land sites for onshore wind energy has spurred the interest in exploiting offshore wind energy. Offshore wind farms consisting of multiple wind turbines all connected to a single transformer station are more financially viable than individual turbines. Offshore sites also enjoy the advantage of having significantly more stable and higher wind speeds than onshore sites and which leads to a longer turbine life. Future wind turbines in 2030 with higher capacities than the current ones are assumed to be located at the Danish part of the North Sea (HornsRev) or similar sites. The whole park is assumed to consist of eighty Vestas V80 turbines with monopile steel foundations.
8Solar Photovoltaics (PVs)—crystalline siliconThe PV installation is small and integrated onto a new or existing building. At 420 kW, this is suited to the roof of a public or commercial building and is too large for most domestic residences. Photovoltaic (PV) reference technology for crystalline silicon is the laminated, integrated slanted-roof multicrystalline-Si module in, which is adapted to the electricity production of 850 kWh kWp. Not only efficiency increase for the PV-cells as such, but also reduced energy demand in the production steps of the PV chains are taken into account for the modeling of the future 2030 reference PV units.
9HydropowerThe hydro plant Illanz/Panix (Switzerland) is used as the reference reservoir site. Lifetime of the dam is assumed to be 150 years.
10Biogas CHPBiogas (SNG) from forest wood gasification is assumed to fuel CHP units. Basis for the production of SNG via wood gasification is the assessment of a 50 MW demonstration plant. A commercialized methanation unit with double capacity and increased efficiency, as well as improved CHP unit SNG combustion, reflect the expected technology development until 2030.

Appendix B: List of Participating LGs in the Study

CountryLocal GovernmentGeographical LocationPopulationGdp (Euros)/Capita
1ItalyRomeSouthern Europe2,638,84229,900
2FranceParisWestern Europe2,249,97725,200
3RomaniaBucharestEastern Europe1,883,42515,500
4AustriaViennaWestern Europe1,794,77045,600
5PolandWarsawEastern Europe1,724,40415,700
6SpainBarcelonaSouthern Europe1,620,94326,600
7TurkeyGaziantepEastern Europe1,376,3524000
8FinlandHelsinki (greater city)Northern Europe1,059,63146,200
9SpainAsturiasSouthern Europe1,006,00021,300
10NetherlandsRotterdam (greater city)Western Europe978,04035,400
11GreeceCreteSouthern Europe620,00016,000
12SwitzerlandZürich (greater city)Western Europe605,81244,640
13United KingdomWorcestershireNorthern Europe566,50023,300
14BelgiumAntwerpWestern Europe512,23038,900
15NetherlandsUtrechtWestern Europe321,91642,300
16ItalyBariSouthern Europe313,21317,100
17SerbiaNisEastern Europe255,5184922
18Spain Vitoria-Gasteiz CitySouthern Europe242,22330,500
19SwitzerlandLausanne (greater city)Western Europe220,84650,829
20ItalyPadovaSouthern Europe207,24530,200
21GeorgiaBatumiEastern Europe170,0002936
22SpainLeónSouthern Europe131,68022,300
23Bosnia and HerzegovinaTuzlaEastern Europe125,0003837
24United KingdomWychavonNorthern Europe117,10022,700
25GreeceThessalonikiSouthern Europe111,70314,400
26CroatiaOsijekEastern Europe108,04810,400
27FranceColombesWestern Europe83,22025,200
28DenmarkRoskildeWestern Europe81,80030,200
29GreeceAmarrousionSouthern Europe72,48024,800
30ItalyMantua (Mantova)Southern Europe48,35333,900
31DenmarkVordingborgWestern Europe46,60030,200

References

  1. Reckien, D.; Flacke, J.; Dawson, R.; Heidrich, O.; Olazabal, M.; Foley, A.; Hamann, J.-P.; Orru, H.; Salvia, M.; de Gregorio Hurtado, S.; et al. Climate change response in Europe: What’s the reality? Analysis of adaptation and mitigation plans from 200 urban areas in 11 countries. Climatic Change 2014, 122, 331–340. [Google Scholar] [CrossRef]
  2. Hoppe, T.; van den Berg, M.; Coenen, F. Reflections on the uptake of climate change policies by local governments: Facing the challenges of migration and adaptation. Energy Sustain. Soc. 2014, 4. [Google Scholar] [CrossRef]
  3. Hernández-Escobedo, Q.; Rodríguez-García, E.; Saldaňa-Flores, R.; Fernández-García, A.; Manzano Agugliaro, F. Solar energy resource assessment in Mexican states along the Gulf of Mexico. Renew. Sustain. Energy Rev. 2015, 43, 216–238. [Google Scholar] [CrossRef]
  4. IPCC. Summary for Policymakers. In IPCC Special Report on Renewable Energy Sources and Climate Change Mitigation; Edenhofer, O., Pichs-Madruga, R., Sokona, Y., von Stechow, C., Seyboth, K., Matschoss, P., Kadner, S., Zwickel, T., Eickemeier, P., Hansen, G., Schlömer, S., Eds.; Cambridge University Press: Cambridge, UK; New York, NY, USA, 2011. [Google Scholar]
  5. European Commission. Communication from the Commission to the European Parliament, the Council, the European Economic and Social Committee and the Committee of the Regions: A Roadmap for Moving to a Competitive Low-Carbon Economy in 2050. Available online: http://eur-lex.europa.eu/legal-content/EN/TXT/HTML/?uri=CELEX:52011DC0112&from=EN (accessed on 25 June 2015).
  6. International Energy Agency (IEA). World Energy Investment Outlook; IEA Publications: Paris, France, June 2014. [Google Scholar]
  7. Hoppe, T.; Graf, A.; Warbroek, B.; Lammers, I.; Lepping, I. Local Governments Supporting Local Energy Initiatives: Lessons from the Best Practices of Saerbeck (Germany) and Lochem (The Netherlands). Sustainability 2015, 7, 1900–1931. [Google Scholar] [CrossRef]
  8. Covenant of Mayors. Covenant of Mayors. Available online: http://www.covenantofmayors.eu/about/covenant-of-mayors_en.html (accessed on 15 August 2013).
  9. International Energy Agency (IEA). Cities, Towns and Renewable Energy, Yes in My Front Yard; IEA Publications: Paris, France, December; 2009. [Google Scholar]
  10. O’Brien, G.; Hope, A. Localism and energy: Negotiating approaches to embedding resilience in energy systems. Energy Policy 2010, 38, 7550–7558. [Google Scholar] [CrossRef]
  11. Castellano, N.N.; Gázquez Parra, J.A.; Valls-Guirado, J.; Manzo-Agugliaro, F. Optimal displacement of photovoltaic array’s rows using a novel shading model. Appl. Energy 2015, 144, 1–9. [Google Scholar] [CrossRef]
  12. Gross, R.; Heptonstall, P.; Blyth, W. Investment in Electricity Generation, the Role of Costs, Incentives and Risks; UK Energy Research Centre: London, UK, May 2007. [Google Scholar]
  13. Blesl, M.; Kober, T.; Bruchof, D.; Kuder, R. Effects of climate and energy policy related measures and targets on the future structure of the European energy system in 2020 and beyond. Energy Policy 2010, 38, 6278–6292. [Google Scholar] [CrossRef]
  14. International Energy Agency (IEA). Projected Costs of Generating Electricity. Available online: https://www.iea.org/publications/freepublications/publication/projected_costs.pdf (accessed on 25 June 2015).
  15. Oikonomou, V.; Flamos, A.; Gargiulo, M.; Giannakidis, G.; Kanudia, A.; Spijker, E.; Grafakos, S. Linking least-cost energy system costs models with MCA: An assessment of the EU Renewable Energy targets and supporting policies. Energy Policy 2011, 39, 2786–2799. [Google Scholar] [CrossRef]
  16. European Commission. ExternE: Externalities of Energy Methodology 2005 Update, Luxembourg. Available online: http://www.externe.info/externe_d7/sites/default/files/methup05a.pdf (accessed on 25 June 2015).
  17. Hirschberg, S.; Bauer, S.; Burgherr, P.; Dones, A.; Simons, A.; Schenler, W.; Bachmann, T. M.; Gallego Carrera, D. Environmental, economic and social criteria and indicators for sustainability assessment of energy technologies. New Energy Externalities Developments for Sustainability (NEEDS), Deliverable D12-3 – Research Stream RS 2b: Energy technology roadmap and stakeholders perspectives. Project co-funded by the European Commission within the Sixth Framework Programme (2002-2006). Paul Scherrer Institut, Villigen PSI (Switzerland). Available online: http://www.needs-project.org/RS2b/RS2b_D3.1.pdf (accessed on 25 June 2015).
  18. Ordorica-Garcia, G.; Douglasa, P.; Croiseta, E.; Zheng, L. Technoeconomic evaluation of IGCC power plants for CO2 avoidance. Energy Convers. Manag. 2006, 47, 2250–2259. [Google Scholar] [CrossRef]
  19. Amann, M.; Bertok, I.; Borken-Kleefeld, J.; Cofala, J.; Heyes, C.; Höglund-Isaksson, L.; Klimont, Z.; Nguyen, B.; Posch, M.; Rafaj, P.; et al. Cost-effective control of air quality and greenhouse gases in Europe: Modelling and policy applications. Environ. Model. Softw. 2011, 26, 1489–1501. [Google Scholar] [CrossRef]
  20. Urge-Vorsatz, D.; Tirado-Herrero, S.; Dubash, N.K.; Lecocq, F. Measuring the Co-Benefits of Climate Change Mitigation. Annu. Rev. Env. Resour. 2014, 39, 549–582. [Google Scholar] [CrossRef]
  21. Lefvevre, B. Incorporating cities into the post-2012 climate change agreements. Environ. Urban. 2012, 24, 575–595. [Google Scholar] [CrossRef]
  22. Del Rio, P.; Burguillo, M. Assessing the impact of renewable energy deployment on local sustainability: Towards a theoretical framework. Renew. Sustain. Energy Rev. 2008, 12, 1325–1344. [Google Scholar] [CrossRef]
  23. Monni, S.; Raes, F. Multilevel climate policy: The case of the European Union, Finland and Helsinki. Environ. Policy Sci. 2008, 11, 743–755. [Google Scholar] [CrossRef]
  24. Grafakos, S.; Flamos, A.; Oikonomou, V.; Zevgolis, D. Integrating environmental, socio political, economic and technological dimensions for the assessment of climate policy instruments. In The Economic, Social and Political Elements of Climate Change; Leal Filho, W., Ed.; Springer Verlag: Berlin, Germany, 2011; pp. 623–648. [Google Scholar]
  25. Doukas, H.; Karakosta, C.; Flamos, A.; Psarras, J. Foresight for Energy Policy: Methodologies and Concepts of Participation in Greece. Energy Sources B Econ. Plan. Policy 2014, 9, 109–119. [Google Scholar]
  26. Molyneaux, L.; Wagner, L.; Froome, C.; Foster, J. Resilience and electricity systems: A comparative analysis. Energy Policy 2012, 47, 188–201. [Google Scholar] [CrossRef]
  27. Grafakos, S.; Flamos, A. Assessing low-carbon energy technologies against sustainability and resilience criteria: Results of a European experts survey. Int. J. Sustain. Energy 2015, 1–15. [Google Scholar] [CrossRef]
  28. Neves, A.R.; Leal, V.; Lourenco, J.C. Methodology for Sustainable and Inclusive Energy Planning. Sustain. Cities Soc. 2015, 17, 110–121. [Google Scholar] [CrossRef]
  29. Stagl, S. Multicriteria evaluation and public participation: The case of UK energy policy. Land Use Policy 2006, 23, 53–62. [Google Scholar] [CrossRef]
  30. Burton, J.; Hubacek, K. Is small beautiful? A multicriteria assessment of small-scale energy technology applications in local governments. Energy Policy 2007, 35, 6402–6412. [Google Scholar] [CrossRef]
  31. Kaldellis, J.; Kapsali, M.; Kaldelli, E.; Katsanou, E. Comparing recent views of public attitude on wind energy, photovoltaic and small hydro applications. Renew. Energy 2013, 52, 197–208. [Google Scholar] [CrossRef]
  32. Keeney, R.L. Value-Focused Thinking: A Path to Creative Decisionmaking; Keeney, R.L., Ed.; Harvard University Press: Cambridge, MA, USA, 1992. [Google Scholar]
  33. Willis, H.; Potoglou, D.; Bruine de Bruin, W.; Hoorens, S. The Validity of the Preference Profiles Used for Evaluating Impacts in the Dutch National Risk Assessment; the RAND Corporation: Cambridge, UK, 2012. [Google Scholar]
  34. Willis, H.H.; DeKay, M.L.; Morgan, M.G.; Florig, H.K.; Fischbeck, P.S. Ecological risk ranking: Development and evaluation of a method for improving public participation in environmental decision making. Risk Anal. 2004, 24, 363–378. [Google Scholar] [CrossRef] [PubMed]
  35. Kowalski, K.; Stagl, S.; Madlener, R.; Omann, I. Sustainable energy futures: Methodological challenges in combining scenarios and participatory multi-criteria analysis. Eur. J. Oper. Res. 2009, 197, 1064–1074. [Google Scholar] [CrossRef]
  36. Grafakos, S.; Flamos, A.; Enseñado, E.M. Preferences Matter: A Constructive Approach to Incorporating Local Stakeholders’ Preferences in the Sustainability Evaluation of Energy Technologies. Sustainability 2015, 7, 10922–10960. [Google Scholar] [CrossRef]
  37. Scrieuciu, S.; Belton, V.; Chalabi, Z.; Mechler, R.; Puig, D. Advancing methodological thinking and practice for development-compatible climate policy planning. Mitig. Adapt. Strateg. Global Chang. 2014, 19, 261–288. [Google Scholar] [CrossRef]
  38. Grafakos, S.; Flamos, A.; Oikonomou, V.; Zevgolis, D. Multi-Criteria Analysis Weighting Methodology to Incorporate Stakeholders’ Preferences in Energy and Climate Policy Interactions. Int. J. Energy Sector Manag. 2010, 4, 434–461. [Google Scholar]
  39. Bell, M.L.; Hobbs, B.F.; Ellis, H. The use of multi-criteria decision-making methods in the integrated assessment of climate change: Implications for IA practitioners. Socio-Econ. Plan. Sci. 2003, 37, 289–316. [Google Scholar] [CrossRef]
  40. Belton, V.; Stewart, T. Multiple Criteria Decision Analysis: An Integrated Approach, 1st ed.; Kluwer Academic Publishers: Boston, MA, USA, 2002. [Google Scholar]
  41. Keeney, R.; Gregory, R. Selecting Attributes to Measure the Achievement of Objectives. Oper. Res. 2005, 53, 1–11. [Google Scholar] [CrossRef]
  42. Haralambopoulos, D.A.; Polatidis, H. Renewable energy projects: Structuring a multi-criteria group decision-making framework. Renew. Energy 2003, 28, 961–973. [Google Scholar] [CrossRef]
  43. Ragwitz, M.; Schade, W.; Breitschopf, B.; Walz, R.; Helfrich, N. The impact of renewable energy policy on economic growth and employment in the European Union. Available online: https://ec.europa.eu/energy/sites/ener/files/documents/2009_employ_res_report.pdf (accessed on 25 June 2015).
  44. Shaw, S.; Peteves, E. Exploiting Synergies in European Wind and Hydrogen Sectors: A Cost-benefit Assessment. Int. J. Hydrogen Energy 2008, 33, 3249–3263. [Google Scholar] [CrossRef]
  45. Shen, Y.-C.; Lin, G.; Li, K.-P.; Yuan, B. An assessment of exploiting renewable energy sources with concerns of policy and technology. Energy Policy 2010, 38, 4604–4616. [Google Scholar] [CrossRef]
  46. Afgan, N.H.; Carvalho, M.G. Sustainable assessment method for energy systems: indicators, criteria and decision making procedure; Kluwer Academic Publishers: Boston, MA, USA, 2000. [Google Scholar]
  47. Beccali, M.; Cellura, M.; Mistretta, M. Decision making in energy planning: The ELECTRE method at regional level for the diffusion of renewable energy technology. Renew. Energy 2003, 28, 2063–2087. [Google Scholar] [CrossRef]
  48. Diakoulaki, D.; Karangelis, F. Multi-criteria decision analysis and cost–benefit analysis of alternative scenarios for the power generation sector in Greece. Renew. Sustain. Energy Rev. 2006, 11, 716–727. [Google Scholar] [CrossRef]
  49. Andrews, C.J.; Dewey-Mattia, L.; Schechtman, J.M.; Mayr, M. Alternative energy sources and land use. In Climate Change and Land Policies; Ingram, G.K., Hong, Y.H., Eds.; Lincoln Institute of Land Policy: Cambridge, MA, USA, 2011. [Google Scholar]
  50. Burgherr, P.; Hirschberg, S. A Comparative Analysis of Accident Risks in Fossil, Hydro, and Nuclear Energy Chains. Hum. Ecol. Risk Assess.: An Int. J. 2008, 14, 947–973. [Google Scholar] [CrossRef]
  51. Paul Scherrer Institut (PSI). Energie-Spiegel: Facts for the Energy Decisions of Tomorrow; PSI: Villigen, Switzerland, June 2010. [Google Scholar]
  52. Gallego-Carrera, D.; Mack, A. Sustainability assessment of energy technologies via social indicators: Results of a survey among European energy experts. Energy Policy 2010, 38, 1030–1039. [Google Scholar] [CrossRef]
  53. Streimikiene, D. Comparative assessment of future power generation technologies based on carbon price development. Renew. Sustain. Energy Rev. 2010, 14, 1283–1292. [Google Scholar] [CrossRef]
  54. Ebinger, J.; Vergara, W. Climate Impacts on Energy Systems: Key Issues for Energy Sector Adaptation; The World Bank: Washington, DC, USA, January 2011. [Google Scholar]
  55. Dowling, P. The impact of climate change on the European energy system. Energy Policy 2013, 60, 406–417. [Google Scholar] [CrossRef]
  56. Lee, S.K.; Yoon, J.Y.; Kim, J.W. A study on making a long-term improvement in the national energy efficiency and GHG control plans by the AHP approach. Energy Policy 2007, 37, 2862–2868. [Google Scholar] [CrossRef]
  57. Stillwell, W.G.; Seaver, D.A.; Edwards, W. A Comparison of Weight Approximation Techniques in Multiattribute Utility Decision-Making. Organ. Behav. Hum. Perform. 1981, 28, 62–77. [Google Scholar] [CrossRef]
  58. Cinelli, M.; Coles, S.; Kirwan, K. Analysis of the potentials of multi criteria decision analysis methods to conduct sustainability assessment. Ecol. Indic. 2014, 46, 138–148. [Google Scholar] [CrossRef]
  59. Diakoulaki, D.; Grafakos, S. Multi-criteria analysis. In ExternE—Externalities of Energy: Extension of Accounting Framework and Policy Applications; European Commission, Ed.; Directorate—General for Research: Luxembourg-Ville, Luxembourg, 2004. [Google Scholar]
  60. Roth, S.; Hirschberg, S.; Bauer, C.; Burgherr, P.; Dones, R.; Heck, T.; Schenler, W. Sustainability of electricity supply technology portfolio. Ann. Nucl. Energy 2009, 36, 409–416. [Google Scholar] [CrossRef]

