
Energy and Environmental Evaluation of Non-Transparent Constructions of Building Envelope for Wooden Houses


Abstract
:
1. Introduction
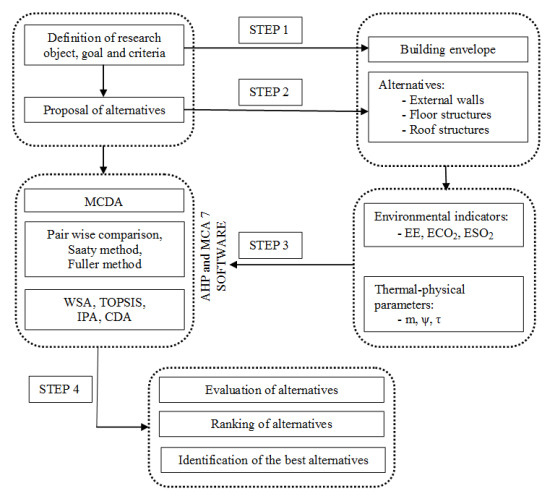
2. Methods of Research
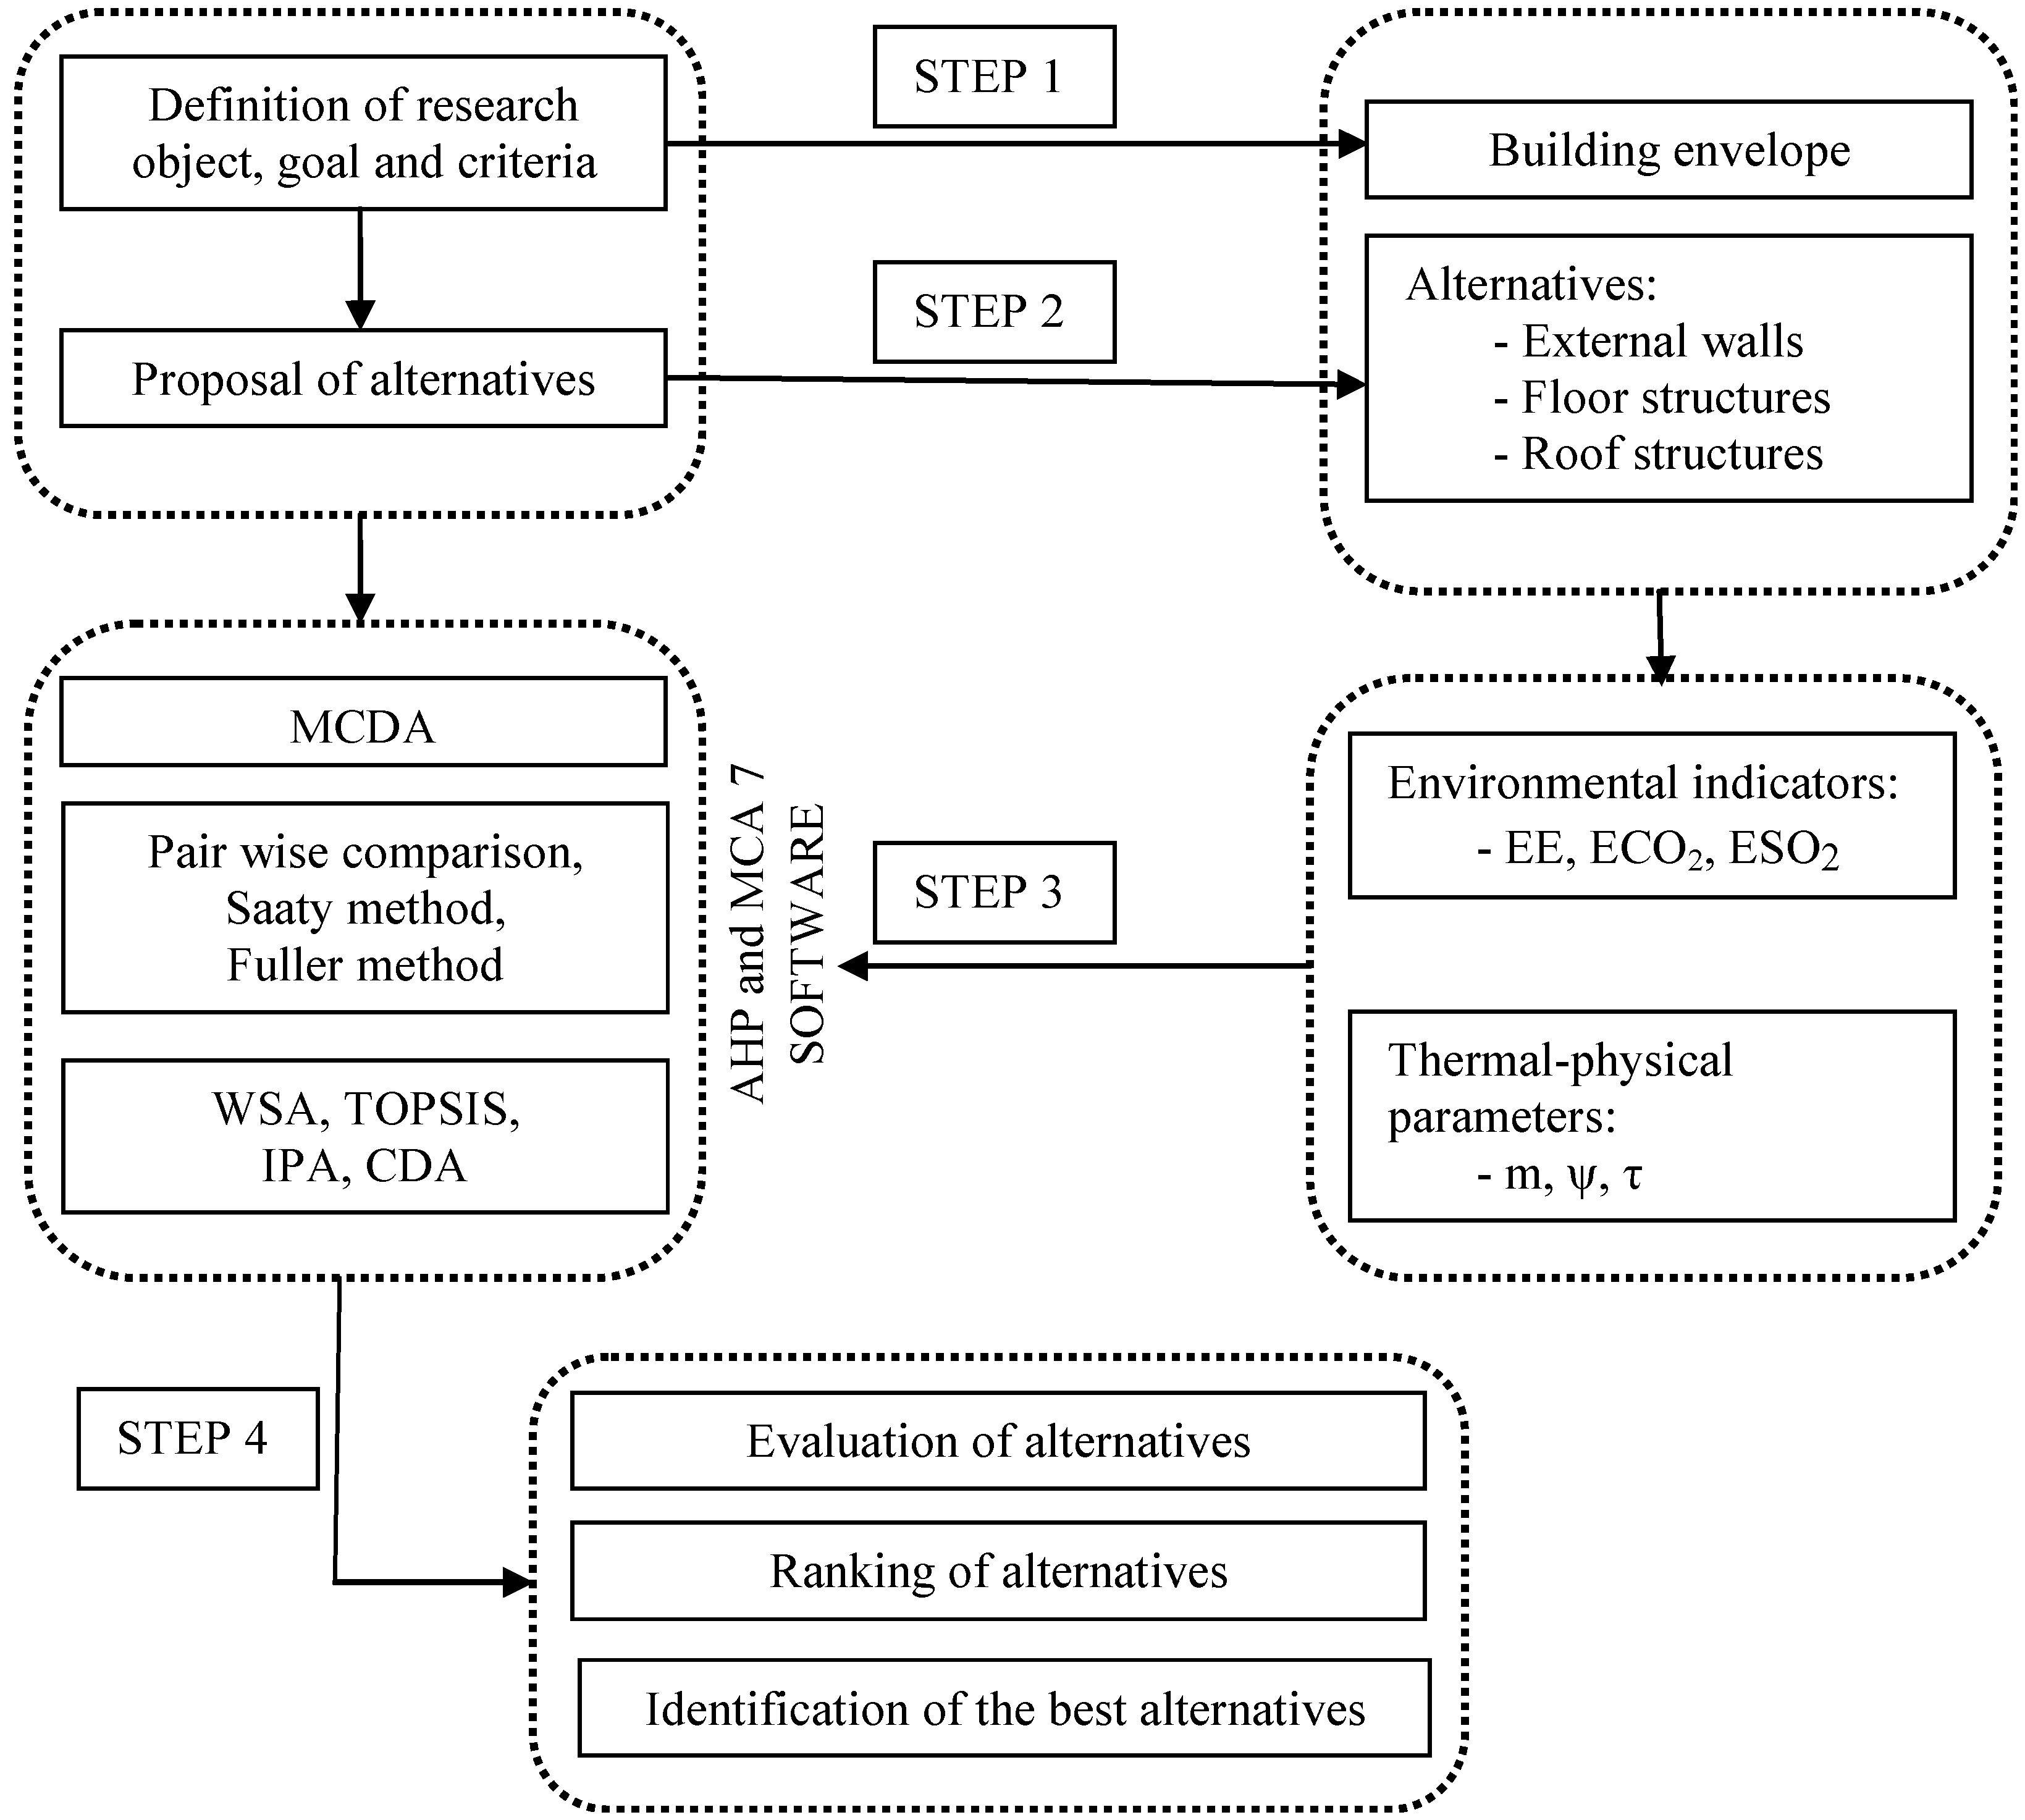
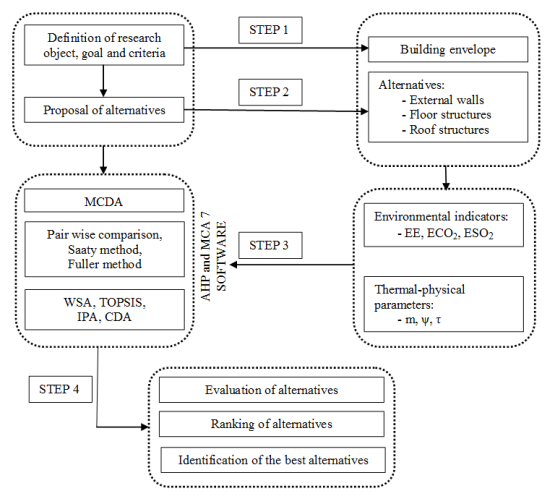
2.1. Thermo-Physical Parameters
2.2. Life-Cycle Assessment
2.3. Multi-Criteria Decision Analysis
3. Material Compositions
3.1. External Walls

| Bearing system | Thermal insulation * (Thickness), Additional thermal insulation | |
|---|---|---|
| MTS |
|
|
| I-profile |
|
|
| CLT |
|
|
| wooden board |
|
|
| box profile |
|
|
| framework |
|
|
| log house |
|
|
3.2. Floor Constructions
| Bearing system | Thermal insulation * (Thickness), Additional thermal insulation | |
|---|---|---|
| MTS |
|
|
| I-profile |
|
|
| box profile |
|
|
| CLT |
|
|
| wooden board |
|
|
| Bearing system | Thermal insulation * (Thickness), Additional thermal insulation | |
|---|---|---|
| reinforced board |
| |
| concrete board |
|
|
| reinforced board |
|
|
| concrete board |
|
|
| concrete |
| |
3.3. Roof Constructions
| Bearing system | Thermal insulation * (Thickness), Additional thermal insulation | |
|---|---|---|
| MTS |
|
|
| Glulam |
|
|
| I-profile |
|
|
| box profile |
|
|
| CLT panel |
|
|
| wooden board |
|
|
4. Results and Discussion
| Indicator | Weights (%) |
|---|---|
| EE | 17.98 |
| ECO2 | 17.98 |
| ESO2 | 8.99 |
| m | 3.27 |
| τ | 25.89 |
| ψ | 25.89 |
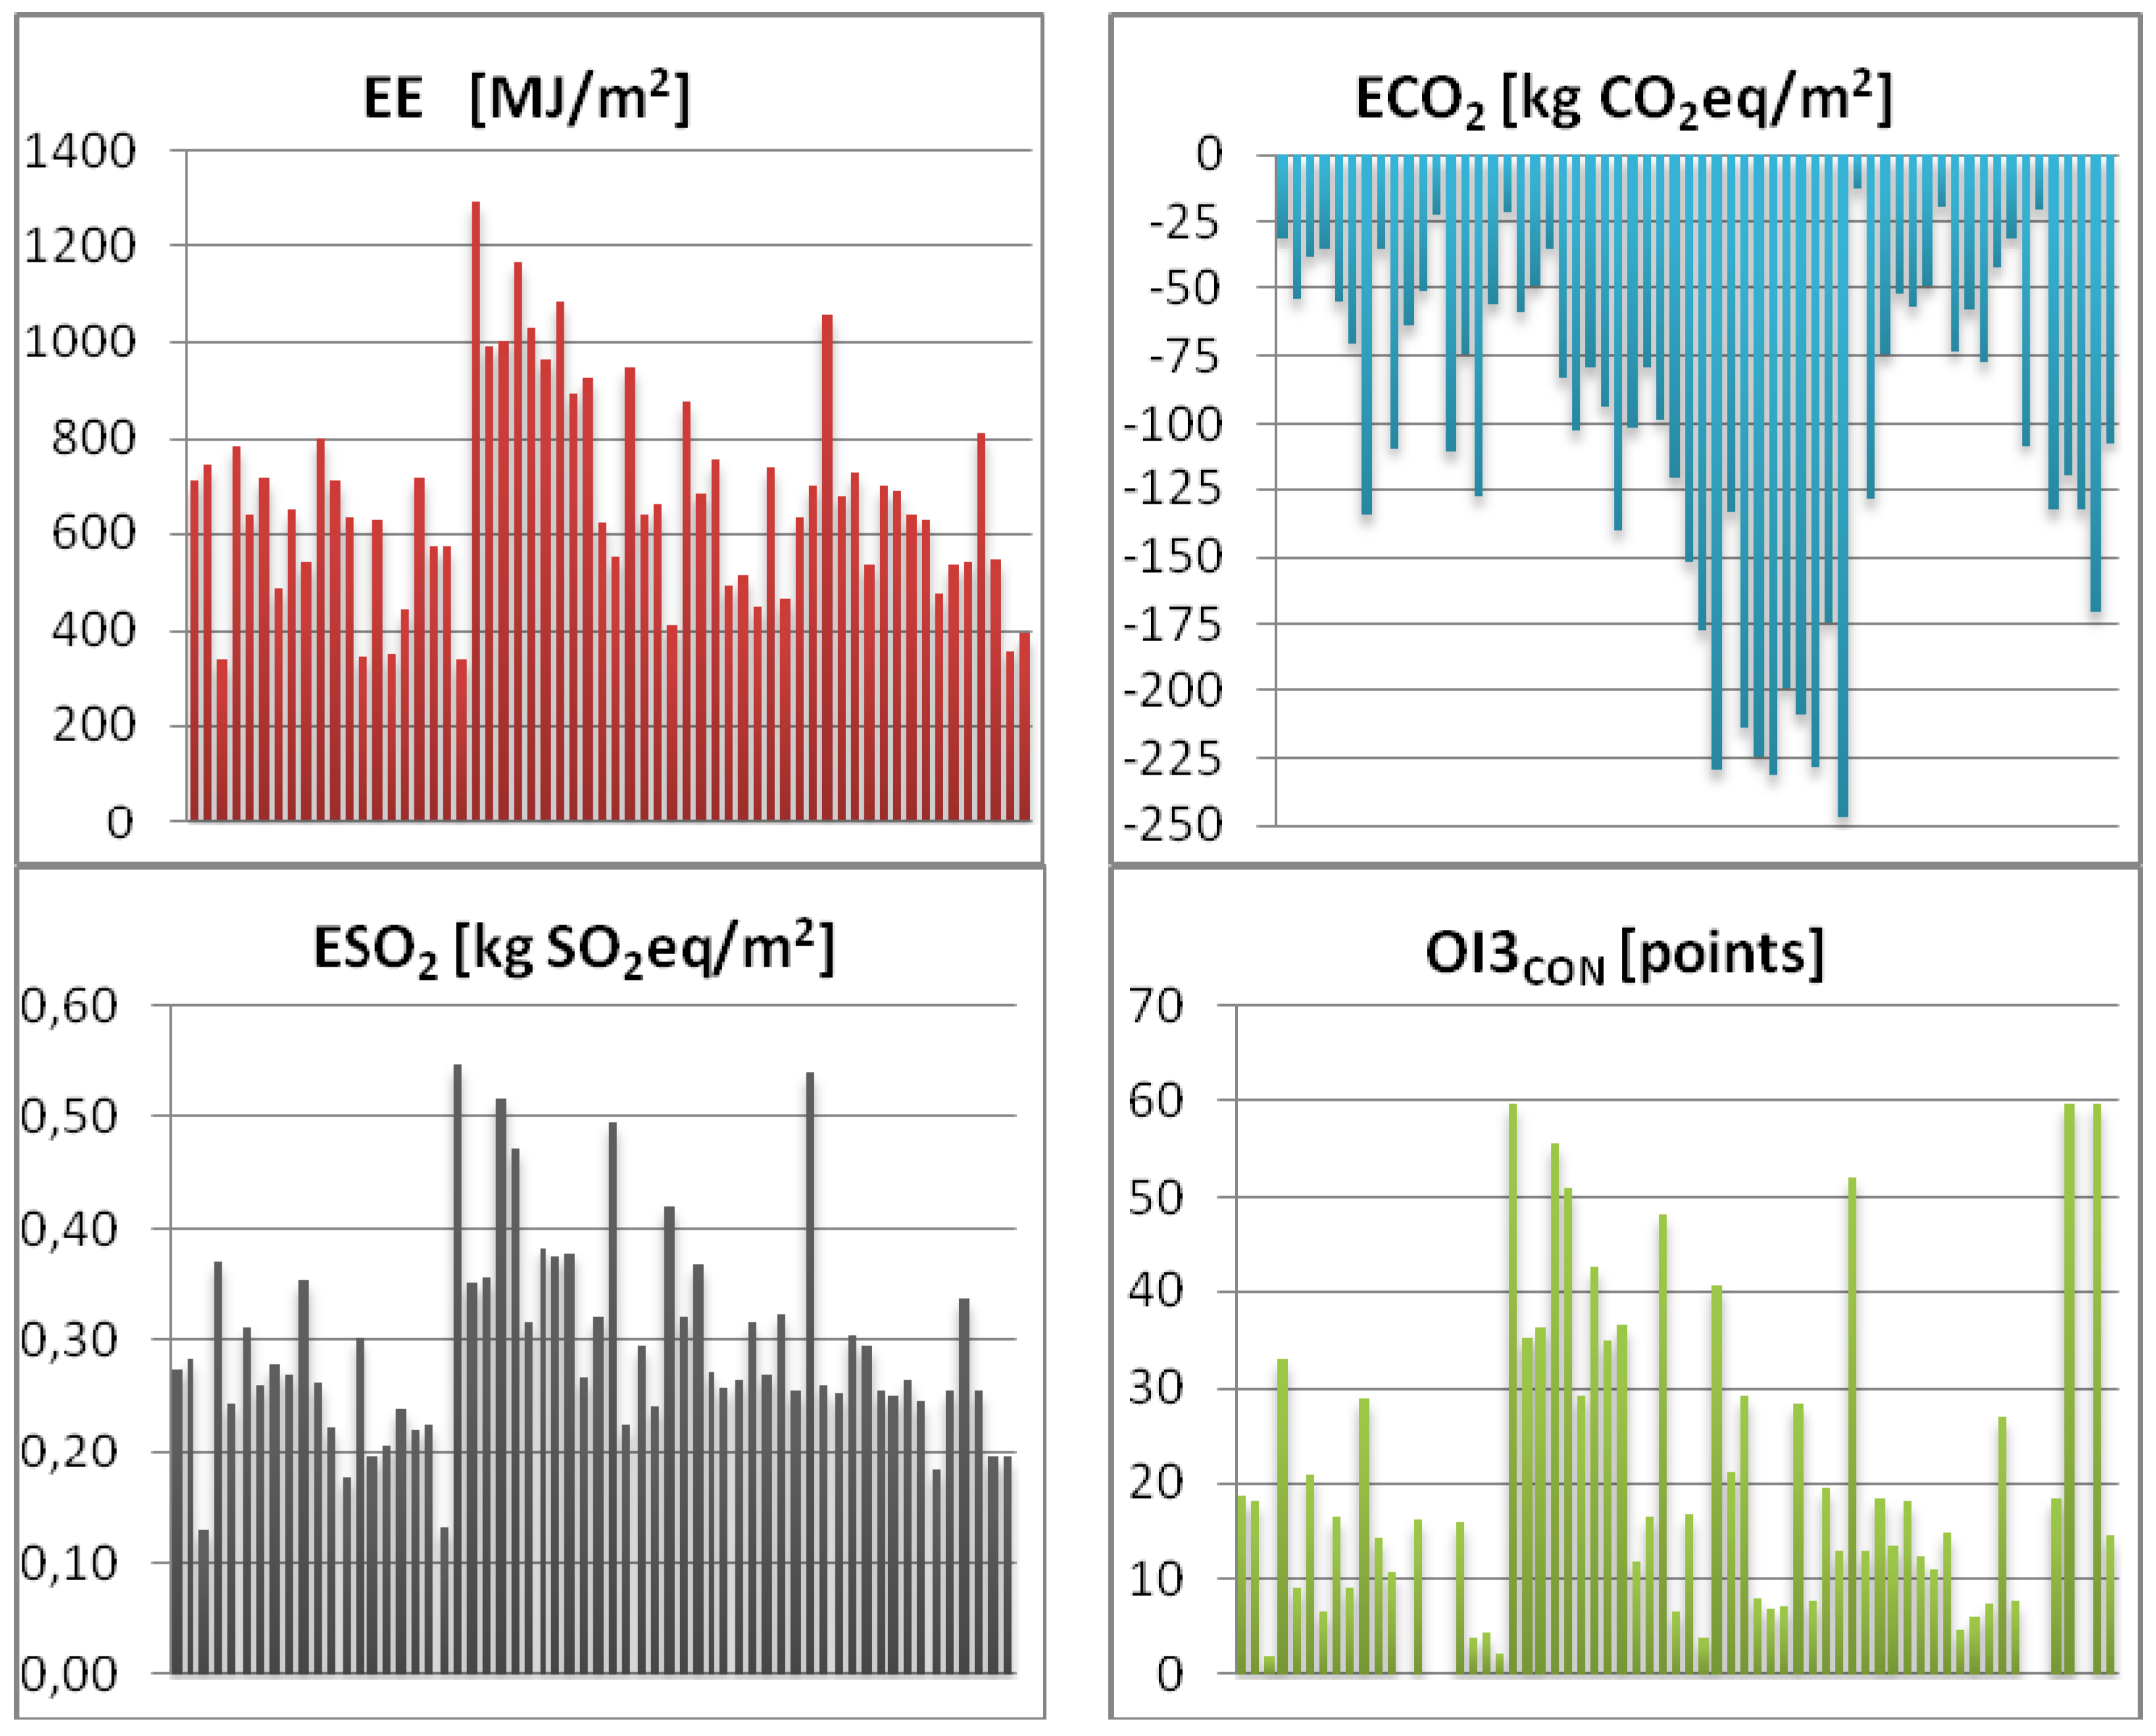
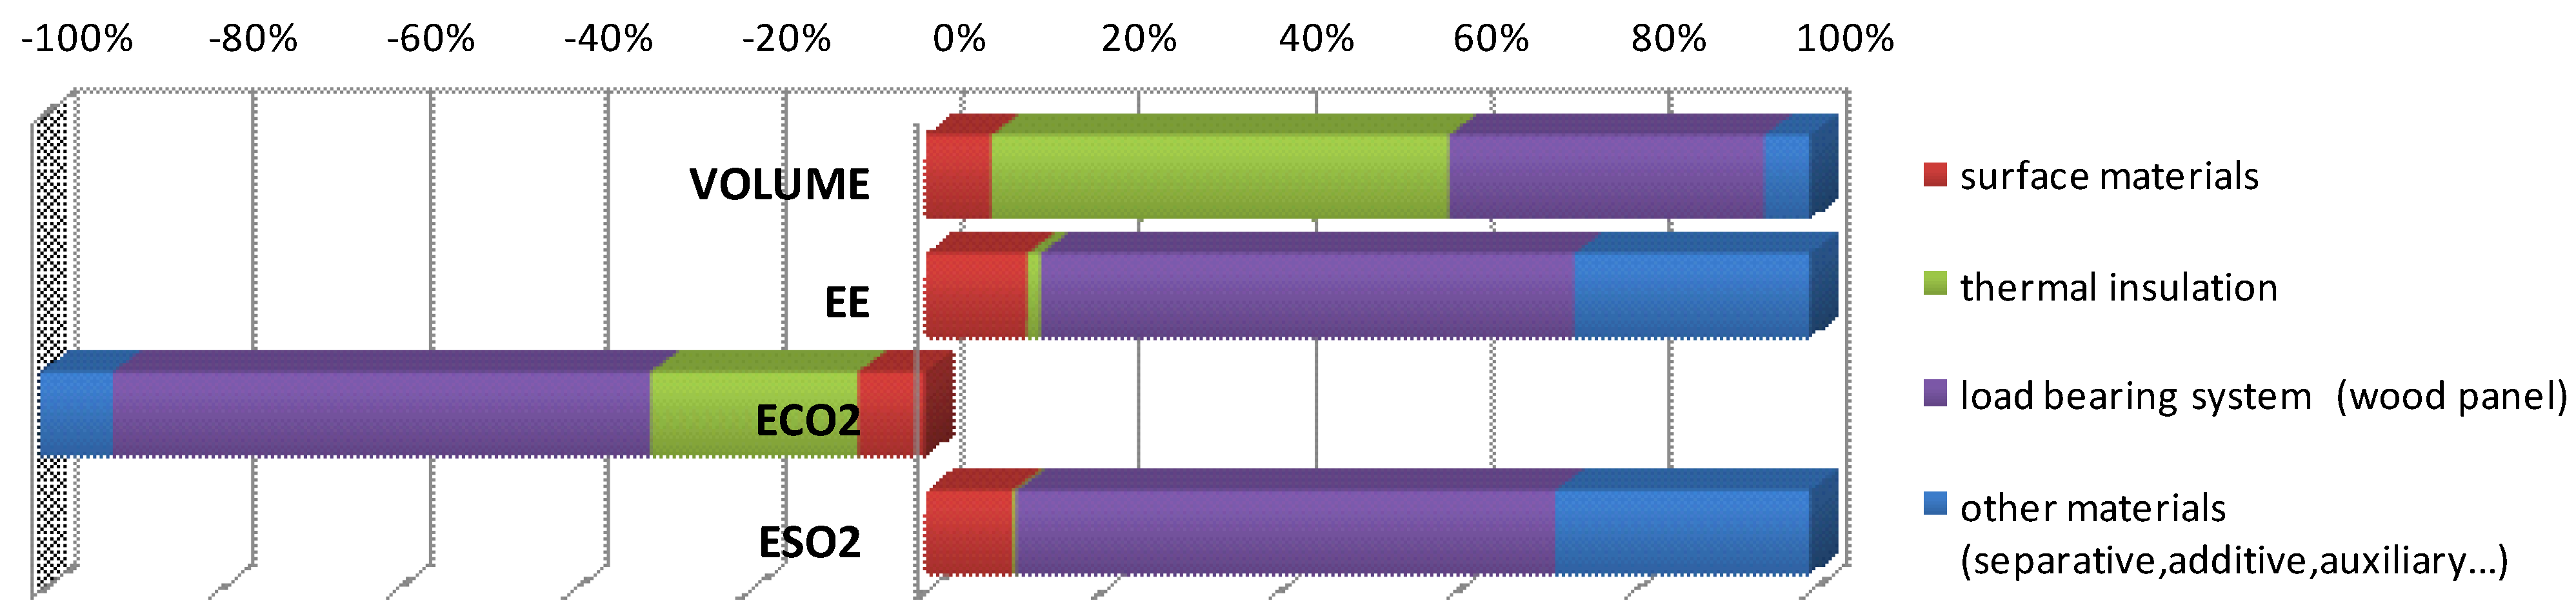
4.1. External Walls


| MCDA | 1. | 2. | 3. | 4. | 5. |
|---|---|---|---|---|---|
| WSA | 41 (0.888) | 35 (0.878) | 39 (0.836) | 59 (0.829) | 15 (0.762) |
| TOPSIS | 41 (0.894) | 35 (0.886) | 39 (0.859) | 34 (0.766) | 59 (0.748) |
| IPA | 41 (0.112) | 35 (0.122) | 39 (0.164) | 59 (0.171) | 15 (0.238) |
| CDA | 35 (7.481) | 41 (8.451) | 59 (9.710) | 15 (13.677) | 39 (14.006) |
| MCDA | 1. | 2. | 3. | 4. | 5. |
|---|---|---|---|---|---|
| WSA | 41 (0.879) | 35 (0.808) | 39 (0.789) | 36 (0.728) | 32 (0,706) |
| TOPSIS | 41 (0.889) | 35 (0.815) | 39 (0.805) | 36 (0.751) | 38 (0.744) |
| IPA | 41 (0.121) | 35 (0.192) | 39 (0.211) | 36 (0.272) | 32 (0.294) |
| CDA | 35 (9.104) | 41 (9.463) | 39 (12.161) | 59 (15.072) | 40 (16.675) |


4.2. Floor Constructions

| MCDA | 1. | 2. | 3. | 4. | 5. |
|---|---|---|---|---|---|
| WSA | 46 (0.895) | 48 (0.850) | 51 (0.834) | 18 (0.765) | 14 (0.765) |
| TOPSIS | 46 (0.874) | 48 (0.844) | 51 (0.819) | 30 (0.760) | 28 (0.765) |
| IPA | 46 (0.105) | 48. (0.150) | 51 (0.166) | 18 (0.235) | 14 (0.235) |
| CDA | 46. (2.908) | 51 (5.017) | 48 (6.809) | 14 (10.560) | 30 (12.855) |
| MCDA | 1. | 2. | 3. | 4. | 5. |
|---|---|---|---|---|---|
| WSA | 46 (0.857) | 48 (0.785) | 51(0.747) | 30 (0.655) | 14 (0.636) |
| TOPSIS | 46 (0.861) | 48 (0.808) | 51 (0.711) | 30. (0.661) | 44 (0.661) |
| IPA | 46 (0.143) | 48 (0.215) | 51 (0.253) | 30 (0.345) | 14 (0.364) |
| CDA | 46 (2.707) | 51 (5.452) | 48 (6.704) | 14 (11.754) | 30 (12.968) |


| Environmental evaluation | Overall evaluation | ||||
|---|---|---|---|---|---|
| MCDA | 1. | 2. | MCDA | 1. | 2. |
| WSA | 55 (0.729) | 60 (0.721) | WSA | 60 (0.707) | 52 (0.522) |
| TOPSIS | 60 (0.728) | 55 (0.604) | TOPSIS | 60 (0.728) | 55 (0.603) |
| IPA | 55 (0.271) | 60 (0.279) | IPA | 60 (0.293) | 52 (0.478) |
| CDA | 55 (1.856) | 60 (2.077) | CDA | 60 (3.036) | 61 (4.816) |
| MCDA | 1. | 2. | 3. | 4. | 5. |
|---|---|---|---|---|---|
| WSA | 46 (0.895) | 48 (0.850) | 51 (0.834) | 18 (0.765) | 14 (0.765) |
| TOPSIS | 46 (0.874) | 48 (0.844) | 51 (0.819) | 30 (0.760) | 28 (0.765) |
| IPA | 46 (0.105) | 48 (0.150) | 51 (0.166) | 18 (0.235) | 14 (0.235) |
| CDA | 46 (2.908) | 51 (5.017) | 48 (6.809) | 14 (10.560) | 30 (12.855) |
| MCDA | 1. | 2. | 3. | 4. | 5. |
|---|---|---|---|---|---|
| WSA | 55 (0.584) | 46 (0.556) | 60 (0.555) | 48 (0.527) | 58 (0.516) |
| TOPSIS | 60 (0.704) | 58 (0.680) | 55 (0.680) | 52 (0.674) | 61 (0.670) |
| IPA | 55 (0.416) | 46 (0.444) | 60 (0.445) | 48 (0.473) | 58 (0.480) |
| CDA | 46 (17.174) | 48 (19.631) | 51 (22.071) | 44 (26.109) | 42 (28.335) |


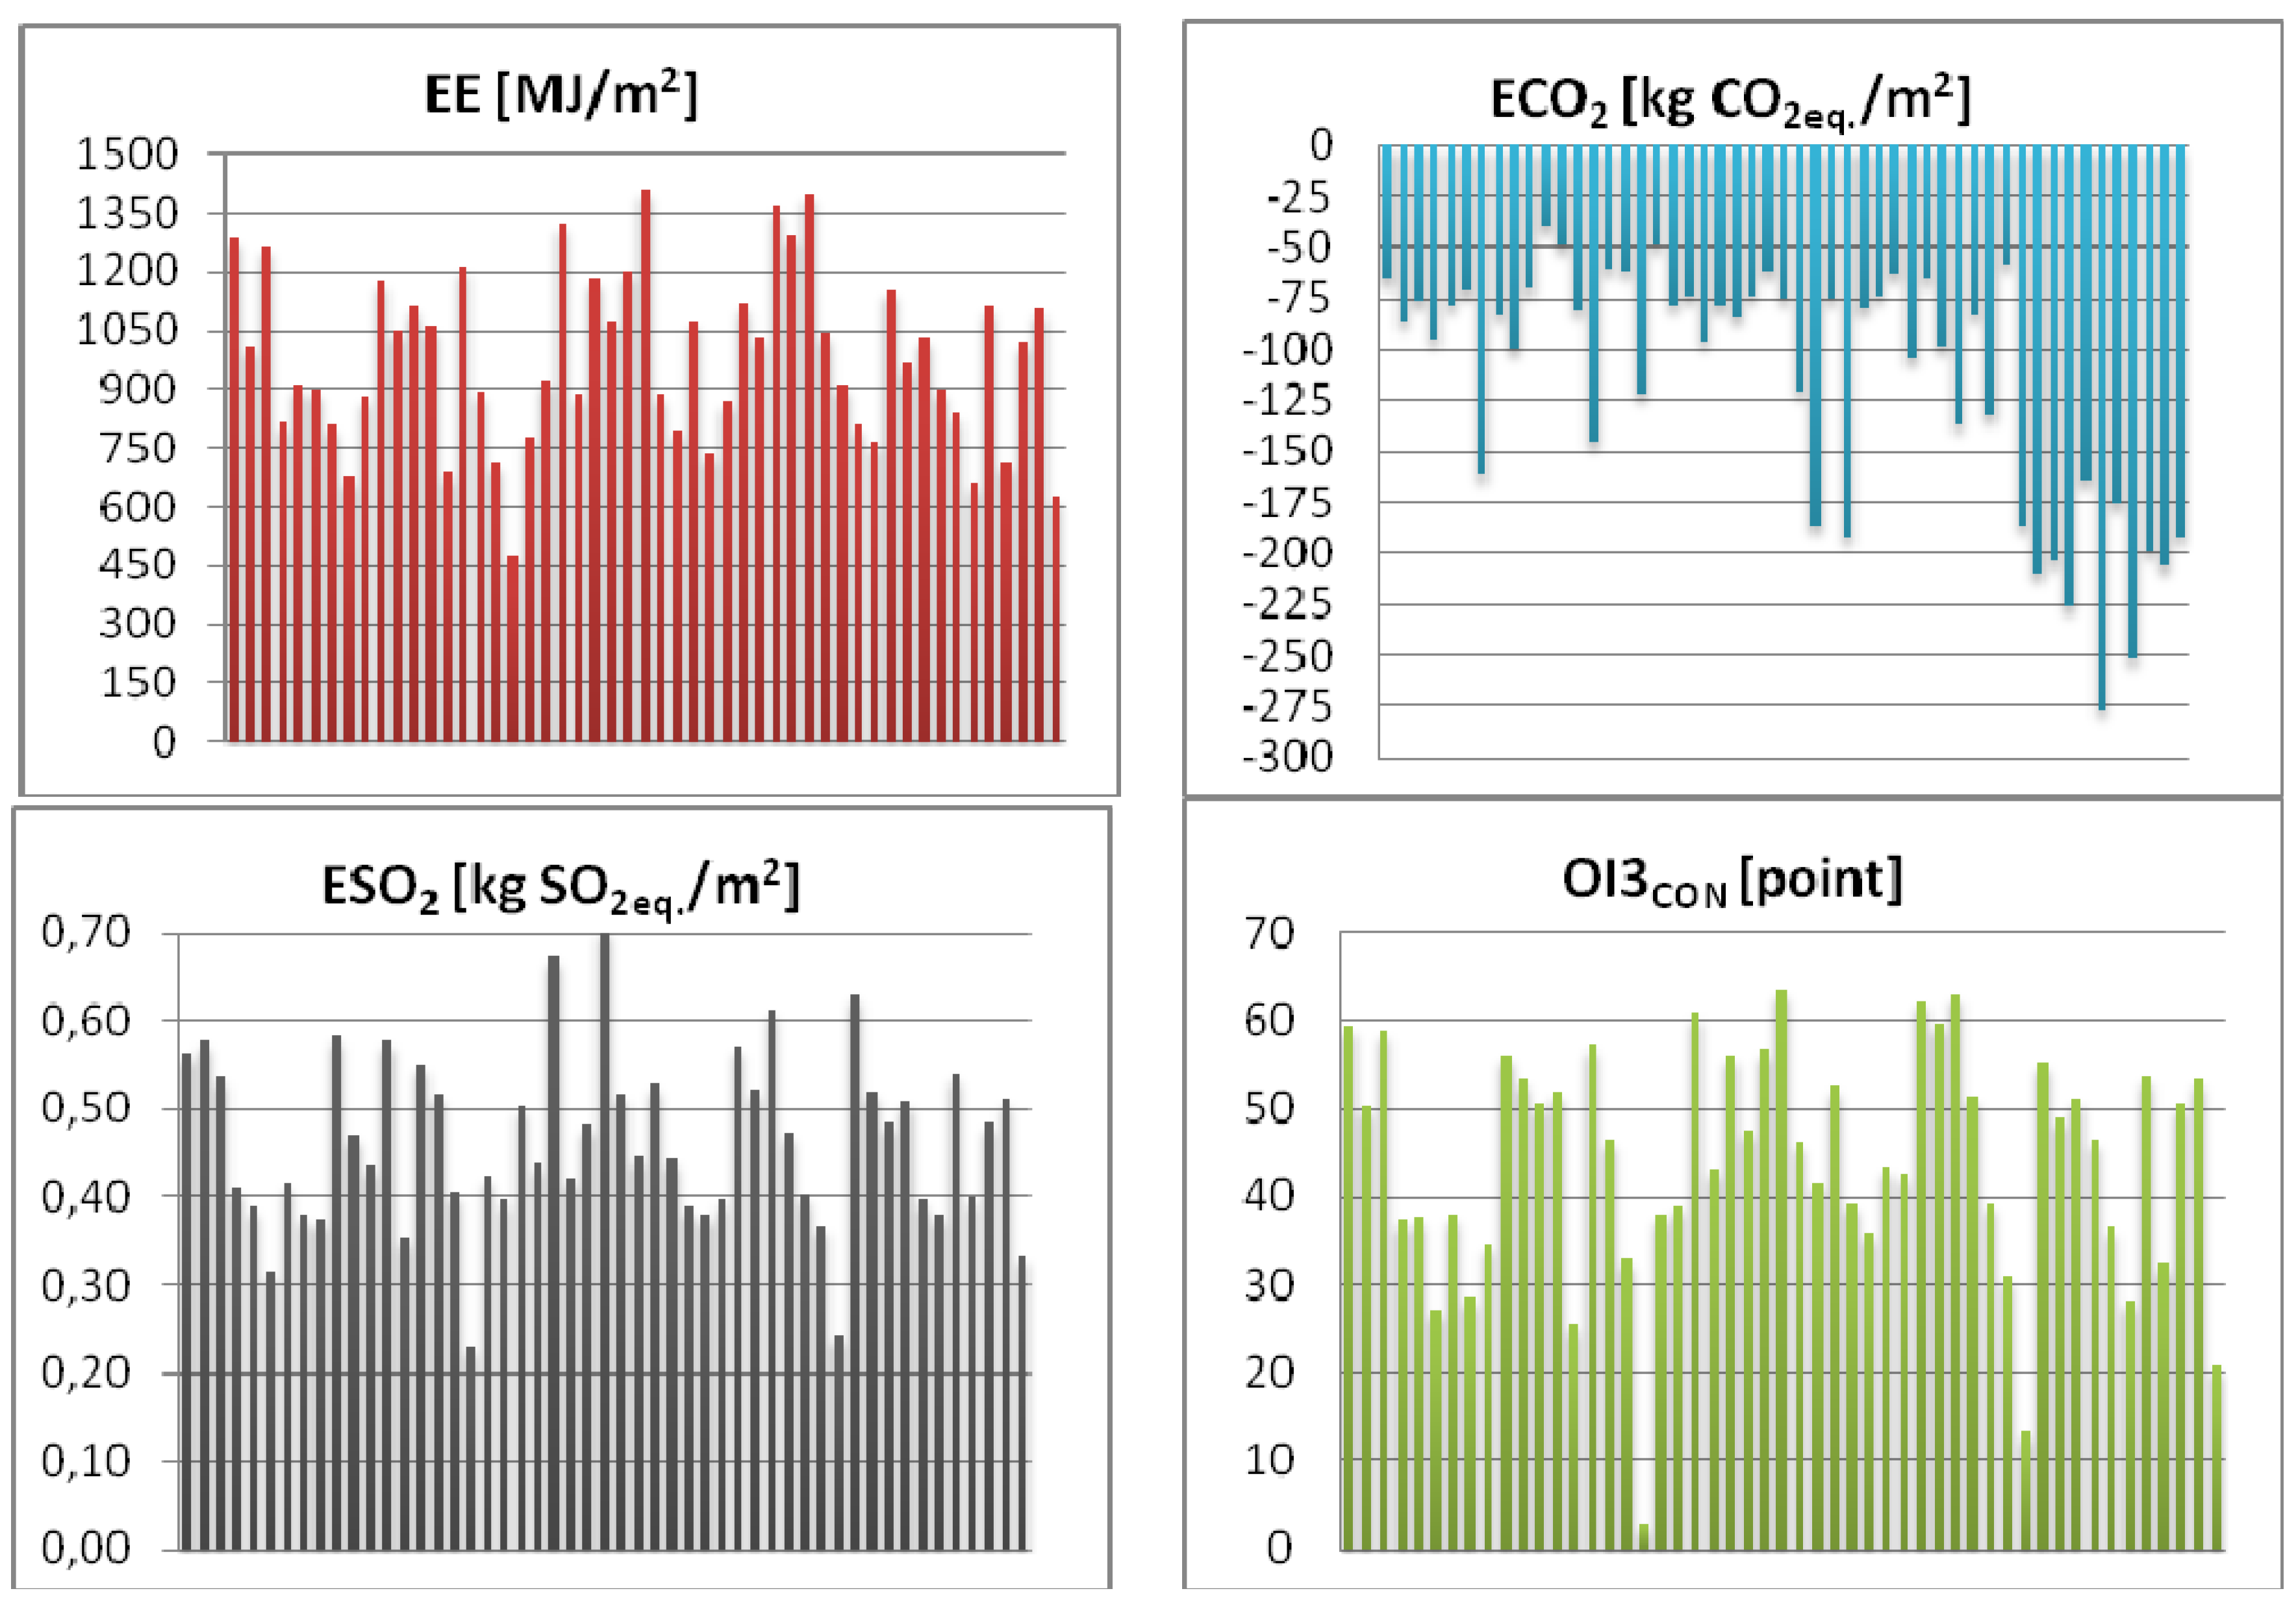
4.3. Roof Constructions


| MCDA | 1. | 2. | 3. | 4. | 5. |
|---|---|---|---|---|---|
| WSA | 49 (0.931) | 53 (0.803) | 46 (0.779) | 32 (0.750) | 19 (0.707) |
| TOPSIS | 49 (0.948) | 53 (0.730) | 46 (0.721) | 55 (0.699) | 50 (0.679) |
| IPA | 49 (0.070) | 53 (0.197) | 46 (0.221) | 32 (0.250) | 19 (0.293) |
| CDA | 49 (3.252) | 53 (5.427) | 46 (8.344) | 32 (10.310) | 19 (10.898) |
| MCDA | 1. | 2. | 3. | 4. | 5. |
|---|---|---|---|---|---|
| WSA | 49 (0.936) | 55 (0.750) | 46 (0.743) | 47 (0.723) | 53 (0.719) |
| TOPSIS | 49 (0.935) | 55 (0.757) | 46 (0.735) | 53 (0.702) | 50 (0.698) |
| IPA | 49 (0.064) | 55 (0.250) | 46 (0.257) | 47 (0.277) | 53 (0.281) |
| CDA | 49 (7.563) | 53 (9.418) | 46 (9.748) | 47 (9.998) | 51 (12.082) |


5. Conclusions
- -
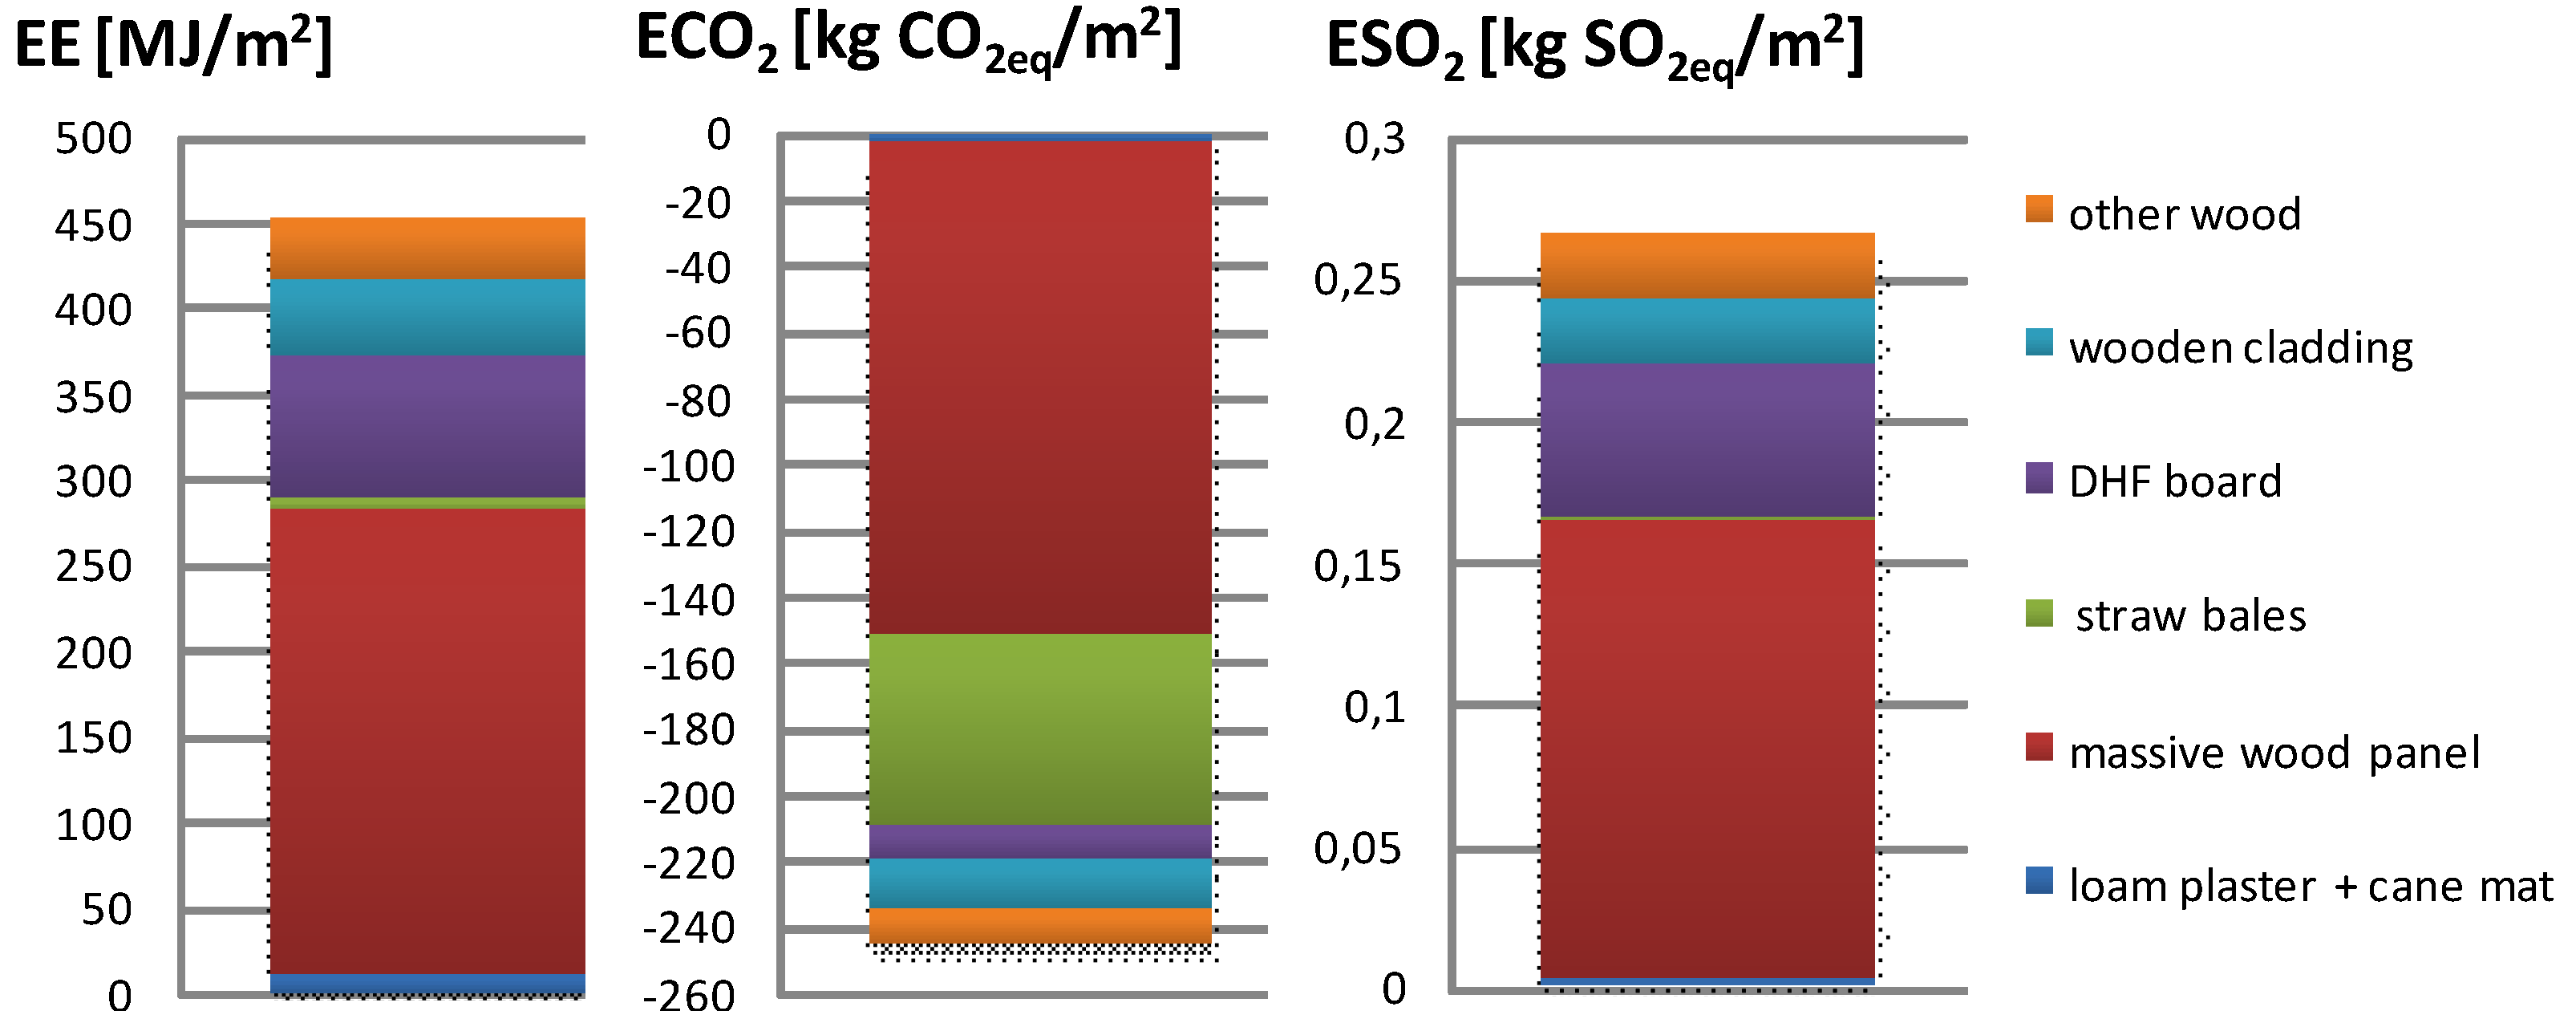
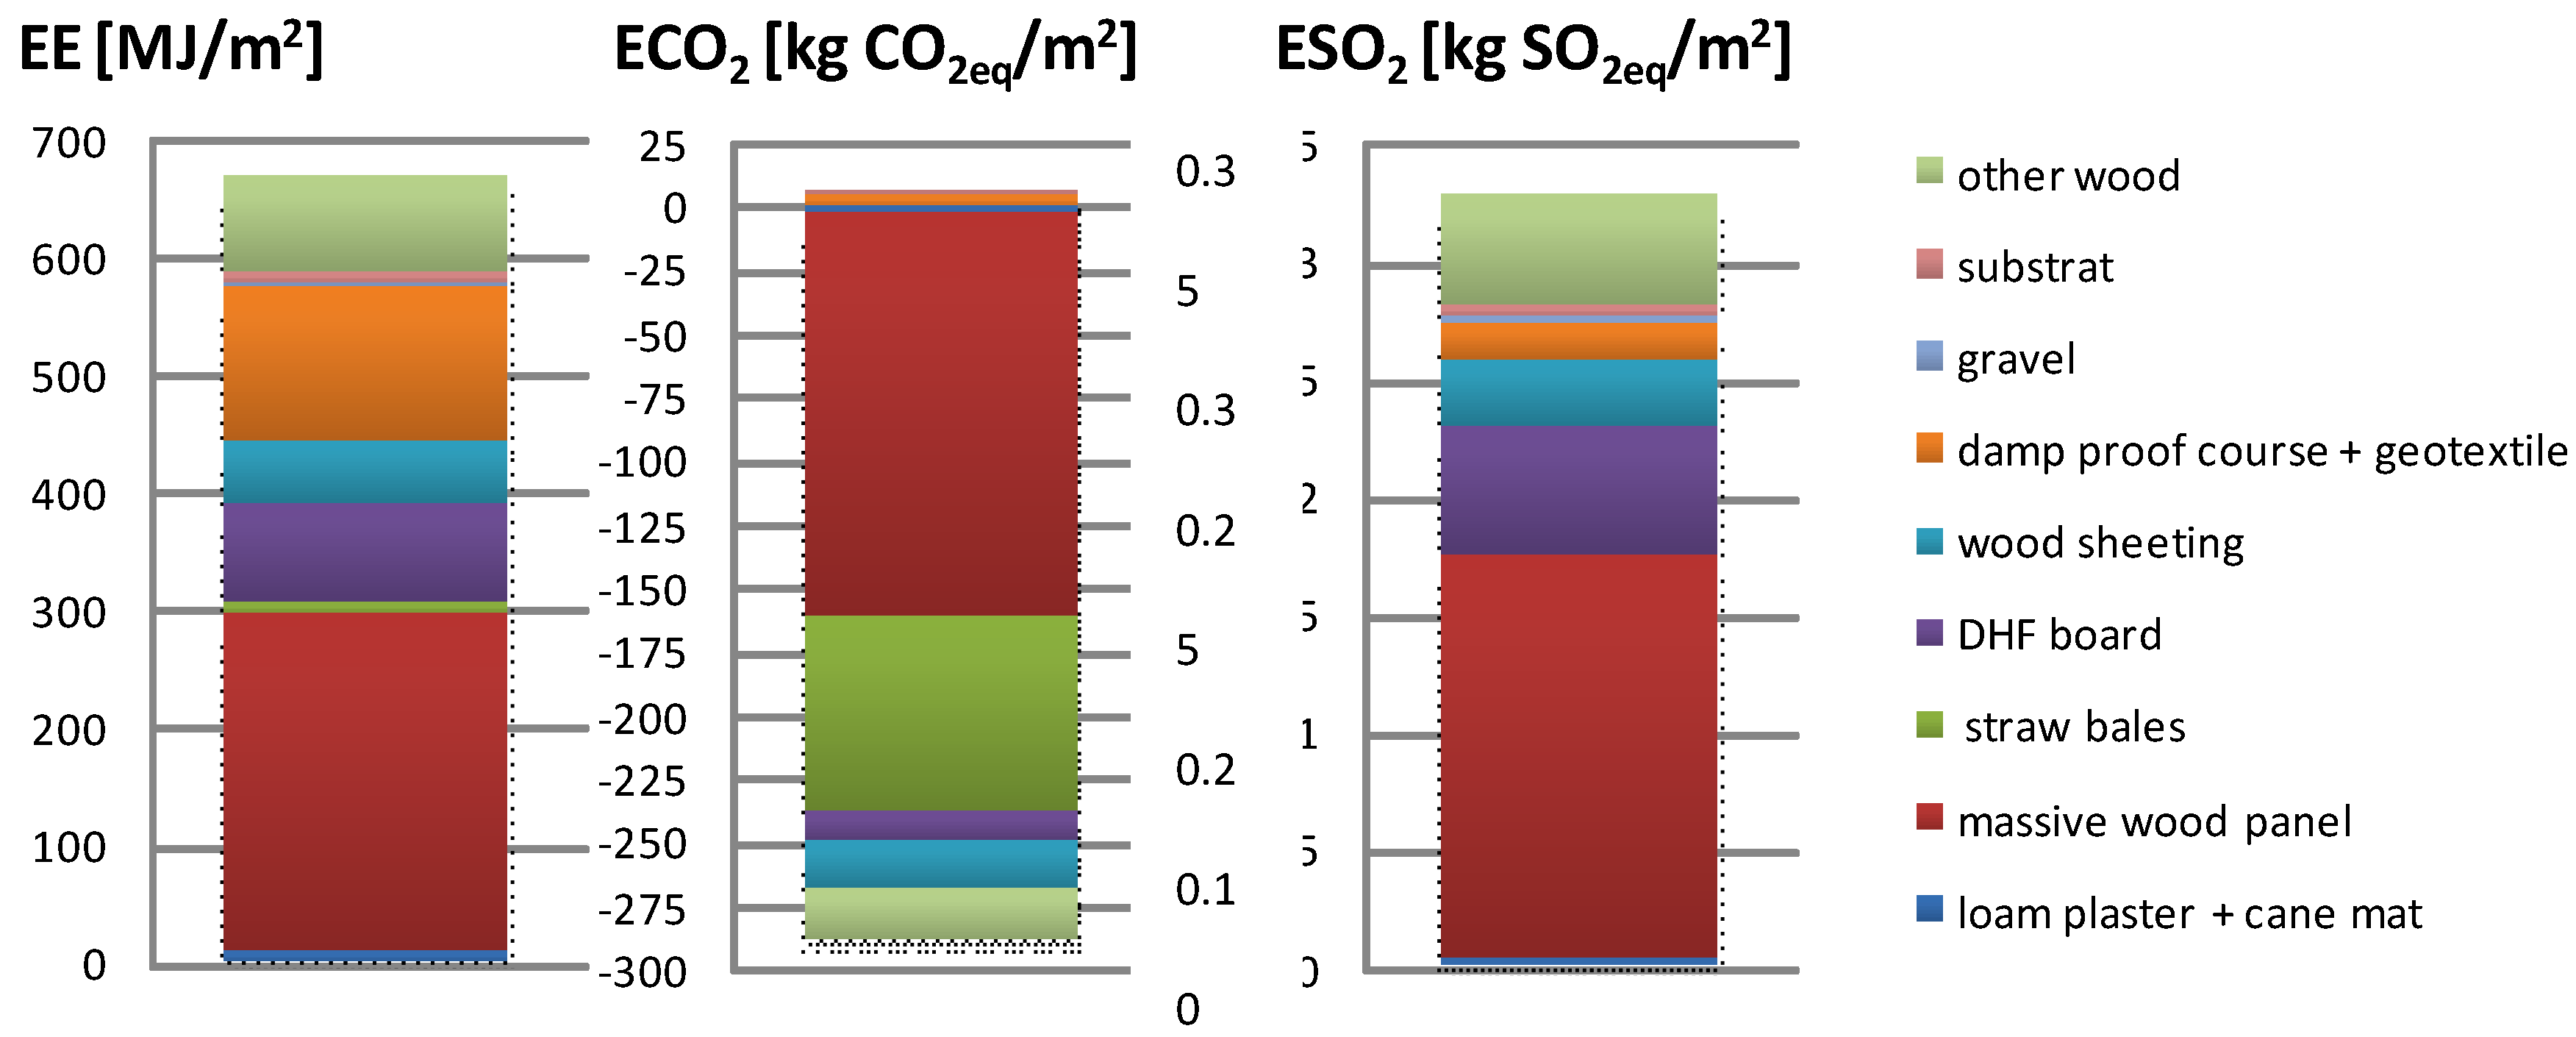
- The best external wall alternative is composed of wood cladding (0.022 m), DHF board (0.015 m), straw bales of 90 kg/m3 (0.300 m) between I-profiles, a massive wood panel (0.200 m), and loam plaster with cane (0.020 m).
- -
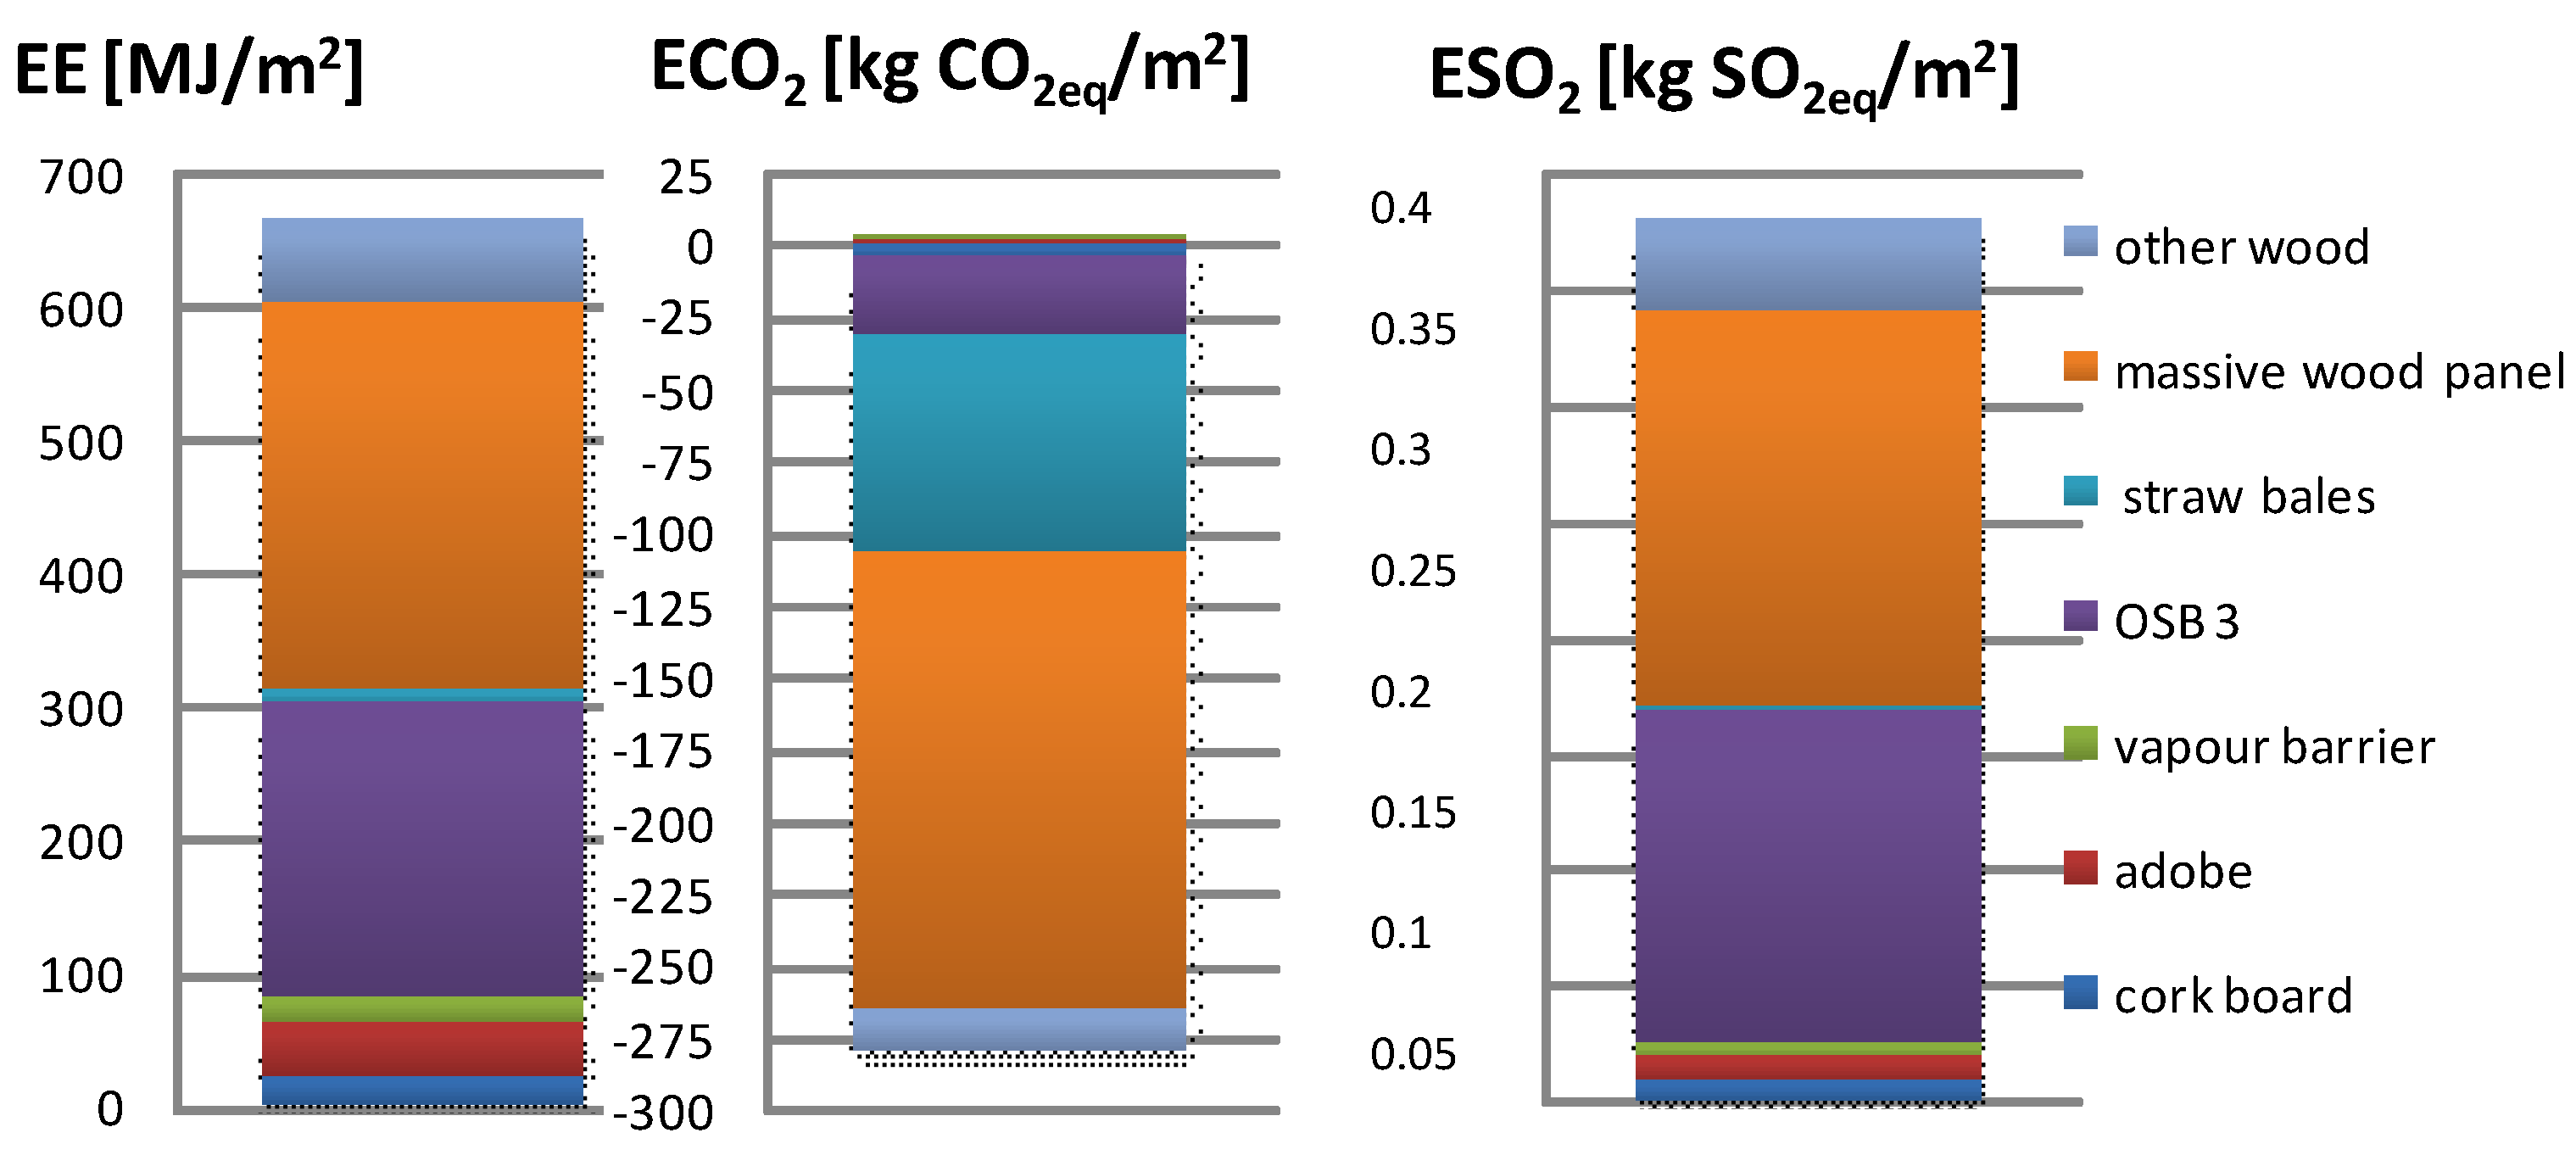
- The best above-the-ground floor alternative is composed of cork board (0.020 m), adobe brick (0.060 m), vapor barrier, OSB 3 board (0.036 m), straw bales of 90 kg/m3 (0.400 m) between I-profiles, and a massive wood panel (0.212 m).
- -
- The best on-the-ground floor alternative is composed of blocks of wood (0.012 m), cork (0.008 m), concrete slab (0.200 m), water proofing + geotextile, foam glass (0.500 m), separated geotextiles, and soil.
- -
- The best roof structure alternative is composed of loam plaster with cane (0.020 m), a massive wood panel (0.212 m), straw bales of 90 kg/m3 (0.400 m) between I-profiles, DHF board (0.015 m), wood sheeting (0.080 m), water proofing + geotextiles, gravel (0.030 m), and substrate (0.060 m).
Acknowledgments
Author Contributions
Conflicts of Interest
Nomenclature
| LCA | life-cycle assessment |
| LCIA | life-cycle impact assessment |
| GHG | green house gas |
| EE | embodied energy |
| ECO2 | global warming potential (GWP) |
| ESO2 | acidification potential (AP) |
| ΔOI3 | environmental indicator describing the impact of a building material in a given construction layer |
| MCDA | multi-criteria decision analysis |
| AHP | analytical hierarchy process |
| WSA | weighted sum approach |
| IPA | ideal points analysis |
| CDA | concordance discordance analysis |
| TOPSIS | technique for order preference by similarity to ideal solution |
| BEAS | building environmental assessment system |
| MTS | massive timber structure |
| CLT | cross laminated timber |
| Glulam | glued laminated timber |
| FB | fiberboard |
| VIP | vacuum insulation panels |
| PUR | polyisocyanurate |
| PIR | polystyrene |
| GFP | gas-filled panels |
| PCM | phase change materials |
| PE | polyethylene |
| θe/θi | outdoor/indoor air temperature (°C) |
| θsi | minimal surface temperature (°C) |
| Rhe/Rhi | outdoor/indoor relative humidity (%) |
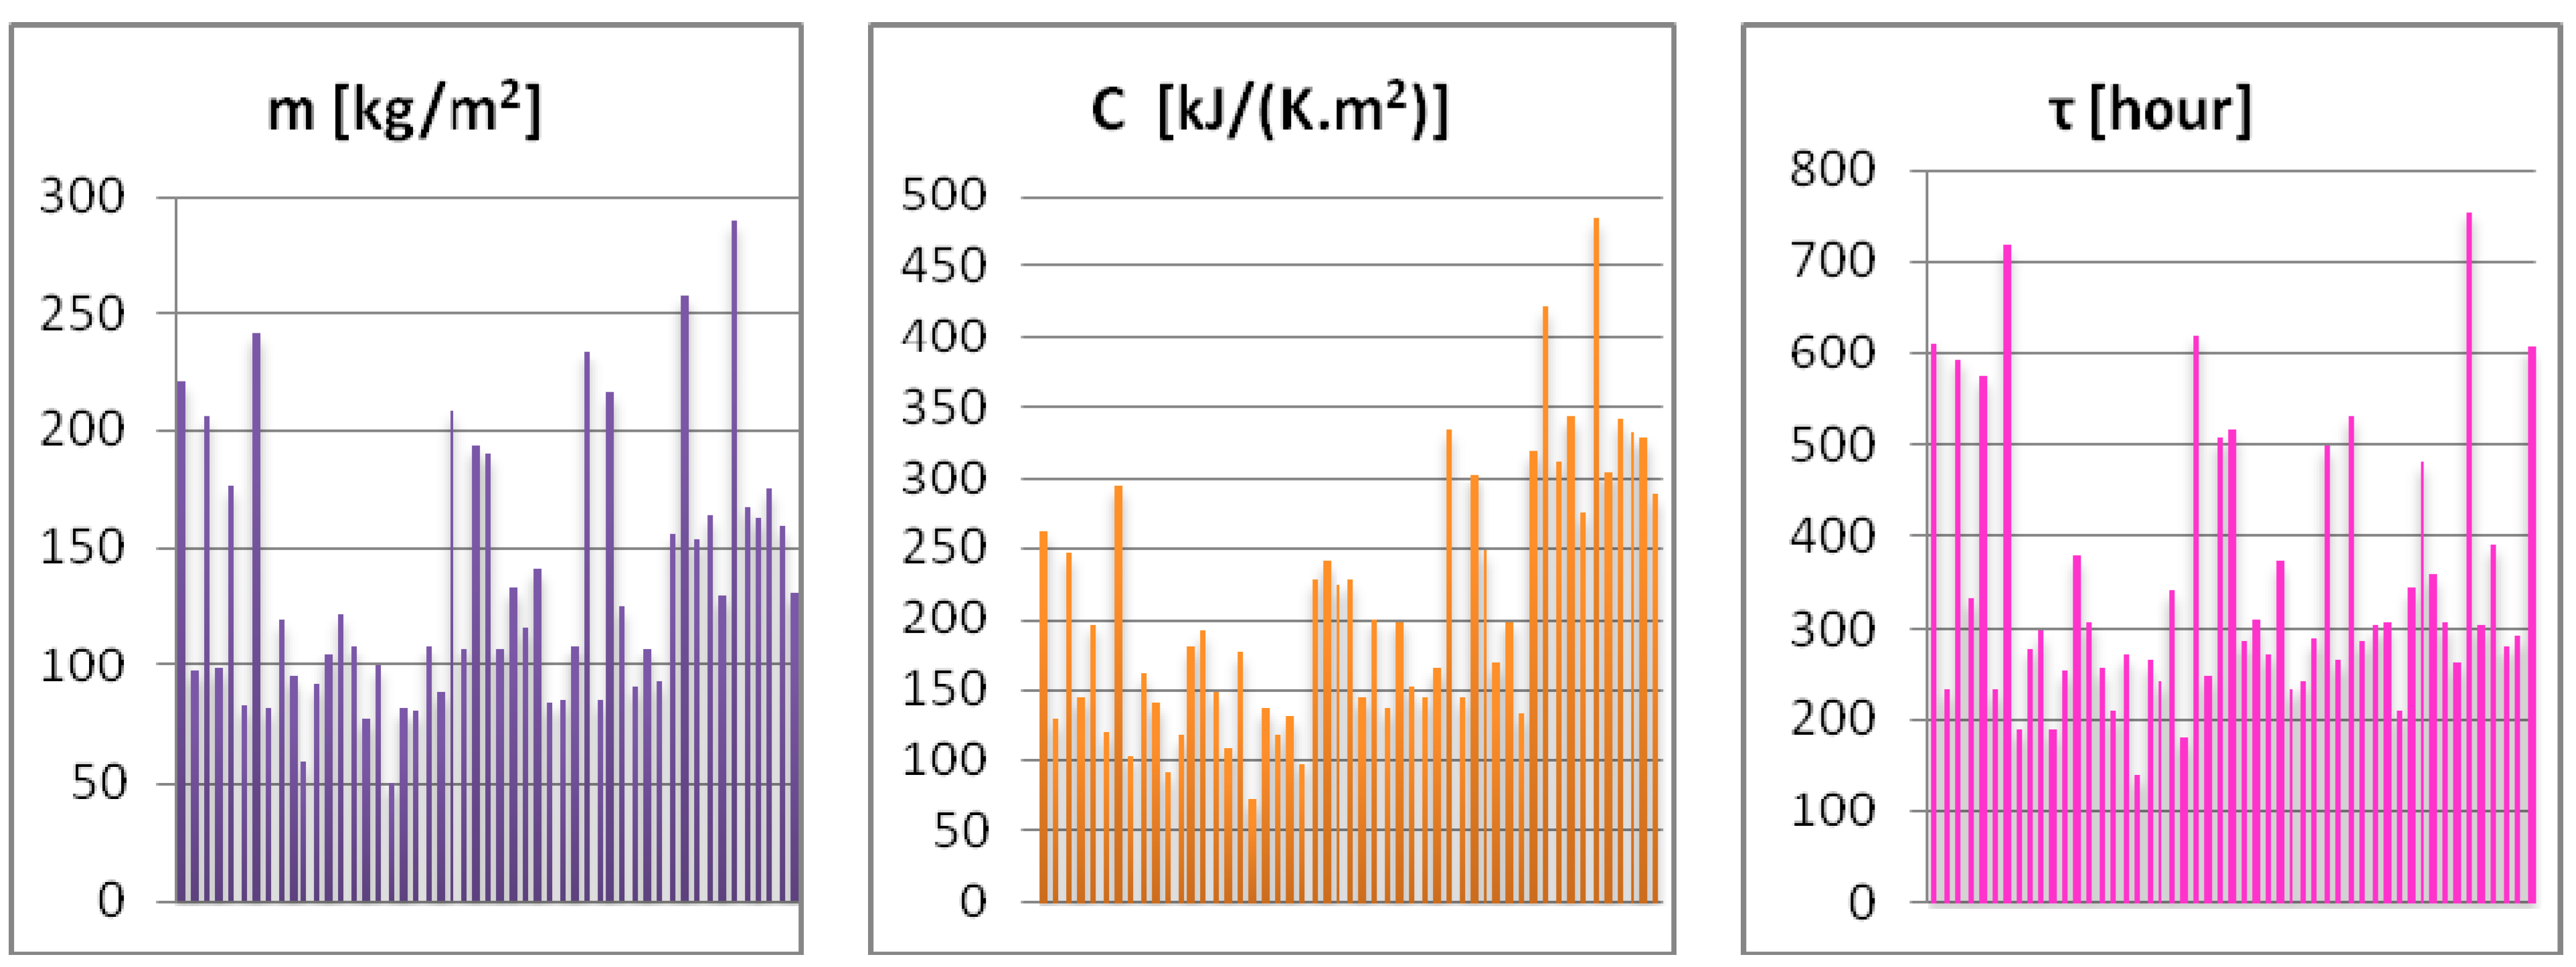
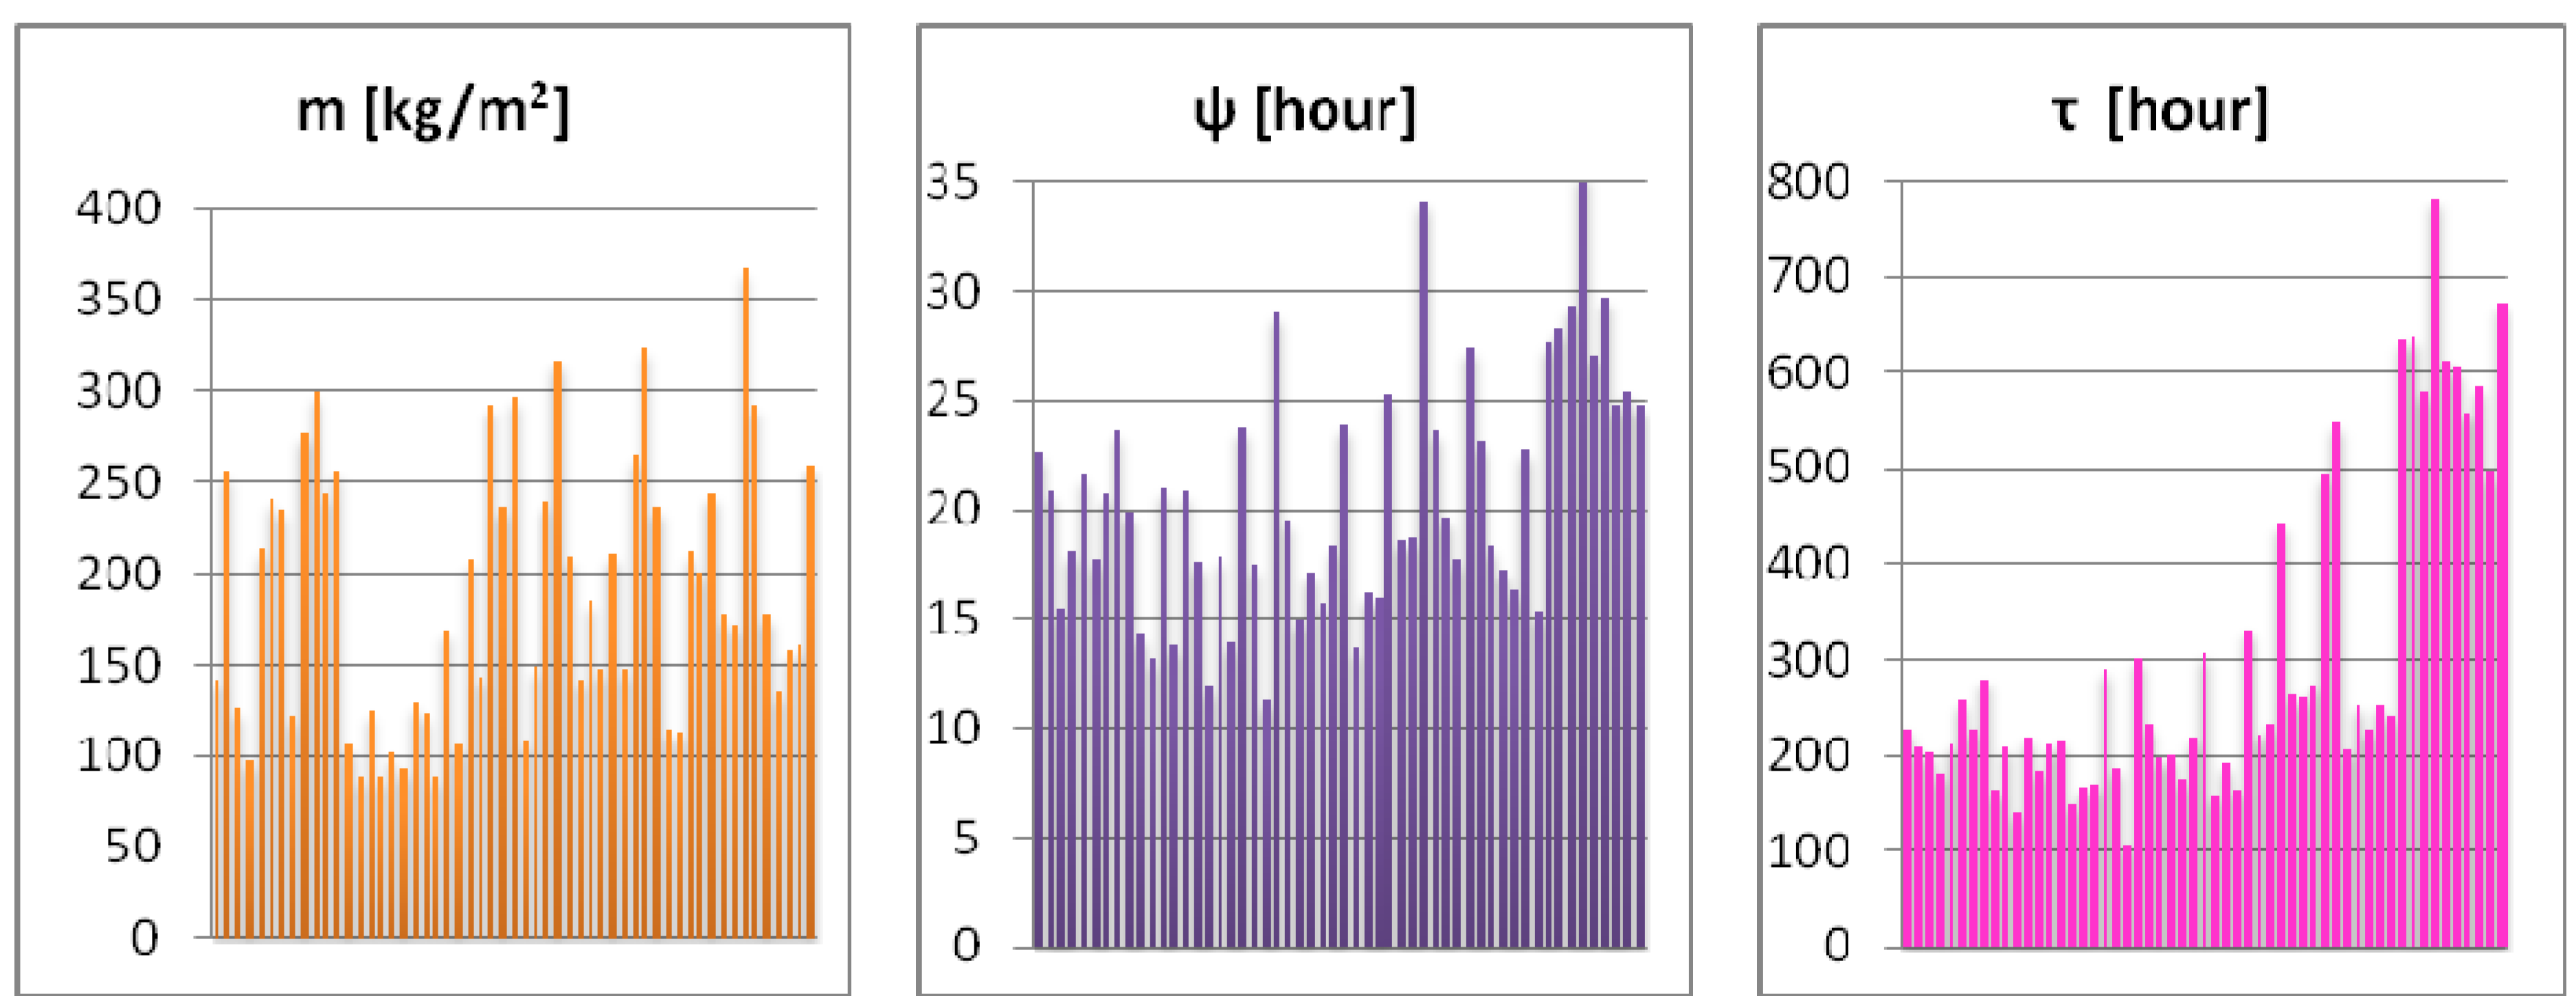
| m | area weight (kg/m2) |
| d | thickness (mm) |
| ρ | density (kg/m3) |
| U | heat transfer coefficient (W/(m2·K)) |
| C | surface thermal capacity (kJ/K·m2) |
| fRsi | temperature factor |
| ψ | phase shift of thermal oscillation (h) |
| Ψe | linear thermal transmittance (W/m·K) |
| λ | thermal conductivity coefficient (W/(m·K)) |
| τ | relaxation time (h) |
| a | thermal diffusivity (m2/s) |
References
- Neiva, S.; Mateus, R.; Bragança, L. Environmental LCA database for conventional Portuguese building Technologies. In Proceedings of the 1st International Conference on Building Sustainability Assessment, Porto, Portugal, 23–25 May 2012; pp. 613–620.
- Cordero, R.R.; Roth, P.; da Silva, L. Economic growth or environmental protection? The false dilemma of the Latin-American countries. Environ. Sci. Policy 2005, 8, 392–398. [Google Scholar] [CrossRef]
- Akadiri, O.P. ICT Development of a multi-criteria approach for the selection of sustainable materials for building projects. Ph.D. Thesis, University of Wolverhampton, West Midlands, UK, February 2011; p. 437. [Google Scholar]
- Energy, Transport and Environment Indicators. Eurostat. Pocketbooks. 2014. Available online: http://ec.europa.eu/eurostat/documents/3930297/6613266/KS-DK-14–001-EN-N.pdf/4ec0677e-8fec-4dac-a058–5f2ebd0085e4 (accessed on 7 July 2015).
- Dodoo, A.; Gustavsson, L.; Sathre, R. Building energy-efficiency standards in a life cycle primary energy perspective. Energy Build. 2011, 43, 1589–1597. [Google Scholar] [CrossRef]
- Balaras, C.A.; Gaglia, A.G.; Georgopoulou, E.; Mirasgedis, S.; Sarafidis, Y.; Lalas, D.P. European residential buildings and empirical assessment of the Hellenic building stock, energy consumption, emissions and potential energy savings. Build. Environ. 2007, 42, 1298–1314. [Google Scholar] [CrossRef]
- Poel, B.; Cruchtena, G.; Balaras, C.A. Energy performance assessment of existing dwellings. Energy Build. 2007, 39, 393–403. [Google Scholar] [CrossRef]
- Acquaye, A.A.; Duffy, A.P.; Basu, B. Stochastic hybrid embodied CO2-eq analysis: An application to the Irish apartment building sector. Energy Build. 2011, 43, 1295–1303. [Google Scholar] [CrossRef]
- Huberman, N.; Pearlmutter, D. A life-cycle energy analysis of building materials in the Negev desert. Energy Build. 2008, 40, 837–848. [Google Scholar] [CrossRef]
- Paleari, M.; Lavagna, M.; Campioli, A. Life cycle assessment of a zero energy residential building. In Proceedings of the 1st International Conference on Building Sustainability Assessment, Porto, Portugal, 23–25 May 2012; pp. 641–650.
- Dimoudi, A.; Tompa, C. Energy and environmental indicators related to construction of office buildings. Resour. Conserv. Recycl. 2008, 53, 86–95. [Google Scholar] [CrossRef]
- Soares, N.; Costa, J.J.; Gaspar, A.R.; Santos, P. Review of passive PCM latent heat thermal energy storage systems towards buildings’ energy efficiency. Energy Build. 2013, 59, 82–103. [Google Scholar] [CrossRef]
- Frenette, C.D.; Bulle, C.; Beauregard, R.; Salenikovich, A.; Derome, D. Using life cycle assessment to derive an environmental index for light-frame wood wall assemblies. Build. Environ. 2010, 45, 2111–2122. [Google Scholar] [CrossRef]
- Monahan, J.; Powell, J.C. An embodied carbon and energy analysis of modern methods of construction in housing: A case study using a lifecycle assessment framework. Energy Build. 2011, 43, 179–188. [Google Scholar] [CrossRef]
- Sartori, I.; Hestnes, A.G. Energy use in the life cycle of conventional and low energy buildings: A review article. Energy Build. 2007, 39, 249–257. [Google Scholar] [CrossRef]
- Scheuer, C.; Keoleian, G.A.; Reppe, P. Life cycle energy and environmental performance of a new university building. Energy Build. 2003, 35, 1049–1064. [Google Scholar] [CrossRef]
- Petersen, A.; Solberg, B. Greenhouse gas emissions, life-cycle inventory and cost-efficiency of using laminated wood instead of steel construction. Environ. Sci. Policy 2002, 5, 169–182. [Google Scholar] [CrossRef]
- Thormark, C. The effect of material choice on the total energy need and recycling potential of a building. Build. Environ. 2006, 41, 1019–1026. [Google Scholar] [CrossRef]
- Stephan, A.; Crawford, R.H.; Myttenaere, K. Towards a comprehensive life cycle energy analysis framework for residential buildings. Energy Build. 2012, 55, 592–600. [Google Scholar] [CrossRef]
- Coelho, A.C.; Branco, J.M.; Gervásio, H. Life-cycle assessment of a single-family timber house. In Proceedings of the 1st International Conference on Building Sustainability Assessment, Porto, Portugal, 23–25 May 2012; pp. 533–542.
- Borjesson, P.; Gustavsson, L. Greenhouse gas balances in building construction: Wood versus concrete from life-cycle and forest land-use perspectives. Energy Policy 2000, 28, 575–588. [Google Scholar] [CrossRef]
- Liu, M.; Li, B.; Yao, R. A generic model of exergy assessment for the environmental impact of building lifecycle. Energy Build. 2010, 42, 1482–1490. [Google Scholar] [CrossRef]
- Monteiro, H.; Freire, F. Environmental life-cycle impacts of a single-family house in Portugal. Gazi Univ. J. Sci. 2011, 24, 527–534. [Google Scholar]
- Verbeeck, G.; Hens, H. Life cycle inventory of buildings: A contribution analysis. Build. Environ. 2010, 45, 964–967. [Google Scholar] [CrossRef]
- Cuéllar-Franca, R.M.; Azapagic, A. Environmental impacts of the UK residential sector: Life cycle assessment of houses. Build. Environ. 2012, 54, 86–99. [Google Scholar] [CrossRef]
- Blengini, G.A.; Carlo, T.D. The changing role of life cycle phases, subsystems and materials in the LCA of low energy buildings. Energy Build. 2010, 42, 869–880. [Google Scholar] [CrossRef]
- Zhang, X.; Wang, F. Life-cycle assessment and control measures for carbon emissions of typical buildings in China. Build. Environ. 2015, 86, 89–97. [Google Scholar] [CrossRef]
- Airaksinen, M.; Matilainen, P. A carboon footprint of an office building. Energies 2011, 4, 1197–1210. [Google Scholar] [CrossRef]
- Heinonen, J.; Säynäjoki, A.; Kuronen, M.; Junnila, S. Are the greenhouse gas implications of new residential developments understood wrongly? Energies 2012, 5, 2874–2893. [Google Scholar] [CrossRef]
- Cole, R.J. Energy and greenhouse gas emissions associated with the construction of alternative structural systems. Build. Environ. 1999, 34, 335–348. [Google Scholar] [CrossRef]
- Suzuki, M.; Oka, T.; Okada, K. The estimation of energy consumption and CO2 emission due to housing construction in Japan. Energy Build. 1995, 22, 165–169. [Google Scholar] [CrossRef]
- Takano, A.; Pal, S.K.; Kuittinen, M.; Alanne, K. Life cycle energy balance of residential buildings: A case study on hypothetical building models in Finland. Energy Build. 2015, 105, 154–164. [Google Scholar] [CrossRef]
- Estokova, A.; Porhincak, M. Environmental analysis of two building material alternatives in structures with the aim of sustainable construction. Clean. Technol. Environ. Policy 2015, 17, 75–83. [Google Scholar] [CrossRef]
- Hui, S.C.M. Low energy building design in high density urban cities. Renew. Energy 2001, 24, 627–640. [Google Scholar] [CrossRef]
- Sedláková, A.; Vilčeková, S.; Burdová, E.K. Analysis of material solutions for design of construction details of foundation, wall and floor for energy and environmental impacts. Clean. Technol. Environ. Policy 2015, 17, 1323–1332. [Google Scholar] [CrossRef]
- Čuláková, M.; Vilčeková, S.; Hejhálek, J. Assessment of performance of building structures in compliance with sustainable concept. In Advances in Civil, Structural and Environmental Engineering (ACSEE): Proceedings of the International Conference; Institute of Research Engineers and Doctors: Zurich, Switzerland; Newark, DE, USA, 2013; pp. 103–106. [Google Scholar]
- BRE Environmental Profiles 2013. Product Category Rules for Type III environmental product declaration of construction products to EN 15804:2012. Final version. Available online: https://www.bre.co.uk/filelibrary/BRE_EP_15804_PCR_final_version_II_for_public_consultation.pdf (accessed on 30 September 2015).
- De Benedetto, D.; Klemeš, J. The environmental performance strategy map: An integrated LCA approach to support the strategic decision-making process. J. Clean. Prod. 2009, 17, 900–906. [Google Scholar] [CrossRef]
- Waltjen, T. Passivhaus-Bauteilkatalog, Ökologisch bewertete Konstruktionen; Springer: Wien, Austria, 2009. [Google Scholar]
- OI3-indicator: Leitfaden zur Berechnung von Ökokennzahlen für Gebäude. (2011). Available online: http://www.ibo.at/documents/OI3_Berechnungsleitfaden_V3.pdf (accessed on 7 July 2015).
- Wang, J.-J.; Jing, Y.-Y.; Zhang, C.-F.; Zhao, J.-H. Review on multi-criteria decision analysis aid in sustainable energy decision-making. Renew. Sustain. Energy Rev. 2009, 13, 2263–2278. [Google Scholar] [CrossRef]
- Korviny, P. Theoretical Basis of Multi-Criteria Decision. Ph.D. Thesis, Technical University of Ostrava, Ostrava, Czech Republic, 2009. [Google Scholar]
- Almusaed, A.; Almssad, A. Building materials in eco-energy houses from Iraq and Iran. Case studies in construction. Materials 2015, 2, 42–54. [Google Scholar]
- Tettey, U.Y.A.; Dodoo, A.; Gustavsson, L. Effects of different insulation materials on primary energy and CO2 emission of a multi-storey residential building. Energy Build. 2014, 82, 369–377. [Google Scholar] [CrossRef]
- Zabalza, B.I.; Capilla, A.V.; Usón, A.A. Life cycle assessment of building materials: Comparative analysis of energy and environmental impacts and evaluation of the eco-efficiency improvement potential. Energy Build. 2011, 46, 1133–1140. [Google Scholar] [CrossRef]
- Korjenic, A.; Klarić, S.; Hadžić, A.; Korjenic, S. Sheep wool as a construction material for energy efficiency improvement. Energies 2015, 8, 5765–5781. [Google Scholar] [CrossRef]
- Monteiro, H.; Freire, F. Life-cycle assessment of a house with alternative exterior walls: Comparison of three impact assessment method. Energy Build. 2012, 47, 572–583. [Google Scholar] [CrossRef]
- Marsono, A.K.B.; Balasbaneh, A.T. Combinations of building construction material for residential building for the global warming mitigation for Malaysia. Construct. Build. Mater. 2015, 85, 100–108. [Google Scholar] [CrossRef]
- Jelle, B.P. Traditional, state-of-the-art and future thermal building insulation materials and solutions—Properties, requirements and possibilities. Energy Build. 2011, 43, 2549–2563. [Google Scholar] [CrossRef]
- Berge, A.; Johansson, P. Literature Review of High Performance Thermal Insulation. Report in Building Physics; Chalmers University of Technology: Gothenburg, Sweden, 2012. [Google Scholar]
- Mukhopadhyay, P.; MacLean, D.; Korn, J.; van Reenen, D.; Molleti, S. Building application and thermal performance of vacuum insulation panels (VIPs) in Canadian subarctic climate. Energy Build. 2014, 85, 672–680. [Google Scholar] [CrossRef]
- Boafo, F.E.; Chen, Z.; Li, C.; Li, B.; Xu, T. Structure of vacuum insulation panel in building system. Energy Build. 2014, 85, 644–653. [Google Scholar] [CrossRef]
- Dowson, M.; Grogan, M.; Birks, T.; Harrison, D.; Craig, S. Streamlined life cycle assessment of transparent silica aerogel made by supercritical drying. Appl. Energy 2012, 97, 396–404. [Google Scholar] [CrossRef]
© 2015 by the authors; licensee MDPI, Basel, Switzerland. This article is an open access article distributed under the terms and conditions of the Creative Commons Attribution license (http://creativecommons.org/licenses/by/4.0/).
Share and Cite
Vilčeková, S.; Čuláková, M.; Burdová, E.K.; Katunská, J. Energy and Environmental Evaluation of Non-Transparent Constructions of Building Envelope for Wooden Houses. Energies 2015, 8, 11047-11075. https://doi.org/10.3390/en81011047
Vilčeková S, Čuláková M, Burdová EK, Katunská J. Energy and Environmental Evaluation of Non-Transparent Constructions of Building Envelope for Wooden Houses. Energies. 2015; 8(10):11047-11075. https://doi.org/10.3390/en81011047
Chicago/Turabian StyleVilčeková, Silvia, Monika Čuláková, Eva Krídlová Burdová, and Jana Katunská. 2015. "Energy and Environmental Evaluation of Non-Transparent Constructions of Building Envelope for Wooden Houses" Energies 8, no. 10: 11047-11075. https://doi.org/10.3390/en81011047
APA StyleVilčeková, S., Čuláková, M., Burdová, E. K., & Katunská, J. (2015). Energy and Environmental Evaluation of Non-Transparent Constructions of Building Envelope for Wooden Houses. Energies, 8(10), 11047-11075. https://doi.org/10.3390/en81011047