Implications of Spatial Variability in Heat Flow for Geothermal Resource Evaluation in Large Foreland Basins: The Case of the Western Canada Sedimentary Basin

Abstract
: Heat flow and geothermal gradient of the sedimentary succession of the Western Canada Sedimentary Basin (WCSB) are mapped based on a large thermal database. Heat flow in the deep part of the basin varies from 30 mW/m2 in the south to high 100 mW/m2 in the north. As permeable strata are required for a successful geothermal application, the most important aquifers are discussed and evaluated. Regional temperature distribution within different aquifers is mapped for the first time, enabling a delineation of the most promising areas based on thermal field and aquifer properties. Results of previous regional studies on the geothermal potential of the WCSB are newly evaluated and discussed. In parts of the WCSB temperatures as high as 100–210 °C exist at depths of 3–5 km. Fluids from deep aquifers in these “hot” regions of the WCSB could be used in geothermal power plants to produce electricity. The geothermal resources of the shallower parts of the WCSB (>2 km) could be used for warm water provision (>50 °C) or district heating (>70 °C) in urban areas.1. Introduction
The Western Canada Sedimentary Basin (WCSB) is known for its large reserves of oil, gas and coal. In times of public discussion on climate change and the greenhouse gas emissions that come with burning of fossil fuels, the focus of interests shifts gradually towards renewable energy production such as geothermal energy. In western Canada, geothermal energy could play a role in replacing some fossil-fuel generated heat energy used as an energy source for warm water provision, district heating, industrial processes, or even electric power production. The feasibility of producing geothermal heat is strongly dependent on the thermal and geological conditions of the subsurface. Naturally, sufficient temperature is a primary constraint. However, only in a situation where a significant amount of warm fluid is produced will a geothermal project be successful. Therefore information on reservoir properties, particularly porosity and permeability, are crucial for geothermal exploration.
In this study information on subsurface thermal conditions and geology is combined by mapping the temperature for different stratigraphic depths, and overlaying the distribution of potential geothermal target formations on these maps.
2. Previous Work
2.1. Thermal Field
The study of geothermal heat in the WCSB has a long history (see Majorowicz and Jessop [1] and Majorowicz and Grasby [2] for a review of the early work). The first precise heat flow measurements were done by Garland and Lennox [3] in shallow 300–1000 m deep wells near Leduc (67 mW/m2) and Redwater (61 mW/m2) in the vicinity of Edmonton. Majorowicz et al. [4] applied a paleoclimatic correction which increased these values by 12% to 75 mW/m2 for the Leduc well and 68 mW/m2 for the Redwater well.
The first regional WCSB basin analysis of geothermal patterns from industrial temperatures was done in 1981 by Majorowicz and Jessop [1] for Alberta, Saskatchewan and the Northwest Territories (NWT). Lam and Jones [5] and Jones and Majorowicz [6] expanded the database available to Majorowicz and Jessop and conducted thermal conductivity, heat generation and heat flow studies of the sedimentary basin and Precambrian basement rocks. They found that heat flow patterns poorly correlate with heat generation of the Precambrian basement rocks from decay of 235U-, 232Th- and 40K- isotopes. This has been recently confirmed by Majorowicz et al. [7]. It is contradictory with Bachu [8] who assumed that heat flow in the basin is controlled by variability of heat generation of the basement and influence of hydrodynamics is marginal (see discussion section for more information).
The first attempt to predict and map temperature at the geological surfaces was done by Jones et al. [9] in 1985 for the Paleozoic erosional surface and the Precambrian surface of the Alberta basin, followed by mapping of temperature at Precambrian surface for the larger area of the whole WCSB by Bachu [8] in 1993.
Majorowicz et al. [10] identified significant overestimation of temperatures from Alberta industrial well logs from shallow depths (<1000 m). This has been determined from high precision temperature logs conducted in shallow wells that have been allowed to reach thermal equilibrium. These findings have been confirmed by recent studies in the northern half of Alberta using tens of thousands of industrial temperature measurements from three independent datasets: Annual Pool Pressure surveys (APP), Drill Stem Tests (DST) and Bottom Hole Temperatures (BHT) constrained by equilibrium high precision logs coupled with 33 Thermal Conductivity wells were used to provide a more accurate prediction of the temperature gradient of the northern Alberta part of the WCSB [7,11]. The results of these recent northern Alberta studies showed the need for this study which covers all of the WCSB.
One of the main reasons for the overestimation of BHT's from shallow wells are seasonal effects on analogue thermometers which were used until the 1980's [11]. These thermometers recorded the maximum temperature in a well, which was assumed to have been recorded at the bottom of the well. However, during the summer months surface air temperatures exceed the BHT and can lead to overestimation of BHT's [11].
No high precision temperature data exists below 1000 m with the exception of one deep well on the outskirts of Fort McMurray in the shallow north eastern part of the basin, drilled 2400 m into the basement granites below 0.5 km of sediments [7].
2.2. Studies on the Geothermal Potential of Deep Aquifers
The first study on the geothermal potential of deep aquifers in the WCSB was published by Lam and Jones [12] in 1985. In their paper the authors examined aquifer porosity, thickness, water chemistry and water recovery in the area of Hinton-Edson in western Alberta, concluding that especially the Mississippian and Upper Devonian carbonate rocks have a good geothermal potential. In a second study Lam and Jones [13] investigated the geothermal potential in the Calgary area. Despite the low geothermal gradient, the authors stated that the Calgary area is an attractive location for geothermal recovery due to the relatively thick sedimentary succession and the substantial population of the city. Similar to the results of their study of the Hinton-Edson area, the largest potential for geothermal purposes in the Calgary area was also found in Upper Devonian and Mississippian carbonate rocks. Jessop and Vigrass [14] published a report on a geothermal well which was drilled in 1979 into the depth of 2214 m at the Campus of the University of Regina (Saskatchewan). Tests showed an excellent geothermal potential, but unfortunately the large sports building that was intended to be the load for the well was not built, so the well has only been used as a research facility.
In 2011 the Geological Survey of Canada released a report [15] which synthesizes previous geothermal studies and delineates the potential of the different geothermal resource types in Canada. A major finding of the report is that the highest geothermal potential (for electricity production) exists in the volcanic belts of the Cordillera and in parts of the WCSB (northeastern British Columbia, northern Alberta and southern Northwest Territories). The report describes the other deeper parts of the WCSB as a very large resource for direct heat use. In 2013 the British Columbia Ministry of Energy and Mines assessed the geothermal resource in the Devonian Carbonates of the Clarke Lake gas field in northeastern British Columbia [16]. In central Alberta Weides et al. [17] mapped porosity, permeability and temperature of four Devonian carbonate aquifers and the Cambrian Basal Sandstone Unit [18], concluding that all five formations are potentially useable for geothermal heating applications. Using a similar approach, Weides et al. [19] investigated the geothermal potential of the siliciclastic Granite Wash Unit in northwestern Alberta. Ferguson and Grasby [20] examined the deep clastic reservoirs of the Winnipeg and Deadwood formations (Basal Clastics) in Saskatchewan, finding that these formations have “geothermal potential for development of direct use and electricity generation systems”. Besides depth, thickness and temperatures of the Basal Clastics, Ferguson and Grasby focused on injection rates from existing disposal wells, most of which operate at flow rates between 30 and 140 L/s.
3. Methods
3.1. Temperature Database
In this paper heat flow and geothermal gradient data for the WCSB were compiled from previous research. The heat flow and geothermal gradient data base from Majorowicz and Grasby for western and Northern Canada [2] has been expanded by additional heat flow and geothermal gradient studies which were conducted as part of Helmholtz-Alberta Initiative for the northern half of the Alberta territory [2,4,7,11]. The recent compilation done by the Geological Survey of Canada for all of Canada includes this dataset [15]. The Majorowicz and Grasby [2] compilation mainly was based on the corrected bottom hole temperatures (BHTs) and drill stem test (DST) temperature records, with few (5) precise temperature depth logs in equilibrium wells. This compilation has been expanded with a dataset containing estimates of the geothermal gradient from temperatures taken by industry and reported to the Alberta Energy Conservation Board. The same dataset has been used by Majorowicz and Moore [21] for their first Canadian evaluation of feasibility of Enhanced Geothermal Systems in the Alberta basin. The resulting dataset used in this study consists of about 70,000 single values (from APP's, DST' and BHT's) from more than 26,400 wells. The data were carefully filtered and corrected for equilibrium conditions. More detailed information on data quality and handling of the dataset is found in Gray et al. [11]. The heat flow data used in this article is based on conductivities of the main 13 rock types in the WCSB, which were determined from about 1405 measurements [22].
3.2. Mapping of Geothermal Data
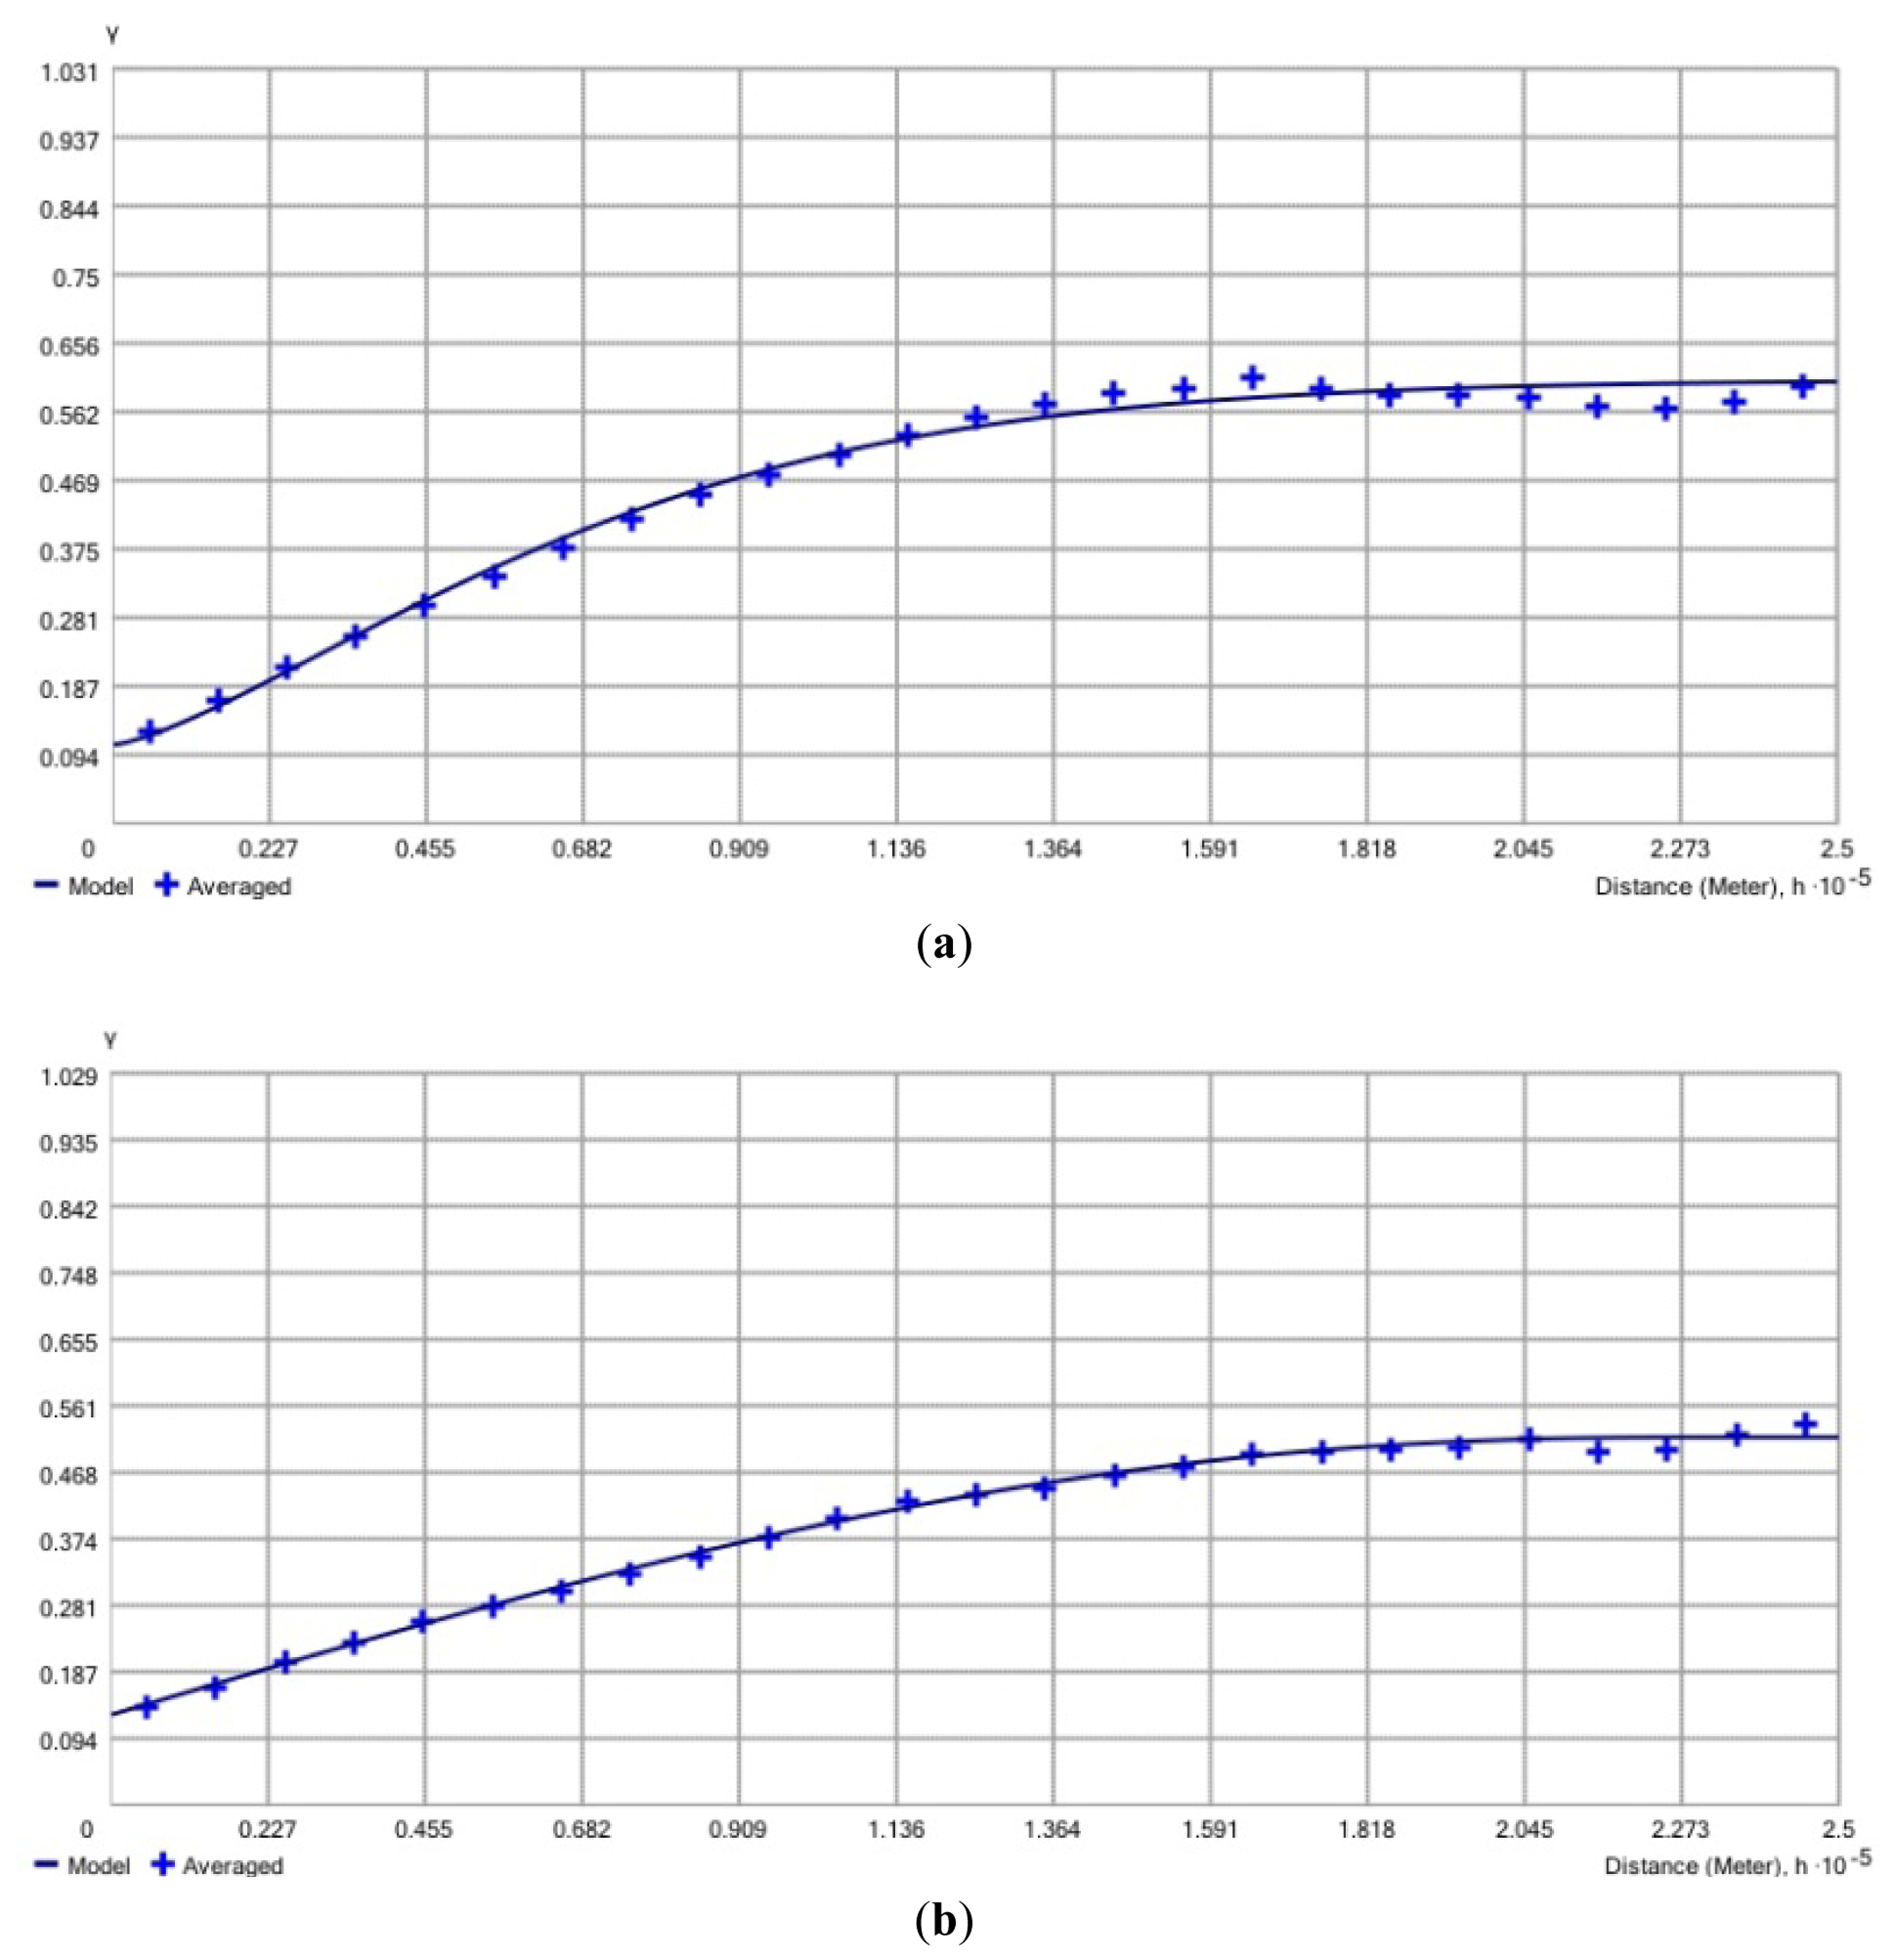
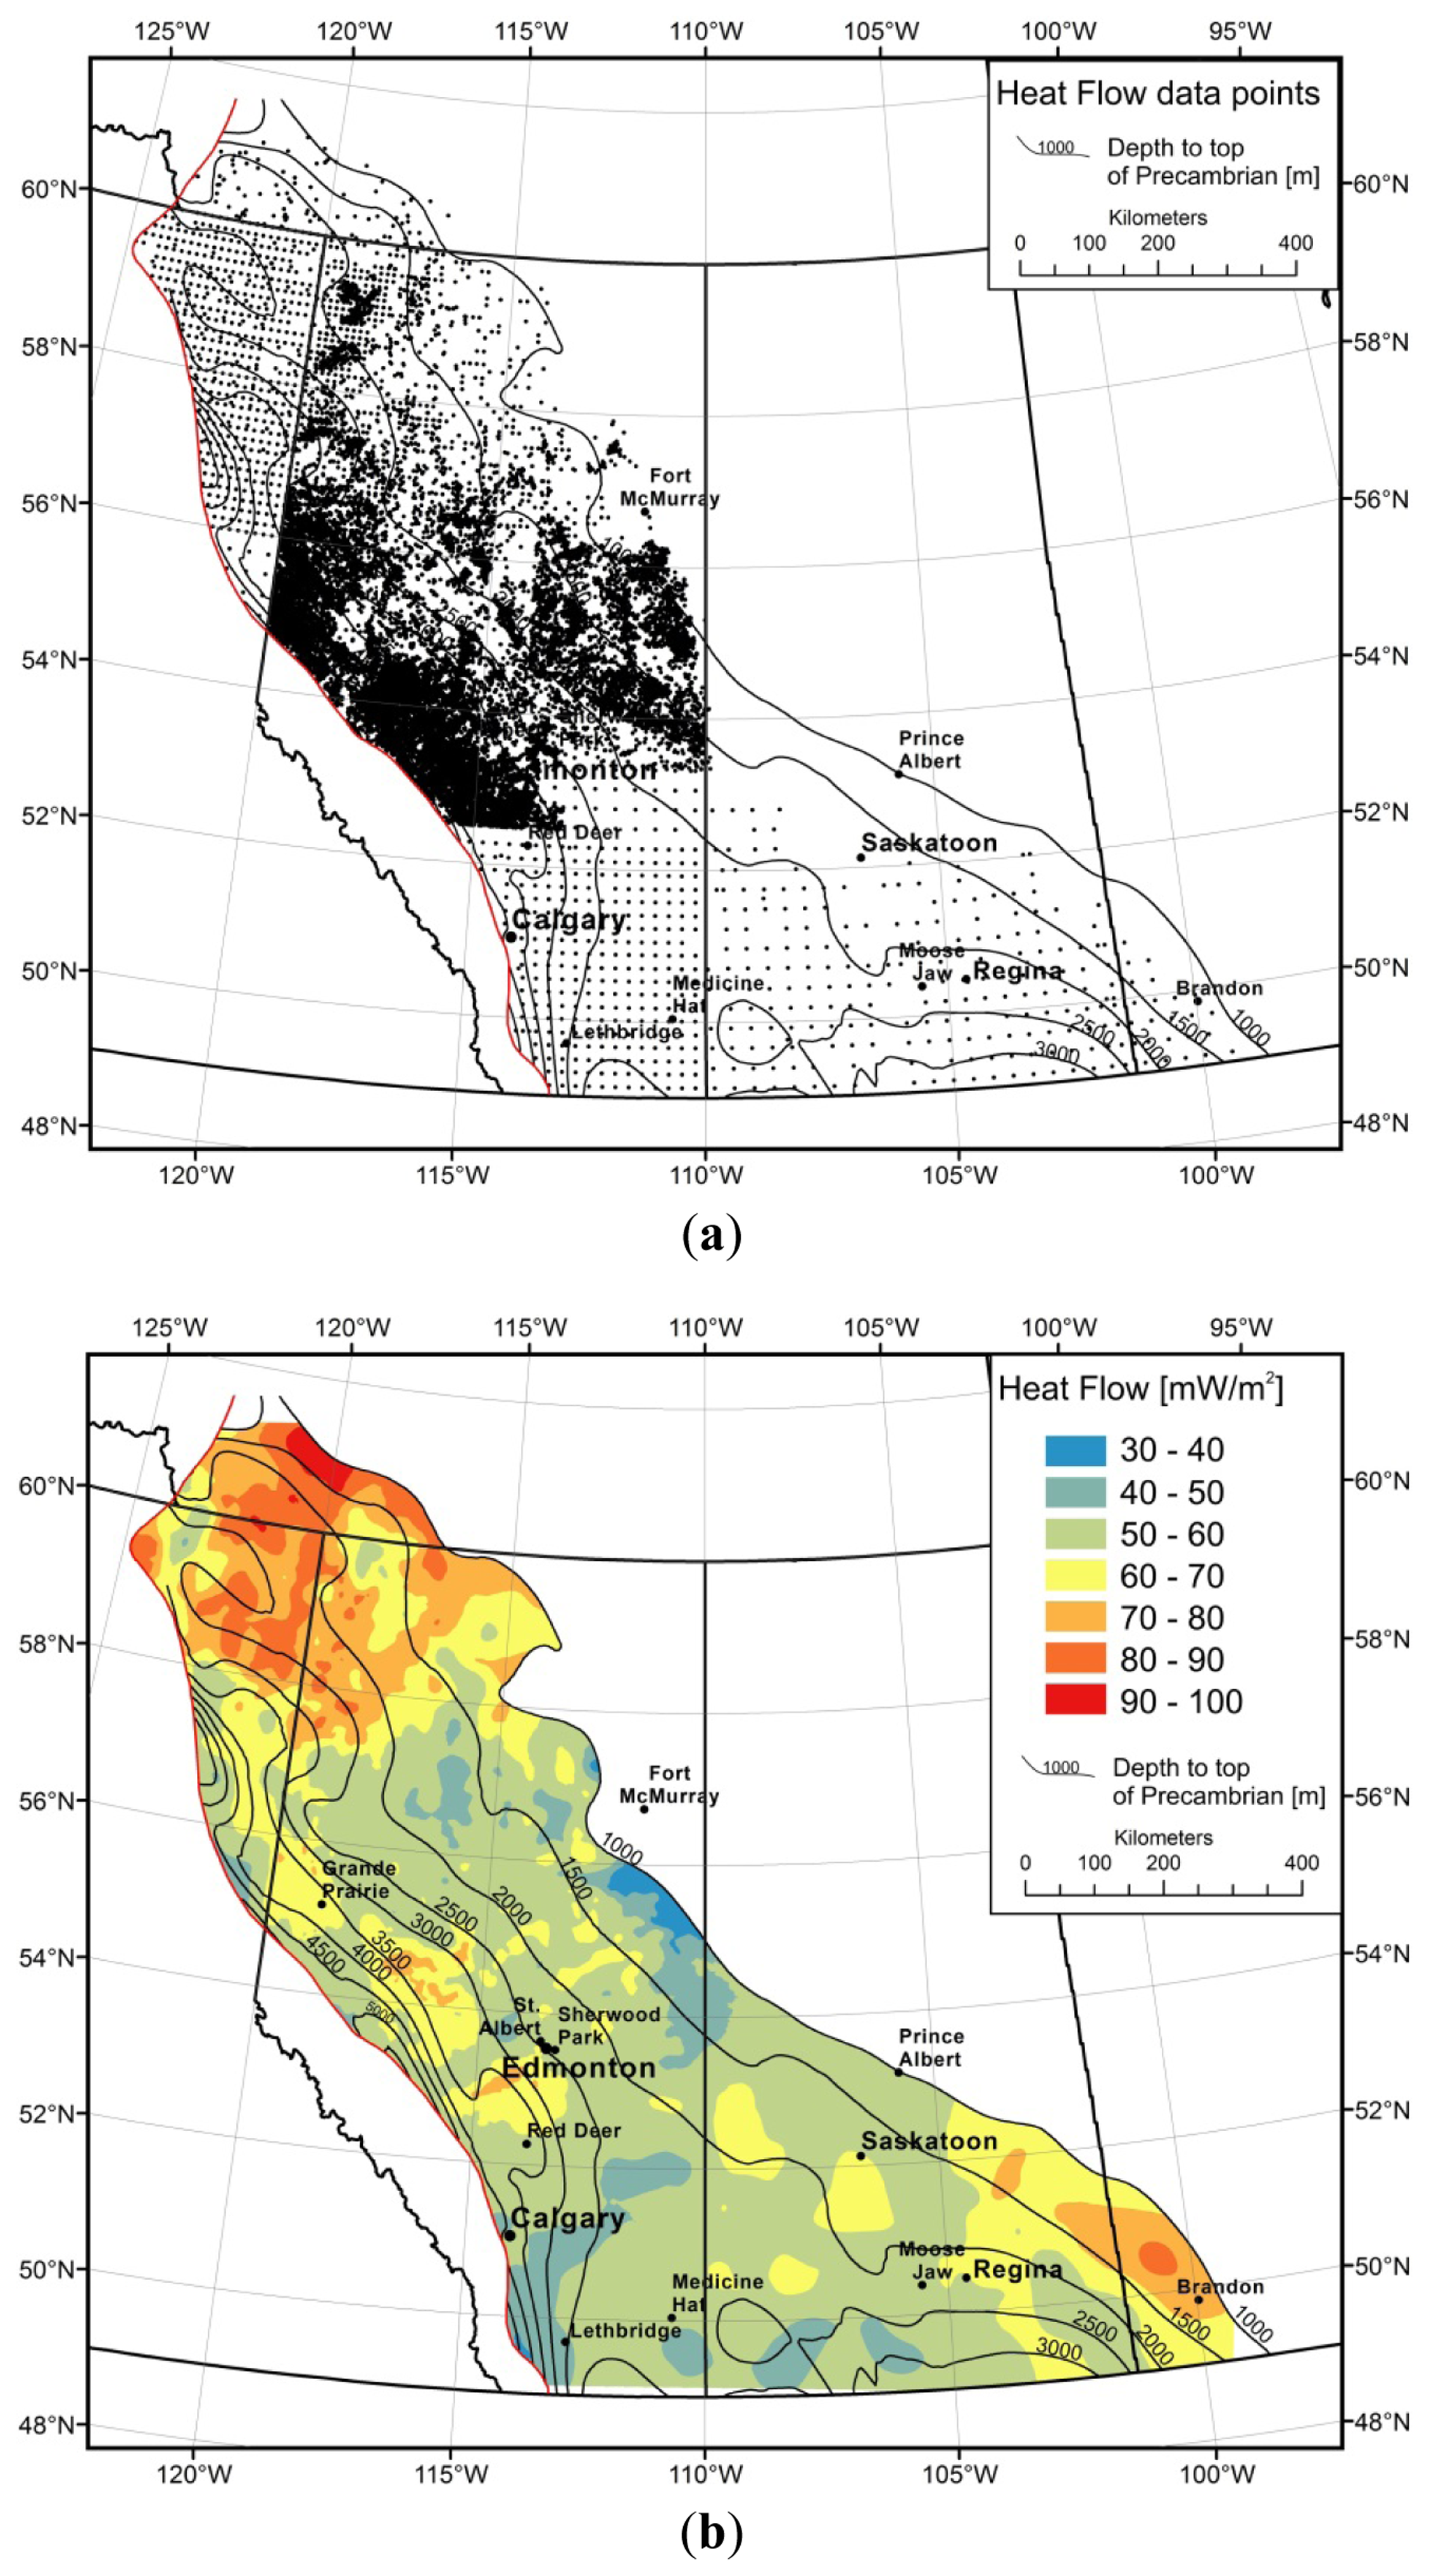
The distribution of geothermal gradient and heat flow were mapped for the whole sedimentary succession deeper than 1 km. For calculation of the maps the ArcGIS 10.1 Geostatistical Analyst extension was used. In a first step, the dataset was checked for outliers. All heat flow values which were unusually high (above 100 mW/m2) or low (below 30 mW/m2) have been removed from the dataset. In total 462 values were identified as outliers, of which the majority showed no spatial consistency. These extreme values probably are the result of measurement or notation errors and do not represent the real thermal conditions. The resulting heat flow dataset includes 74,728 heat flow values from 26,421 wells. For those wells for which more than one heat flow value exists, the arithmetic average was calculated. The heat flow map was calculated using the simple kriging algorithm. The data were declustered to adjust for preferential sampling. A stable omnidirectional semivariogram was modelled, using 25 lags with a length of 10,000 m each, a nugget of 0.11, a range of 165 km and a partial sill of 0.50 (Figure 1a).
A similar approach was applied to map the geothermal gradient. First, all geothermal gradient values which were unusually high (above 80 °C/km) or low (below 10 °C/km) have been removed (37 values), resulting in a dataset of 68,377 gradient values from 26,492 wells. For those wells for which more than one gradient value exists, the arithmetic average was calculated. The geothermal gradient was mapped applying the simple kriging algorithm. A tetraspherical omnidirectional semivariogram was modelled, using 25 lags with a length of 10,000 m each, a nugget of 0.13, a range of 230 km and a partial sill of 0.39 (Figure 1b).
The geothermal gradient map was then used to calculate the temperature distribution for different stratigraphic units. The benefit of this approach over mapping temperature at a constant depth is that the resulting maps combine two key aspects relevant for geothermal exploration: temperature and geology. Five stratigraphic units where chosen for the maps: the top of the Precambrian basement, the Devonian Beaverhill Lake Group, the Devonian Winterburn Group and the Mississippian succession, and the bottom of the Cretaceous succession (sub-Mannville unconformity). First, structure depth maps were calculated for the five stratigraphic units using the well control data of the Geological Atlas of the Western Canada Sedimentary Basin [23], applying the ordinary kriging algorithm. To obtain the temperature distribution at depth, the raster of the geothermal gradient map was then multiplied with the raster of the depth distribution. Because at shallow depths less than 1 km subsurface temperatures are generally too low for geothermal applications, and as temperature measurements from shallow wells (less than 1 km) tend to be biased [11], the depth range shallower than 1 km is not displayed on the temperature distribution maps.
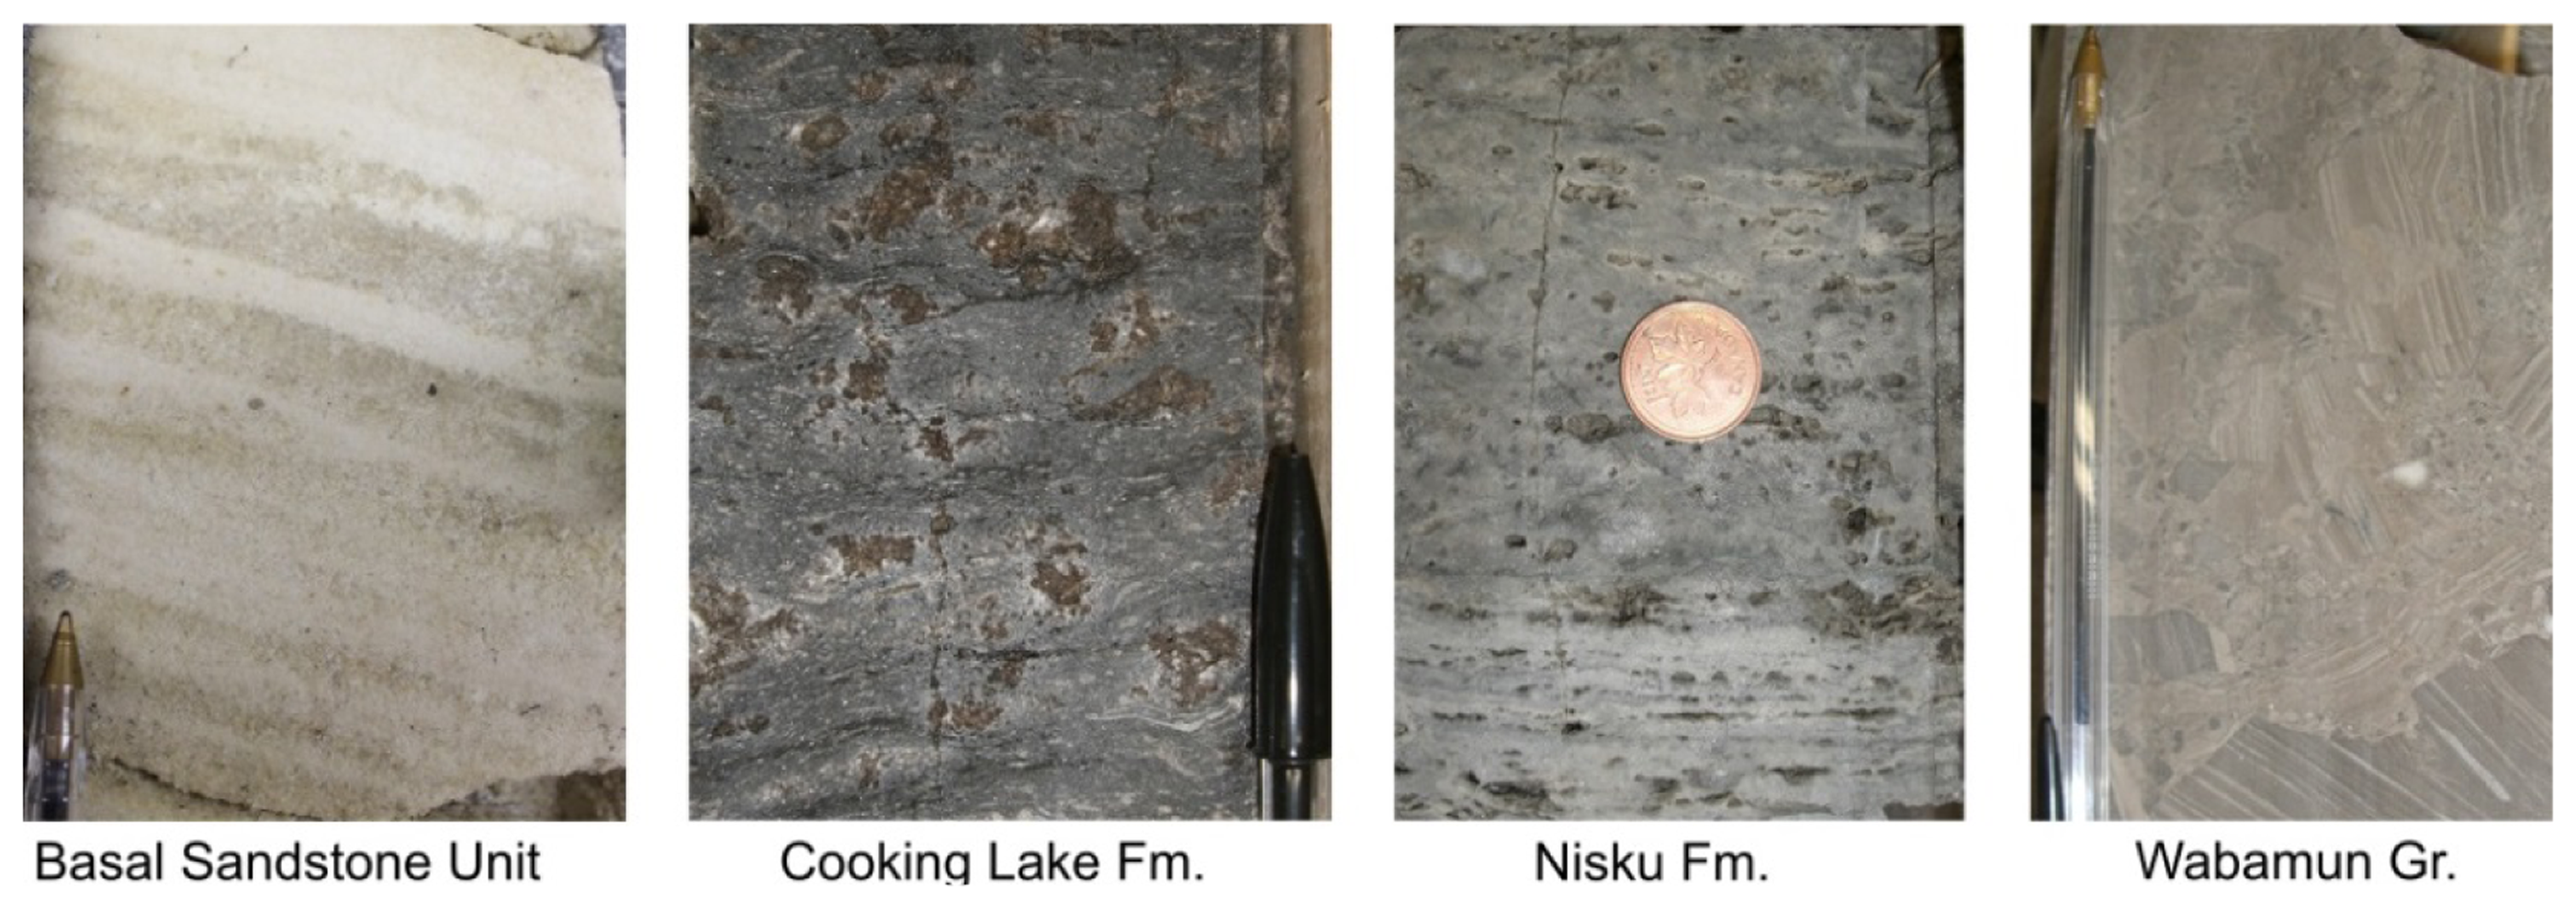
In addition to the temperature and depth information, the geographical extension of potential geothermal target formations was added to the maps. These formations were either chosen because they have already been in the focus of earlier geothermal exploration studies, or because they have been described in the literature as porous (and permeable) and therefore could host larger amount of warm fluids. It has to be pointed out that the potential geothermal target formations in most cases do not have the same depth as the particular temperature map (and as the depth contours), but rather are located a few hundred meters above or below, because the maps report the temperature at the top or bottom of a specified formation. A brief overview on the potential geothermal target formations is given in Table 1. Figure 2 shows examples of core samples from some of the formations.
4. Results
4.1. Heat Flow and Geothermal Gradient
The heat flow in the WCSB generally ranges from 30 to 100 mW/m2, being 60.4 mW/m2 on average (Figure 3a,b). The highest heat flow is found in the northern part of the WCSB in the Northwest Territories, and adjacent northeastern British Columbia (B.C.) and northwestern Alberta. Other larger positive anomalies exist at the southeastern margin of the WCSB in the area of Regina (Saskatchewan) and Brandon (Manitoba), and in the western part of central Alberta (Figure 3b). Larger negative heat flow anomalies are found in northeastern Alberta (south of Fort McMurray) and in southern Alberta in the area of Calgary. Generally a northerly trend of increasing heat flow exists.
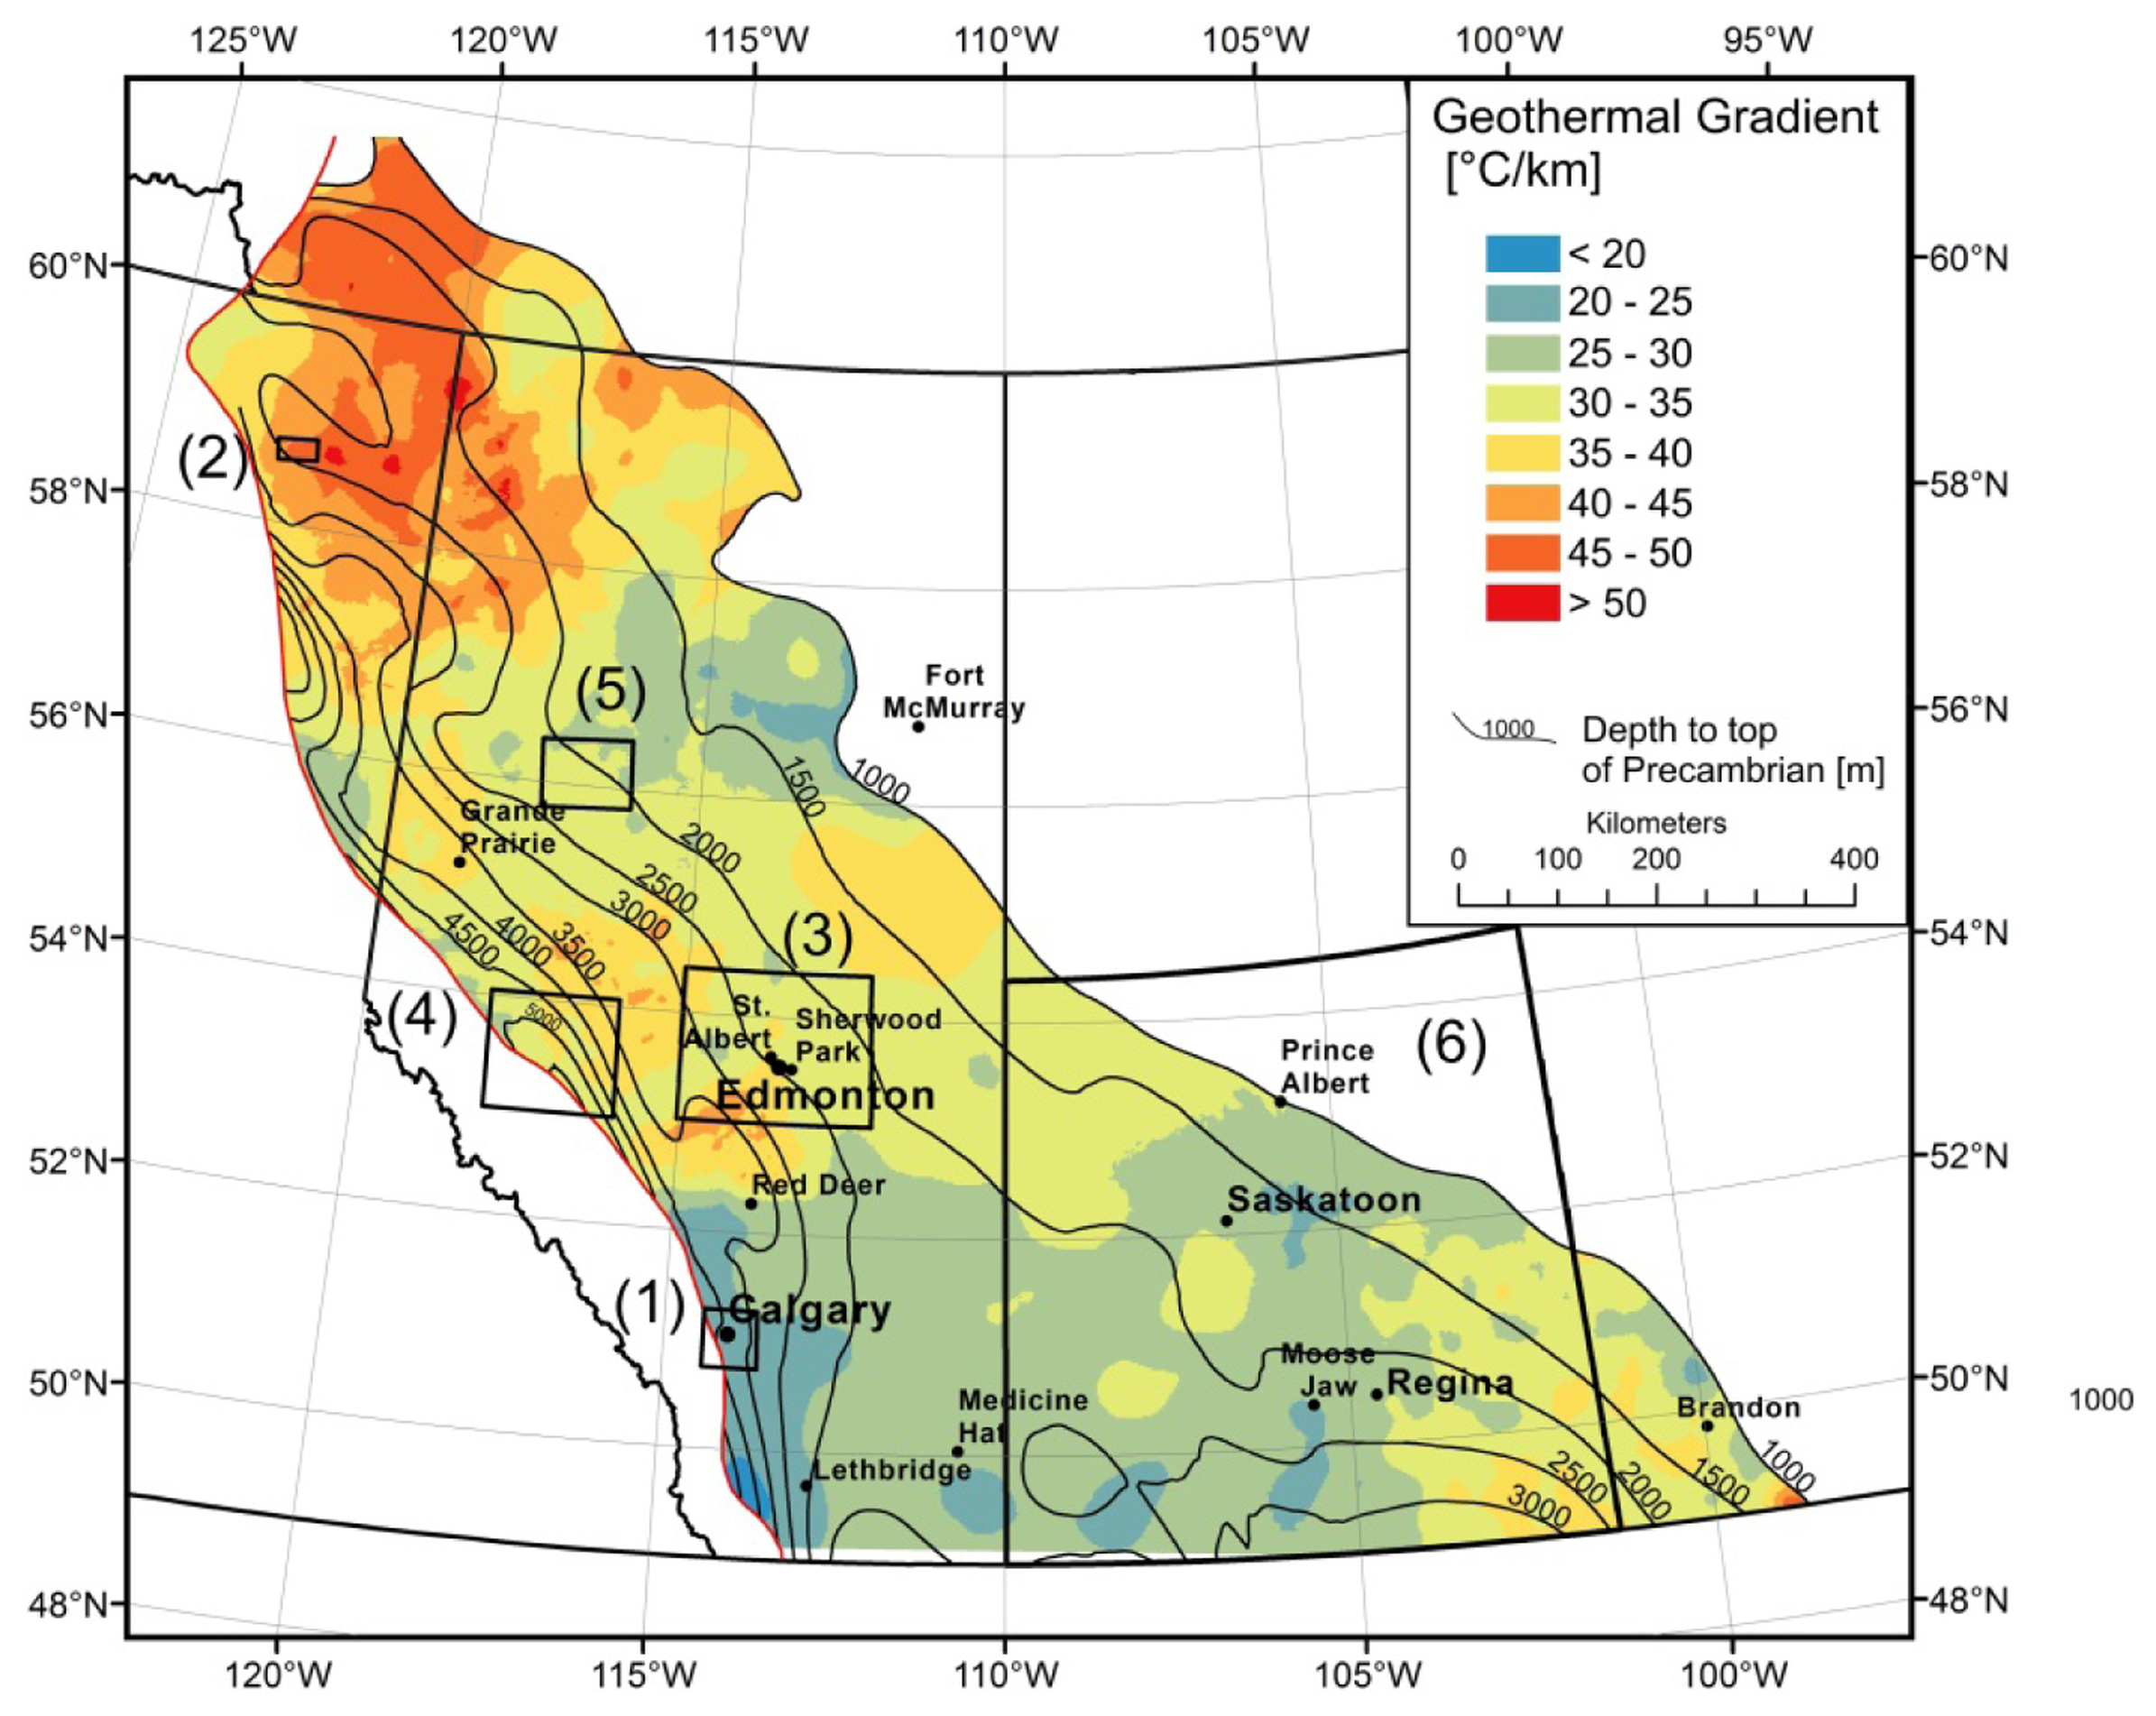
The geothermal gradient in the WCSB ranges from 20 to 55 °C/km, with an average value of 33.2 °C/km (Figure 4). The distribution of the thermal gradient follows the same trend of increasing values towards the northern WCSB.
4.2. Temperature at Depth and Distribution of Potential Geothermal Target Formations
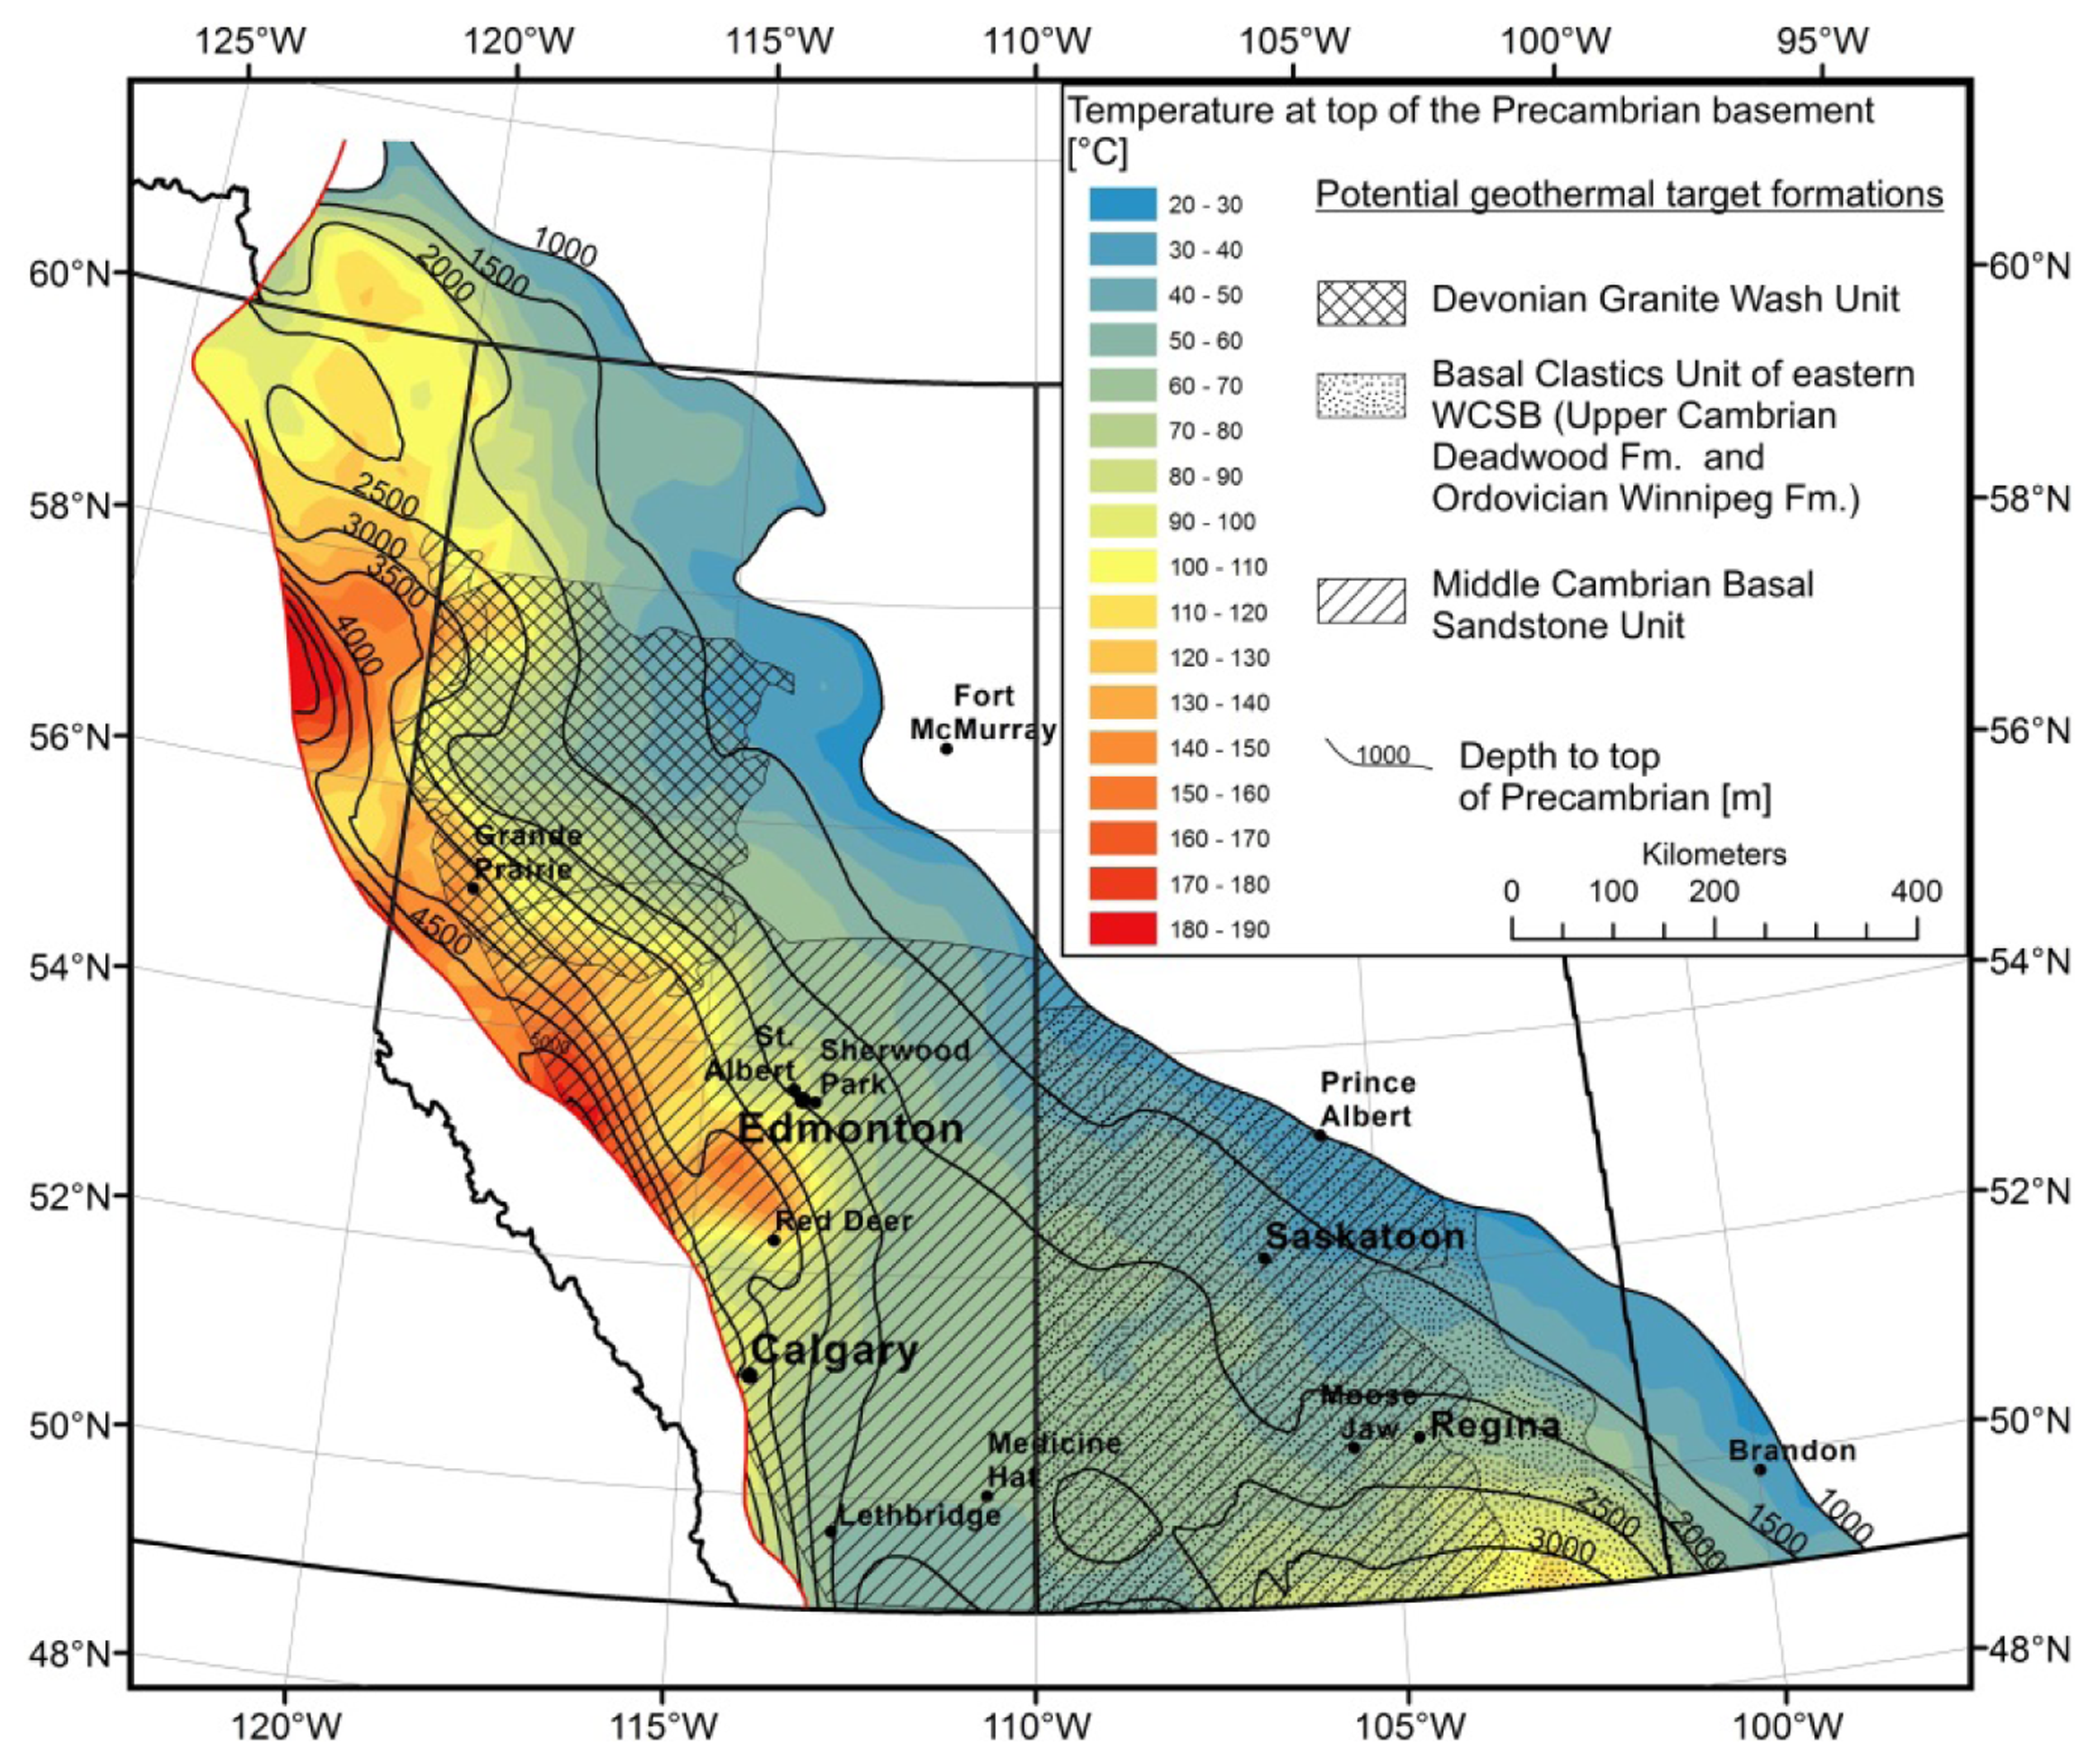
At the base of the sedimentary column the highest temperatures are found in the deepest parts of the basin close to the Cordillera, reaching values above 180 °C at a depth of 4.5 km and more (Figure 5). In the deeper half of the WCSB, at depth below 2–2.5 km, temperatures are above 70 °C, thus sufficient for district heating (see also Discussion Section). Potential geothermal target formations at the basal part of the basin fill are the siliciclastic deposits of the Cambrian Basal Sandstone Unit in central Alberta and western Saskatchewan, the Cambro−Ordovician Basal Clastics in eastern Saskatchewan, and the Devonian Granite Wash Unit in northwestern Alberta.
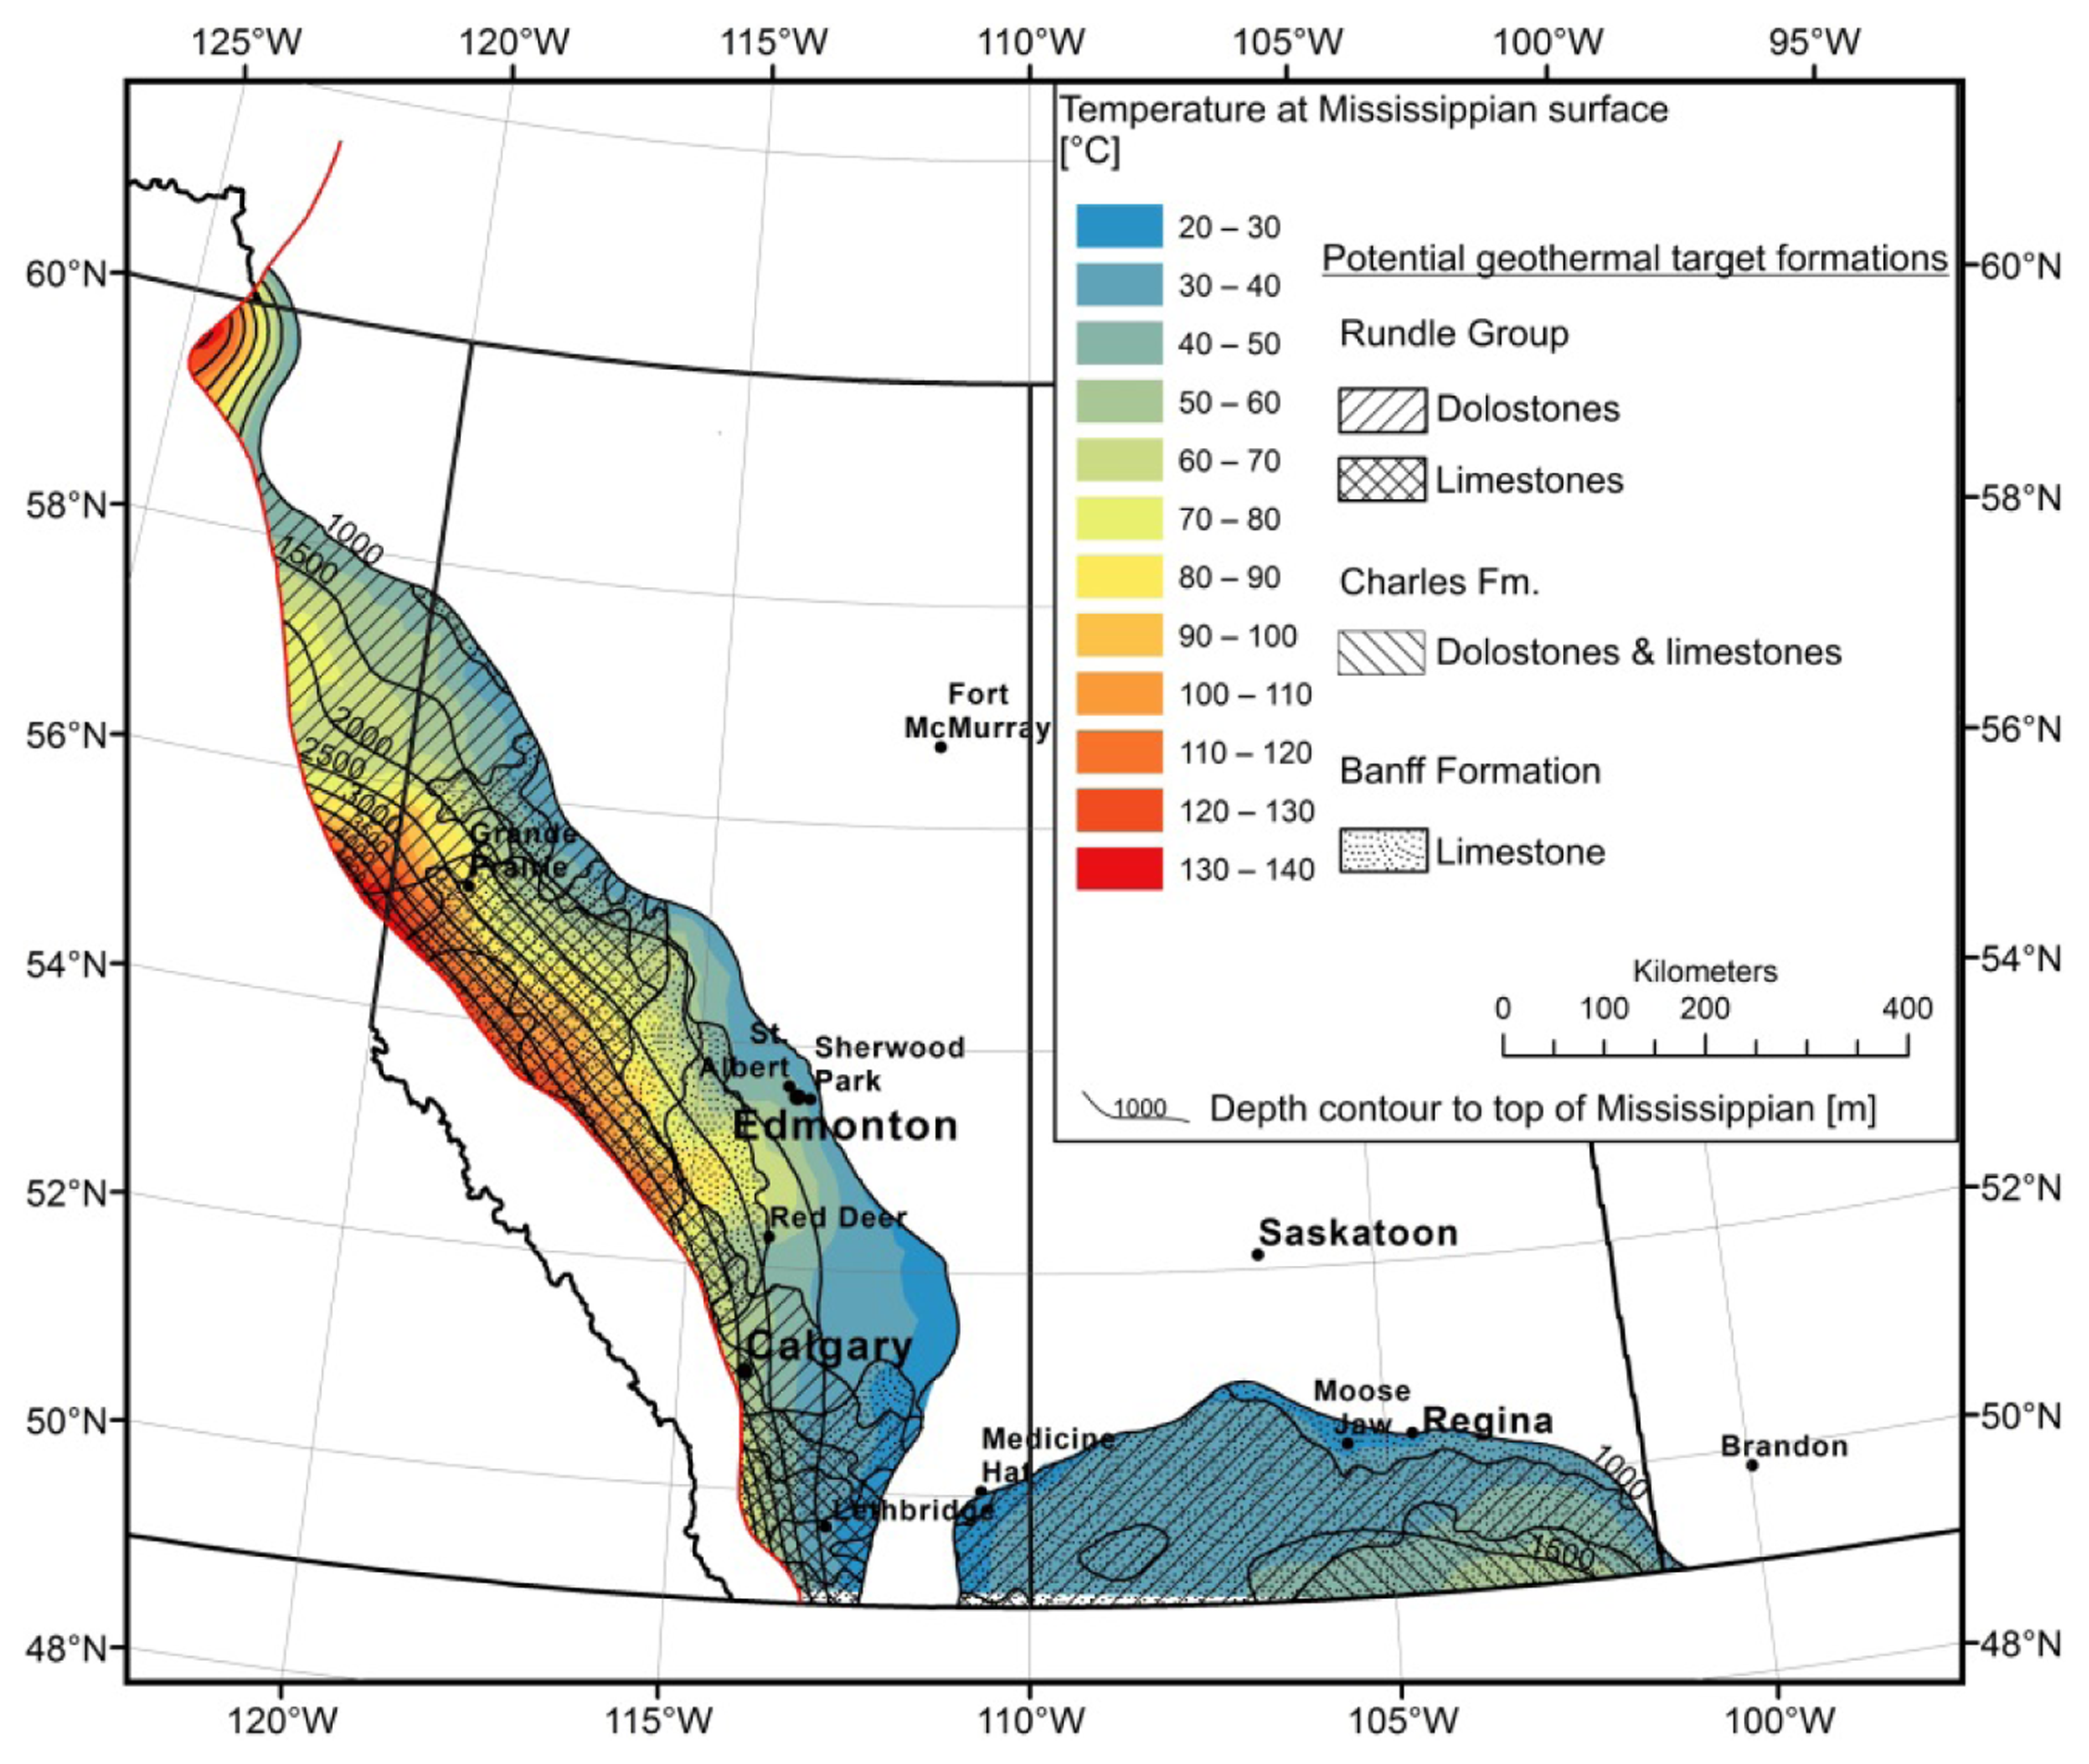
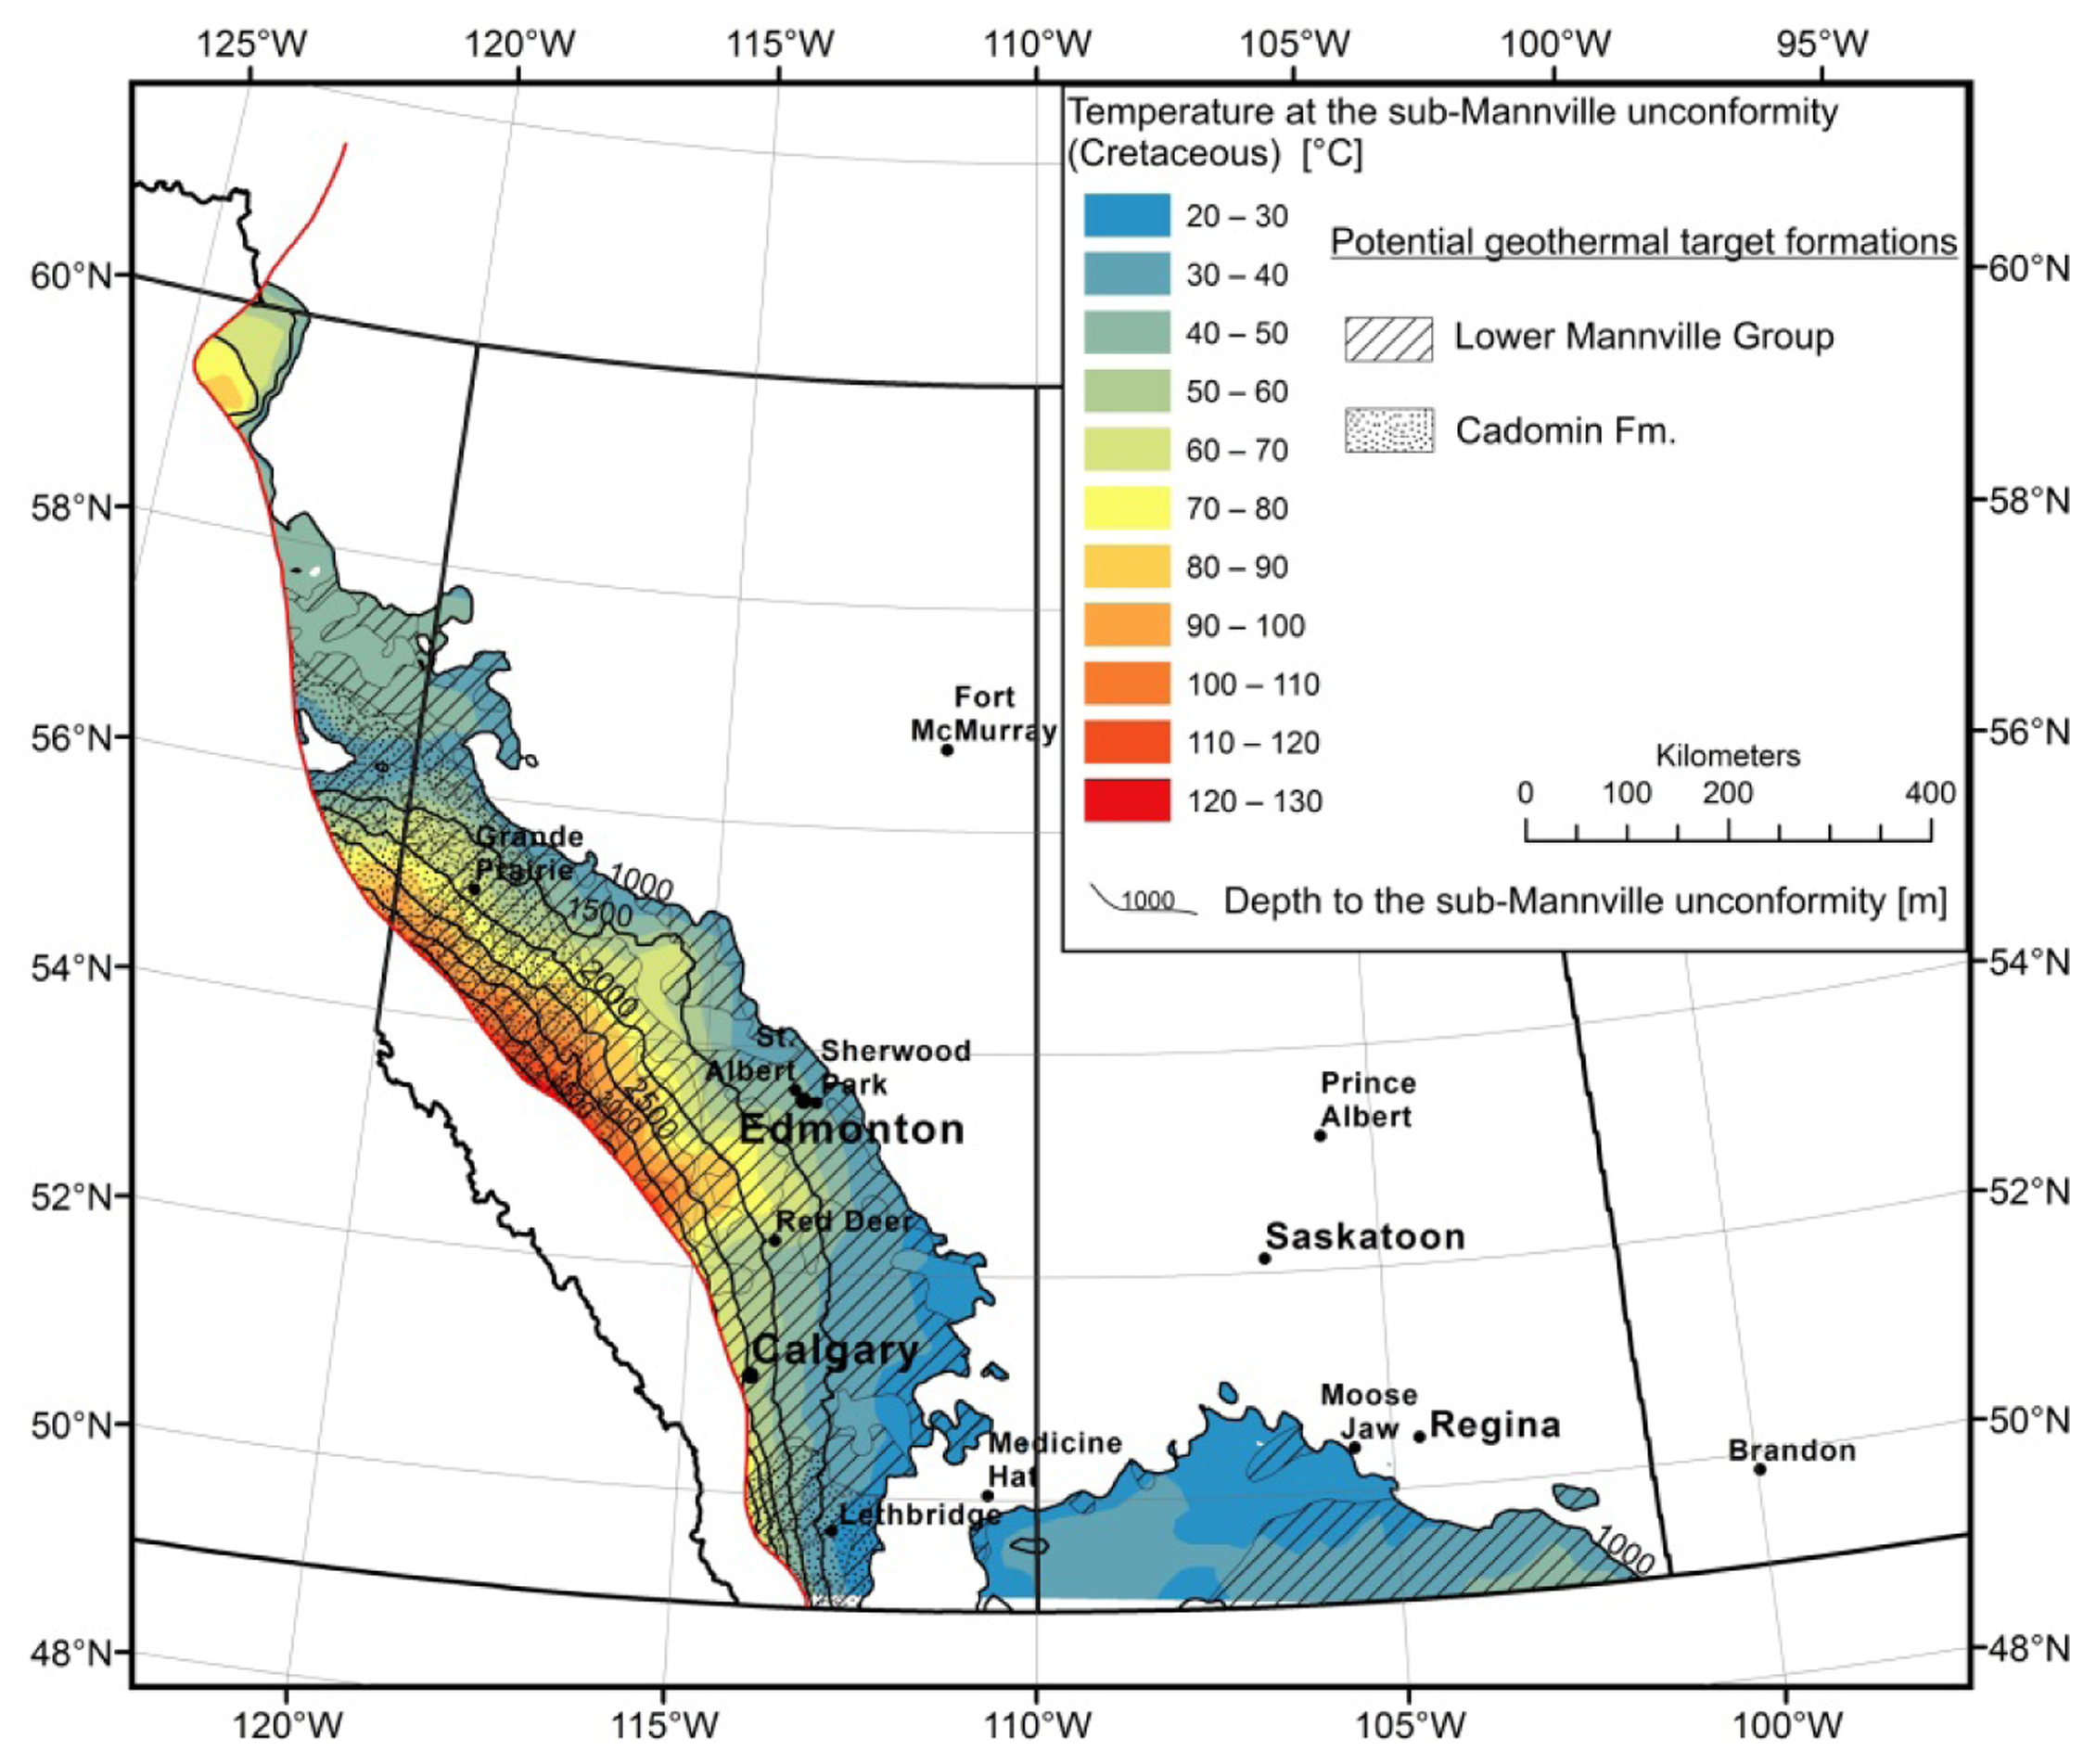
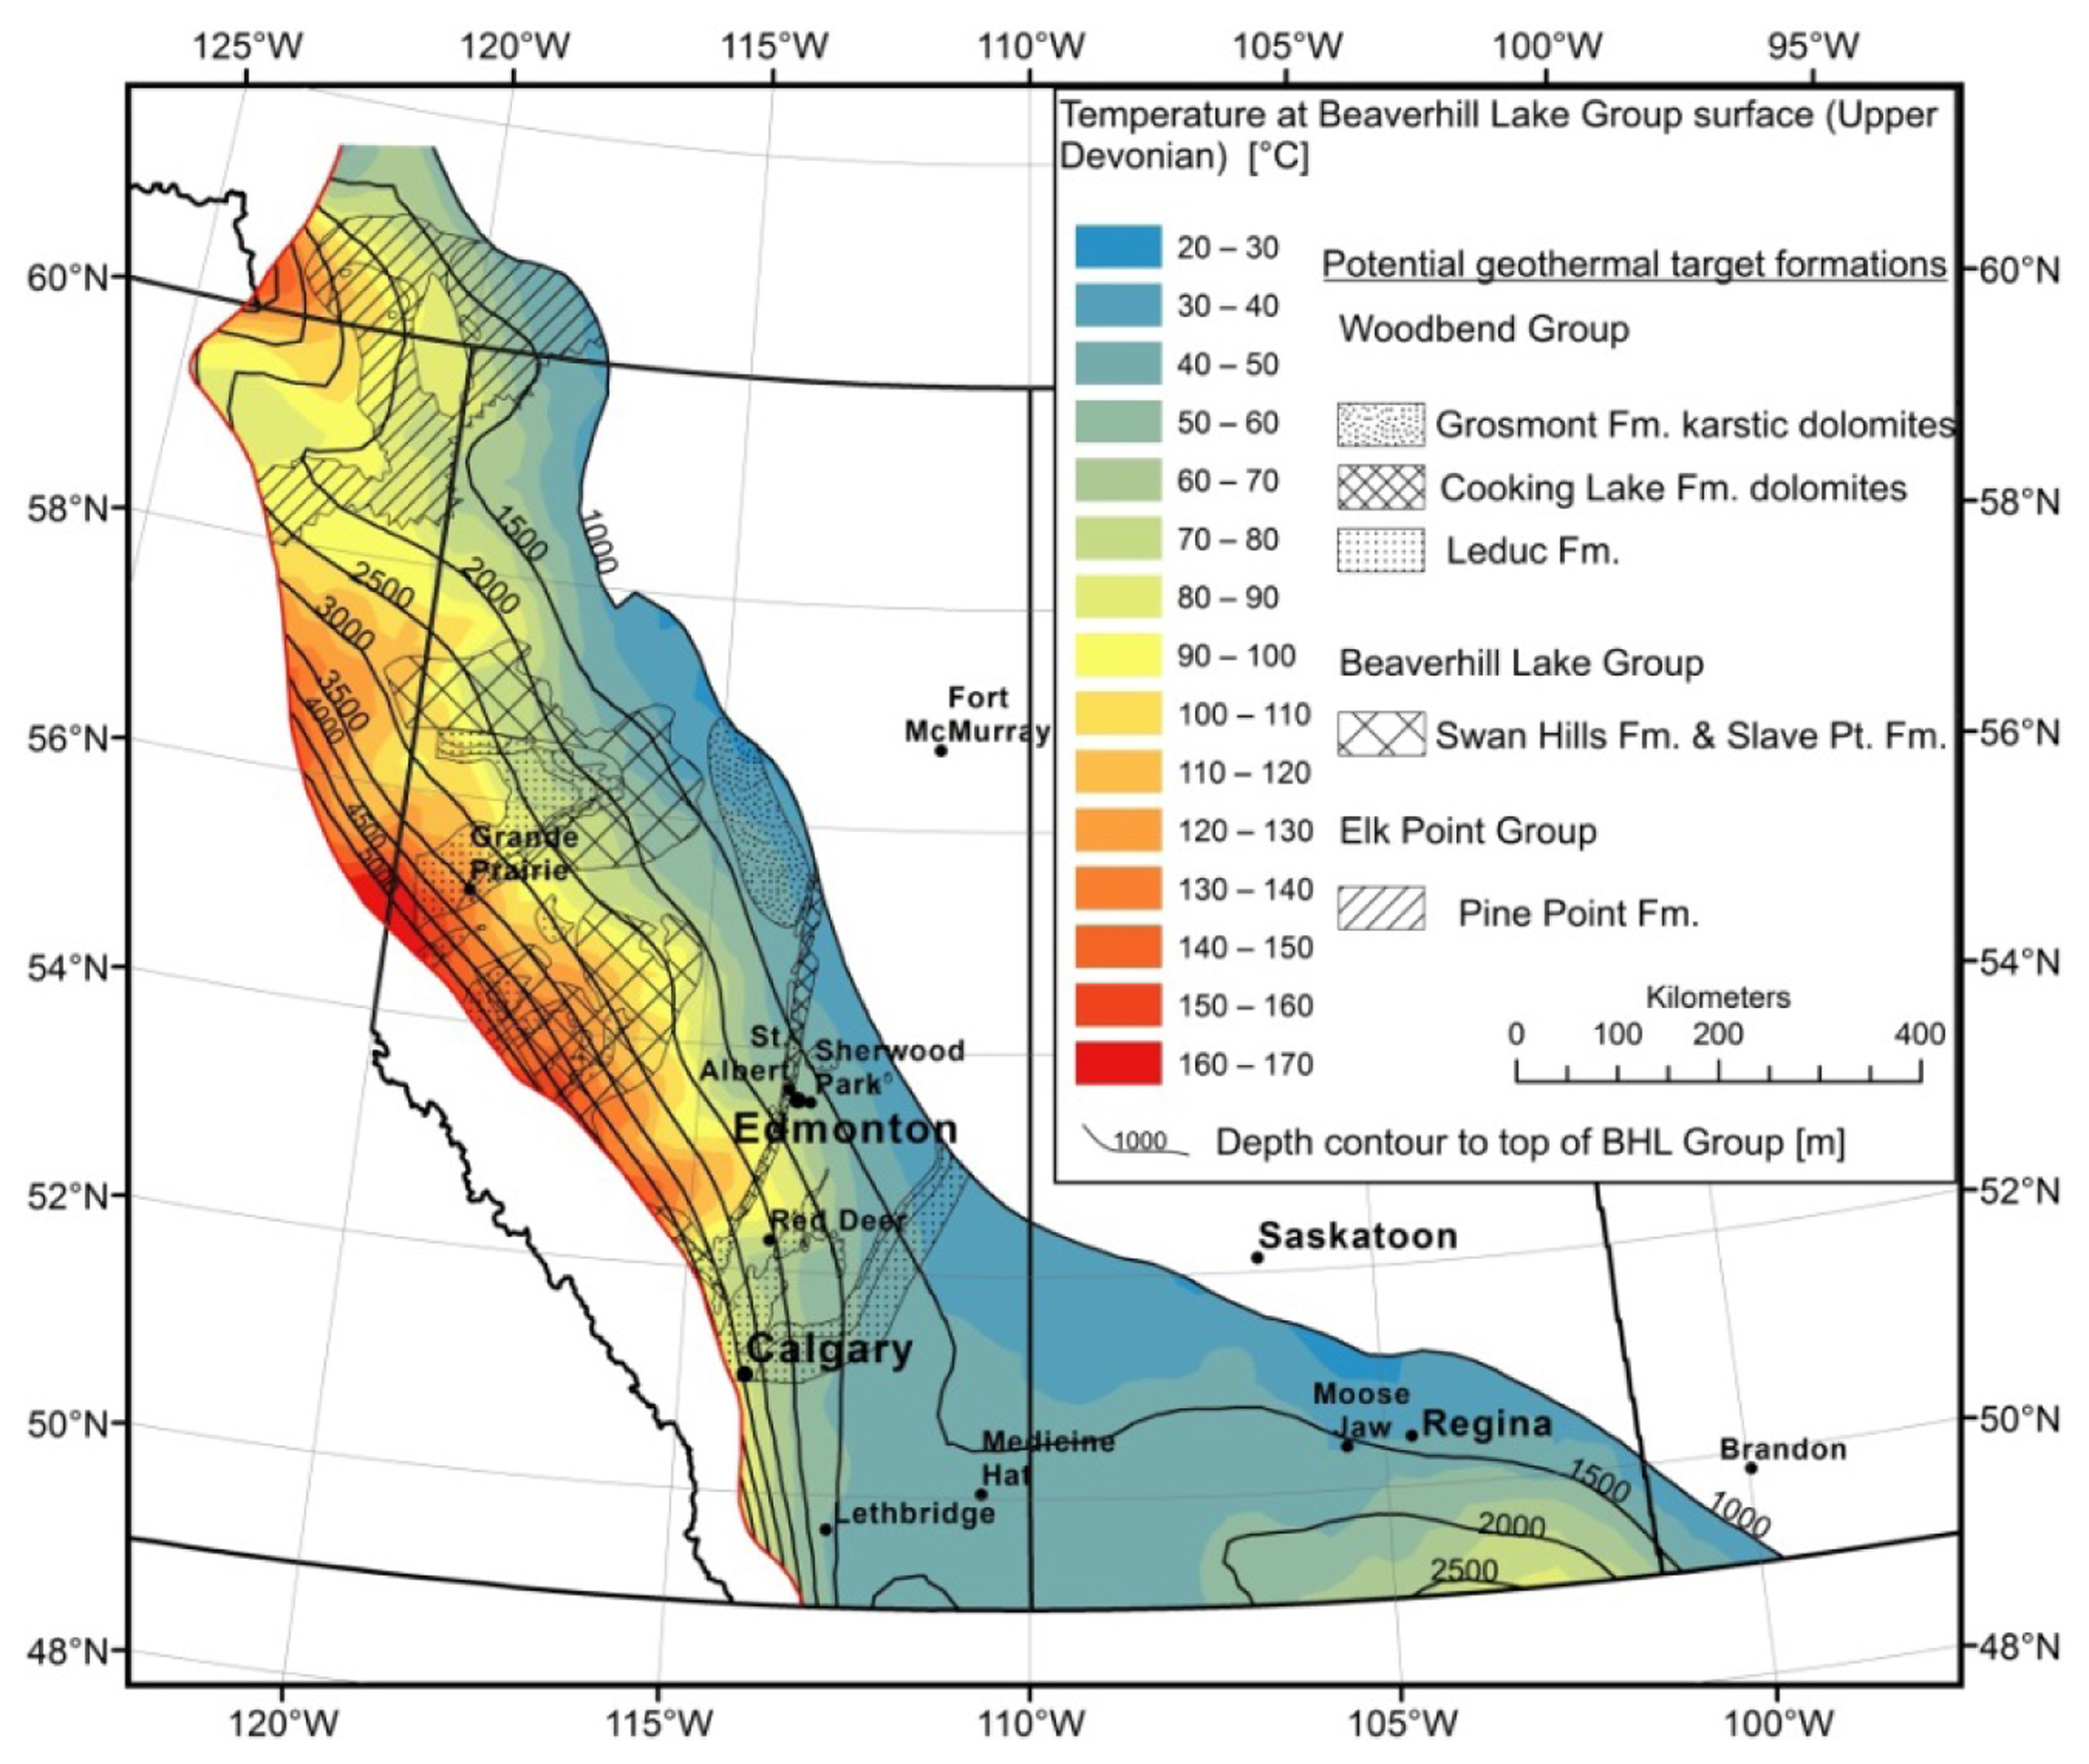
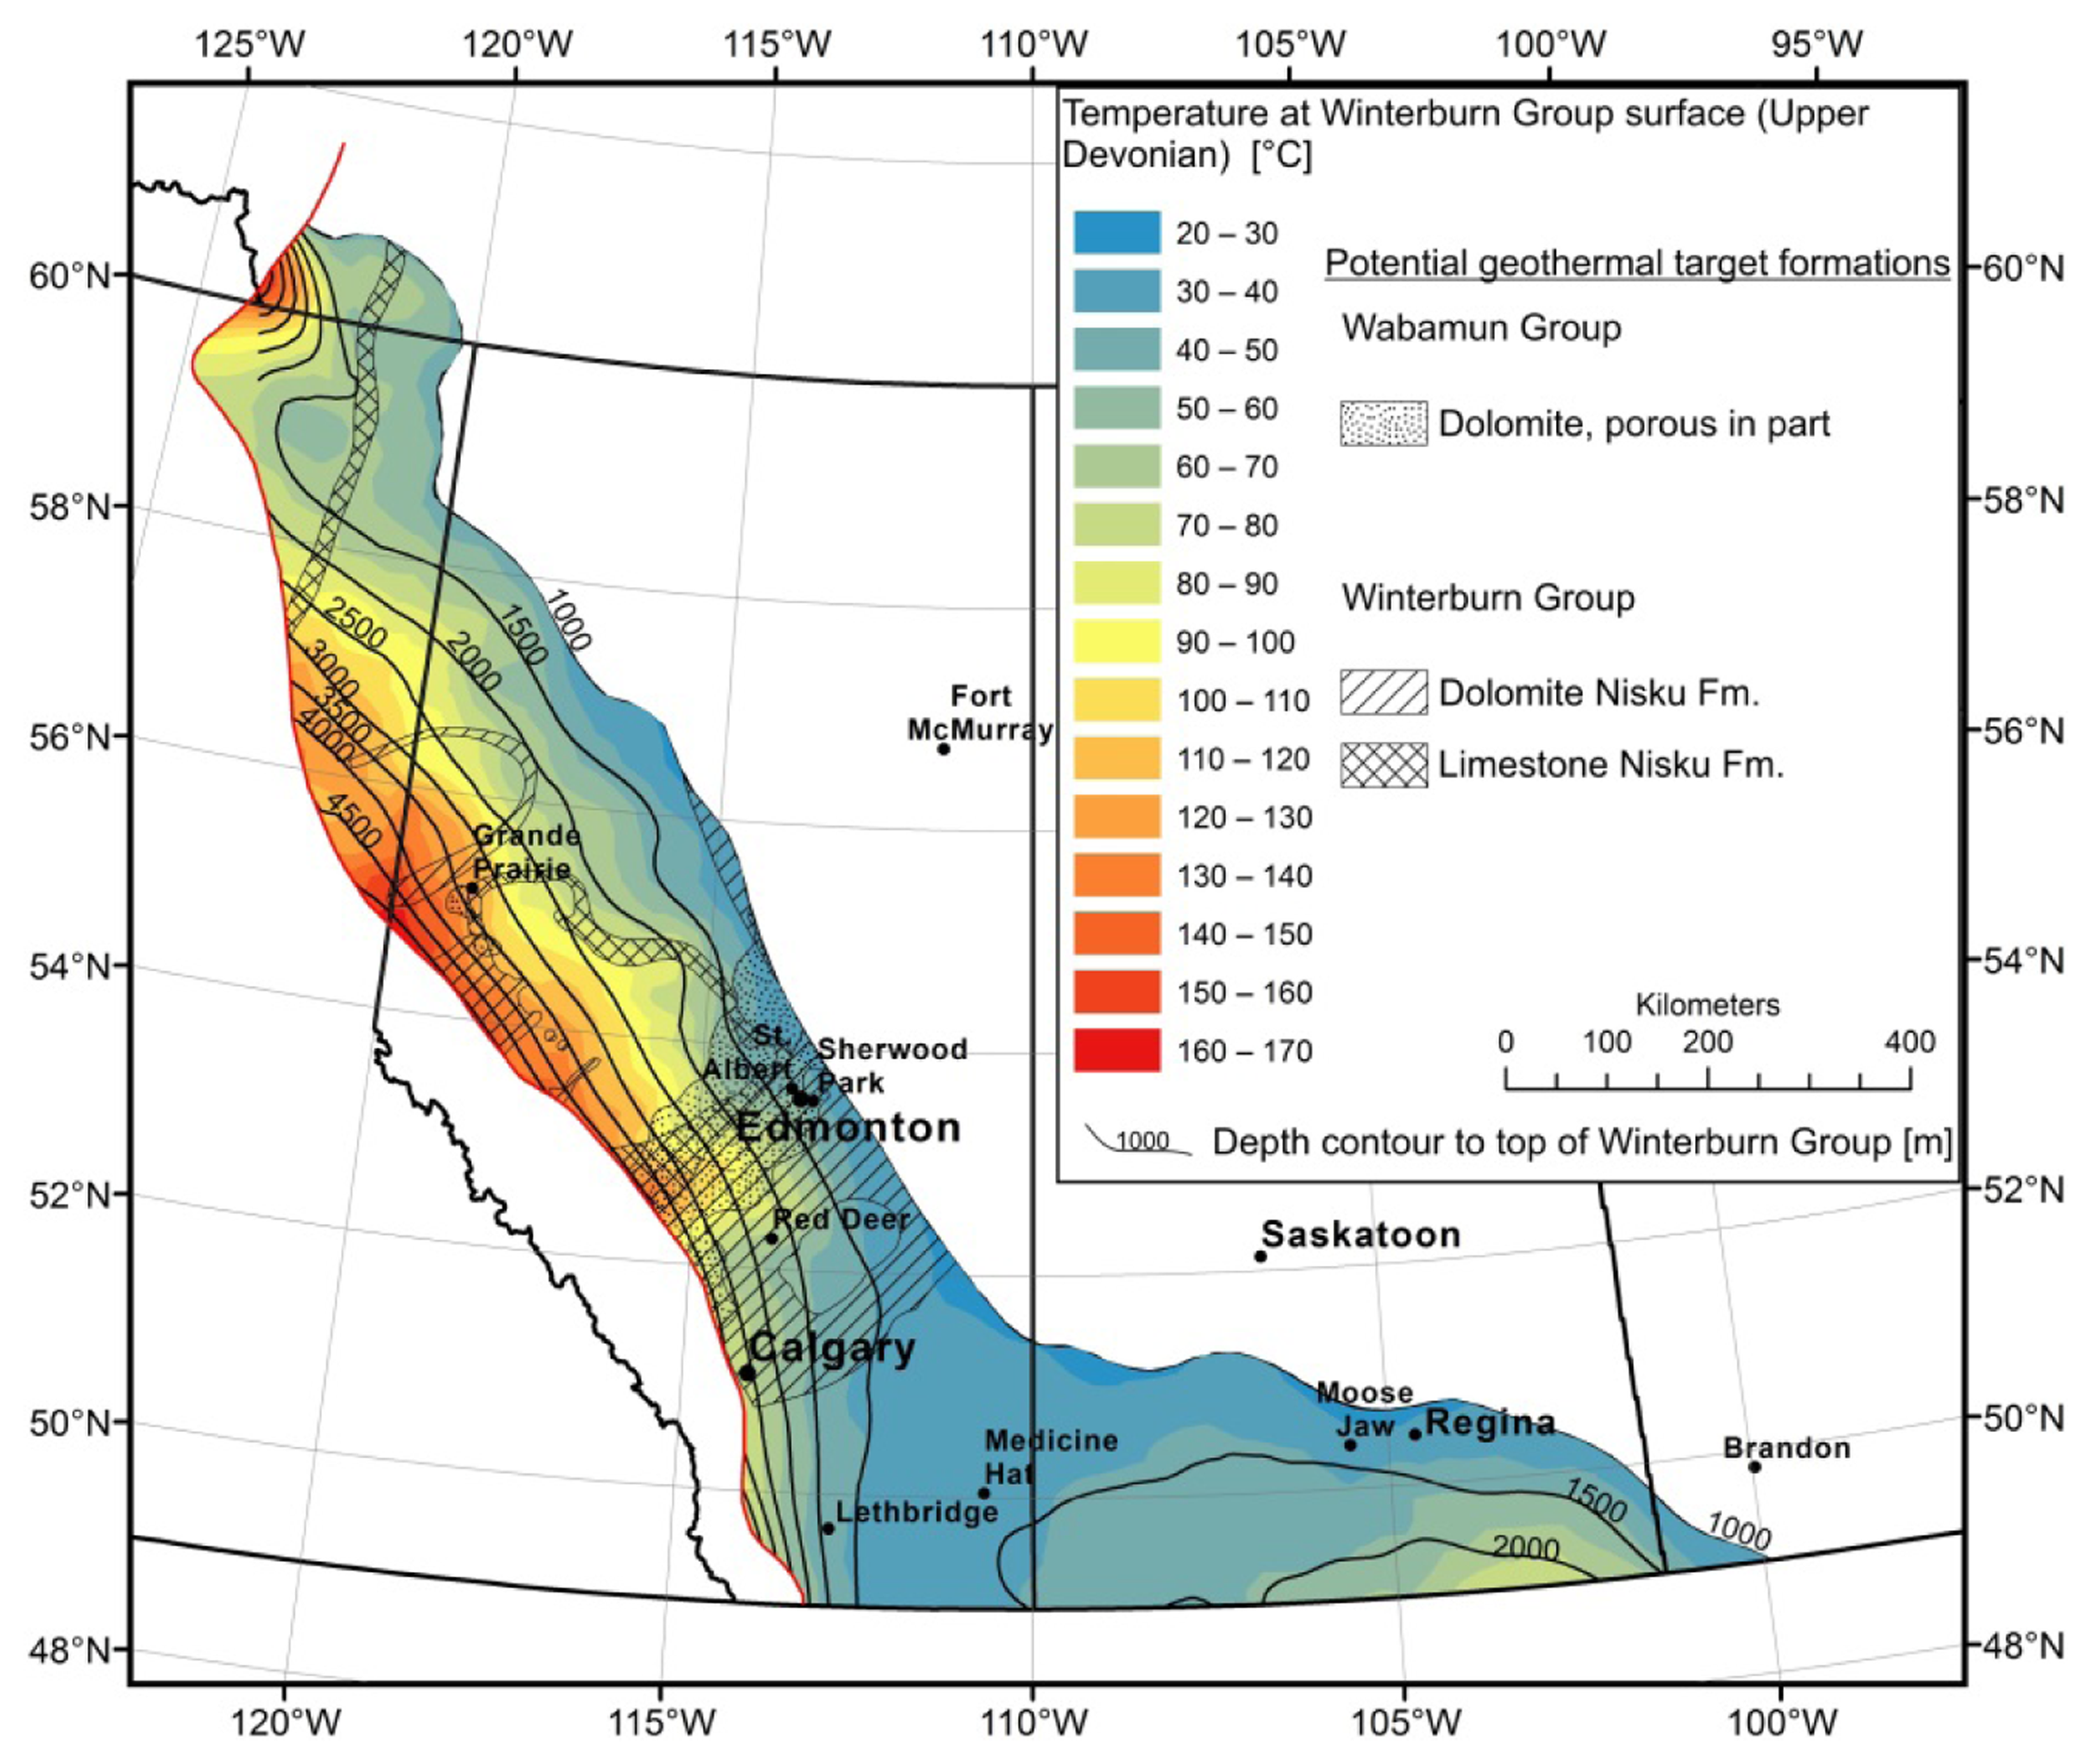
At the stratigraphic depth of the Devonian, the porous deposits from the carbonate platforms and reefal buildups in the Alberta and B.C. part of the WCSB are the potential targets formations (see Figures 6 and 7). Porous carbonate formations from the Carboniferous succession are deposited throughout the major part of the deeper WCSB (Figure 8). The temperature distribution at the sub-Mannville unconformity is the shallowest map presented in this study (Figure 9). Potential geothermal target formations are the sandstones and conglomerates of the Mannville Group above the unconformity, which reach temperatures above 60 °C in the cities of Red Deer and Great Prairie at a depth of about 2 km, and are naturally warmer at greater depths closer to the Cordillera.
5. Discussion
5.1. Controls upon Thermal Field
It is noticed that the thermal field in the WCSB is highly variable. Heat flow in the deep part of the basin varies from 30 mW/m2 in the south to 100 mW/m2 in the north; the geothermal gradient varies from as low as 20 °C/km to over 55 °C/km. While values in the range of 30–60 mW/m2 and 20–30 °C/km are typical for the Precambrian basement platform filled with sediment, values of 70–100 mW/m2 and 40–55 °C/km can be considered as high respectively anomalous.
There are several controlling factors for geothermal gradient:
Thermal conductivity;
Heat flow;
Gravity driven convectional heat transport.
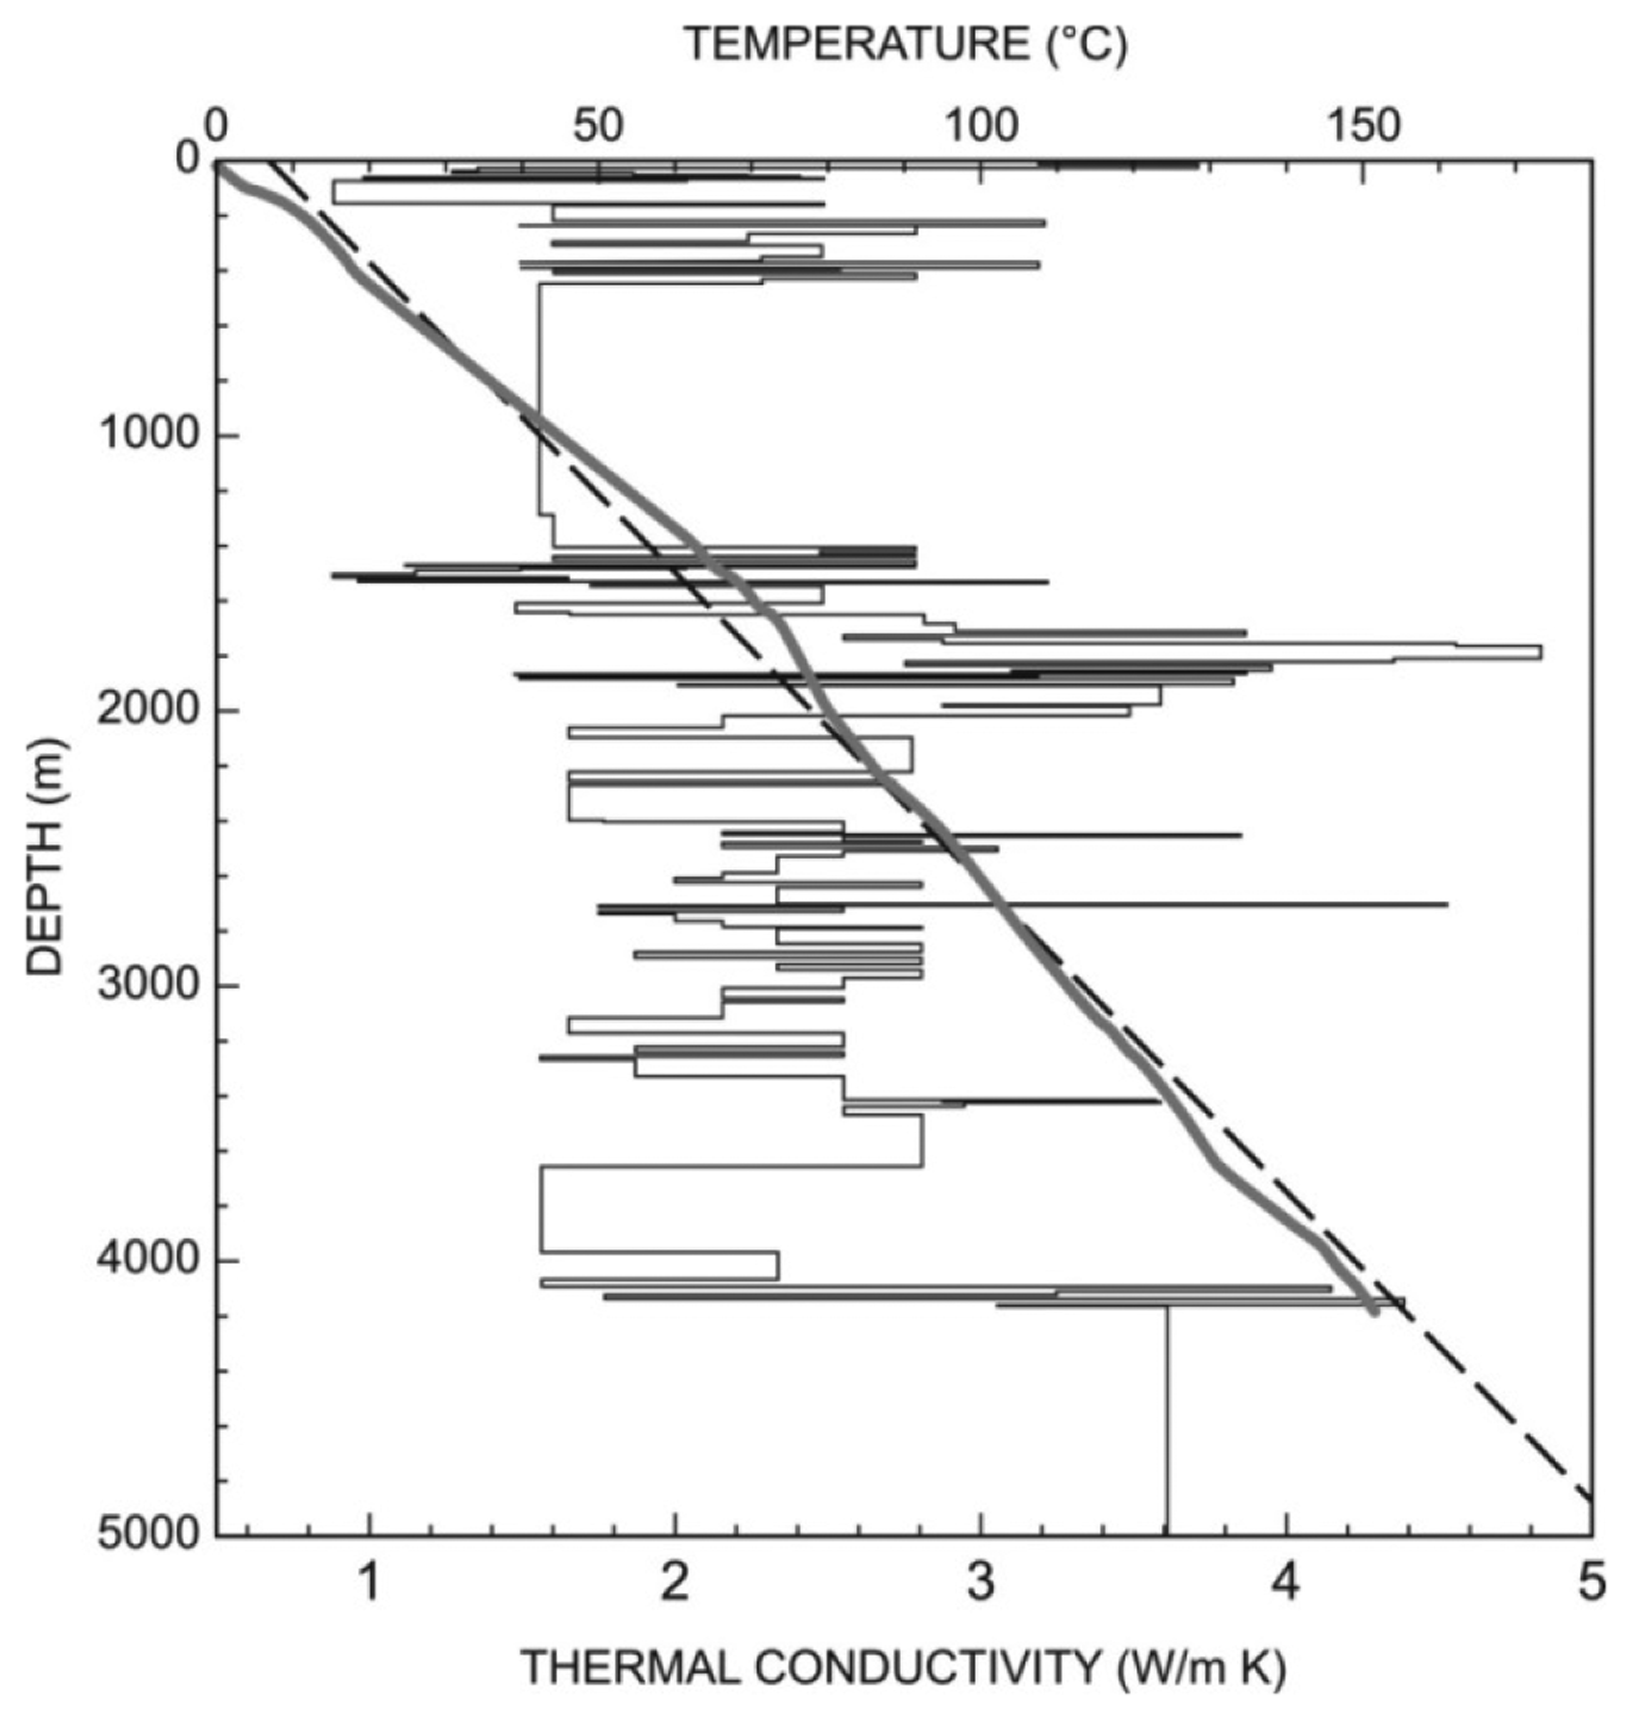
Thermal conductivity k controls the geothermal gradient at constant heat flow Q. The Q/k relationship for any depth along the vertical z axis of the well follows Fourier's law:
Thermal conductivity k for the crust for Canada is given by Jessop [35] and Beach, Jones and Majorowicz [22]. Beach et al. [22] based their statistic on 1405 values measured on core samples from Alberta basin rocks with use of the divided bar method. Typically, thermal conductivity is 3 W/mK for crystalline rocks, and 2 W/mK for sediments, which serve as a thermal blanket over the top of the crystalline crust. Figure 10 shows a good example of the control of k upon heat flow for a constant Q = 70 mW/m2 and a mean thermal gradient approximation for the sedimentary succession in this paper.
Heat flow at the surface is composed of the heat generation in the sediments (10−1 μW/m3), in the granitic upper crust (1–10 μW/m3), in the basaltic crust (10−2 μW/m3), and of the contribution from below the crust, which consists of input from transient sources and radiogenic heat production at a very low rate (10−3 μW/m3) [7]. While for several regions in the world a heat flow—heat generation relationship has been established (mainly for the measurements taken in the granitic batholiths [35]), it is difficult to find one for the heat flow estimates vs. heat generation of the basement of the WCSB [6]. In case of WCSB estimate of contribution from the upper crust can be based on 235U, 232Th and 40K radiogenic elements contribution [6,36] and lower crust and mantle contribution [36]. This shows that the so called “reduced heat flow” from the mantle and the lower crust is 37 mW/m2 (S.D. = 2 mW/m2) [36]. The upper crustal contribution varies in much wider range due to much larger variability of heat production of the “granitic” crust [6]. Its contribution will depend on the thickness the upper crustal high heat generating (“granitic”) part and the mean heat generation which differs between 1.1 μW/m3 (Precambrian shield) and 2.4 μW/m3 (WCSB) [36].
In the WCSB Burwash and Burwash [37] have provided data on uranium and thorium concentrations for 182 samples from the Precambrian basement in Alberta, Saskatchewan, Manitoba and British Columbia, and for the southern part of the Mackenzie Corridor of the southern Northwestern Territories. The measurements were made by the delayed neutron activation method. Jones and Majorowicz [6] included additional data from the Peace River area in north western Alberta (total of 229 samples analyzed in a nuclear reactor facility at the University of McMaster in Ontario). First analysis and mapping of the heat generation trends across the WCSB was reported by Jones and Majorowicz [6] who delineated three major high heat generation trends across the basement underlying the basin and concluded that these do not correlate with heat flow for the same study area (based on their heat flow data). Burwash and Burwash [37] and Bachu and Burwash [38] also did further analysis and mapping for Alberta and the WCSB, respectively. It has been noticed that the mean heat production for the WCSB is 2.4 μW/m3 [6,36] which is more than two times higher that of the eastern Canada for the shield 1.1 μW/m3 [36]. This can to some extent explain the elevated high heat flow in the WCSB based on the data which was used for the heat flow map (Figure 3b). The average heat flow for the WCSB is 60 mW/m2, with a standard deviation of 9 mW/m2, calculated from 74,728 determinations. If the average heat flow is calculated from the geostatistical interpolation grid presented in Figure 3b, the result is almost the same (61 mW/m2). This is much higher than the heat flow examined for the Precambrian shield which is closer to 42 mW/m2 (S.D. 9 mW/m2) [36]. There is a difference of approx. 18–19 mW/m2 which cannot be explained by the contribution of radiogenic elements in the sediments. It can be explained by the difference in mean heat generation between the shield and the WCSB, which differs from 1.1 μW/m3 to 2.4 μW/m3 respectively [36]. If the upper high heat productive “granitic” crust is about 15 km thick, the difference of 1.3 μW/m3 in heat generation will explain the difference of about 20 mW/m2.
A study based on gamma spectroscopy and API gamma logs from a 2.4 km deep well in the NE Alberta part of the WCSB [7] shows a large contrast in the contribution of radiogenic elements to heat production in the sedimentary succession (0.6 μW/m3) and in the Precambrian granites of the upper crust (3.2 μW/m3).
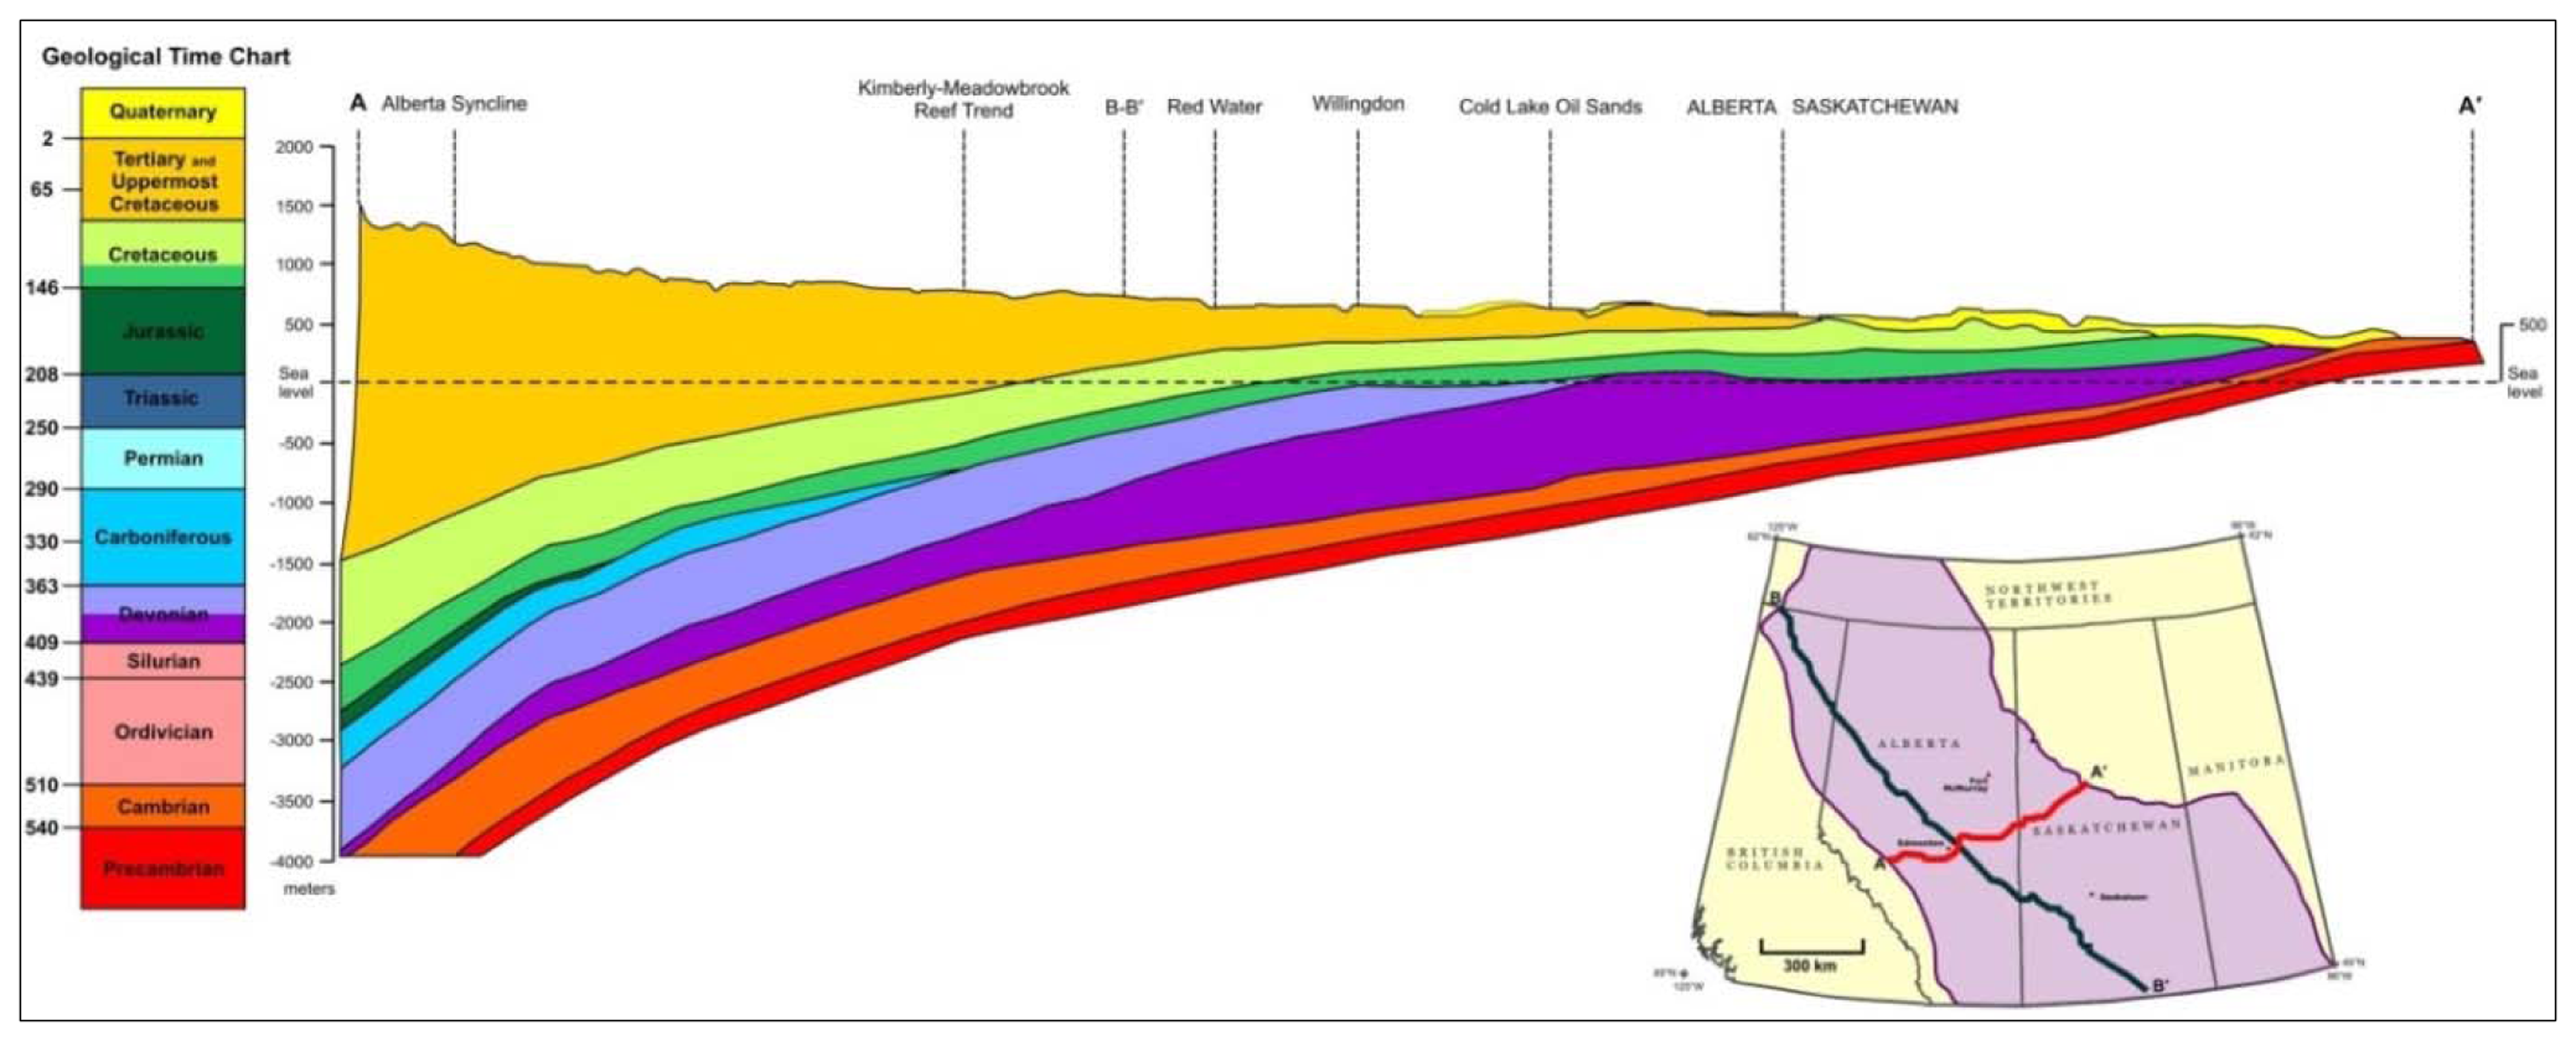
Temperatures in sedimentary rocks of the foreland basin can be influenced to some extent by non-conductive mechanisms, such as fluid flow. This occurs mainly through flow through porous aquifer conduits in the sedimentary succession above the westward deepening basement (Figure 11), however, flow through faults in the basement cannot be excluded. It was shown by previous research that in these porous sedimentary rocks the calculated surface Q values are significantly different (up to 50%) from the conductive Q, depending upon the nature of the hydrogeological system and its geometry which has been changing over time [1,10]. This was later questioned by Bachu and Burwash [38] who speculated on the relation of heat flow and heat generation as the main factor controlling distribution of thermal field in the WCSB. They argued that Darcy flow rates are too small to make an impact on regional-scale heat flow. Also hydraulic heads and Darcy fluid flow rates with reducing hydrodynamic influence upon heat flow have been diminishing over time due to the erosional change in topography. In the area towards the deep basin foothills of the Rocky Mountains about 2 km of erosion has taken place since the uplift during the Laramide orogeny [39].
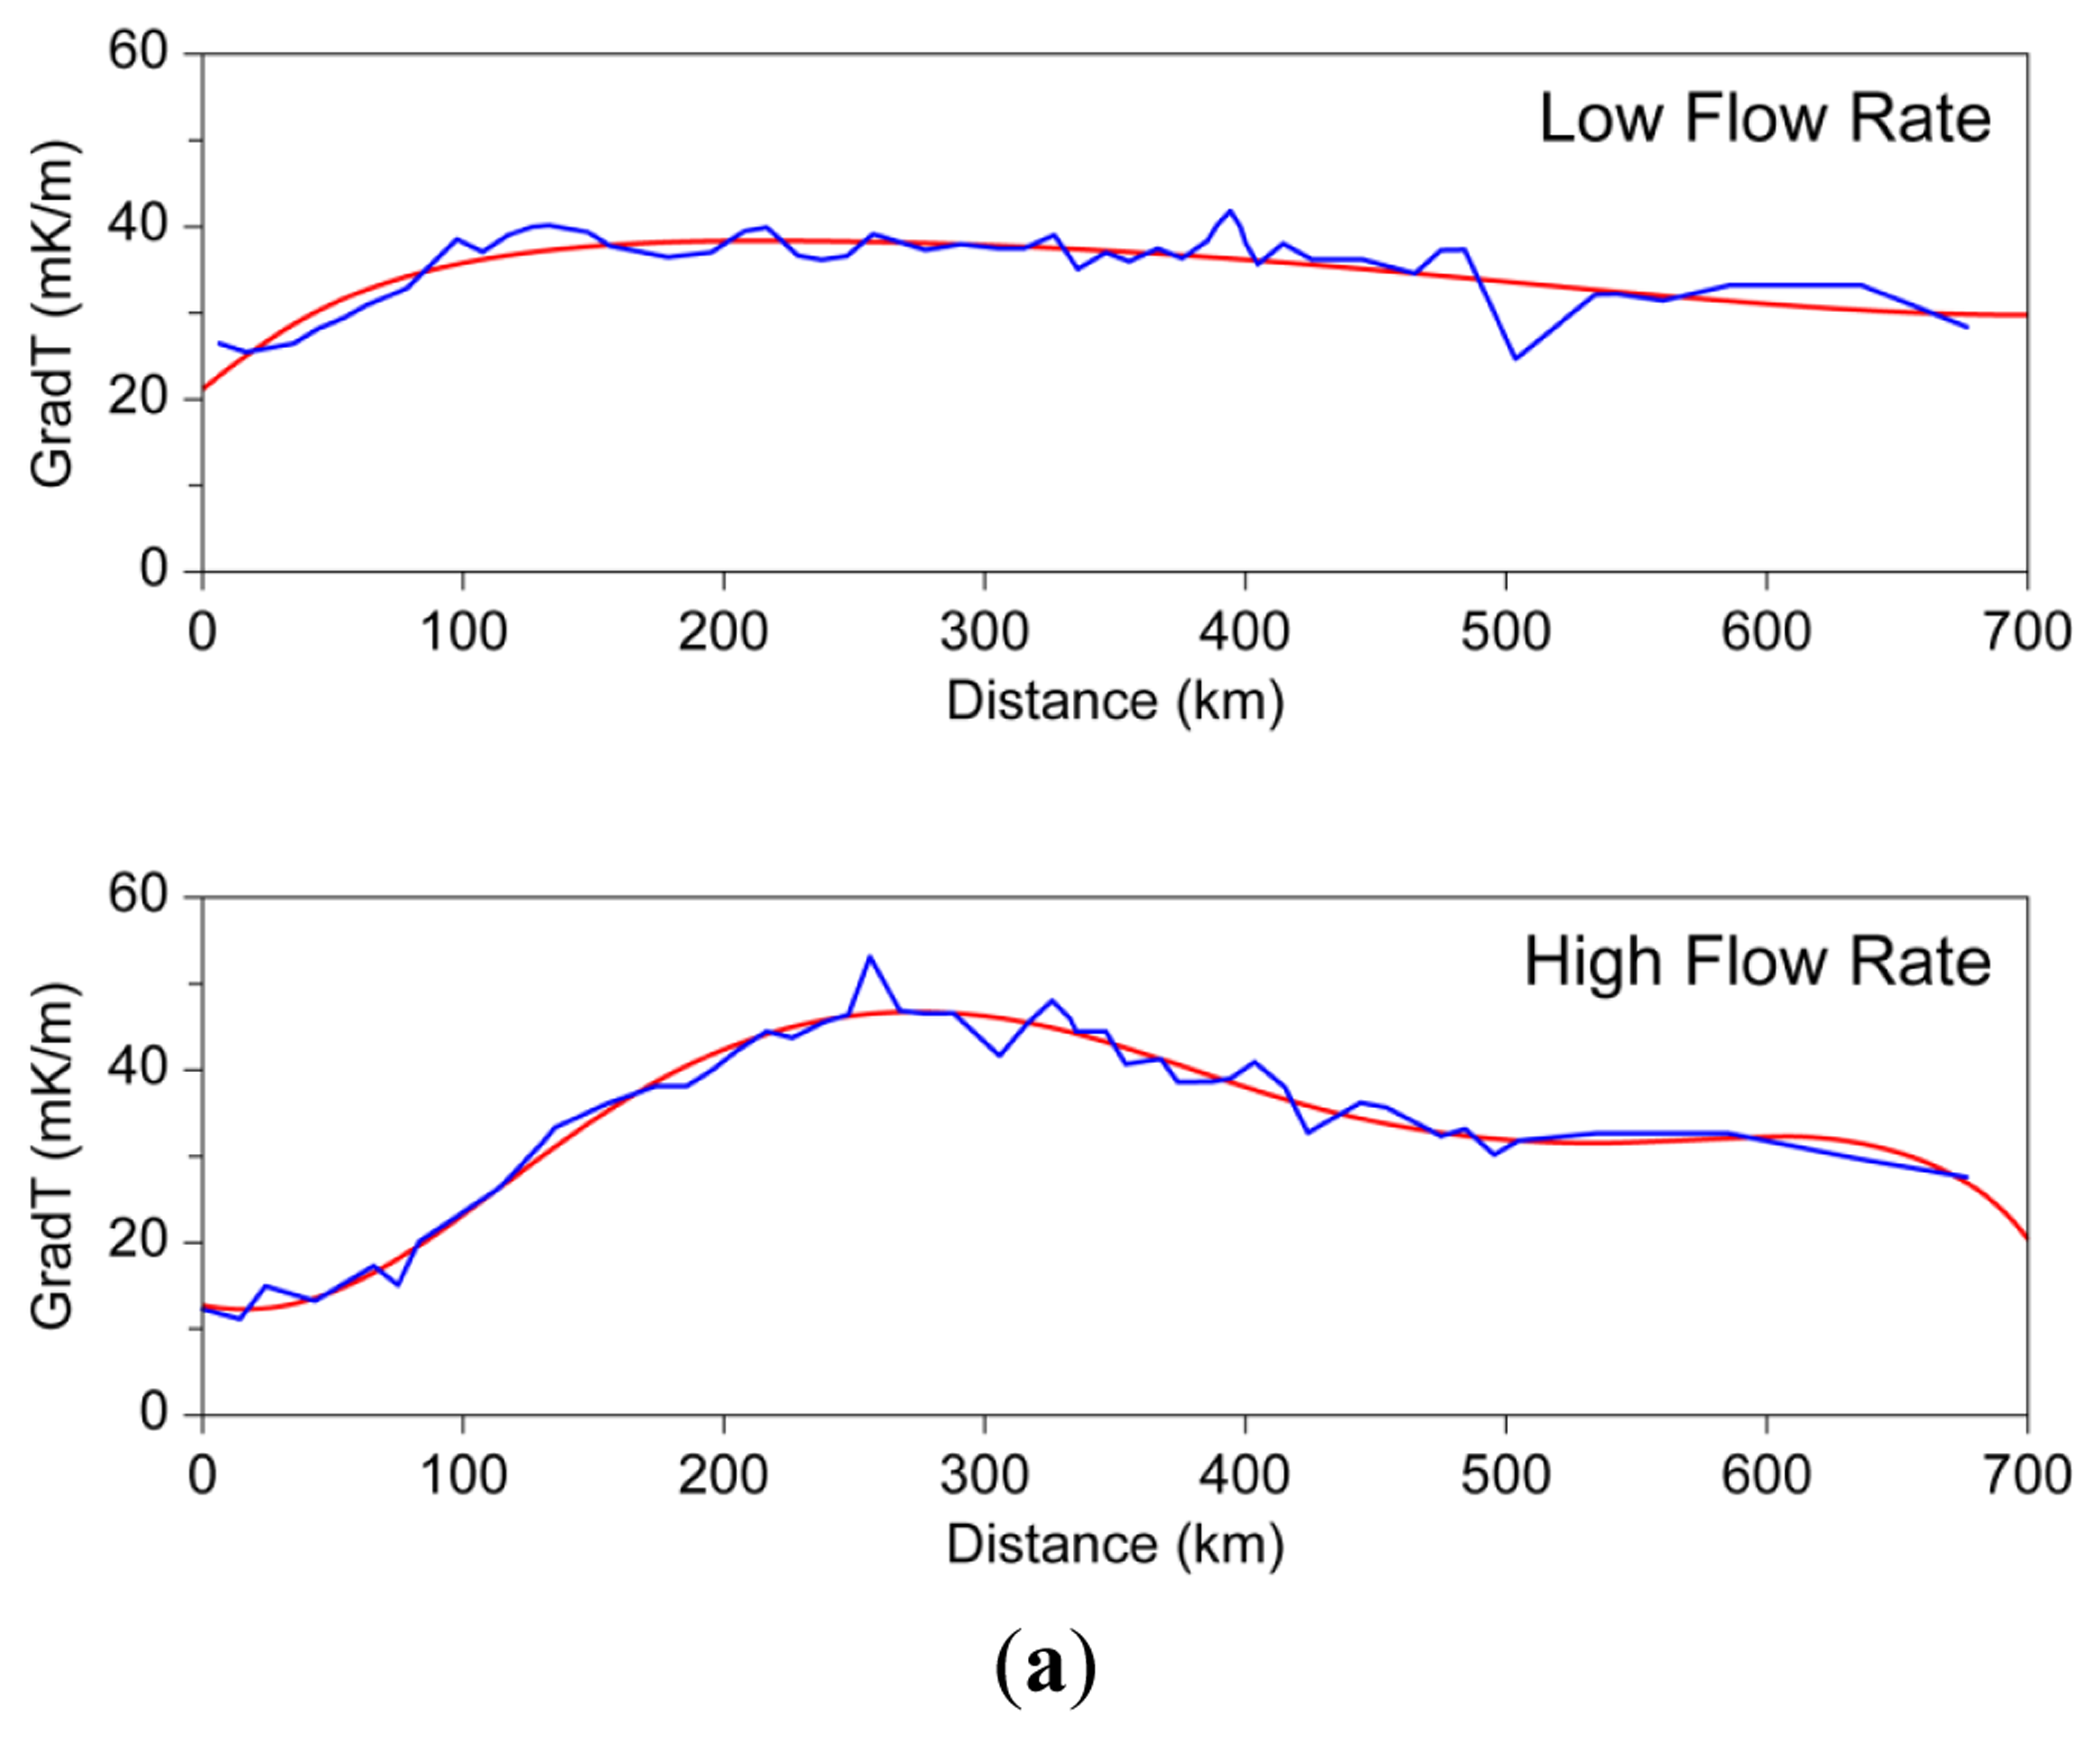
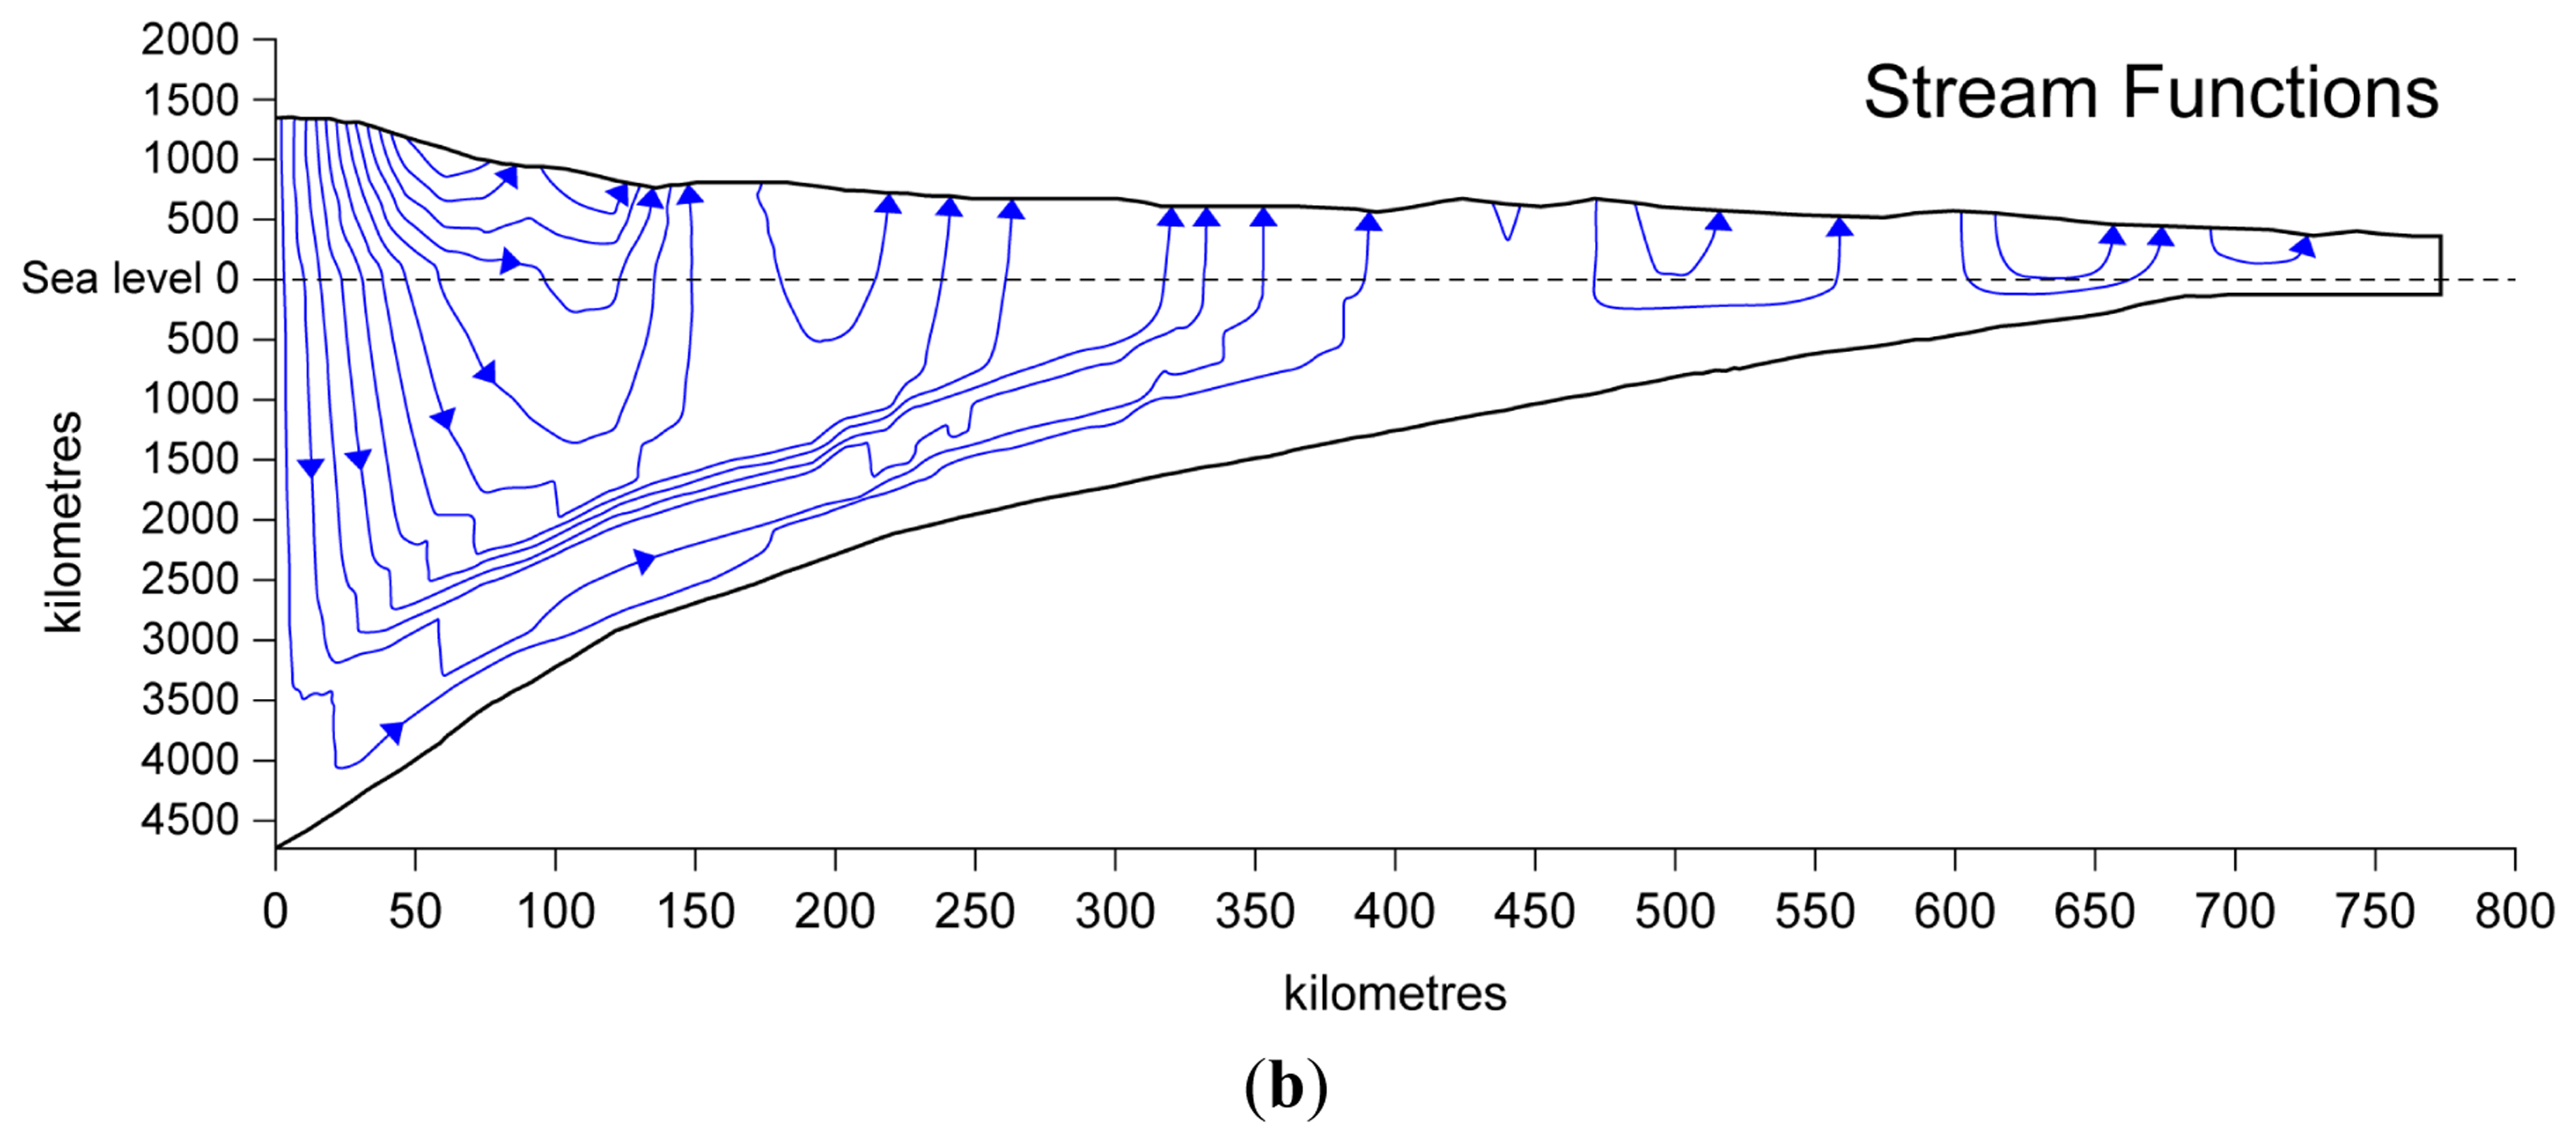
Majorowicz et al. [10] numerically tested the extent of hydrodynamic influence across the basin using a 2D numerical model constrained by revised thermal data. For this model a finite element mesh was generated which rebuilds the geometry of the cross section shown in Figure 11 (model is shown in lower panel of Figure 12). For the major fluid conduits like the Devonian carbonates or the Cambrian Basal Sandstone Unit the range of hydraulic conductivities was estimated. The Tertiary and Cretaceous shale units were assumed to have minimal permeability. Topography controls gravity driven flow patterns. Analysis shown in Figure 12 demonstrates that Darcy velocities of 0.01 to 1 m/yr can explain only 10–15 °C/km of thermal gradient elevation, and consequently cannot alone explain observations of temperature gradients elevated 30–40 °C/km above typical values for the basin. From the thermal gradient map (Figure 4) some reduction of gradients can be observed in high topography areas in the western part of the foreland basin, while some positive anomalies are located further east at a distance of 100 km and more, as predicted by the simple model which was made along the cross section through the central foreland basin (Figure 12a,b).
5.2. Geothermal Potential Zones
Other than previous studies on the geothermal potential of deep aquifers which all focused on a scale of several 10 km to few 100 km, this paper investigates temperatures and extension of potential geothermal target formations on the scale of the whole WCSB. With help of the maps presented in this paper the best locations for geothermal energy utilization can be identified both laterally and in the rock column on the WCSB scale. However, besides temperature, an appropriate (porous and permeable) reservoir is mandatory for a successful geothermal project. Though the extension of geological formations can be mapped over large distances with manageable effort, the facies of the formations, which controls the distribution of porosity and permeability, must always be investigated on a smaller scale. It is possible to map facies or reservoir properties such as porosity on a large scale, using well logs and core analysis data for example (see [17,19]). However, to obtain a reliable facies map for the scale of the WCSB, an enormous amount of well data would need to be collected, interpreted, classified and mapped, which is beyond the scope of this paper. Previous studies on geothermal reservoir parameters, though they are fragmented throughout the WCSB, can help to increase our knowledge on formation properties at a regional scale. Table 2 summarizes the major findings of these previous studies, and Figure 4 gives the location of these studies projected on the geothermal gradient map. Table 2 gives information on porosity and permeability which are important properties for reservoir evaluation. However, it must be emphasized that high porosities and permeabilities do not necessarily result in high flow rates, which are crucial for the success of a geothermal well. As a result of the large scale of this study, it was not possible to estimate of flow rates from single well tests for all formations presented. Lam and Jones [12,13] calculated flow rates from DST's for some aquifers in their geothermal exploration studies. In the Leduc Fm. in the central part of the Hinton-Edson area (area 4 in Figure 4; for formation properties see Table 2) flow rates of more than 400 m3/h are reached [12]. This value is high and can be compared to the wells at the geothermal power plants of Landau and Unterhaching in Germany, which produce at rates of 180–540 m3/h from carbonatic aquifers at a depth of 3–3.4 km [41,42].
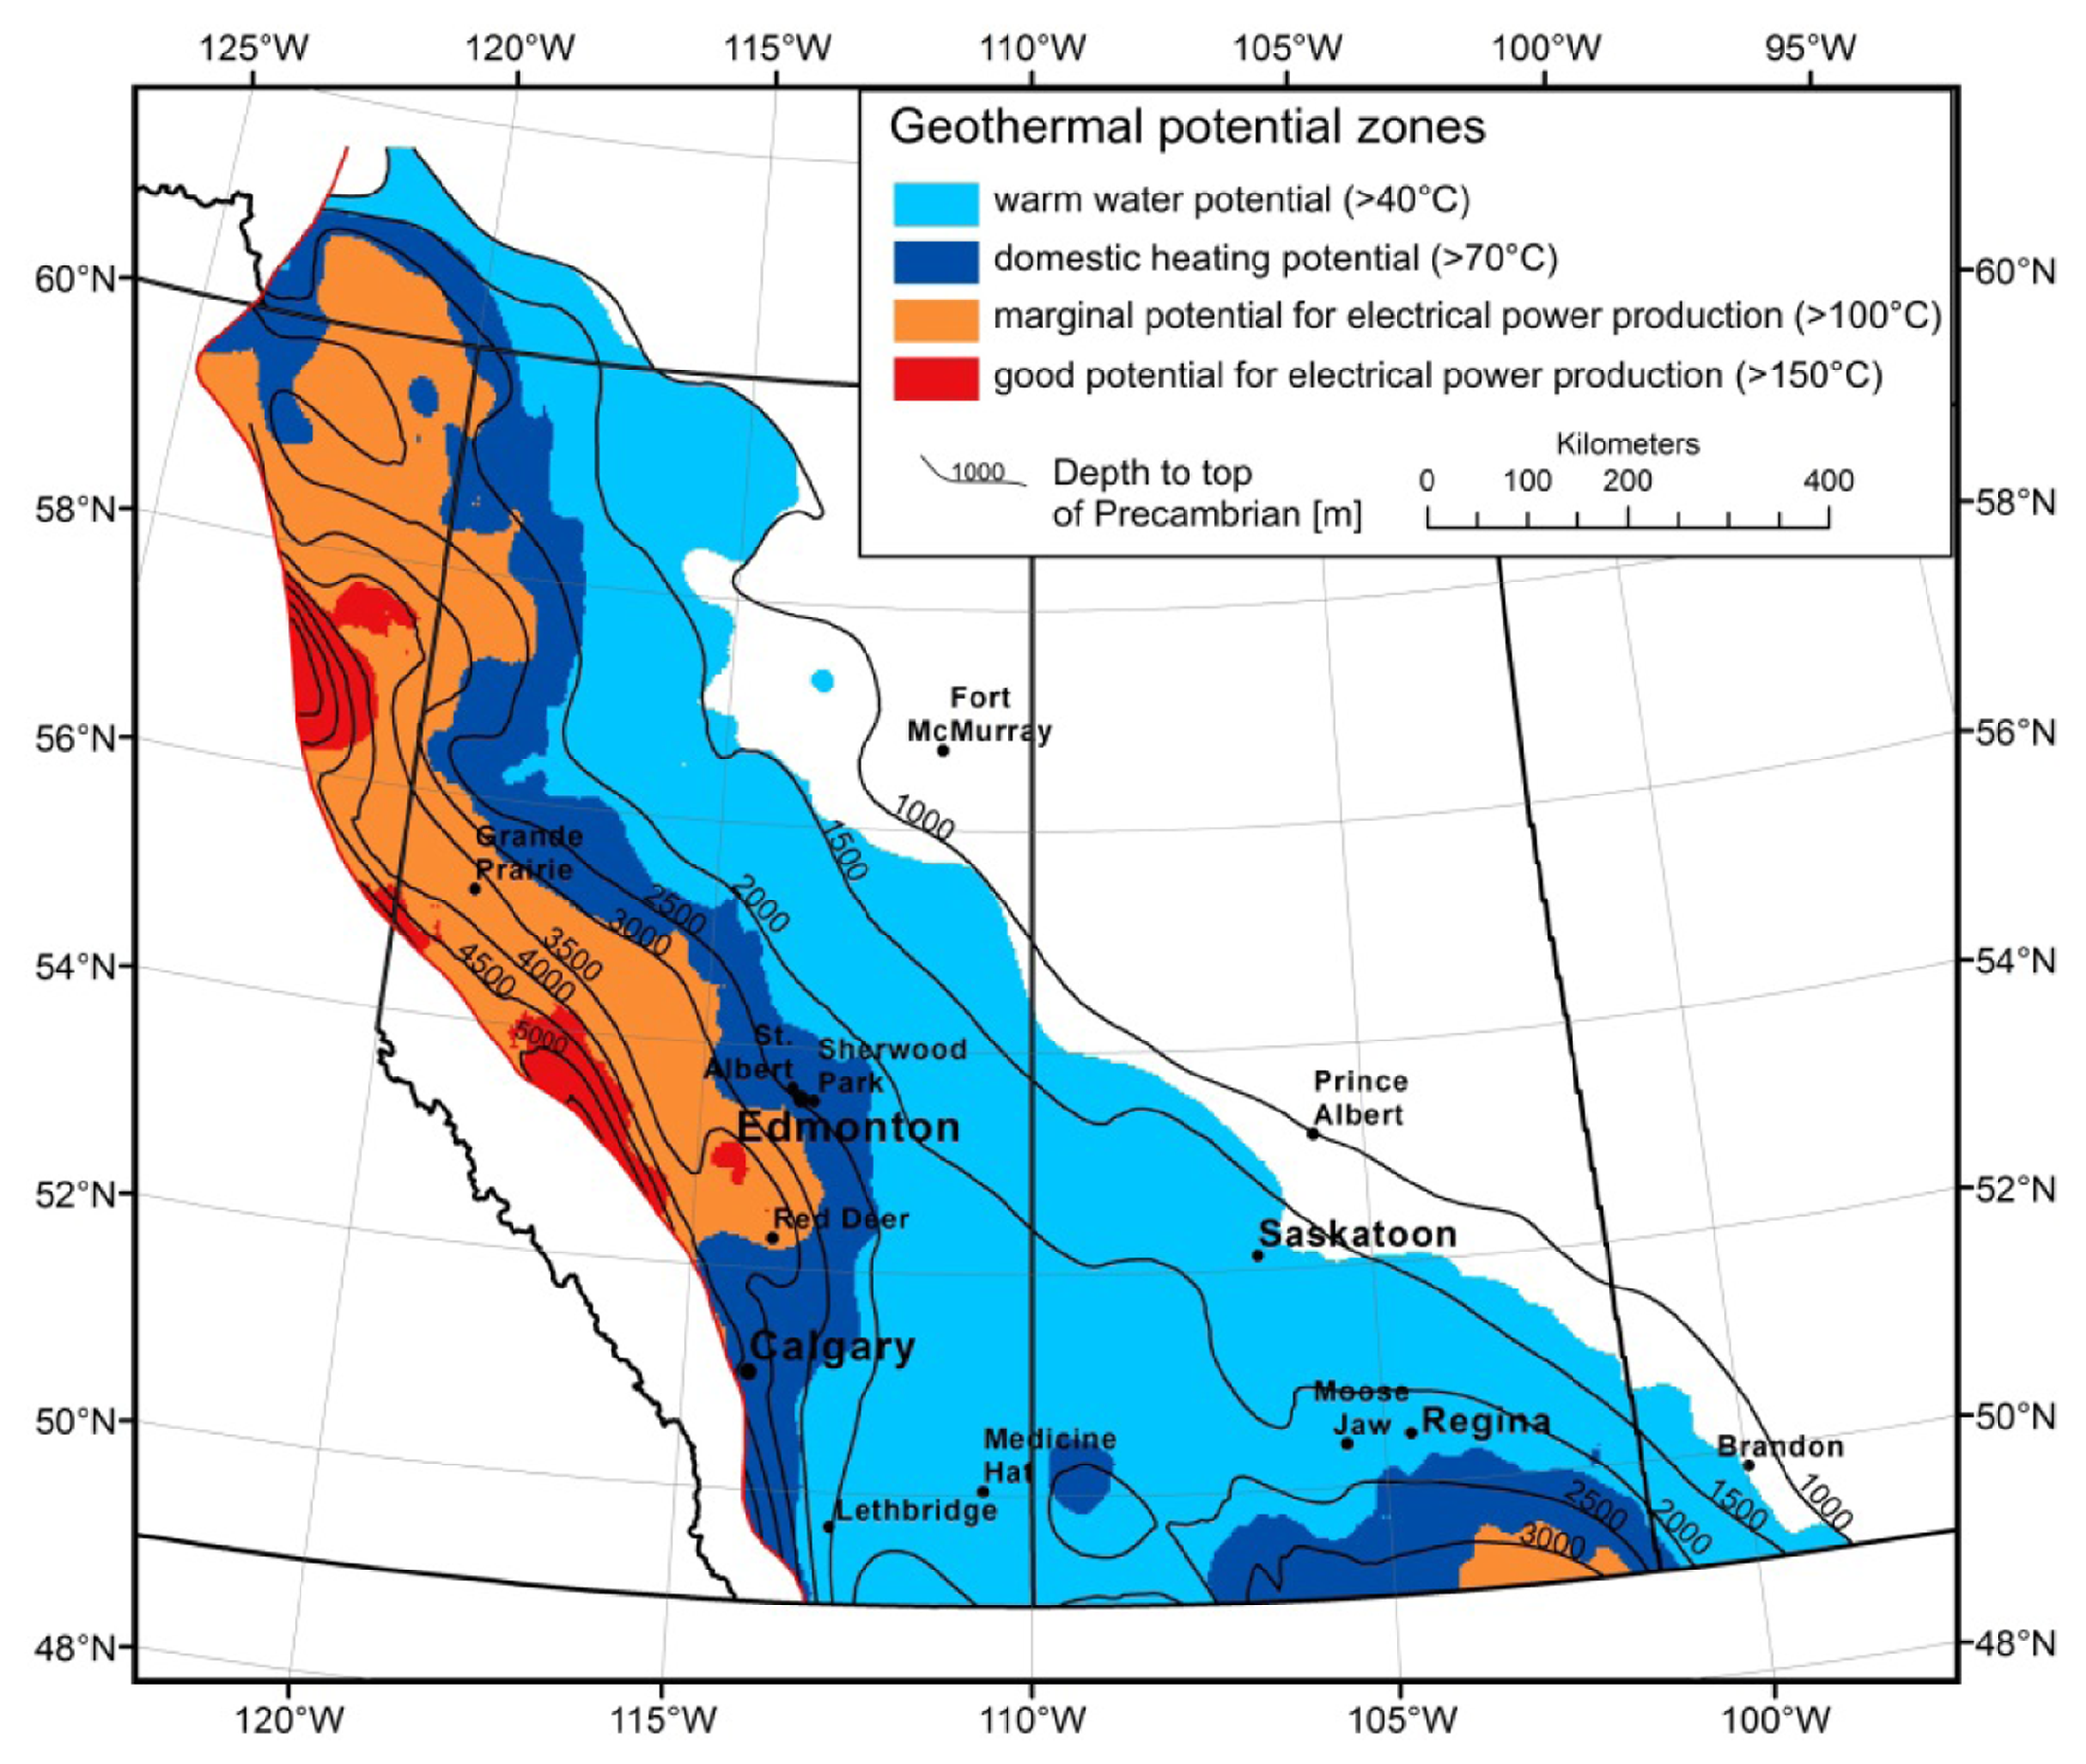
Depending on subsurface temperature and the heat demand at the surface, different applications for using geothermal resources are possible. In Figure 13 different geothermal potential zones are presented for the WCSB, depending on the Precambrian surface temperature, after a classification of Líndal [43]: (1) potential for warm water provision (>40 °C); (2) potential for domestic heating (>70 °C); (3) marginal potential for electrical power production (>100 °C); and (4) good potential for electrical power production (>150 °C). For the major part of the WCSB the temperatures at depths below 1.3 km are high enough to be used for warm water provision or balneological use. Underneath the large urban areas of Edmonton and Calgary, fluid temperatures are sufficient to be used for district heating purposes. Here geothermal heat production appears as a feasible option for a green, sustainable and economic way to reduce dependency on fossil fuels and decrease greenhouse gas emissions. For the southern part of Saskatchewan, Ferguson and Grasby [20] found that direct use of geothermal energy could be quite successful due to the high injection rates and sufficiently high temperatures.
Replacement of gas heating with geothermal systems could form part of a long range target for industrial emissions reduction. Based on the calculations from Majorowicz and Moore [44] 1000 heat generating systems (with 2 wells each) across Alberta drawing 100 °C from deep wells in deep sedimentary basin can save about 30 MT CO2 per year. For a comparison, the oil sands industry generates some 34.7 MT CO2 and other greenhouse gases [45]. 1000 wells is a small number compared to >300,000 oil and gas wells drilled in Alberta.
Electrical power production from geothermal heat is generally possible in the deepest part of the basin in vicinity of the Cordillera. A suitable spot for a geothermal power plant would be the geothermal anomaly around the hamlet of Winfield, located 100 km southwest of Edmonton and in direct vicinity of the Altalink transmission line. Here temperatures above 150 °C are found in the Basal Cambrian Sandstone Unit at a depth of 3.7 km. Another good location for a geothermal power plant is found in the area near Hinton in western Alberta, where temperatures in the Leduc Fm. at a depth of 5 km are above 150 °C [12]. Marginal potential for electrical power production exists at the Clarke Lake gas field near Ft. Nelson in northeastern B.C., where temperatures above 110 °C are found in 2.1 km deep Middle Devonian porous reefal carbonates [16], and in southeastern Saskatchewan in the highly permeable Basal Clastics aquifer, where temperatures are around 100 °C at depth of 3 km [20]. Generally it has to be emphasized that all locations presented here as favorable for geothermal utilizations represent locations with technical geothermal potential, based on the distribution of temperatures and potentially permeable formations. However, besides temperature the critical point in the development of a geothermal project is to achieve high flow rates. Hence, in the first phase of a local scale exploration study flow rates from DST's should be analyzed to evaluate whether a site has an economic geothermal potential. In some cases, depending on the geological and economic situation, stimulation techniques like massive waterfrac treatments or acid injection could be applied to increase permeability of the reservoir.
While exploitation of geothermal resources generally can help to significantly reduce Western Canada's CO2 emissions, geothermal power production could also lower the power costs for remote communities and reduce their dependency on diesel fuel transports. Electricity costs in remote areas of Canada range from 0.40 to 1.3 $/kWh [46]. Compared to the feed in tariffs for electricity from geothermal power plants in Germany of 0.20–0.28 $/kWh [47], or to the electricity generation costs from low temperature binary developments provided by the International Energy Agency [48], which range from 0.08 to 0.22 $/kWh, geothermal energy production could be economically in remote areas of Canada.
6. Conclusions
The thermal field of the WCSB is highly variable. The heat flow ranges from 30 mW/m2 in the south to high 100 mW/m2 in the north, while the geothermal gradient varies from as low as 20 °C/km to over 55 °C/km. The controlling factors of the thermal field in WCSB are poorly understood, and a heat flow—heat generation relationship cannot be established for the entire WCSB. Convective heat transport through fluid flow across the basin can partly explain observed thermal gradient variations.
For most of the WCSB potential geothermal target formations are present at sufficient depth. Especially the deep foreland basin clastic and carbonate plays offer potential for geothermal applications. In the large urban areas of Edmonton and Calgary, fluid temperatures are in the range of 80–90 °C and could be used for district heating, warm water provision, and for industrial applications. In the deepest basin, potential for electricity production by applying EGS technology exists.
Acknowledgments
The authors would like to acknowledge the helpful reviews by three anonymous reviewers. This study is part of the Helmholtz–Alberta Initiative (HAI), which is a research collaboration between the Helmholtz Association of German Research Centres and the University of Alberta.
We would like to thank HAI, and especially Theme 4 “Geothermal Energy” research coordinators Martyn Unsworth (UofA Edmonton) and Ernst Huenges (GFZ Potsdam), for enabling such an in depth study which increased our knowledge on the geothermal energy potential in the area.
We would like to thank Inga Moeck (UofA) for encouraging us to further conduct and deepen this study, which at an earlier point was presented during the “Reservoirs in foreland basin” session at the “Sedimentary Basins Jena 2013” conference in Jena, Germany.
Conflicts of Interest
The authors declare no conflict of interest.
References
- Majorowicz, J.; Jessop, A. Regional heat flow patterns in the western Canadian sedimentary basin. Tectonophysics 1981, 74, 209–238. [Google Scholar]
- Majorowicz, J.; Grasby, S.E. Heat flow, depth–temperature variations and stored thermal energy for enhanced geothermal systems in Canada. J. Geophys. Eng. 2010, 7, 232. [Google Scholar] [CrossRef]
- Garland, G.; Lennox, D. Heat flow in western Canada. Geophys. J. Int. 1962, 6, 245–262. [Google Scholar]
- Majorowicz, J.; Gosnold, W.; Gray, A.; Safanda, J.; Klenner, R.; Unsworth, M. Implications of post-glacial warming for northern Alberta heat flow- correcting for the underestimate of the geothermal potential. GRC Trans. 2012, 36, 693–698. [Google Scholar]
- Lam, H.; Jones, F. Geothermal gradients of Alberta in western Canada. Geothermics 1984, 13, 181–192. [Google Scholar]
- Jones, F.; Majorowicz, J. Regional trends in radiogenic heat generation in the Precambrian basement of the Western Canadian Basin. Geophys. Res. Lett. 1987, 14, 268–271. [Google Scholar]
- Majorowicz, J.; Unsworth, M.; Chacko, T.; Gray, A.; Heaman, L.; Potter, D.; Schmitt, D. Geothermal energy as a source of heat for oil sands processing in northern Alberta, Canada. In Heavy Oil/Bitumen Petroleum Systems in Alberta and beyond; Hein, F.J., Leckie, D.A., Suter, J., Larter, S., Eds.; American Association of Petroleum Geologists (AAPG): Tulsa, OK, USA, 2013; Volume 64, pp. 725–746. [Google Scholar]
- Bachu, S. Basement heat flow in the Western Canada sedimentary basin. Tectonophysics 1993, 222, 119–133. [Google Scholar]
- Jones, F.; Lam, H.-L.; Majorowicz, J. Temperature distributions at the Paleozoic and Precambrian surfaces and their implications for geothermal energy recovery in Alberta. Can. J. Earth Sci. 1985, 22, 1774–1780. [Google Scholar]
- Majorowicz, J.A.; Garven, G.; Jessop, A.; Jessop, C. Present heat flow along a profile across the Western Canada Sedimentary Basin: The extent of hydrodynamic influence. In Geothermics in Basin Analysis; Springer: Heidelberg, Germany, 1999; pp. 61–79. [Google Scholar]
- Gray, D.A.; Majorowicz, J.; Unsworth, M. Investigation of the geothermal state of sedimentary basins using oil industry thermal data: Case study from Northern Alberta exhibiting the need to systematically remove biased data. J. Geophys. Eng. 2012, 9, 534–548. [Google Scholar]
- Lam, H.-L.; Jones, F. Geothermal energy potential in the Hinton-Edson area of west-central Alberta. Can. J. Earth Sci. 1985, 22, 369–383. [Google Scholar]
- Lam, H.; Jones, F. An investigation of the potential for geothermal energy recovery in the Calgary area in southern Alberta, Canada, using petroleum exploration data. Geophysics 1986, 51, 1661–1670. [Google Scholar]
- Jessop, A.M.; Vigrass, L.W. Geothermal measurements in a deep well at Regina, Saskatchewan. J. Volcanol. Geotherm. Res. 1989, 37, 151–166. [Google Scholar]
- Grasby, S.E.; Allen, D.M.; Chen, Z.; Ferguson, G.; Jessop, A.; Kelman, M.; Majorowicz, J.; Moore, M.; Raymond, J.; Therrien, R. Geothermal Energy Resource Potential of Canada; Geological Survey of Canada: Calgary, AB, Canada, 2011; p. 322. [Google Scholar]
- Walsh, W. Geothermal resource assessment of the Clarke Lake Gas Field, Fort Nelson, British Columbia. Bull. Can. Pet. Geol. 2013, 61, 241–251. [Google Scholar]
- Weides, S.; Moeck, I.; Majorowicz, J.; Palombi, D.; Grobe, M. Geothermal exploration of Paleozoic formations in Central Alberta. Can. J. Earth Sci. 2013, 50, 519–534. [Google Scholar]
- Weides, S.; Moeck, I.; Majorowicz, J.; Grobe, M. The Cambrian Basal Sandstone Unit in Central Alberta—An investigation of temperature distribution, petrography and hydraulic and geomechanical properties of a deep saline aquifer. Can. J. Earth Sci. 2014. submitted. [Google Scholar]
- Weides, S.; Moeck, I.; Schmitt, D.; Majorowicz, J. An integrative geothermal resource assessment study for the siliciclastic Granite Wash Unit, north western Alberta (Canada). Environ. Earth Sci. 2014. [Google Scholar] [CrossRef]
- Ferguson, G.; Grasby, S.E. The geothermal potential of the basal clastics of Saskatchewan, Canada. Hydrogeol. J. 2014, 22, 143–150. [Google Scholar]
- Majorowicz, J.; Moore, M.C. Enhanced Geothermal Systems (EGS) Potential in the Alberta Basin; University of Calgary, Institute for Sustainability, Energy, Environment and Economy: Calgary, AB, Canada, 2008; p. 34. [Google Scholar]
- Beach, R.; Jones, F.; Majorowicz, J. Heat flow and heat generation estimates for the Churchill basement of the Western Canadian Basin in Alberta, Canada. Geothermics 1987, 16, 1–16. [Google Scholar]
- Mossop, G.D.; Shetsen, I. Geological Atlas of the Western Canada Sedimentary Basin; Canadian Society of Petroleum Geologists and Alberta Research Council: Edmonton, AB, Canada, 1994. [Google Scholar]
- Dixon, J. Stratigraphy and facies of Cambrian to lower Ordovician strata in Saskatchewan. Bull. Can. Pet. Geol. 2008, 56, 93–117. [Google Scholar]
- Trotter, R.D. Sedimentology and Depositional Setting of the Granite Wash of the Utikuma and Red Earth areas, North-Central Alberta; Dalhousie University: Dalhousie, NS, Canada, 1989. [Google Scholar]
- Slind, O.; Andrews, G.; Murray, D.; Norford, B.; Paterson, D.; Salas, C.; Tawadros, E. Middle Cambrian to Lower Ordovician Strata of the Western Canada Sedimentary Basin. In Geological Atlas of the Western Canada Sedimentary Basin; Special Report; Mossop, G., Shetsen, I., Eds.; Canadian Society of Petroleum Geologists and Alberta Research Council: Edmonton, AB, Canada, 1994; Volume 4, pp. 87–108. [Google Scholar]
- Pugh, D.C. Subsurface Lower Paleozoic Stratigraphy in Northern and Central Alberta; Geological Survey of Canada, Department of Energy, Mines and Resources: Ottawa, ON, Canada, 1973; p. 54. [Google Scholar]
- Pugh, D.C. Subsurface Cambrian Stratigraphy in Southern and Central Alberta; Geological Survey of Canada, Department of Energy, Mines and Resources: Ottawa, ON, Canada, 1971; p. 33. [Google Scholar]
- Switzer, S.; Holland, W.; Christie, D.; Graf, G.; Hedinger, A.; McAuley, R.; Wierzbicki, R.; Packard, J. Devonian Woodbend-Winterburn Strata of the Western Canada Sedimentary Basin. In Geological Atlas of the Western Canada Sedimentary Basin; Special Report; Mossop, G., Shetsen, I., Eds.; Canadian Society of Petroleum Geologists and Alberta Research Council: Edmonton, AB, Canada, 1994; Volume 4, pp. 165–202. [Google Scholar]
- Oldale, H.; Munday, R. Devonian Beaverhill Lake Group of the Western Canada Sedimentary Basin. In Geological Atlas of the Western Canada Sedimentary Basin; Special Report; Mossop, G., Shetsen, I., Eds.; Canadian Society of Petroleum Geologists and Alberta Research Council: Edmonton, AB, Canada, 1994; pp. 149–163. [Google Scholar]
- Meijer Drees, N.C. Devonian Elk Point Group of the Western Canada Sedimentary Basin. In Geological Atlas of the Western Canada Sedimentary Basin; Special Report; Mossop, G., Shetsen, I., Eds.; Canadian Society of Petroleum Geologists and Alberta Research Council: Edmonton, AB, Canada, 1994; Volume 4, pp. 129–138. [Google Scholar]
- Halbertsma, H. Devonian Wabamun Group of the Western Canada Sedimentary Basin. In Geological Atlas of the Western Canada Sedimentary Basin; Special Report; Mossop, G., Shetsen, I., Eds.; Canadian Society of Petroleum Geologists and Alberta Research Council: Edmonton, AB, Canada, 1994; Volume 4, pp. 203–220. [Google Scholar]
- Richards, B.; Barclay, J.; Bryan, D.; Hartling, A.; Henderson, C.; Hinds, R. Carboniferous Strata of the Western Canada Sedimentary Basin. In Geological Atlas of the Western Canada Sedimentary Basin; Special Report; Mossop, G., Shetsen, I., Eds.; Canadian Society of Petroleum Geologists and Alberta Research Council: Edmonton, AB, Canada, 1994; Volume 4, pp. 221–250. [Google Scholar]
- Hayes, B.; Christopher, J.; Rosenthal, L.; Los, G.; McKercher, B.; Minken, D.; Tremblay, Y.; Fennell, J.; Smith, D. Cretaceous Mannville Group of the Western Canada Sedimentary Basin. In Geological Atlas of the Western Canada Sedimentary Basin; Special Report; Mossop, G., Shetsen, I., Eds.; Canadian Society of Petroleum Geologists and Alberta Research Council: Edmonton, AB, Canada, 1994; Volume 4, pp. 317–334. [Google Scholar]
- Jessop, A.M. Thermal Geophysics; Elsevier: Amsterdam, The Netherlands, 1990; p. 316. [Google Scholar]
- Jessop, A.M. Thermal input from the basement of the Western Canada Sedimentary Basin. Bull. Can. Pet. Geol. 1992, 40, 198–206. [Google Scholar]
- Burwash, R.; Burwash, R. A radioactive heat generation map for the subsurface Precambrian of Alberta. Geol. Surv. Can. Pap. 1989, 89, 363–368. [Google Scholar]
- Bachu, S.; Burwash, R.A. Regional-scale analysis of the geothermal regime in the Western Canada Sedimentary Basin. Geothermics 1991, 20, 387–407. [Google Scholar]
- Majorowicz, J.; Jones, F.; Ertman, M.; Osadetz, K.; Stasiuk, L. Relationship between thermal maturation gradients, geothermal gradients and estimates of the thickness of the eroded foreland section, southern Alberta Plains, Canada. Mar. Pet. Geol. 1990, 7, 138–152. [Google Scholar]
- Wright, G.; McMechan, M.; Potter, D. Structure and Architecture of the Western Canada Sedimentary Basin. In Geological Atlas of the Western Canada Sedimentary Basin; Special Report; Mossop, G., Shetsen, I., Eds.; Canadian Society of Petroleum Geologists and Alberta Research Council: Edmonton, AB, Canada, 1994; Volume 4, pp. 25–40. [Google Scholar]
- Geothermie Neubrandenburg GmbH. Gröβtes geothermisches Kraftwerk in Süddeutschland: Wärmegeführtes Kalina-Kraftwerk in Unterhaching. Available online: http://www.gtn-online.de/Projekte/TiefeGeothermie/Projektbeispiel/grotesgeothermischeskraftwerkinsuddeutschland (accessed on 26 March 2014).
- Geox GmbH. Geothermische Stromerzeugung in Landau. Available online: http://www.geox-gmbh.de/media/Downloadbereich/projekt_1407internet-x.pdf (accessed on 26 March 2014).
- Líndal, B. Industrial and Other Applications of Geothermal Energy: (Except Power Production and District Heating). In Geothermal Energy: Review of Research and Development; United Nations Educational, Scientific and Cultural Organization (UNESCO): Paris, France, 1973; pp. 135–148. [Google Scholar]
- Majorowicz, J.; Moore, M. The feasibility and potential of geothermal heat in the deep Alberta foreland basin-Canada for CO2 savings. Renew. Energy 2014, 66, 541–549. [Google Scholar]
- Biello, D. How much will tar sands oil add to global warming? Available online: http://www.scientificamerican.com/article/tar-sands-and-keystone-xl-pipeline-impact-on-global-warming (accessed on 17 April 2014).
- Arriaga, M.; Cañizares, C.A.; Kazerani, M. Renewable energy alternatives for remote communities in Northern Ontario, Canada. IEEE Trans. Sust. Energy 2013, 4, 661–670. [Google Scholar]
- Einspeiseverguetung.info. Einspeiseverguetung Geothermie. Available online: http://www.einspeisevergütung.info/?page_id=41 (accessed on 26 March 2014).
- International Energy Agency. Renewable Energy Essentials: Geothermal. Available online: https://www.iea.org/publications/freepublications/publication/Geothermal_Essentials.pdf (accessed on 26 March 2014).


| Period | Group | Formation | Lithology | References | Figure |
|---|---|---|---|---|---|
| Cretaceous | Mannville | sandstone | [12] | 9 | |
| Cretaceous | Mannville | Cadomin | sandstone & congl. | [12] | 9 |
| Mississippian | Rundle | carbonates | [12,13] | 8 | |
| Mississippian | - | Charles | carbonates | - | 8 |
| Mississippian | - | Banff | limestone | - | 7 |
| Devonian | Wabamun | Wabamun | dolomite | [12,13,17] | 7 |
| Devonian | Winterburn | Nisku | carbonates | [12,13,17] | 7 |
| Devonian | Woodbend | Grosmont | dolomite | - | 6 |
| Devonian | Woodbend | Leduc | dolomite | [12,17] | 6 |
| Devonian | Woodbend | Cooking Lake | reefal carbonates | [17] | 6 |
| Devonian | Beaverhill Lake | Slave Point | reefal carbonates | [12,16,19] | 6 |
| Devonian | Beaverhill Lake | Swan Hills | reefal carbonates | [19] | 6 |
| Devonian | Elk Point | Pine Point | dolostone | - | 6 |
| Devonian | - | Granite Wash Unit | sandstone | [19] | 5 |
| Ordovician | Basal Clastics | Winnipeg | sandstone | [14,20,24] | 5 |
| Cambrian | Deadwood | sandstone | |||
| Cambrian | - | Basal Sandstone Unit | sandstone | [13,17,18] | 5 |
| Area & basin depth | Geothermal gradient [°C/km] | Best aquifer | Lithology | Aquifer depth [km] | Thickness [m] | Porosity [%] | Permeability [mD] | Temp. [°C] | Other potential aquifers |
|---|---|---|---|---|---|---|---|---|---|
| Calgary (1) 3.4–4.2 km | 23.6 | Leduc | reefal carbonate, dolomitized | 3.7–4.0 | up to 300 | - | - | 87–94 | BSU, Nisku, Wabamun, Elkton |
| Clarke Lake (2) 2.4–2.6 km | up to 50–55 | Slave Point & Keg River | reefal carbonate, dolomitized | 2.0–2.1 | up to 200 | up to 25 | - | 110–123 | - |
| Edmonton (3) 1.8–3.5 km | 34.6 | BSU | sandstone | 1.8–3.5 | 28–45 | 7–19 | 1–>1000 (avg. ∼1) | 62–122 | Cooking Lake, Leduc, Nisku, Wabamun |
| Hinton–Edson (4) 4–6 km | 29.2 | Leduc | reefal carbonate, dolomitized | 3.4–5.4 | up to 250 | 6–12 | - | 99–158 | Slave Point, Nisku, Wabamun, Elkton, Belloy |
| Peace River (5) 1.7–2.3 km | 33 | Granite Wash Unit | sandstone | 1.7–2.4 | <30 | 2–19 | 1–>200 (avg ∼1–10) | 50–75 | Slave Point |
| Saskatchewan (6) 2.2 km | 28.1 | Basal Clastics | sandstone | 0.4–3.0 | 50–550 | 11–17 | 100–200 | 40–100 | - |
© 2014 by the authors; licensee MDPI, Basel, Switzerland. This article is an open access article distributed under the terms and conditions of the Creative Commons Attribution license ( http://creativecommons.org/licenses/by/3.0/).
Share and Cite
Weides, S.; Majorowicz, J. Implications of Spatial Variability in Heat Flow for Geothermal Resource Evaluation in Large Foreland Basins: The Case of the Western Canada Sedimentary Basin. Energies 2014, 7, 2573-2594. https://doi.org/10.3390/en7042573
Weides S, Majorowicz J. Implications of Spatial Variability in Heat Flow for Geothermal Resource Evaluation in Large Foreland Basins: The Case of the Western Canada Sedimentary Basin. Energies. 2014; 7(4):2573-2594. https://doi.org/10.3390/en7042573
Chicago/Turabian StyleWeides, Simon, and Jacek Majorowicz. 2014. "Implications of Spatial Variability in Heat Flow for Geothermal Resource Evaluation in Large Foreland Basins: The Case of the Western Canada Sedimentary Basin" Energies 7, no. 4: 2573-2594. https://doi.org/10.3390/en7042573