1. Introduction
During the last decade, the European photovoltaic (PV) sector has expanded at an extraordinary pace, significantly contributing to reducing CO
2 emissions into the atmosphere, while creating so-called “green jobs” [
1,
2,
3]. According to the latest available data [
4], from 2004 to 2013 European PV installed capacity has grown at an average annual rate of 69.8% (
Table 1).
Table 1.
PV installed capacity (in MW) in Italy and in European Union from 2004 to 2013.
Table 1.
PV installed capacity (in MW) in Italy and in European Union from 2004 to 2013.
| Items | 2004 | 2005 | 2006 | 2007 | 2008 | 2009 | 2010 | 2011 | 2012 | 2013 | Total |
|---|
| Italy | 4.7 | 15.6 | 12.5 | 70.2 | 338.0 | 698.8 | 2,326.1 | 9,303.0 | 3,369.0 | 1,462.0 | 17,614.0 |
| European Union | 658.3 | 914.2 | 926.5 | 1,833.1 | 5,070.3 | 5,739.0 | 13,478.8 | 22,019.4 | 16,673.5 | 9,922.2 | 78,798.2 |
| Incidence (%) | 0.7 | 1.7 | 1.3 | 3.8 | 6.7 | 12.2 | 17.3 | 42.2 | 20.2 | 14.7 | 22.4 |
As reported from different studies [
5,
6,
7,
8], during the period analyzed the growth of the PV sector is mainly attributable to national policies, aimed at remunerating electricity production by PV systems, that have reassured potential investors on investment feasibility [
9], encouraging the widespread installation of PV systems in Europe Union territory.
At the end of 2013, Italy accounted for 22.4% of total European PV installed capacity, reaching in the period under analysis an average annual growth rate equal to 149.5%, thus more than doubling every year. In particular, over the years the Italian feed-in scheme has granted overly profitable tariffs and advantageous conditions to investors [
10,
11,
12,
13], originating from the incapacity of political interventions to correlate incentive size to changes in the PV market [
14].
Anyway, as of July 2013 the Italian feed-in scheme has no longer been in effect, since PV incentives reached their critical annual cost of 6.7 billion Euros [
15]. However, the present Italian regulatory framework allows PV systems to take advantage of net metering, facilitating energy self-consumption. In this context, it is essential to assess whether unsubsidized electricity production from PV plants remains economically convenient, in order to provide a real measure of the competitiveness of photovoltaic technologies [
16].
Grid parity is defined as the moment when PV levelized cost of electricity (LCOE) becomes competitive with grid electricity prices. Once PV grid parity is reached, electricity consumers would be better off by self-consuming PV-generated electricity instead of purchasing electricity from the grid [
17].
Over the years, both cost reduction of PV systems and increases in retail prices of electricity have improved PV cost-competitiveness, making PV systems profitable in some markets, even without granting incentives. Furthermore, future generation costs of solar electricity are expected to decrease in coming decades, due to the law of mass production and learning from experience, whereas the price of fossil fuels will probably increase [
18]. Some studies [
17,
19,
20] have reported that grid parity has been reached in some Italian areas according to the specific size of the PV system, due mainly to high irradiation levels, expensive grid electricity prices and cost-competitive installations of PV systems. Moreover, grid parity is more readily achieved in insular systems, primarily thanks to the higher selling prices of the produced energy [
21].
Among the different typologies of PV systems, the large availability of surfaces guaranteed by greenhouses could be exploited by installing PV panels and thereby reducing grid electricity requirements [
22,
23], that ranged from 10,000 to 70,000 kWh/ha for solar greenhouses located in the Mediterranean area [
24]. Moreover, Italian greenhouses that could satisfy their own electrical needs by means of PV panels amounted to a surface of about 6000 ha [
25].
In this paper an economic and cost analysis of several PV grid-connected systems on greenhouses has been carried out, similarly to other studies [
14,
26,
27,
28]. It has been assumed that PV systems have access to net metering, so that the electricity fed into the grid could be economically offset with the value of electricity withdrawn from the grid service. In this way, we assumed that all the PV-generated electricity is self-consumed by solar greenhouses. Moreover, national incentives to electricity production were considered absent.
The solar greenhouses selected are located on the southern coast of Sicily that, thanks to its favorable climatic conditions [
29,
30,
31,
32,
33,
34,
35,
36,
37,
38,
39], allowed elevated electricity production from PV panels. Renewable sources could play an important role in covering Sicilian energy consumption [
40], both in the form of solar energy as well as other sources [
41,
42,
43,
44,
45,
46,
47,
48].
First of all, as reported in other studies [
19,
49,
50,
51], PV electricity costs have been calculated by means of LCOE, because high electricity generating costs have represented the main obstacle to more widespread deployment of PV technologies [
52], in order to compare the generation costs of electricity by conventional and PV plants [
53].
Subsequently, economic analysis of PV investments has been determined through the methods of net present value (NPV), internal rate of return (IRR) and discounted payback time (DPBT).
Finally, in line with similar studies [
54,
55], a sensitivity analysis has been carried out by varying the main parameters that affected profitability of PV systems, in order to evaluate the effect of potential changes in market conditions so as to make useful comparisons with the results of other self-consumption scenarios.
The main aim of this paper was to assess the economic feasibility of unsubsidized PV systems on greenhouses, in the post feed-in Italian scheme. This could represent important savings for the whole electric system, even in the absence of incentives, since large amounts of electricity can be used from renewable sources at a much lower cost [
56]. In fact, if on the one hand the Italian PV energy policy reached and exceeded in a short time the legislators’ objectives in terms of installed capacity, also creating new job opportunities, on the other hand it entailed a drawback in terms of public spending, as the same targets could have be achieved with a lower burden in terms of public funds [
57,
58,
59].
In this way, we also hope to prove the profitability of grid parity, so as to encourage the widespread diffusion of solar greenhouses.
2. PV Systems in the Italian Primary Sector
For farms solar energy represents an efficient means to reduce the production costs in terms of energy requirements [
60], especially in distant rural areas, with important environmental benefits [
22,
61]. In fact, PV technologies are proven to be sustainable and environment-friendly as measured by energy payback time and greenhouse gas emission rate [
62,
63]. Moreover, PV systems lead farms to the concept of sustainable agriculture, based on the delicate balance of maximizing crop productivity and maintaining economic stability, while minimizing the utilization of finite natural resources and negative environmental impacts [
64]. However, it is reasonable to find an analogy between agricultural production and electricity generated from PV systems, since both use the land and solar radiation [
65].
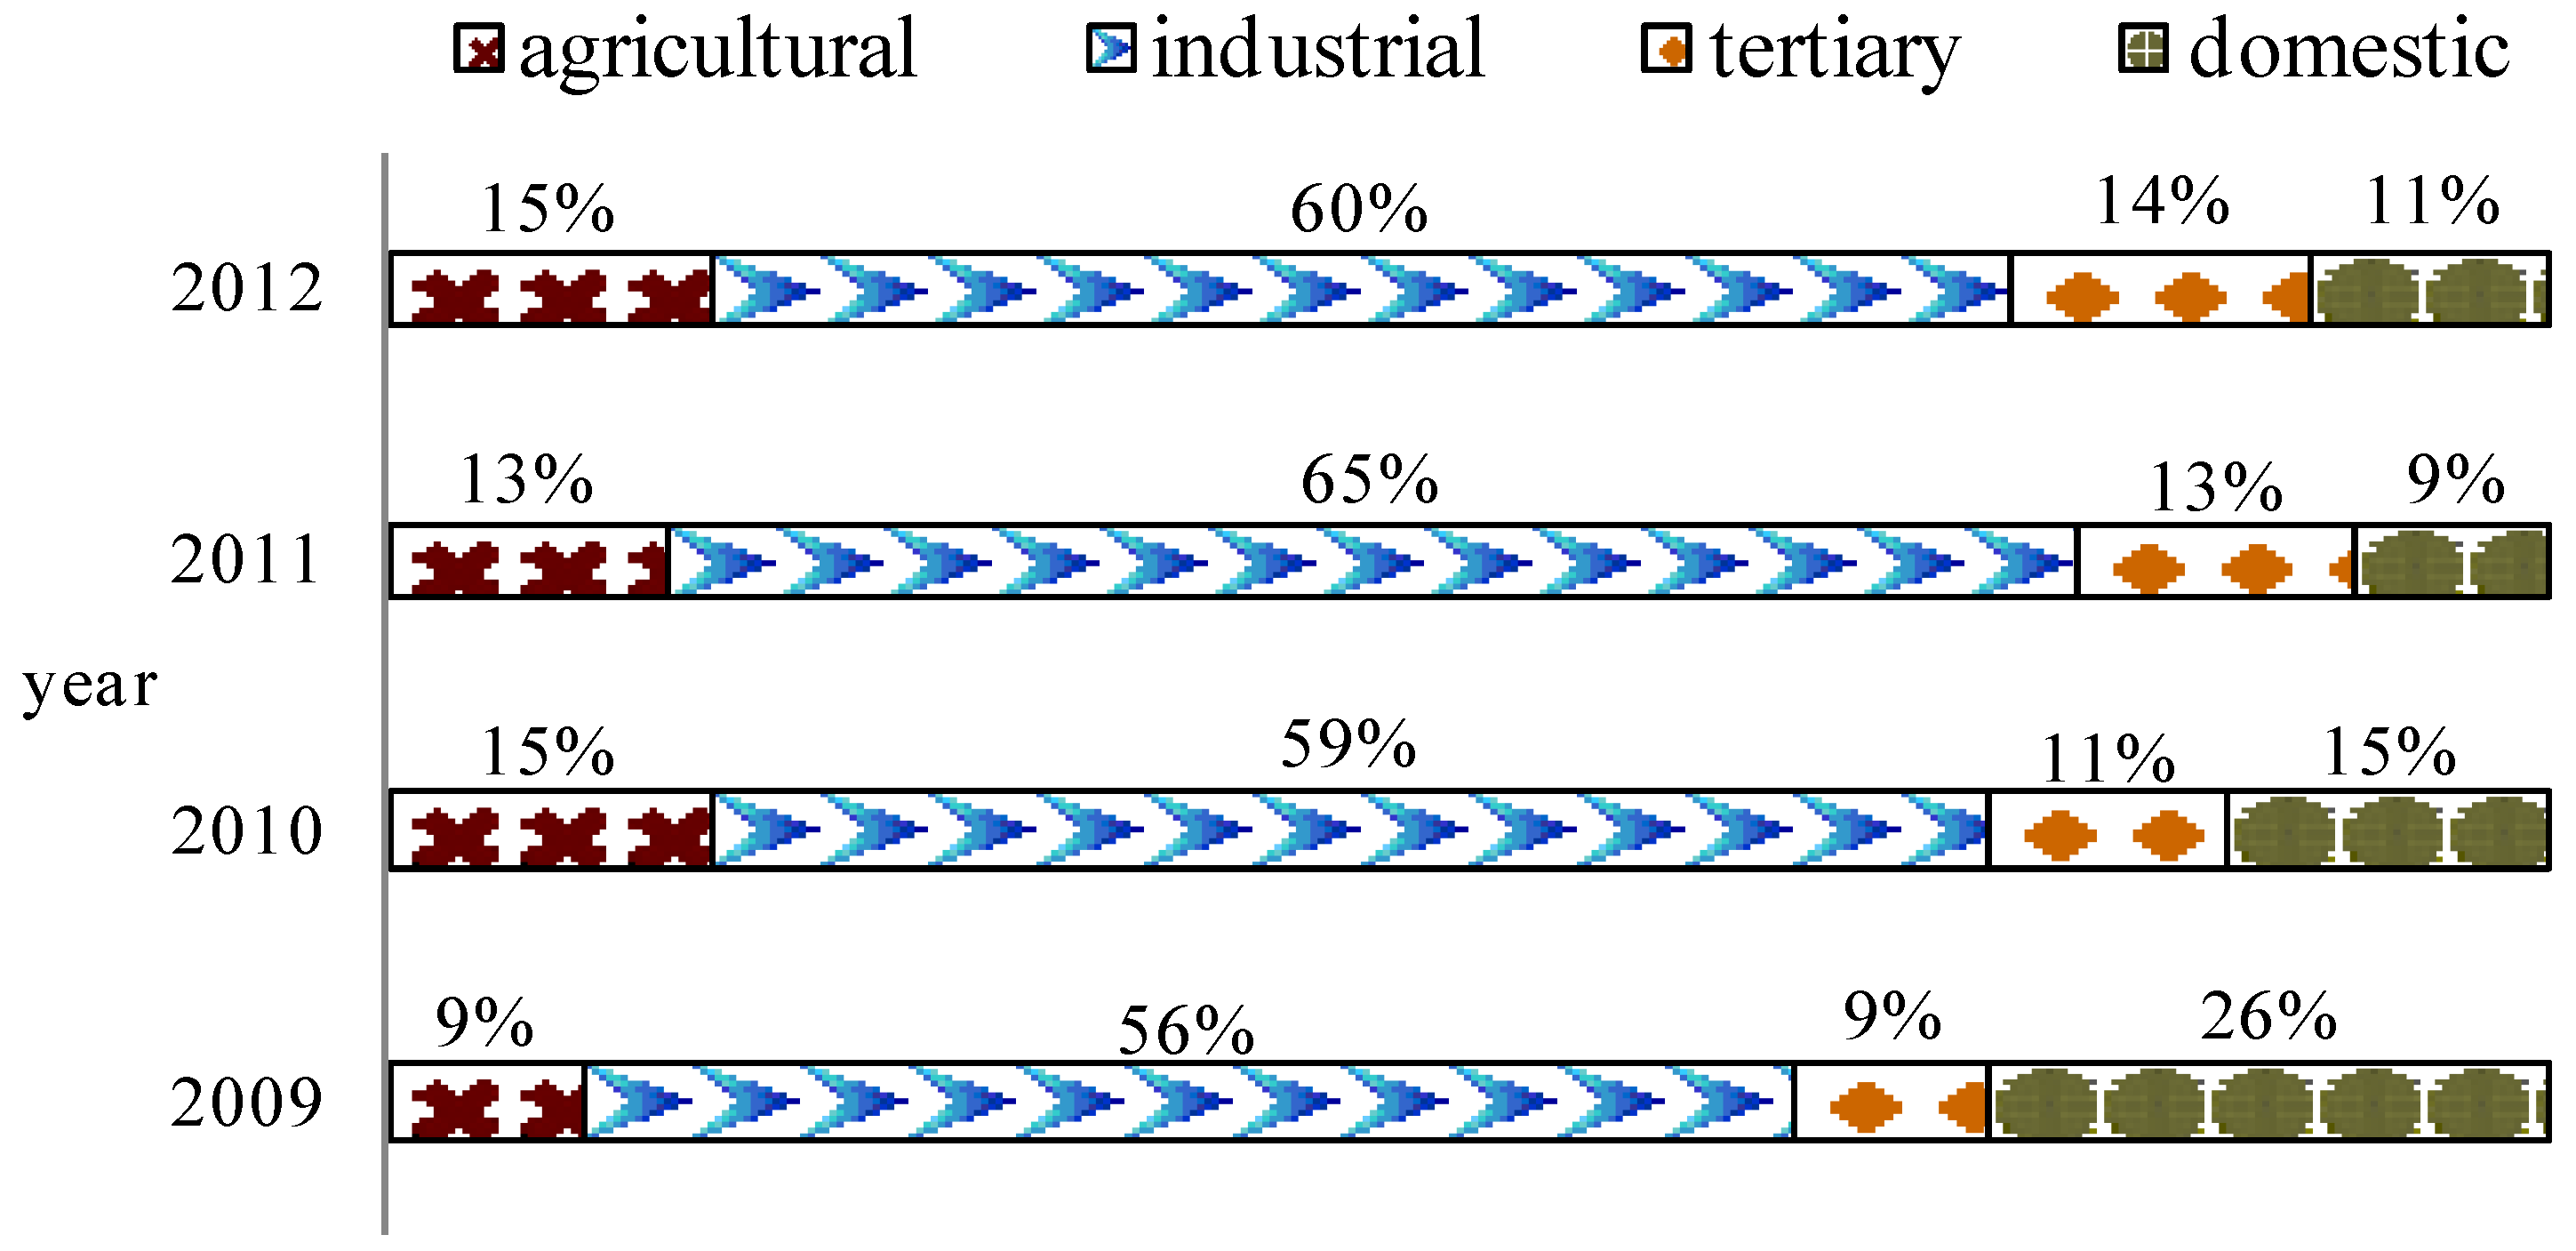
Over recent years, the diffusion of PV system has also involved Italian farms through the installation of ground-mounted or building-mounted PV plants. According to available data [
66,
67,
68,
69], from 2009 to 2012 the PV capacity relative to the agricultural sector has experienced little fluctuation in percentage terms (
Figure 1).
Figure 1.
PV systems capacity according to activity segment.
Figure 1.
PV systems capacity according to activity segment.
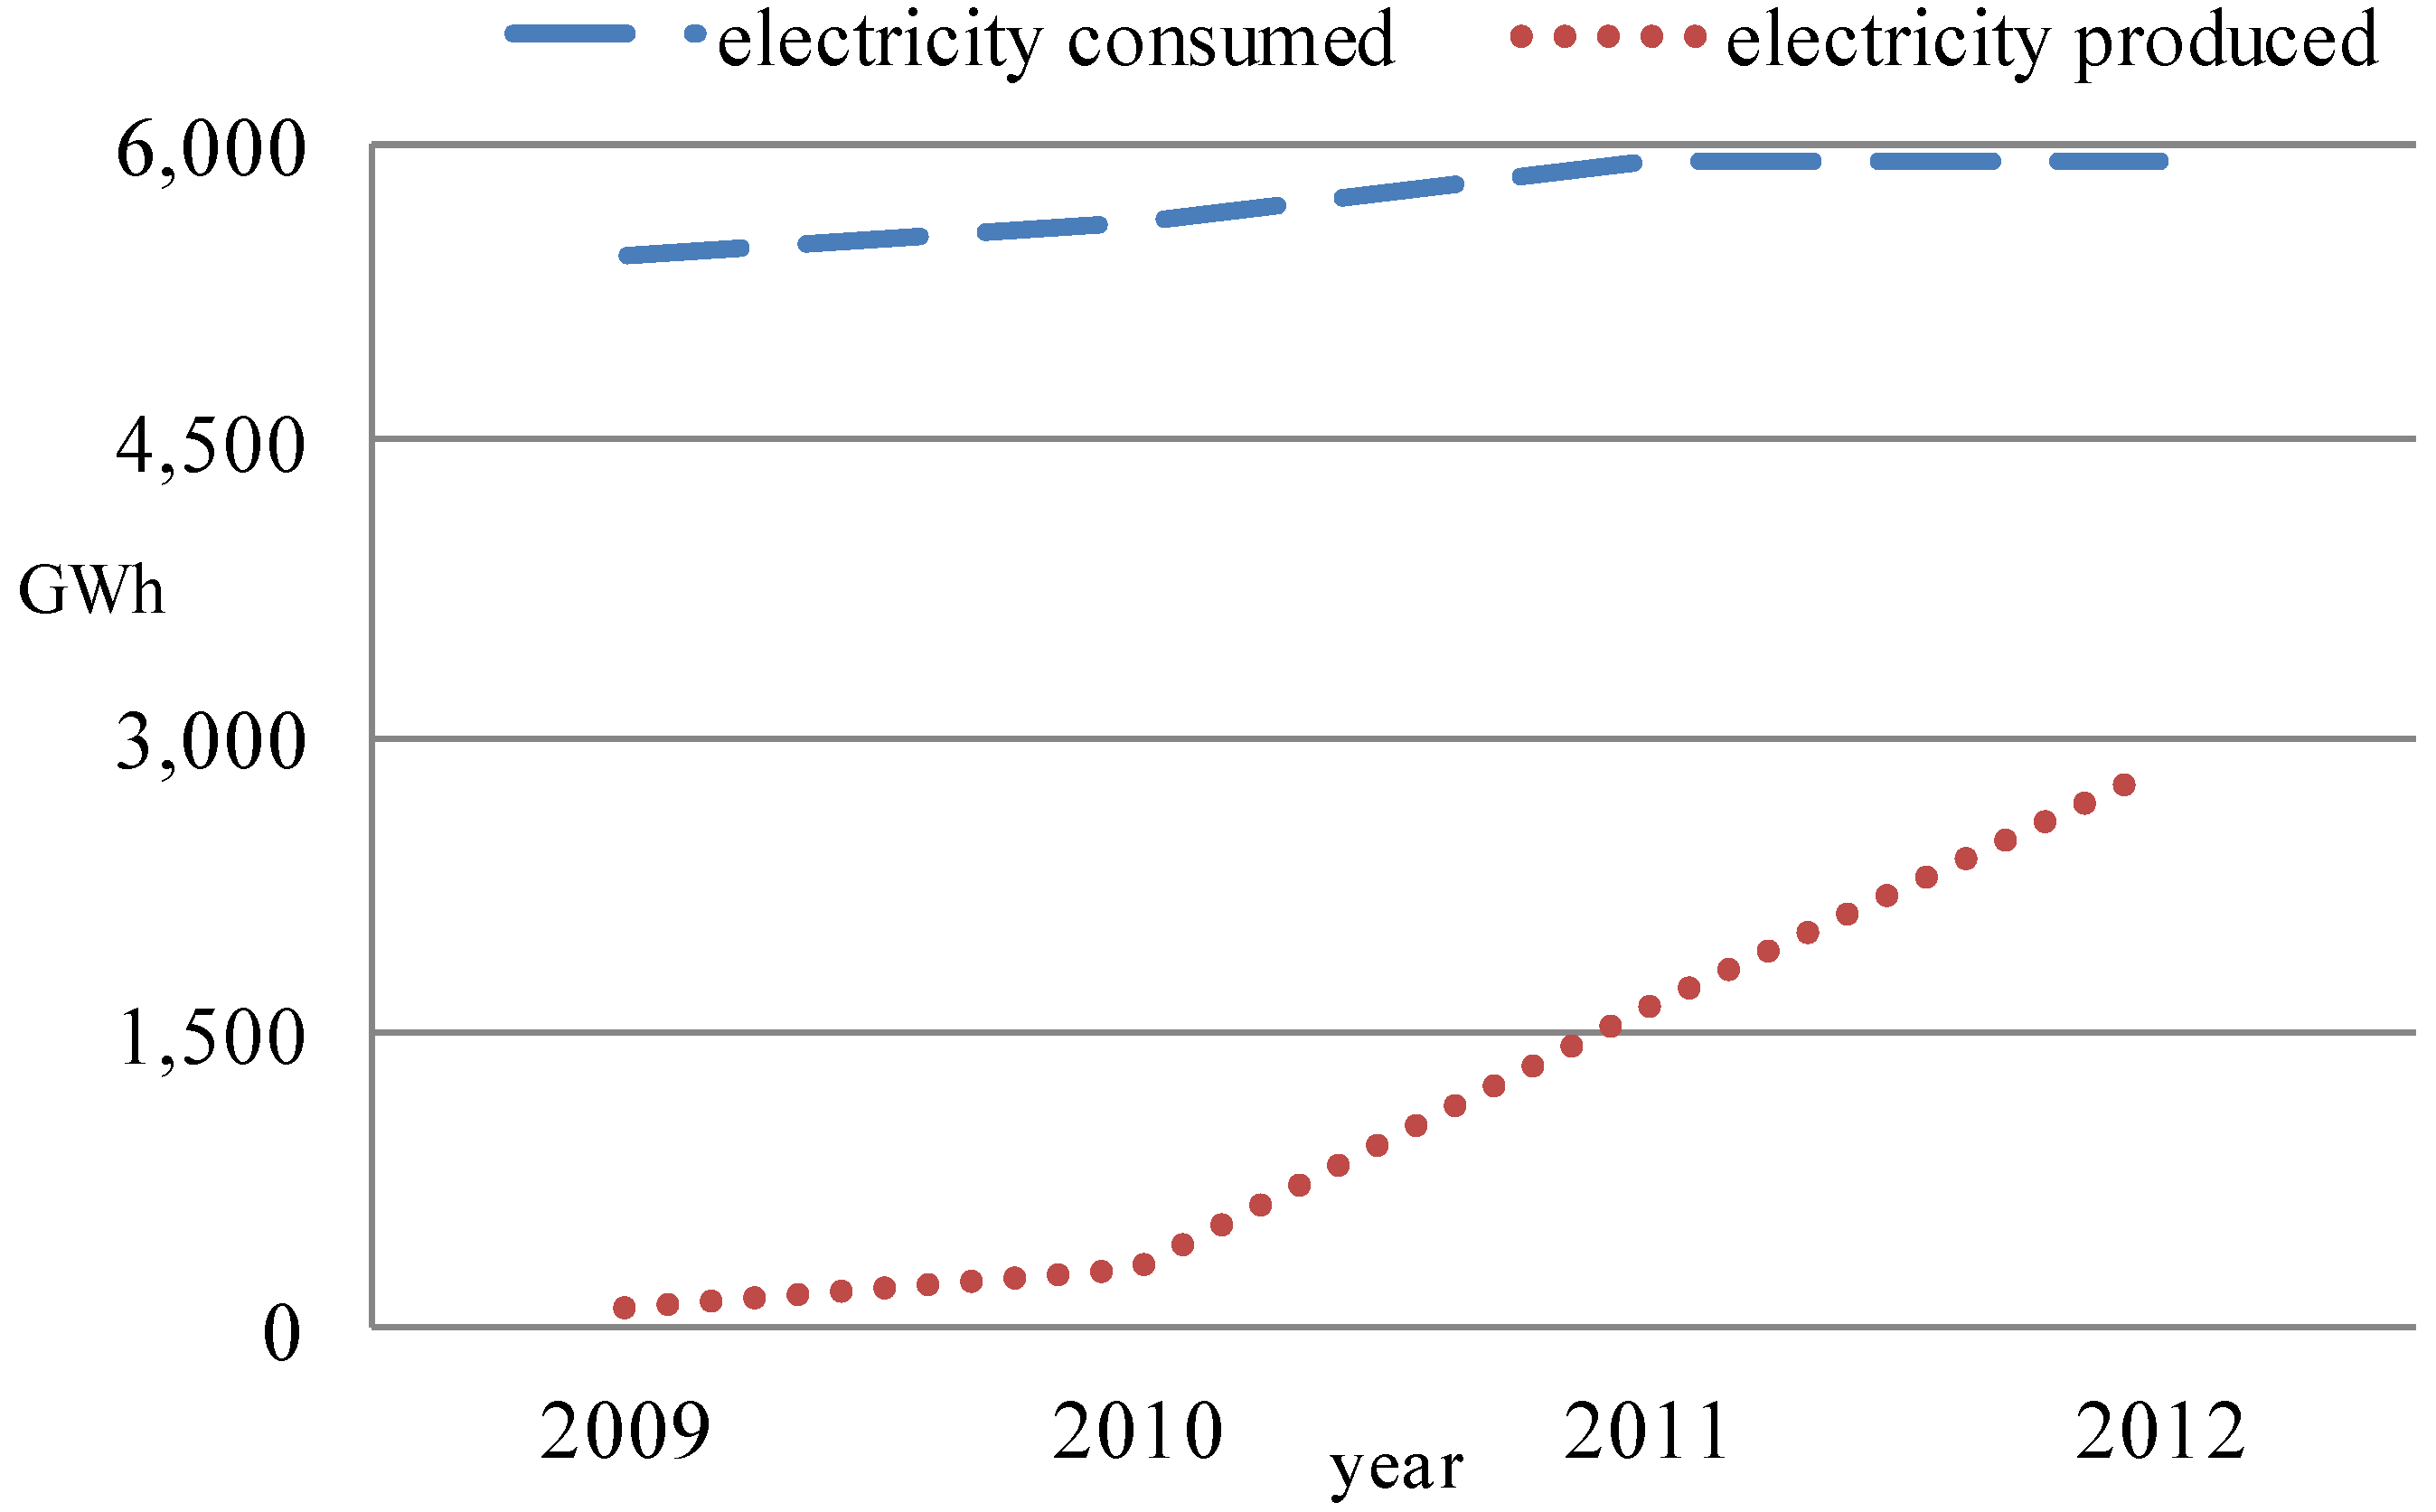
However, in the same period, PV capacity has increased from 103 to 2463 MW. Consequently, a growth in the electricity generated by farms has been observed and, at the end of 2012, it amounted to approximately 50% of the total electricity consumption on behalf of the primary sector (
Figure 2) [
70].
Figure 2.
Primary sector electricity consumption and production on farms via PV systems.
Figure 2.
Primary sector electricity consumption and production on farms via PV systems.
The diffusion of PV systems in farms could also continue in following years; in fact, it has been estimated that by utilizing a mere 10% of building rooftops located in arable land, 1 GWh of additional electricity production could be obtained [
71]. Hence, complete electrical self-sufficiency of the primary sector does not seem unfeasible in the short-medium term.
This remarkable potential should be used by farms, also allowing them to benefit from a new environment-friendly image of their own agricultural activities, in full compliance with the objectives of environmental and landscape balance [
72]. In fact, it is appropriate that the diffusion of PV systems is accompanied by the adoption of specific rules and regulations to define their integration into the landscape [
73].
The great debate, that involved Italian PV systems in farms, concerned the occupation of land by ground-mounted PV systems, in that they subtract areas from the cultivation of agricultural products. Ultimately, the legislators banned national incentives granted by the feed in-scheme to PV systems installed on agricultural soil [
74]. Agricultural areas, destined to ground-mounted PV plants, are estimated at 13,370 hectares (ha), equal to 0.1% of Italian agricultural surface area [
75]. Since daily losses of agricultural soil due to overbuilding have been estimated at 100 ha [
76], it seems incomprehensible that a similar ban has not been adopted for the residential sector as well.
Among the different PV applications, greenhouses are a suitable solution for installing PV systems, because they represent one of the most energy-intensive sectors in agriculture [
77]. However, available and ongoing research relative to solar greenhouse design should be implemented, developing more transparent solar panels and selecting plants better adapted to this particular production system [
78]. In this context, with regard to the greenhouse effect, photovoltaic films have been proven to have the same efficiency as traditional ones [
79]. According to available data [
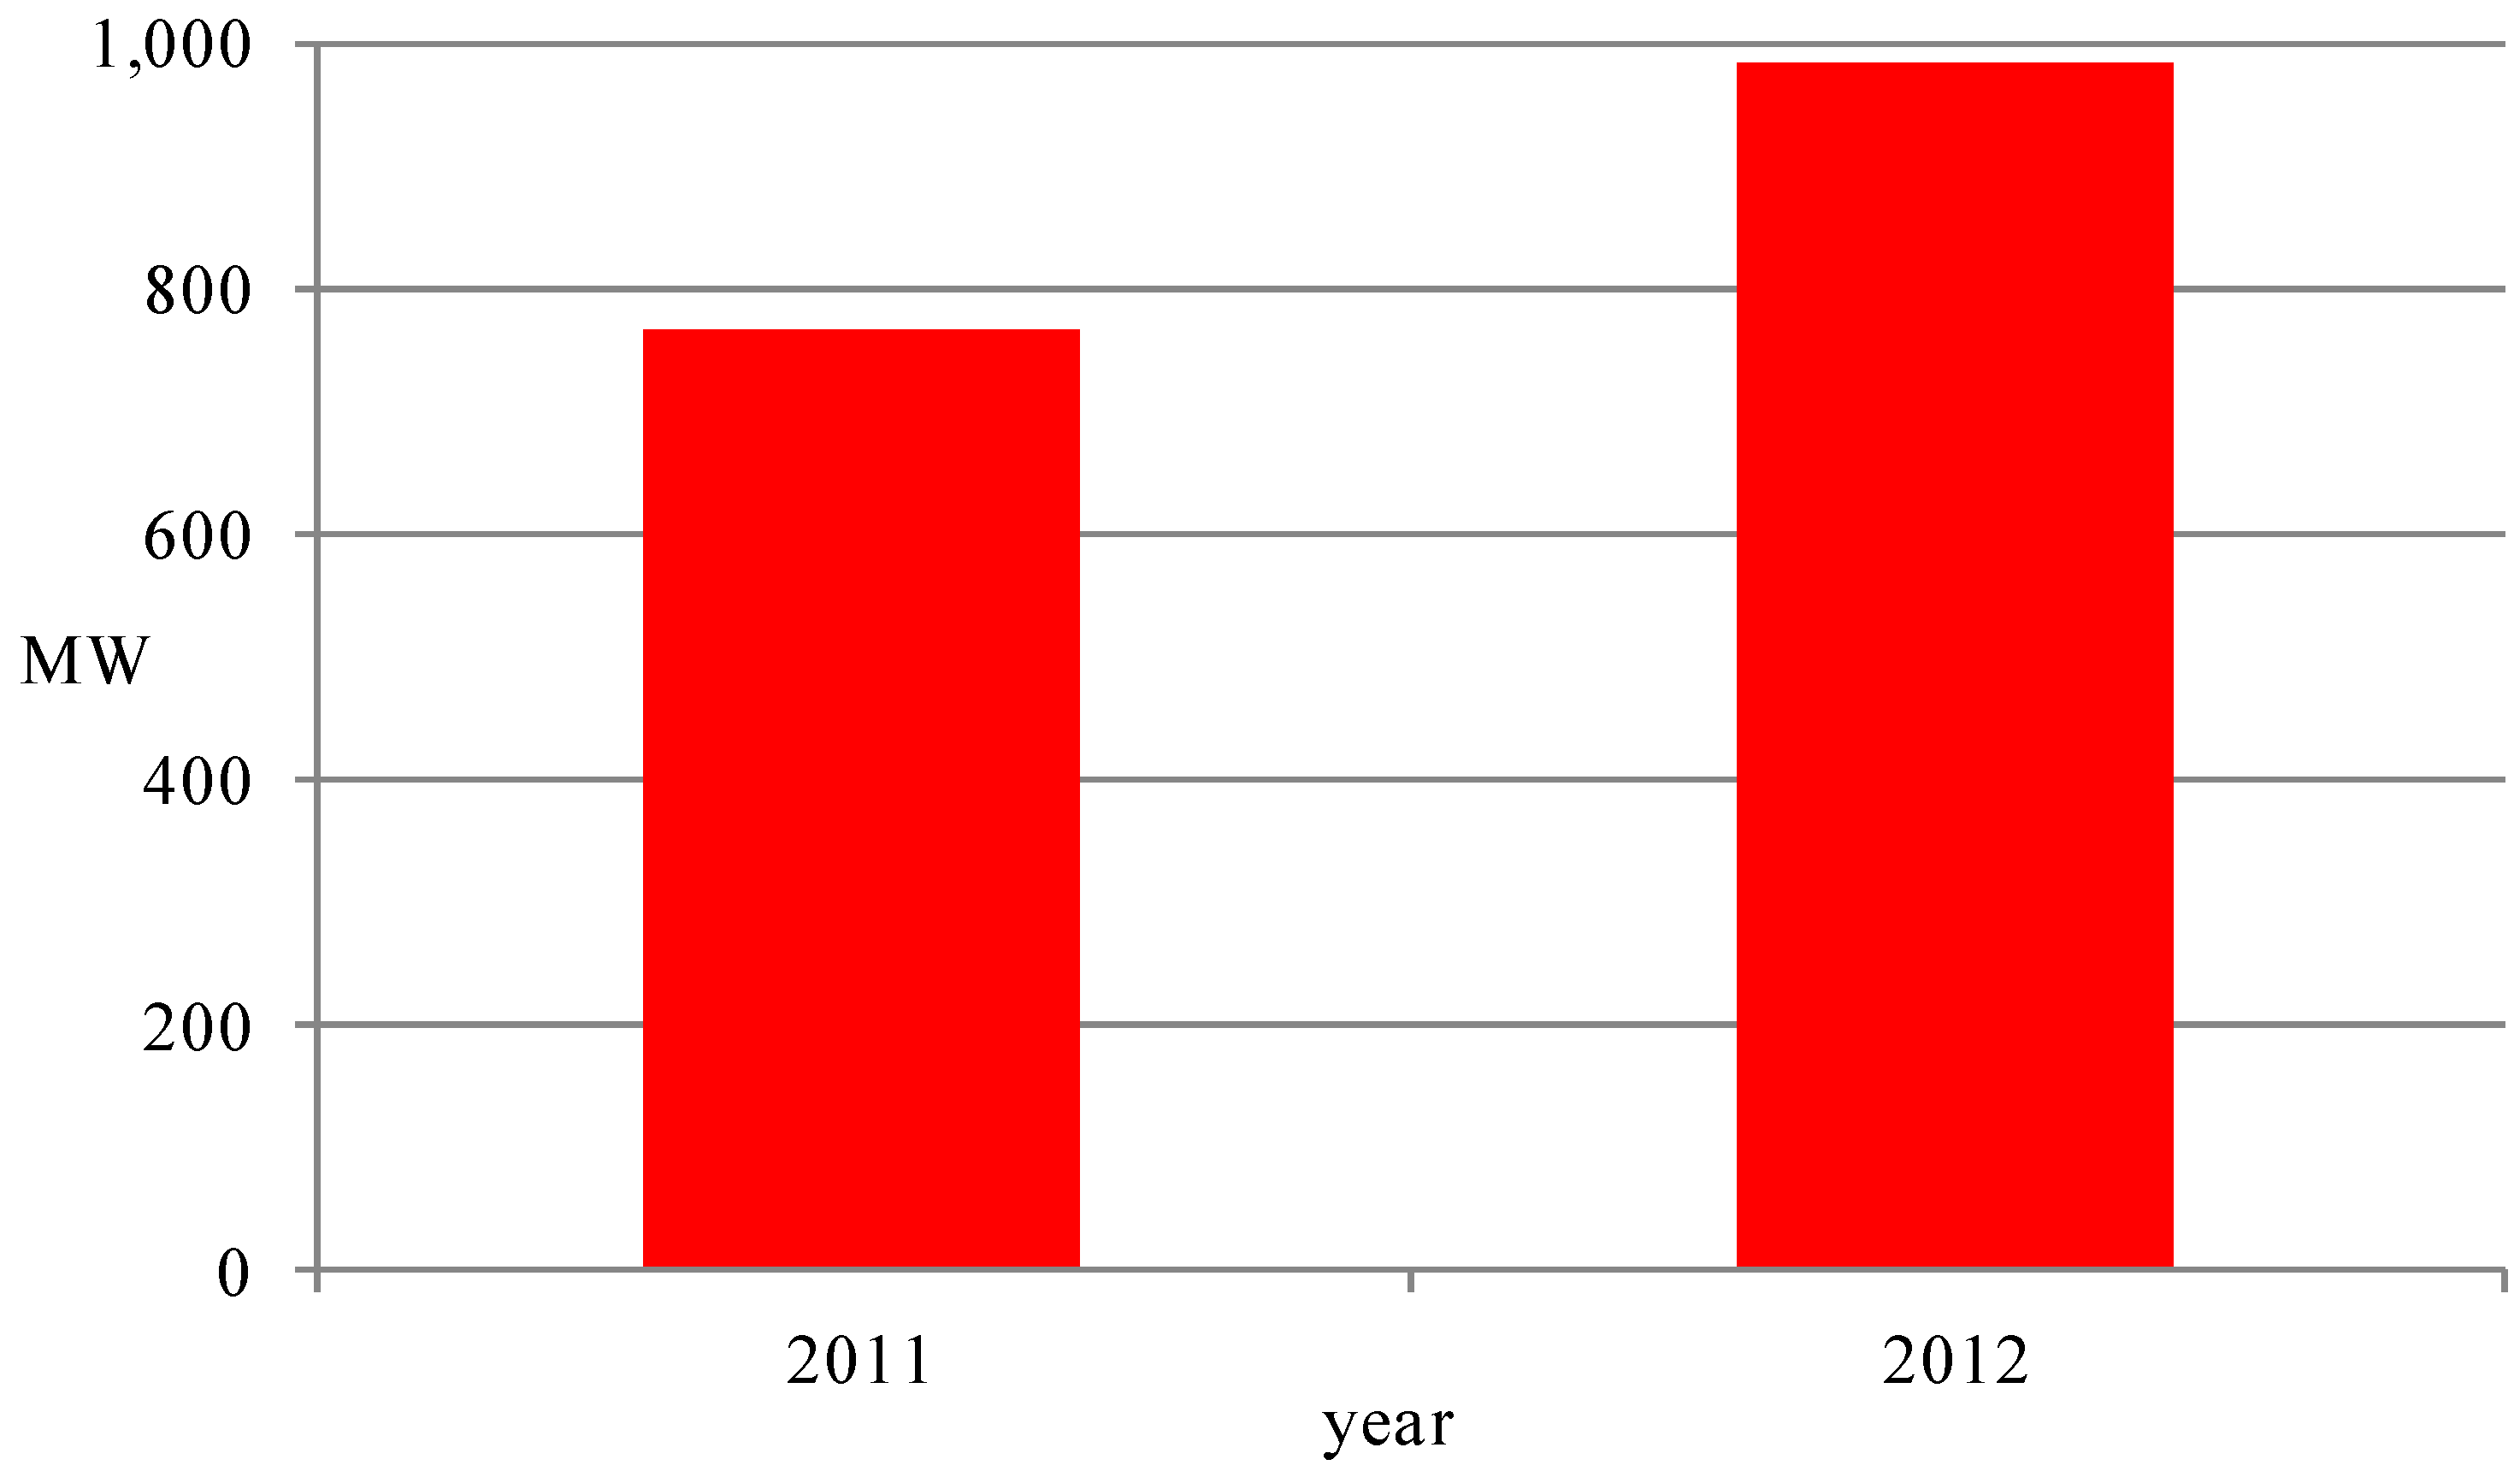
66,
67], at the end of 2012 PV systems on greenhouses and roofs/covers (separate data are unavailable) accounted for a capacity of 985 MW, with an increase of 29% as compared to 2011 (
Figure 3).
Figure 3.
Capacity of PV systems on greenhouses and roofs/covers.
Figure 3.
Capacity of PV systems on greenhouses and roofs/covers.
3. Case Study and Methodology
Economic and cost analyses have involved five different PV systems installed on greenhouses located on the southern coast of Sicily that we refer to as cases A, B, C, D and E. The investigated PV systems had a capacity of 10, 20, 30, 40 and 50 kW, respectively. This selection of capacities allows to cover the potential spectrum of annual electricity requirements for managing solar greenhouses located in the Mediterranean area, which ranges from 10,000 to 70,000 kWh/ha [
24].
PV electricity is consumed on the farm for its own energy requirements, so according to net metering, we assumed that the excess energy, not instantly consumed, is injected into the public net and withdrawn at no cost at a later time, when farm electricity requirements exceed production by PV panels.
All PV investments were financed in a measure of 25% by own capital and for 75% by accessing bank loans for a depreciation period of 15 years and an annual interest rate varying between 4% and 5%, as a function of the financial resources required.
3.1. PV Electricity Cost Production Analysis
LCOE, whose value is constant over the entire lifetime of the system studied, is the most frequently used method for comparing electricity generation technologies [
53]. It allows cost comparisons, in current monetary units, of a kWh of electricity generated by PV systems with other sources of electricity [
16]. Therefore, LCOE is calculated by dividing the cumulative PV system costs by the energy produced over its lifetime, as shown in the following equation [
80]:
where
Kt represents annual costs,
d is the nominal discount rate,
n corresponds to the PV system lifetime,
t is the year considered,
Epv represents the annual PV electricity yield and
fEpv is the annual degradation factor of the power of the PV system.
With regard to d, a value equal to the weighted average cost of capital (WACC) was chosen. The WACC is the rate that a company is expected to pay, on average, to all its security holders to finance its assets. The WACC is the minimum return that a company must earn on an existing asset base to satisfy its creditors, owners, and other providers of capital, or they will invest elsewhere.
The PV annual costs include:
where
Cpv is the PV system total cost,
Com represents the annual operation and maintenance cost and ε
om is the annual escalation rate of the operation and maintenance cost. Thus, in order to bring the costs up to date, how faster or slower the energy price varies in proportion to the PV system costs was taken into consideration.
Considering that all the PV investments were financed in part by own capital (25% of the plant cost), but also through bank loans (covering the remaining 75%) for a depreciation period of 15 years,
Cpv can be written as follows:
where
Coc corresponds to the plant cost financed with own capital and
Qb represents the quota relative to the bank loan. So according to Equation (3),
Kt can be expressed as follows:
3.2. Profitability Analysis
In order to evaluate the profitability of PV systems on greenhouses a cost-benefit analysis (CBA) was carried out for each of the five case studies.
CBA is a financial technique used to predict if an investor can benefit from a specific investment [
81,
82]. CBA allows the farmer to make predictions concerning potential benefit regarding an investment [
83,
84], but it also represents an ex-ante evaluation method for third parties [
85].
In particular, in this paper the most common profitability indices have been calculated: the Net Present Value (NPV), the Internal Rate of Return (IRR) and the Discounted Payback Time (DPBT).
These financial indicators are derived from annual cash flows, obtained from the difference between the annual revenues and costs generated during the lifetime of the investment, in order to quantify the economic convenience of the PV systems analyzed [
86]. The NPV corresponds to the sum of the discounted cash flows, according to the following formula:
where
Rt corresponds to annual revenues. In fact, since through net metering all the electricity generated is consumed so as to satisfy the farm’s own energy requirements, annual revenues correspond to the savings on electrical energy expenses, so
Rt can be written as follows:
where
PEpv is the market retail electricity price and ε
p is the increase in annual rate of unitary electricity price, above inflation. According to this financial indicator, investments with the highest NPV value will be more convenient than others [
87]. However, this financial indicator proves unsuitable for choosing between two projects with the same NPV, but different initial cost requirements and lifetimes [
88].
The IRR has been calculated by rearranging Equation (5), using the following formula:
In fact, IRR corresponds to the discount rate (
d) that satisfies Equation (7) and it corresponds to the interest rate on the initial investment during its lifetime that would achieve the same profitability [
89]. According to IRR, one investment is more attractive than another if the IRR of former investment is higher than that of the latter feasible alternative, where the discount rates are risk-adjusted to make them comparable [
90].
Finally, the DPBT represents the number of years required so that the cumulative discounted cash flow equates to the initial cost of the PV system. In other words, the DPBT can be interpreted as the time needed for the investment to pay for itself [
91].
3.3. Sensitivity Analysis
With the aim of making this work more complete, a sensitivity analysis was carried out, in line with similar studies [
18,
26,
92,
93,
94]. In this way, we hope to gauge the effect of potential changes in market conditions so as to compare this to other works in self-consumption scenarios characterized by different solar radiation levels or system prices.
Our sensitivity analysis took into consideration both electricity production cost and profitability analysis by varying the main parameters that affect the above equations: PV system cost and electricity production. Therefore, using the real cases as the starting points we studied modifications in LCOE, NPV, IRR and DPBT as a function of the variations of our target parameters.
Practically, in the sensitivity analysis four different scenarios were foreseen for PV system costs and electricity production: plus or minus 10% and plus or minus 20%. Moreover, we investigated which parameter variation, among those mentioned above, had a greater influence on the indicators studied.
3.4. Parameters Utilized
All parameters affecting the above equations are shown in
Table 2.
The PV total cost (
Cpv) of the cases studied ranged from 22,000 € (Case A) to 95,000 € (Case B). Slight decreases of PV unitary prices were found with increasing PV installed capacities, passing from 2200 (Case A) to 1900 (Case E) €/kW. The annual operation and maintenance cost (
Com) was assigned a value equal to 1.0% of the total system cost [
88,
90] and its annual escalation rate (ε
om) was equal to 2.7% [
95].
Table 2.
Parameters considered in electricity cost production and profitability analysis.
Table 2.
Parameters considered in electricity cost production and profitability analysis.
| Case | PV Power (kW) | Cpv (€) | Com (€/year) | εom (%) | Epv (kWh/kW/year) | fEpv (%) | PEpv (€/kWh) | εp (%) | d (%) | n (years) | Bank Loan |
|---|
| Depreciation Period (years) | Interest Rate (%) |
|---|
| A | 10 | 22,000 | 1.0% Cpv | 2.7 | 1,510 | 0.5 | 0.184 | 2.2 | 7.5 | 25 | 15 | 5.0 |
| B | 20 | 42,500 | 5.0 |
| C | 30 | 60,750 | 4.5 |
| D | 40 | 79,000 | 4.0 |
| E | 50 | 95,000 | 4.0 |
Regarding PV energy production (
Epv), the electricity generated was estimated consulting the Photovoltaic Geographical Information System (PVGIS) database, provided by the Joint Research Institute of the European Commission [
96,
97]. In order to estimate the electricity production, building-mounted PV systems and multicrystalline silicon panels, with an inclination of 33° and an orientation of 0°, were considered. According to geographic location of plants, the PVGIS database calculated combined PV system losses of 28.9% (due to temperature, irradiance, cables, inverter,
etc.). Consequently, PVGIS provided an annual average PV electricity production of 1510 kWh/kW for solar greenhouses located on the southern coast of Sicily. Moreover, a 0.5% annual degradation factor (
fEpv) for electricity production was considered, due to the efficiency losses of PV systems over the years [
53,
98].
Since, by net metering, all the generated electricity is self-consumed on the farm for its own energy requirements, the annual revenues correspond to the savings on energy expenditures, considering a market retail electricity price (
PEpv) of 0.184 €/kWh and an increase in annual rate of unitary electricity price (ε
p) equal to 2.2% [
95,
99]. The discount rate (
d) corresponds to the WACC that is the cost paid by the owner of the PV system for using the available financial resources to finance the initial investment cost. The WACC varies according to how such resources are chosen for financing initial investment costs and, in our case, the WACC was assumed equal to 7.5%.
The serviceable life (
n) of PV systems was considered equal to 25 years [
100,
101,
102]. The sums paid for the PV investment were assumed to be mixed financed; in fact, 25% of
Cpv was own capital while the remaining loan capital was borrowed at a depreciation period equal to 15 years at an annual interest rate varying from 5.0% (Case A) to 4.0% (Case E).
4. Results
4.1. LCOE, NPV, IRR and DPBT
Our results for electricity production cost and profitability analysis are shown in
Table 3.
Table 3.
LCOE, NPV, IRR and DPBT of each case study.
Table 3.
LCOE, NPV, IRR and DPBT of each case study.
| Case | LCOE (€/kWh) | NPV (€) | IRR (%) | DPBT (Years) |
|---|
| A | 0.140 | 20,389 | 25.72 | 4.5 |
| B | 0.136 | 42,455 | 27.44 | 4.0 |
| C | 0.128 | 67,643 | 30.14 | 3.5 |
| D | 0.121 | 95,298 | 33.04 | 3.5 |
| E | 0.116 | 123,138 | 35.30 | 3.0 |
The LCOE values ranged from 0.116 (case E) to 0.140 (case A) €/kWh, thus previous reports for Italian grid parity are confirmed for PV plants with a capacity of 50 kW [
17]. For the other cases studied, we predicted that expected cost reductions for PV systems would make electricity production from PV panels more competitive than from other sources, thus allowing them to also achieve grid parity [
103]. Moreover, new PV technical solutions, aimed at increasing electrical yield, could decrease LCOE value relative to PV systems [
104,
105,
106]. The results of profitability analysis denoted a high convenience for PV investments, due to net metering that allowed huge savings on energy expenditures. In fact, VAN values were always positives, IRR ranged from 25.72% (Case A) to 35.30% (Case E) and DPBT ranged from 3.0 (Case E) to 4.5 (Case A) years. Thus, in general we observed more favorable financial indicators with increasing PV system capacities.
4.2. Sensitivity Analysis
The sensitivity analysis was carried out with the aim of comparing this work to other self-consumption scenarios, characterized by different solar radiation levels or PV system costs. Our results are shown in
Table 4,
Table 5,
Table 6 and
Table 7.
Table 4.
+10% and +20% variation of PV system cost (Cpv).
Table 4.
+10% and +20% variation of PV system cost (Cpv).
| Case | +10% PV System Cost | +20% PV System Cost |
|---|
| LCOE (€/kWh) | NPV (€) | IRR (%) | DPBT (Years) | LCOE (€/kWh) | NPV (€) | IRR (%) | DPBT (Years) |
|---|
| A | 0.154 | 17,931 | 21.39 | 5.5 | 0.168 | 15,473 | 17.94 | 7.5 |
| B | 0.149 | 37,706 | 22.90 | 5.5 | 0.163 | 32,957 | 19.27 | 7.0 |
| C | 0.141 | 60,916 | 25.31 | 4.5 | 0.154 | 54,189 | 21.43 | 5.5 |
| D | 0.133 | 86,839 | 27.92 | 4.0 | 0.145 | 78,380 | 23.78 | 5.0 |
| E | 0.128 | 112,966 | 29.92 | 3.5 | 0.139 | 102,793 | 25.56 | 4.5 |
Table 5.
−10% and −20% variation of PV system cost (Cpv).
Table 5.
−10% and −20% variation of PV system cost (Cpv).
| Case | −10% PV System Cost | −20% PV System Cost |
|---|
| LCOE (€/kWh) | NPV (€) | IRR (%) | DPBT (Years) | LCOE (€/kWh) | NPV (€) | IRR (%) | DPBT (Years) |
|---|
| A | 0.126 | 22,848 | 31.22 | 3.5 | 0.112 | 25,306 | 38.35 | 3.0 |
| B | 0.122 | 47,204 | 33.21 | 3.5 | 0.108 | 51,953 | 40.66 | 2.5 |
| C | 0.115 | 74,370 | 36.24 | 3.0 | 0.102 | 81,097 | 44.05 | 2.5 |
| D | 0.109 | 103,757 | 39.46 | 3.0 | 0.097 | 112,216 | 47.64 | 2.5 |
| E | 0.105 | 133,310 | 42.03 | 2.5 | 0.093 | 143,482 | 50.57 | 2.0 |
Table 6.
+10% and +20% variation of PV electricity production (Epv).
Table 6.
+10% and +20% variation of PV electricity production (Epv).
| Case | +10% PV Electricity Production | +20% PV Electricity Production |
|---|
| LCOE (€/kWh) | NPV (€) | IRR (%) | DPBT (Years) | LCOE (€/kWh) | NPV (€) | IRR (%) | DPBT (Years) |
|---|
| A | 0.128 | 24,887 | 30.66 | 4.5 | 0.117 | 29,384 | 35.76 | 3.0 |
| B | 0.123 | 51,449 | 32.63 | 3.5 | 0.113 | 60,444 | 37.96 | 3.0 |
| C | 0.116 | 81,134 | 35.62 | 3.0 | 0.107 | 94,626 | 41.22 | 2.5 |
| D | 0.110 | 113,286 | 38.81 | 3.0 | 0.101 | 131,275 | 44.68 | 2.5 |
| E | 0.106 | 145,623 | 41.35 | 2.5 | 0.097 | 168,109 | 47.48 | 2.5 |
Table 7.
−10% and −20% variation of PV electricity production (Epv).
Table 7.
−10% and −20% variation of PV electricity production (Epv).
| Case | −10% PV Electricity Production | −20% PV Electricity Production |
|---|
| LCOE (€/kWh) | NPV (€) | IRR (%) | DPBT (Years) | LCOE (€/kWh) | NPV (€) | IRR (%) | DPBT (Years) |
|---|
| A | 0.156 | 15,892 | 20.97 | 6.0 | 0.175 | 11,395 | 16.47 | 8.0 |
| B | 0.151 | 33,461 | 22.45 | 5.5 | 0.169 | 24,466 | 17.72 | 7.5 |
| C | 0.142 | 54,151 | 24.84 | 4.5 | 0.160 | 40,660 | 19.78 | 6.5 |
| D | 0.134 | 77,309 | 27.42 | 4.5 | 0.151 | 59,321 | 22.01 | 5.5 |
| E | 0.129 | 100,652 | 29.39 | 4.0 | 0.145 | 78,166 | 23.69 | 5.0 |
With regard to LCOE, the best scenario was case E with −20% Cpv (0.093 €/kWh), while the worst was case A with −20% Epv (0.175 €/kWh). Thus, sensitivity analysis highlighted that the expected PV cost reductions and the likely increases in PV electricity yield, due to technological improvements, could play a key role in reaching grid parity.
Considering NPV, we observed that values are always positives, even in negative scenarios (i.e., with increases in PV costs and decreases in electricity production).
Similarly, according to IRR, PV investments proved to be convenient. In fact, IRR values exceeded those of WACC in each case scenario hypothesized, reaching a peak value for case E with +20% Cpv (50.57%) and a minimum for case A with −20% Epv (16.47%).
The time required for the cumulative discounted cash flow to equate the PV initial costs did not exceed 8.0 years in the less favorable scenario (case A with +20% Epv), while the best DPBT value was equal to 2.0 years (case E with −20% Cpv).
In order to better understand how the considered parameters affected LCOE, NPV, IRR and DPBT, the average effect of a 10% variation in cost and production of electricity by the PV system was calculated. In
Table 8 and
Table 9, minimum, maximum and average variations of measured indicators are shown for a 10% variation of
Cpv and
Epv.
Table 8.
Average effect of a 10% variation of considered parameter on LCOE and NPV.
Table 8.
Average effect of a 10% variation of considered parameter on LCOE and NPV.
| Parameter | LCOE (€/kWh) | NPV (€) |
|---|
| Variation Range | Average Variation | Variation Range | Average Variation |
|---|
| from | to | from | to |
|---|
| PV cost (Cpv) | −0.014 | +0.014 | |0.013| | −10,172 | +10,172 | |6,513| |
| electricity production (Epv) | −0.009 | +0.019 | |0.013| | −22,486 | +22,486 | |13,491| |
Table 9.
Average effect of a 10% variation of considered parameter on IRR and DPBT.
Table 9.
Average effect of a 10% variation of considered parameter on IRR and DPBT.
| Parameter | IRR (Percentage Points) | DPBT (Years) |
|---|
| Variation Range | Average Variation | Variation Range | Average Variation |
|---|
| from | to | from | to |
|---|
| PV Cost (Cpv) | −5.38 | +8.55 | |5.66| | −1.0 | +2.0 | |1.0| |
| Electricity Production (Epv) | −5.91 | +6.13 | |5.37| | −1.5 | +2.0 | |1.0| |
Our data elaborations showed that a 10% variation of PV costs or electricity production caused identical absolute variations in LCOE (0.013 €/kWh) and DPBT (1.0 year).
It should be highlighted that a 10% reduction of PV costs, considering all cases, entailed an average increase of LCOE of 10.0%. Vice versa, a 10% increase in electricity production produced an average increase of LCOE of 8.3%, so in positive scenarios, LCOE resulted more sensitive to variations of PV costs than to electricity yield. IRR was slightly more influenced by PV cost variations (5.66 percentage points) as compared to electricity production (5.37). Considering NPV, a 10% variation of electricity production entailed a much more pronounced average variation (13,491 €) respect to PV costs (6513 €). Therefore ultimately, sensitivity analysis highlighted that PV costs and electricity production affected LCOE and the DPBT formula in the same way, however the IRR equation was slightly more influenced by variation of PV costs whereas the NPV value was strongly affected by PV yield.
5. Conclusions
Over the years Italian energy policies have granted very convenient tariffs, aimed at remunerating electricity production by PV systems that supported the growth of the Italian PV sector. After this Italian feed-in scheme ceased, it became necessary to evaluate the feasibility of unsubsidized PV systems, in order to furnish updated indications about the current situation of the PV sector. In this paper, we have reported our results regarding PV electricity costs and profitability analysis of PV systems installed on greenhouses. Thus, considering the potential electricity consumptions of Mediterranean greenhouses, we focused on PV systems having capacities able to satisfy their own energy requirements. Moreover, thanks to net metering, we assumed that all generated electricity is self-consumed in order to account for savings on electricity expenditures.
Our results have shown that grid parity is already reached for plants with a capacity greater than 50 kW, while financial indicators such as NPV, IRR and DPBT denote a high convenience for the PV investments analyzed.
The sensitivity analysis highlighted that LCOE was very sensitive to variations of PV costs and electricity production, the IRR equation was slightly more influenced by variations of PV costs while NPV values were strongly affected by PV yield. Therefore, expected reductions of PV system costs in future years, along with continuous technical advances, aimed at increasing yield, will play a key role in the coming development of the PV sector, boosting its competitiveness. Moreover, rising electrical tariffs will improve the profitability of PV systems, especially if net metering, which allows self-consumption of the electricity produced, continues over the years.

