Article

An Insight into the Effect of Advanced Injection Strategies on Pollutant Emissions of a Heavy-Duty Diesel Engine

1
Department of Astronautics, Electrical and Energy Engineering, Sapienza University of Rome, via Eudossiana 18, Rome 00184, Italy
2
Department of Mechanical and Aerospace Engineering, Sapienza University of Rome, via Eudossiana 18, Rome 00184, Italy
*
Author to whom correspondence should be addressed.
Energies 2013, 6(9), 4331-4351; https://doi.org/10.3390/en6094331
Submission received: 11 July 2013 / Revised: 6 August 2013 / Accepted: 6 August 2013 / Published: 22 August 2013

Abstract

:
An advanced numerical investigation has been carried out in order to study the effect of multiple injection strategies on Caterpillar heavy-duty diesel engine emissions. Both different injected fuel percentages for each pulse and several dwells between main and post phase were investigated via computational fluid dynamics (CFD) and large eddy simulation (LES). Two sets of simulations were taken into account for 10% and 20% exhaust gas recirculation (EGR) fractions. In the first one, the main injection was split into two identical phases, while in the second one into three pulses. Within each set, three strategies were considered, increasing the amount of fuel injected during the main and concurrently decreasing the post pulse. Overall, 48 simulations were employed, since four different dwells between the last phase of the main and post injection were considered. Results show that the pollutant emissions minimization has been obtained for the Schemes injecting 65% and 70% of fuel for both two and three split strategies, but for different values of dwell. In fact, emissions very close to each other for NOx and particulate matter have been reached for these cases. Reductions of about −30% and −71% were respectively obtained for NOx and soot in comparison with experimental emissions related to the single injection case.

1. Introduction

Even if diesel engines produce lower partially burned hydrocarbons in comparison with gasoline engines, NOx and particulate matter are significant pollutants that require proper control strategies because of their impact on health and the environment [1]. To reduce this impact, research efforts can be focused on both the development of after-treatment devices and the study of in-cylinder combustion phenomena [2]. This latter aspect involves several physical quantities and operative parameters, as well as different combustion strategies: one of the most advances to simultaneously reduce NOx and soot emissions while maintaining fuel consumption and engine performance is multiple injection combustion [3]. Since both particulate matter and NOx are strongly dependent on temperature and equivalence ratio, their emission can be reduced by controlling the flame temperature and the mixture formation through an optimized injection law during the compression and power strokes [4]. Figure 1 shows the regions of formation for these two pollutant emissions within an equivalence ratio-temperature map: while NOx formation happens at high flame temperature and low equivalence ratio, soot occurs in region characterized by fuel rich mixtures and moderate temperature. Moreover, soot emission represents a balance between the formation and the oxidation of the particulate matter, so that its final concentration can be reduced both decreasing the rate of formation and raising the rate of oxidation [5]. Therefore, a compromise has to be usually reached if emissions have to be simultaneously minimized.
Figure 1. Diesel combustion field.
Energies 06 04331 g001
The benefits of multiple injections have been found to be highly dependent on the quantity of fuel associated to each pulse (pilot, main and post injection) and the dwell between them [6]. Moreover, the facility with which the fuel can be injected within the cylinder through the modern electronically controlled high pressure systems leads to the opportunity to further split the main injection into several pulses. The aim is that to lower the flame temperature and allow sufficient air and fuel mixing to increase homogeneity of charge, limiting the impact of diffusion combustion which leads to an increase of pollutant emission, especially of soot production [7].
The article starts with the introduction to the numerical model and its validation against experimental data related to the single injection case. Subsequently, an additional in-depth analysis about multiple injection strategies will be discussed: the effect on pollutant emissions of the fuel quantity associated to each pulse and the dwell between the main and post phase will be analyzed as well as the impact of the main injection splitting into two and three shorter pulses.

2. The Numerical Model

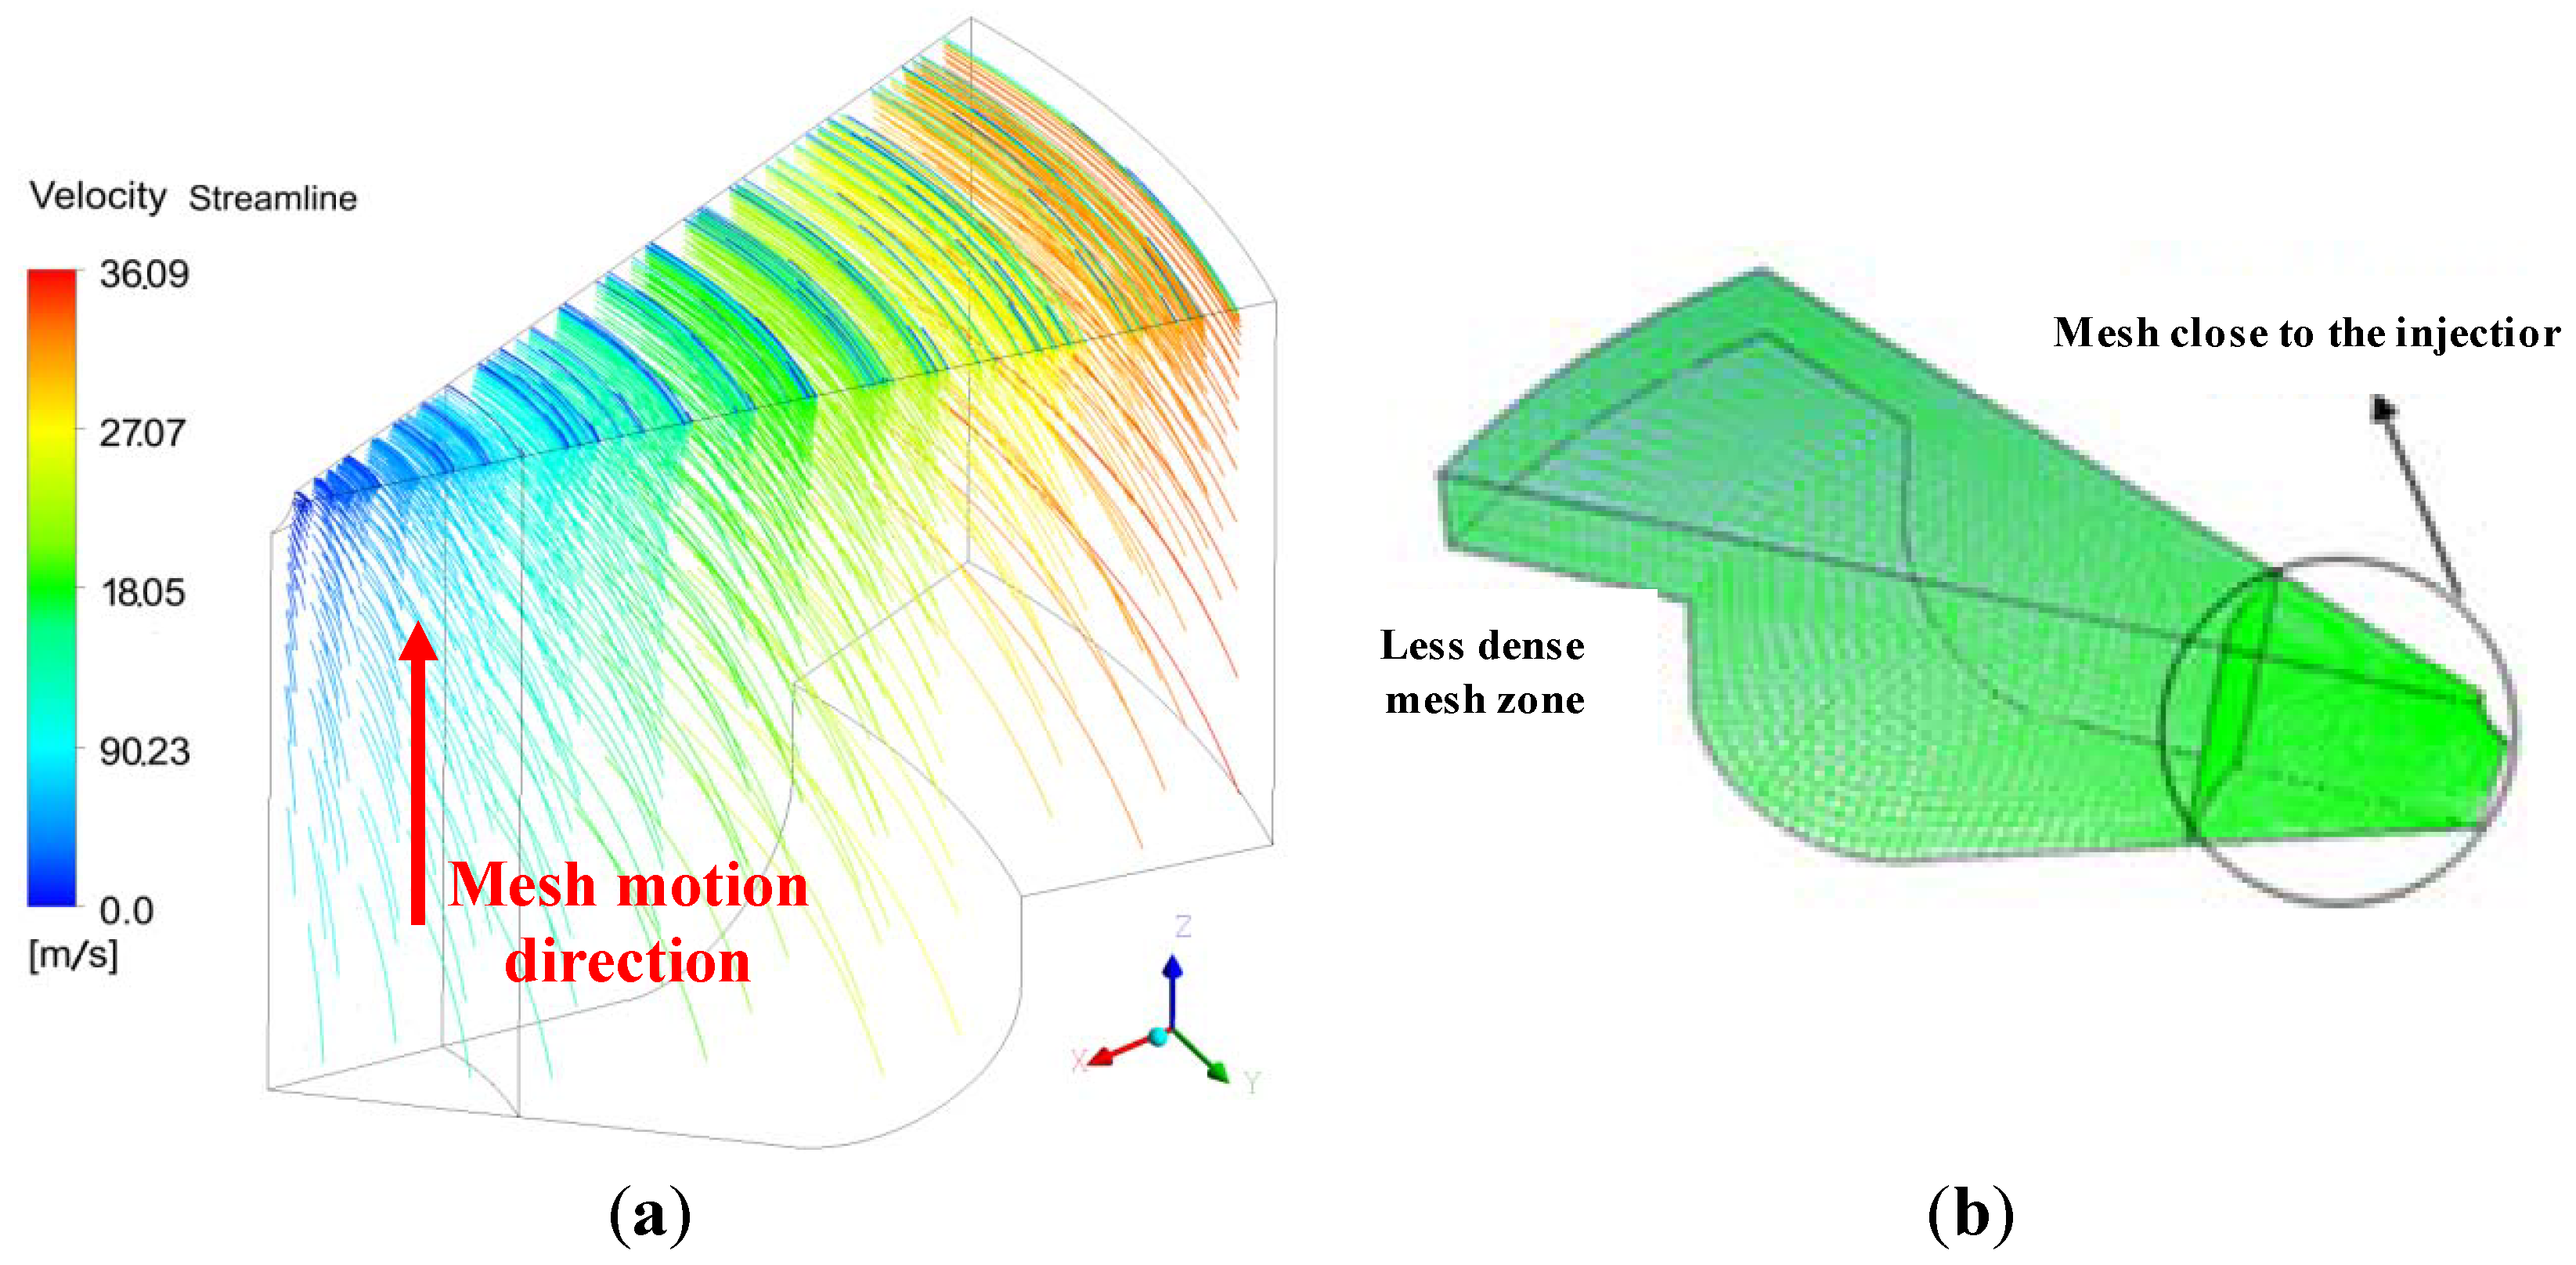
2.1. The Engine Specification and the Computing Mesh

The computational model has been built in Ansys Fluent with reference to a heavy-duty engine that is the single-cylinder version of the six-cylinder Caterpillar 3406 whose specifications are listed in Table 1. The simulations have involved only the compression and the power strokes for the crank angle range between the Intake Valve Closure (IVC) and the Exhaust Valve Opening (EVO). In fact, to characterize the engine performances in terms of pollutant emissions and specific fuel consumption, the attention can be focused only on in-cylinder flow and combustion phenomena. However, the flow field within the cylinder has been initialized through an User Defined Function (UDF) at the beginning of compression, in order to set the air swirl and squish motions (Figure 2a) and take into account the turbulent effect of the intake stroke [8,9].
Table 1. Engine specifications.
Engine typeUnitsCaterpillar 3406
Bore × Strokemm137.2 × 165.1
Compression ratio-15.1:1
Displacementl2.44
Connecting rod lengthmm261.62
Squish clearancemm4.16
IVO/IVC-−32° ATDC/−147° After top dead center (ATDC)
EVO/EVC-128° ATDC/29° ATDC
Intake manifold air pressure—IMAPkPa/rpm184/1600
Intake manifold air temperature—IMATK310
Engine speedrpm1600
Peak torqueNm/rpm1972/1200
Peak powerkW/rpm265/1700
Piston shape (Bowl in piston)-Mexican hat style
The fuel delivery system is an electronically controlled common rail that can ensure an injection pressure up to 120 MPa. The injector consists of six nozzles with a diameter of 260 µm. At full load, the total mass injected within the cylinder is 0.1622 g/cycle. Table 2 summarizes the operative parameters for the single injection case.
Since the bowl of the piston is perfectly centered and the axis of the injector coincides with vertical axis of the cylinder, so that the geometry of the system is symmetric, just a 60° slice has been studied. The mesh is structured (Figure 2b) and the dynamic motion has been simulated through the layering technique: the Split and the Collapse Factors that control the addition and the removing of the cell layers has been set to 0.4 and to 0.1, respectively.
Table 2. Injector fuel system specifications.
Fuel fedUnitsCommon rail
Injection pressureMPaUp to 120 MPa
Number of nozzle holes-6
Nozzle hole diametermm0.259
Start of injection-9 Before top dead center (BTDC)
Injection duration-21.5 crank angle (CA)
Fuel injectedg/cycle0.1622 (at full load)
Since the spray physical quantity is characterized by a high gradient just in the central zone of the cylinder where the break-up occurs, a denser discretization (+30% in comparison with the remaining zones) has been applied within a cylindrical zone whose radius is equal about to 18 mm. The latter value ensures that the break-up happens within this zone. This solution ensures a reduction of the number of the cells without to compromise the stability and reliability of the model. At TDC the mesh consists of about 42 kCells, while at EVO of about 222 kCells: it has been verified that this density can provide adequately grid independent results. The employed time step is normally 0.25 crank angle degree, while during the injection phases it has been reduced to the half to better describe the spray break-up and its ignition. In fact, to study combustion process and limit the numerical error, both length and time scale have to be adequate to describe turbulence [10].
Figure 2. The computational mesh: (a) swirl initialization and (b) details of the structured mesh.
Energies 06 04331 g002

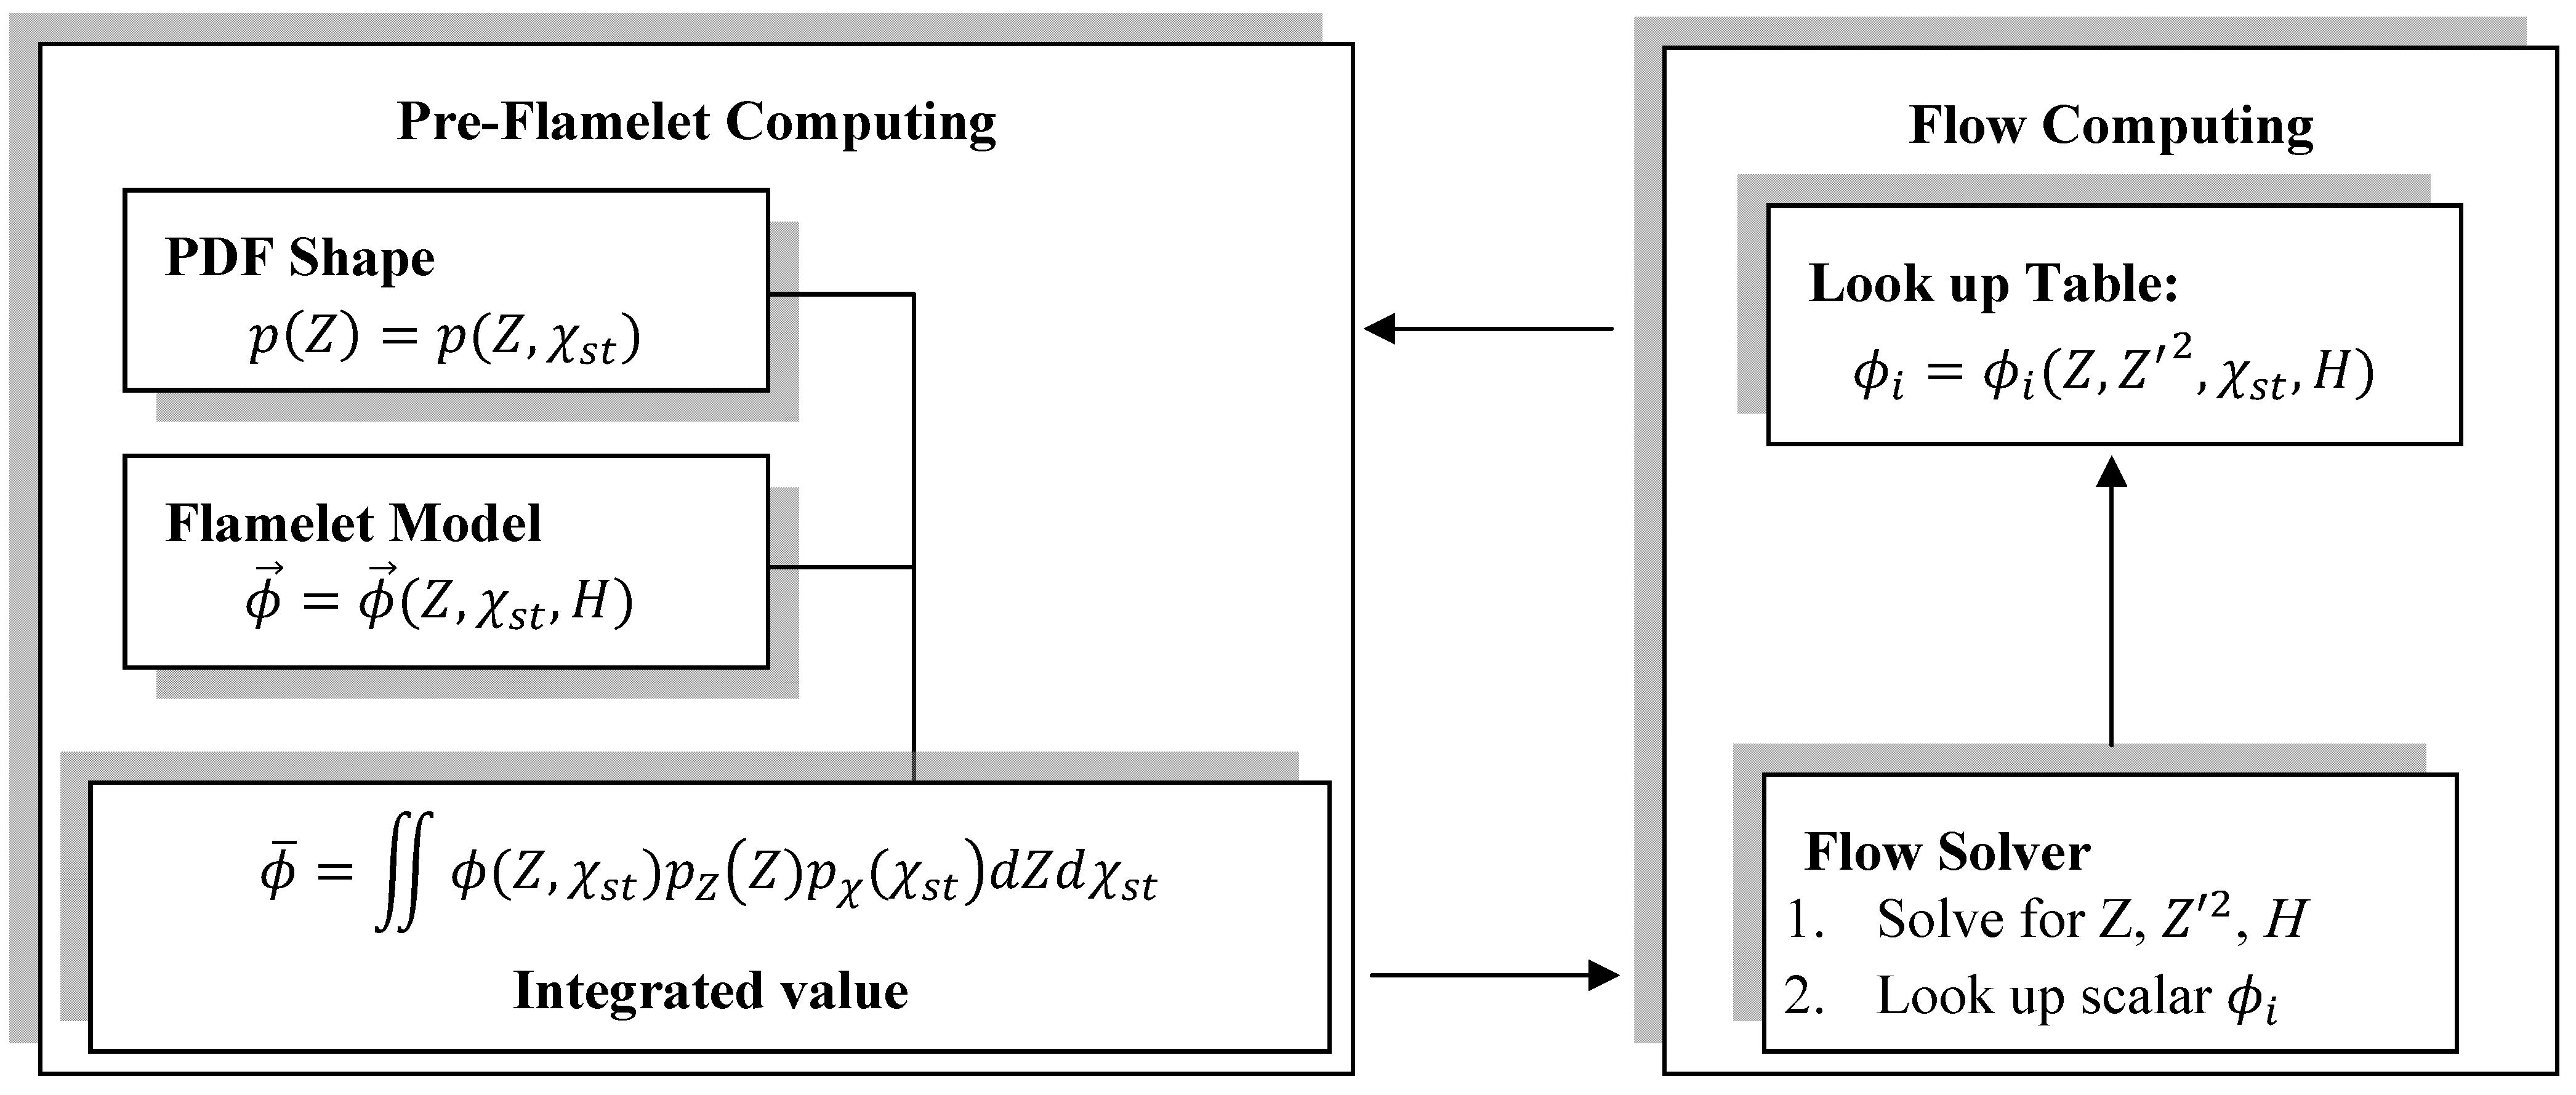
2.2. The Turbulent Combustion Model

The turbulent effects have been modeled through large eddy simulation (LES) Smagorinsky-Lilly approach. With regard to the combustion model, a mechanism with 57 intermediate species and 86 reactions for n-heptane was employed in the place of a detailed chemistry which can result too large to be integrated within a multi dimensional computational fluid dynamics (CFD) code [11]. Although many other species can be chosen as diesel surrogate, the n-heptane matches the cetane number of diesel fuels perfectly, ensuring a good accuracy in ignition delay prediction. This mechanism has been used to compute the Diesel Unsteady Flamelets. Using the flamelet approach, species mass fraction, temperature as well as the chemical reactions is computed from a physical space to a mixture fraction space. Therefore, they can be uniquely described by the mixture fraction Z and the strain rate χ. After translation of the flamelet equation from a physical space to mixture fraction space, a set of simplified equations can be written in the mixture fraction space, including equations for the species mass fraction [Equation (1)] and energy [Equation (2)] [12]:
t ( ρ Y i ) = 1 2 ρ χ 2 Y i Z 2 + S i
ρ T t ρ χ 2 2 T Z 2 ρ χ 2 c p T Z c p Z i N ρ χ 2 L e i c p , i c p Y i Z T Z + 1 c p i N S i h i 1 c p p t = 0
where Y i , T, ρ , Z , S i and h i represent the mass fraction, temperature, density, mixture fraction, reaction rate and enthalpy of the i-th species, respectively; c p , i and c p are the specific heat of the i-th species and the specific heat of the mixture. The last addend in Equation (2) takes into account the rising in temperature during the compression stroke which leads to mixture ignition: p is the volume-averaged pressure within the cylinder. At stoichiometric condition, the strain rate χ and the mixture fraction Z are related according to the following Equation (3):
χ s t = a s exp ( 2 [ e r f c 1 ( 2 Z s t ) ] 2 ) π
where a s is a characteristic strain rate; Z s t and χst are the mixture fraction and the strain rate at stoichiometric condition; erfc is the inverse function of the error. In the turbulent flame, both Z and χst are random variables with a joint probability density function. Therefore, the characteristic scalar (such as density, temperature and mass fraction) in the turbulent diffusion flame may be gained by laminar flamelet statistically:
ϕ ¯ = ϕ ( Z ,   χ s t ) p ( Z , χ s t ) d Z d χ s t
Assuming that Z and χst have independent distributions, the previous equation can be written as:
ϕ ¯ = ϕ ( Z ,   χ s t ) p Z ( Z ) p χ ( χ s t ) d Z d χ s t
The Equations (1) and (2) for species mass fraction and energy are solved simultaneously with the flow: the flamelet equations are advanced for a fractional time-step using properties computed from the fluid flow and then the latter is advanced for the same fractional time-step using properties from the flamelets. The flamelet time-step is computed through the volume-averaged scalar dissipation, pressure, fuel and oxidizer temperatures which are passed from the flow solver to the flamelet solver. It’s important underline that the table creation and the flamelet calculation are performed at every time-step and not just in a pre-processing step as in other non-premixed combustion models. To close the equation system, in LES, the solved equation for the mean mixture fraction in the physical space is the following:
( ρ Z ) t + x j ( ρ v Z ) = x j ( µ t σ t Z x i ) + S m
where the source term S m is due to transfer of mass into the gas phase from liquid fuel droplets and µ t is the sub-grid-scale viscosity. Equation (7) is solved for the mixture fraction variance:
Z 2 = C v a r L v a r 2 | Z x i | 2
with C v a r an user-adjustable constant set to 0.5 and L v a r the sub-grid length scale. Figure 3 summarizes the relationship between the combustion and fluid flow models.
Figure 3. Flamelet model computing.
Energies 06 04331 g003

2.3. The Spray Model

The wave model has been taken into account for the primary and secondary break-up of the particles issuing from the injector with a cylindrical liquid jet of radius r0. The atomization of the parcels and the resulting droplets are computed assuming that the break-up droplet radius r is proportional to the wavelength of the fastest growing unstable surface wave Λ [13]:
r = B 0 Λ
where B0 is a constant of the model set equal to 0.61 and:
Λ = 9.02 r 0 ( 1 + 0.45 O h 0.5 ) ( 1 + 0.4 T a 0.7 ) ( 1 + 0.87 W e l 1.67 ) 0.6
With Oh, T a , Wel the Ohnesorge, Taylor and Weber number of fuel, respectively. The rate of change of the droplet radius is given by:
d r d t = r 0 r τ
The break-up time τ is computable as:
τ = 3.726 B 1 r 0 Λ Ω
Where B1 is set to the value 1.73 as recommended in [14] and Ω is the maximum growth rate of perturbation and takes into account both the interaction between the liquid jet with the air and the physical characteristics of the fuel:
Ω = σ ρ a i r r 0 3 ( 0.34 + 0.38 W e l 1.5 ) ( 1 + O h ) ( 1 + 1.4 T a 0.6 )
being σ the surface tension of the fuel.
The rate of droplets temperature change for the treatment of heat-up and evaporation was determined through the heat balance which states that the heat convection from the surrounding gas to the droplet either heats the droplet or supplies heat for evaporation.

2.4. The Pollutant Emission Models

The estimation of pollutant emissions has to go beyond the flamelet model. The attention has been focused on thermal NOx and soot formation that are the two most important pollutant emissions for a diesel engine [15,16]. It has been verified that the contribution of low temperature NOx (such as N2O) during the final phase of the power stroke is negligible in comparison with thermal NOx, so that it has not been taken into account.
As to the reactions for NOx formation, the extended Zeldovich’s mechanism has been taken into account. The main contribution is given by thermal NO whose forward and backward reactions can be expressed through Equations (13) and (14), respectively:
w NO ,  Th + = 1.35 · 10 16 ρ Y N 2 Y O 2 0.5 T 1 exp ( 69160 T )
w NO ,  Th = 22.5 ρ Y N 2 2 Y O 2 0.5  T 1 exp ( 47355 T )
The net production of soot has to be calculated taking into account both its rate of formation and oxidation. In this study, the Moss-Brookes model has been adopted: soot mass fraction ( Y s o o t ) and soot particle number density ( N ) can be computed solving the relative transport equations:
( ρ Y s o o t ) t + x j ( ρ v Y s o o t ) = x j ( µ t σ s o o t Y s o o t x i ) + d M d t
( ρ b n u c l e i * ) t + x j ( ρ v b n u c l e i * ) = x j ( µ t σ n u c l e i b n u c l e i * x i ) + 1 N n o r m d N d t
with N n o r m = 10 15 particles, b n u c l e i * = N / ( ρ N n o r m ) .
The soot mass concentration M and the soot particle number density N that compares in the previous equations can be computed as follows:
d N d t = C α N A ( X p r e c   p R T ) l exp ( T α T ) C β ( 24   R T ρ s o o t N A ) 0.5 d p 0.5 N 2
d M d t = C α M P ( X p r e c   p R T ) l exp ( T α T ) + C γ ( X s g s p R T ) m e x p ( T γ T ) [ ( π N ) 1 / 3 ( 6 M ρ s o o t ) 2 / 3 ] n C o x C ω η c o l l X O H p R T T 0.5 ( π N ) 0.3 ( 6 M ρ s o o t ) 2 3
In the first equation, the first addend represents nucleation and the second the coagulation rate, with d p the mean diameter of a soot particle and X p r e c the mole fraction of soot precursors (acetylene and benzene). In the second equation, the three addends represent nucleation, surface growth and oxidation rate, respectively [17]. As regards the constant of the model, Table 3 summarizes their values and meaning.
Table 3. Model constant for the soot pollutant emission computing.
ConstantValuesFunction
C α 54 s−1Model constant for soot inception rate
T α 21.000 KActivation temperature of soot inception
C β 1Model constant for coagulation rate
C γ 11.700 kg m kmol−1 s−1Surface growth rate scaling factor
T γ 12.100 KActivation temperature of surface growth rate
C ω 105.812 kg m kmol−1 s−1 K−1/2Oxidation model constant
η coll 0.04Collisional efficiency parameter
C oxid 0.015Oxidation rate scaling parameter

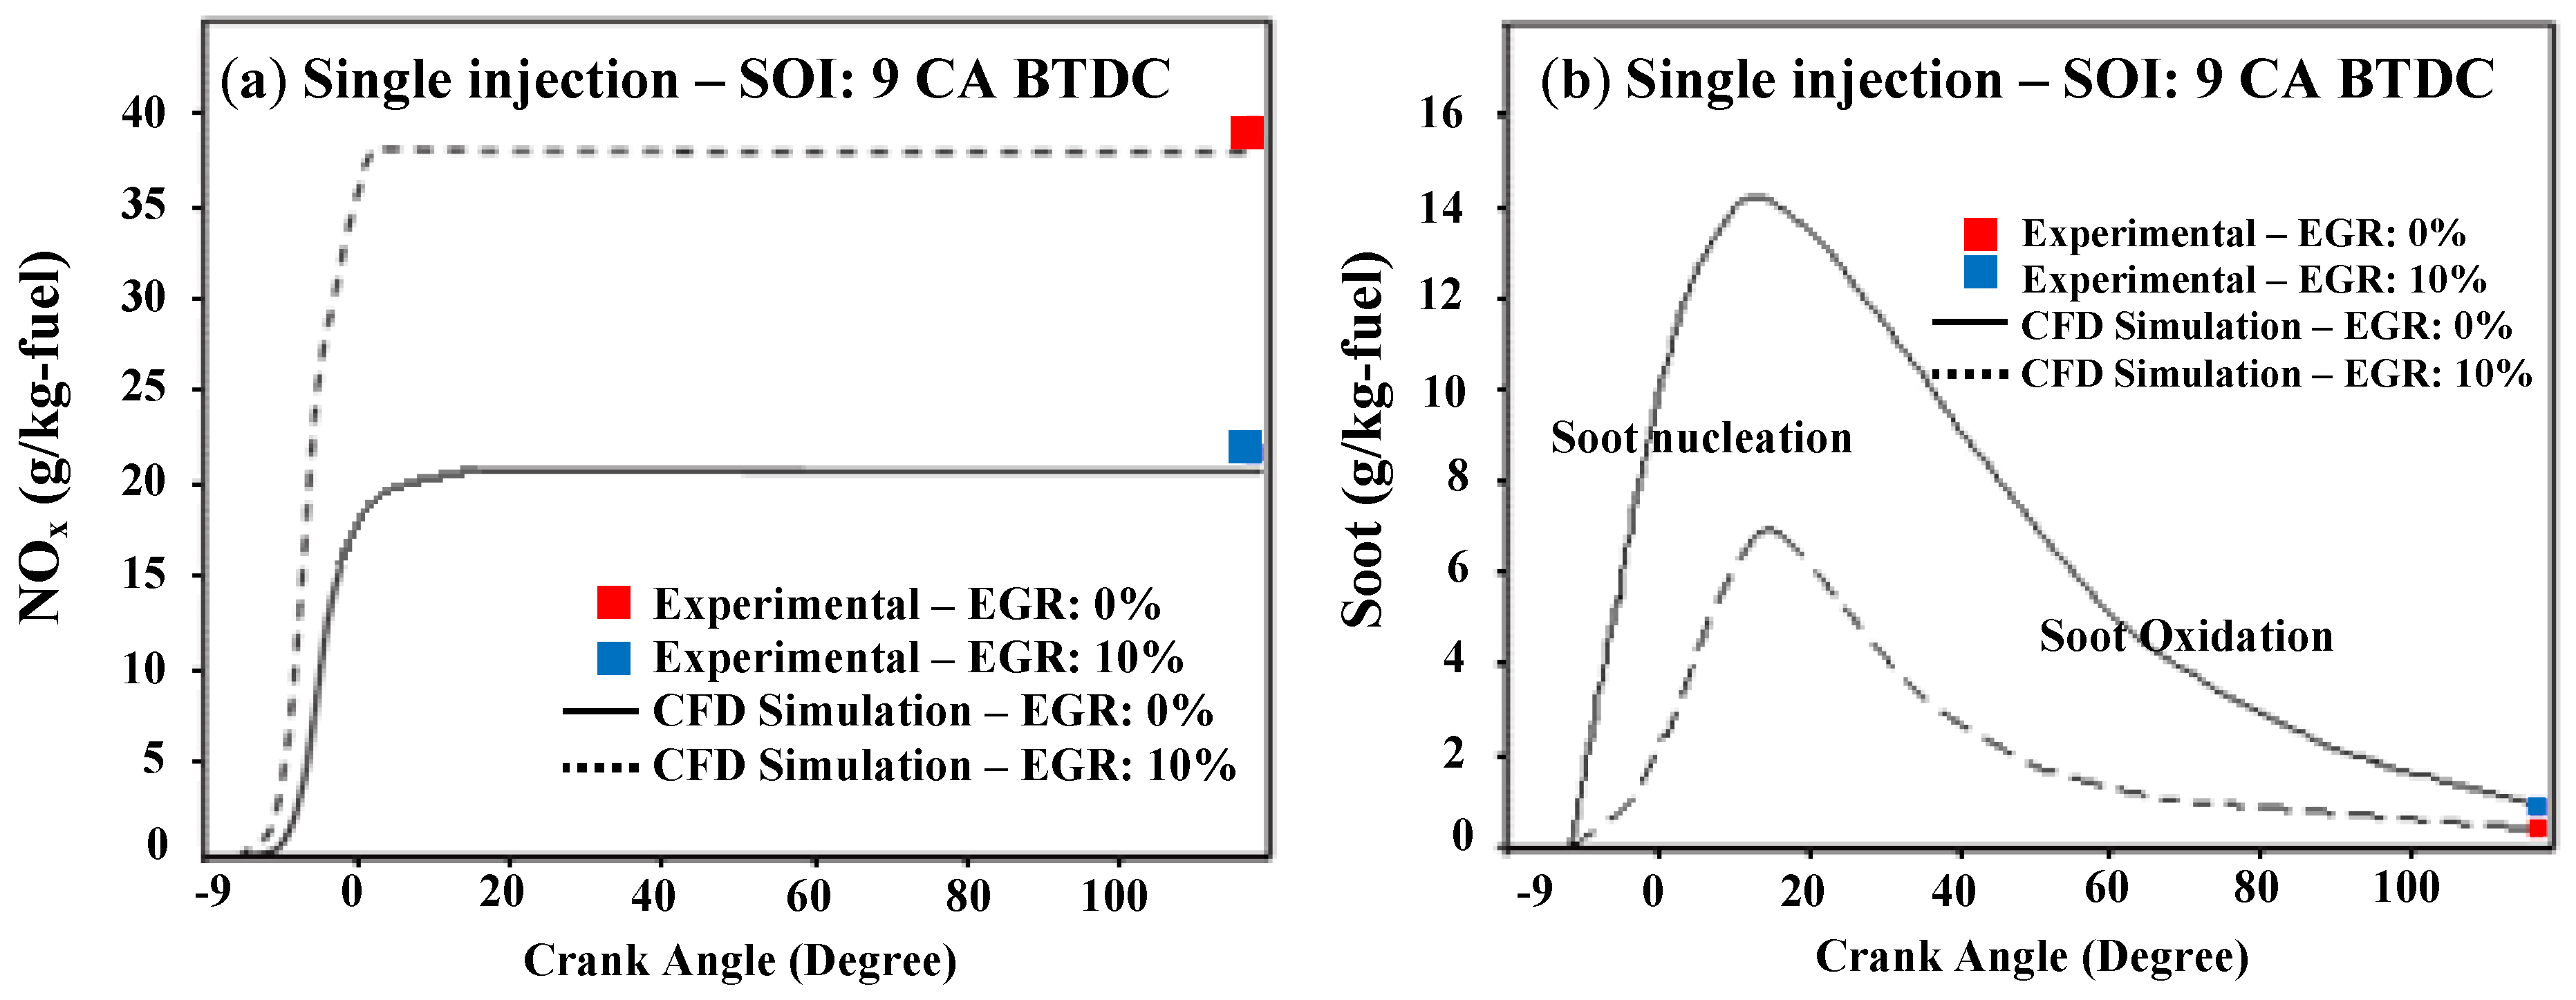
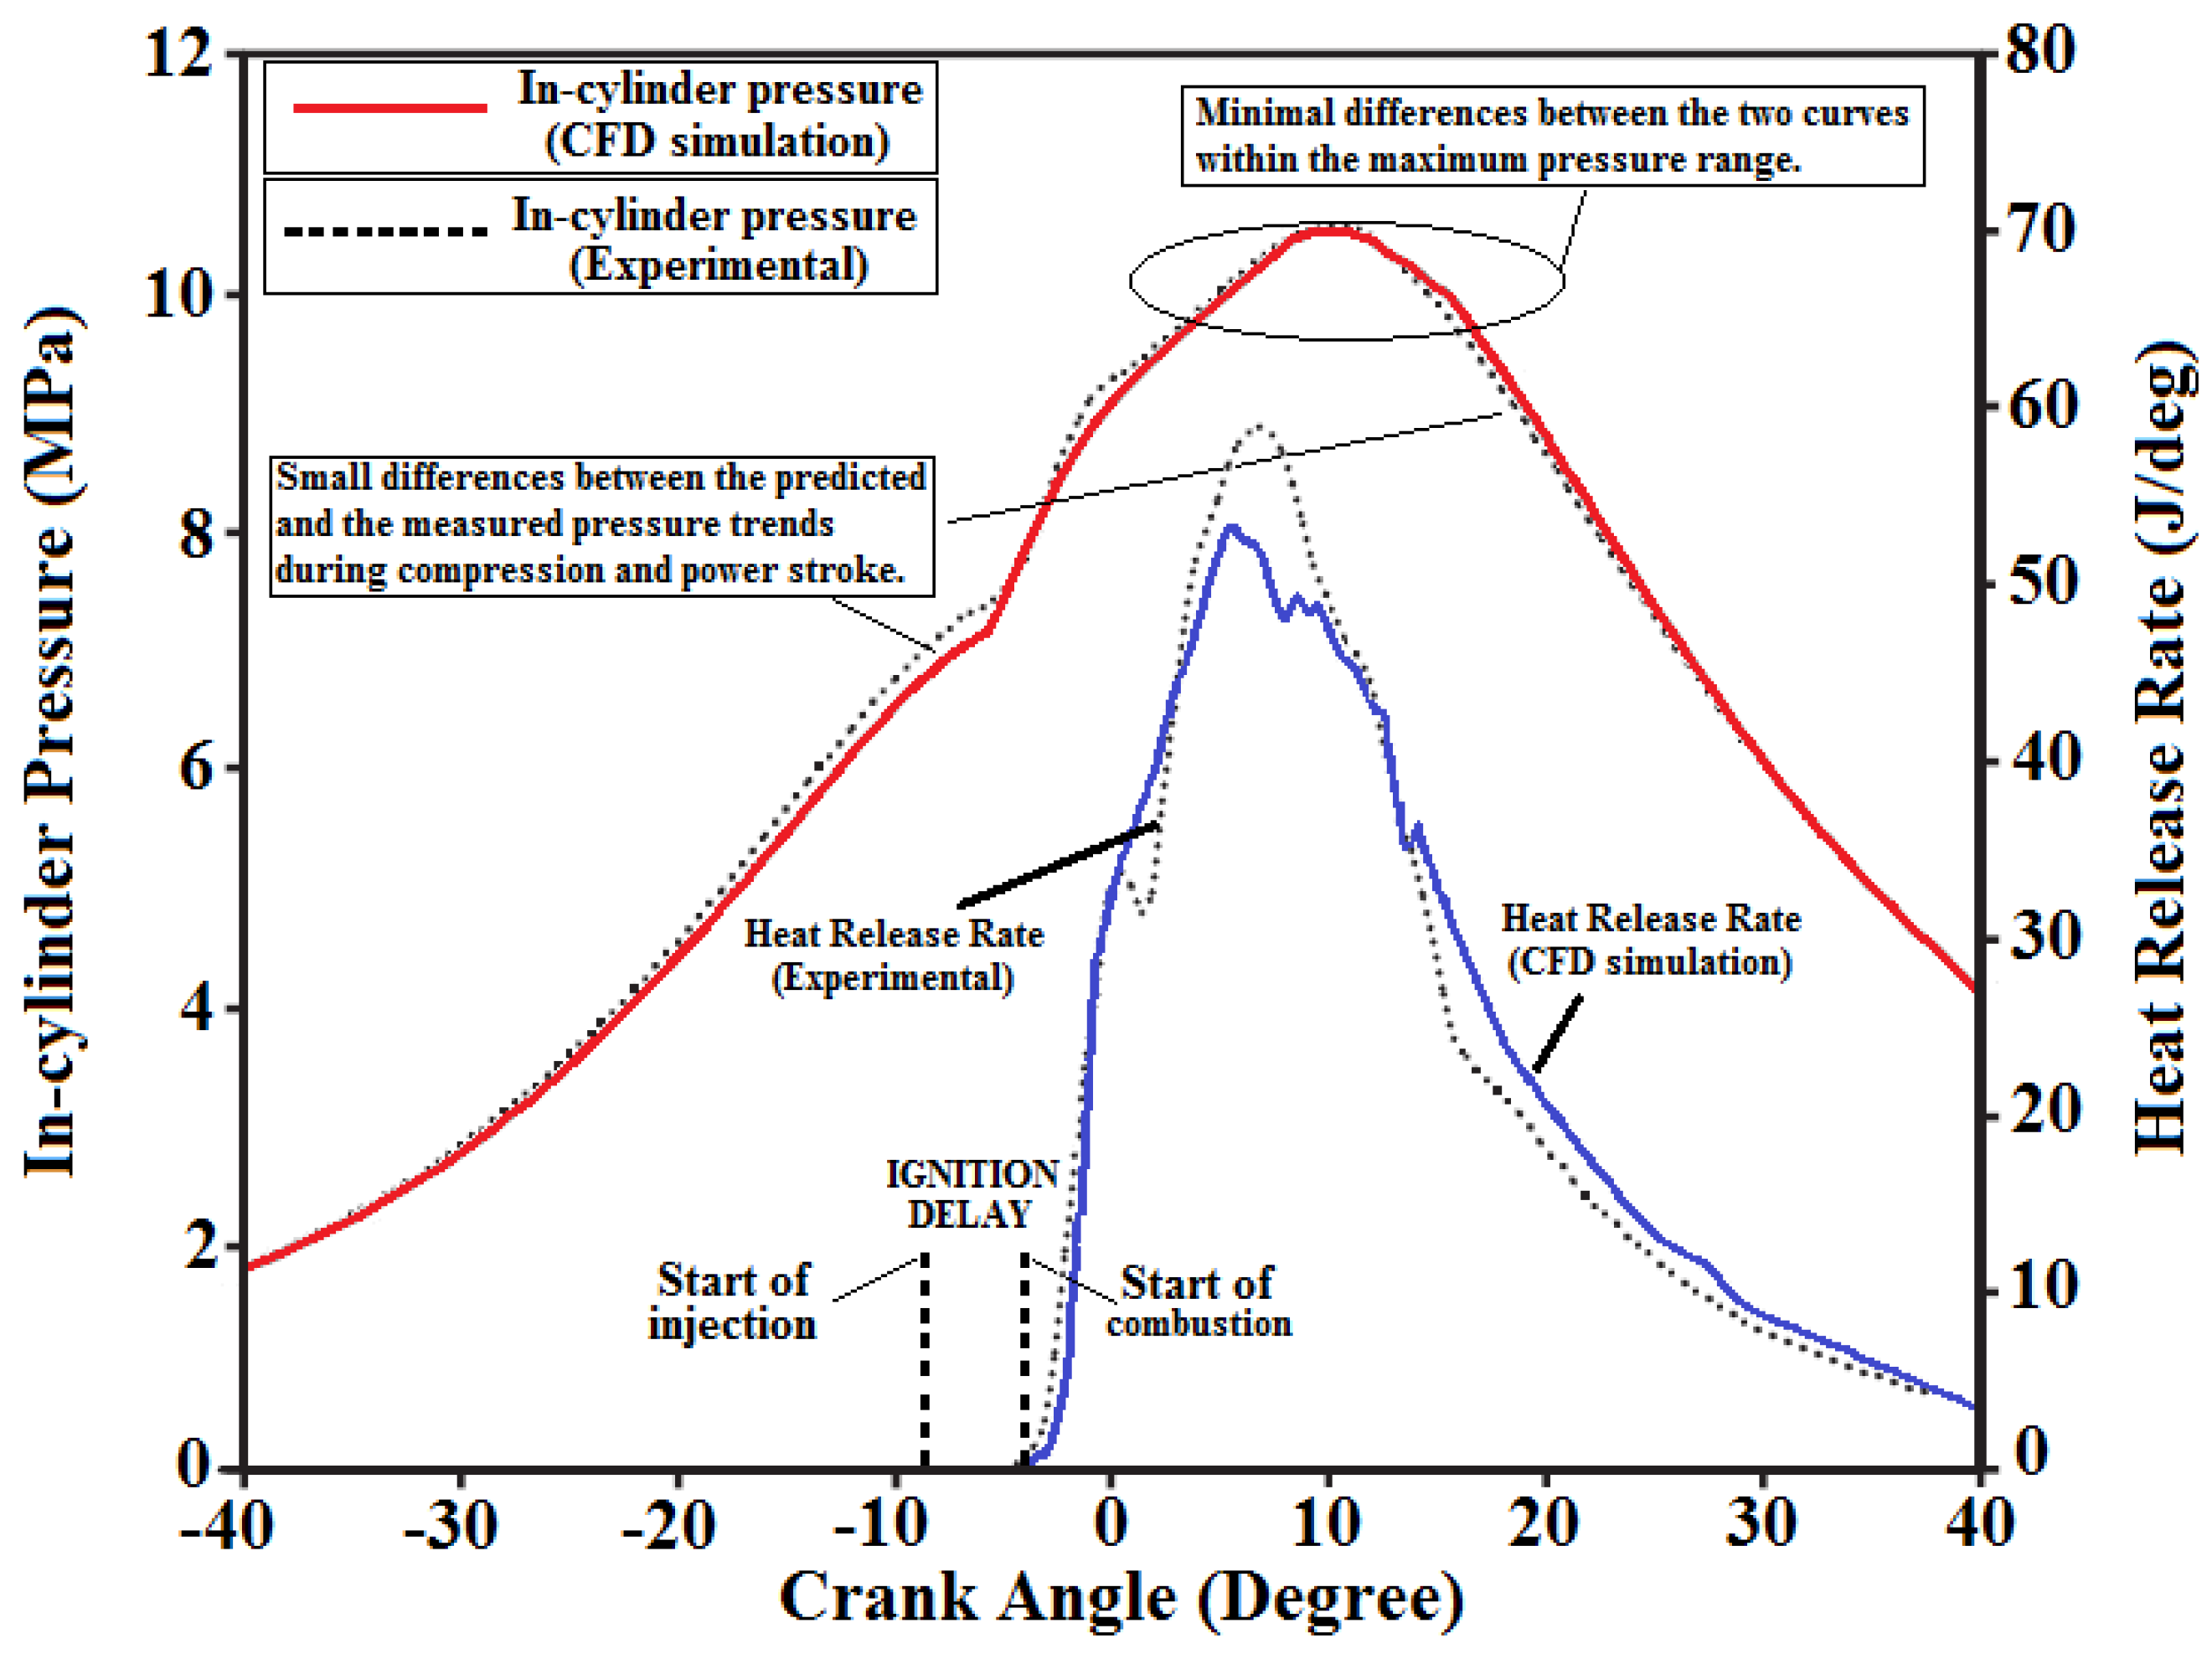
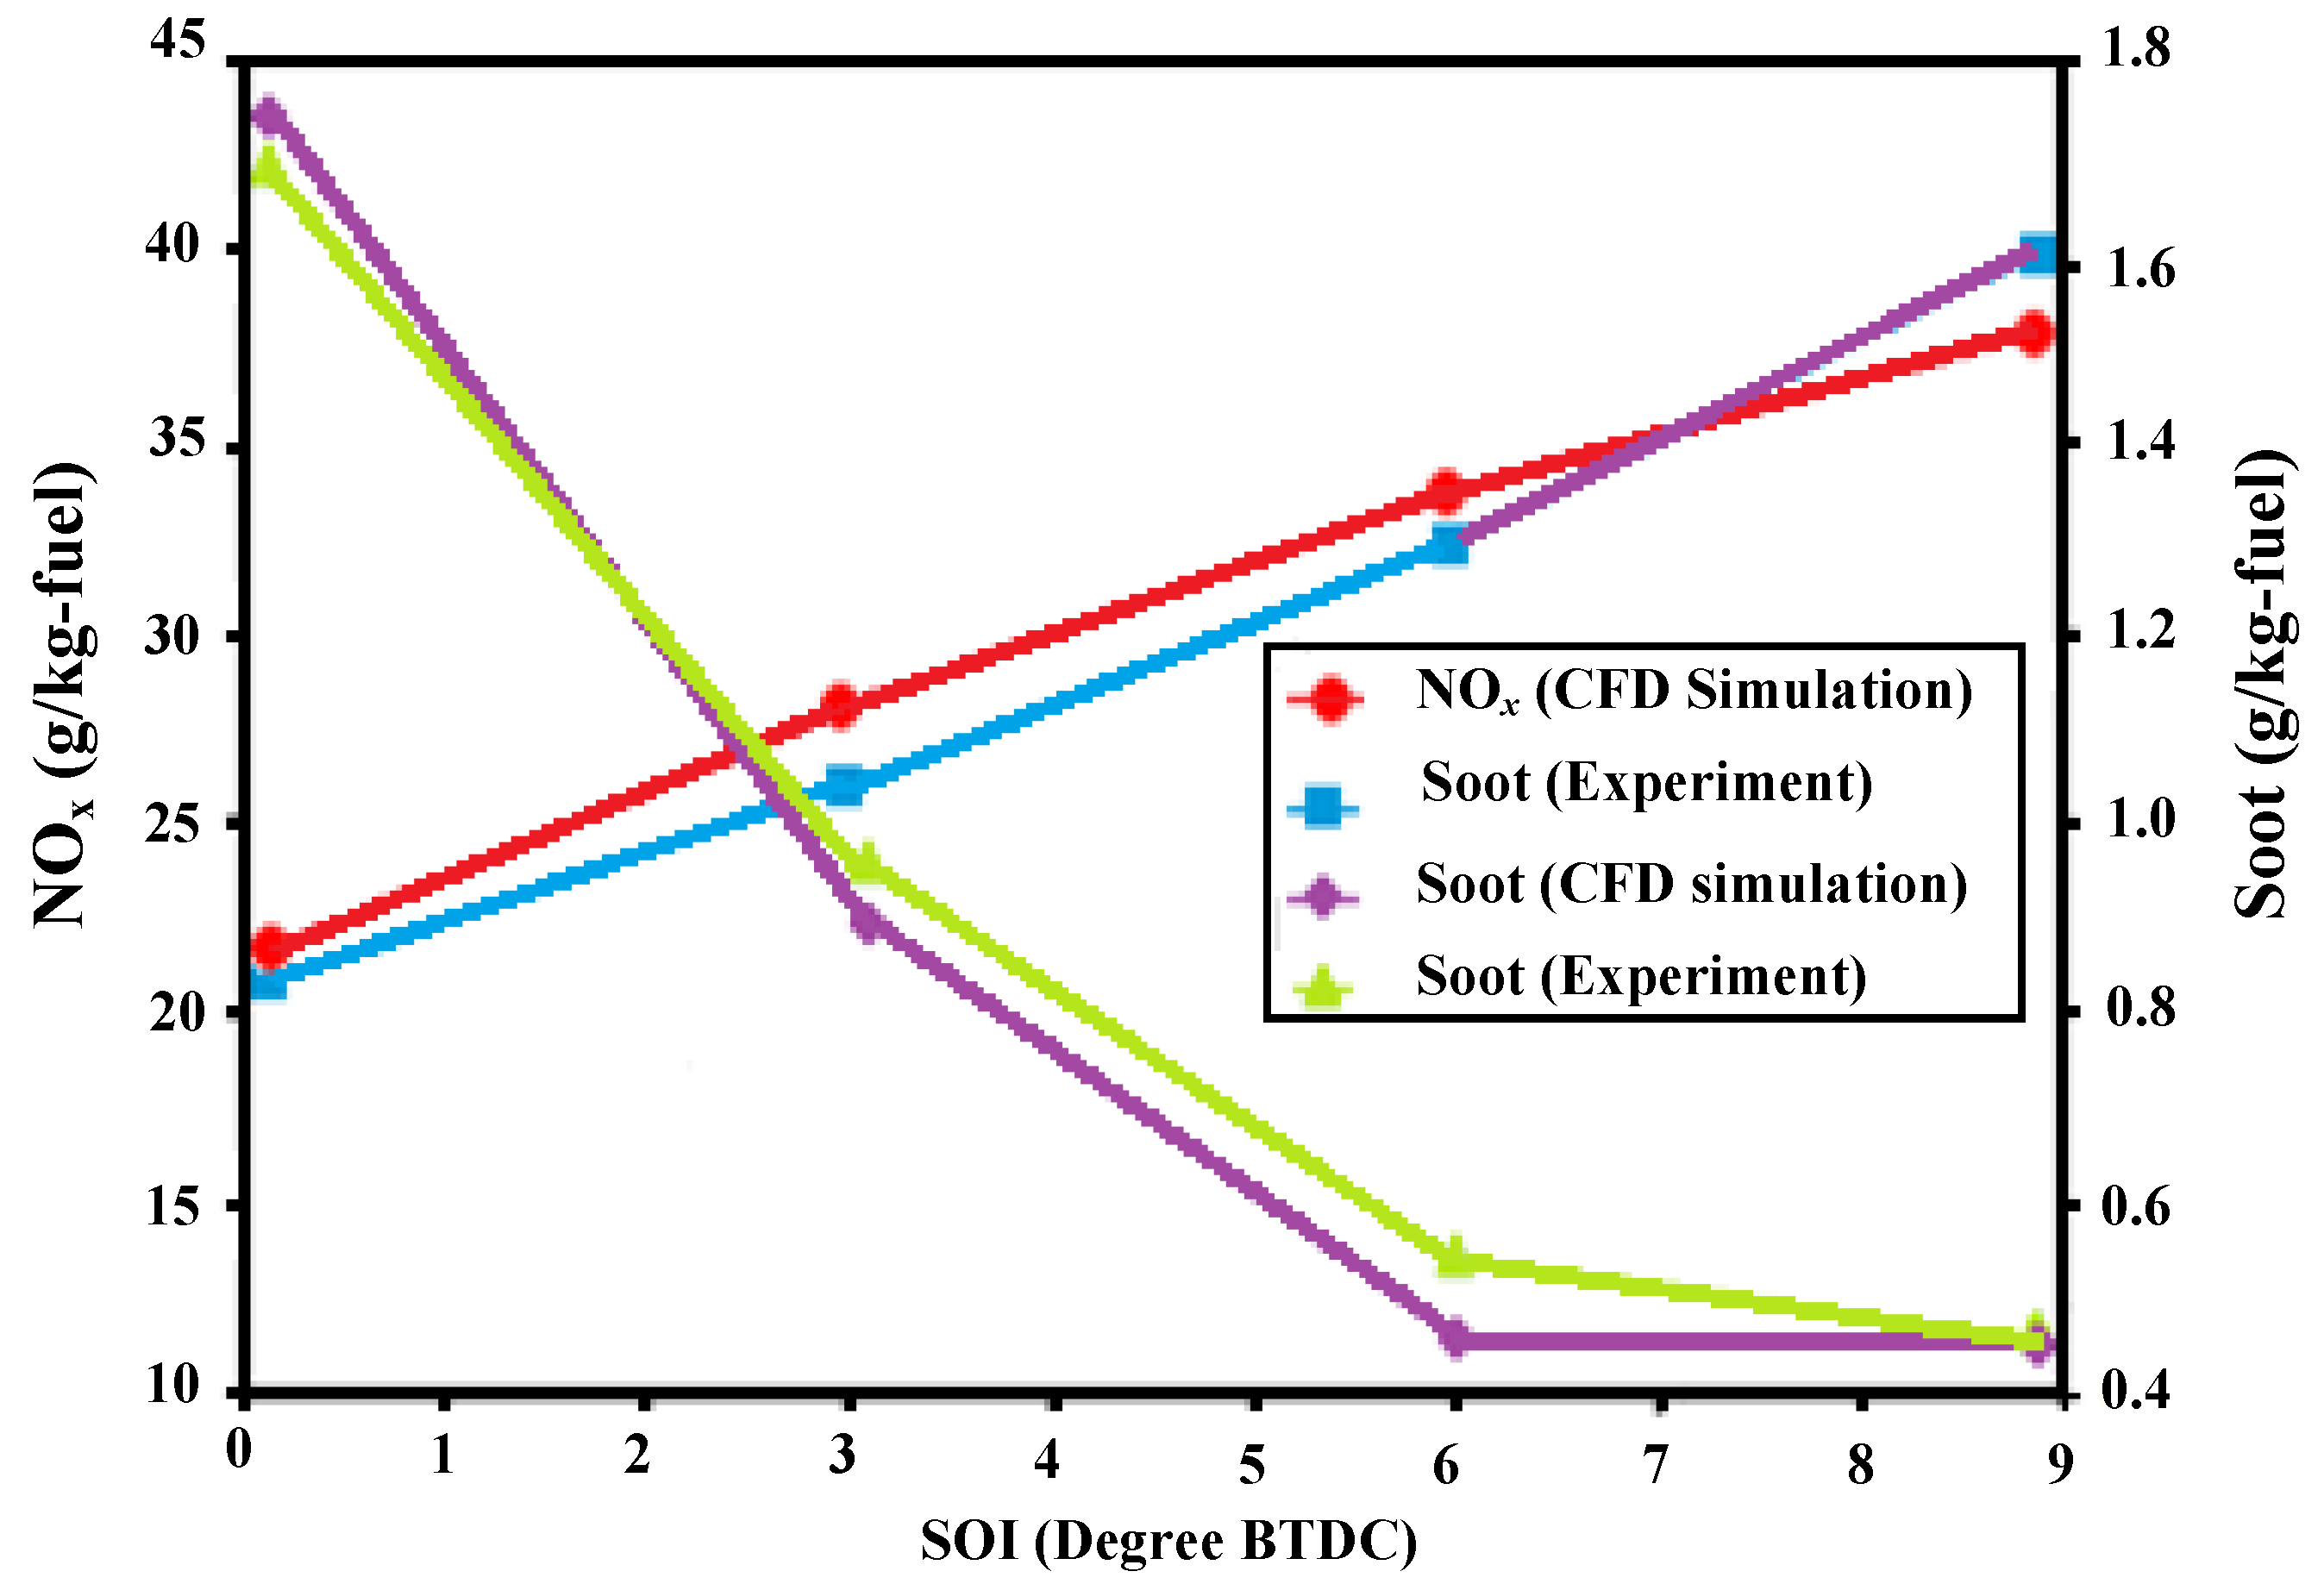
3. The Numerical Validation: The Single Injection Case

The base experimental data are referred to a single injection starting nine CA BTDC and two exhaust gas recirculation (EGR) levels, which is 0% and 10% [18]. Figure 4 shows the comparison between the predicted and measured in-cylinder pressure and heat release rate (HRR). The numerical curve of pressure has been obtained computing the mass averaged value at each time-step. Although there are some differences between the two trends, the discrepancies within the maximum pressure range are minimal: this ensures that pressure influence on pollutant emission evaluation is characterized by a limited error. The HRR diagram shows an ignition delay of about 5 CA and demonstrates the accuracy of the model being in agreement with the experimental curve.
Figure 4. Comparison between predicted and measured in-cylinder pressure and HRR.
Energies 06 04331 g004
As regard emissions, Figure 5 presents the numerical trends for NOx and soot and the measured data. In both cases the estimated emissions are reasonably close to the experimental data: it means that the model well describes both the diffusion combustion and the premixed combustion after ignition delay. It’s evident how EGR increasing leads to drastic NOx reduction due to lower peak temperatures. At the same time, lower oxygen concentration causes an increasing in soot emissions.
Figure 5. Comparison of predicted and measured pollutant (a) NOx; (b) soot emissions.
Energies 06 04331 g005
The simulations have been extended to other operative conditions as the predication capability of the model can’t be deduced by the comparison with a single measured value. Therefore, the effect of different start of injection time (SOI) has been simulated for null EGR mass flow rate. It is evident from Figure 6 that the model can follow the trend for both NOx and soot emissions: in particular, it can predict the increasing in NOx concentration and the corresponding soot reduction that can be experimentally observed anticipating the start of injection. Based this success of validation with a single injection, simulation results for different multiple injection cases will be presented and discussed in the following sections.
Figure 6. Influence of injection timing: comparison between predicted and measured data.
Energies 06 04331 g006

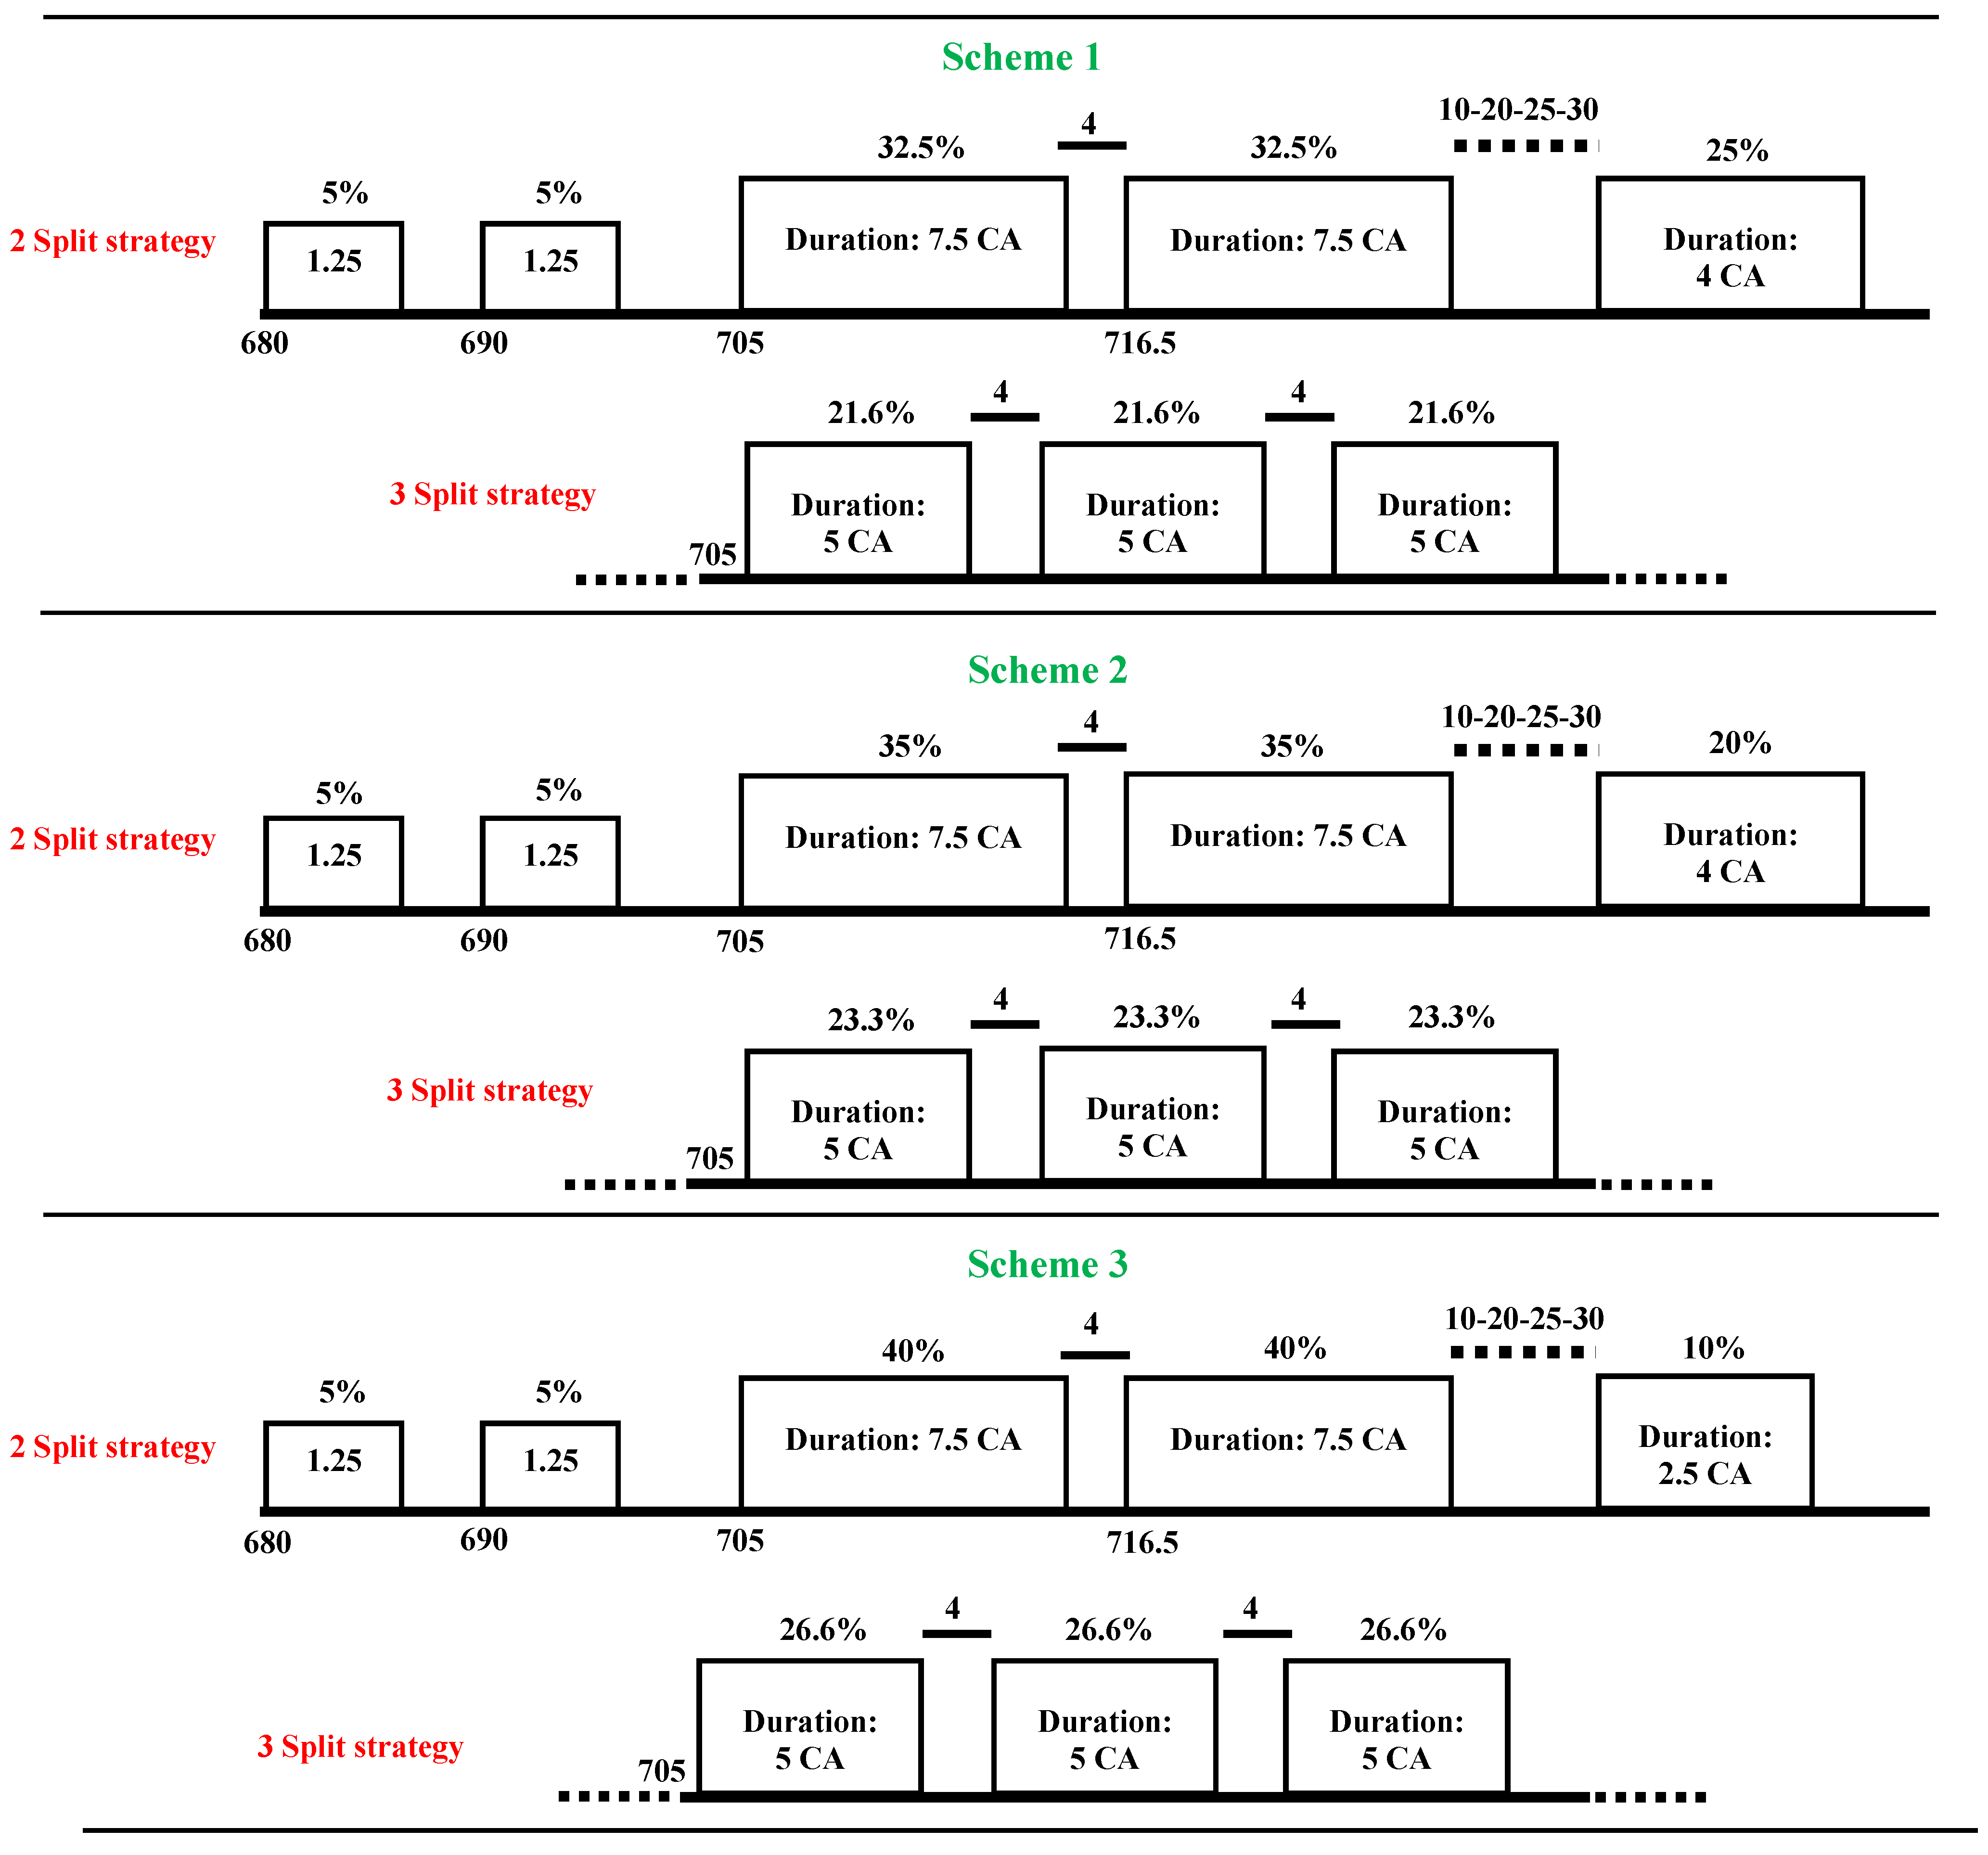
4. The Investigated Cases for Multiple Injection Strategies

The investigated strategies differ in the main injection splitting schematization. In the first approach, the main was formed by two injections, while in the second one by three injections. The dwell between each pulse of the main is four CA. In this context, three different schemes were simulated, each one with a different quantity of fuel injected during the main and post pulses (Figure 7).
Figure 7. Main splitting into two and three injections.
Energies 06 04331 g007
As evident, the schemes presented two pilot injections, each one with the 5% of the total mass. As well as for the main injections, the start and the duration of the pilot were kept constant. On the contrary, the post injection phase was characterized by a variable dwell with the last part of the main and a duration reduced to 2.5 CA for the Scheme 3 since just the 10% was injected in this phase. Therefore, each scheme provided four simulations that have been carried out for two values of EGR mass flow rate: 10% and 20%. The EGR percentage has been kept below 30% because beyond this threshold the further NOx reduction slows down while the amount of oxidized soot decreases significantly [19,20]. This approach allows to concurrently investigate about the influence of the different amount of fuel associated with each phase and to examine the interaction between the main and the post injections which represents a critical aspect for the pollutant emission reduction. Table 4 reports a statement of the simulations.
Table 4. Statement of simulations.
-First strategy: main split into 2 injections
-Scheme 1Scheme 2Scheme 3
n. of simulations444
-Second strategy: main split into 3 injections
-Scheme 1Scheme 2Scheme 3
n. of simulations444
-EGR (%)
-1020
-Total number of cases: 48

5. Results and Discussions

The following paragraphs report the results of the simulations. The attention will be firstly focused on the first strategy and later on the second one. The employed labeling scheme gives the percent of fuel injected for each pulse and the dwell between them within the brackets. For instance, the first scheme of the first strategy can be represented as 5(10)5(15)32.5(4)32.5(x)25: the variable dwell between the main and the post pulse is represented by the x letter.
Figures and graphs contain also information about experimental data related to the single injection case in order to have an immediate comparison.

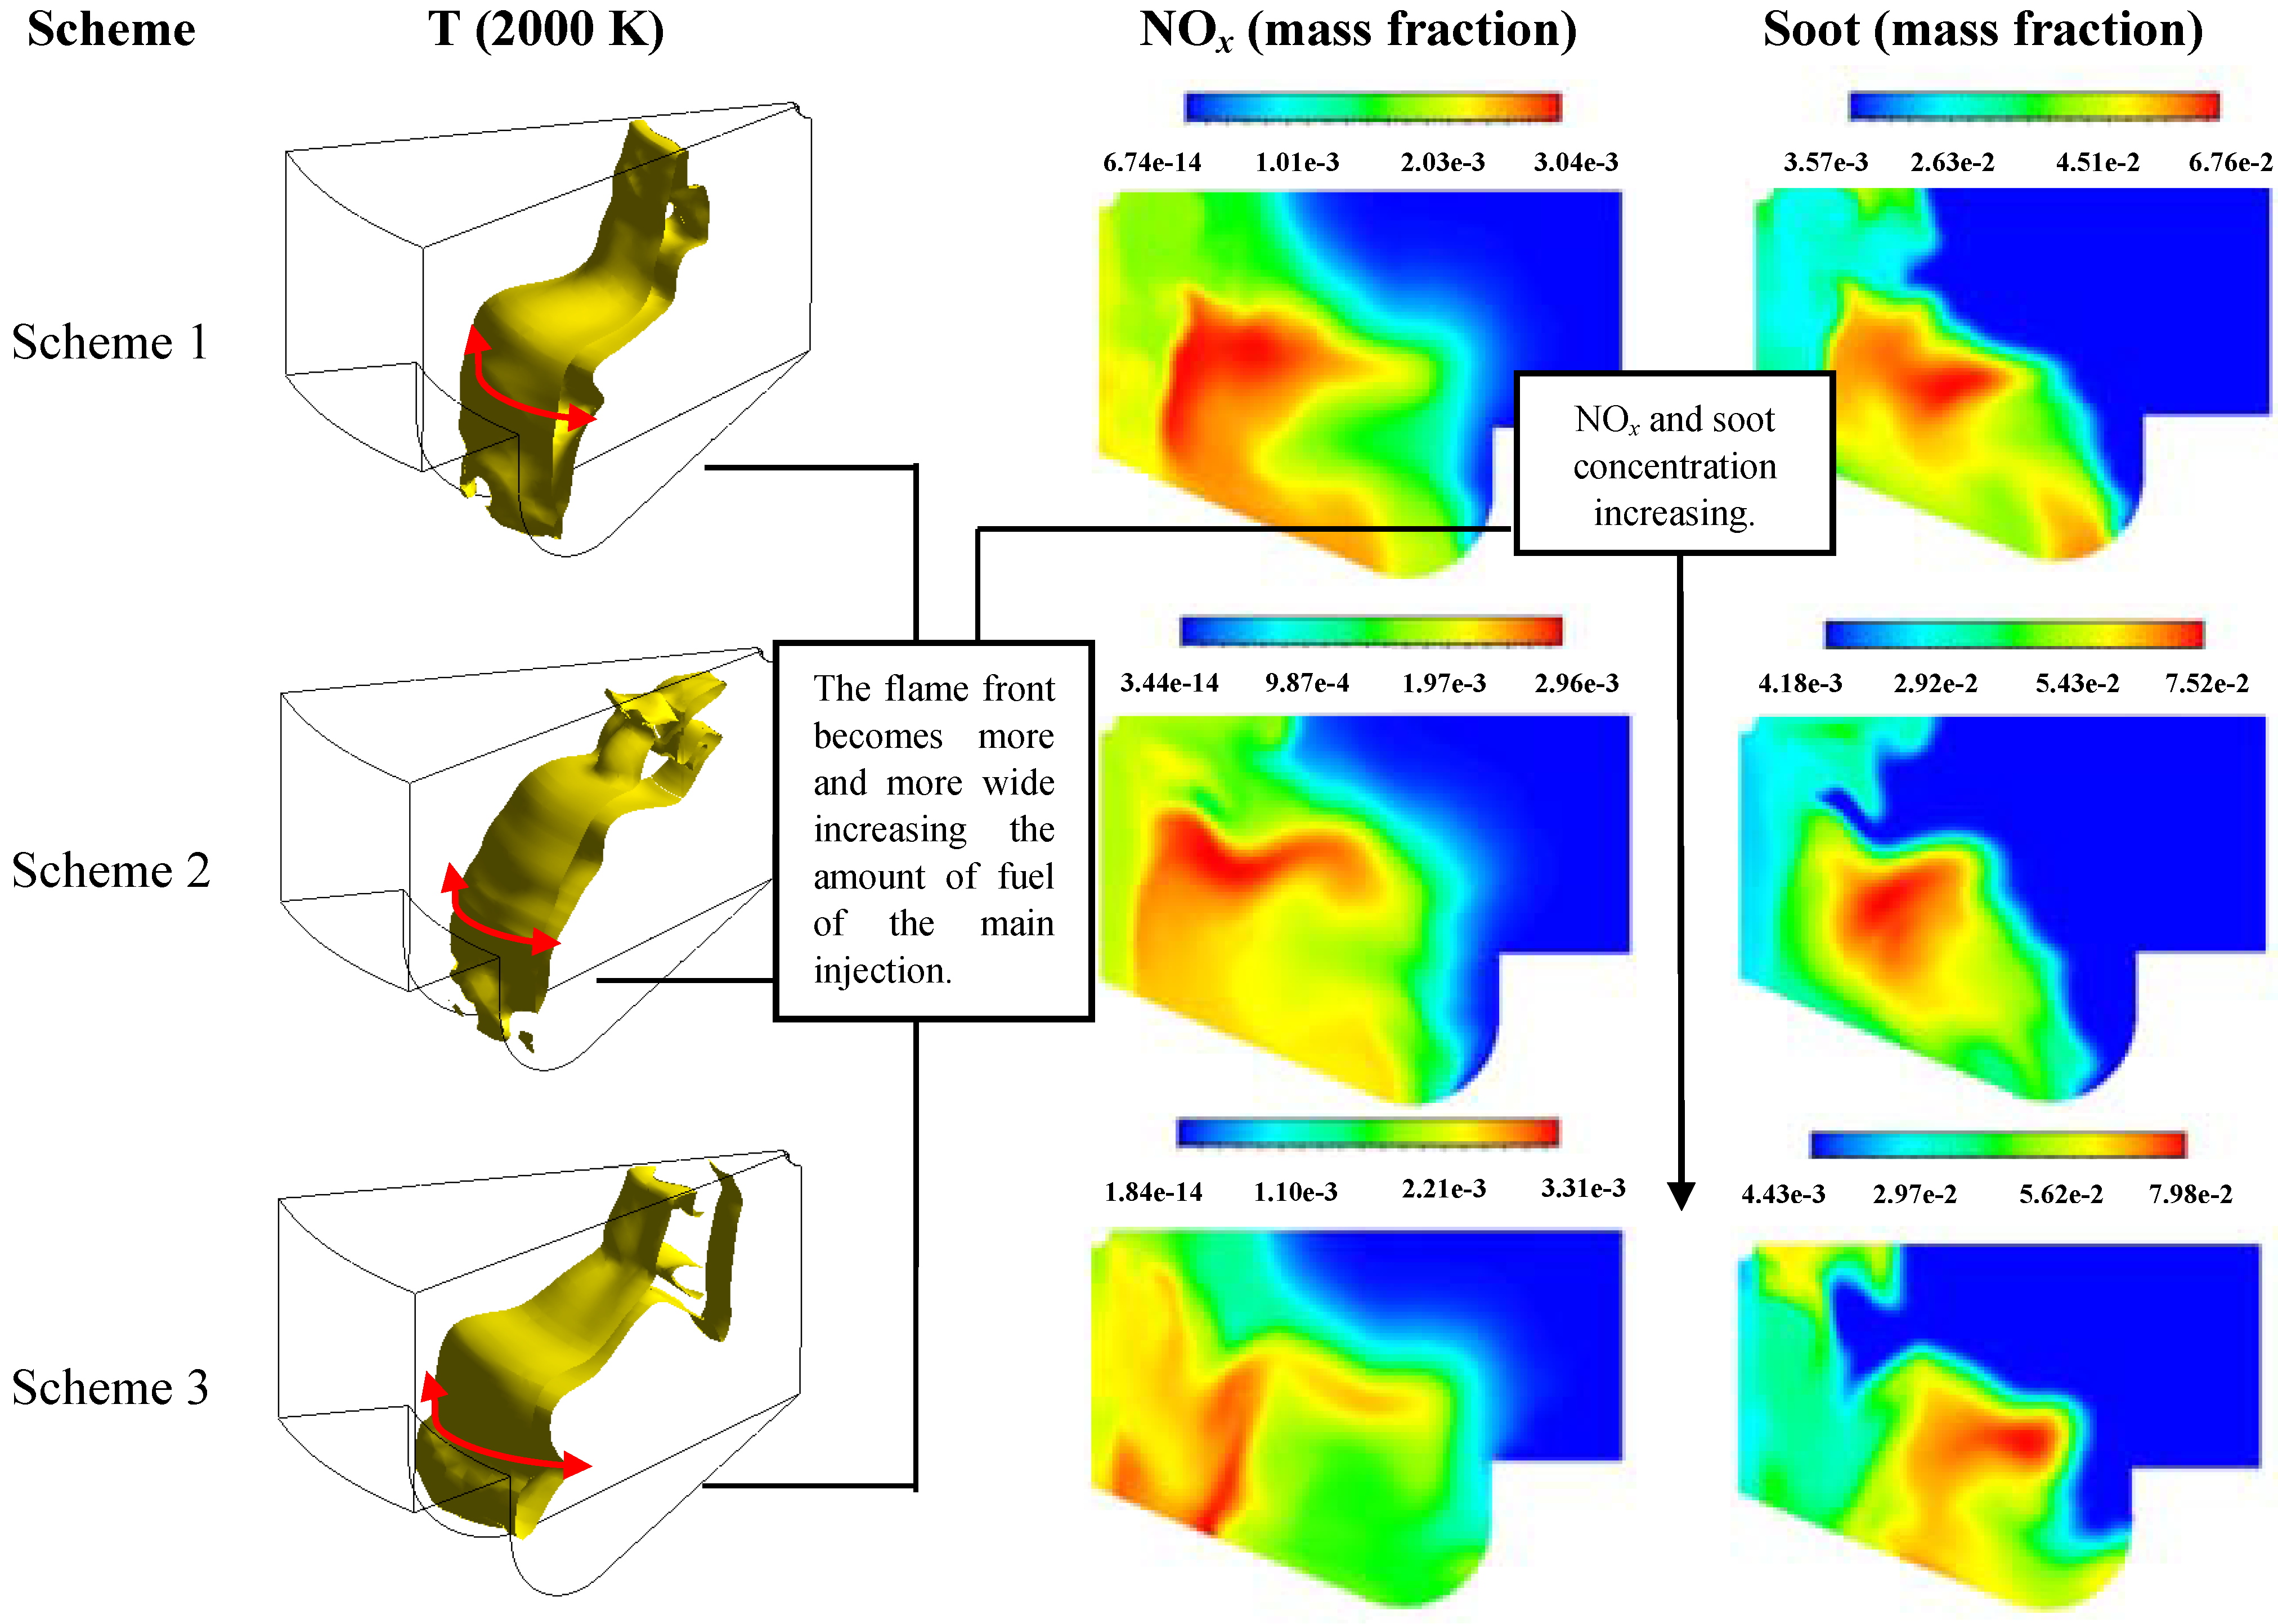
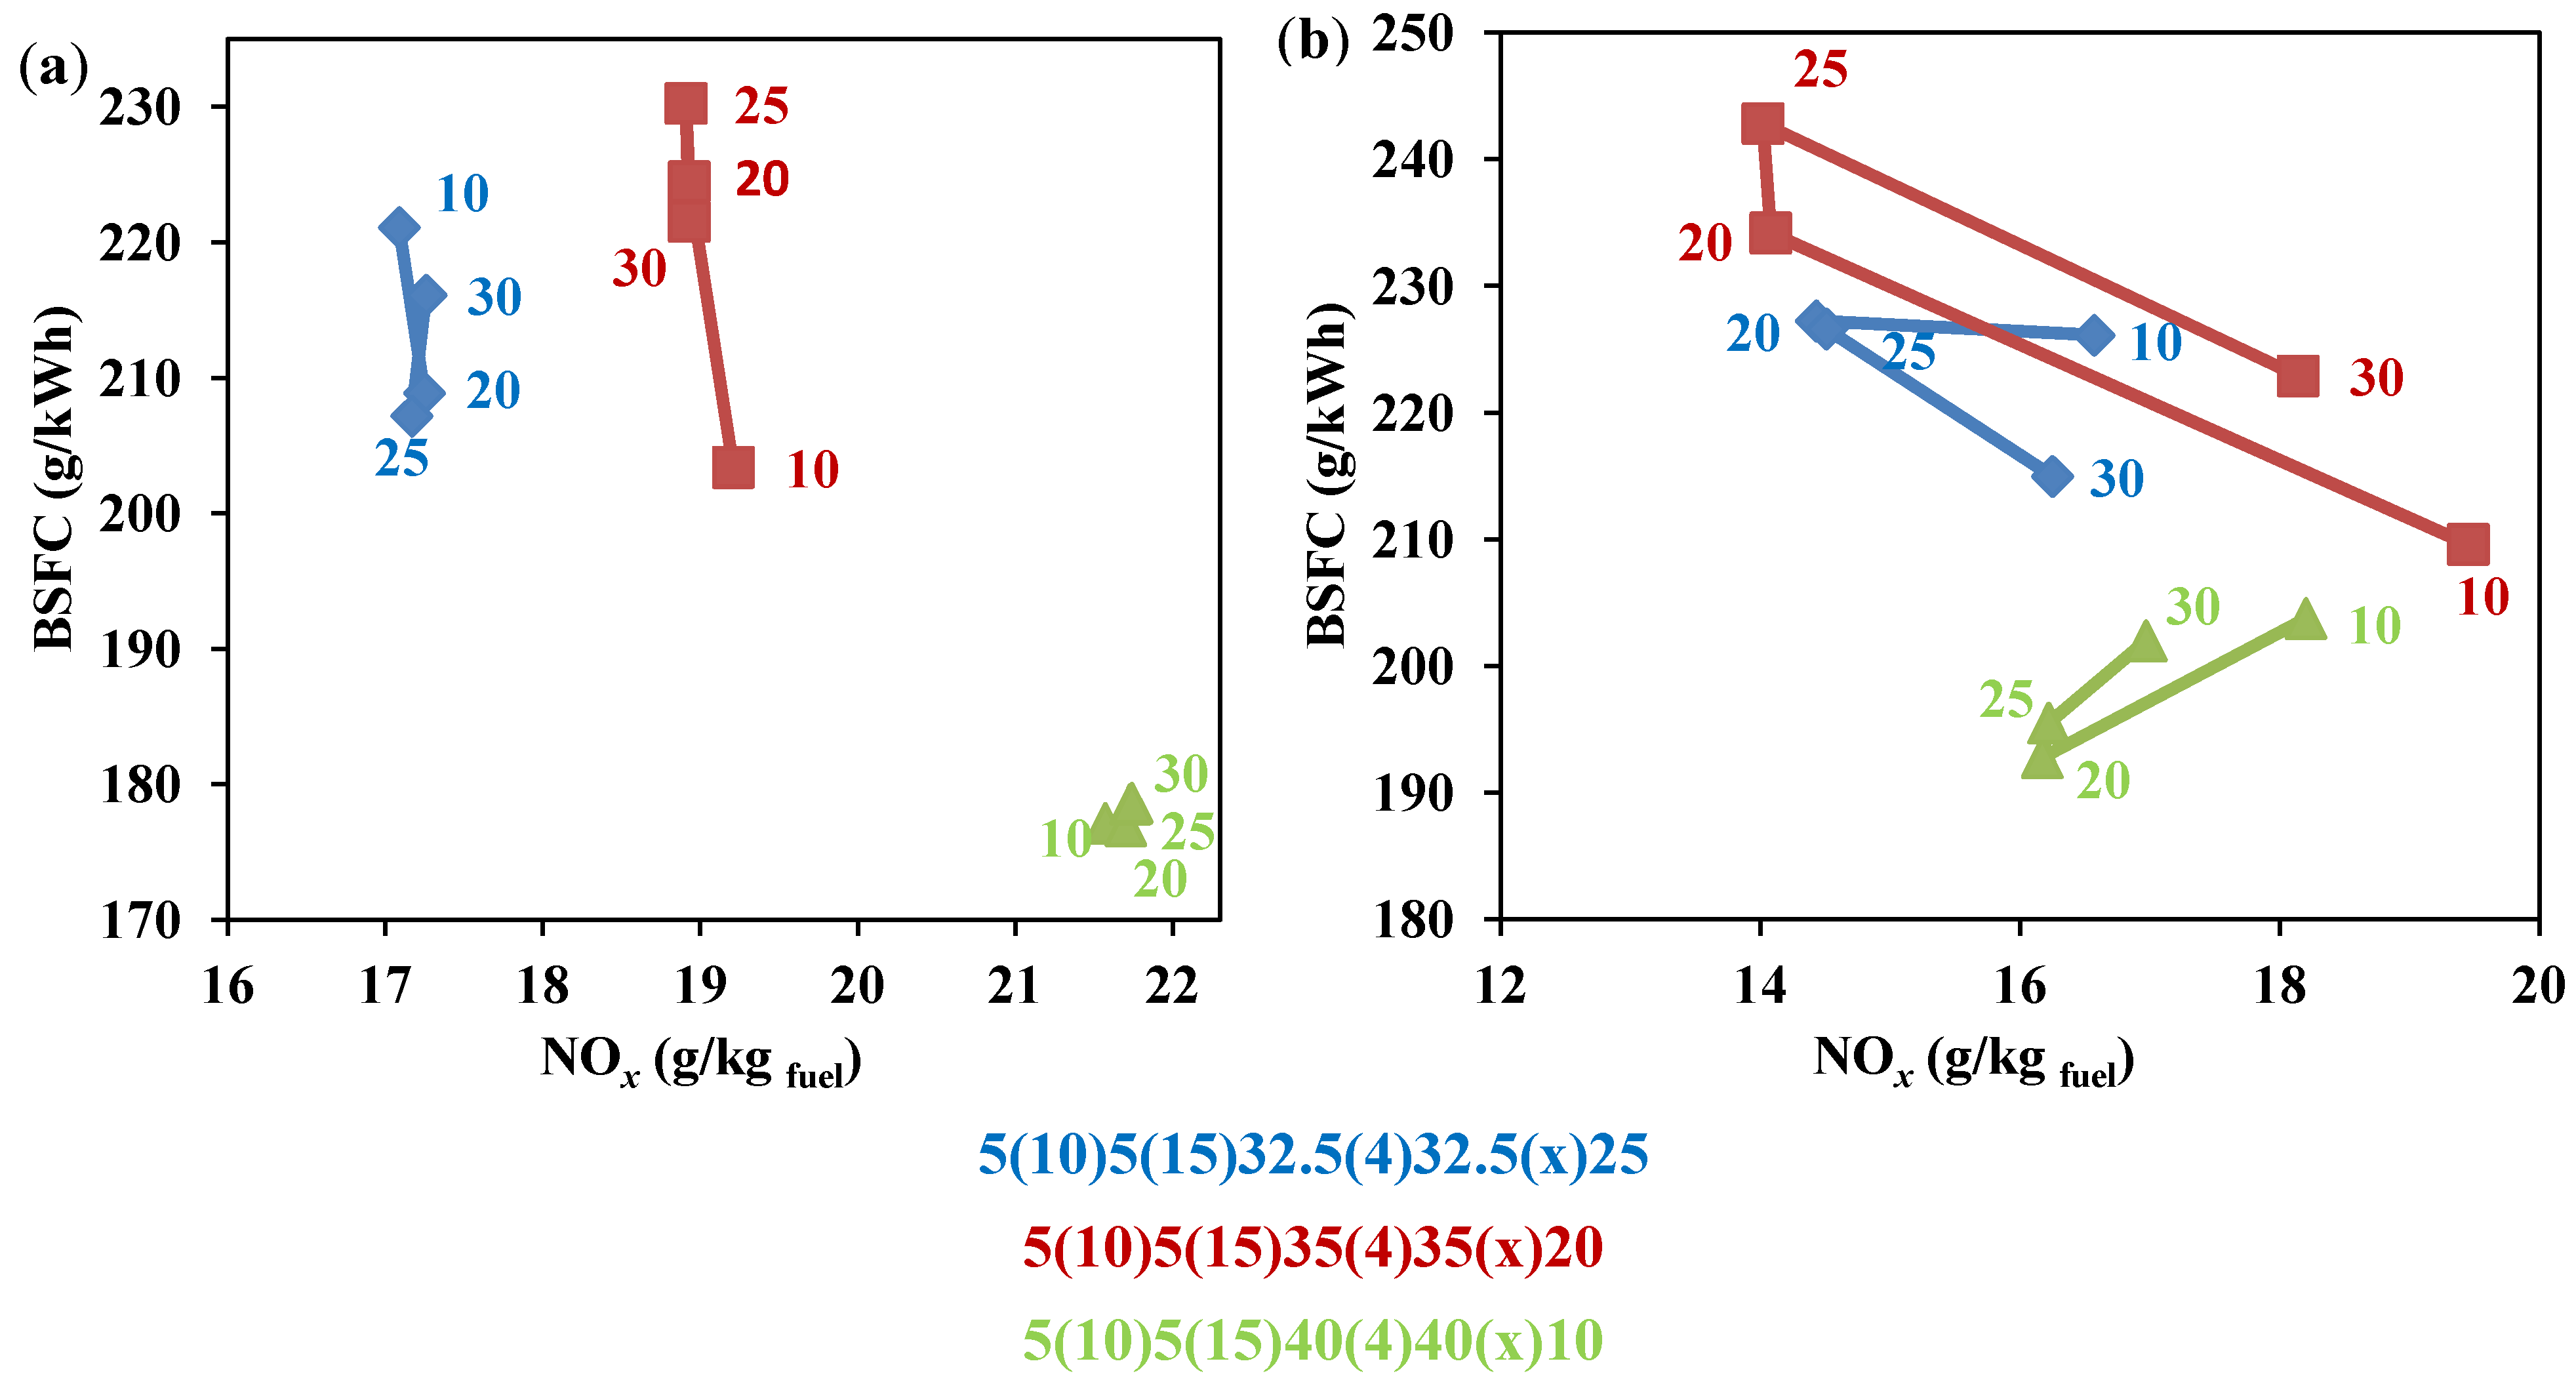
5.1. The First Multiple Injection Strategy: Splitting the Main into Two Injections

In this section, the results obtained for different split injection schemes presented in Figure 7a are considered. Under 10% EGR condition the operative distance between the three schemes is evident (Figure 8a). Focusing attention on the influence of dwell between main and post pulses, a small variability for NOx emission can be appreciate for any scheme. This means that NOx formation is concentrated in the combustion of the fuel injected during main phase, while it is no influenced by the post injection.
The advantage in NOx reduction is evident increasing the EGR fraction (Figure 8b). This is directly connected to the reduction of the temperature peaks within the cylinder due to the substitution of air with inert having a more elevated specific heat value (Figure 9a). Moreover, soot emission is not subjected to evident changes for Schemes 1 and 2 varying EGR fraction. On the contrary, a decreasing can be verified for Scheme 3 for each of the four investigated cases in comparison with 10% EGR results. This is due to a lower soot production rate consequent to the reduction of temperature rather than an increase of soot oxidation.
Figure 8. Soot-NOx trade-off for (a) 10% and (b) 20% EGR.
Energies 06 04331 g008
Figure 9. Three different trends for (a) temperature and (b) pressure [and its correlation with Brake Specific Fuel Consumption (BSFC)].
Energies 06 04331 g009
For 20% EGR, the increasing of the inert fraction leads also to a different behavior of the different strategies within each scheme, since it modifies the kinetic reaction rates of fuel oxidation: the dwells equal to 20 and 25 CA seem to offer the best performance for a simultaneous minimization of pollutant emissions. These strategies can benefit of:
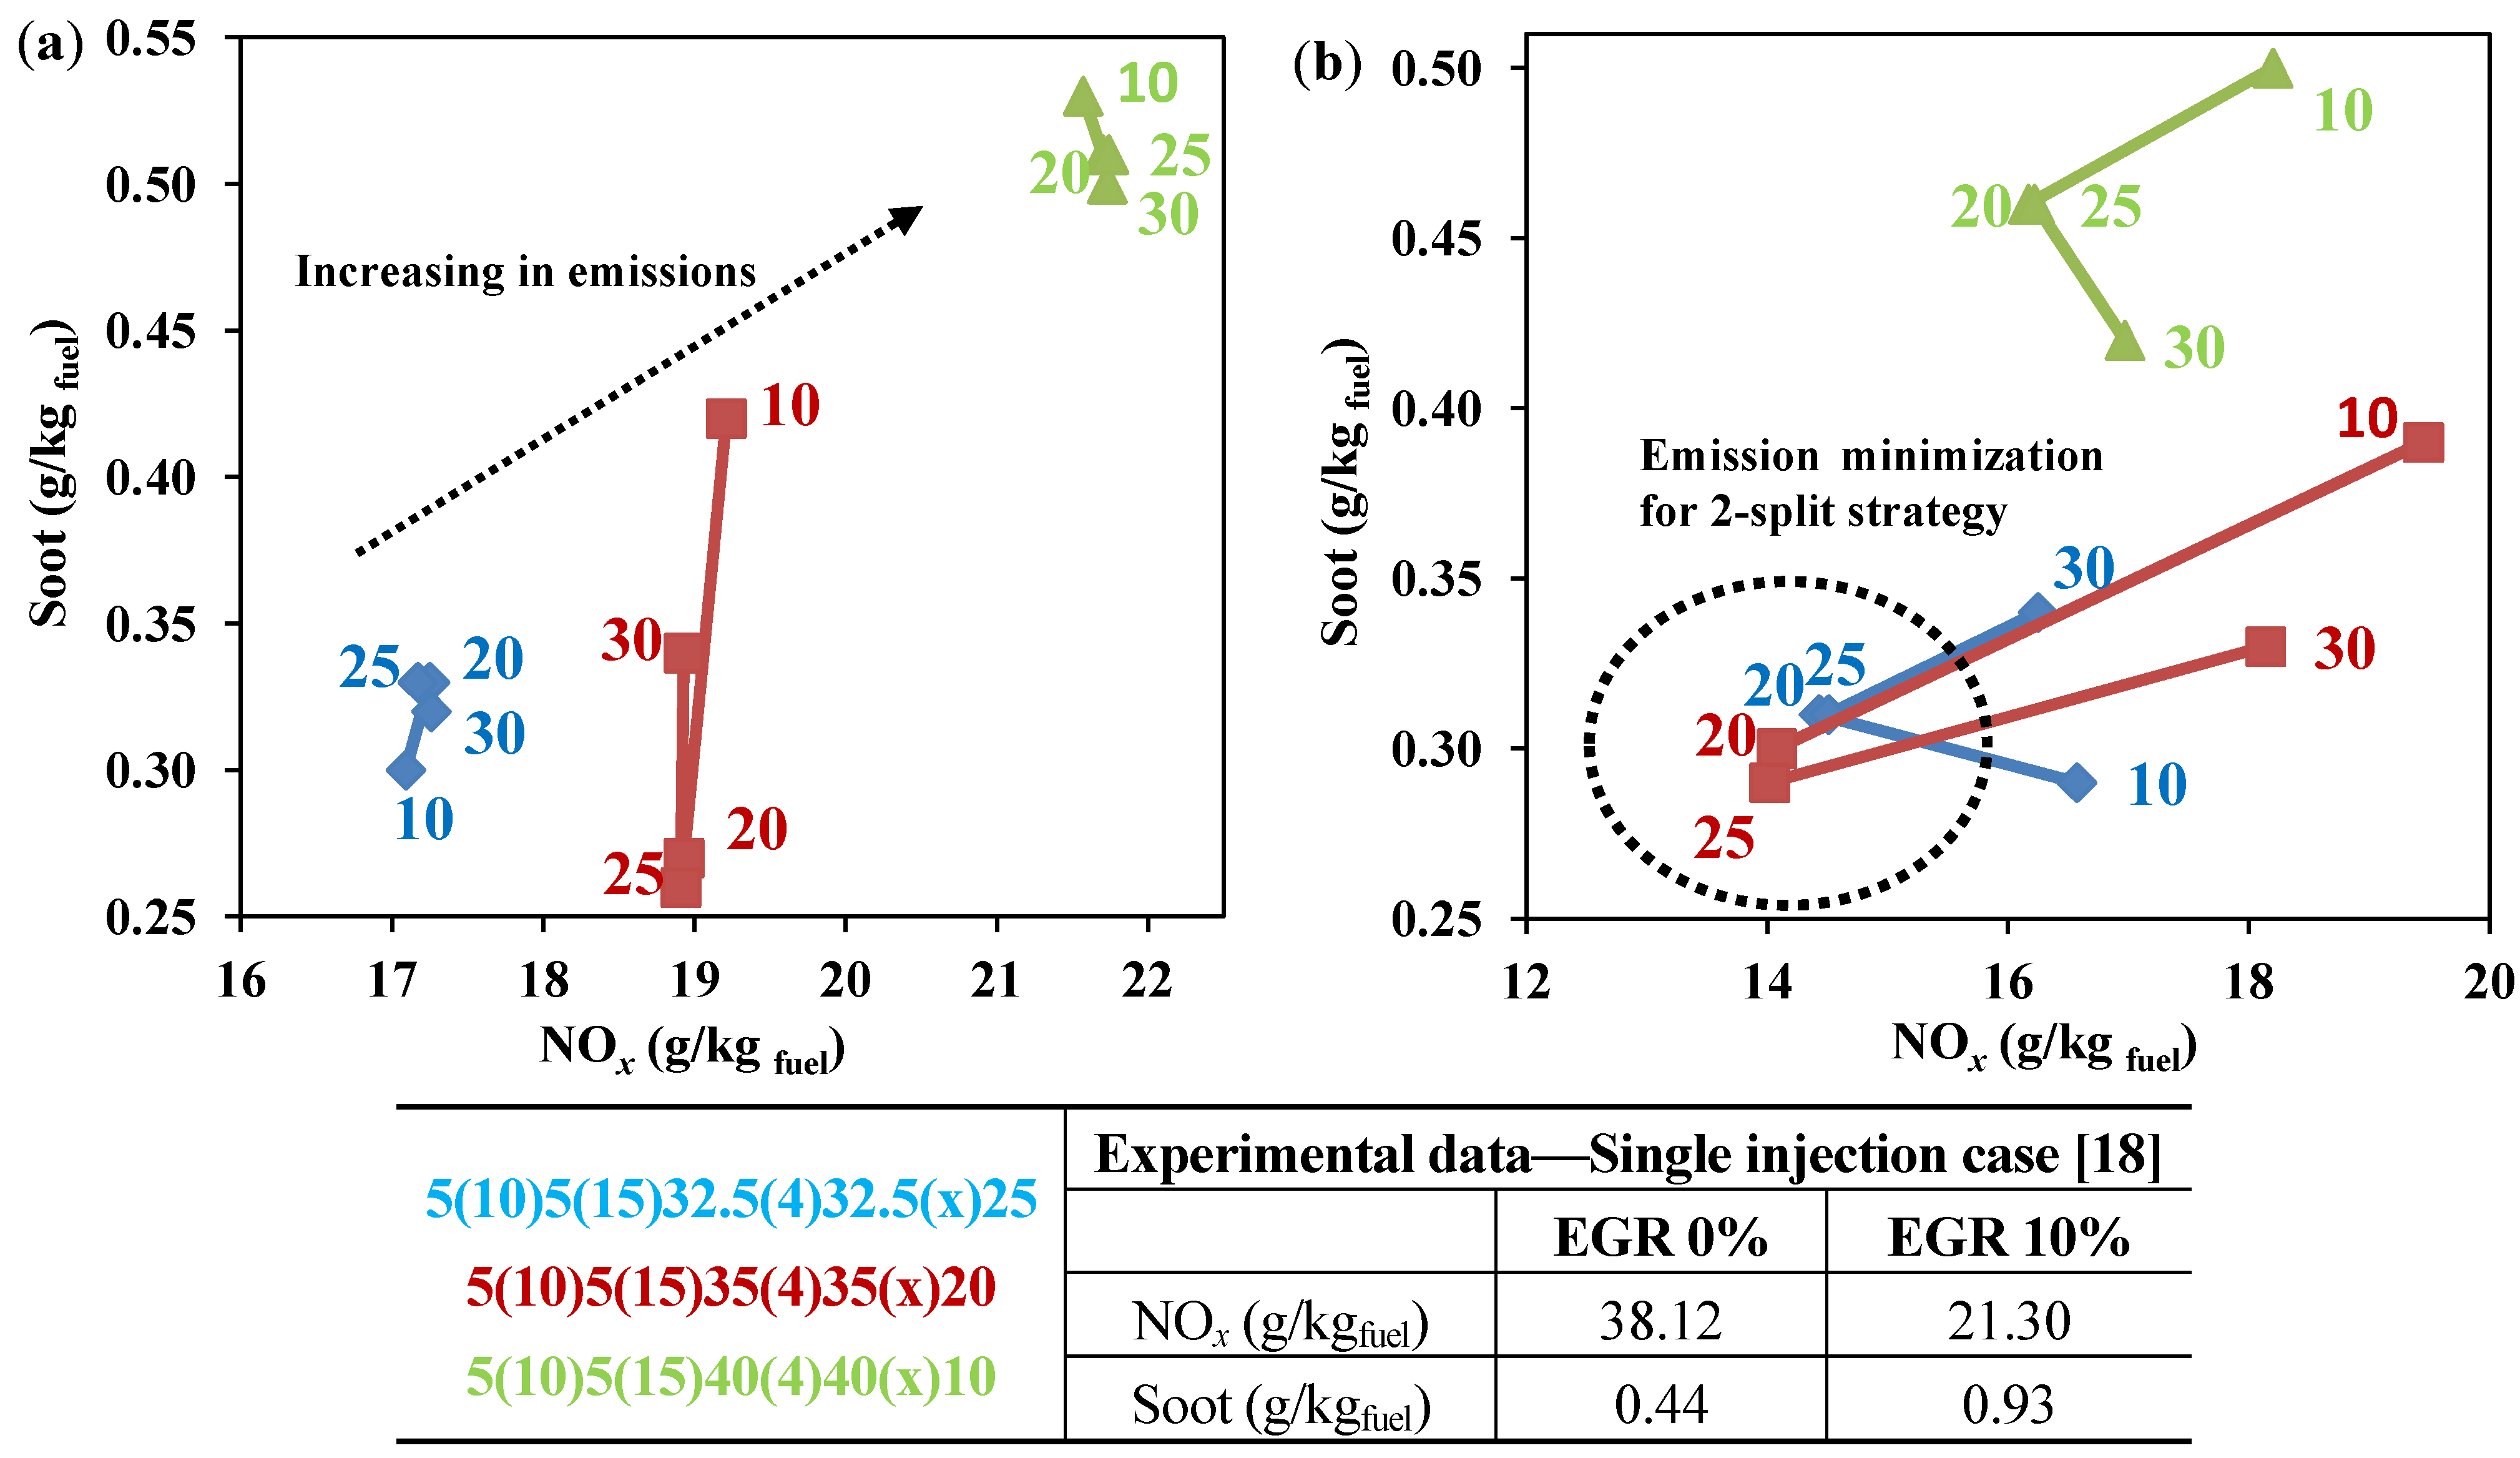
  • NOx abatement for EGR increasing;
  • minimal impact of the main combustion on soot production;
  • maximization of the soot oxidation due to the combustion of an optimized percentage of fuel during the power stroke.
In particular, Scheme 2 with 25% fuel injected during the post pulse offers the lowest emission values. Therefore, it is possible conclude that this value represents an optimization of the amount of fuel to be injected during the “post” phase. Comparing the numerical results with experimental data referred to the single injection case and 0% and 10% EGR, a general reduction of pollutant emissions can be verified. Taking as reference the 10% EGR experimental test, particulate emission has been reduced to about 30% in the best numerical case and to 50% in the worst one. NOx concentrations have been further decreased at both 10% EGR (Schemes 1 and 2) and 20% EGR (for any Scheme). This is the confirmation that the optimization of a multiple injection strategy has got a great impact on the engine performance.
Figure 10 shows the BSFC-NOx trade-off. Depending on indicated mean effective pressure, the minimization of specific consumption is reached when this parameter assumes the highest trend, which is during the Scheme 3. Figure 9b reports a pressure trend comparison between the cases that ensure the highest BSFC for Schemes 1 and 2 (20% EGR) and the case with its lowest value for Scheme 3 (10% EGR).
In addition, numerical results highlight that the multiple injection strategies have minimal impact on BSFC if the post injection is characterized by low fuel percentages: for Scheme 3 and EGR equal to 10%, the BSFC is characterized by a very low variability being its value comprised within the range 176 ÷ 179 g/kWh (Figure 10a).
Figure 10. BSFC for the investigated cases and the EGR values: (a) 10% and (b) 20%.
Energies 06 04331 g010

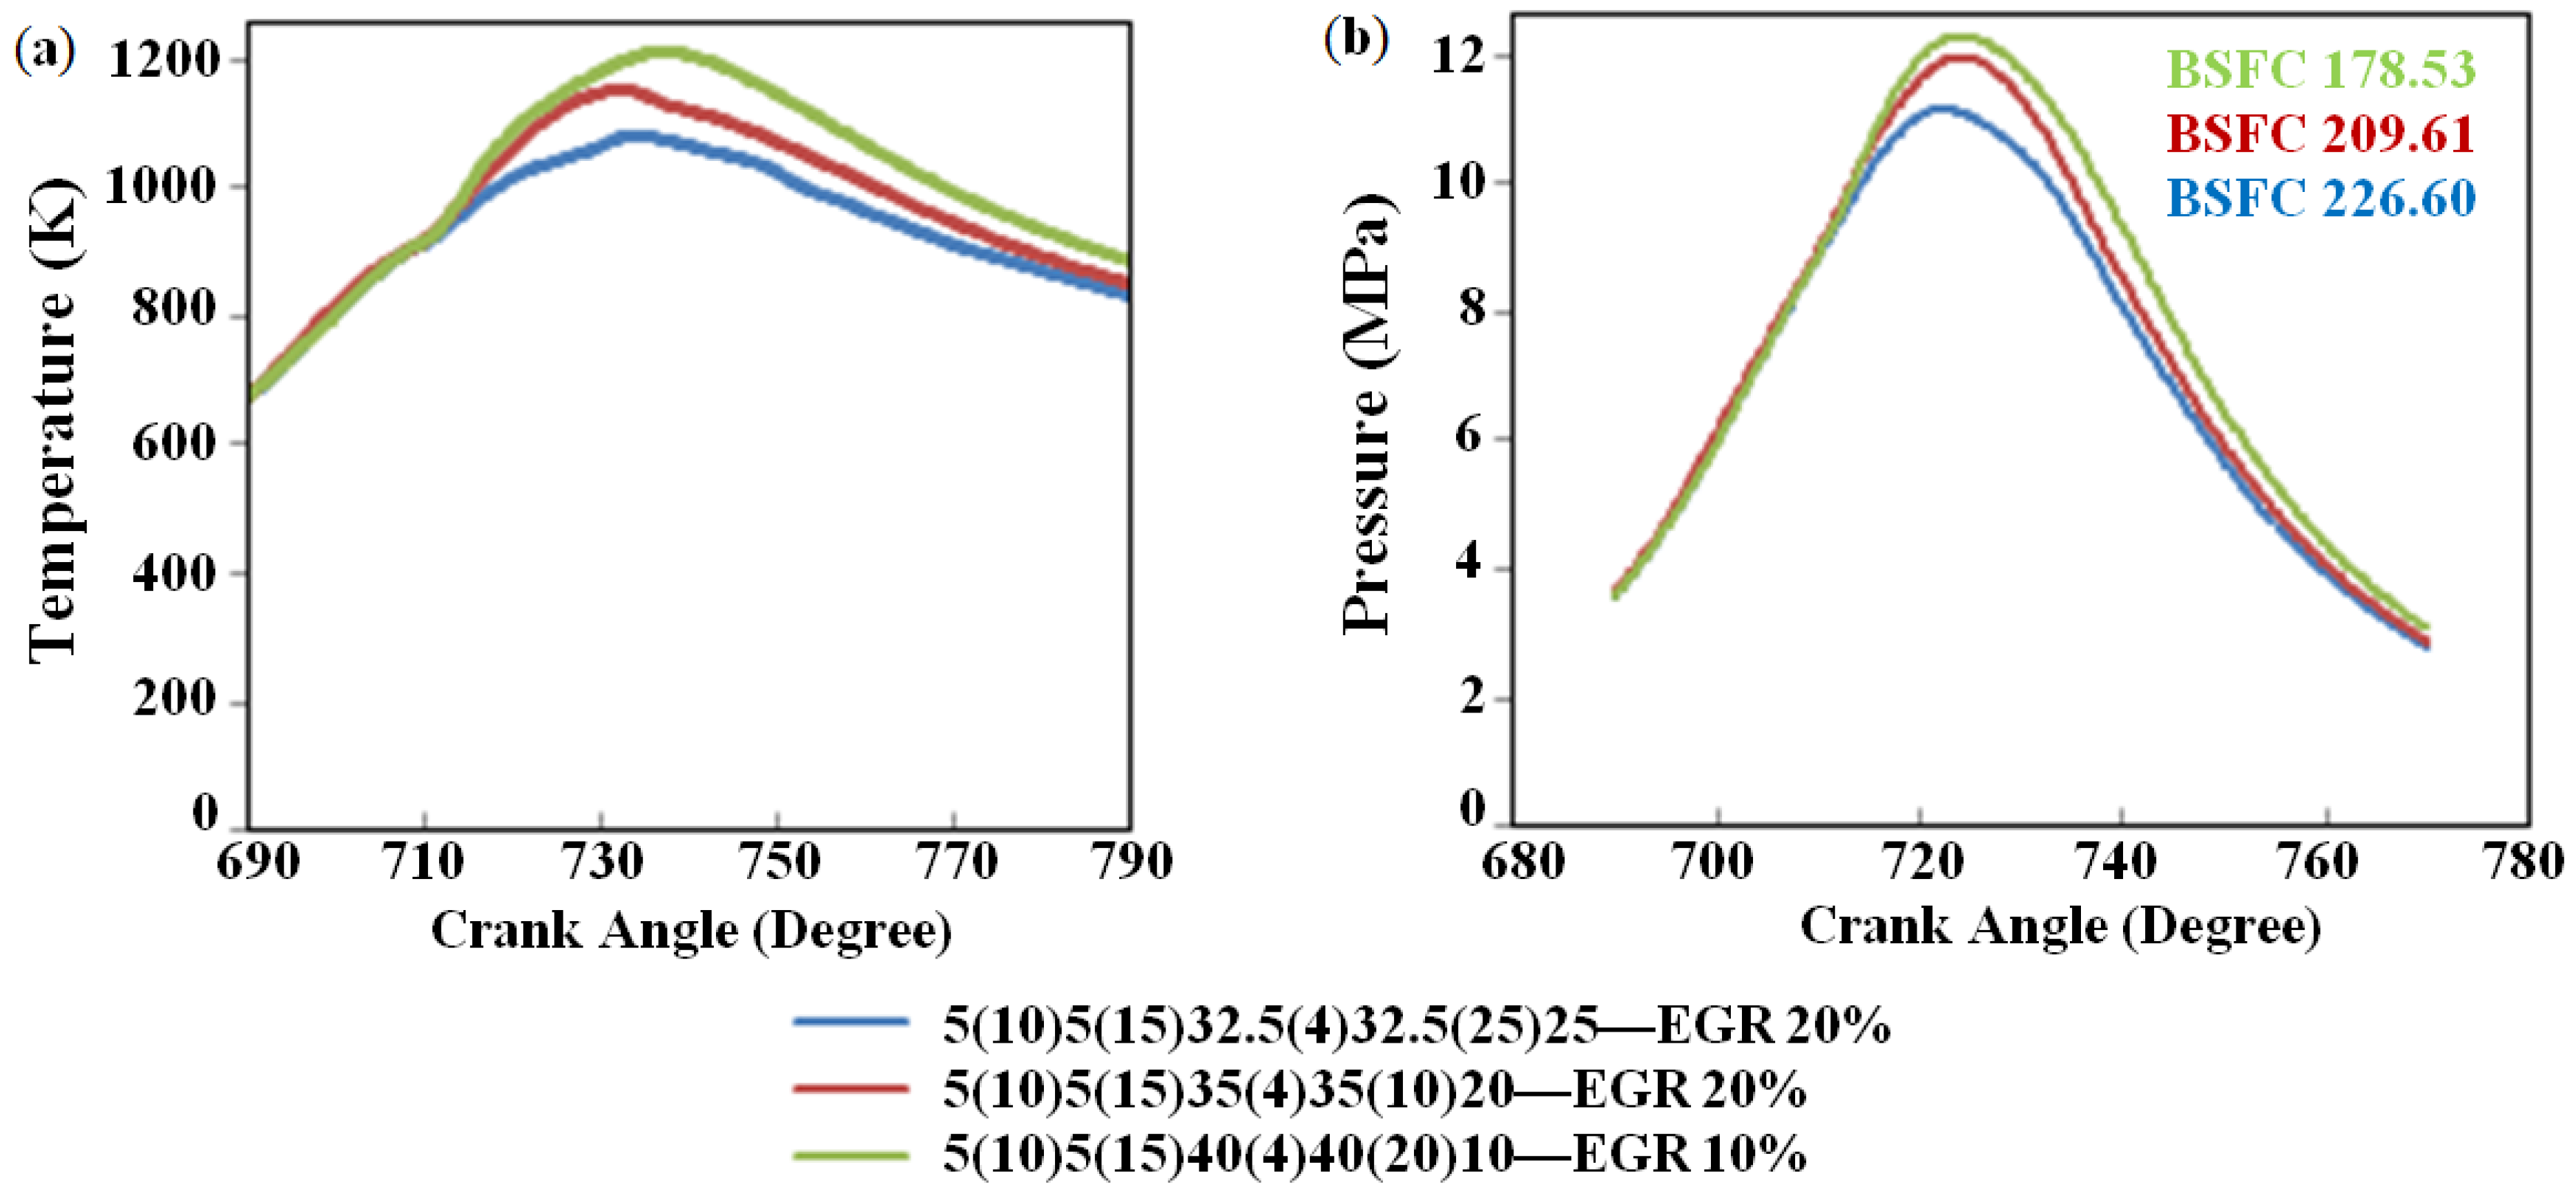
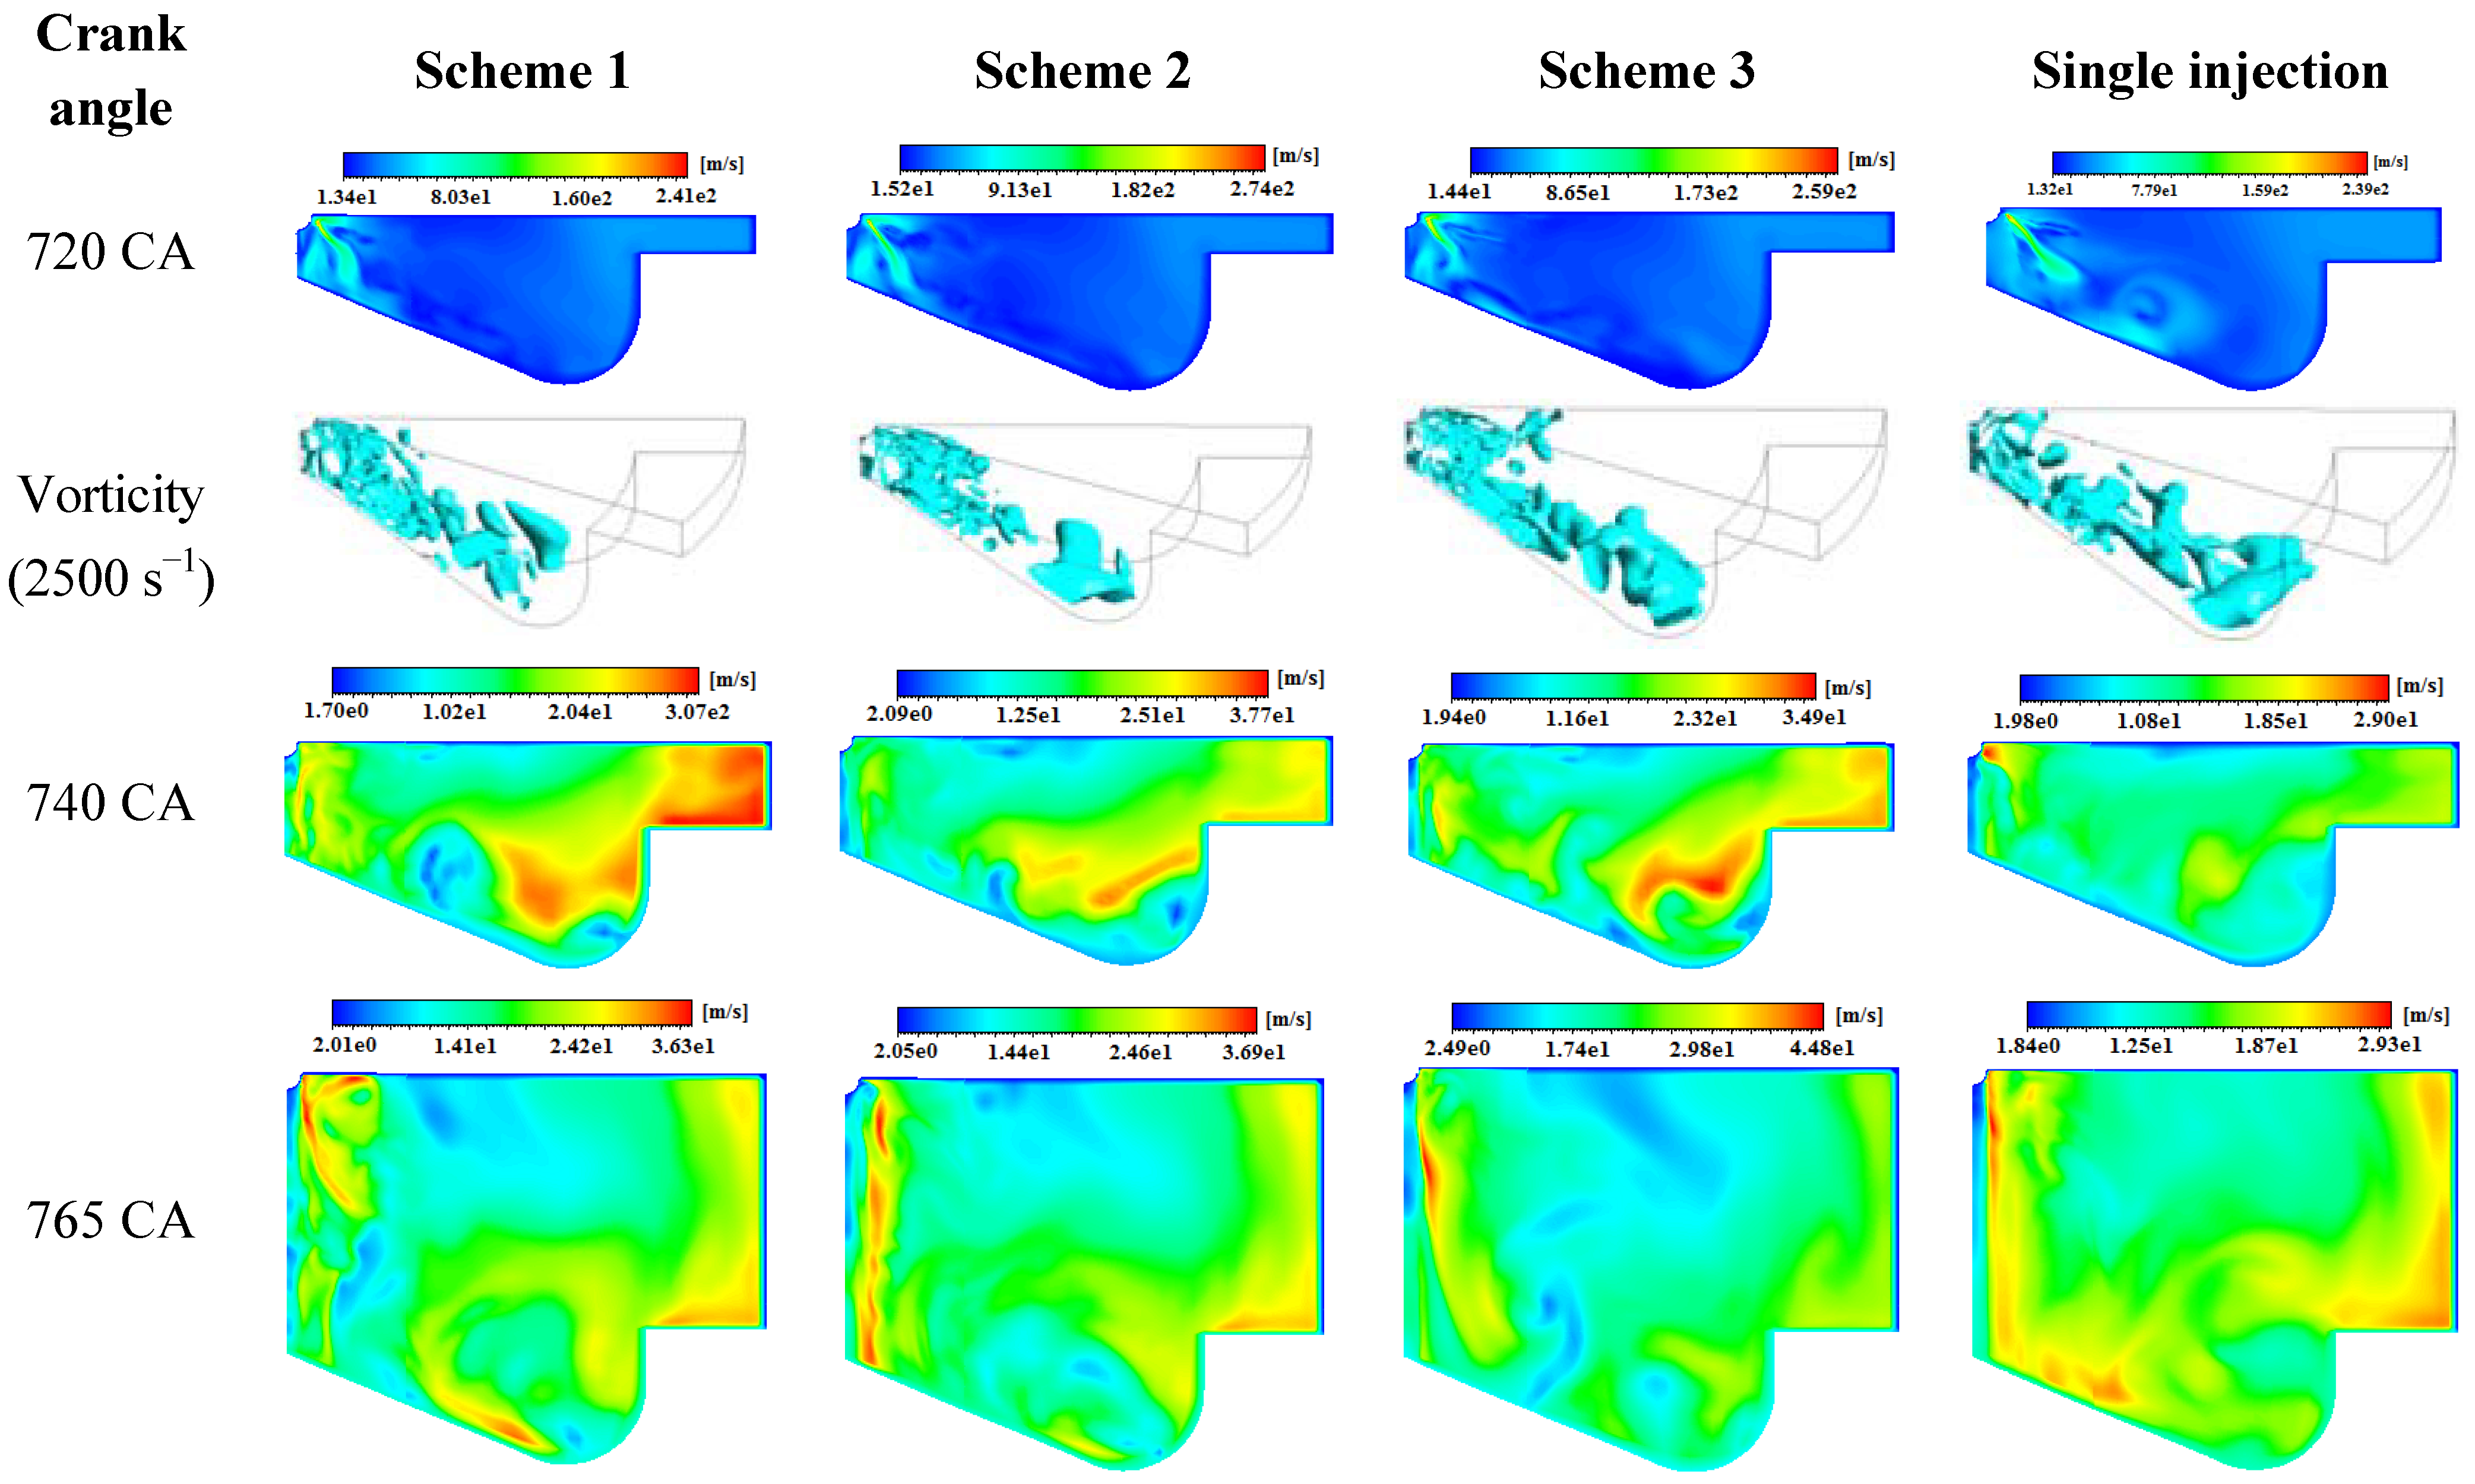
A Fluid Dynamic Overview

The comparison between some important physical characteristics will be discussed in this paragraph with reference to 25 CA dwell between the main and post injection cases and 20% EGR. As said above, this strategy represents the best operative condition for the Schemes 1 and 2, while it is the case that ensures the NOx minimization for Scheme 3.
Increasing the amount of fuel associated with the main injection, the diffusion oxidant mechanism becomes more and more prevalent. This is demonstrated by an increasing of the flame front surface for Scheme 3 which produces a higher NOx production. At the same time, soot emission is penalized by the lower amount of fuel injected during post phase, being lower the oxidation effect on particle nuclei. These mechanisms are shown in Figure 11 where the iso-temperature at 2000 K, the NOx and soot mass fraction contours at 760 CA, so about 10 CA after the end of post injection, have been presented. These contour plots highlight the interaction between temperature and pollutant emissions within the cylinder: it is evident how NOx and soot have their concentration peaks in two different adjacent regions in respect to flame front position.
Figure 11. Iso-Temperature at 2000 K, NOx and soot contour plot at 760 CA.
Energies 06 04331 g011
Figure 12 shows the velocity field contours for the analyzed cases in comparison with the single injection strategy at 720°, 740° and 765° CA. As can be seen, a direct correlation between the multiple injection combustion and the velocity field exists. In fact, a general decreasing of velocity field can be observed in the single injection case, especially after TDC. This means that multiple injections have a significant effect of the fluid-dynamic fields and then on the pollutant emissions, too. Moreover, in Figure 12 the snap-shot of the iso-vorticity at 2500 s−1 has been plotted for the piston at TDC: the swirling structures revel a more extended turbulent effect for multiple injections, especially in proximity of the injector: this is due to the pilot injections combustion and the main injection splitting.
Figure 12. Velocity field contours for the best cases in comparison with the single injection strategy.
Energies 06 04331 g012

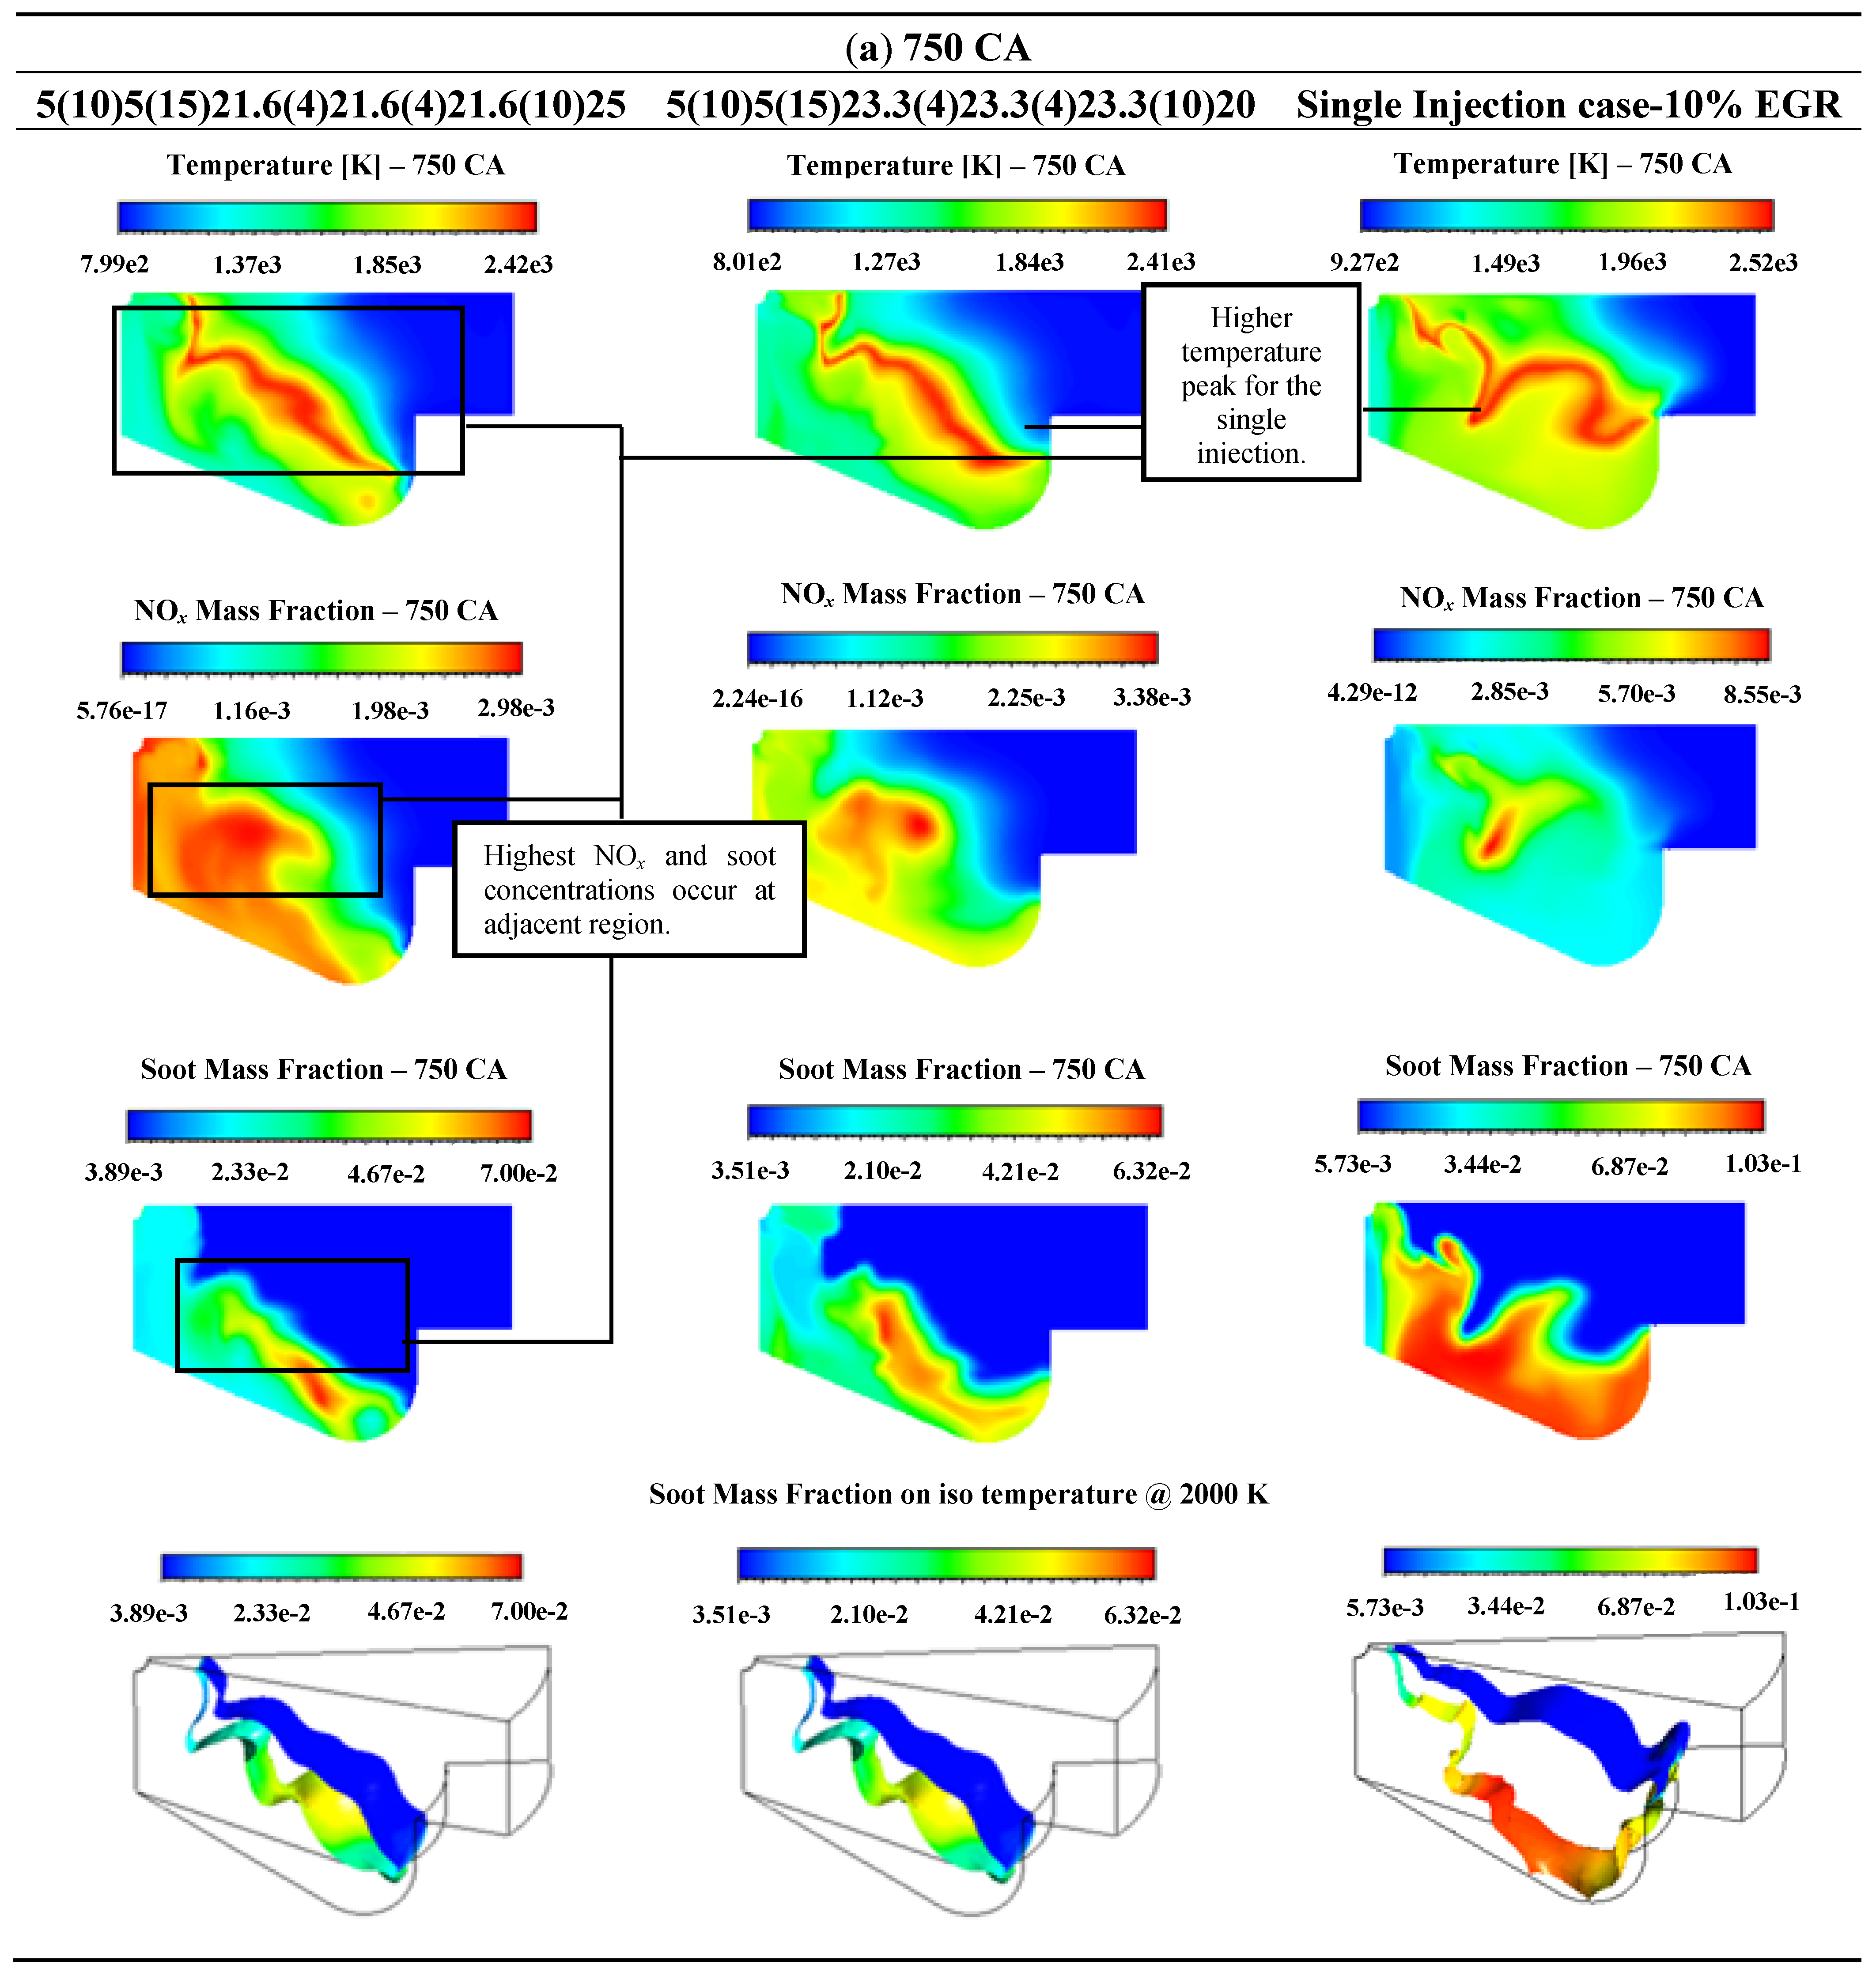
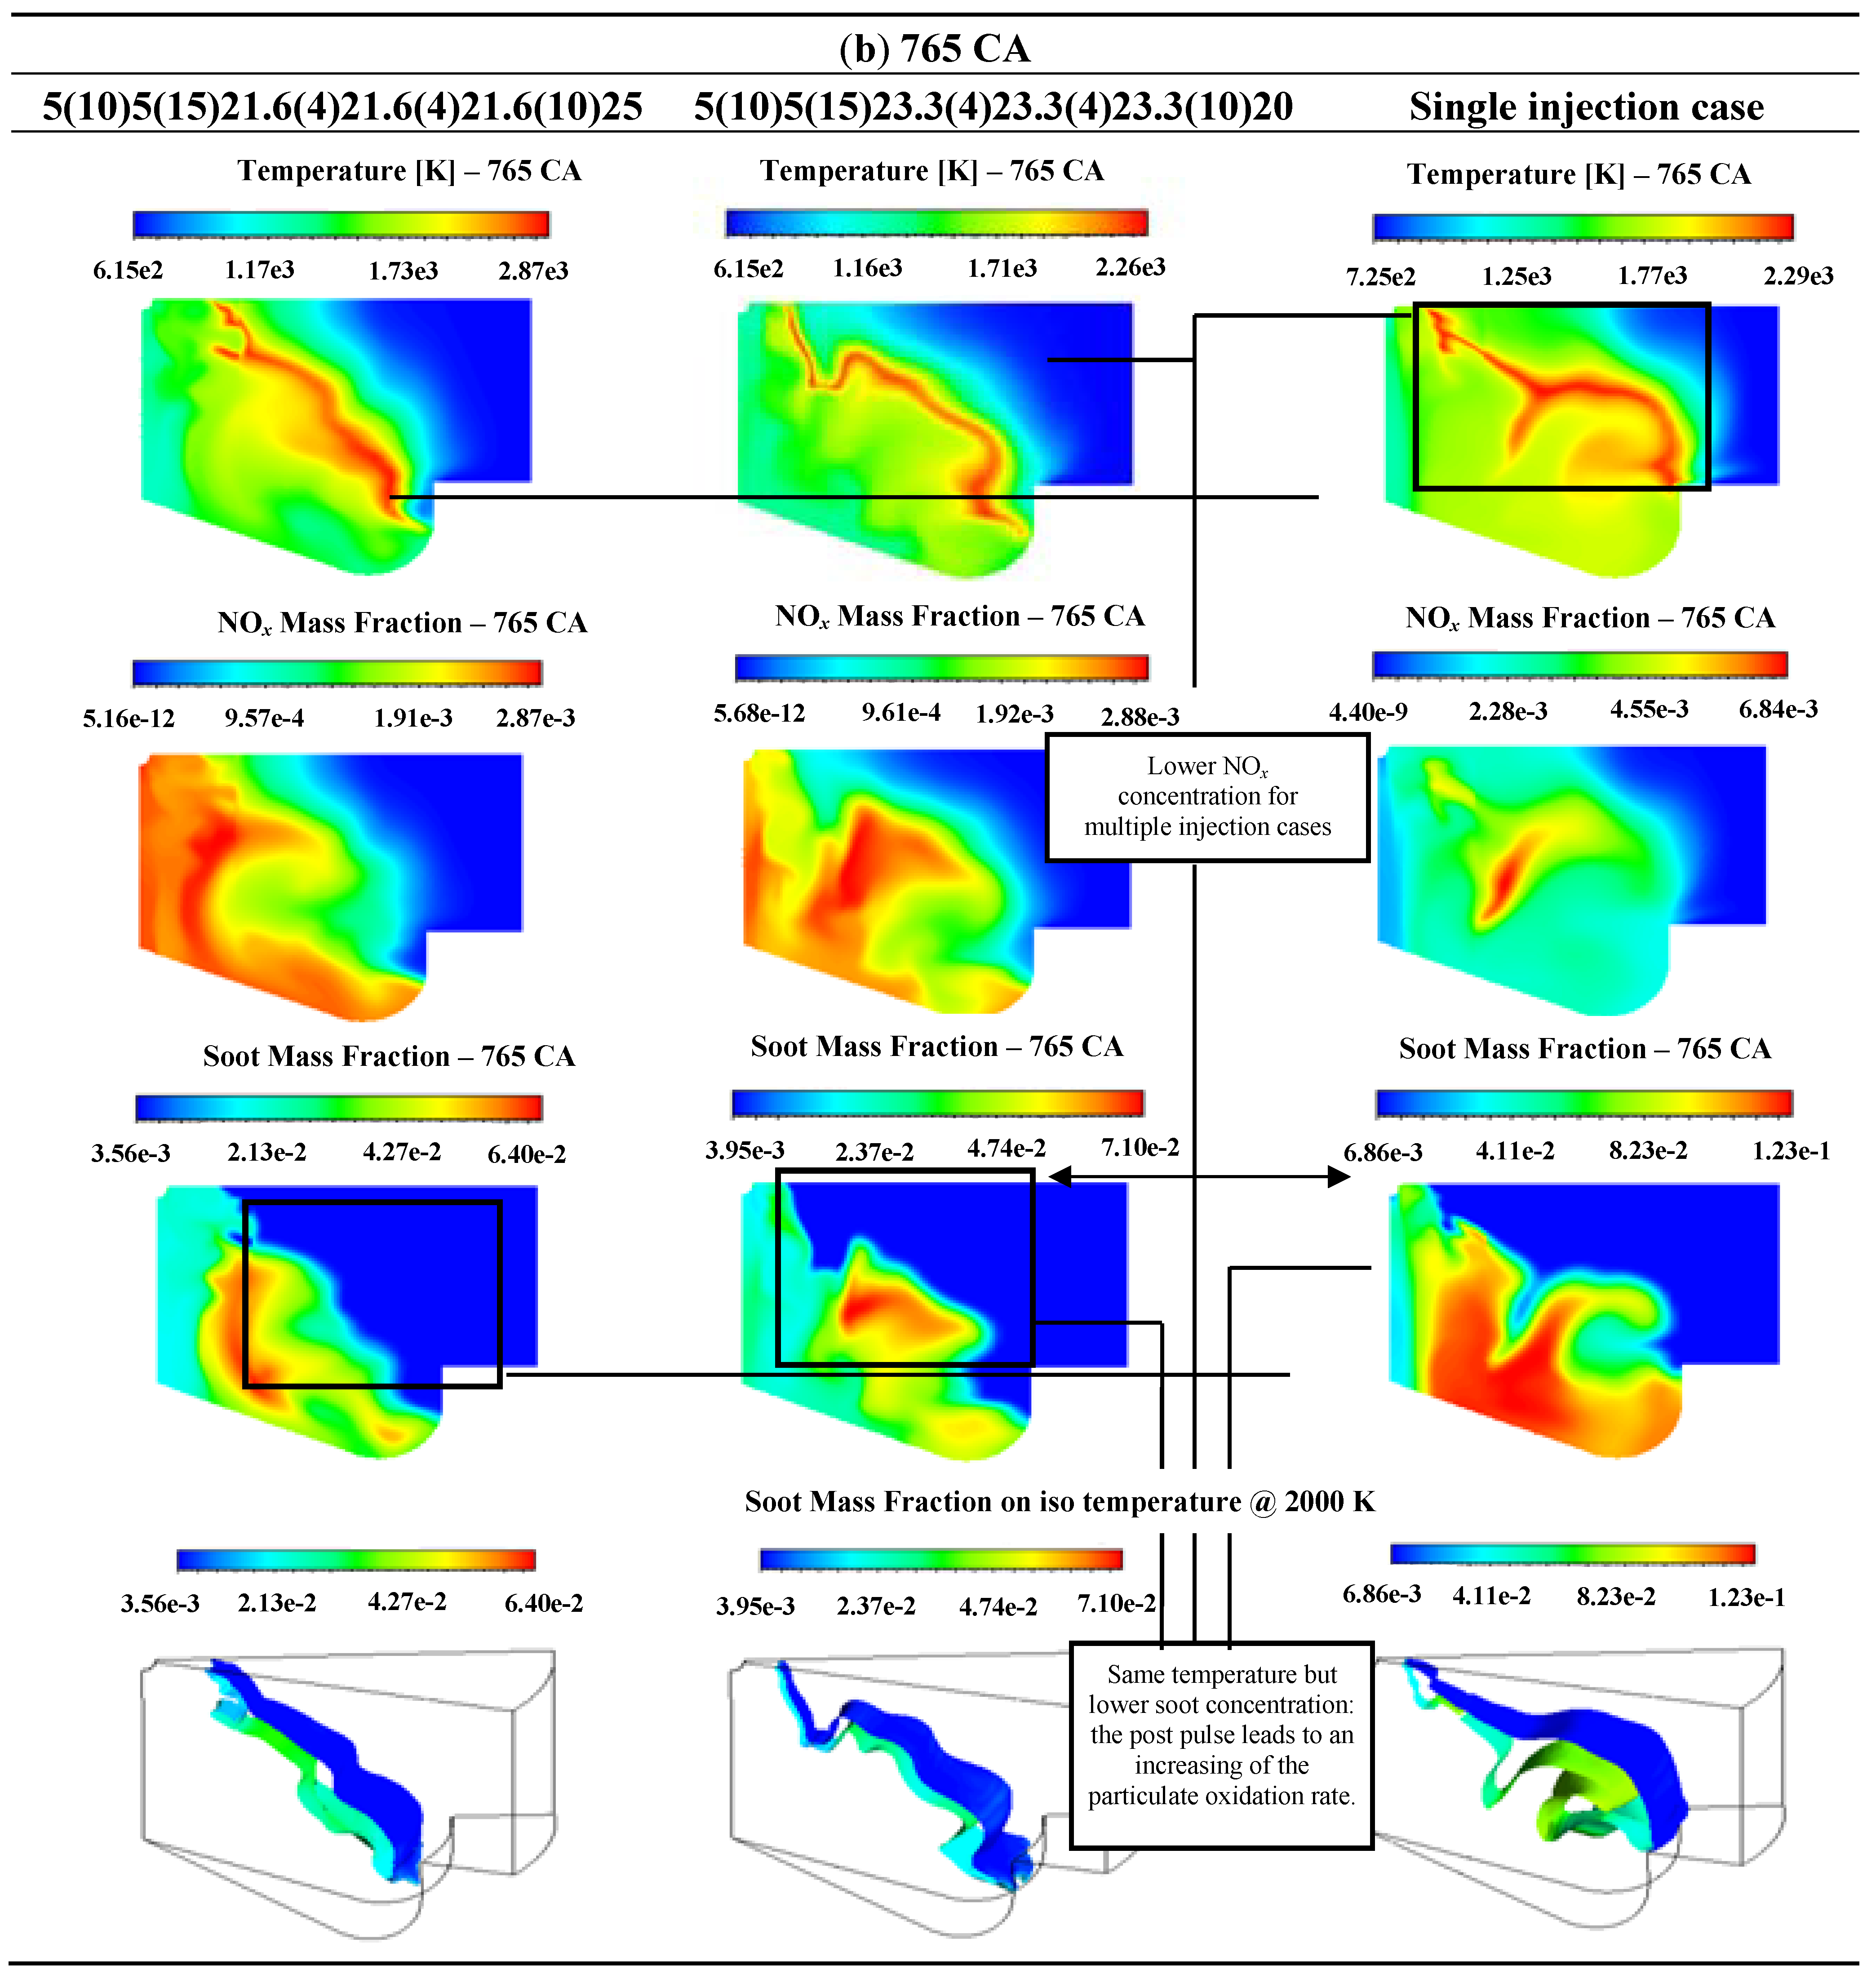
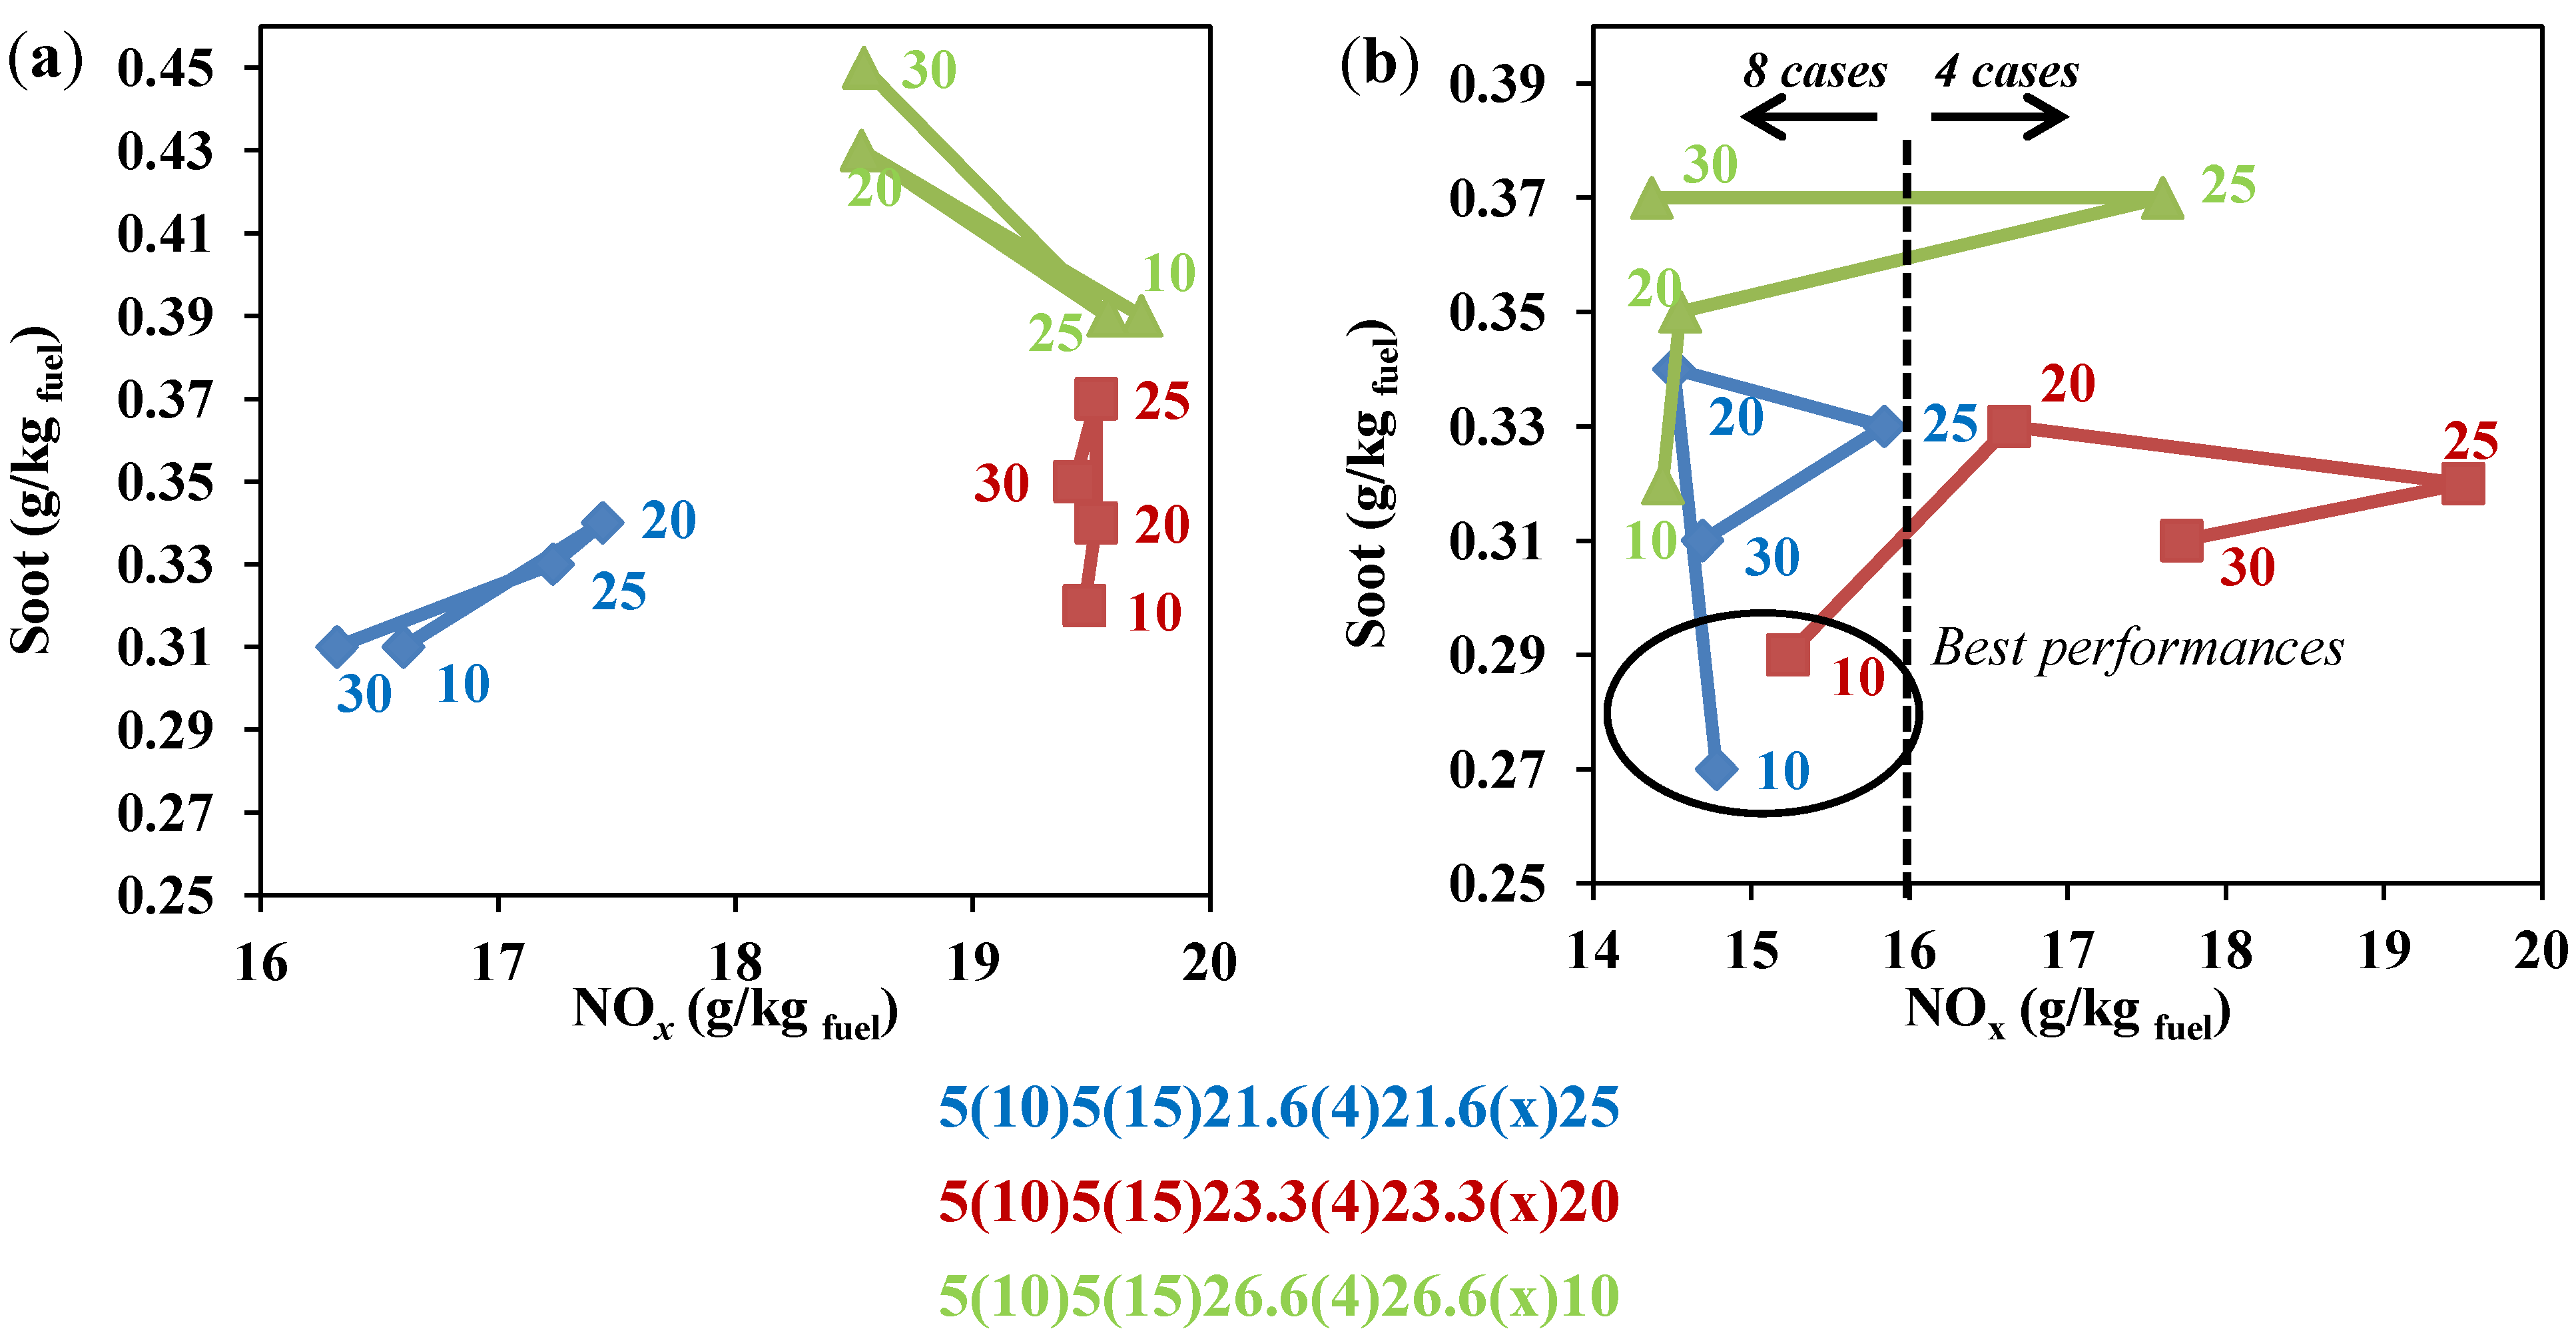
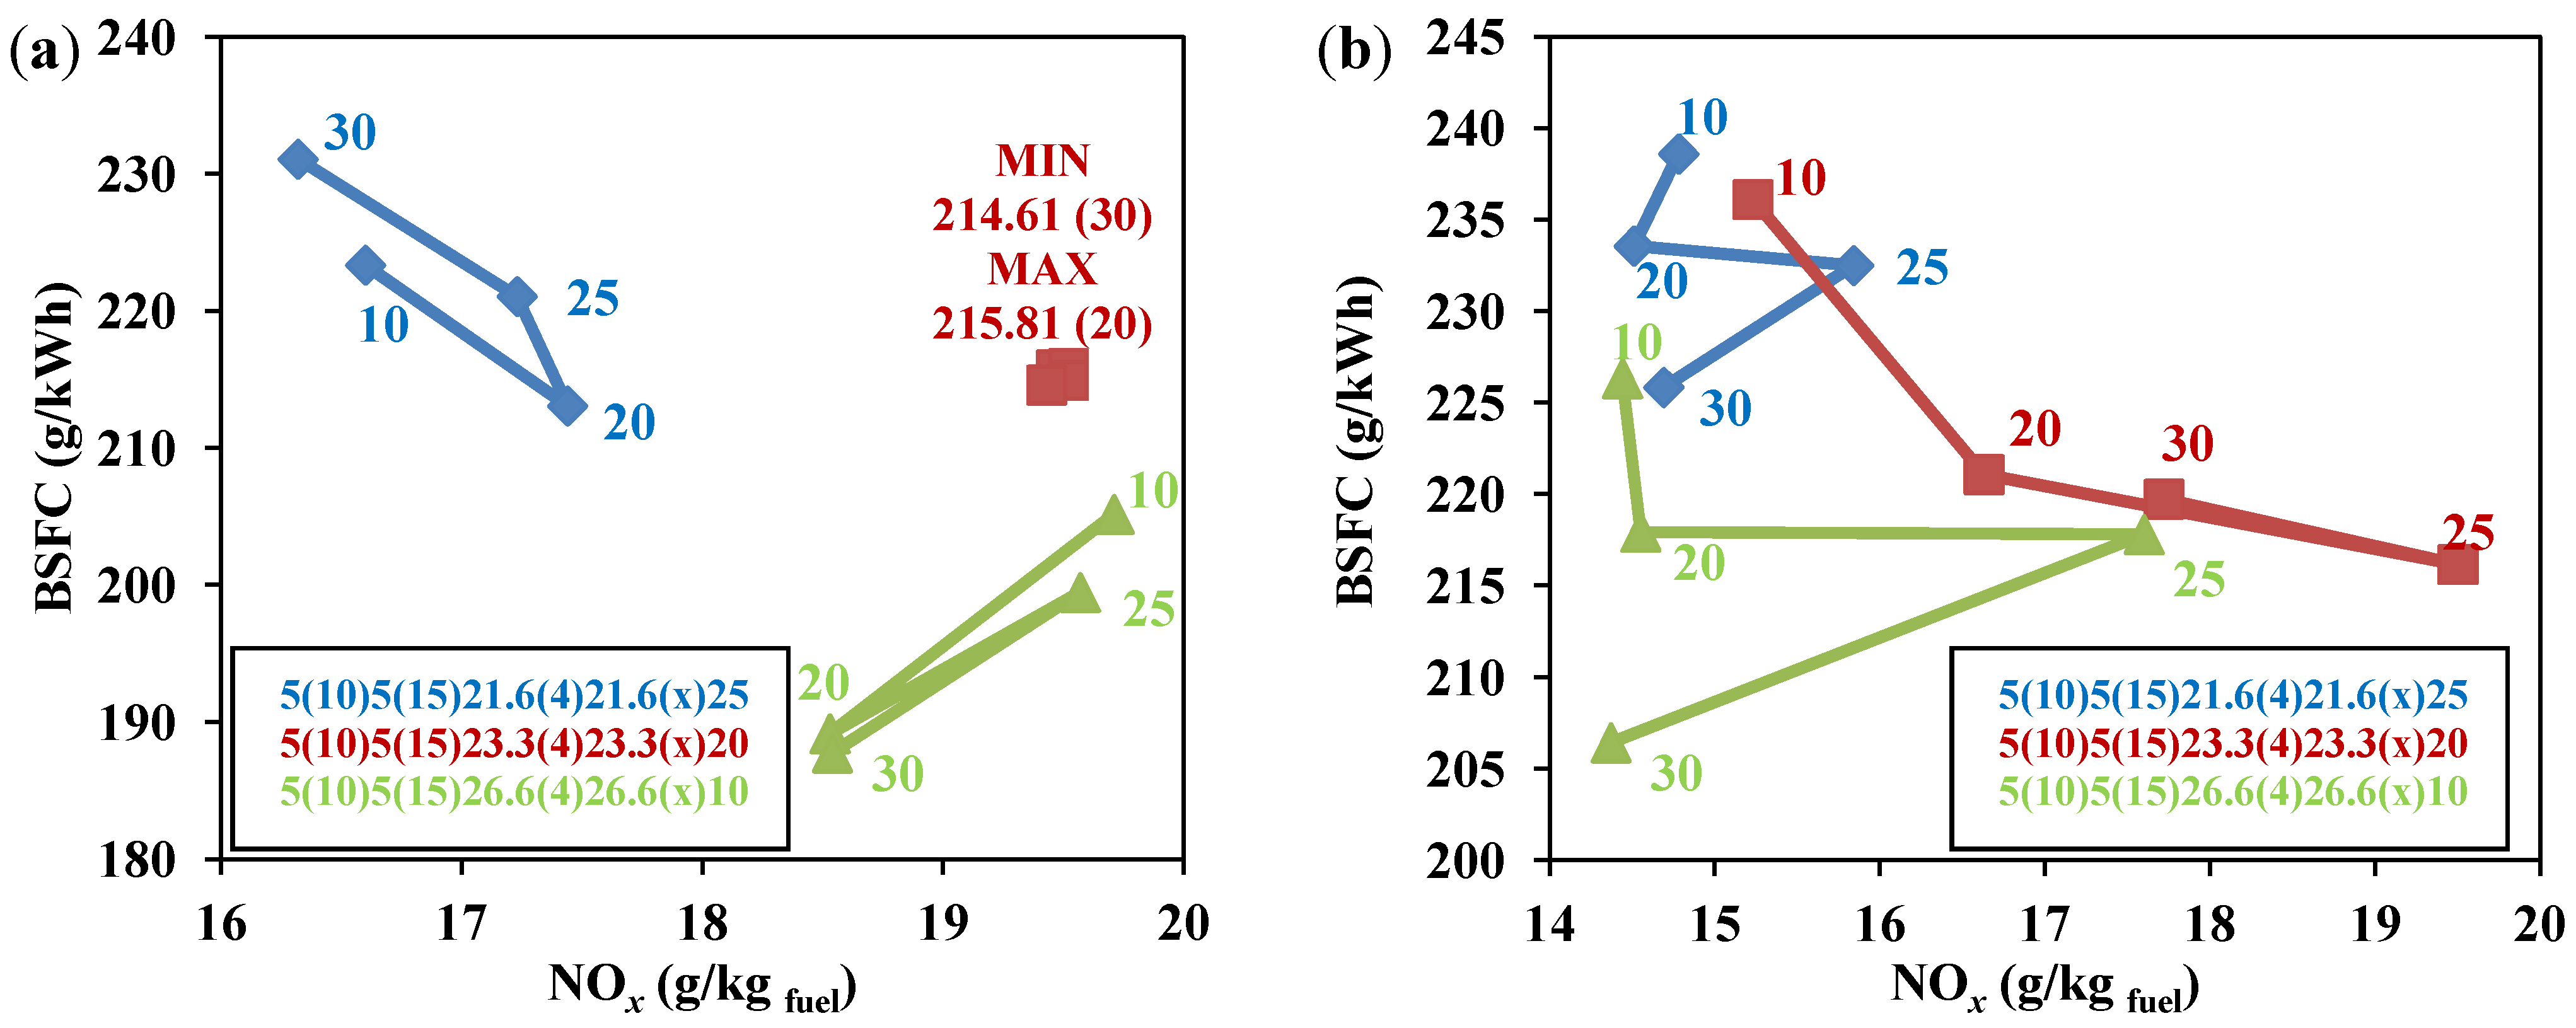
5.2. The Second Multiple Injection Strategy: Splitting the Main into Three Injections

The results for the second multiple injection strategy have been summarized in Figure 13 where the soot-NOx trade-off has been plotted. Focusing attention on 10% EGR configuration, a low variability can be observed for Schemes 1 and 2 about NOx emission in comparison with the results of the previous paragraph. On the contrary, Scheme 3 presents a good improvement for all four different strategies investigated. This means that the splitting has the highest effect on NOx when the highest fuel percentage of the main pulse is injected.
The same results have been obtained for soot emission since Scheme 3 presents a great improvement while Schemes 1 and 2 are characterized by small variations. It can be concluded that through this strategy the soot formation rate significantly decreases because this result cannot be completely associated to the oxidizing action of the small percentage (10%) of fuel injected during post pulse. Nevertheless, it has been confirmed that Scheme 3 produces the highest soot concentration.
With regard to 20% EGR and NOx emission, results show that the most of cases are comprised within the range 14 ÷ 16 g/kgfuel. Therefore, a decreasing trend can be noticed in comparison with 2-split strategy for each Scheme. Also in this case, Scheme 3 seems to have the highest reduction: excluding the case with 25 CA dwell between last main phase and post, in the other cases low concentrations have been reached. As to particulate concentration, simulations revel that for any scheme the lowest value can be obtained for the minimum dwell between main and post. High EGR mass flow rate causes an increase in the ignition delay and shifts the whole combustion process further toward the expansion stroke. Furthermore, this translation is increased splitting the main into three smaller injections. This results in the exhaust gases spending shorter period at high temperature, limiting the NOx formation but reducing the soot oxidation rate. Therefore, burning the post injected fuel immediately after the end of main, a minimization of the soot oxidation rate reduction can be obtained. For Scheme 1, this configuration provides the lowest value ever reached during simulations.
Figure 13. Soot-NOx trade-off for (a) 10% and (b) 20% EGR.
Energies 06 04331 g013
In Figure 13 the two best cases have been highlighted. They ensure a simultaneous minimization of nitrogen oxides and particulate emission. Even if no experimental data with 20% EGR mass flow rate are available, Table 5 reports an analysis of these two simulations performance in comparison with 10% EGR single injection case.
Table 5. Comparison between best simulations and experimental data at 10% EGR.
Pollutant emission5(10)5(15)21.6(4)21.6(4)21.6(10)255(10)5(15)23.3(4)23.3(4)23.3(10)20Single Injection
% EGR202010
NOx (g/kgfuel)14.7815.2921.30
NOx reduction (%)−30.61%−28.21%-
Soot (g/kgfuel)0.270.290.93
Soot reduction (%)−70.96%−68.81%-
Unfortunately, these advantages in terms of pollutant emission reduction involve an increase of fuel specific consumption, as Figure 14 confirms.
Figure 14. BSFC-NOx trade-off for (a) 10% and (b) 20% EGR.
Energies 06 04331 g014

An Insight about Post Injection Pulse

Figure 15 reports the contour plot of different physical quantities at 750 and 765 CA, that is 12 and 27 CA after the end of the post injection for the two best identified cases in comparison with the single injection case. The employed strategies allow to obtain temperature fields characterized by peaks whose extension is just limited to the flame front region while, for the single injection case, the most of cylinder volume has a temperature of about 2000 K or higher. For example, focusing attention on 765 CA engine configuration, the Scheme 1 has a maximum temperature higher than single injection case one (TS1 2870 K vs. TSI 2290 K); nevertheless, the mass averaged temperature is higher in the latter case (TS1 943 K vs. TSI 1231 K). These thermal configurations involve a minimization of the high NOx production rate zones within the cylinder and, consequently, an abatement of its concentrations at exhaust valve opening.
At the same time, the most evident differences can be related to the soot contour plots. Two different points of view have been presented in Figure 15: in addition to temperature and nitrogen oxides, the soot contour plots on the middle plane are shown. They highlight the dislocation of the maximum concentration regions in relation with the thermal field and reveal the strong difference in the numerical values during the power stroke. However, the effect of the post pulse on particulate can be incisively explained through the analysis of the soot concentration within the flame front: the 2000 K iso-temperature has been taken as characteristic surface and it has been colored in function of the soot mass fraction. Despite a high fraction of fuel has just been injected (the post pulse, that is 25% and 20% for the cases under consideration), these contour plots show a lower soot concentration for the multiple injection cases at the same temperature. This means that the main effect of the post injection is to increase the particulate oxidation rate without increasing NOx production.
Figure 15. Temperature, NOx and soot contour plots at (a) 750 CA and (b) 765 CA.
Energies 06 04331 g015aEnergies 06 04331 g015b

6. Conclusions

In the present work, the effect of multiple injections on combustion process has been evaluated in terms of pollutant emission reduction for a heavy-duty diesel engine. The investigated cases concerned not just the injection timing of the various phases but also their fuel fractions for two EGR fractions (10% and 20%). Moreover, the consequences of the main injection splitting into two and three shorter pulses have been appreciated. Comparing the best performance simulations obtained through these two splitting approaches, achieved for 20% EGR, the emission minimization has been always obtained associating 65% and 70% of total fuel to the main injection. Small numerical variations for NOx and soot emissions have been noticed in these cases. However, different dwells between main and post injection led to these results. Splitting the main into three injections, the post pulse had to be advanced (10 CA after last part of main) in comparison with what occurs in the 2-split strategy in order to prevent a soot oxidation rate reduction.
It has been also verified that the 3-split strategy in combination with 20% EGR fraction led to concentrate the most of the investigated cases within a narrow range of NOx concentrations without to increase soot emission. On the contrary, this strategy seems to have its greatest impact in soot emission reduction for the cases characterized by 80% fuel injected through main pulses.
The advantages of the use of these strategies are evident comparing the maximum reduction with the experimental data related to the single injection scheme. Taking as reference the 3-split best cases, a simultaneous reduction of about 30% and 70% has been reached for NOx and particulate, respectively.

Acknowledgment

The authors wish to acknowledge ENEA (Agenzia Nazionale per le nuove tecnologie, l’energia e lo sviluppo economico sostenibile) for providing computational resources.

References

  1. Ferrari, G. Motori a Combustione Interna; [in Italian]; Il Capitello: Rome, Italy, 2008; pp. 482–532. [Google Scholar]
  2. Brijesh, P.; Sreedhara, S. Exhaust emissions and its control methods in compression ignition engines: A review. Int. J. Automot. Technol. 2013, 14, 195–206. [Google Scholar] [CrossRef]
  3. Mendez, S.; Thirouard, B. Using multiple injection strategies in diesel combustion: Potential to improve emissions, noise and fuel economy trade-off in low CR engines. SAE Int. J. Fuels Lubr. 2009, 1, 662–674. [Google Scholar]
  4. Gan, S.; Ng, H.K.; Pang, K.M. Homogeneous charge compression ignition (HCCI) combustion: Implementation and effects on pollutants in direct injection diesel engines. Appl. Energy 2011, 88, 559–567. [Google Scholar] [CrossRef]
  5. Tree, D.R.; Svensson, K.I. Soot processes in compression ignition engines. Prog. Energy Combust. Sci. 2007, 33, 272–309. [Google Scholar] [CrossRef]
  6. Shundoh, S.; Komori, M.; Tsujimura, K.; Kobayashi, S. NOx reduction from diesel combustion using pilot injection with high pressure fuel injection. SAE Spec. Publ. 1992, 895, 25–36. [Google Scholar]
  7. Takeda, Y.; Keiichi, N.; Keiichi, N. Emission Characteristics of Premixed Lean Diesel Combustion with Extremely Early Staged Fuel Injection. In Proceedings of International Fuels & Lubricants Meeting & Exposition, Dearborn, MI, USA, 6–8 May 1996.
  8. Choi, W.; Choi, B.C.; Park, H.K.; Joo, K.J.; Lee, J.H. In-Cylinder Flow Field Analysis of a Single Cylinder DI Diesel Engine Using PIV and CFD; SAE Technical Papers; SAE International: Warrendale, PA, USA, 2003. [Google Scholar]
  9. Arcoumanis, C.; Bicen, A.F.; Whitelaw, J.H. Squish and swirl-squish interaction in motored model engines. J. Fluids Eng. 1983, 105, 105–112. [Google Scholar] [CrossRef]
  10. Baritaud, T. Multi-Dimensional Simulation of Engine Internal Flow, 1st ed.; Editions Technip: Rueil-Malmaison, France, 1998; pp. 234–237. [Google Scholar]
  11. Xi, J.; Zhong, B.J. Reduced kinetic mechanism of n-heptane oxidation in modeling polycyclic aromatic hydrocarbon formation in diesel combustion. Chem. Eng. Technol. 2006, 29, 1461–1468. [Google Scholar] [CrossRef]
  12. Kong, S.C.; Han, Z.Y.; Reitz, R.D. The development and application of a diesel ignition and combustion model for multidimensional engine simulation. SAE Trans. 1995, 104, 502–508. [Google Scholar]
  13. Reitz, R.D. Mechanism of atomization processes in high-pressure vaporizing sprays. At. Spray Technol. 1987, 3, 309–337. [Google Scholar]
  14. Liu, A.B.; Mather, D.; Reitz, R.D. Modeling the Effect of Drop Drag and Breakup on Fuel Sprays; SAE Technical Papers; SAE International: Warrendale, PA, USA, 1993. [Google Scholar]
  15. Cipolat, D. Analysis of energy release and NOx emissions of a CI engine fuelled on diesel and DME. Appl. Therm. Eng. 2007, 27, 2095–2103. [Google Scholar] [CrossRef]
  16. Jafarmadar, S.; Hosenzadeh, M.B. Improvement of emissions and performance by using of air jet, EGR and insulation methods in a DI diesel engine. Therm. Sci. 2013, 17, 57–70. [Google Scholar] [CrossRef]
  17. Ansys Fluent 12.0 Theory Guide. 2009. Available online: https://www.sharcnet.ca/Software/Fluent12/html/ug/node676.htm (accessed on 16 January 2013).
  18. Mobasheri, R.; Peng, Z.; Mirsalim, S.M. Analysis the effect of advanced injection strategies on engine performance and pollutant emissions in a heavy duty DI-diesel engine by CFD modeling. Int. J. Heat Fluid Flow 2012, 33, 59–69. [Google Scholar] [CrossRef]
  19. Hentschel, W.; Ritcher, J. Time-Resolved Analysis of Soot Formation and Oxidation in a Directed-Injection Diesel Engine for Different EGR Rates by an Extinction Method; SAE Technical Papers; SAE International: Warrendale, PA, USA, 1995. [Google Scholar]
  20. Zheng, M.; Reader, G.T.; Hawley, J.G. Diesel engine exhaust gas recirculation—A review on advanced and novel concept. Energy Convers. Manag. 2004, 45, 883–900. [Google Scholar] [CrossRef]

