1. Introduction
Road transportation is responsible for 17% of worldwide emissions of carbon dioxide [
1]. Passenger light-duty vehicles account for 60% of that amount. The number of these vehicles is assumed to double between 2010 and 2035 due to their fast growing number in emerging countries [
2]. Reducing the carbon dioxide emissions of passenger light-duty vehicles is thus a major task necessary for achieving the long-term goal of reducing total carbon dioxide emissions.
1.1. Carbon Dioxide Emissions of a Vehicle
The carbon dioxide emissions of a vehicle (
) depend on the amount of fuel energy required (
), and the specific carbon dioxide emissions of the fuel (
):
The value of
is the mass of carbon dioxide emitted per kilogram of fuel burnt, divided by the lower heating value of the fuel. Using natural gas instead of gasoline or Diesel is the most attractive option, since it reduces the carbon dioxide emissions by 20%–25% for the same fuel energy [
3]. This reduction is based on the composition of natural gas. Since it mainly consists of methane, it has a higher hydrogen-to-carbon ratio than gasoline or Diesel. This higher ratio leads to the lower value of
. For gasoline and Diesel the corresponding value of
is 73 g CO
per mega joule of fuel energy, while the same value for methane is 55 g CO
per mega joule of fuel energy.
1.2. Required Fuel Energy of a Vehicle
The required fuel energy of a vehicle per distance traveled
can be formulated as [
4]:
where
and
represent the energy demand at the wheel. More specifically,
is the dissipative part which is lost in any case, while
is the circulating part, which is lost only if energy is not recuperated during braking. The variable
represents the fuel-to-traction efficiency, and
is the recuperation efficiency.
1.3. Influence of Hybridization
Electric hybridization is one option available to increase both the recuperation efficiency
as well as the fuel-to-traction efficiency
. In [
4], we showed that the potential of hybridization can be exploited with a full parallel hybrid with a moderate hybridization ratio of around 20%. The hybridization ratio is the ratio of electrical power divided by sum of electrical power plus power of the internal combustion engine. For that powertrain configuration, the recuperation efficiency (
) reaches a value around 65%, while the fuel-to-traction efficiency (
) approaches the maximum efficiency of the engine. That result is almost independent of the driving cycle. Higher hybridization ratios do not further reduce the fuel energy required. A further, substantial reduction of the fuel energy required, can be achieved only if the maximum efficiency of the internal combustion engine is increased.
1.4. Dual-Fuel Natural Gas-Diesel Engine
Among all possible natural gas engines, the dual-fuel natural gas-Diesel engine is one of the most promising engine types. It has the potential of achieving Diesel-like efficiencies without the need for a lean nitrogen oxide aftertreatment system. In the dual-fuel engine, the natural gas is injected into the intake manifold. Instead of using a spark plug for ignition, the premixed air-gas mixture is ignited with a small amount of directly injected Diesel fuel. Combustion in dual-fuel engines has been studied by various researchers, see for example [
5,
6,
7,
8,
9,
10,
11].
1.5. Contribution
In this paper we investigate the potential of combining all measures mentioned above to achieve the lowest possible carbon dioxide emissions. First, we use natural gas as the fuel with the lowest specific carbon dioxide emissions. Second, we use a dual-fuel natural gas-Diesel engine to ensure a high combustion efficiency. Third, we use a full parallel hybrid with a sufficiently high hybridization ratio to exploit the potential of hybridization. By hardware-in-the-loop experiments on an engine teste bench, we demonstrate that this combination enables a reduction of carbon dioxide emissions to very low levels for all three vehicles investigated.
By static engine measurements we demonstrate that the natural gas-Diesel engine reaches efficiencies as high as 39.5% without any need for lean nitrogen oxide aftertreatment. The engine is operated lean at low loads with low engine out nitrogen oxide emissions. At medium to high loads the engine is operated stoichiometrically, which enables the use of a three-way catalytic converter.
By hardware-in-the-loop experiments of a non-hybrid vehicle on the the Worldwide harmonized Light vehicles Test Procedures (WLTP), we demonstrate that transient operation of the natural gas-Diesel engine is also possible.
1.6. Outline
The paper is structured as follows:
In
Section 2, the materials and methods used are described, including details on the engine test bench, information on engine control, a description of the measurement devices installed and of calculations based on the measurement results as well as details on hardware-in-the-loop experiments and a description of the component models used.
Section 3 contains the results, including those of static engine measurements of the natural gas-Diesel engine and of the vehicle emulation results.
In
Section 4, a summary is given and conclusions are drawn.
2. Materials and Methods
2.1. Engine Test Bench
All measurements are performed on a 4-cylinder dual-fuel natural gas-Diesel engine with a displacement volume of 2.0 L. The engine is based on a standard Diesel engine equipped with a common-rail Diesel injection system, a turbocharger with variable turbine geometry, and a high pressure exhaust gas recirculation system.
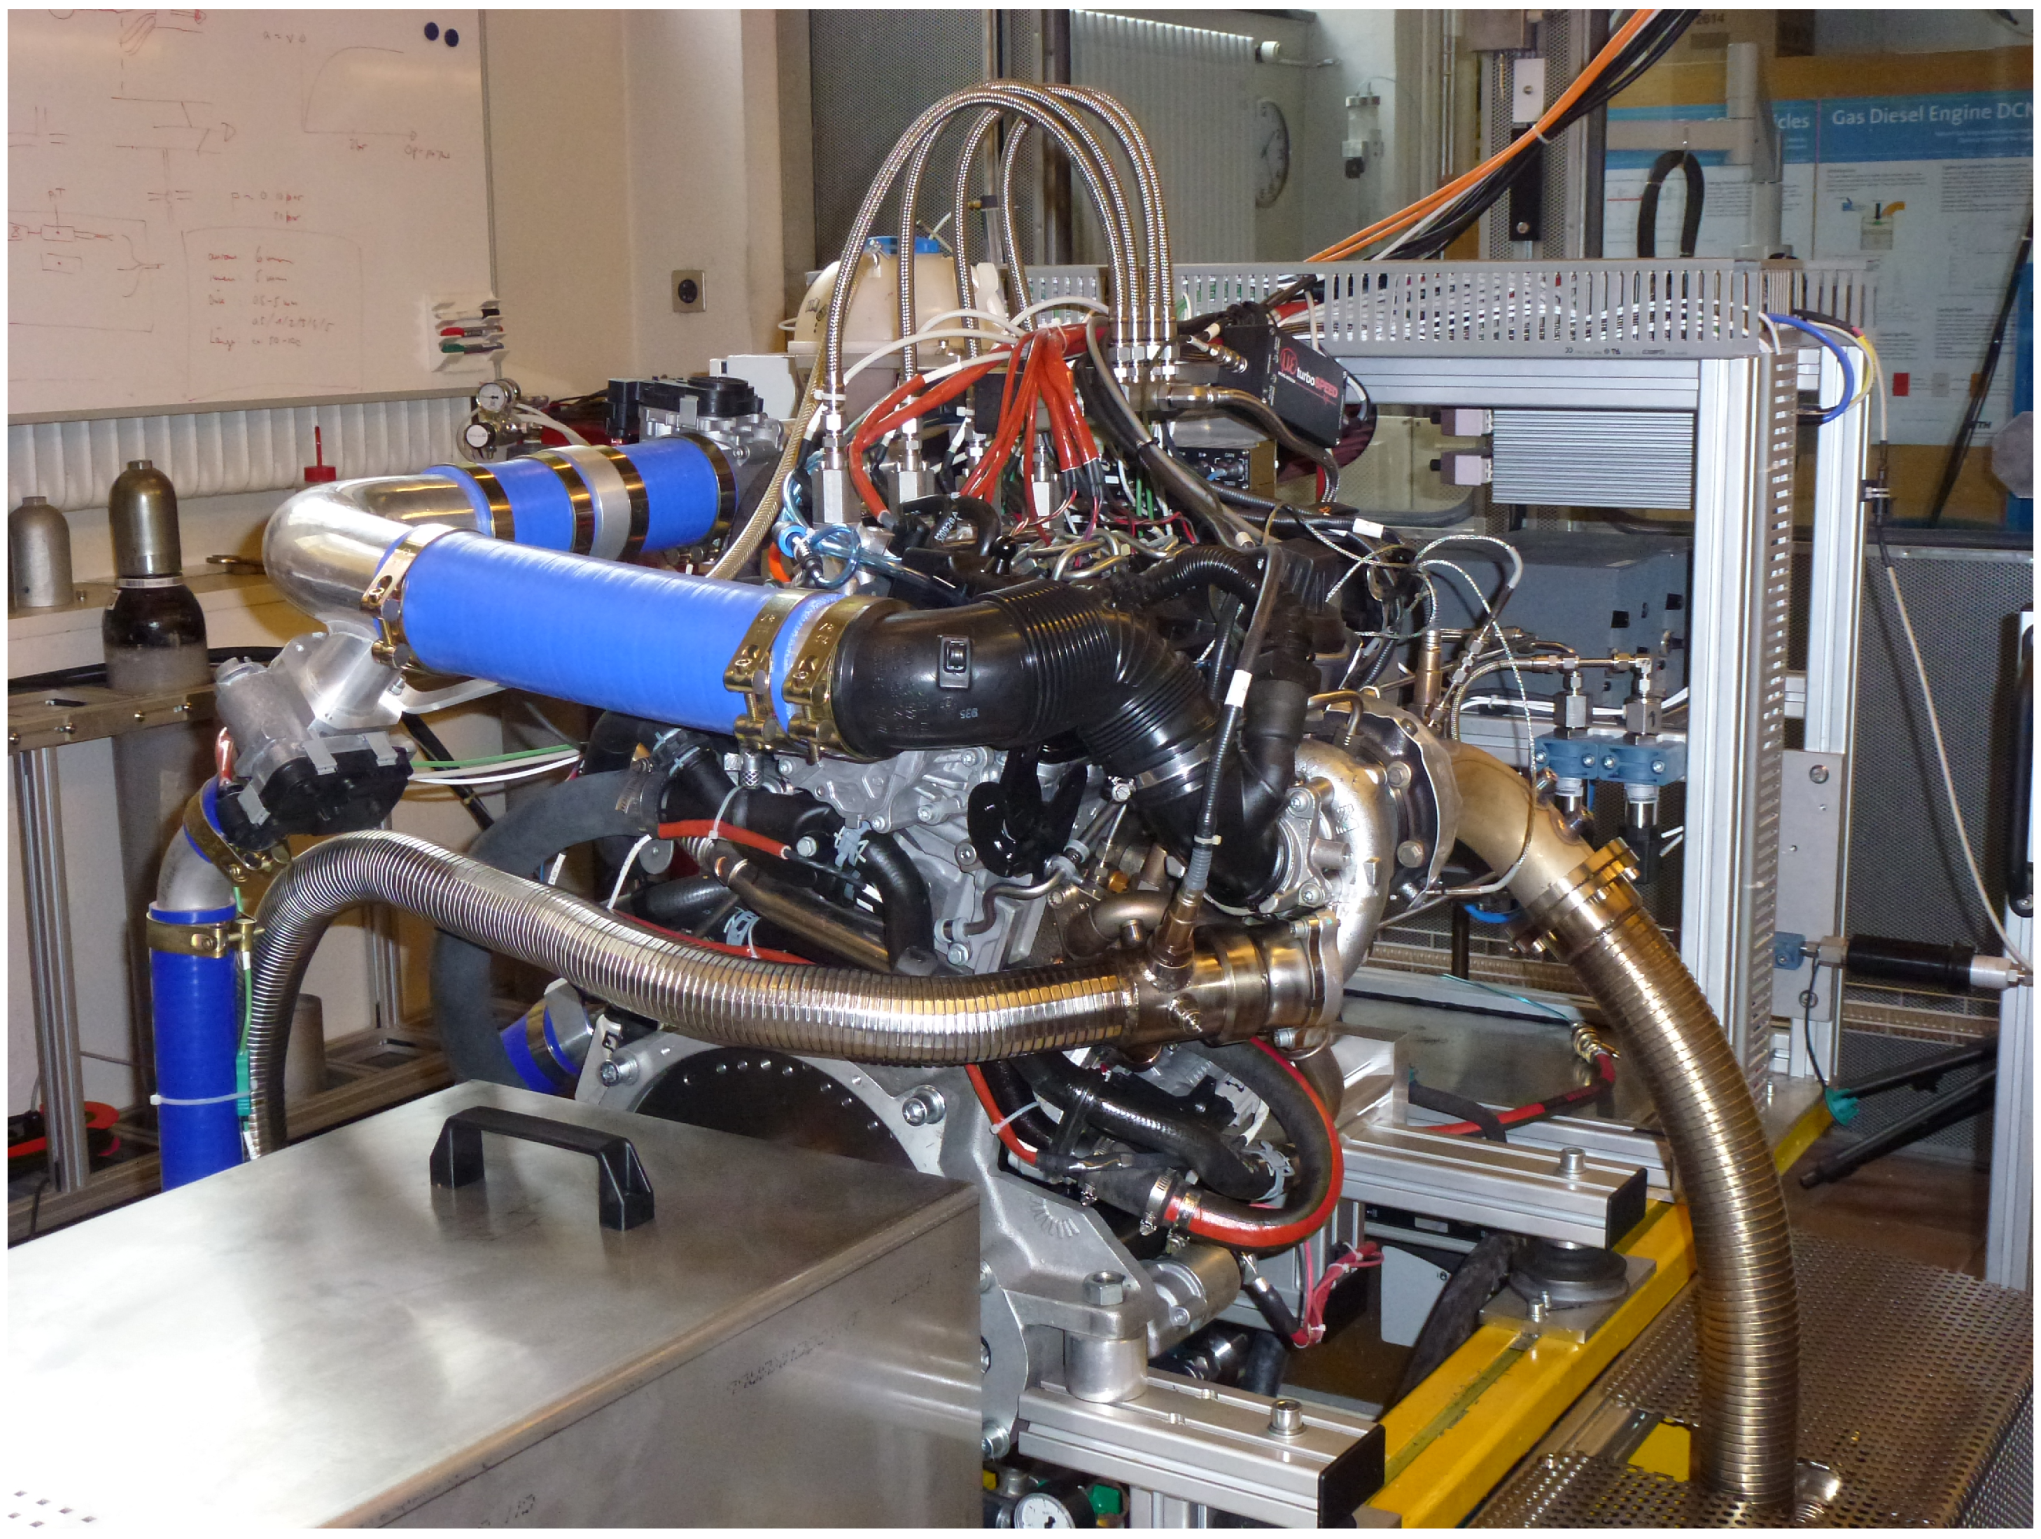
Figure 1 shows a picture of the engine test bench.
Table 1 lists additional details on the engine, while more information on the base engine can be found in [
12]. In comparison with the series production engine, the following modifications have been installed:
port-fuel injection system for gaseous fuels;
low-pressure exhaust gas recirculation system; and
cylinder-pressure sensors in all four cylinders.
Figure 1.
Picture of the test bench.
Figure 1.
Picture of the test bench.
Table 1.
Engine specification.
Table 1.
Engine specification.
| Engine Type | Volkswagen TDI 2.0-475 NE (CJDA), industrial engine |
| Cylinders | 4 |
| Displ. Volume | 1.968 L |
| Bore | 81.0 mm |
| Stroke | 95.5 mm |
| Compression Ratio | 16.5 |
| Injection System | Bosch common rail with piezo injectors |
2.2. Engine Control
In the natural gas-Diesel engine combustion phasing and combustion noise are very sensitive to the start of injection [
5,
6]. The start of combustion depends on the injection time and on the ignition delay of the Diesel fuel. The ignition delay is mainly dependent on the chemical reaction kinetics of the Diesel fuel. This process is very sensitive to small changes in pressure, temperature or cylinder charge composition. To overcome this problem and to ensure a stable engine operation also during transients, we use feedback control of the combustion. The start of injection and the duration of injection of the Diesel fuel are controlled based on the measured cylinder pressure. More details on the controller design can be found in [
13].
2.3. Measurements and Calculations
2.3.1. Measurements
Consumption measurements are performed with pure methane, while all other measurements are performed using natural gas from the grid. The measurement data presented in this paper are obtained using the following measurement devices:
Engine torque is measured with an in-line torque transducer “Vibrometer TG20BP” with a nominal torque of 200 and a maximum measurement torque of 400 ;
Engine speed is measured with an incremental angular encoder “Haidenhein ROD 426” with 1800 pulses. The encoder is connected to the crankshaft of the engine;
Diesel consumption is measured with a scale “Mettler Toledo MS 6002S/01” with a resolution of . The Diesel consumption is the difference of the weight of the Diesel tank between the start and the end of the measurement;
Gas consumption is measured with a coriolis mass flow meter “Rheonik RHM015”. Its signal conditioning unit generates a pulse every . Total gas consumption is obtained by summing up these pulses. Total gas consumption is additionally measured with another scale “Mettler Toledo MS 32001L/01” with a resolution of . The consumption is the difference of the weight of the gas bottle between the start and the end of the measurement;
Nitrogen oxide emissions are measured with a “Continental Smart NO Sensor”, and with a “Cambustion fNOx 400”;
Air-fuel ratio is also measured with the same “Continental Smart NO Sensor”;
Soot is measured with an “AVL Micro Soot Sensor”.
2.3.2. Calculations
Based on the measurements described above, the following quantities are calculated:
Engine Efficiency is calculated based on the following Equation:
where
is the measured gas consumption,
is the measured Diesel consumption,
is the measured engine torque,
is the measured engine speed and
are the lower heating values of Diesel and gas, respectively. The lower heating values of the fuels investigated are listed in
Table 2.
Table 2.
Fuel Properties.
Table 2.
Fuel Properties.
| Parameter | Diesel | Methane | Natural Gas |
|---|
| Lower heating value (MJ/kg) | 43.1 | 50.02 | 46.11 |
| Mass emitted per mass of fuel burnt (-) | 3.16 | 2.74 | 2.61 |
Gas Ratio is the energetic gas ratio with respect to the total fuel energy. The ratio is calculated based on the following Equation:
Nitrogen oxide emissions are measured in parts per million. To convert that value to gram per kilowatt hour, the following assumptions are made:
- -
NO only consists of NO;
- -
Diesel is represented by ; and
- -
Air consists of 21% and 79% .
The products of a complete combustion with sufficient or excess air thus are:
where
and
are the mole numbers of gas and Diesel. Therefore,
where
is the measured gas consumption,
is the measured Diesel consumption,
denotes the molar mass and
λ is the measured air fuel ratio.
Soot is measured in milligram per cubic meter with respect to standard temperature and pressure. The conversion to milligram per kilowatt hour is similar to the conversion of the nitrogen oxide emissions:
Carbon dioxide emissions are calculated based on the measured fuel consumption:
where
is the mass of
produced by complete combustion of 1
Diesel, while
is the corresponding value for gas. The actual values are shown in
Table 2.
2.4. Vehicle Emulation (Hardware-in-the-Loop Experiments)
The fuel consumption of a vehicle equipped with a natural gas-Diesel engine is determined with hardware-in-the-loop experiments, also called vehicle emulation.
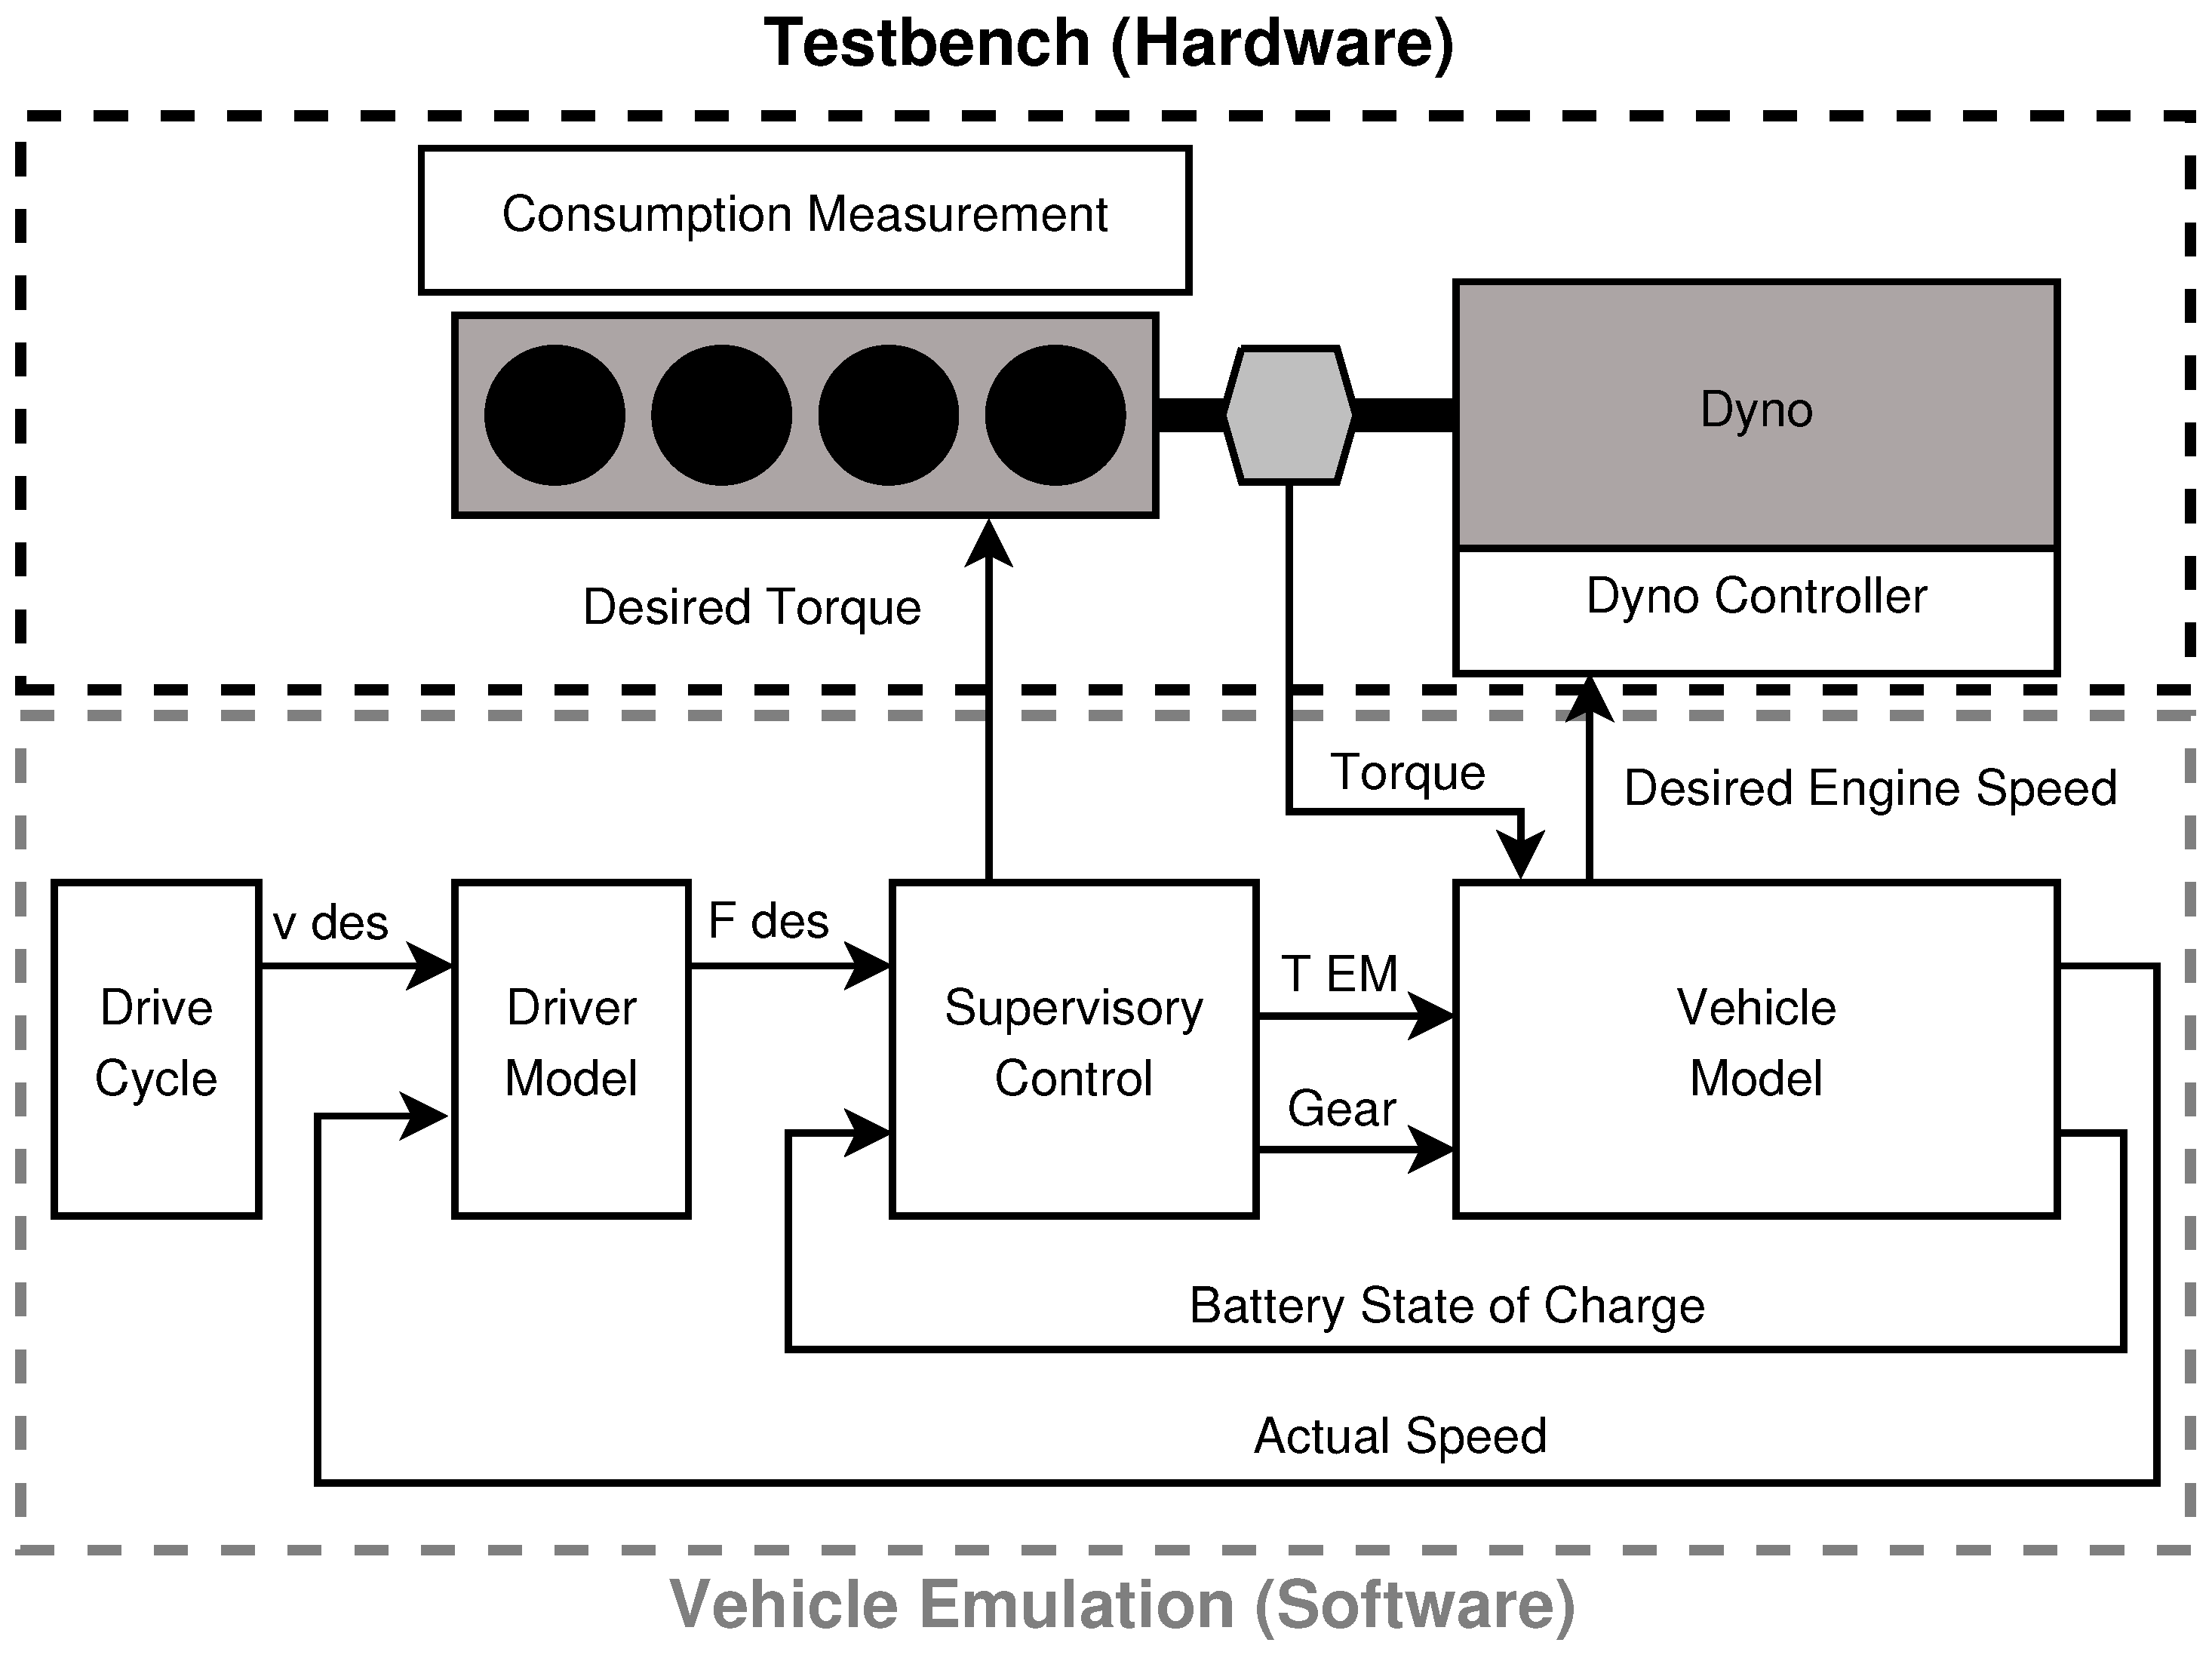
Figure 2 shows a schematic drawing of the setup. The figure shows the emulation structure for a hybrid-electric vehicle. The internal combustion engine is connected to a dynamometer with high bandwidth. The rest of the powertrain as well as the vehicle are simulated. The measured torque of the engine is fed to the vehicle model. The output of the vehicle model consists of the actual vehicle speed and the engine speed. The engine speed of the vehicle model serves as input to the controller of the dynamometer which sets the speed of the dynamometer. The modelled driver ensures that the vehicle velocity is kept at the prescribed speed of the driving cycle. The supervisory controller determines the torque split between engine and electric motor and the desired gear. For more information on vehicle emulation, see for example [
14,
15,
16,
17].
Figure 2.
Vehicle emulation structure.
Figure 2.
Vehicle emulation structure.
2.4.1. Powertrains Investigated
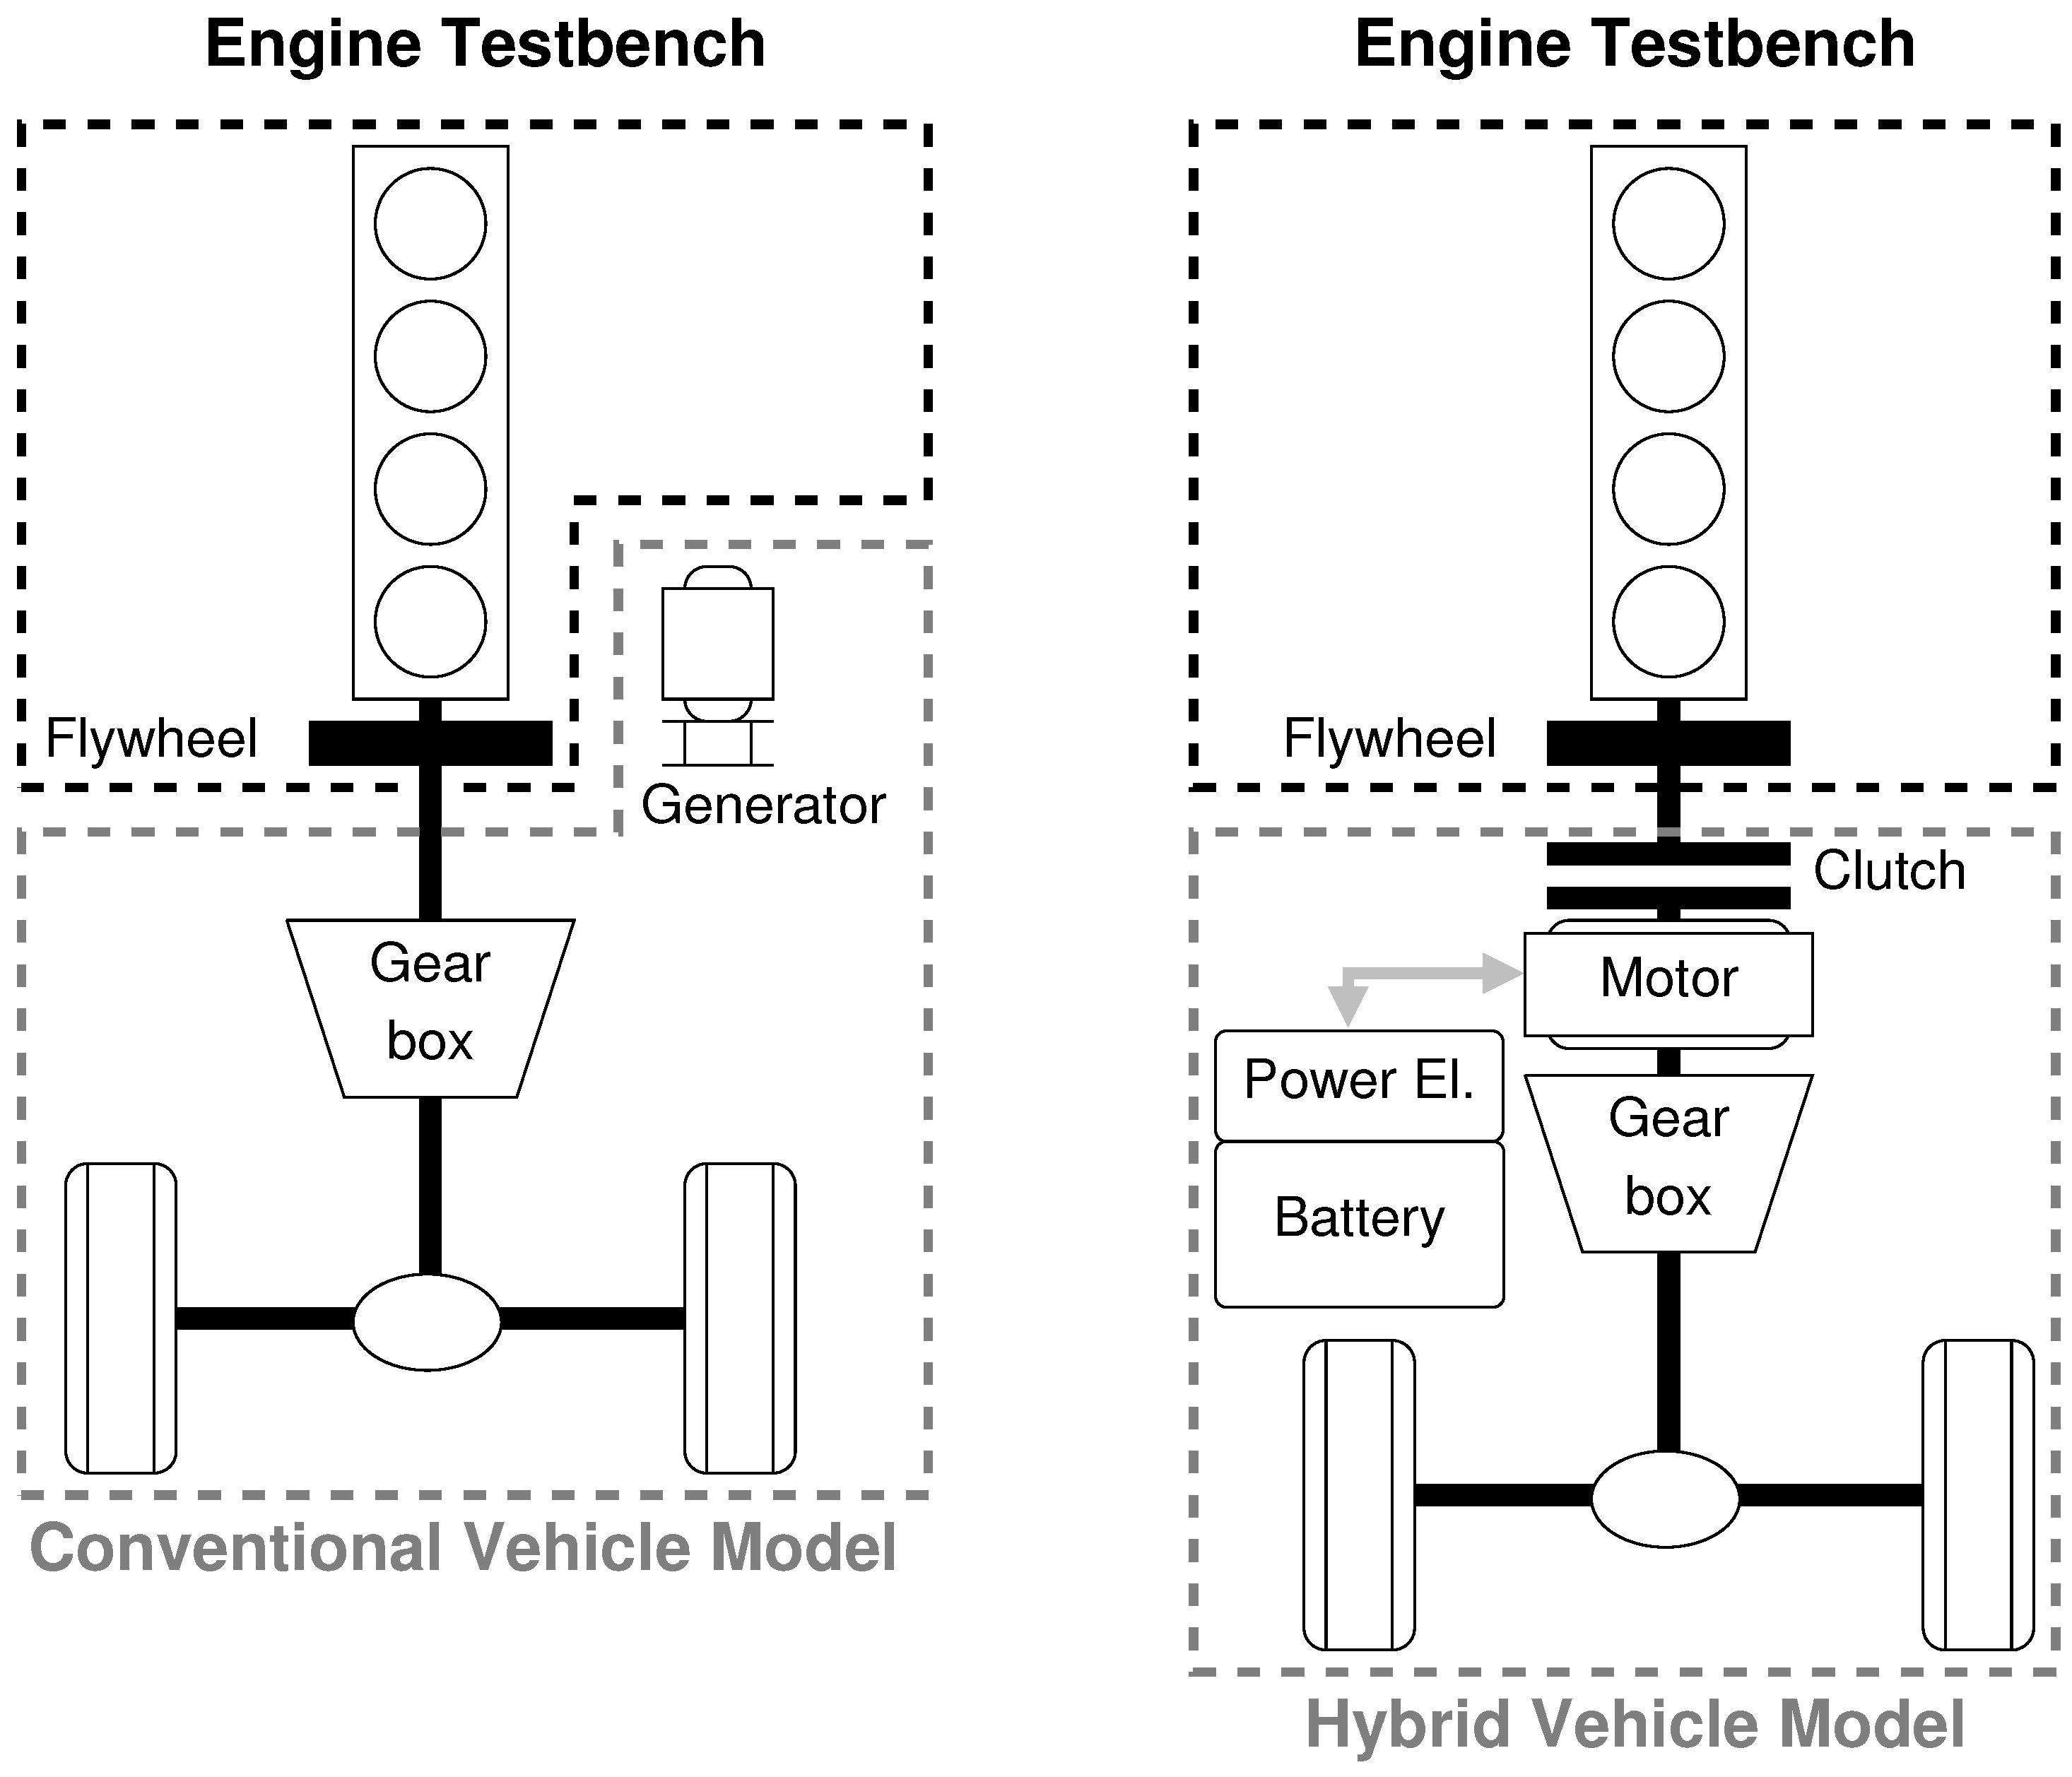
The powertrains investigated are shown in
Figure 3. The types of vehicles investigated are a conventional vehicle with start/stop system and a hybrid-electric vehicle. The hybrid-electric vehicle is a full parallel hybrid, where the engine can be decoupled from the electric motor. The dashed black line indicates that part of the vehicle which physically exists on the test bench. The dashed grey line indicates that part of the vehicle which is simulated. The models used for simulation are described in detail in the following sections.
Figure 3.
Powertrains investigated: Conventional (non-hybrid) vehicle on the left-hand side. Hybrid-electric vehicle on the right-hand side.
Figure 3.
Powertrains investigated: Conventional (non-hybrid) vehicle on the left-hand side. Hybrid-electric vehicle on the right-hand side.
2.4.2. Longitudinal Vehicle Dynamics
The longitudinal vehicle dynamics are given by the following Equation:
where
is the vehicle speed,
the vehicle mass,
the inertia of the wheels,
the radius of the wheels,
the inertia of the electric motor,
the gear ratio,
the wheel torque,
the rolling friction coefficient,
g the gravitational acceleration,
the density of air,
the frontal area and
the aerodynamic drag coefficient.
2.4.3. Gearbox
The gearbox is a 7-speed dual clutch gearbox. The friction is modelled as a constant friction torque on the engine side of the gearbox (
) plus a constant efficiency (
η). The wheel torque (
) can thus be calculated by:
where
is the input torque to the gearbox and
is the gear-dependent gear ratio. In the case of the conventional vehicle, the powertrain torque (
) is calculated by:
where
is the engine Torque and
is the torque of the generator. In the case of the hybrid-electric vehicle, the powertrain torque (
) is calculated by:
where
is the torque of the electric motor.
Table 3 summarises the parameters of the gearbox,
is the maximum gearbox input torque. The gear ratios are taken from [
18], while the efficiency data is extracted from [
19].
Table 3.
Gearbox Parameters.
Table 3.
Gearbox Parameters.
| Gear | 1 | 2 | 3 | 4 | 5 | 6 | 7 |
|---|
| 15.943 | 10.038 | 6.359 | 4.335 | 3.205 | 2.501 | 1.995 |
| η | 0.97 |
| |
2.4.4. Generator
The generator is used to provide the required electrical auxiliary power in the conventional vehicle. The generator is assumed to have a constant efficiency of 75%, which is a reasonably good approximation for a wide range of generator operating points [
20]. The generator torque is calculated by:
2.4.5. Electric Motor
The model of the electric motor is based on a 20 kW permanent magnet synchronous machine. An electric power map is used to obtain the electric power either drawn from or supplied to the battery,
i.e.,
. The electric power map of the motor, maximum and minimum torque, motor mass, and inertia are scaled linearly with the maximum nominal power of the motor.
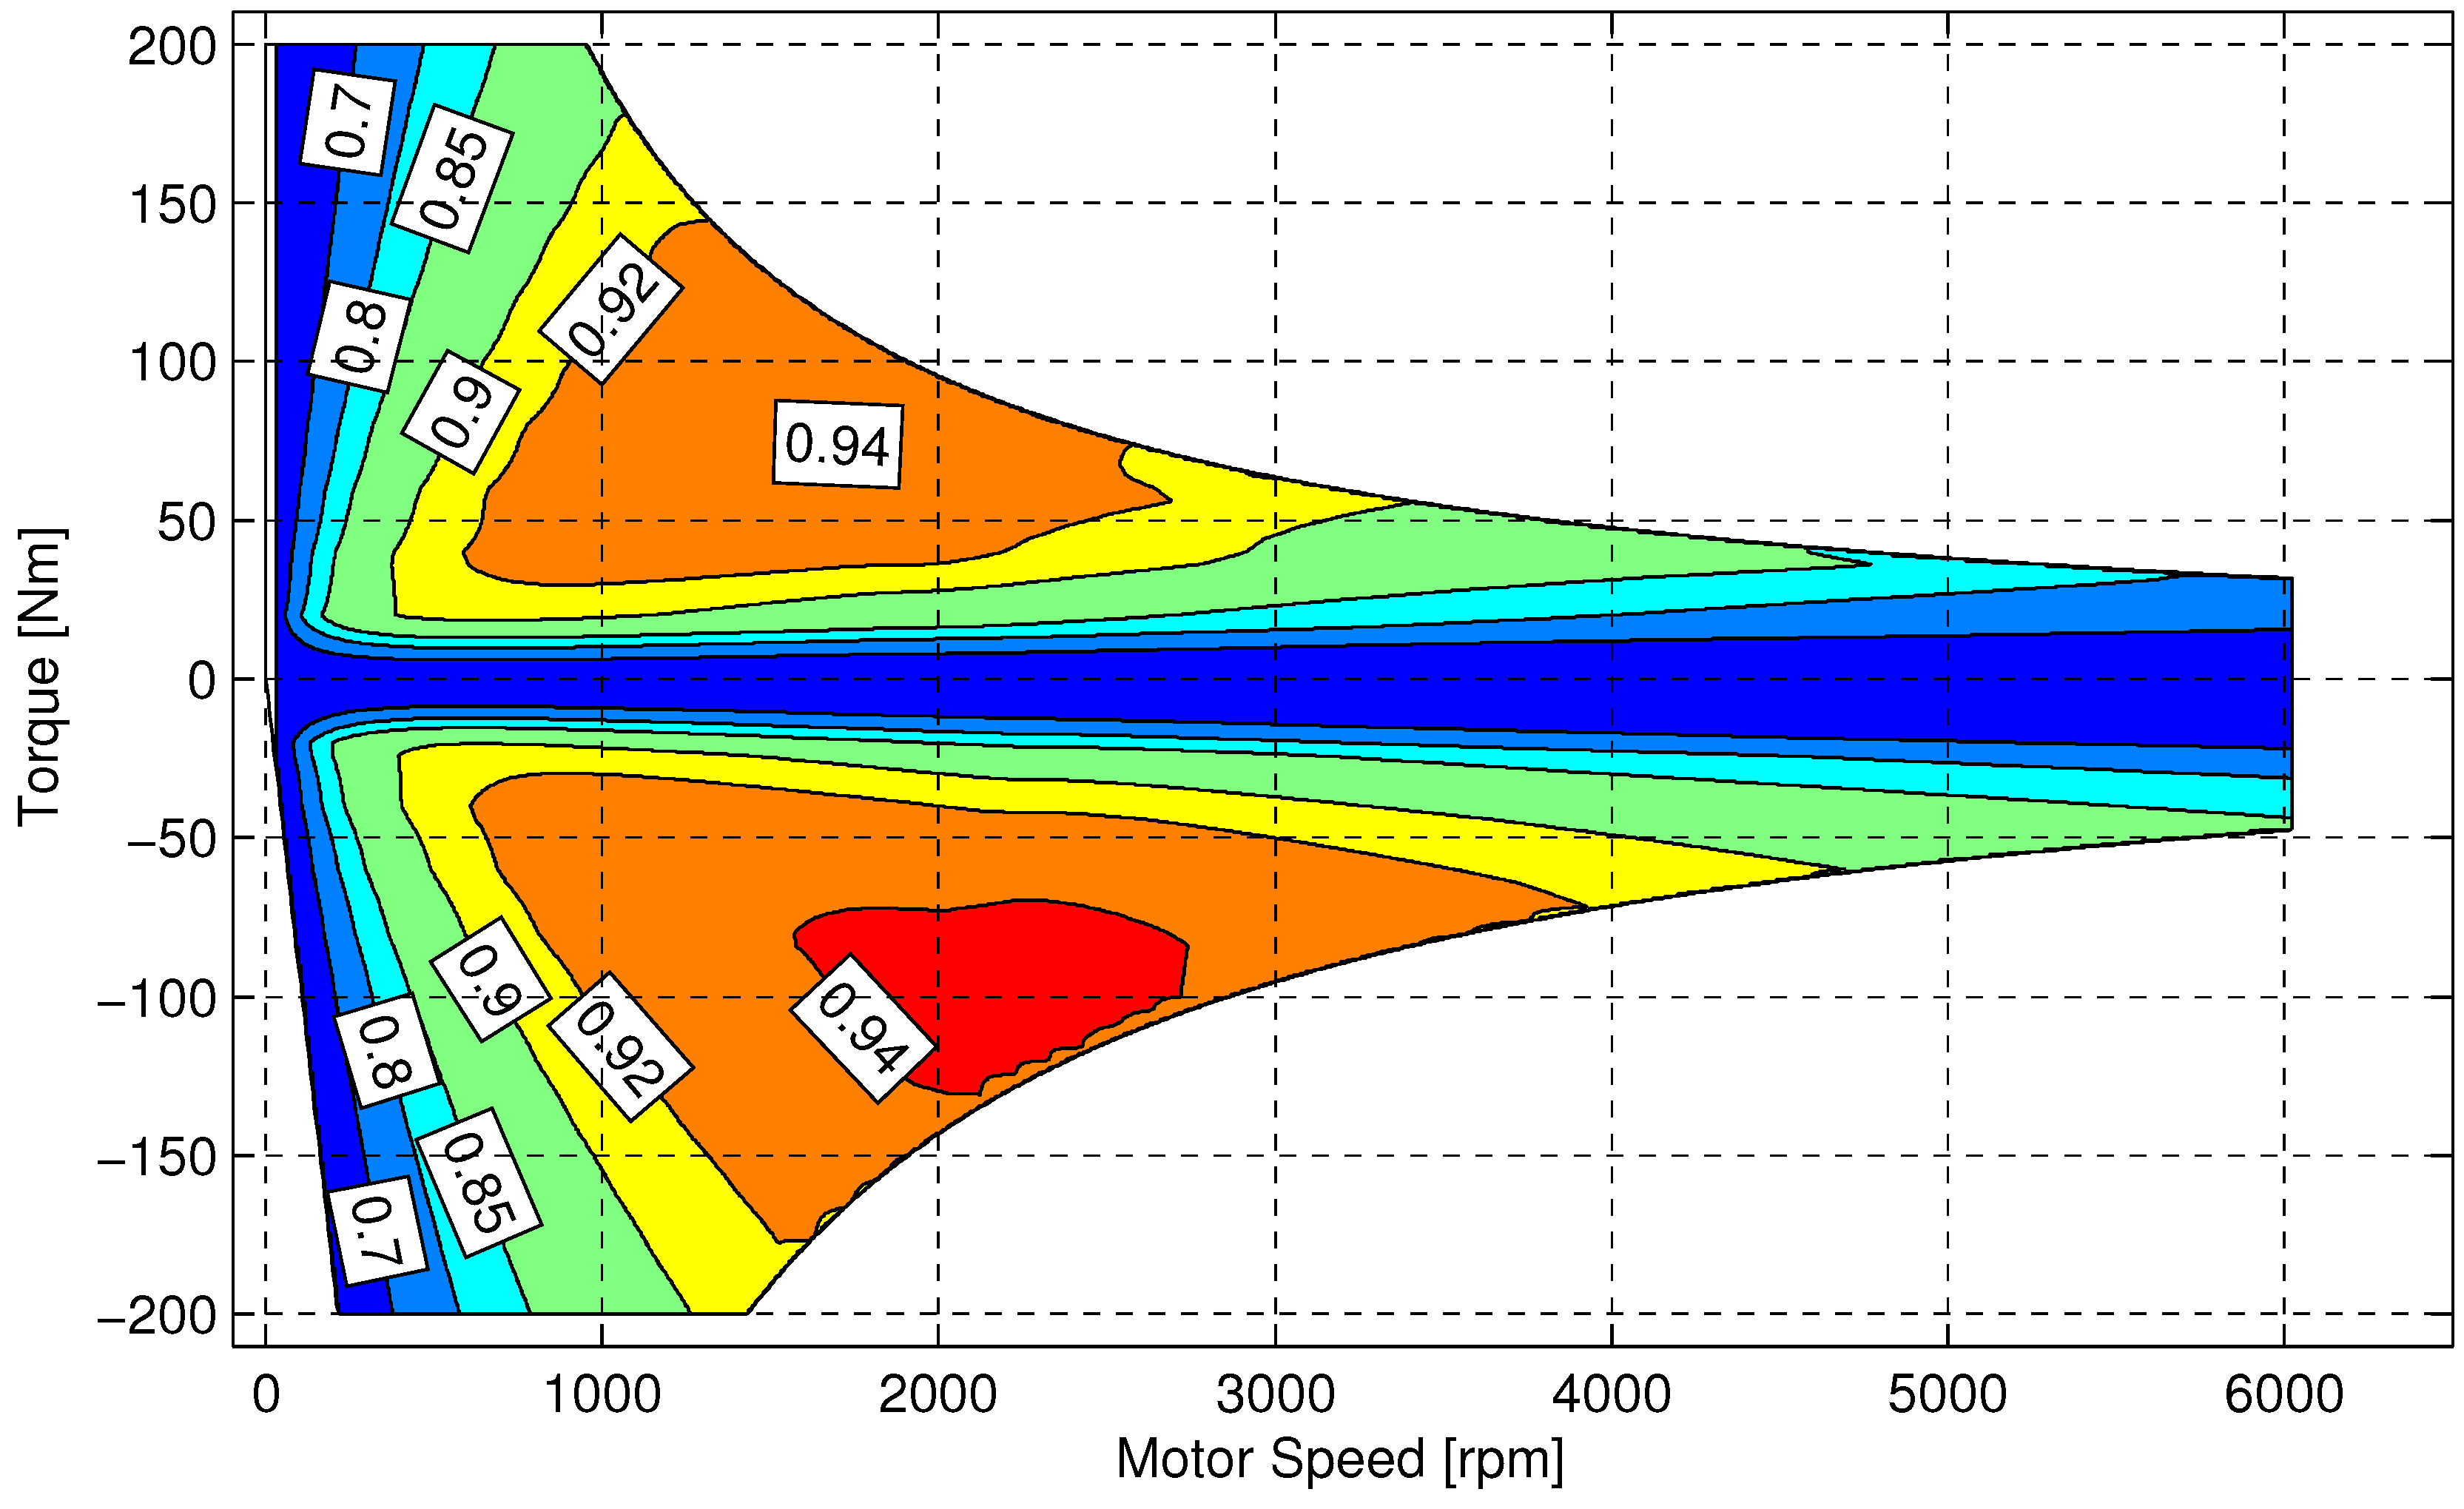
Figure 4 shows the efficiency of the electric motor including the inverter. Motor mass and inertia are obtained by the following Equations:
The mass includes the mass of the motor, the mass of the inverter and the mass of the clutch between engine and motor.
Figure 4.
Efficiency map of the electric motor, including inverter efficiency.
Figure 4.
Efficiency map of the electric motor, including inverter efficiency.
2.4.6. Battery
The battery is modeled based on an equivalent circuit model with the nominal capacity
, where an ideal open-circuit voltage source
is placed in series with an internal resistance
. The electrical power to or from the motor
and the constant electrical power
change the battery state of charge
according to [
21]:
The battery pack is a series connection of
N cells. The parameters of a single cell can be found in
Table 4. The parameters of the battery pack are obtained by the following Equations:
The factor 2 in the battery mass compared to the single cell accounts for all necessary auxiliary devices of the battery pack such as housing, cooling, wiring, and others.
Table 4.
Parameters of a single battery cell. (A123 ANR32113M1).
Table 4.
Parameters of a single battery cell. (A123 ANR32113M1).
| Parameter | Value | Unit | Parameter | Value | Unit |
|---|
| 3.3 | | | 400 | |
| 4.5 | | η | 0.98 | - |
| 5 | Ω | | 205 | |
2.4.7. Vehicle Parameters
The parameters of the vehicles investigated are summarised in
Table 5. Four vehicles are investigated: a full-size car with a non-hybridized (conventional) powertrain, the same vehicle with a hybrid-electric powertrain and a compact and a subcompact car, both with a hybrid-electric powertrain. The total vehicle mass consists of the mass of the base vehicle, the mass of hybridization, the mass of gas and the mass of the gas tanks. The mass of the base vehicle is the mass of the corresponding vehicle with a Diesel engine and an automatic transmission. The mass of hybridization contains the mass of the motor including the clutch and the mass of the battery. The mass of the gas tanks is calculated under the assumptions that the gas is stored with a maximum pressure of 200 bar and that the tanks have a specific mass of 0.5
/L.
Table 5.
Parameters of the vehicles under investigation.
Table 5.
Parameters of the vehicles under investigation.
| Vehicle | Hybrid | Conventional |
|---|
| Subcompact | Compact | Full-size | Full-size |
|---|
| Mass base vehicle (kg) | | 855 | 1313 | 1735 | 1735 |
| Mass hybridization (kg) | | 41 | 55 | 69 | - |
| Mass gas (kg) | | 12 | 18 | 24 | 24 |
| Mass gas tank (kg) | | 35 | 53 | 70 | 70 |
| Total mass vehicle (kg) | | 943 | 1439 | 1898 | 1829 |
| Aerodynamic drag coefficient (-) | | 0.25 | 0.27 | 0.25 | 0.25 |
| Frontal area () | | 2.18 | 2.19 | 2.21 | 2.21 |
| Rolling friction coefficient () | | 6.5 | 6.5 | 6.5 | 6.5 |
| Auxiliary power demand () | | 200 | 300 | 400 | 400 |
| Wheel radius () | | 0.293 | 0.316 | 0.326 | 0.326 |
| Wheel inertia () | | 4 0.74 | 4 0.92 | 4 1.05 | 4 1.05 |
| Combustion engine displ. volume (L) | | 0.8 | 1.2 | 2.0 | 2.0 |
| Electric motor power (kW) | | 12 | 16 | 20 | N.A. |
| Battery number of cells (-) | | 42 | 56 | 70 | N.A. |
| Battery power (kW) | | 16.8 | 22.4 | 28 | N.A. |
| Battery capacity (kWh) | | 0.62 | 0.83 | 1.04 | N.A. |
| Gearbox nominal torque (Nm) | | 160 | 240 | 400 | 320 |
2.4.8. Engine Scaling
The engine size chosen for the full-size car is the same as the engine available on the test bench. For the subcompact and the compact car, the engine size chosen is smaller than that of the engine available on the test bench. For the latter two vehicles, the engine is scaled under the assumption that both the efficiency as well as the gas ratio do not change. The measured torque, the measured gas consumption and the measured Diesel consumption are therefore calculated by the following Equations:
Variables with a tilde indicate the values of the scaled engine with a displacement volume , while variables without tilde indicate the measured values of the test bench engine with a displacement volume .
2.4.9. Gear Shifting
Gear shifting is performed according to a simple, heuristic shifting strategy. The gear is shifted to the next higher gear if the vehicle speed is higher than a given threshold and if the demanded torque in the new gear is lower than 75% of the maximum engine torque. The speed thresholds are given by:
The gear is shifted to the next lower gear if the vehicle speed is 10% below the speed threshold or if the demanded torque is higher than the maximum engine torque.
2.4.10. Energy Management of Hybrid-Electric Vehicle
The optimal control problem of torque split is solved using Dynamic Programming. See [
22] for general information on dynamic programming, [
23] for details on the implementation and [
24] for its application for hybrid-electric vehicles. Using Dynamic Programming guarantees that the lowest possible fuel consumption for the given vehicle and driving cycle is achieved. Dynamic Programming is non-causal and thus requires perfect information on the full driving cycle. Such a method is not applicable in a vehicle where full information on future driving is not available. However, it has been shown in [
25] that if the driving cycle has no elevation, the results obtained by using causal energy management strategies come very close to those obtained by dynamic programming,
3. Results and Discussion
This section presents the experimental results.
Subsection 3.1 presents the results of the stationary engine experiments.
Subsection 3.2 presents the results of the vehicle emulation experiments.
3.1. Static Engine Measurements
3.1.1. Consumption Measurements
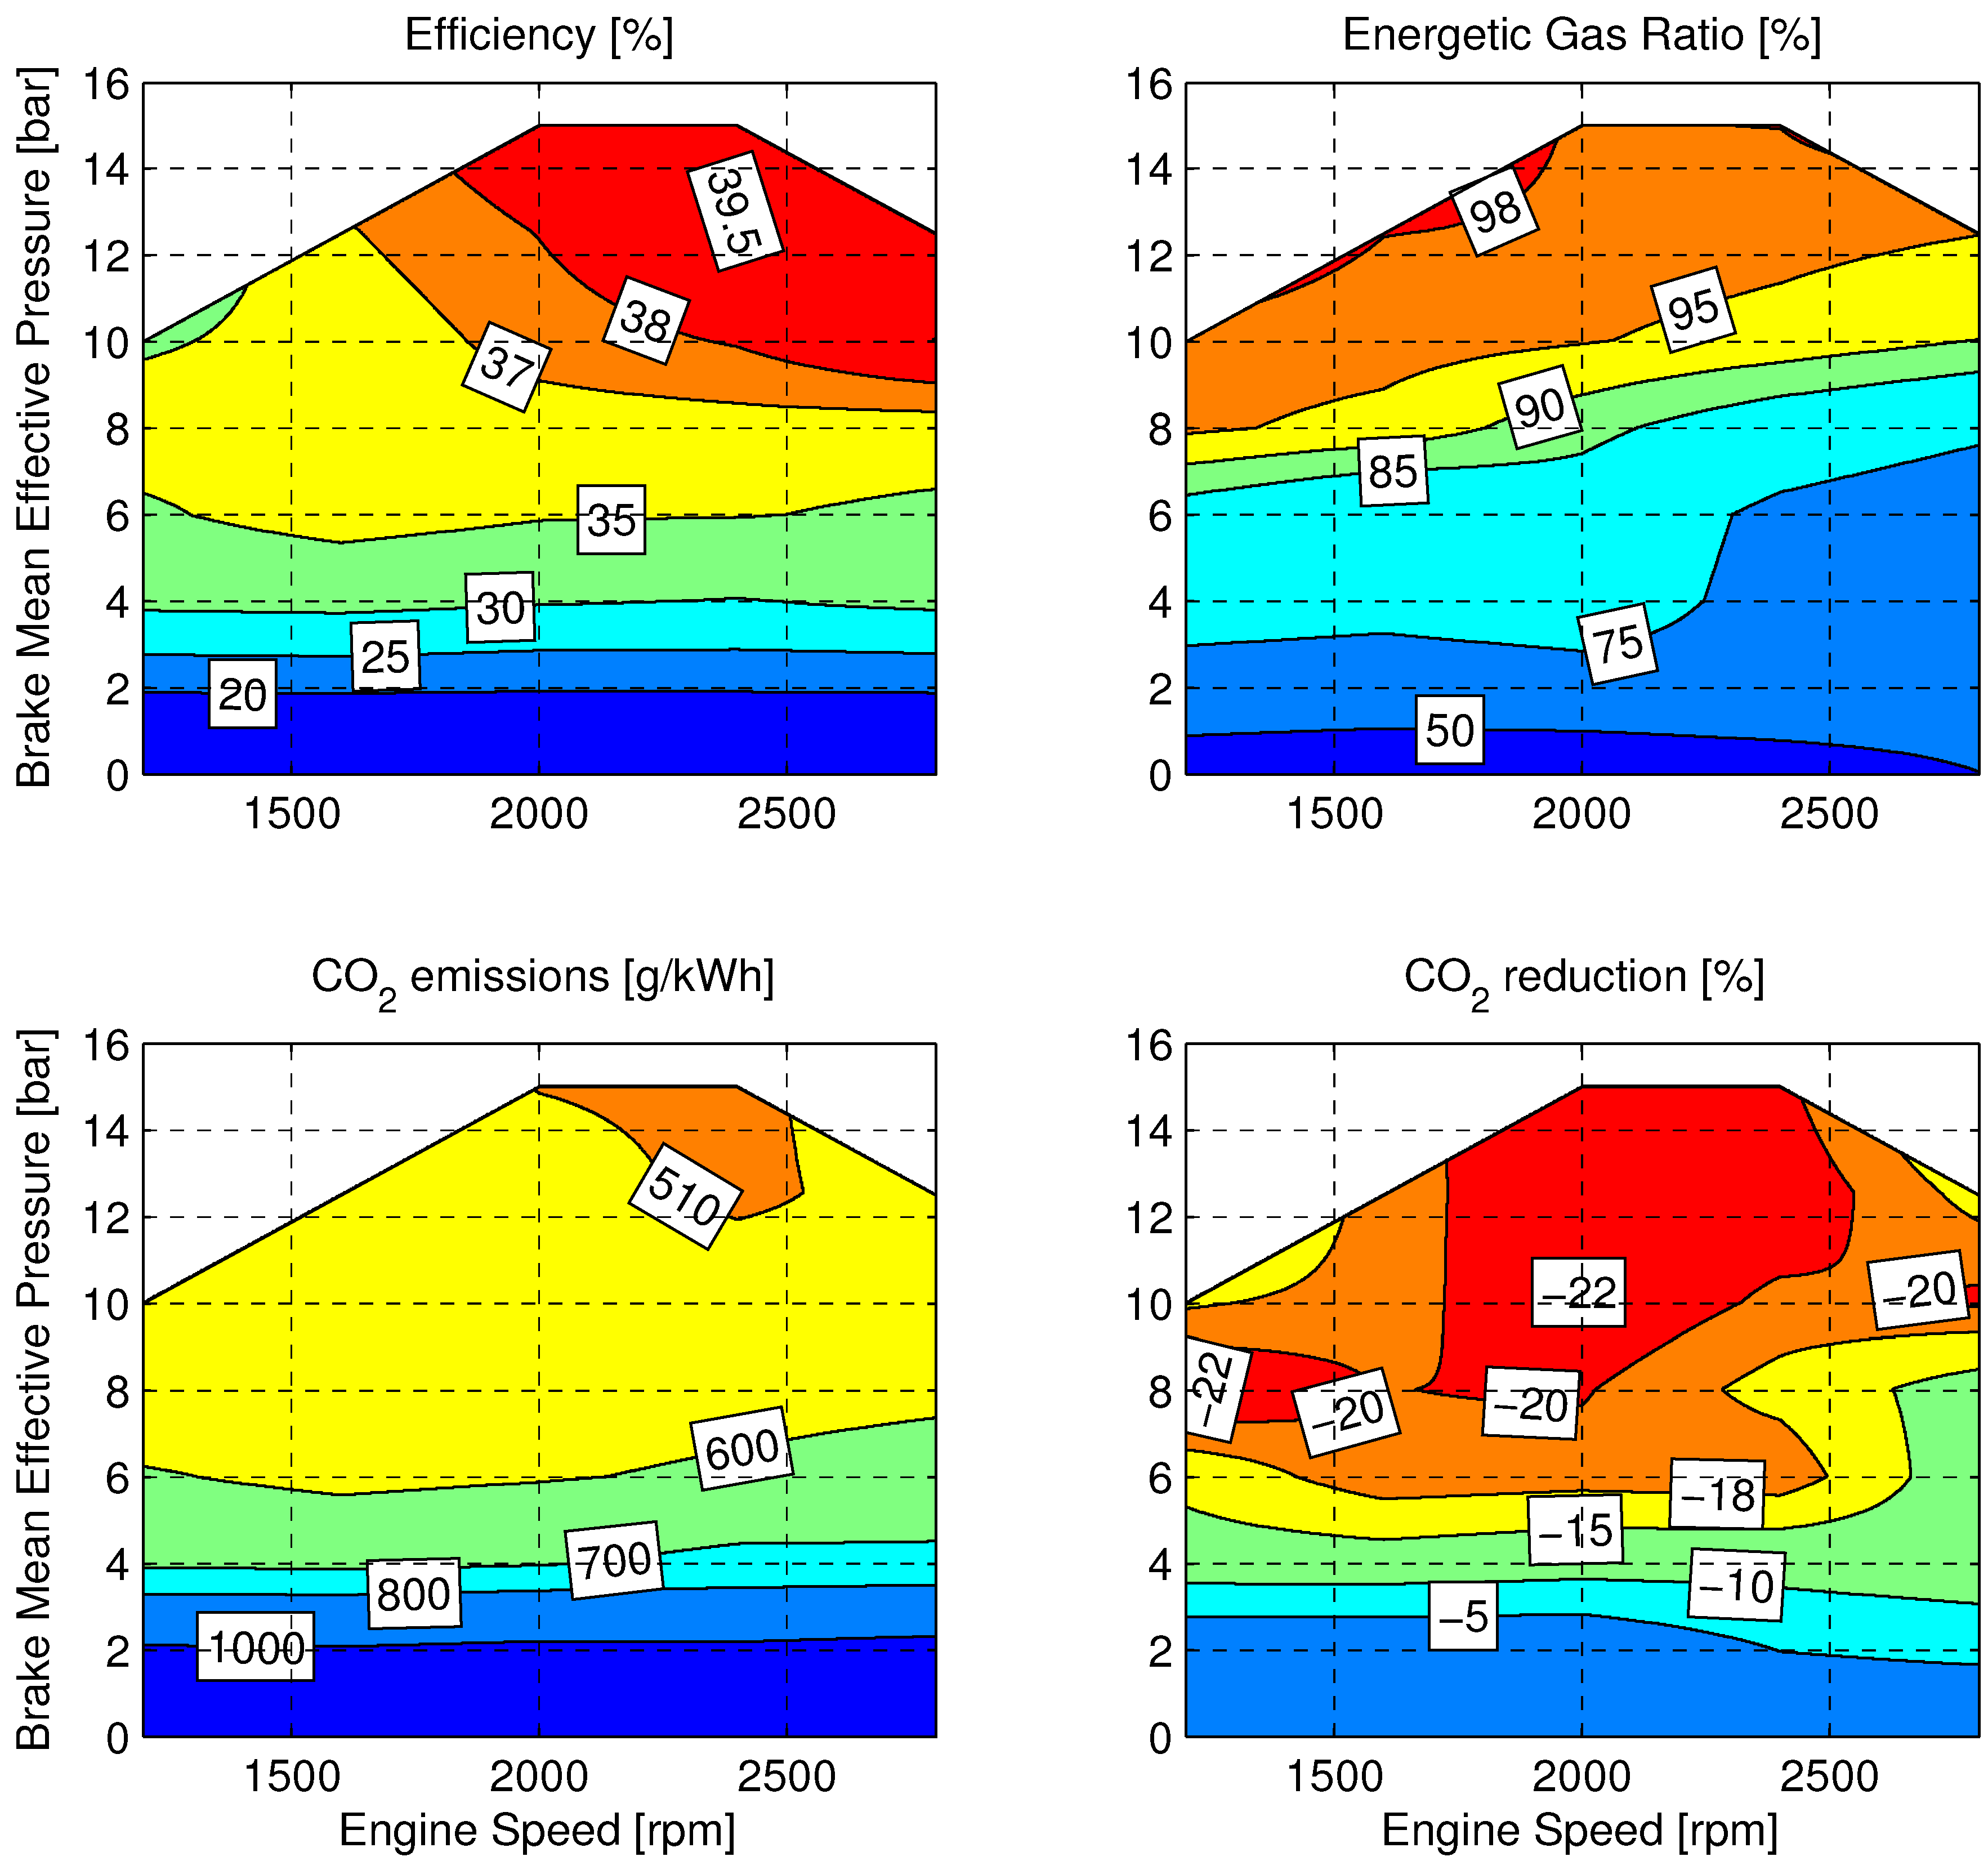
Figure 5 shows the results of the consumption measurements. The maximum torque measured at low speeds is limited by the elasticity of the shaft used at the test bench. At higher speeds, the maximum torque measured is limited by the size of the gas injectors. The top left plot shows the engine efficiency measured. The natural gas-Diesel engine reaches efficiencies as high as 39.5%. The top right plot shows the gas ratio
as defined in Equation (
4). The engine is operated with pure Diesel fuel at very low loads only. With increasing load, the gas ratio
is increasing. The gas ratio reaches values above 98% at high loads and low speeds. The bottom left plot shows the CO
emissions in gram per kilowatt hour. For two reasons, the CO
emissions are decreasing with increasing load. First, the efficiency increases with an increasing load. Second, the gas ratio increases with an increasing load. The bottom right plot shows the reduction of CO
emissions with respect to the base Diesel engine. Compared to the Diesel engine, the dual-fuel natural gas-Diesel engine reaches CO
reductions of up to 22% for certain operating points.
Figure 5.
Results of the consumption measurements as a function of engine speed and load.
Figure 5.
Results of the consumption measurements as a function of engine speed and load.
3.1.2. Nitrogen Oxide Emissions
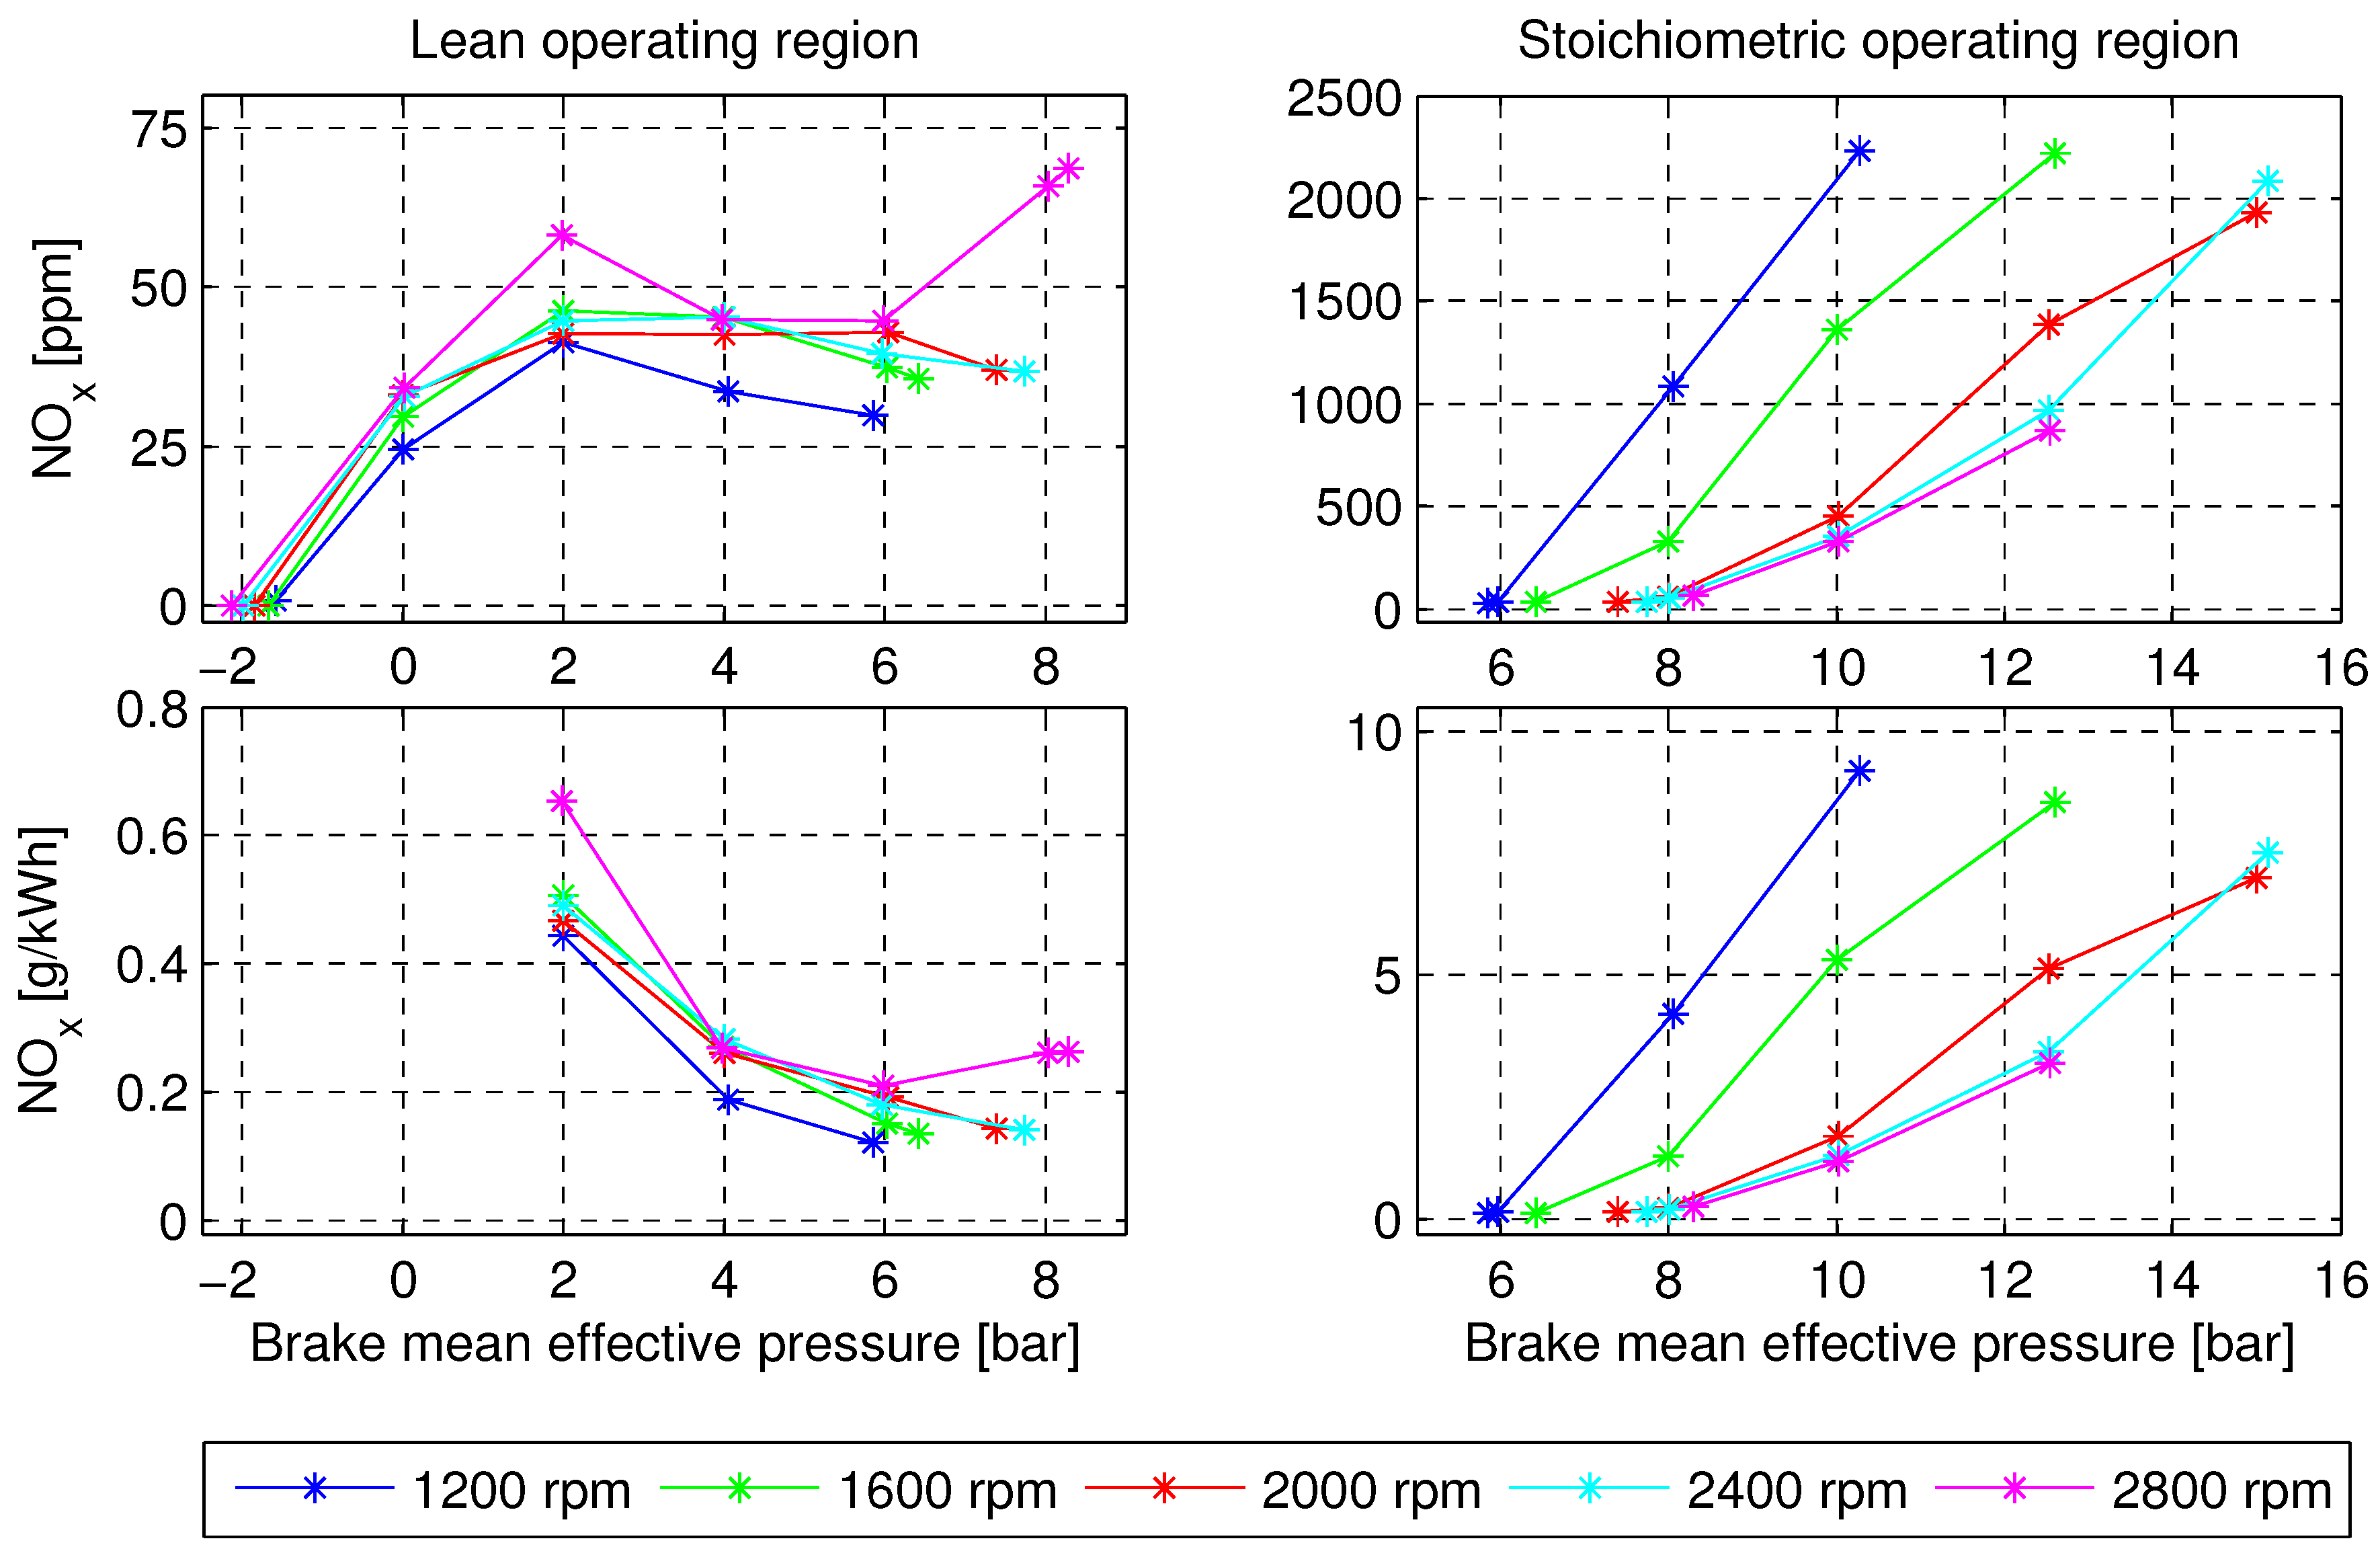
Figure 6 shows the engine out nitrogen oxide emissions for various operating points. The top left plot shows the nitrogen oxide emissions for the operating points where the engine is operated lean. The values are given in parts per million (ppm) as a function of engine load. Each line represents one engine speed. Nitrogen oxide emissions are below 75 ppm for the lean operating region. The top right plot shows the engine out nitrogen oxide emissions for those operating points where the engine is operated stoichiometrically. The nitrogen oxide emissions are strongly increasing with an increasing load. However, due to the stoichiometric operation, they can be reduced with a cost-efficient catalytic converter as it is state of the art in stoichiometrically operated spark ignited engines. The bottom plots show the nitrogen oxide emissions both for the lean region and the stoichiometric region, converted to gram per kilowatt hour. The results indicate that Euro 6 limitations for nitrogen oxide emissions can be met without a lean nitrogen oxide aftertreatment.
Figure 6.
Measured nitrogen oxide emissions (engine out). Measurements for the lean operating region on the left-hand side. Measurements for the stoichiometric operating region on the right-hand side. Emissions are given as a function of engine load; each line indicates one engine speed.
Figure 6.
Measured nitrogen oxide emissions (engine out). Measurements for the lean operating region on the left-hand side. Measurements for the stoichiometric operating region on the right-hand side. Emissions are given as a function of engine load; each line indicates one engine speed.
3.1.3. Soot
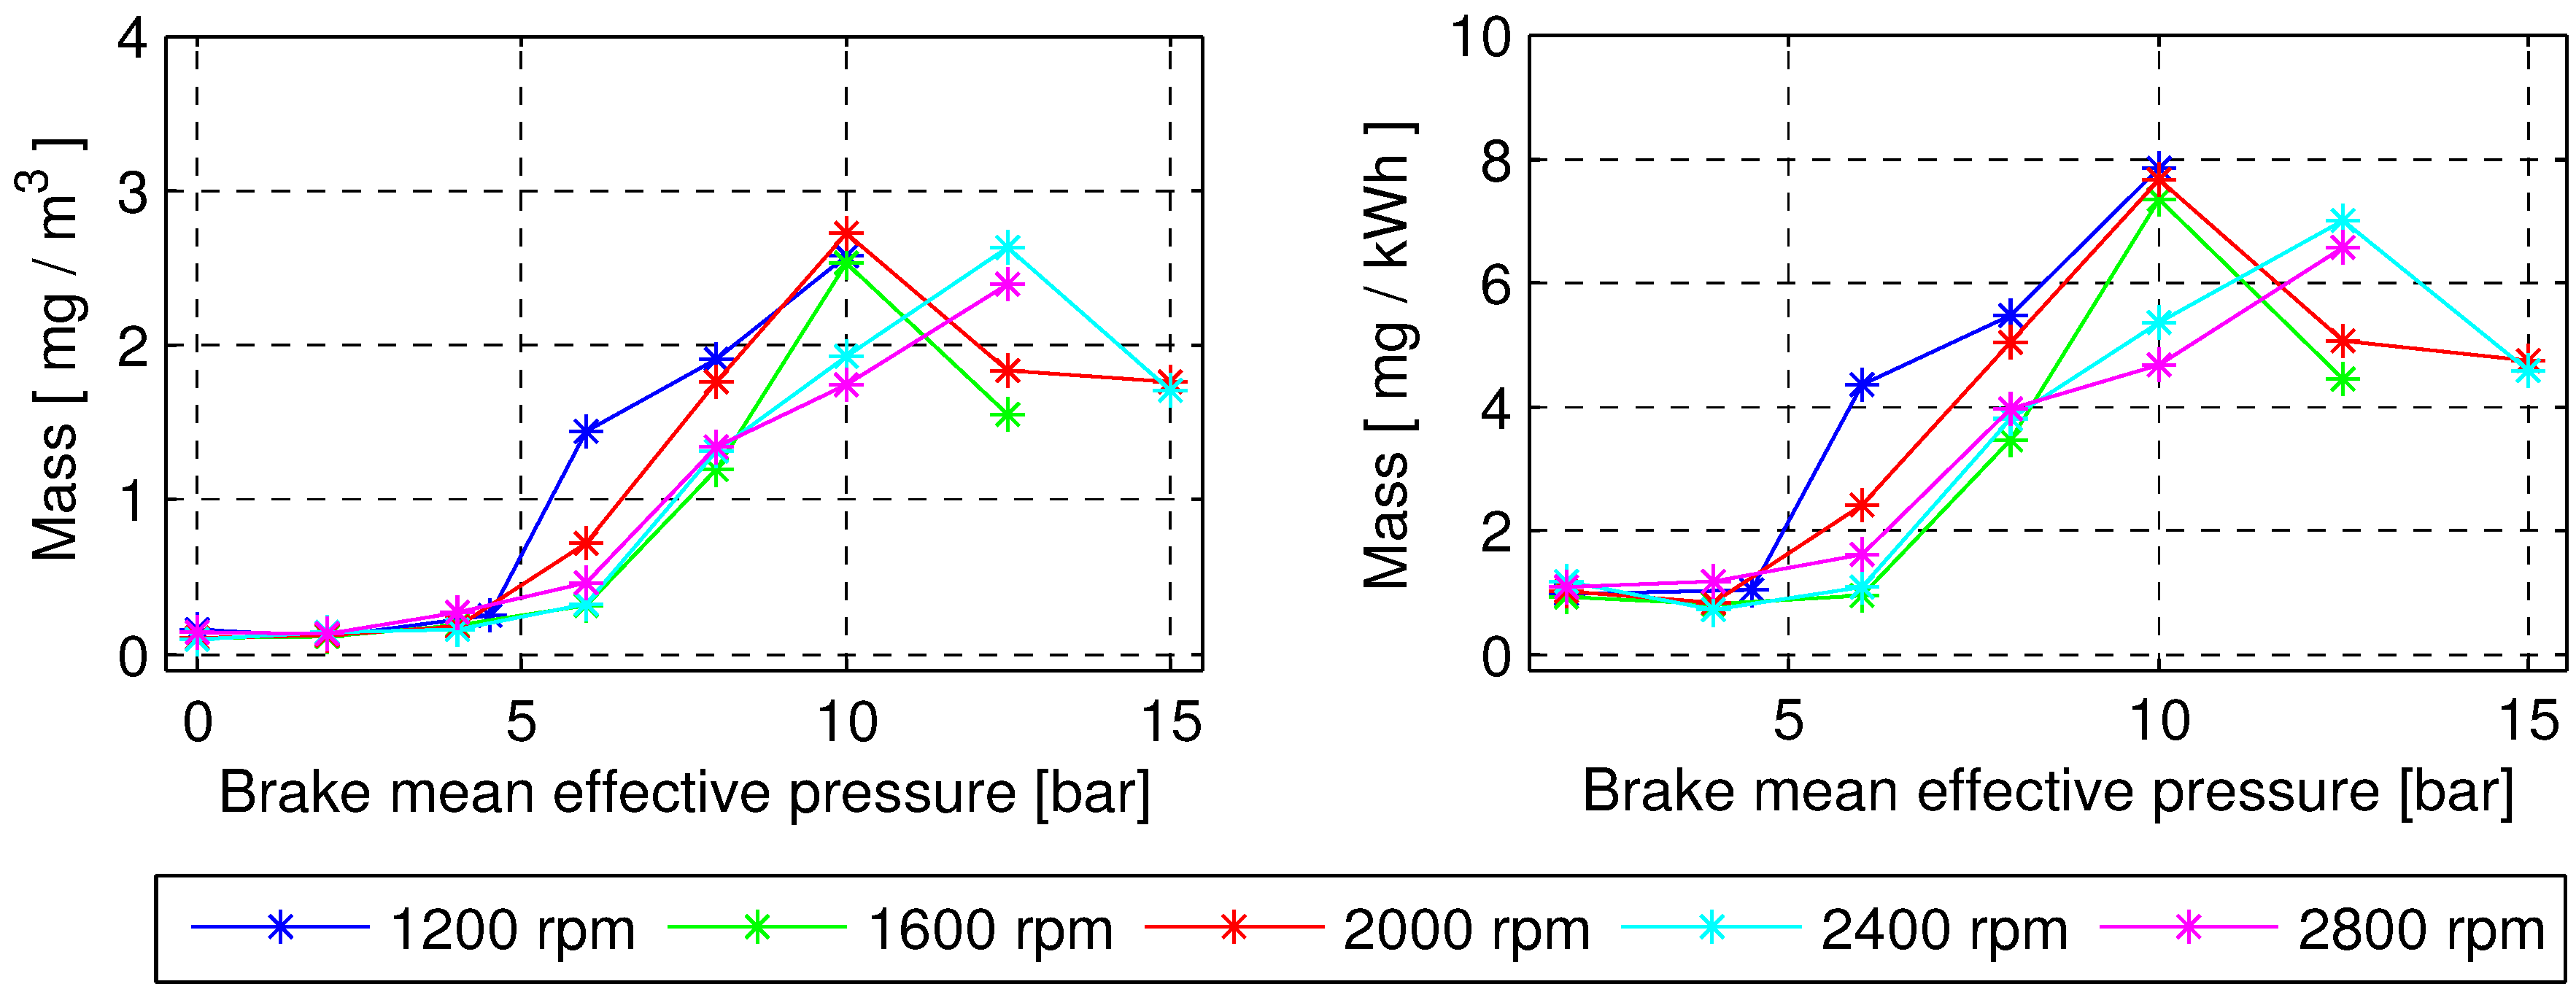
Figure 7 shows the measured engine out soot concentration. The left plot shows the soot concentration in milligram per cubic meter as a function of engine load. Each line represents one engine speed. The measured soot concentration is below 3 mg/m
for all operating points investigated. The right plot shows the converted values in milligram per kilowatt hour. The results indicate that Euro 6 limitations for particulate mass can be met without a particulate filter.
Figure 7.
Measured soot emissions (engine out), as a function of engine load, with each line indicating one engine speed.
Figure 7.
Measured soot emissions (engine out), as a function of engine load, with each line indicating one engine speed.
3.2. Vehicle Emulation Results
3.2.1. Detailed Results
Figure 8 shows detailed measurement results for the full-size hybrid vehicle on the NEDC.
Figure 8.
Measured vehicle emulation results for the Full-size car with hybrid-electric powertrain on the NEDC.
Figure 8.
Measured vehicle emulation results for the Full-size car with hybrid-electric powertrain on the NEDC.
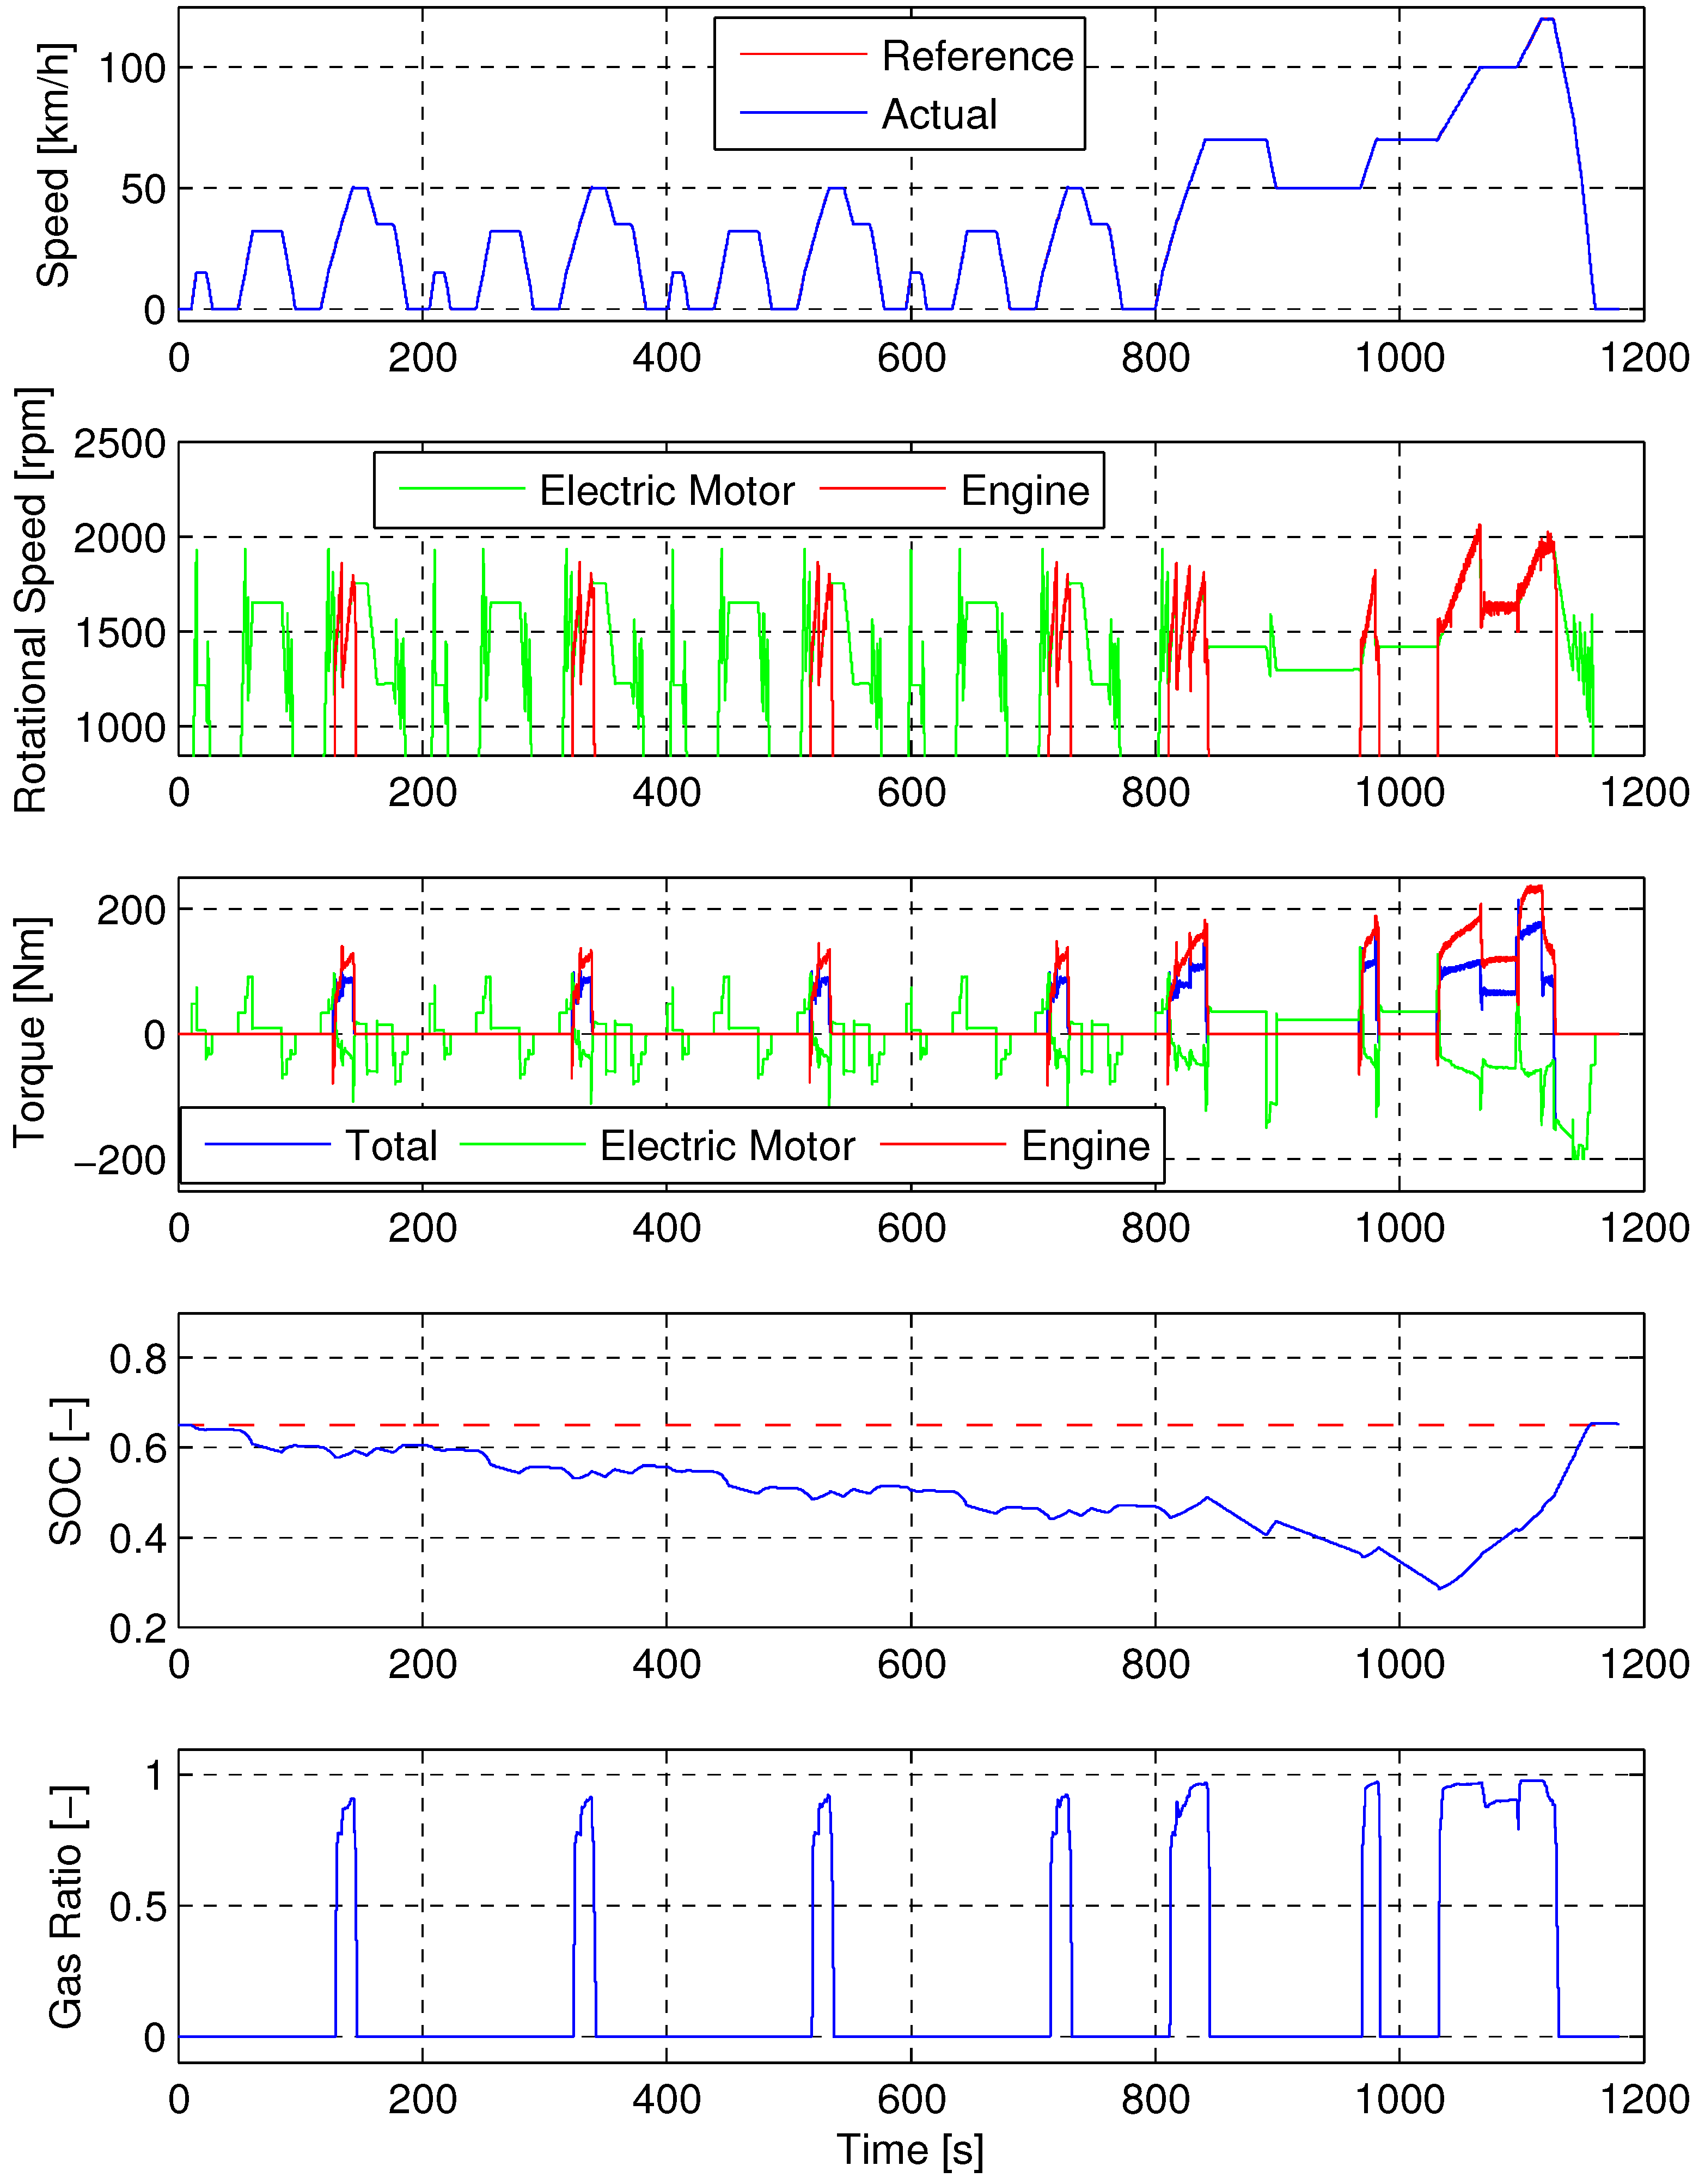
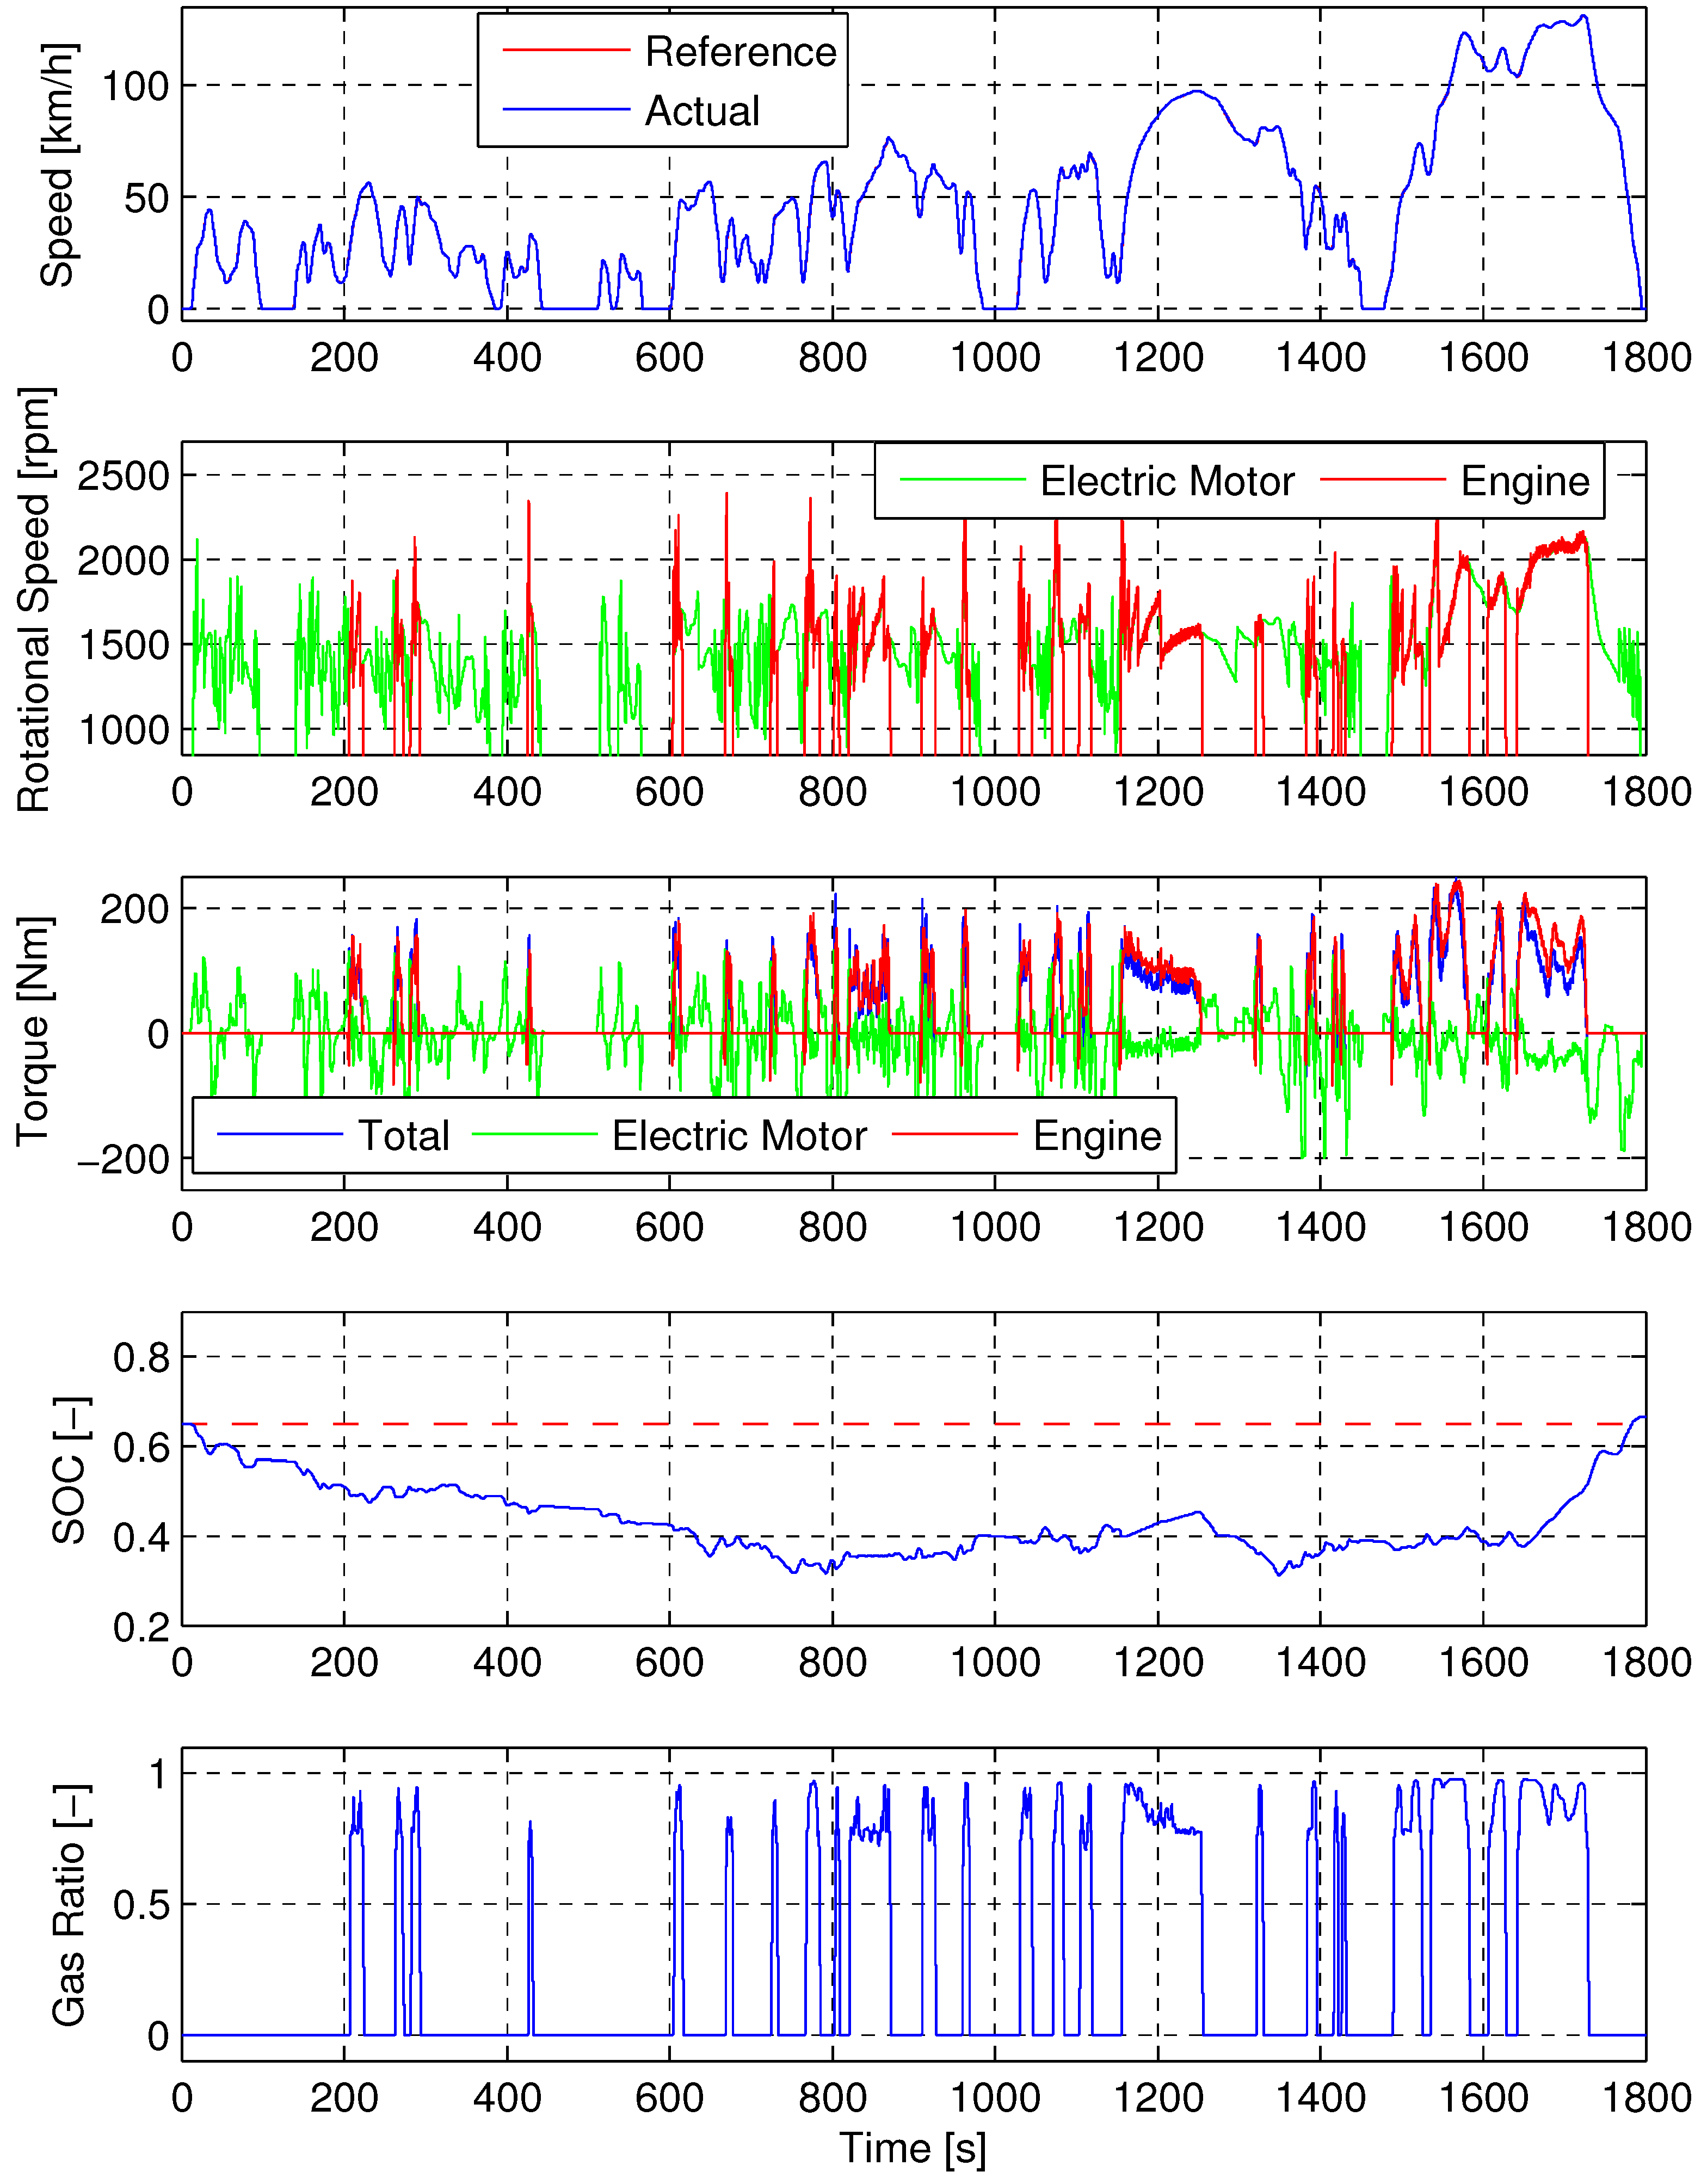
Figure 9 shows the same results for the WLTP. The first plot shows the vehicle speed. Both the reference and the actual speed are shown. The second plot shows the rotational speed of the electric motor and the engine. The two speeds are identical if the clutch between the engine and the motor is closed. The third plot shows the torque of the electric motor, the torque of the engine and the total gearbox input torque. The total torque is the sum of the torque of the motor and the engine. The fourth plot shows the state of charge of the battery. The plot confirms that the vehicle is operated charge sustaining. The final state of charge is even slightly higher than the initial state of charge. The last plot shows the gas ratio. The gas ratio is obtained from the measured engine operating point and the gas ratio map obtained from the static engine measurements.
Figure 9.
Measured vehicle emulation results for the Full-size car with hybrid-electric powertrain on the WLTP.
Figure 9.
Measured vehicle emulation results for the Full-size car with hybrid-electric powertrain on the WLTP.
Figure 10 shows detailed measurement results for the full-size conventional vehicle on the NEDC.
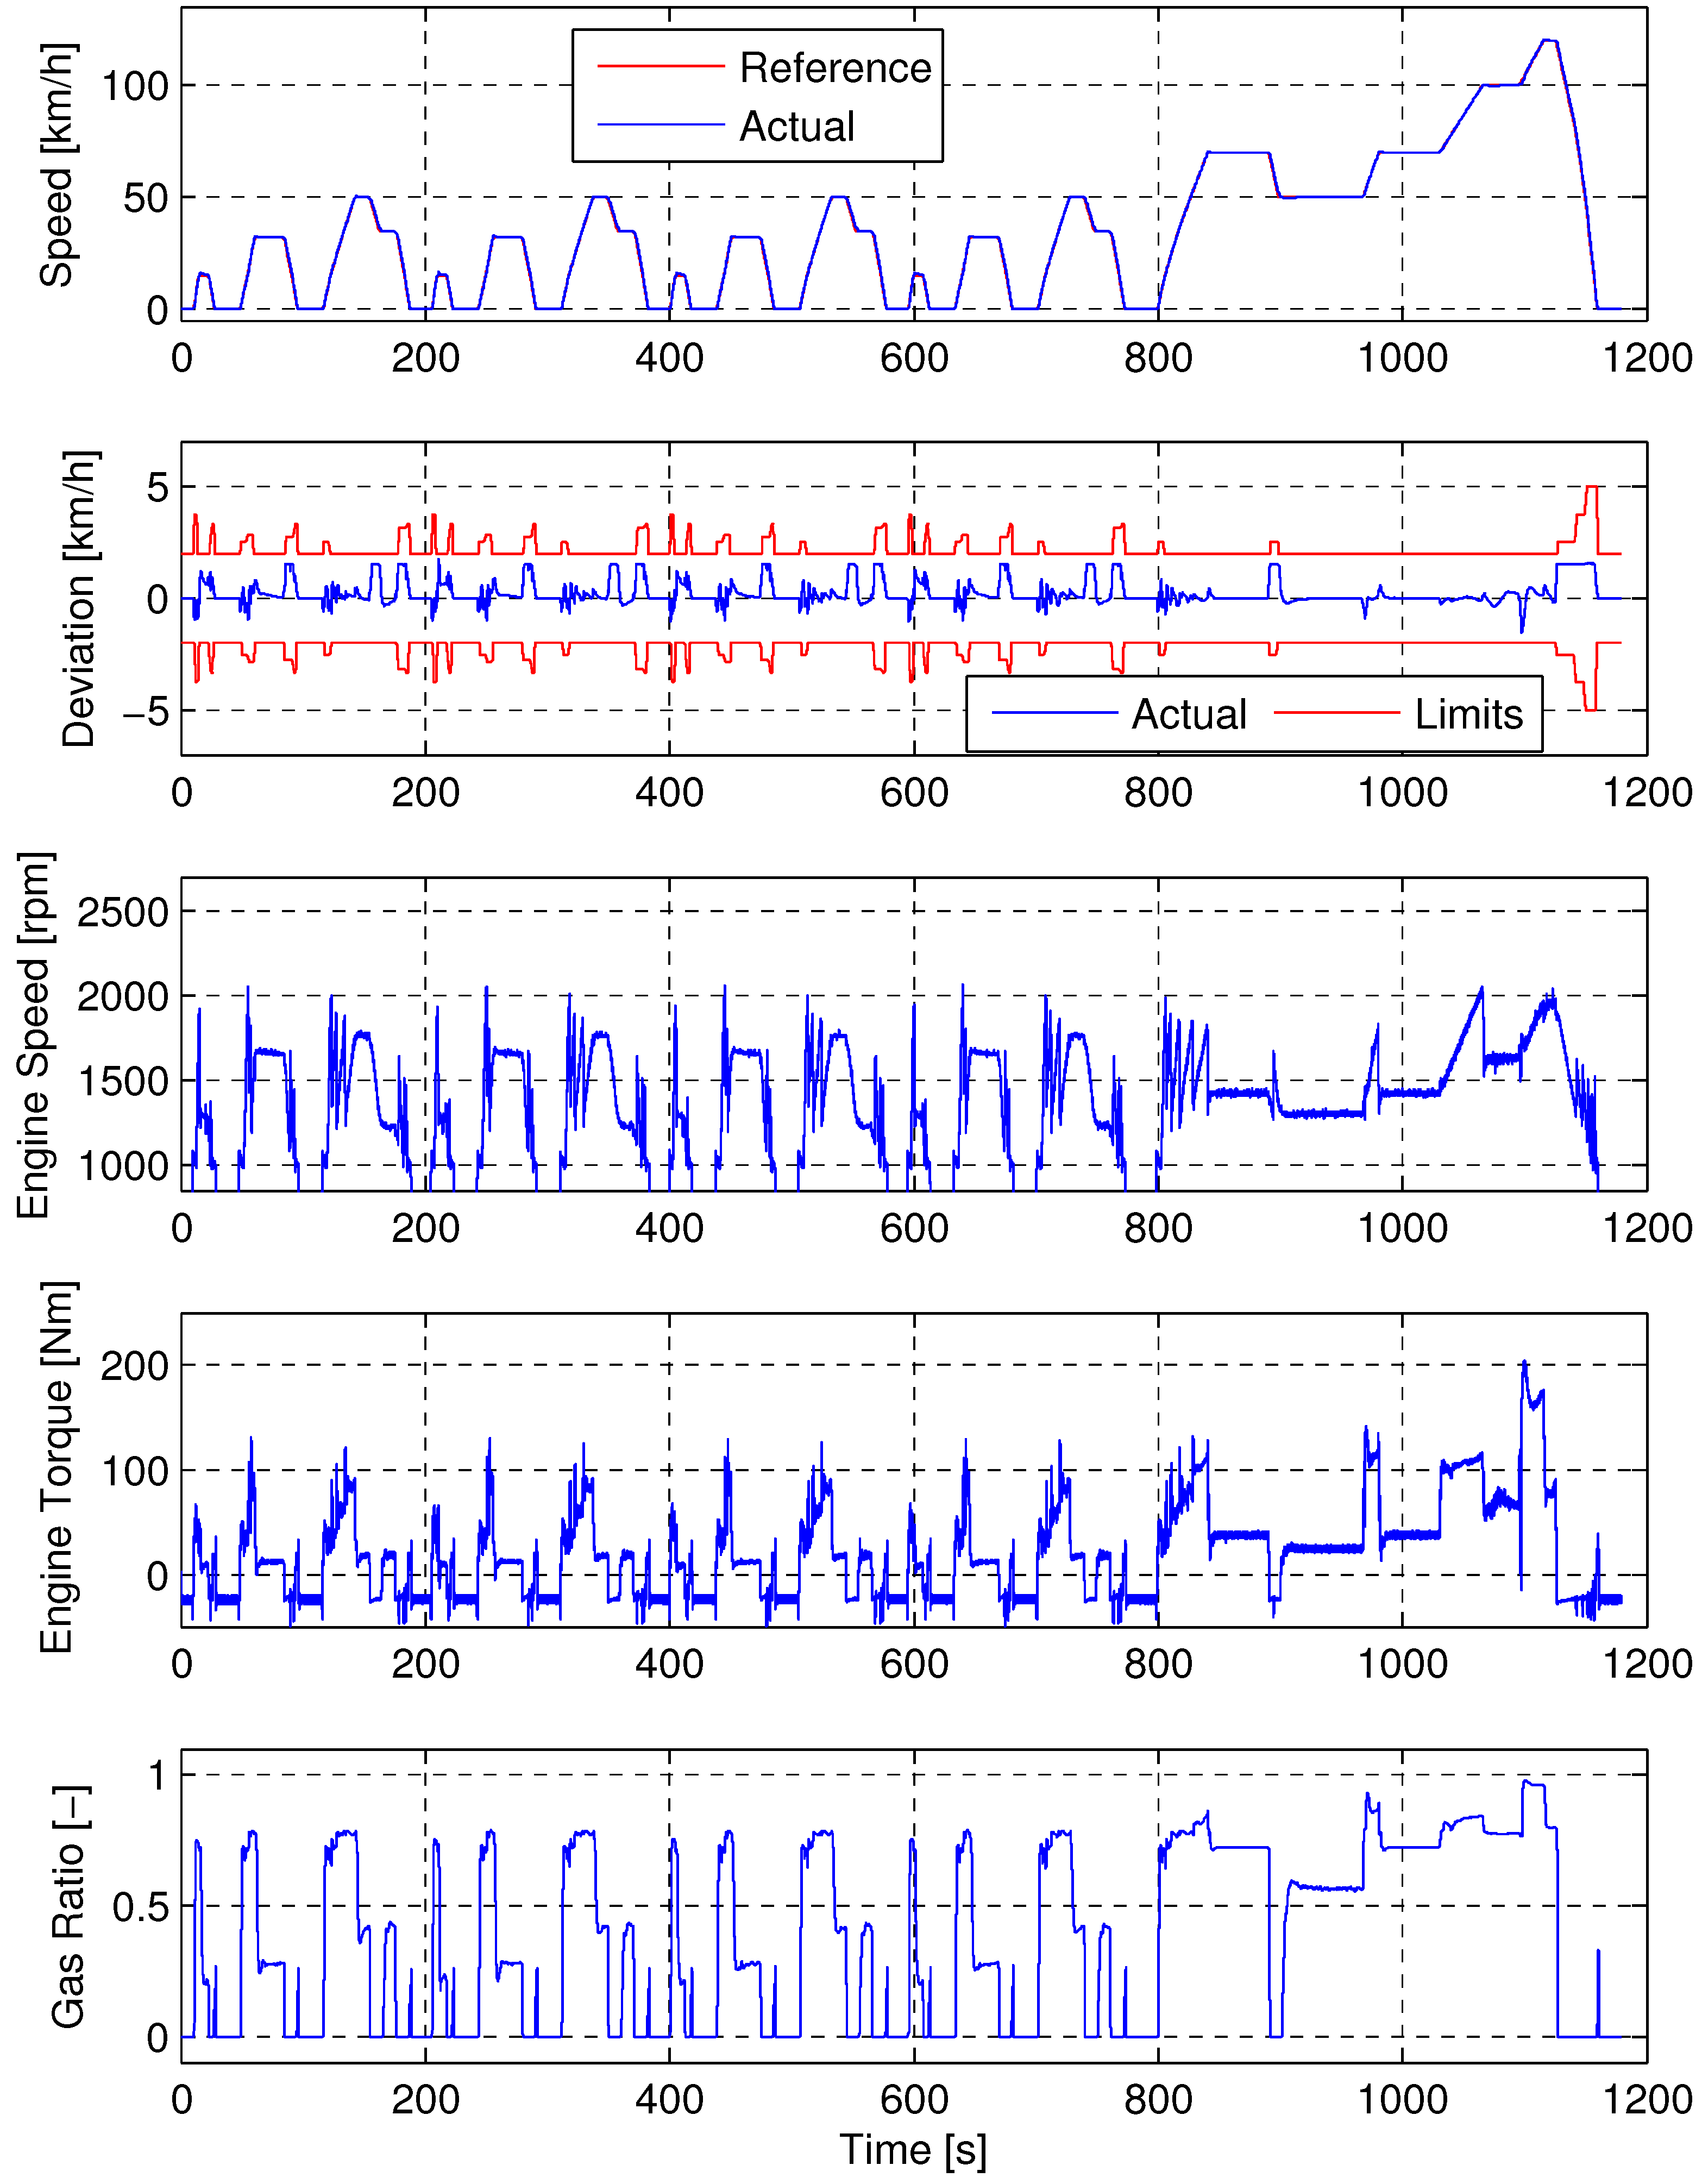
Figure 11 shows the same results for the WLTP. The first plot shows the vehicle speed. Both the reference and the actual speed are shown. The second plot shows the deviation of the vehicle speed from the reference speed of the driving cycle. The red lines indicate the maximum allowed deviation, which is either two kilometers per hour or one second. The plot shows that the actual deviation is always smaller than the maximum allowed deviation. The third plot shows the rotational speed of the engine. The fourth plot shows the measured engine torque. The last plot shows the gas ratio. The measurement results in
Figure 10 and
Figure 11 demonstrate that transient operation of the natural gas-Diesel engine is possible, thus enabling the use of the natural gas-Diesel engine in a non-hybrid powertrain.
Figure 10.
Measured vehicle emulation results for the Full-size vehicle with conventional powertrain on the NEDC.
Figure 10.
Measured vehicle emulation results for the Full-size vehicle with conventional powertrain on the NEDC.
Figure 11.
Measured vehicle emulation results for the Full-size vehicle with conventional powertrain on the WLTP.
Figure 11.
Measured vehicle emulation results for the Full-size vehicle with conventional powertrain on the WLTP.
3.2.2. Consumption Results
Table 6 shows a summary for all vehicles on the NEDC and on the WLTP. It lists the CO
emissions per distance (
), the average efficiency of the engine (
), the gas consumption per distance (
), the Diesel consumption per distance (
), the gas ratio (
), and the deviation of the final battery state of charge from the initial value (
). Since all measurements are performed three times, the table shows the mean value and the largest positive and negative deviation of all three measurements from the mean value. It has to be repeated at this point that the results of the hybrid electric vehicles have been obtained using a non-causal energy management strategy. The results for the hybrid electric vehicles must thus be regarded as an upper bound on what is achievable. This point has already been discussed in more details in
Section 2.4.10.
Table 6.
Summary of the vehicle emulation experiments for all vehicles and driving cycles. Each measurement is repeated three times. The table shows the mean value together with the maximum/minimum deviation of all measurements from the mean value.
Table 6.
Summary of the vehicle emulation experiments for all vehicles and driving cycles. Each measurement is repeated three times. The table shows the mean value together with the maximum/minimum deviation of all measurements from the mean value.
| | Vehicle | Cycle | (g/km) | (%) | (kg/100 km) | (l/100 km) | (%) | (%) |
|---|
| Hybrid | Full-size | NEDC | 68.8 | 35.4 | 2.27 | 0.25 | 92.7 | +0.21 |
| WLTP | 77.7 | 34.9 | 2.46 | 0.40 | 89.6 | +1.82 |
| Compact | NEDC | 55.9 | 35.9 | 1.88 | 0.17 | 94.0 | +0.86 |
| WLTP | 63.9 | 35.9 | 2.12 | 0.22 | 93.2 | +2.37 |
| Subcompact | NEDC | 43.0 | 35.9 | 1.40 | 0.18 | 91.5 | +1.37 |
| WLTP | 49.5 | 36.4 | 1.67 | 0.14 | 93.1 | +2.50 |
| Conv. | Full-size | NEDC | 115.4 | 25.4 | 2.66 | 1.62 | 69.6 | N.A. |
| WLTP | 109.1 | 29.3 | 2.88 | 1.14 | 77.8 | N.A. |
Table 7 shows a comparison of the total fuel energy and CO
emissions with those of the same vehicles equipped with a standard Diesel engine. The results for the vehicles with standard Diesel engines are obtained by simulation. The Diesel engine is represented by a static consumption map, which is taken from [
26]. It it is the automotive version of the engine used at the test bench for natural gas-Diesel experiments.
Table 7.
Comparison with base Diesel engine.
Table 7.
Comparison with base Diesel engine.
| | Vehicle | Cycle | Fuel energy (J/m) | Emissions of (g/km) |
|---|
| Diesel | Gas-Diesel | Change (%) | Diesel | Gas-Diesel | Change (%) |
|---|
| Hybrid | Full-size | NEDC | 1131 | 1226 | +8.4 | 82.9 | 68.8 | −17.0 |
| WLTP | 1219 | 1371 | +12.5 | 89.4 | 77.7 | −13.1 |
| Compact | NEDC | 924 | 1000 | +8.2 | 67.7 | 55.9 | −18.4 |
| WLTP | 1026 | 1140 | +11.1 | 75.3 | 63.9 | −15.1 |
| Subcompact | NEDC | 708 | 764 | +7.9 | 51.9 | 43.0 | −18.1 |
| WLTP | 807 | 886 | +9.8 | 59.1 | 49.5 | −16.2 |
| Conv. | Full-size | NEDC | 1614 | 1911 | +18.4 | 118.3 | 115.4 | −2.4 |
| WLTP | 1635 | 1853 | +13.3 | 119.9 | 109.1 | −9.0 |
The first column of the table shows the simulated fuel energy of the vehicles with a standard diesel engine, while the second column shows the measured total fuel energy for the same vehicles equipped with the natural gas-Diesel engine. The third column shows the change in fuel energy of the natural gas-Diesel engine with respect to the standard Diesel engine. The total fuel energy is higher for the natural-gas Diesel engine than for the standard diesel engine. Increases are in the range of 8.2% to 12.5% for the hybrid electric vehicles and are in the range of 13.3% to 18.4% for the conventional vehicle.
The fourth column of the table shows the simulated CO
emissions of the vehicles with a standard Diesel engine, while the fifth column shows the measured CO
emissions for the same vehicles equipped with the natural gas-Diesel engine. The results in the fifth column are the same as those shown in
Table 6. The last column shows the change in CO
of the natural gas-Diesel engine with respect to the standard Diesel engine. Even though total fuel energy is higher for the natural gas-Diesel engine, CO
emissions are lower due to the lower specific CO
emissions of natural gas. Reductions are in the range of 13.1% to 18.4% for the hybrid-electric vehicles and are in the range of 2.4% to 9.0% for the conventional vehicle.
4. Conclusions
In this paper we investigate the potential of combining electric hybridization with a dual-fuel natural gas-Diesel engine. The engine is operated lean at low to medium loads and is operated stoichiometrically at medium to high loads. All measurements are performed on a production type 2.0 litre, 4-cylinder common-rail Diesel engine. The engine is additionally equipped with cylinder pressure sensors, a low pressure EGR system and a gas port fuel injection system. No further hardware modifications are installed.
Stationary engine measurement results show that nitrogen oxide emissions are below 75 ppm for all operating points where the engine is operated lean. The soot concentration measured is below 3 mg/m for all operating points measured. The engine reaches a maximum efficiency of 39.5%. The gas ratio is low for low loads, while at higher loads, the gas ratio is increasing and reaches a peak value above 98%. The high efficiency in combination with a high gas ratio leads to CO reductions of up to 22% with respect to the base Diesel engine.
Vehicle emulation experiments for hybrid-electric vehicles in combination with the dual-fuel natural gas-Diesel engine show that very low levels of CO are achieved. Three vehicles (subcompact, compact, full-size) are investigated on two different driving cycles (NEDC, WLTP). The CO emissions vary from 43.0 g/km to 77.7 g/km. The low CO levels are due to the high efficiency of the engine and the high gas ratio. The average efficiency of the internal combustion engine varies from 34.9% to 36.4%. The energetic gas ratio lies between 89.6% and 94.1% for the vehicles and driving cycles investigated.
Vehicle emulation experiments for a non-hybrid vehicle equipped with a dual-fuel natural gas-Diesel engine show that transient operation of the engine is also possible. The natural gas-Diesel engine can thus also be used in a non-hybrid vehicle. However, the benefit of hybridization is especially large for the natural gas-Diesel engine. Hybridization drastically reduces the CO emissions of a vehicle with a natural gas-Diesel engine by two effects: First it increases the average engine efficiency by avoiding engine operation at low load and low efficiency. Second it increases the gas ratio by avoiding low-load operation, where the gas ratio is low. The resulting CO emissions on the various driving cycles are compared with simulation results for the base Diesel engine. The CO reduction of the gas Diesel-engine is between 13.1% and 18.4% for the hybrid-electric vehicles and between 2.4% and 9.0% for the conventional vehicle.
Overall, the natural gas-Diesel engine enables a considerable reduction of CO emissions with respect to the base Diesel engine. In contrast to the Diesel engine, the natural gas-Diesel engine does not require a lean nitrogen oxide aftertreatment. The additional costs of the natural gas-Diesel engine compared to those of the Diesel engine are moderate, since only little modifications are necessary. Full Diesel operation of the engine is still possible because the Diesel-relevant components remain unchanged, which makes the natural gas-Diesel engine independent for regions with limited gas filling infrastructure.
Acknowledgments
The project has been funded by the Competence Center Energy and Mobility (CCEM) and the Swiss Federal Office of Energy (BFE).
Conflict of Interest
The authors declare no conflict of interest.
References
- International Energy Agency. CO2 Emissions From Fuel Combustion, 2011; IEA Publications: Paris, France, 2011. [Google Scholar]
- International Energy Agency. World Energy Outlook, 2011; IEA Publications: Paris, France, 2011. [Google Scholar]
- Semin, R. A technical review of compressed natural gas as an alternative fuel for internal combustion engines. Am. J. Eng. Appl. Sci. 2008, 1, 302–311. [Google Scholar]
- Ott, T.; Zurbriggen, F.; Onder, C.; Guzzella, L. Cycle-averaged efficiency of hybrid electric vehicles. Inst. Mechan. Eng. Part D J. Automob. Eng. 2012, 227, 78–86. [Google Scholar] [CrossRef]
- Serrano, D.; Bertrand, L. Exploring the Potential of Dual Fuel Diesel-CNG Combustion for Passenger Car Engine. In Proceedings of the FISITA World Automotive Congress, Beijing, China, 27–30 November 2012.
- Duffour, F.; Ternel, C.; Pagot, A. IFP Energies Nouvelles Approach for Dual Fuel Diesel-Gasoline Engines; SAE Technical Paper 2011-24-0065, doi:10.4271/2011-24-0065; IFP Energies Nouvelles: Rueil-Malmaison, France, 2011. [Google Scholar]
- Eichmeier, J.; Wagner, U.; Spicher, U. Controlling Gasoline low Temperature Combustion by Diesel Micro Pilot Injection. In Proceedings of the ASME International Combustion Engine Division Fall Technical Conference, Morgantown, WV, USA, 2–5 October, 2011.
- Königsson, F.; Stalhammar, P.; Angstrom, H. Characterization and Potential of Dual Fuel Combustion in a Modern Diesel Engine. In Presented at Commercial Vehicle Engineering Congress, Chicago, IL, USA, 13 September 2011.
- Ishiyama, T.; Kang, J.; Ozawa, Y.; Sako, T. Improvement of performance and reduction of exhaust emissions by pilot-fuel-injection control in a lean-burning natural-gas dual-fuel engine. SAE Int. J. Fuels Lubr. 2012, 5, 243–253. [Google Scholar] [CrossRef]
- Papagiannakis, R.; Rakopoulos, C.; Hountalas, D.; Rakopoulos, D. Emission characteristics of high speed, dual fuel, compression ignition engine operating in a wide range of natural gas/diesel fuel proportions. Fuel 2010, 89, 1397–1406. [Google Scholar] [CrossRef]
- Selim, M. Pressure–time characteristics in diesel engine fueled with natural gas. Renew. Energy 2001, 22, 473–489. [Google Scholar] [CrossRef]
- Schmidt, T.; Weiskirch, C.; Lieske, S.; Manz, H. Modern industrial engines emission calibration and engine management. ATZ Highw. 2010, 9, 24–35. [Google Scholar]
- Ott, T.; Zurbriggen, F.; Onder, C.; Guzzella, L. Cylinder Individual Feedback Control of Combustion in a Dual Fuel Engine. In Proceedings of the IFAC Advances in Automotive Control, Tokyo, Japan, 4–7 September 2013.
- Shafai, E. Fahrzeugemulation an Einem Dynamischen Verbrennungsmotor-Prüfstand. Ph.D. Thesis, ETH, Zurich, Switzerland, 1990. [Google Scholar]
- Dönitz, C.; Voser, C.; Vasile, I.; Onder, C.; Guzzella, L. Validation of the fuel saving potential of downsized and supercharged hybrid pneumatic engines using vehicle emulation experiments. J. Eng. Gas Turbines Power 2011, 133, 092801:1–092801:13. [Google Scholar] [CrossRef]
- Schneeweiss, B.; Teiner, P. Hardware-in-the-loop-simulation am motorenprüfstand für realitätsnahe emissions- und verbrauchsanalysen [in German]. ATZextra 2010, 15, 76–79. [Google Scholar]
- Chasse, A.; Sciaretta, A. Supervisory control of hybrid powertrains: An experimental benchmark of offline optimization and online energy management. Control Eng. Pract. 2011, 19, 1253–1265. [Google Scholar] [CrossRef]
- Henning, G.; Gödecke, T.; Damm, A. Neue Getriebe für die neuen Kompakten [in German]. ATZextra 2012, 17, 70–73. [Google Scholar] [CrossRef]
- Hadler, J.; Metzner, F.T.; Schäfer, M.; Gröhlich, H.; John, M. Das siebengang-doppelkupplungsgetriebe von volkswagen [in German]. ATZ Automob. Z. 2008, 110, 512–521. [Google Scholar] [CrossRef]
- Pfaller, S.; Saal, A.; Wildgruber, M.; Bartusch, S. Intelligentes energiemanagement und effizienter generator [in German]. ATZextra 2011, 15, 36–41. [Google Scholar]
- Guzzella, L.; Sciarretta, A. Vehicle Propulsion Systems, Introduction to Modeling and Optimization, 3rd ed.; Springer: Berlin, Germany, 2013. [Google Scholar]
- Bertsekas, D.P. Dynamic Programming and Optimal Control Volume I, 3rd ed.; Athena Scientific: Nashua, NH, USA, 2005. [Google Scholar]
- Sundström, O.; Guzzella, L. A Generic Dynamic Programming Matlab Function. In Proceedings of the 18th IEEE International Conference on Control Applications, Saint Petersburg, Russia, 8–10 July 2009.
- Sundström, O.; Guzzella, L.; Soltic, P. Optimal Hybridization in Two Parallel Hybrid Electric Vehicles using Dynamic Programming. In Proceedings of the 17th IFAC World Congress, Seoul, Korea, 6–11 July 2008.
- Ambühl, D. Energy Management Strategies for Hybrid Electric Vehicles. Ph.D. Thesis, ETH, Zurich, Switzerland, 2009. [Google Scholar]
- Hadler, J.; Rudolph, F.; Engler, H.J.; Röpke, S. Der neue 2,0-l-4V-TDI-Motor mit common-rail-einspritzung [in German]. MTZ Motortech. Z. 2007, 68, 914–923. [Google Scholar] [CrossRef]
© 2013 by the authors. Licensee MDPI, Basel, Switzerland. This article is an open access article distributed under the terms and conditions of the Creative Commons Attribution license ( http://creativecommons.org/licenses/by/3.0/).

