1. Introduction
Several criteria have been proposed, over the last few decades, to evaluate the advantages of cogeneration and different aspects have been taken into account. Cogeneration was initially mainly proposed for industrial applications, and attention was mainly focused on improving energy efficiency and on the resulting economic impact. Another advantage of cogeneration was due to the possibility of increasing the autonomy in power production with respect to the grid. Combined heat and power (CHP) was then expanded to other sectors: residential (mainly district heating) and tertiary (offices, hospitals, supermarkets, hotels). With the liberalization of the electricity market (which was introduced in the European Union in 1996), the production of power from CHP underwent a further expansion. Moreover, increasing attention towards sustainable development has highlighted the advantages of CHP, in terms of primary energy savings and pollutant reduction. CHP has also been considered one of the possible ways of reducing greenhouse gas.
Different criteria can be adopted to quantify the improvements made with CHP solutions or to compare different solutions. Classical indexes are based on energy analysis, in which all the useful energies (work and heat) have the same weight. The criteria of the second law of thermodynamics have been proposed (exergy efficiency) to improve information on CHP. In this approach, it is important not only how much heat is available but also at what temperature it is available.
The main environmental factor that has to be taken into account is the impact of pollutant emissions, and this factor is closely connected to both the fuel that is used and to the prime mover technology. CHP can reduce pollutant emissions in certain conditions: a high total efficiency intrinsically reduces emissions, but the emission factors of CHP need to be analysed to understand whether there will be a real advantage. It is in fact possible to obtain a reduction in emissions for one pollutant, but an increase for another.
However, the economic aspect should also be taken into account. The main issues affecting this aspect are: fuel and power prices, prime mover capital costs, maintenance costs, fiscal incentives, effective power, heating requirements, etc.
These topics have often been discussed in technical literature [
1,
2,
3,
4,
5,
6,
7,
8,
9,
10,
11,
12,
13,
14,
15]. Feng
et al. [
1] proposed a new performance index for cogeneration systems that takes into account the effect of “anergy” in heating, and compared it with four well-known criteria: energy utilization factor, artificial thermal efficiency, fuel energy saving ratio and exergy efficiency. Nussbaumer and Neuenschwander [
2] analysed CHP from an economic point of view and introduced two dimensionless numbers: dimensionless capital costs and dimensionless fuel costs. Their approach allows CHP technologies, with different fuels, to be easily compared in different countries, and with different currencies. Bhatt [
3] has identified nine different parameters that characterize a CHP-unit, and has also underlined the importance of comparing the heat-to-power ratio of the prime mover with the heat-to-power ratio of the load. Pilavachi
et al. [
4] have applied a multi-criteria method to a CHP plant and obtained a General Index of Sustainability. Seven factors are considered to assess their index: efficiency, installation costs, fuel costs, electricity costs, heat costs, CO
2 emissions and energy footprint. These factors are normalised with the weight coefficients and sixteen systems, with different CHP technologies and plant sizes, are compared. The authors stated that the results obtained with their method could be used to establish the most important factors that can influence the performance of a system. Nesheim and Ertesvag [
5] have analysed the energy indexes that are adopted in the legislation of different countries and indexes based on exergy. Two plants have been simulated and compared using the aforementioned indexes. The authors have also discussed the importance of reference plants for separate electric and heat generation, and two possible choices have been underlined: best available technology (BAT) and an average of existing installations. Ertesvag [
6] has continued the work he started in [
5] and introduced a second law index named relative avoided irreversibility; industrial CHP and district heating CHP have been analysed as case studies, and both natural gas and biomass have been considered. He observed that some indexes overstate or underestimate improvements and, in some cases, exergetically poor systems could be favoured. In [
7], Mancarella and Chicco have analysed global and local emissions in distributed cogeneration, and suggested some specific indicators. In [
8], the same authors have introduced a new environmental index, trigeneration CO
2 emission reduction, which can be used to compare a trigeneration plant with conventional separate production of heat and power, and they have considered CHP as a subcase of the trigeneration analysis. They presented case studies, based on current technologies (microturbines, internal combustion engines, gas turbines, combined cycles), and discussed CO
2 emission reductions: the results mainly depend on the technology that was used for the combined production and on the composition of the energy generation mix. Kanoglu and Dincer [
9] have analysed four cogeneration plants in which the heat is supplied to buildings: steam-turbine, gas-turbine, diesel-engine and binary geothermal plants. The adopted criteria were energy and exergy efficiencies, and the latter was more suitable when there were geothermal systems in the comparison. Ruan
et al. [
10] have studied CHP for commercial buildings (hotels, hospitals, stores and offices) and proposed an overall evaluation index that takes into account primary energy savings, CO
2 reduction, and payback. Sanaye and Ardali [
11] have focused attention on microturbine CHP with the aim of estimating the optimal power and the number of units that maximize the annual profit, that is, the objective function; the payback period was also estimated. Kavvadias
et al. [
12] have discussed the design of a trigeneration system for a hospital building: two different electricity tariffs and different strategies to cover the loads were analysed. Different seasonal energy profiles were also taken into account. Particular attention was paid to energy indexes (overall efficiency, primary energy savings, system load coverage) and two economic indexes (annual operating profit and return of investment); no environmental or exergy indexes were considered. Wheeley
et al. [
13] have compared CHP systems for different industrial manufacturing applications using the simple payback, the internal rate of return and the net present value. The authors checked the effects of some factors on these indexes, such as operating hours, electric utility rate, facility thermal load, fuel type and fuel costs.
Compernolle
et al. [
14] have analysed a CHP system for greenhouse cultivation using the net present value approach and the local and global scale balance for CO
2, CO and NO
x. The authors concluded that CHP can be a cost effective technology for greenhouse cultivation and can help to reach emission reduction targets. However, tailored policies and support measures are necessary to promote CHP in the agricultural sector because new technical and management skills are necessary for the farmer, and higher investment are required. Maes and Van Passel [
15] have studied an interesting policy aspect: the interference between different public policies promoting energy efficiency and CO
2 reduction. In fact, when authorities favour a technology, other energy technologies may in find themselves a less favourable position on the market. The authors analysed this aspect in a case study in which a hybrid energy system combined two complementary heating techniques: CHP and thermal solar panels. Two regions, the Netherlands and Flanders, were compared, and critical results were obtained for the latter: CHP has been favoured so much that solar panels are no longer of interest to investors. However, as far as the authorities are concerned, a more balanced policy would result in a larger CO
2 reduction for a lower cost.
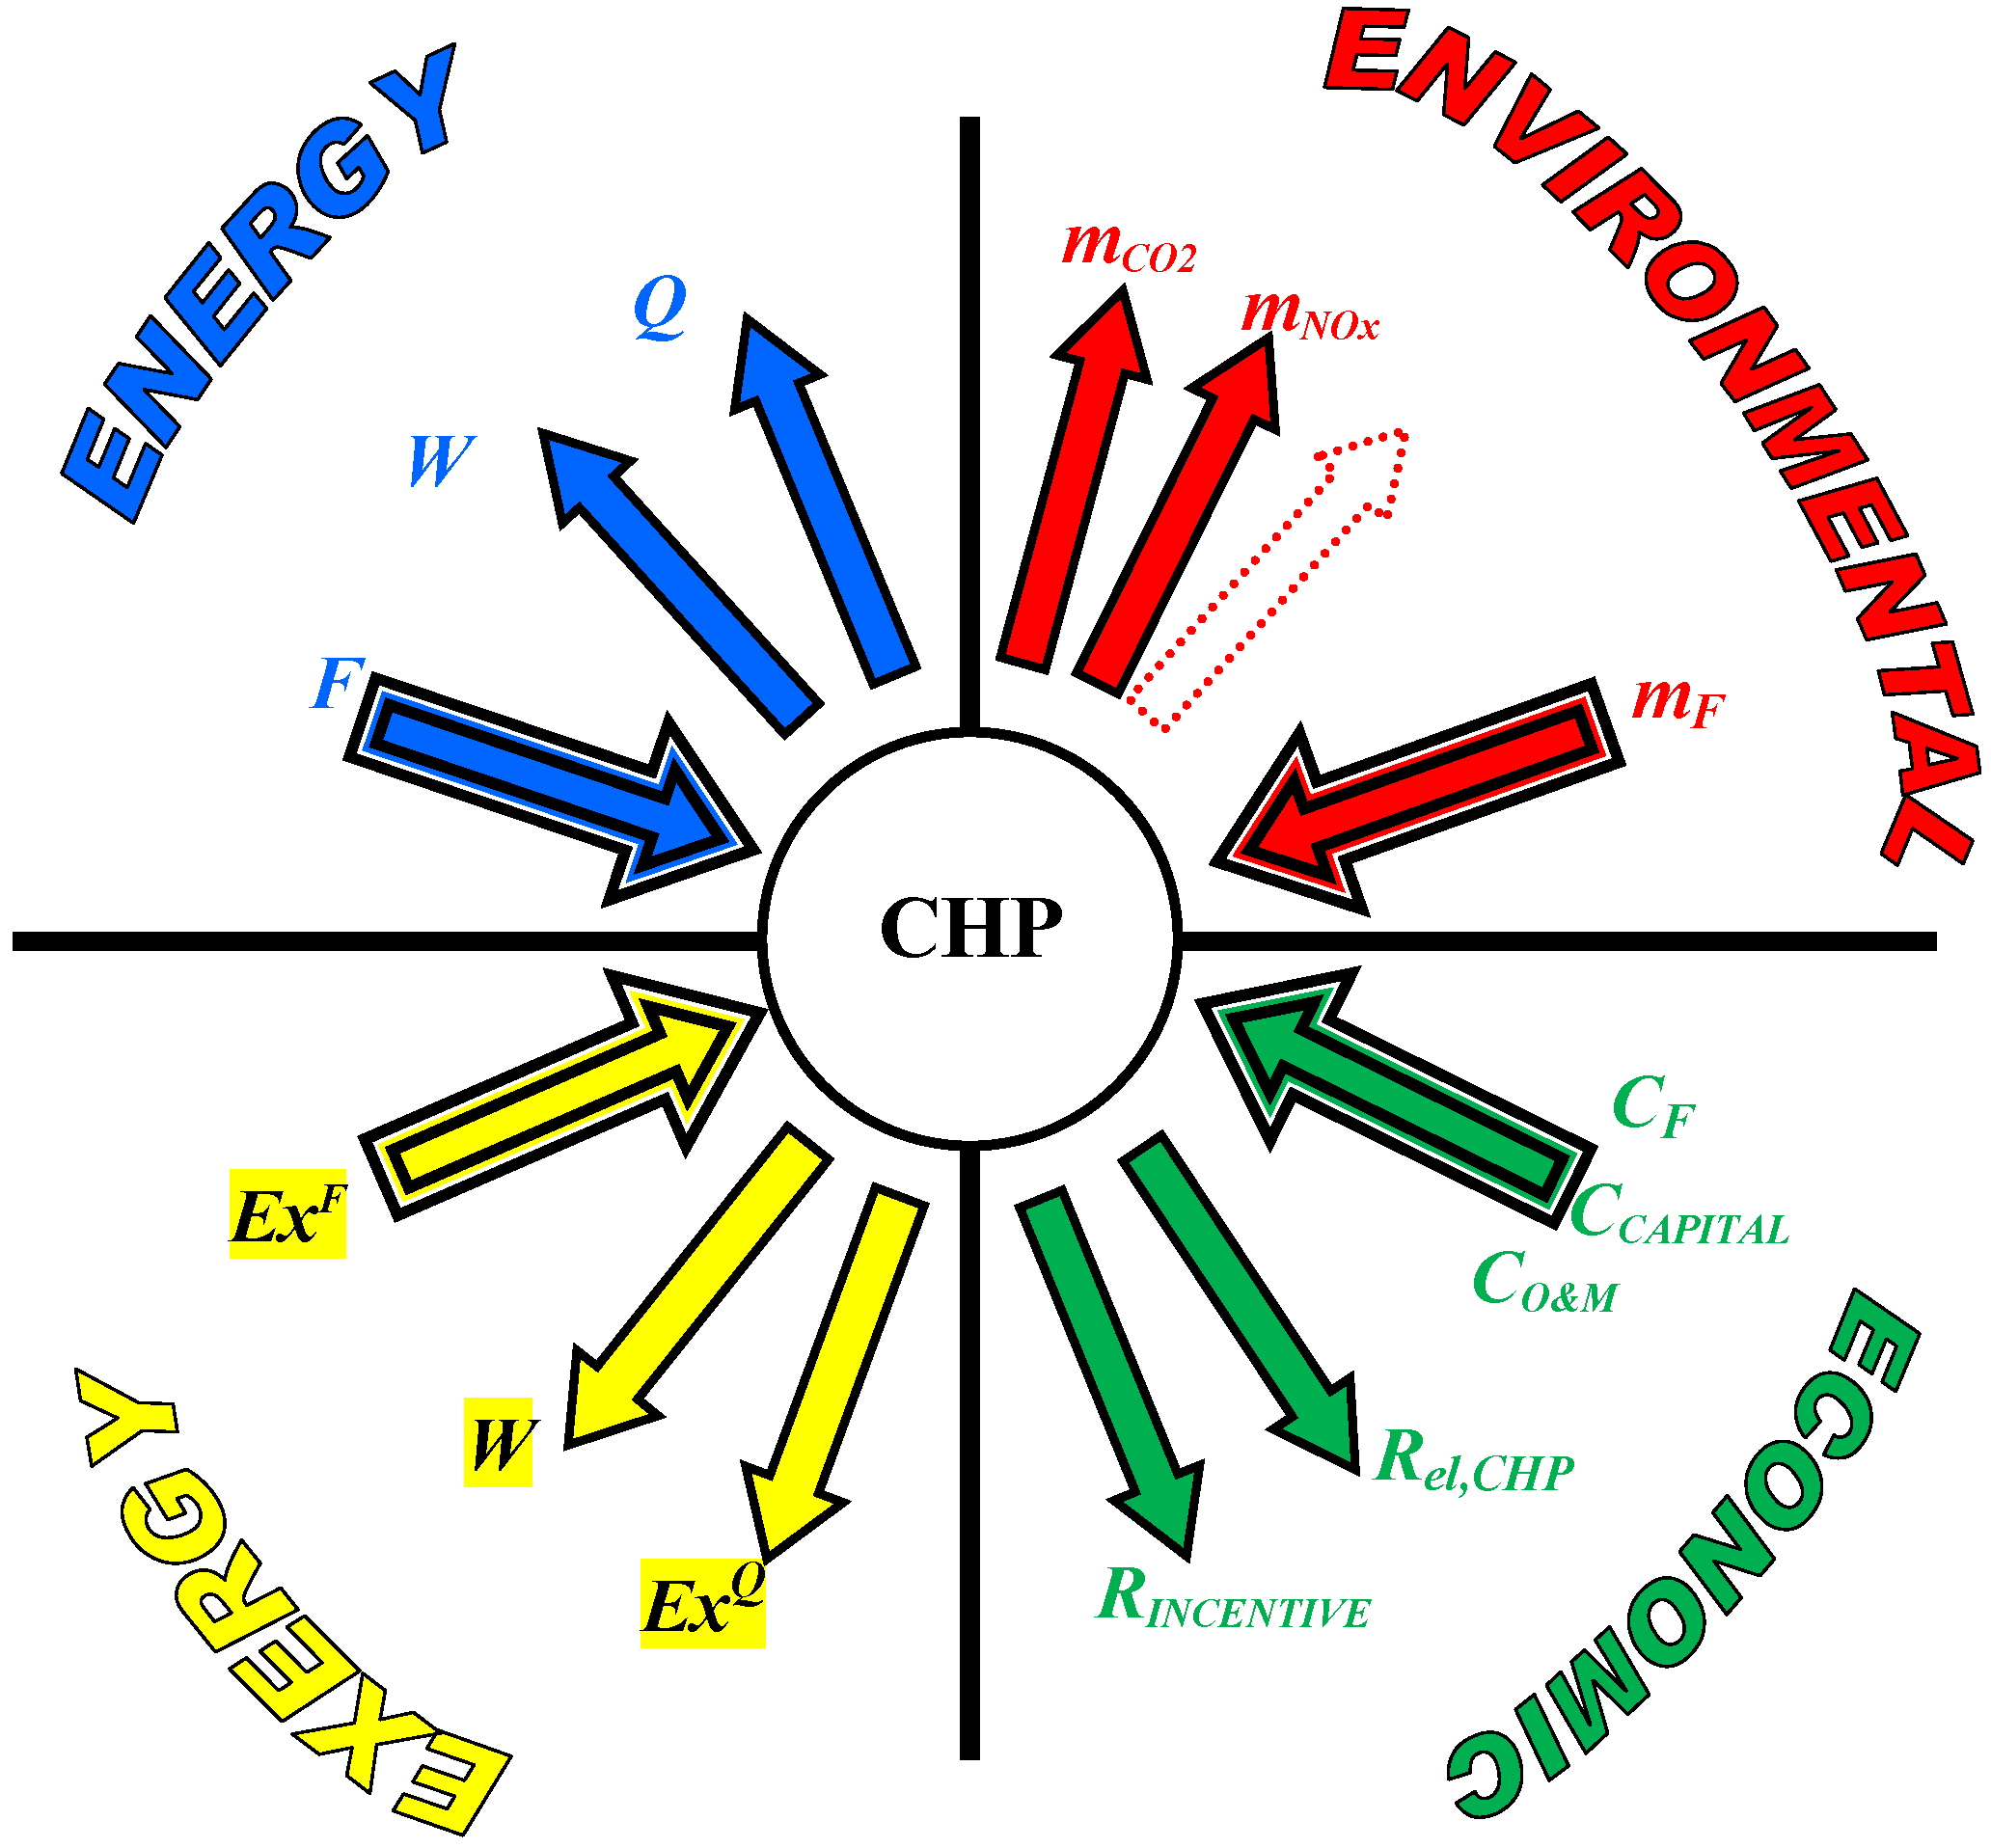
In the first part of the present work, CHP criteria pertaining to energy, exergy, environmental (pollutant emission) and economic aspects have been investigated and compared. For each aspect, particular attention has been paid to the saving indexes. The main quantities concerning the energy, exergy, emission and economic balances are summarised in
Figure 1. The importance of obtaining information for both the individual CHP-unit and the CHP-system has been underlined. CHP-system is here intended as the whole system consisting of all the cogeneration units and the auxiliary plants necessary to cover the users’ demands. Five indexes have been introduced to evaluate the cogeneration potential: one for energy saving, one for exergy, two for environmental aspects (global and local scale) and one for the economic aspects. Finally, the main indexes analysed in the paper have been applied to a case study concerning a district heating cogeneration system, and the different behaviour of the saving and potential index has been evaluated and discussed.
Figure 1.
The main quantities concerning the energy, exergy, emission and economic balances used to analyse the CHP (see the nomenclature for the meaning of the symbols).
Figure 1.
The main quantities concerning the energy, exergy, emission and economic balances used to analyse the CHP (see the nomenclature for the meaning of the symbols).
4. CHP Environmental Criteria
Increasing attention to environmental problems has led to the introduction of more and more stringent restrictions with regard to emissions. At present, a great deal of attention is directed towards greenhouse gases (CO
2, CH
4, N
2O, fluorinated gases), which are expressed in CO
2 equivalents. However, several other pollutants are also important: nitrogen oxides (NO
x), sulphur oxides (SO
x), particulate matter (PM), carbon monoxide (CO), unburned hydrocarbons (HC),
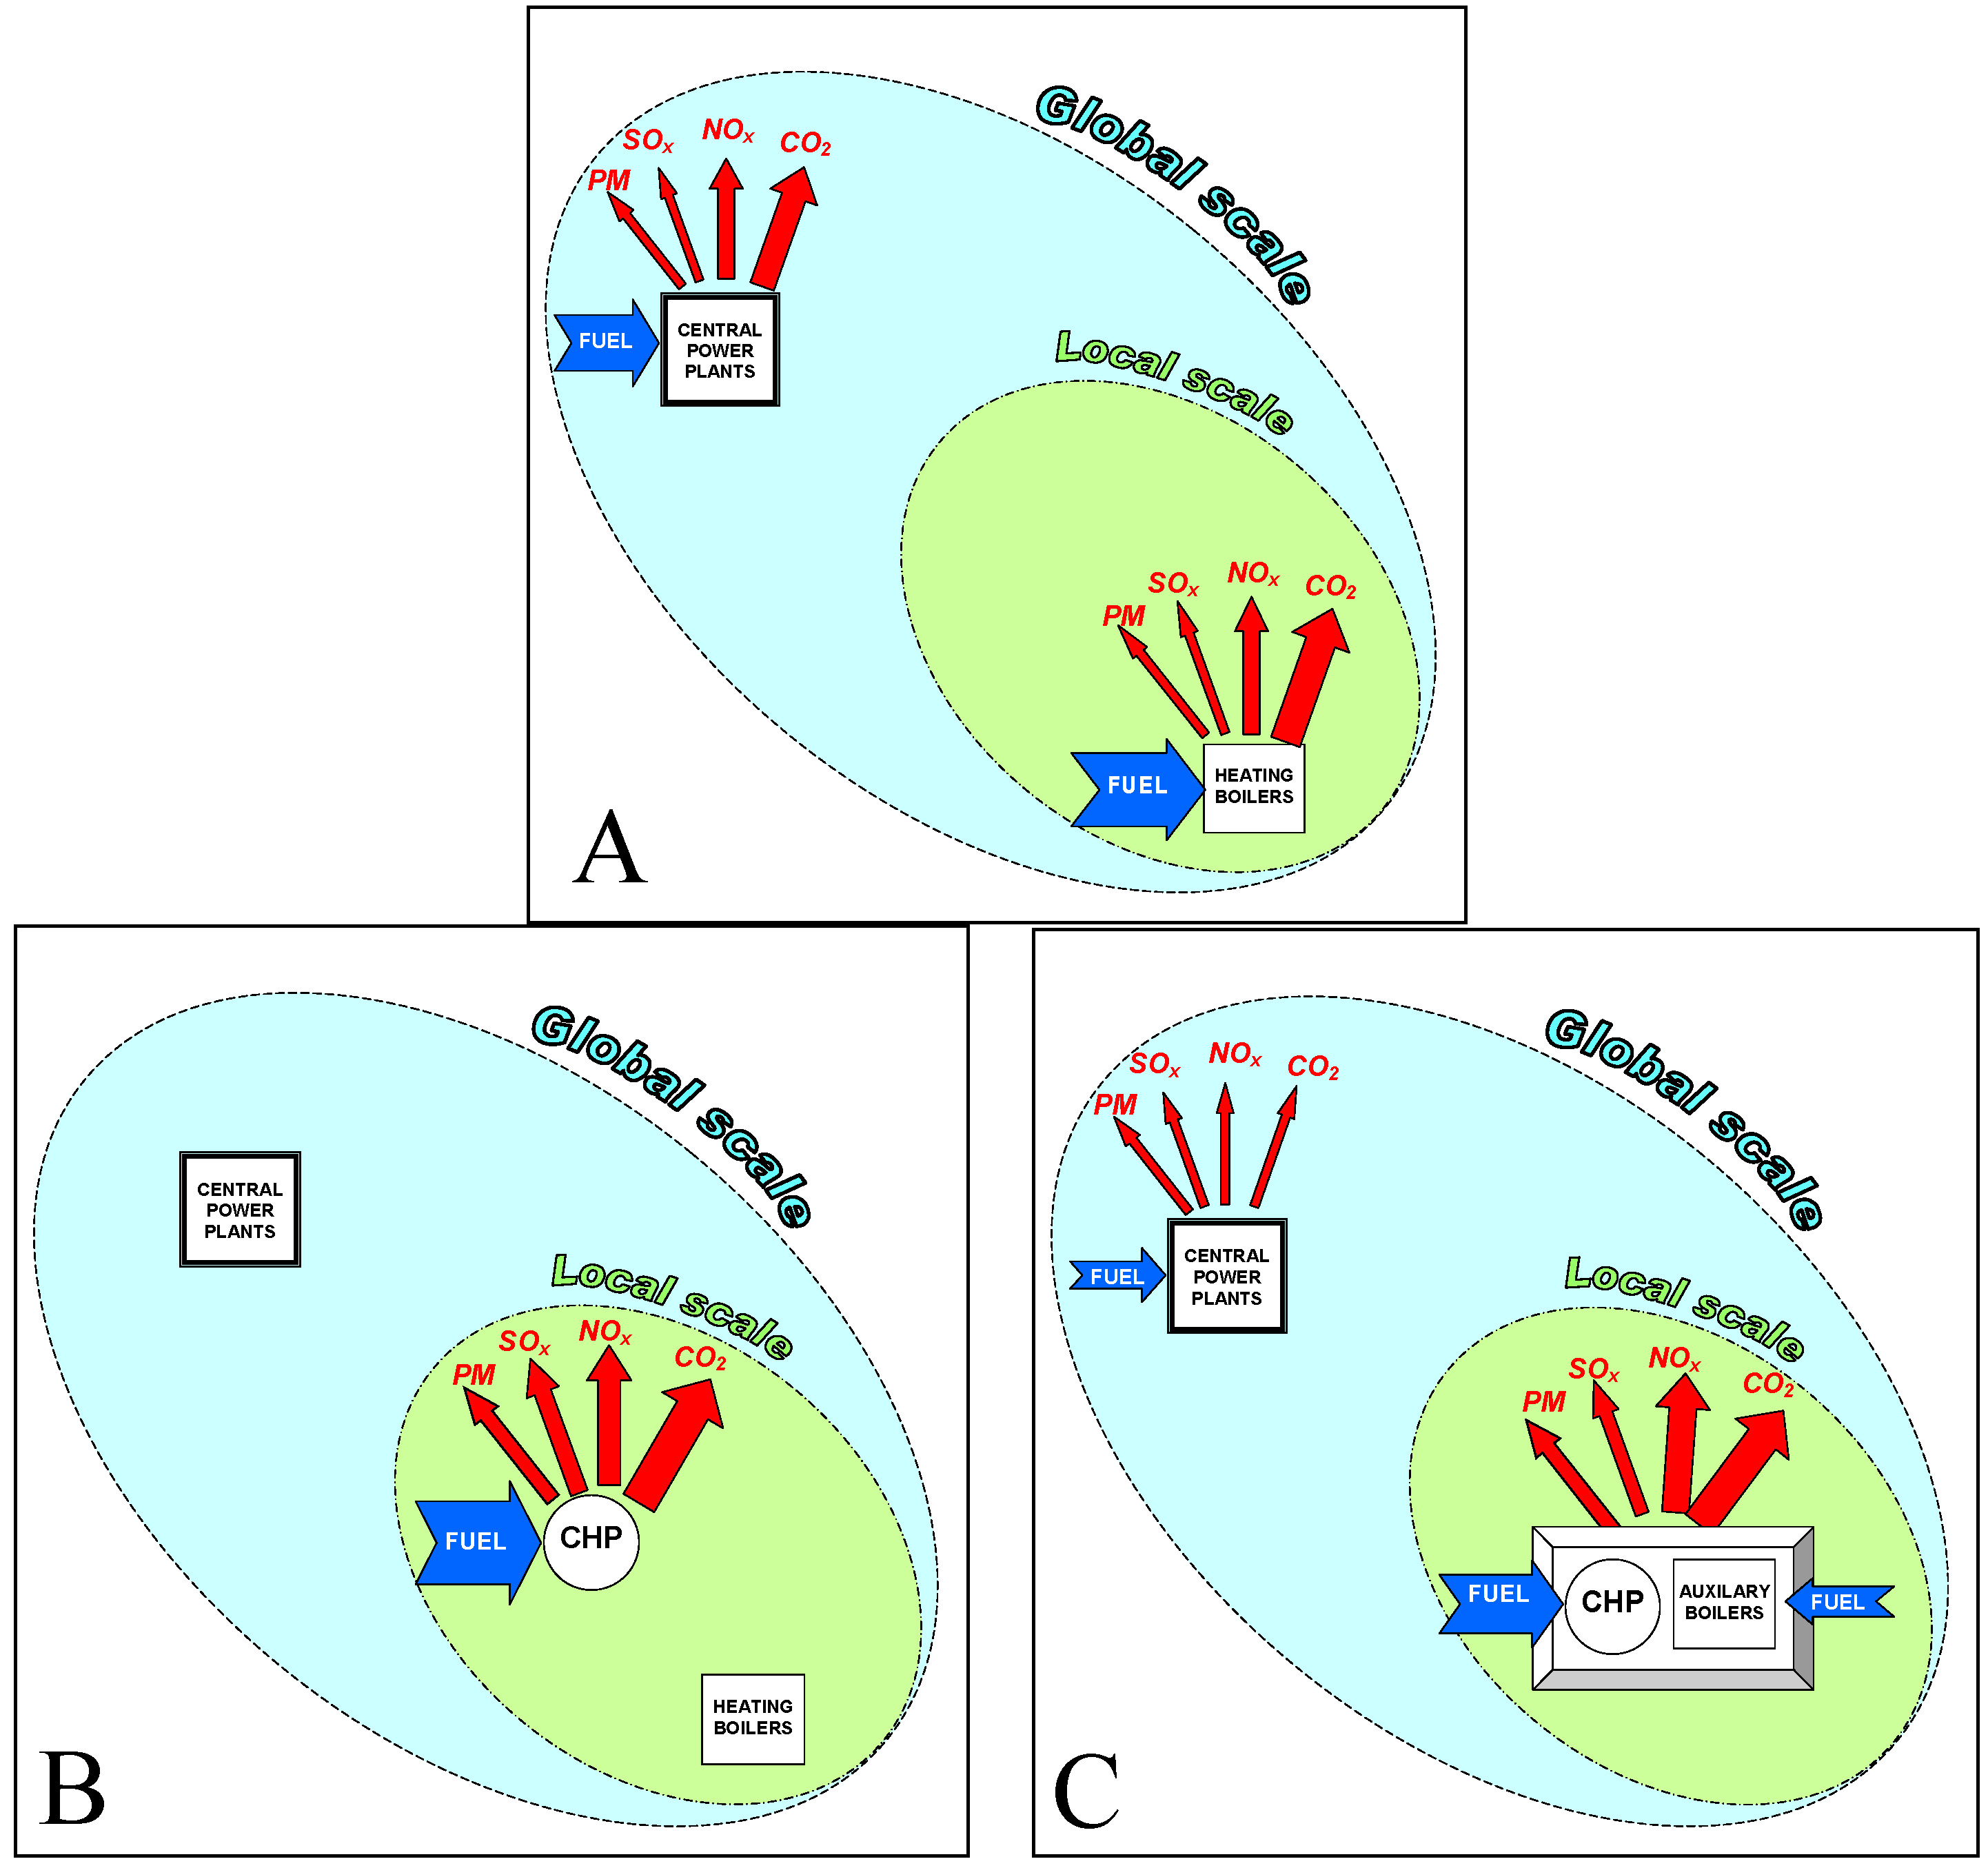
etc. CHP technologies can reduce emissions due to the increase in efficiency, but in some cases the net emissions can increase, and a dedicated balance should therefore be conducted for each pollutant and each CHP technology. Before conducting a balance, it is necessary to define the boundaries of the area, and two cases are significant [
7]: global scale balance, in which both the on-site plants and central power plants are taken into account, and local scale balance, in which only the on-site plants are taken into account. This distinction is important and the pollutant indexes have therefore been presented distinguishing between these two boundaries. A schematic drawing of an SHP is given in
Figure 2A, while
Figure 2B shows the case of a CHP-unit which is matched exactly to the power and heat demands.
Figure 2.
Schematic comparison of the emissions (global and local scale). A: SHP; B: the CHP-unit is matched exactly to the power and heat demands; C: the CHP-unit is not matched exactly to the power and heat demands; a CHP-system (composed of CHP-units, auxiliary boilers, and central power plants) has therefore been considered.
4.1. Pollutant Saving Indicators (Global Scale)
4.1.1. Absolute Pollutant Saving (Global Scale)
A global emission balance can be conducted for each pollutant (subscript
j):
In order to obtain an improvement at a global scale, the following conditions should be satisfied for each pollutant:
The absolute saving is often cited for GHG emissions, in order to promote the environmental benefits of a technology, but this value is closely linked to the size of the plant and a relative value is more significant.
4.1.2. Relative Pollutant Saving (Global Scale)
These equations can be written by introducing emission factors, and in particular the CHP emission factor definitions for each j-th pollutant are
and the emission factors definitions for SHP electric production and for SHP-thermal production are
Therefore the Equation (30) can be written as
It is useful to rewrite Equation (33), introducing the CHP-unit efficiencies:
and the SHP efficiencies:
Equation (35) shows that the avoided emissions are functions of several factors: the fuels that are used and the technologies that are adopted for both SHP and CHP. In this case, three different emission factors and four efficiencies are present. Equation (35) is a general equation that can be applied to each j-th pollutant. When CO
2 emissions are analysed, a further simplification can be made by introducing two hypotheses: the same fuel is used for CHP and SHP, and a complete combustion of the fuel is assumed, in this way, the emission only depends on the fuel characteristics. These conditions entail that the same emission factor is present as both the numerator and as the denominator, and Equation (35) can be simplified to:
Equation (36) is the same as Equation (16), and the
index therefore coincides with
PESR. These considerations have been extended to trigeneration systems in [
8].
4.1.3. Potential Indexes for Pollutant Saving
When the CHP-system is considered, the following can be written for each j-th pollutant:
A schematic representation of the local and global scale pollutant emissions for the CHP-system is shown in
Figure 2C. This representation can be compared with SHP (
Figure 2A), and with the CHP-unit (
Figure 2B). Therefore, the CHP-system pollutant saving is:
and the potential index at a global scale is:
4.2. Pollutant Saving Indicator (Local Scale)
A distinction between global and local scale is fundamental in order to understand whether there is a real environmental improvement due to cogeneration. Greenhouse gases are usually analysed with reference to their global effects (it could also be useful to differentiate between the local and global scale for CO
2 in order to establish where it has been produced). However, the local environmental impact is more important than the global one for other pollutants, because these pollutants could have adverse health effects on the local population. Therefore, a local emission balance should be conducted for each j-th pollutant in order to obtain the local indexes (superscript
L). The main local saving indexes are shown in
Table 2 and compared with the global indexes.
It should be noted that, if the emission factors in are equal, cogeneration does not improve local emissions (because the thermal efficiency of a CHP-unit is usually lower than that of an SHP). Therefore, in order to obtain an improvement at the local scale, it is necessary for the emission factor ratio to compensate the ratio of these thermal efficiencies.
In addition to the local scale balance, other analyses can be conducted to obtain knowledge on the environmental impact connected to the geographical sites of the plants. For example, it is possible to evaluate the concentration of a pollutant using a dispersion model applied to the area surrounding the plant. The dispersion of a pollutant could be estimated and two maps could be obtained, one with the CHP plant and one without (i.e. with the SHP heating system). If these maps are compared, it is possible to evaluate whether some parts, and which parts, of an area undergo improvement. An example of this type of analysis is discussed in [
23], in which a CHP district heating plant has been analysed using a Gaussian dispersion model and the maps of the concentration of some pollutants (NO
x, SO
x and PM) are discussed. As an alternative to the graphical comparison, an index could be calculated from the mean spatial distribution of the pollutant concentration, that is, a spatial integral is calculated over the area of the dominion. These evaluations are interesting, but require more detailed information (the orography of the site, weather data, the height of the stack,
etc.) and are more complex.
Table 2.
The main equations for the evaluation of the global and local pollutant savings.
Table 2.
The main equations for the evaluation of the global and local pollutant savings.
| Type of index | Global scale | Local scale |
|---|
| Absolute saving | | |
| Relative saving | | |
| Potential index | | |
6. Case Study
The savings and potential indexes discussed in the previous sections are presented hereafter applied to a case study. The case study refers to the district heating system with CHP plants studied in [
23], where a district heating system was introduced in Northern Italy to substitute the existing heating systems. The environmental aspects were also investigated in [
23] through a dispersion model. In the present analysis, in addition to energy and environmental aspects, exergy and economic aspects will also be considered. The main characteristics of the case study concern:
SHP: the thermal loads of the existing buildings are covered by local boilers. The local heating system data have been obtained from the governmental environmental office, which does a periodic check on the heating plant. The main fuels used in the local boilers were oil and natural gas. The yearly thermal energy requirement is 36.4 GWh and the peak load is 21.7 MW. Data from the Italian plant stock has been adopted for central power plant.
CHP SYSTEM: in the district heating generation plant there are both auxiliary boilers and CHP units. In order to take into account the heat losses in the network, the thermal energy requirements have been increased by 5.6%. The fuel is natural gas and the adopted CHP technology is internal combustion engines. The CHP units have a total power generation of 3.6 MW and a heat generation of 3.8 MW. Additional information on the case study can be found in [
23]: the daily heating load curves, the monthly distribution of the heating load, the boiler part load efficiencies,
etc.As far as the economic aspects are concerned, the following assumptions have been done: the adopted discount rate is 5%; the CHP capital costs and maintenance costs have been obtained from [
16] and the data have been updated from consumer price indices. The fuel costs have been calculated considering the Italian market and tax advantages for district heating have been taken into account. The main considered revenues are: sale of the surplus CHP power and an incentive due to the energy efficiency certificates, which are known as “white certificates” [
30].
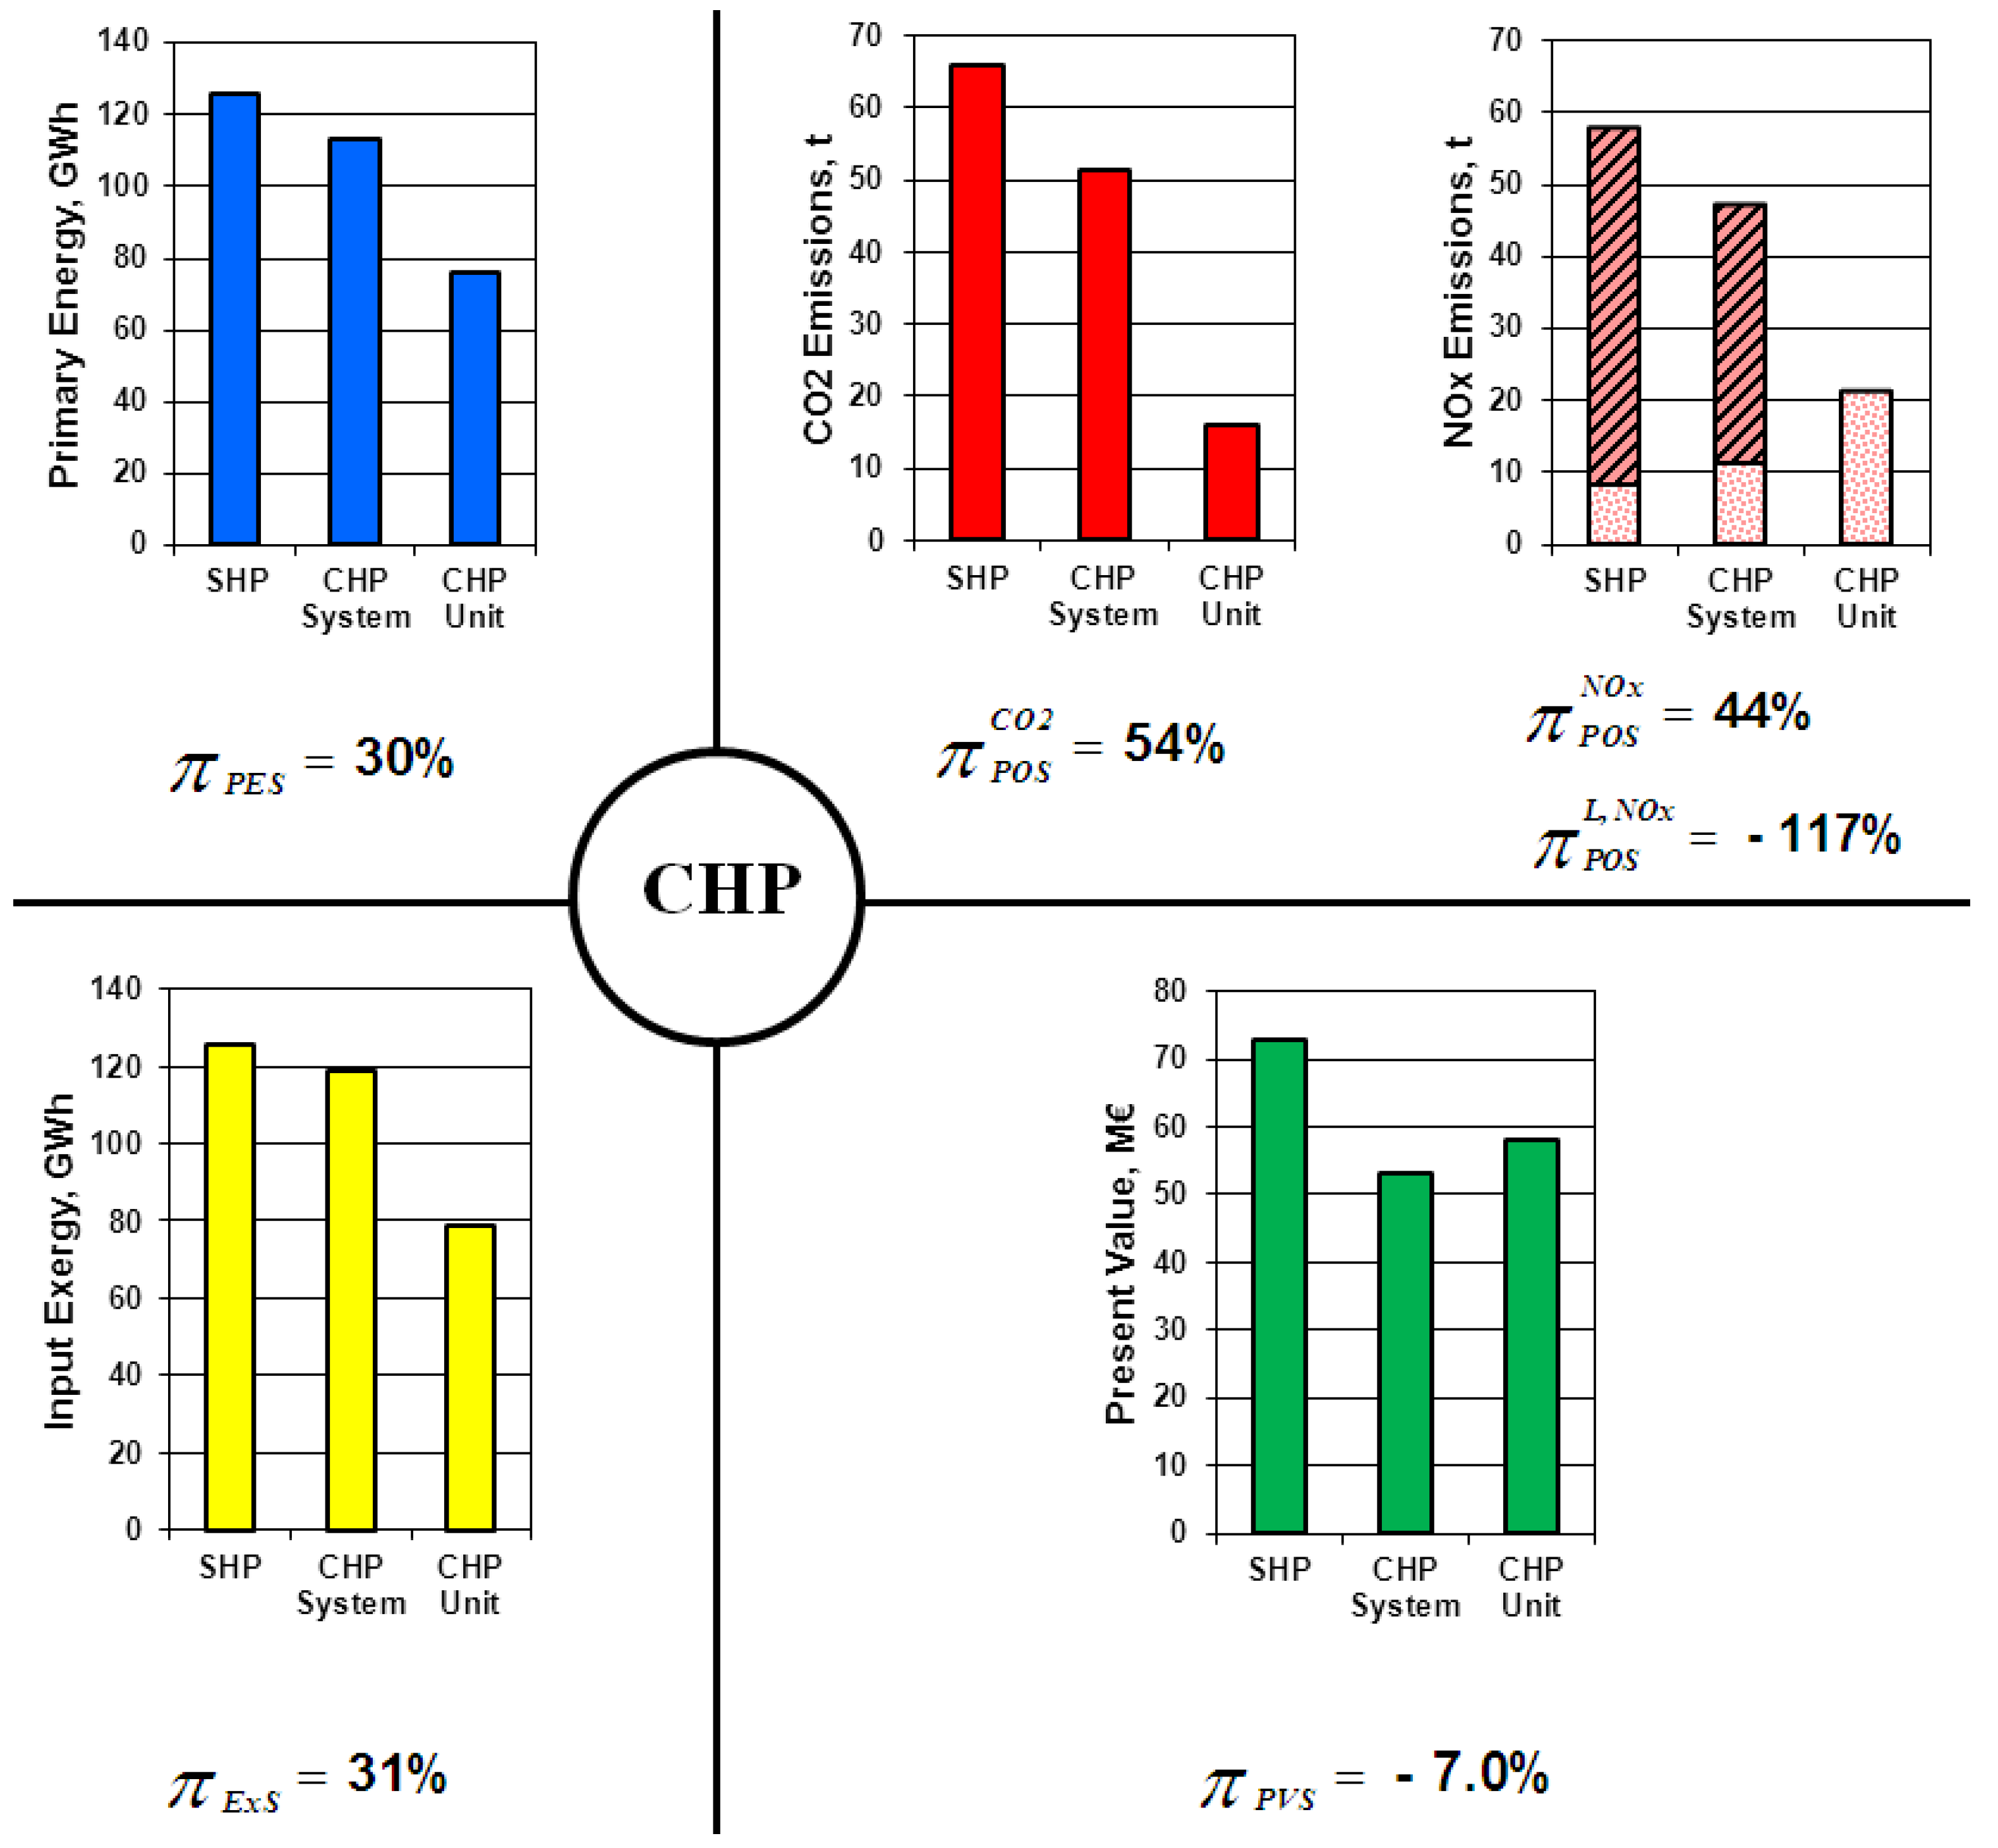
The results of the analysis of the main indexes proposed in the present paper are shown in
Figure 3. The blue bars indicate the yearly primary energy. The energy saving for the proposed CHP-System is 10%, while for the CHP-units is 40%. A high potential value, 30%, can therefore be observed. This high value is due to the district heating load coverage; the auxiliary boilers are in fact adopted both in the mid-season and in off peak hours. When the input exergies are compared (yellow bars), the exergy saving is 6% for the CHP-System and 37% for the CHP-units. The potential index is 31% and this value is close to that of the primary energy saving.
Two environmental evaluations (red bars) have been conducted: one for CO
2 and another for NO
x. The CO
2 savings is 22% for the CHP-System and 76% for CHP-unit. These values are much higher than the primary energy saving because the emission factors of the SHP system are high and the potential index, 54%, is therefore high. As far as the NO
x emissions are concerned, the emissions at a local scale (dotted bars) are distinct from the emissions from the central power plant (hatched bars), as can be seen in the
Figure 3. In the global scale balance, the NO
x saving is 19% for the CHP-System and 63% for the CHP-unit. Therefore, a positive potential index of 44% can be observed. The local scale balance instead gives more critical results: the CHP-System shows a negative NO
x saving (−33%), which means the local emissions are increased. This deterioration could further increase to −150% if cogeneration increases. The potential index is therefore negative, −117%, which means that an increase in cogeneration units leads to a deterioration of this environmental aspect.
Finally, the economic saving indexes are discussed. The increase in cogeneration leads to an increase in the capital cost, the fuel purchase and the O&M cost. On the other hand, the revenues also increase, in particular the power sales and the energy efficiency certificates. The green bars in
Figure 3 show the present values of all the costs and revenues [Equation (40)]. The CHP-system leads to present value saving of 27%, while the CHP-units give a lower saving of 20%, and a negative potential index of −7% is found from these values. Therefore, an increase in cogeneration could have negative economic implications.
A “snapshot” of the proposed CHP solution can be obtained by looking at all the potential indexes together. From the energy and exergy point of view, there are still significant margins to increase the CHP. The environmental aspect is favourable at the global scale and unfavourable at the local scale. The economic index suggests that caution should be taken when CHP is increased.
The analysis of this snapshot could be useful both to policy-makers and investors, who will both, however, view it from different points of view. National and local governments could benefit from having more comprehensive information. At a national level, indices like the
PES or
POSCO2 are usually privileged but for a local government the goal is generally on improving the quality of the conditions of the people who are governed; for example in the case study,
Figure 3, there is a deterioration of the NO
x emissions due to the local presence of the CHP. Therefore, the local policy-makers could also constrain the incentives to achieve environmental improvements at a local scale, and the economic indexes could help them to calibrate the incentives. Moreover, these evaluations can be extended to other significant pollutants such as PM, CO,
etc. However, the investors point of view is primarily focused on economic evaluation, but in a context where new constrains or incentives can be introduced by legislator at a later stage of investment, they should also take into account the energy and environment impact, in order to not penalize these aspects in the design phase. Therefore, they should simultaneously consider all the indexes as a function of different parameters: CHP technologies, fuels used, possible use of pollutant abatement systems, storage systems,
etc. These analyses could be further extended by introducing a multi-objective optimization technique.
Figure 3.
Case study results. Blue bars: primary energies; yellow bars: exergies; red bars: emissions (dotted bars refer to local scale); green bars: present values.
Figure 3.
Case study results. Blue bars: primary energies; yellow bars: exergies; red bars: emissions (dotted bars refer to local scale); green bars: present values.


