1. Introduction
Cities have become major contributors to global energy consumption and greenhouse gas (GHG) emissions. The urbanization process causes local climate change through excessive anthropogenic heat release and modification of land biophysical properties. The resultant urban heat island (UHI) effects and aggravating human heat stress have become key environmental issues in city management. Cities can be designed to be climate-conscious and energy-efficient to contribute to urban sustainability and address global climate-change issues at the local level [
1].
Roof greening presents a feasible design strategy for microclimate amelioration and energy conservation in cities [
2]. Previous field and modeling studies in various climatic zones indicate that an individual green roof can reduce roof surface temperature by 15–45 °C, near-surface air temperature by 2–5 °C and building energy consumption by up to 80% [
3,
4,
5,
6,
7,
8,
9,
10,
11,
12]. In an extremely compact tropical city such as Hong Kong with severe shortage of ground-level green spaces and intense UHI effects [
13,
14], green roof could bring significant benefits. Large-scale installation of greenery on the spatially concentrated roofs and podiums forming an elevated green network could compensate for the green-space deficit, mitigate urban climate and improve quality of life [
15].
Previous assessments of green-roof thermal effects are largely restricted to the individual building scale. Few studies cover the wider influences of green-roof networks at the neighborhood or city scales. Besides, the conventional emphasis on temperature and energy cannot reflect the impacts of green roofs on human comfort, which is regarded as a key indicator of sustainable design. This study evaluates the summer cooling and human thermal comfort (HTC) effects of community-scale installation of green roofs in typical residential areas in urban Hong Kong. Two climate models, namely ENVI-met and RayMan, were employed for simulation of microclimate parameters and HTC index PET (physiologically equivalent temperature), respectively. The study serves three objectives: (1) it investigates the intensity and spatial pattern of neighborhood-scale green-roof cooling effects; (2) it explores green-roof impacts on rooftop and pedestrian-level HTC; and (3) it analyzes the variations in cooling and HTC effects amongst different vegetation types and residential sites of different urban forms.
2. Study Area
2.1. Climate
Hong Kong is situated on the south coast of China, at 22 °N latitude and 114 °E longitude with a typical humid-subtropical climate influenced by the dominant Asian monsoon climatic system. The summer is hot and humid from late April to September with August the hottest month often exceeding 33 °C. The dry winter is relatively short and mild, running from January to February with average temperature above 10 °C. The long-hot period vis-à-vis the relatively short-cool period calls for summer cooling as a priority in sustainable urban design for environmental and human health and amelioration of the increasingly intense UHI effect.
2.2. Study Sites
We selected four conventional residential areas, ranging from low-rise single family houses to high-rise towers, and one commercial-residential site where a cluster of tall residential buildings stands above the sprawling podium block accommodating a sizeable shopping mall (
Figure 1). The sites represent the main housing types in Hong Kong with different urban forms characterized by building height, plot ratio, ground green coverage, roof area ratio, and population density (
Table 1). The definitions of these urban planning attributes are given in the footnotes of
Table 1.
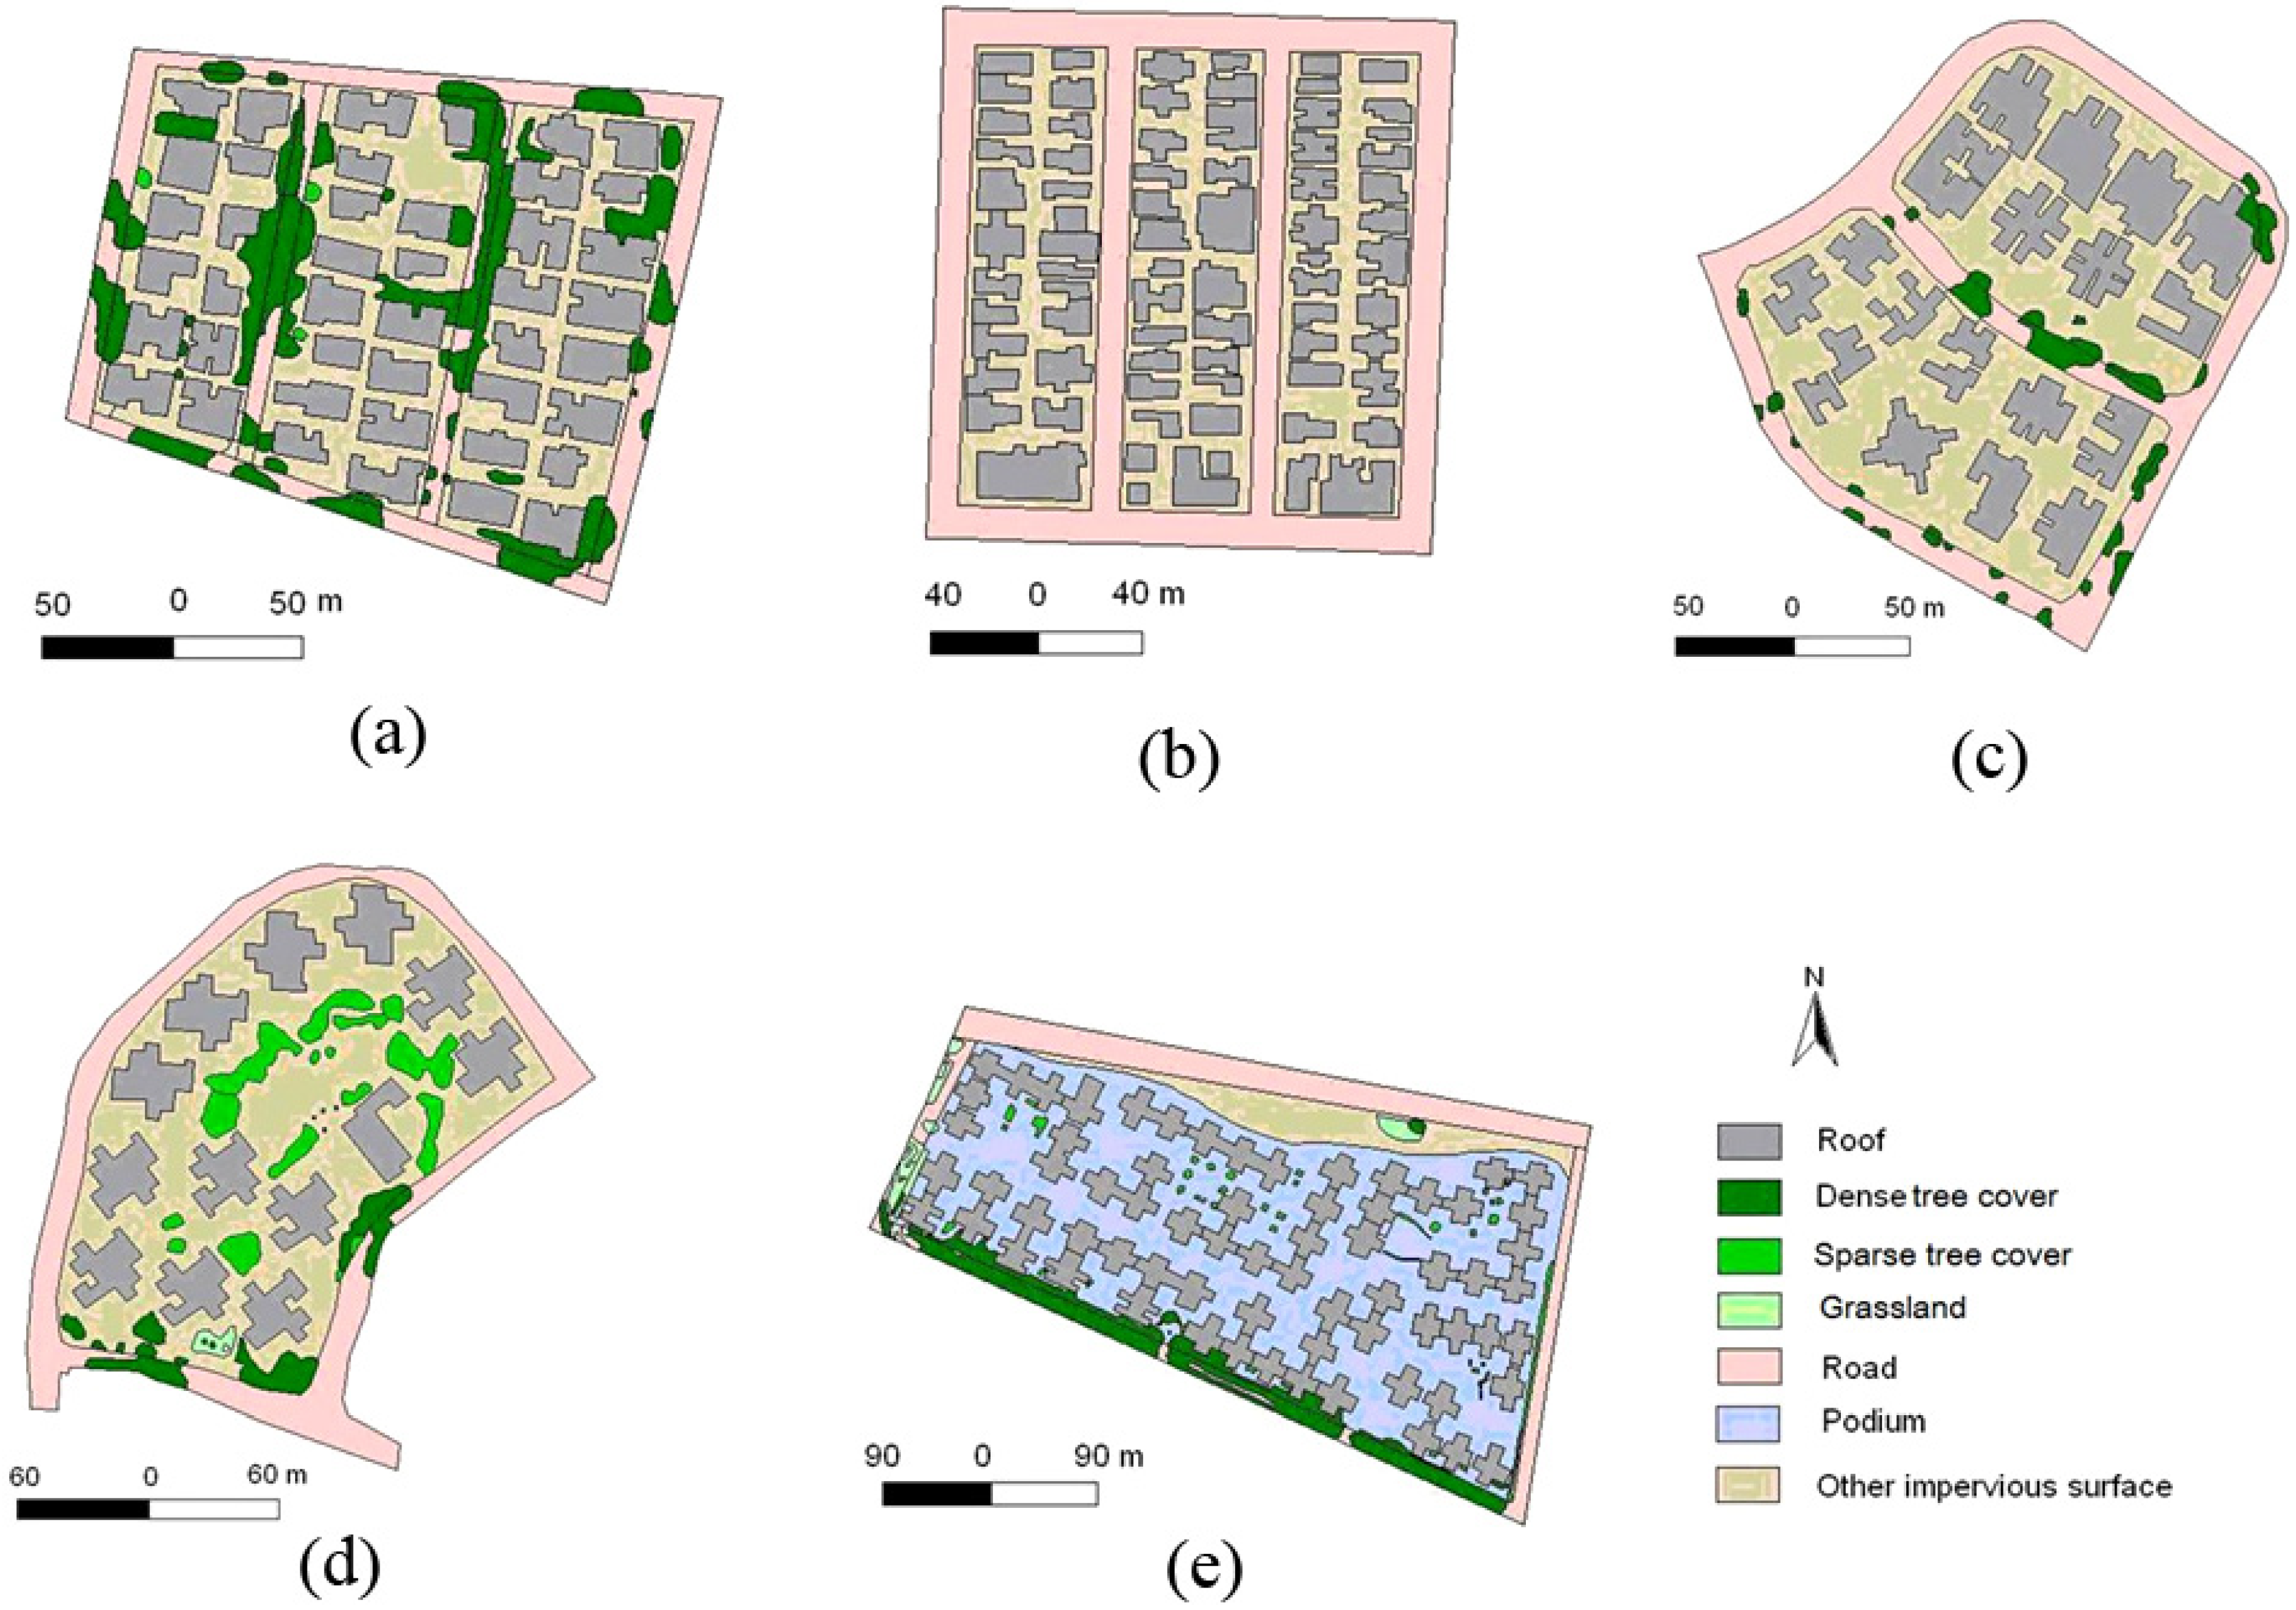
Figure 1 shows that most residential areas in Hong Kong are intensively developed, leaving limited spaces for ground-level greenery. The ground green coverage is inordinately low, ranging from 0% to 18% with most sites near the low end of the spectrum. The public green space provision in built-up areas remains stagnant at about 3 m
2/person, which is amongst the lowest in cities of a comparable size in the world [
13]. Only a tiny proportion of the population can afford to have private open spaces. The high roof area ratio in the study sites, composed of rooftops of both residential and podium blocks (22%–34%), presents a large quantity of flat, elevated and often unused surfaces. This scenario echoes the prevalence of vacant rooftops in most urban areas. It is perhaps paradoxical that in a city desperately short of development and outdoor leisure land, such a precious elevated resource has been left idle and wasted. It offers a great potential to compensate for the grave shortage of ground-level green spaces in the ultra-compact city.
Figure 1.
Town plan and land cover types of the five study sites (drawings a–e respectively for Kowloon Tong (KT), Kowloon City (KC), Broadcast (BC), Chun Man (CM) and Mei Foo (MF).
Figure 1.
Town plan and land cover types of the five study sites (drawings a–e respectively for Kowloon Tong (KT), Kowloon City (KC), Broadcast (BC), Chun Man (CM) and Mei Foo (MF).
Table 1.
Pertinent urban design parameters of the five study sites.
Table 1.
Pertinent urban design parameters of the five study sites.
| Study site | Site area (ha) | Building height (m) | Plot ratio a | Ground green coverage b (%) | Roof area ratio c (%) | Population density d (DU/ha) | Residential urban form e |
|---|
| Kowloon Tong (KT) | 3.9 | 10 | 1.8 | 18 | 34 | 233 | Open-set low rise |
| Kowloon City (KC) | 3.9 | 15 | 3 | 0 | 34 | 203 | Compact low rise |
| Broadcast (BC) | 4 | 25 | 3.8 | 4.5 | 29 | 280 | Open-set middle rise |
| Chun Man (CM) | 4.1 | 40 | 4.5 | 11 | 22 | 372 | Open-set high rise |
Mei Foo
(MF) | 15 | 40 | 6.4 | 7.7 | 27 | 562 | Compact high rise (towers above large podium elevated at 15 m) |
3. Modeling Process
3.1. ENVI-Met Model
The ENVI-met 3.1 model is a grid-based three-dimensional model for the simulation of air flow, heat and vapor exchange, turbulence and particle dispersion in urban areas [
17]. The program is designed for micro-scale simulation with a typical resolution from 0.5 to 10 m in the horizontal land surface and 10 s in time [
18]. It takes into account the key modeling inputs, including site location, initial climatic parameters, soil and plant type, building structure, and thermal properties. It can generate three-dimensional distributions of radiation, temperature, heat flux, humidity and wind flow.
Recently, the ENVI-met has been adapted mainly to simulate surface-plant-air interactions in urban canyons, and to predict climatic consequences of different urban design options [
19,
20,
21]. Some studies used it to explore the climatic effects of green roofs at the building or neighborhood scale [
22,
23], but the lack of empirical data for verification increases the uncertainty of simulation results. This study obtained on-site monitoring data to validate the model and offer initial meteorological parameters for the simulation of the study sites.
3.2. Validation of ENVI-Met
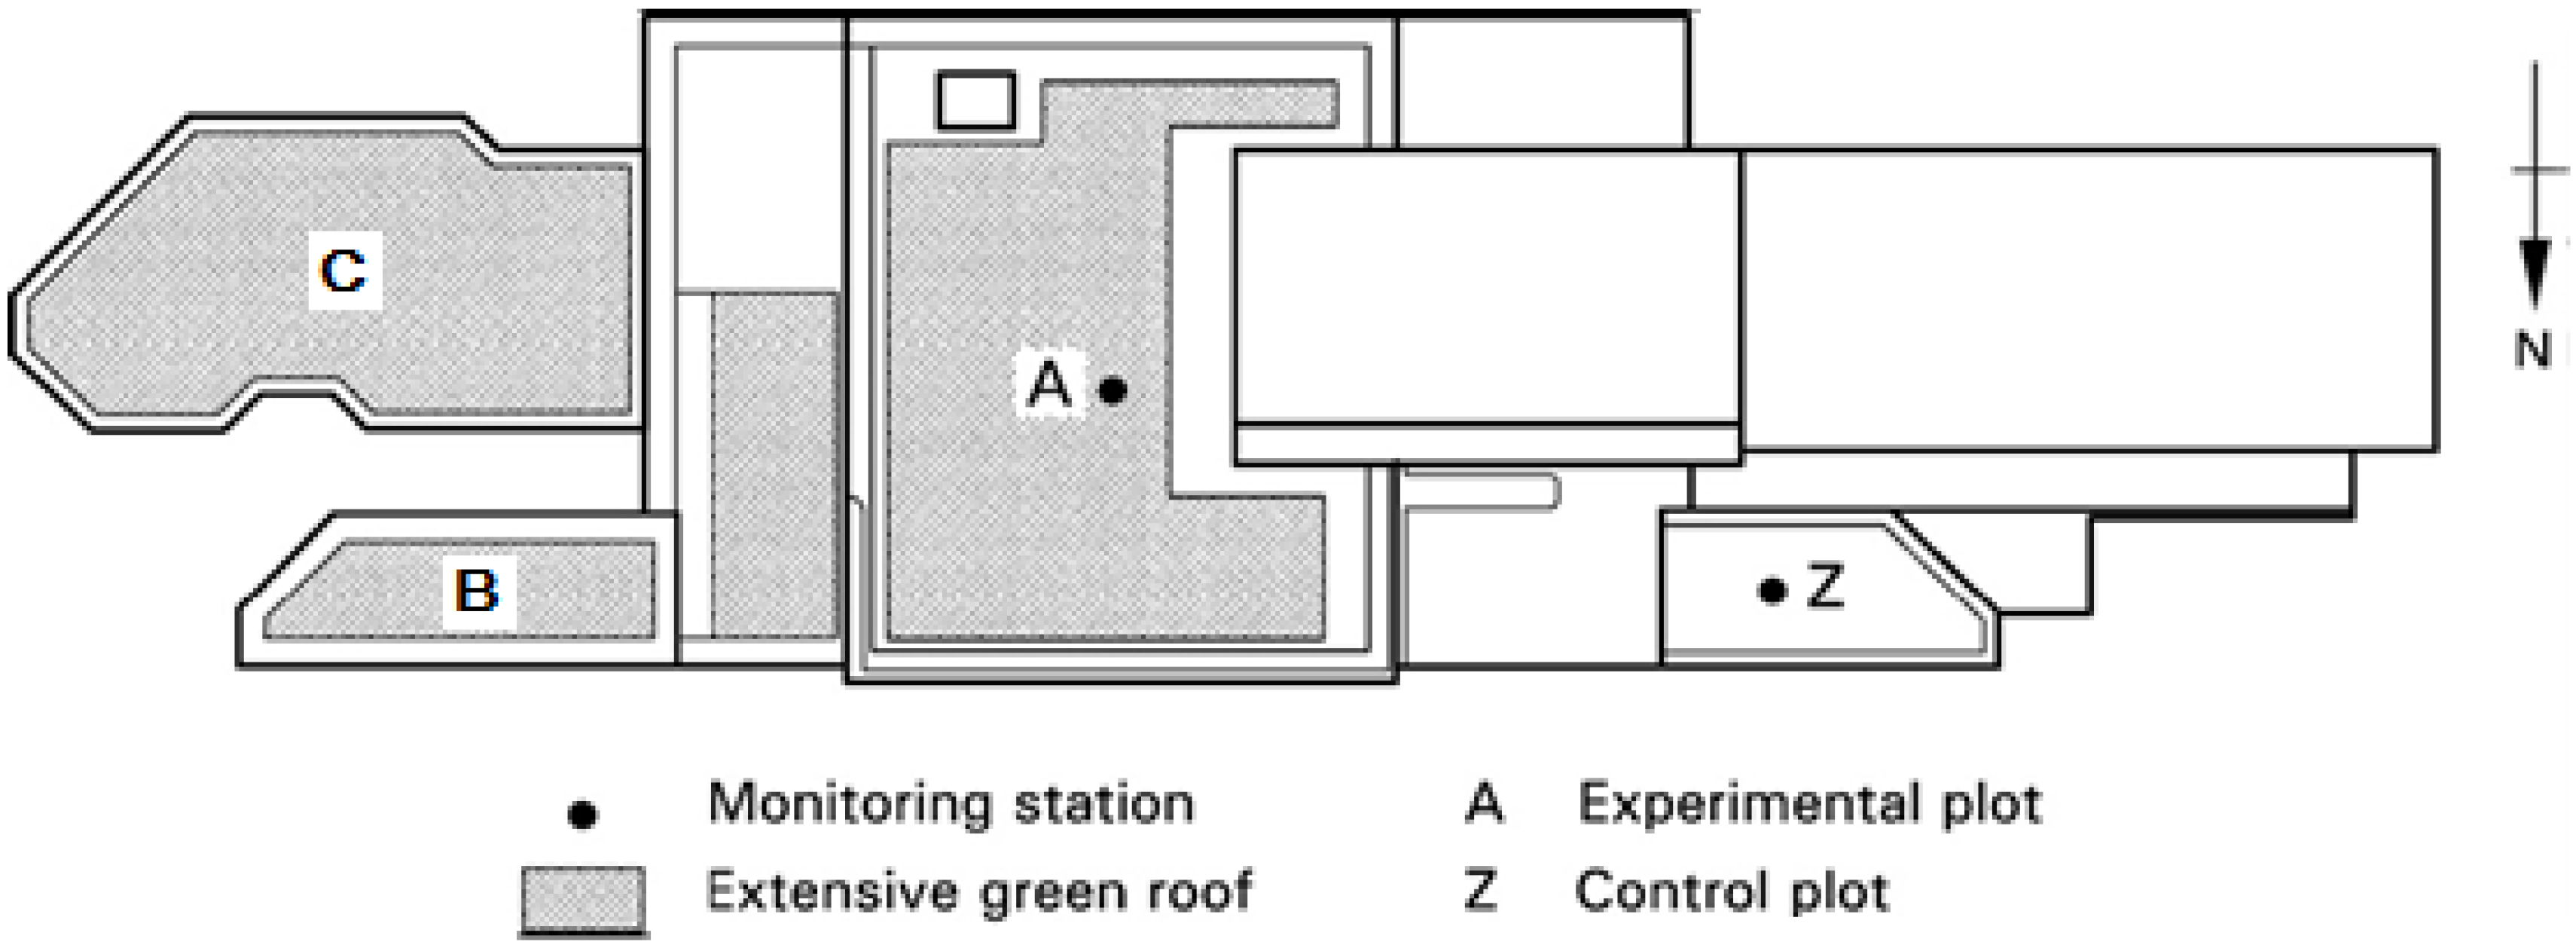
The experimental green roof is installed on the top of a railway station at the Tai Po district of Hong Kong. The station building is a one-to-two storey low-rise structure facing the platform and tracks. The roof is composed of three parcels (
Figure 2): greenery installed at sites A (484 m
2) and B (125 m
2), and a control bare roof at site Z (106 m
2). The hourly-based air temperature data at 160 cm height of the sites were obtained on a clear sunny summer day (28 August 2009) to validate the simulation carried out on the same day. Environmental sensors mounted on instrument stands were placed at the center of each site to avoid edge effect.
Figure 2.
Layout of the experimental green-roof sites.
Figure 2.
Layout of the experimental green-roof sites.
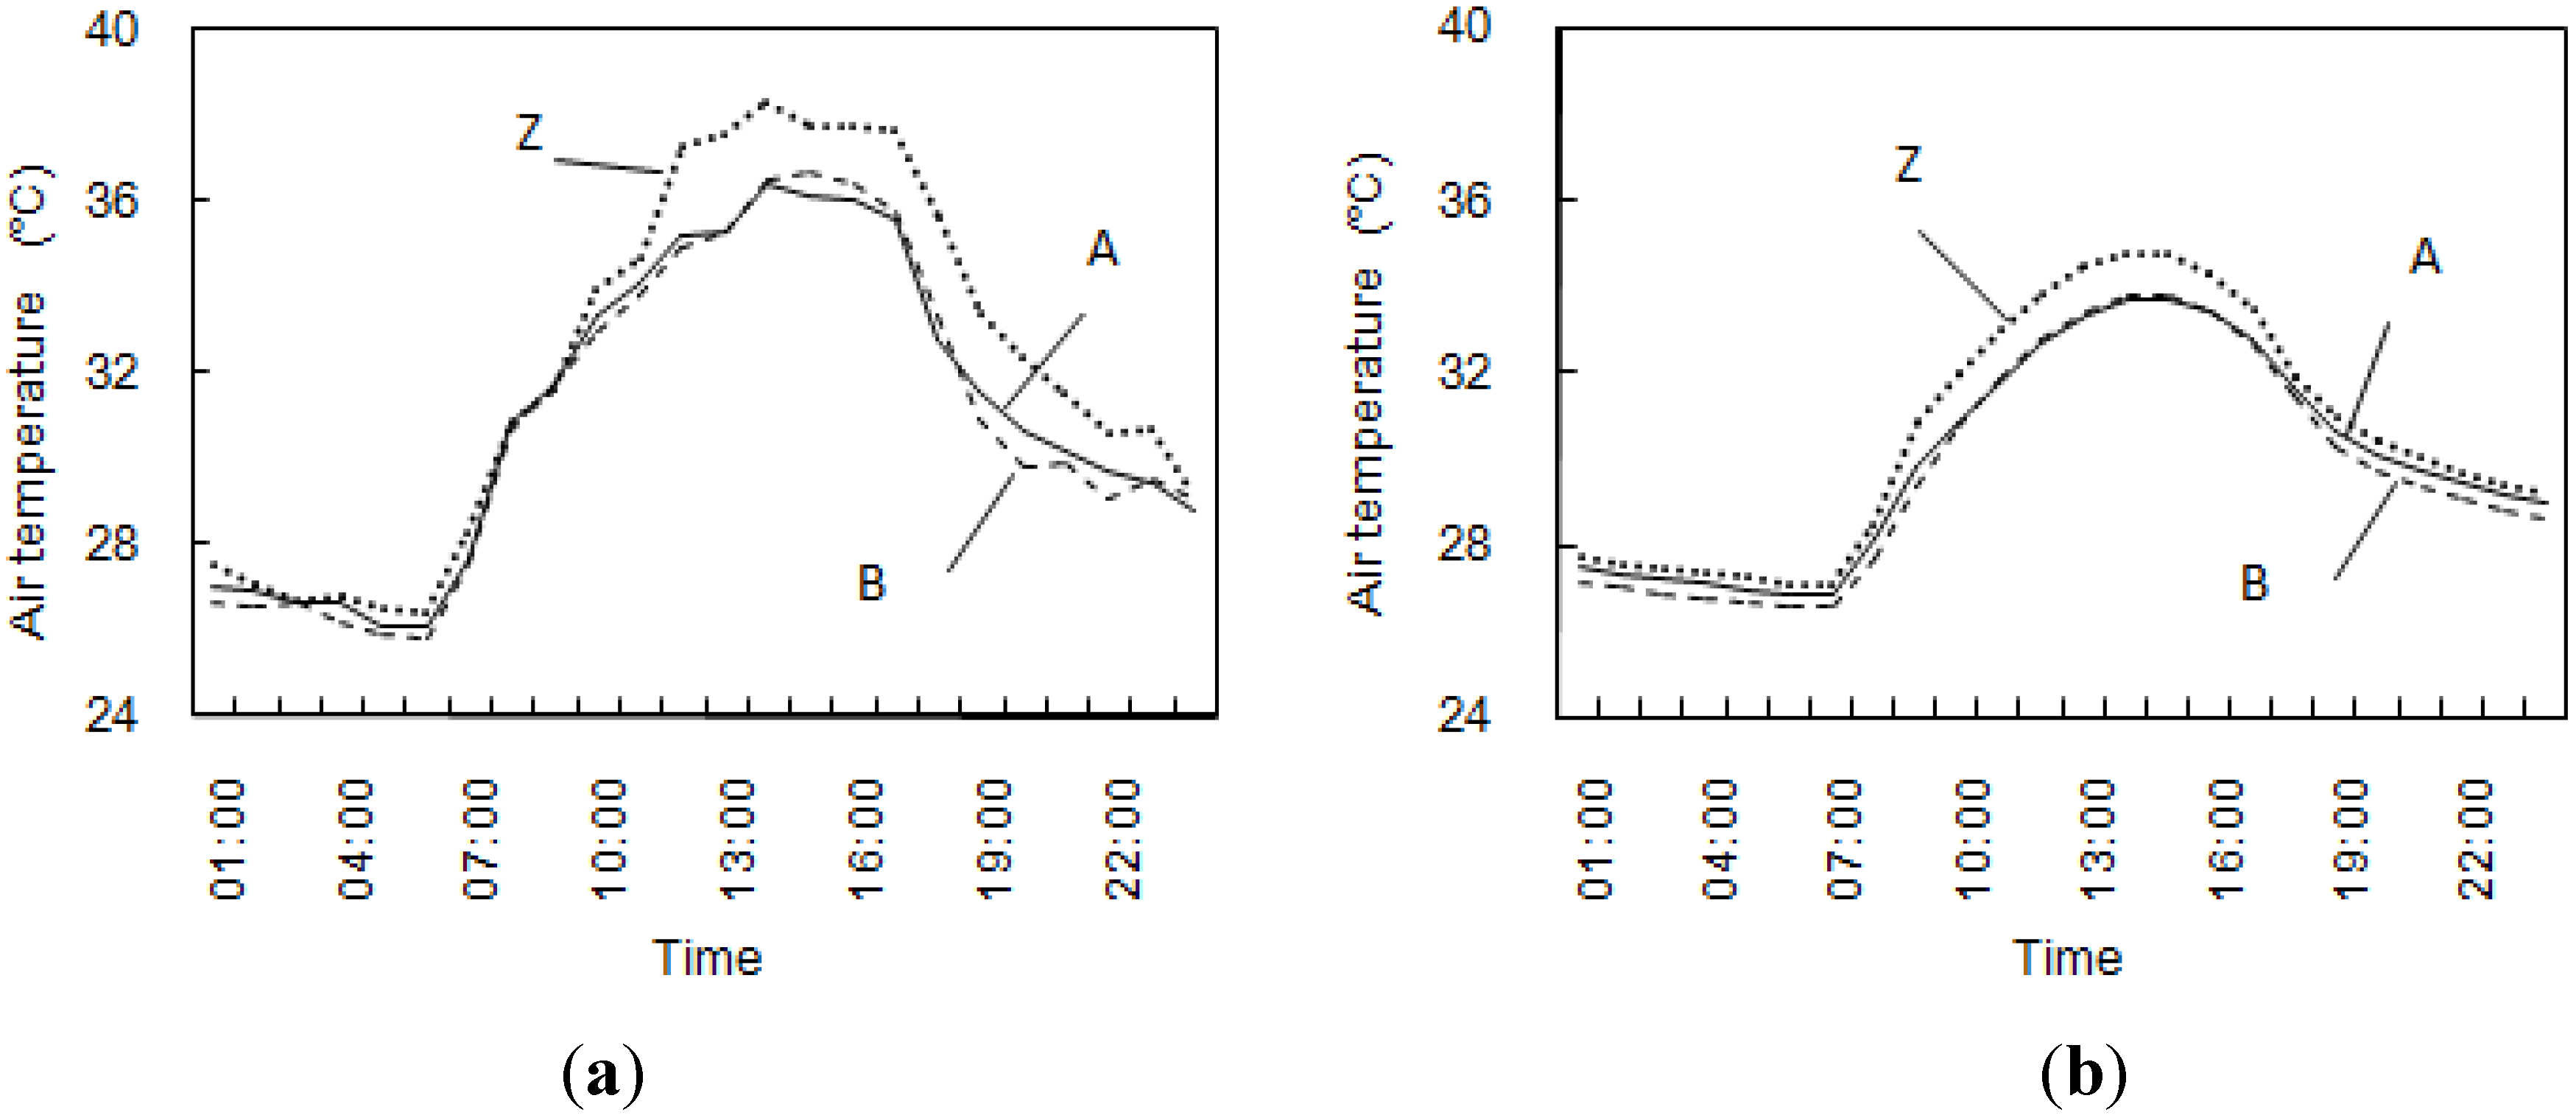
Figure 3a,b shows a notable contrast between the observed and simulated air temperature on both green and bare roofs, with the latter being 3–4 °C lower in the daytime and around 1 °C higher at night. The discrepancy could be explained as follows: (1) the inability of ENVI-met to simulate anthropogenic heat which might cause sharp temperature rise in reality but cannot be reflected in the modeling process; (2) the computed temperature is a time and space averaged result, whereas the observed data represent the instant situation of the time of measurements. Therefore, there is constant tendency for numerical models such as ENVI-met to moderate extreme values and contract the diurnal range. Similar results have been reported by Johansson
et al. [
24] and Emmanuel
et al. [
18].
Despite the above divergence, the simulated and observed air temperatures display similar horizontal patterns (
Figure 3a,b): Z > B > A from 08:00 to 18:00, and Z > A > B from 19:00 to 07:00. The two green roofs are cooler than the bare roof throughout the day. Green roof A has lower daytime air temperature than B because of its larger size with enhanced evaporative cooling, and higher nighttime air temperature due to the augmented release of trapped heat. Furthermore,
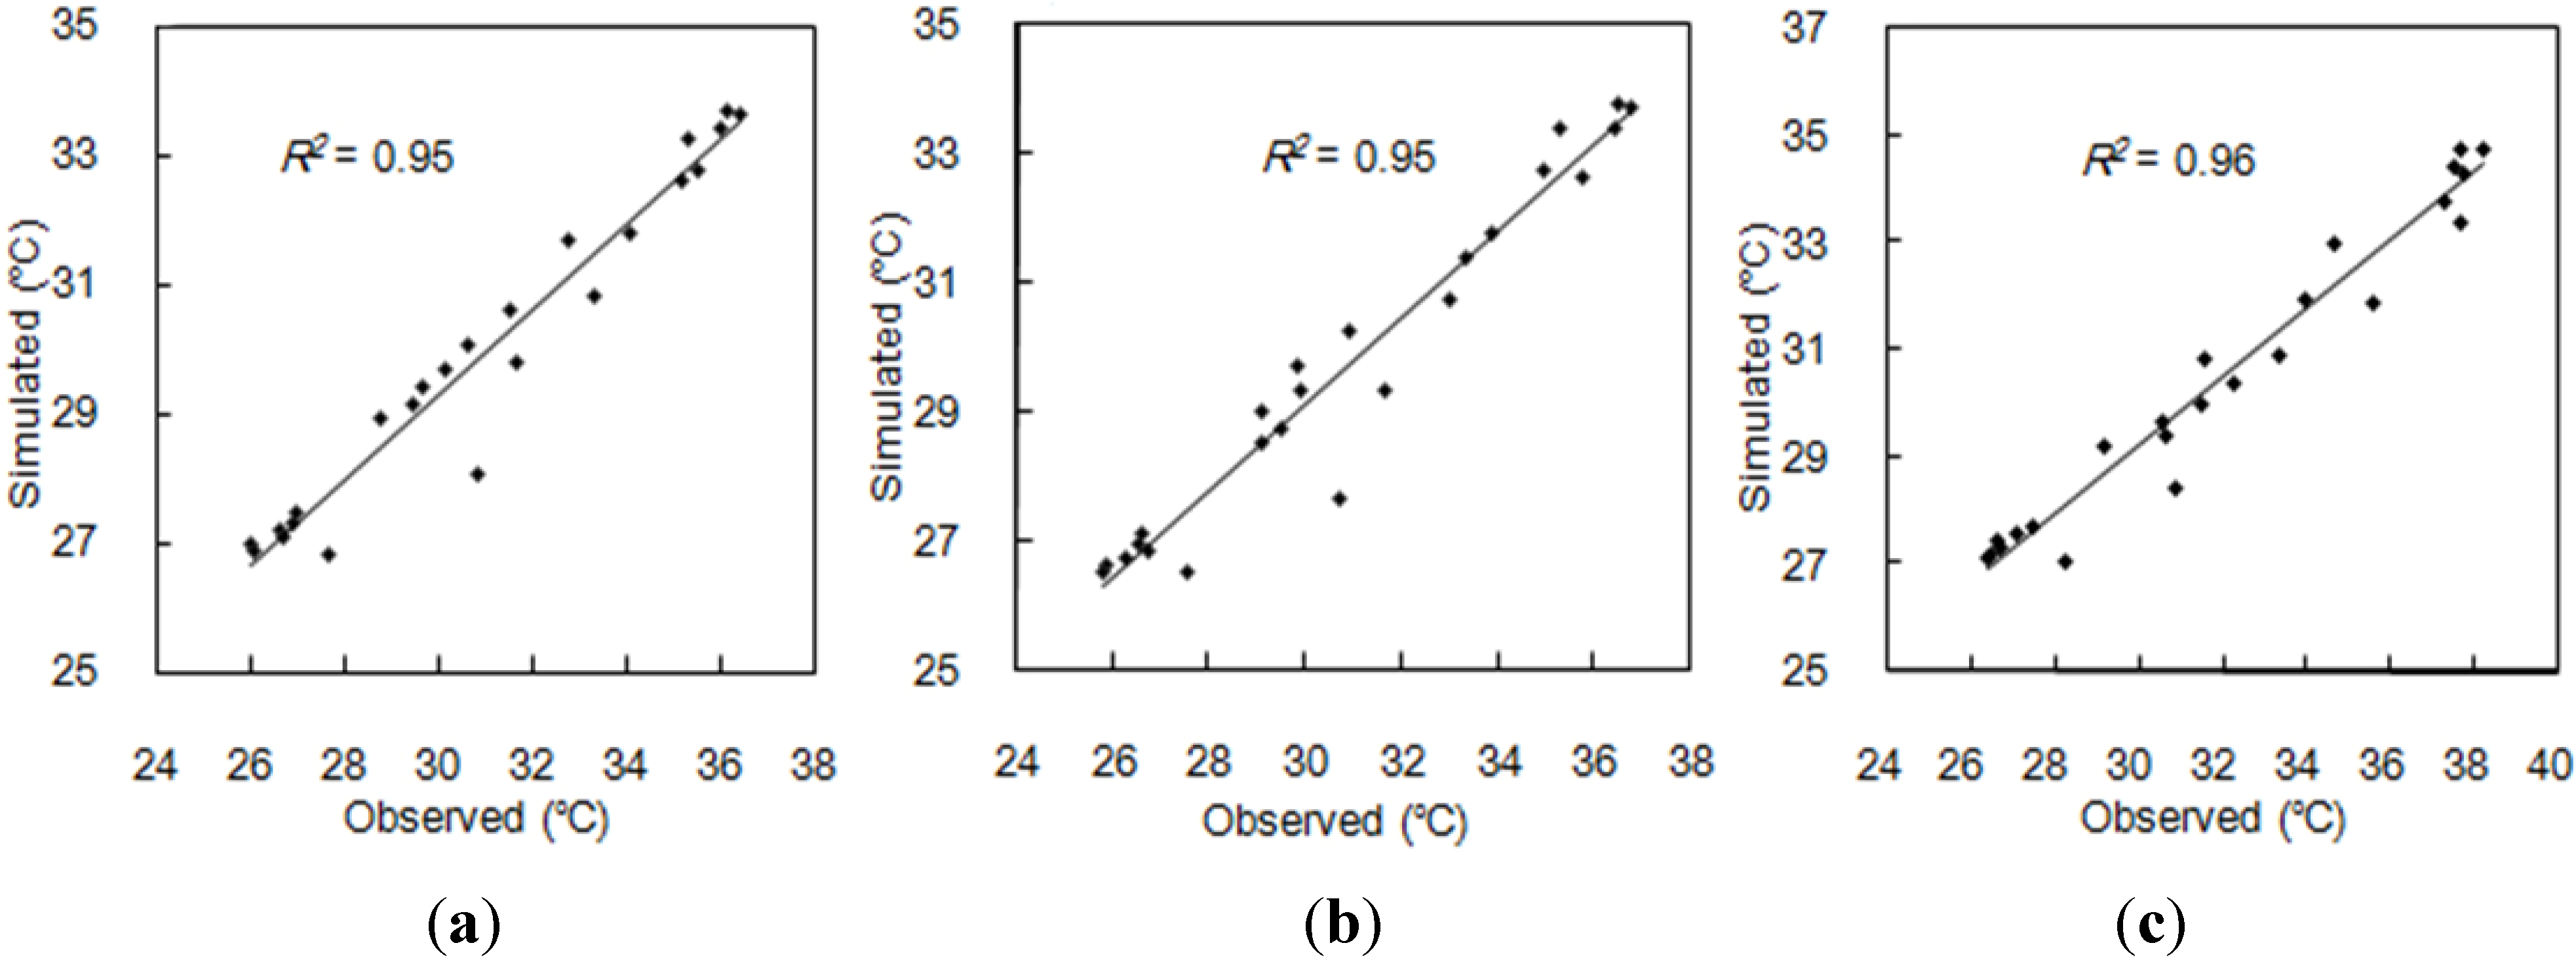
Figure 4 shows significant correlations between the observed and simulated air temperature at the two green roofs (
R2 = 0.95) and the bare roof (
R2 = 0.96). The above comparisons verify that ENVI-met can simulate with a reasonable level of sensitivity and stability the spatial and temporal climatic dynamics of subtropical green roofs, and thus it could fulfill our study objectives.
Figure 3.
Horizontal pattern of diurnal air temperature: (a) observed; (b) simulated. (lines A, B, and Z respectively denote the two green roofs and the bare roof).
Figure 3.
Horizontal pattern of diurnal air temperature: (a) observed; (b) simulated. (lines A, B, and Z respectively denote the two green roofs and the bare roof).
Figure 4.
Correlations between the hourly-based observed and simulated air temperature. (a) green roof A; (b) green roof B; (c) bare roof Z.
Figure 4.
Correlations between the hourly-based observed and simulated air temperature. (a) green roof A; (b) green roof B; (c) bare roof Z.
3.3. Modeling Domain
The model domain of each study site is digitized based on vertical color digital aerial photographs (2008) which cover the entire territory of Hong Kong with a fine resolution of 0.5 m. To fit the map to the model area, Broadcast (BC) and Mei Foo (MF) sites were rotated anti-clockwise 45° and 20° respectively, and the other three sites kept the original orientation. The spatial resolutions were set at 2 m for the model domains of Kowloon Tong (KT), Kowloon City (KC), Broadcast (BC) and Chun Man (CM), and 10 m for MF due to its relatively larger size. Each model domain covers the entire area of the site (
Figure 1) plus 5 external nesting grids to extend our area of interests in a zone around the borders.
Two green-roof scenarios were simulated for each site, namely extensive (EGR) and intensive (IGR). EGR assume all building roofs or the entire podium covered with 3 cm tall dense grasses, and IGR with a dense 100% coverage of 6 m tall trees. ENVI-met also requires structural information of the plant canopy, which is characterized by the vertical gradient of leaf area density (LAD in square meter leaf area per cubic meter canopy volume, m
2/m
3). There were 10 LAD values for each plant type depicting the canopy characteristics from
z/
H = 0.1 (LAD1) to
z/
H = 1 (LAD10), where
z is the height of the LAD and
H is the total plant height. In this study, the LAD values of EGR and IGR were estimated based on previous measurements of tropical or subtropical plants [
25,
26,
27].
The simulation is conducted for a hypothetical clear and hot sunny day with typical subtropical summer weather characteristics. The initial air temperature, wind speed and humidity for simulations are the average values of August 2009 obtained from the Hong Kong Observatory. The summer prevailing S-N wind direction is used in simulation. Building heights were determined by field assessment and information gleaned from the website of the government’s Rating and Valuation Department.
Table 2 lists the modeling input parameters.
Table 2.
Model input data for the ENVI-met simulation.
Table 2.
Model input data for the ENVI-met simulation.
| Model parameter | Model value |
|---|
| Simulation date a | 1 August 2009 |
| Starting time | 12:00 on 31 July 2009 |
| Time for initialization (h) | 12 (from 12:00 on 31 July to 00:00 on 1 August) |
| Simulation duration (h) | 24 (from 00:00 1 August to 00:00 2 August) |
| Initial air temperature (°C) | 30 |
| Wind speed at 10 m above ground (m·s−1) | 3 |
| Wind direction | South |
| Roughness length zo at Reference Point b | 0.1 |
| Specific humidity in 2500 m (g water.kg air−1) c | 7 |
| Relative humidity at 2 m (%) | 80 |
| Extensive green roof plant type, height and density d | Grasses, 3 cm, average LAD = 1 m2/m3 |
| Intensive green roof plant type, height and density d | Dense trees, 6 m, average LAD = 1 m2/m3 |
3.4. Estimation of HTC
Human thermal comfort (HTC), which depicts human sensory perception of the thermal environment, has been widely adopted to examine the relative sustainability of urban design options from the human-health viewpoint [
18,
21,
24]. HTC depends on some key weather parameters such as radiation, temperature, humidity and air flow. In vegetated areas with suppressed ground-level radiation input, lower air temperature and elevated relative humidity than their surrounding built-up spaces, improvement of HTC could be expected. Some studies have confirmed notable enhancement of HTC by urban parks or tree groups [
28,
29], whereas little research has incorporated HTC in the assessment of green roof benefits.
Many indices have been developed to estimate HTC, including the predicted mean vote (PMV), effective temperature (ET), standard equivalent temperature (SET), and physiologically equivalent temperature (PET). This study employs PET due to its well-confirmed adaptation for outdoor HTC estimation and simple comparable unit in degree Celsius [
30,
31]. PET is calculated by RayMan based on ENVI-met output of air temperature, relative humidity, wind speed and mean radiant temperature (MRT). The physical basis, abilities and limitations of RayMan have been introduced by Matzarakis
et al. [
32], and the ranges of PET and corresponding HTC level are summarized in
Table 3. These HTC zones are defined for specific heat production and clothing circumstances, which may not be directly applicable to humid-subtropical areas. Nevertheless, they are adapted to find the relative HTC of different urban green-roof design scenarios.
Table 3.
Physiologically equivalent temperature (PET) range for different grades of human thermal perception and associated physiological stress [
31].
Table 3.
Physiologically equivalent temperature (PET) range for different grades of human thermal perception and associated physiological stress [31].
| PET (°C) | Thermal perception | Physiological stress |
|---|
| 18–23 | Comfortable | No thermal stress |
| 23–29 | Slightly warm | Slightly heat stress |
| 29–35 | Warm | Moderate heat stress |
| 35–41 | Hot | Strong heat stress |
| >41 | Very hot | Extreme heat stress |
4. Results and Discussion
4.1. Horizontal Cooling Effects
This study investigates the horizontal pattern of green-roof cooling effects during the daytime (14:00) at both rooftop (1.2 m above the roof surface) and pedestrian levels (1.2 m above the street-level ground surface). Cooling effects were defined as the air-temperature differences between the bare and green roof scenarios.
4.1.1. Rooftop-Podium Level Cooling Effects
Green roofs can generate cool enclaves of different sizes, shapes, orientations and connectivity at the rooftop level. The associated cooling effect tends to spread beyond the green pockets to a relatively large area of the community (
Figure 5 and
Figure 6). The shape of the cool enclaves depends on building density and the layout pattern and geometry of buildings in conjunction with roads. In KT and KC, the roads and building constellations follow a regular linear S-N orientation. They engender a series of elongated-parallel “cool belts” that are aligned with the S-N wind direction (
Figure 5a,b and
Figure 6a,b). In BC and CM, the buildings are more loosely scattered without a linear orientation or regular pattern. They generate small, roughly circular and rather clearly demarcated “cool islets”. The cooling effect of individual cool islets tends to spill from the green-roof core to several meters away from the periphery (
Figure 5c,d and
Figure 6c,d). In the large MF site, the sprawling podium is punctuated in a rather regular pattern with 60 high-rise residential blocks. The podium itself forms a rather continuous and effective “cool island”, and the whole neighborhood is more or less equally cooled (
Figure 5e and
Figure 6e).
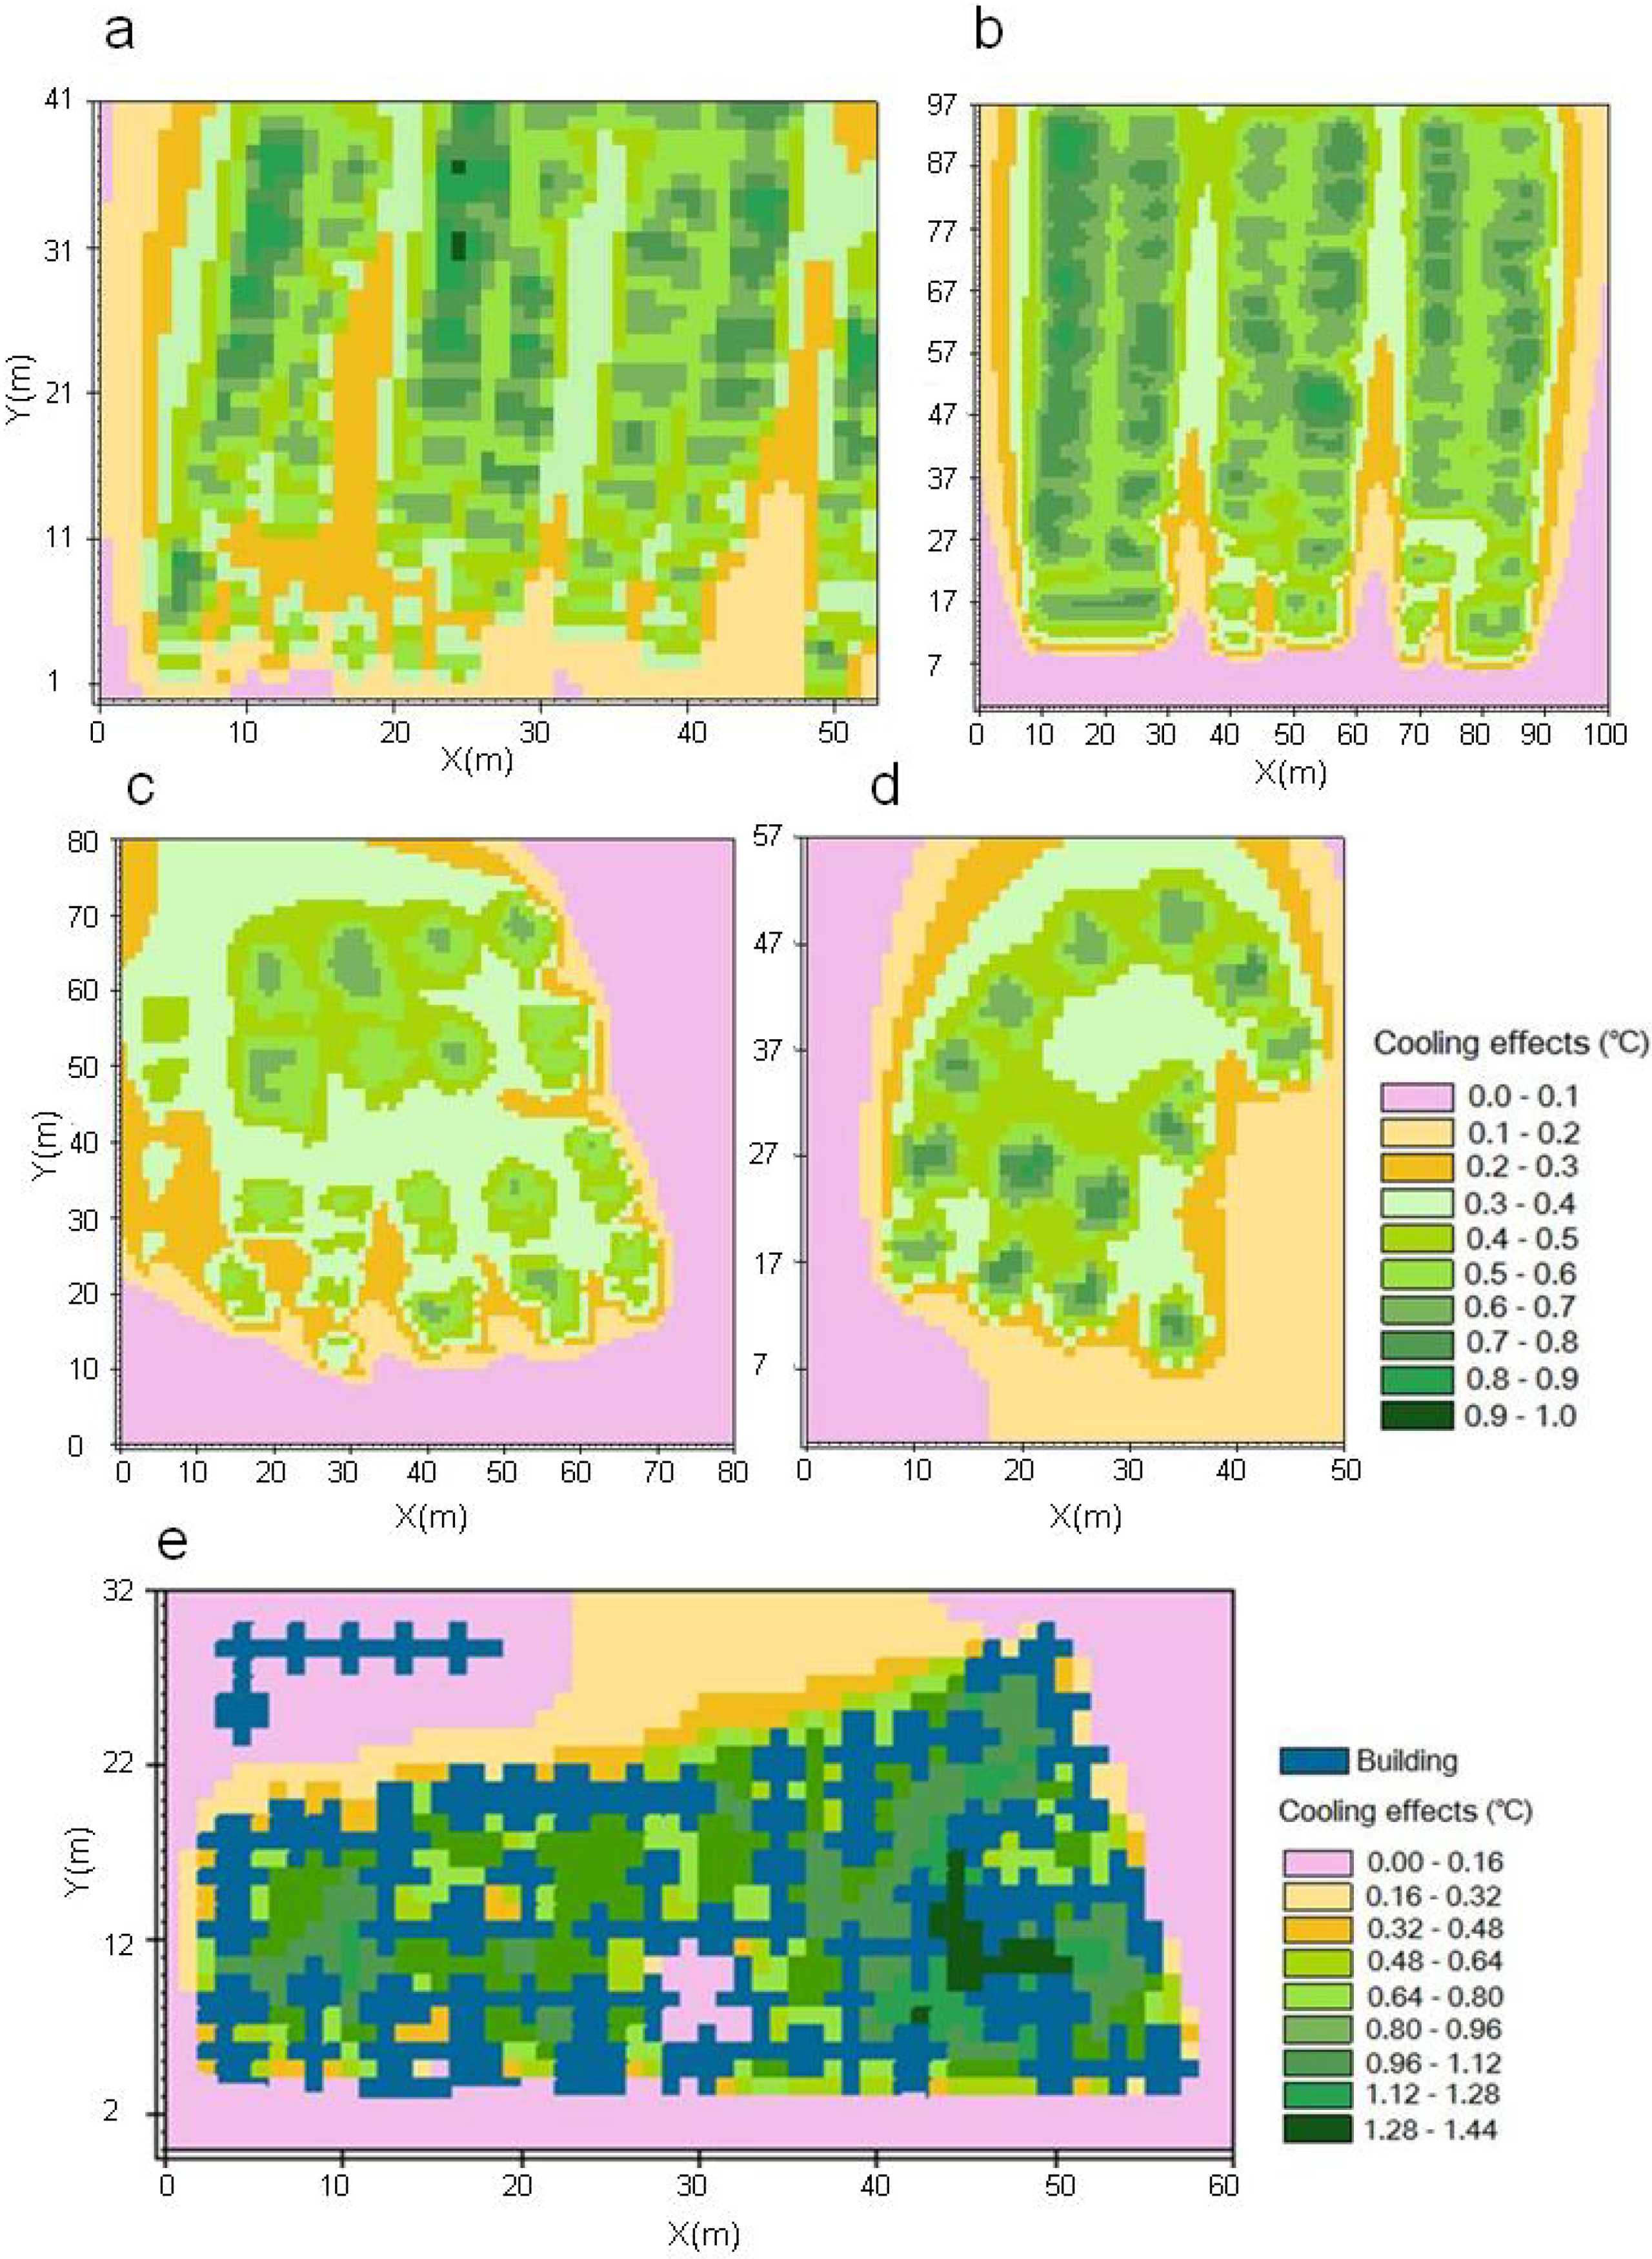
Figure 5.
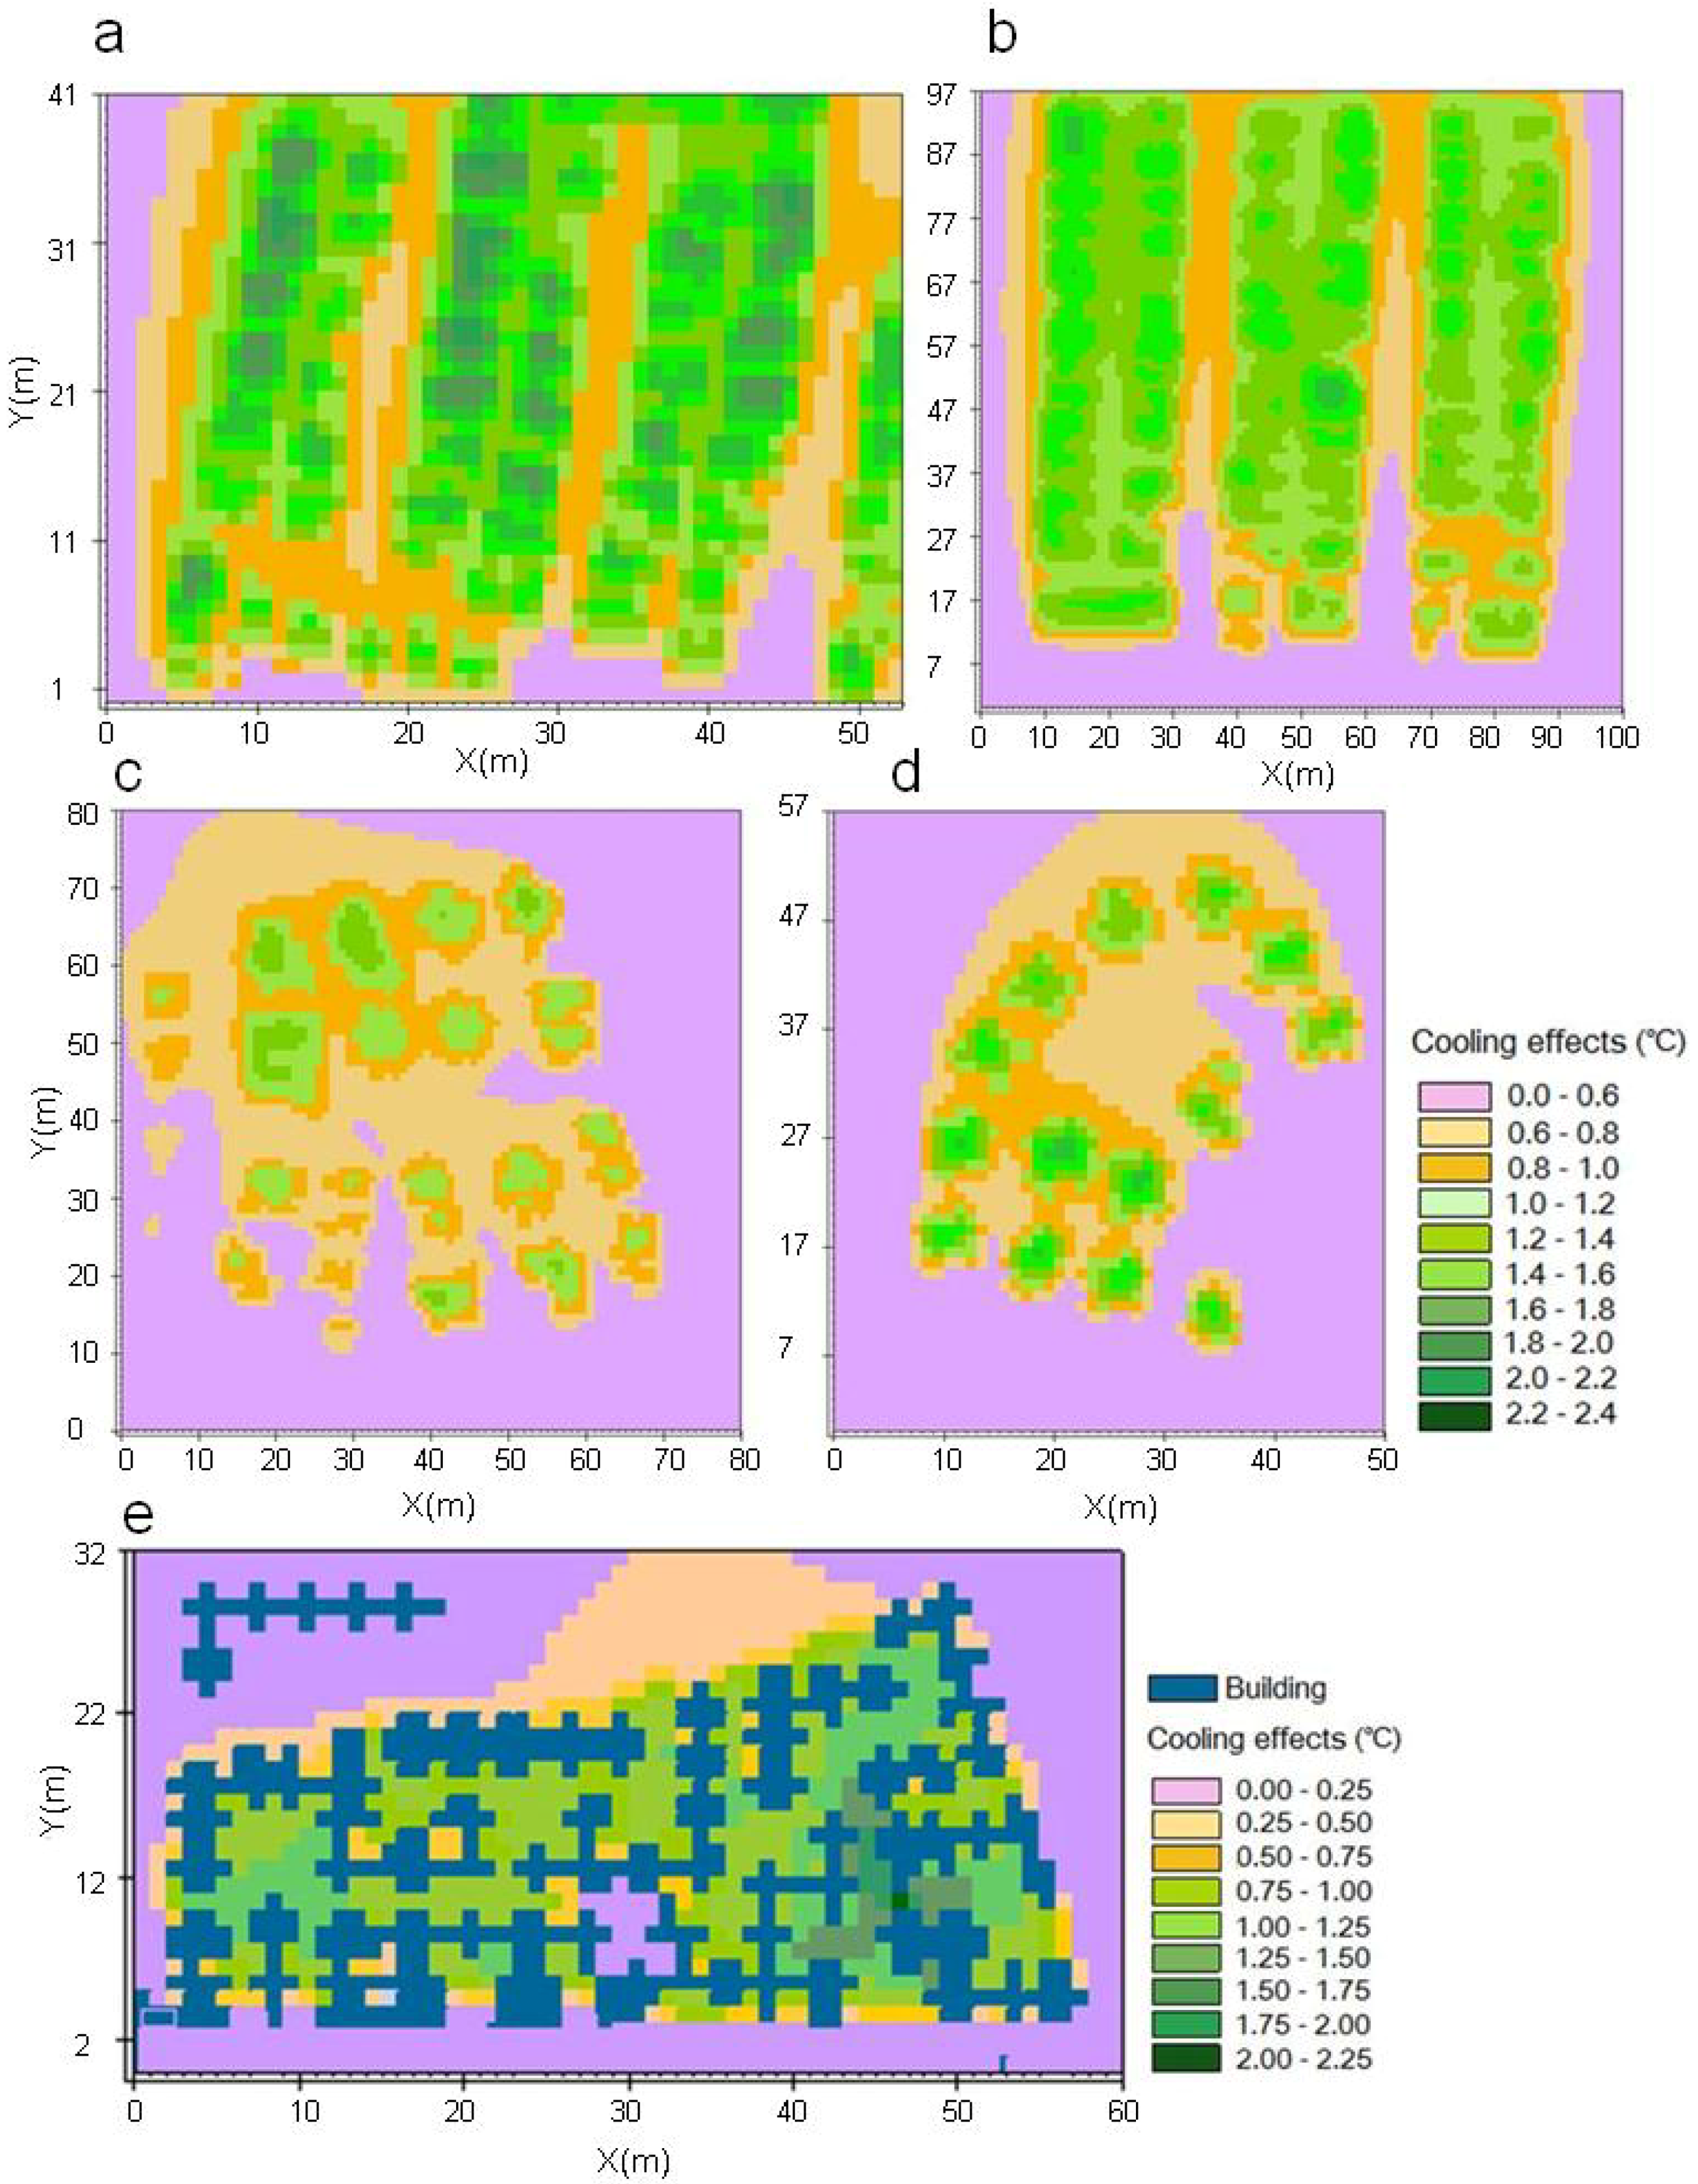
Horizontal distribution of cooling effects for extensive green roof (EGR) at the rooftop-podium level at 14:00 (cooling effects refer to the air-temperature differences between the bare and green-roof scenarios). (a) KT; (b) KC; (c) BC; (d) CM; (e) MF.
Figure 5.
Horizontal distribution of cooling effects for extensive green roof (EGR) at the rooftop-podium level at 14:00 (cooling effects refer to the air-temperature differences between the bare and green-roof scenarios). (a) KT; (b) KC; (c) BC; (d) CM; (e) MF.
Figure 6.
Horizontal distribution of cooling effects for intensive green roof (IGR) at the rooftop-podium level at 14:00 (cooling effects refer to the air-temperature differences between the bare and green-roof scenarios). (a) KT; (b) KC; (c) BC; (d) CM; (e) MF.
Figure 6.
Horizontal distribution of cooling effects for intensive green roof (IGR) at the rooftop-podium level at 14:00 (cooling effects refer to the air-temperature differences between the bare and green-roof scenarios). (a) KT; (b) KC; (c) BC; (d) CM; (e) MF.
The cooling intensity of a location is mainly dependent on the number of green roofs and the distance between them. Generally, the coolest areas are found on the green roofs and the tight spaces between cramped buildings. On the other hand, wider open spaces between buildings often have subdued cooling. For example, the cooling effect in KT (
Figure 5a and
Figure 6a) displays a horizontal gradient decreasing from green roofs to the limited spaces between buildings. Away from the green roofs, the cooling wanes and reaches a minimum in the wider spaces of intra-neighborhood roads. The rooftop-level cooling intensity ranges from 0.1 to 0.9 °C for EGR, and 0.6 to 2.1 °C for IGR (
Table 4). KC displays a spatial pattern of isotherms similar to KT, but it has lower cooling intensity ranging from 0.1 to 0.8 °C for EGR, and 0.4 to 1.7 °C for IGR. In BC and CM, the maximum cooling effect is around 0.8 °C for EGR, and 1.3 to 1.7 °C for IGR. The horizontal cooling variations in MF are limited, with most podium area cooled by 0.6 to 0.8 °C for EGR and 1 to 1.3 °C for IGR (
Table 4). The higher cooling efficacy of IGR is verified by the simulation. The high leaf area index and the denser and more complex biomass structure of trees afford more passive cooling by evapotranspiration.
Table 4.
Horizontal ranges of cooling effects (°C) for two green roof types and two levels in five study sites.
Table 4.
Horizontal ranges of cooling effects (°C) for two green roof types and two levels in five study sites.
| Green-roof scenario | Level | Study site |
| KT | KC | BC | CM | MF |
| Extensive green roof | Rooftop or podium | 0.1–0.9 | 0.1–0.8 | 0.2–0.7 | 0.2–0.8 | 0.3–1.6 |
| Pedestrian | 0.1–0.7 | 0.0–0.5 | 0.0–0.5 | 0.2–0.4 | 0.0–0.4 |
| Intensive green roof | Rooftop or podium | 0.6–2.1 | 0.4–1.7 | 0.2–1.3 | 0.2–1.7 | 0.5–1.9 |
| Pedestrian | 0.5–1.7 | 0.3–1.5 | 0.0–0.8 | 0.4–0.8 | 0.0–0.5 |
Wind direction influences the horizontal distribution of cooling effects. The areas located in the downwind direction (north) have better cooling due to the flow of cool air from the upwind part. This is evident in KT and KC and to a lesser extent in BC, where the cooling intensity in the north is more pronounced than the south part (
Figure 5a and
Figure 6a). The wind has literally driven a wedge in the south part and created coalescence of the “cool belts” in the north part of KT and KC. The lateral advection of air cooled by elevated vegetated pockets is thus verified at the neighborhood scale.
4.1.2. Pedestrian Level Cooling Effects
Cool air generated by green roofs moves downwards to improve the pedestrian-level microclimate (
Figure 7 and
Figure 8). The results indicate that the maximum cooling intensity in a study site is negatively related to building height. The downward spill or vertical advection of cool air generated by green roofs could be dispersed, diluted and dissipated in its descent if the roof-to-street height difference is too high. In low-rise sites KT and KC, the IGR lower the pedestrian-level air temperature by up to 1.7 °C, and 1.5 °C, respectively; they are twice of the maximum values in the mid-rise BC and high-rise CM sites (
Table 4). For EGR, the maximum cooling effect is notably subdued, with KT leading at 0.7 °C, and the remaining sites limited to 0.4–0.5 °C. IGR with more voluminous and complex biomass permits more effective cooling at the pedestrian level. This cooling also demonstrates notable horizontal variations in different study sites (
Figure 7 and
Figure 8). In KT, the entire neighborhood could be cooled by both EGR and IGR, but cooling is better in areas surrounded by closely-spaced buildings. The limited spatial variations in temperature indicate a certain degree of intra-site homogenization down to the street level. With the lowest site coverage by buildings amongst the five study sties, KT permits relatively less obstructed intra-site air movement to foster the spread of cool air. Even though KT has the highest ground green coverage of 18% (
Table 1), the influence of ground-level greenery cannot be separated from that of roof greening, as no discernible differential cooling-effect is evident.
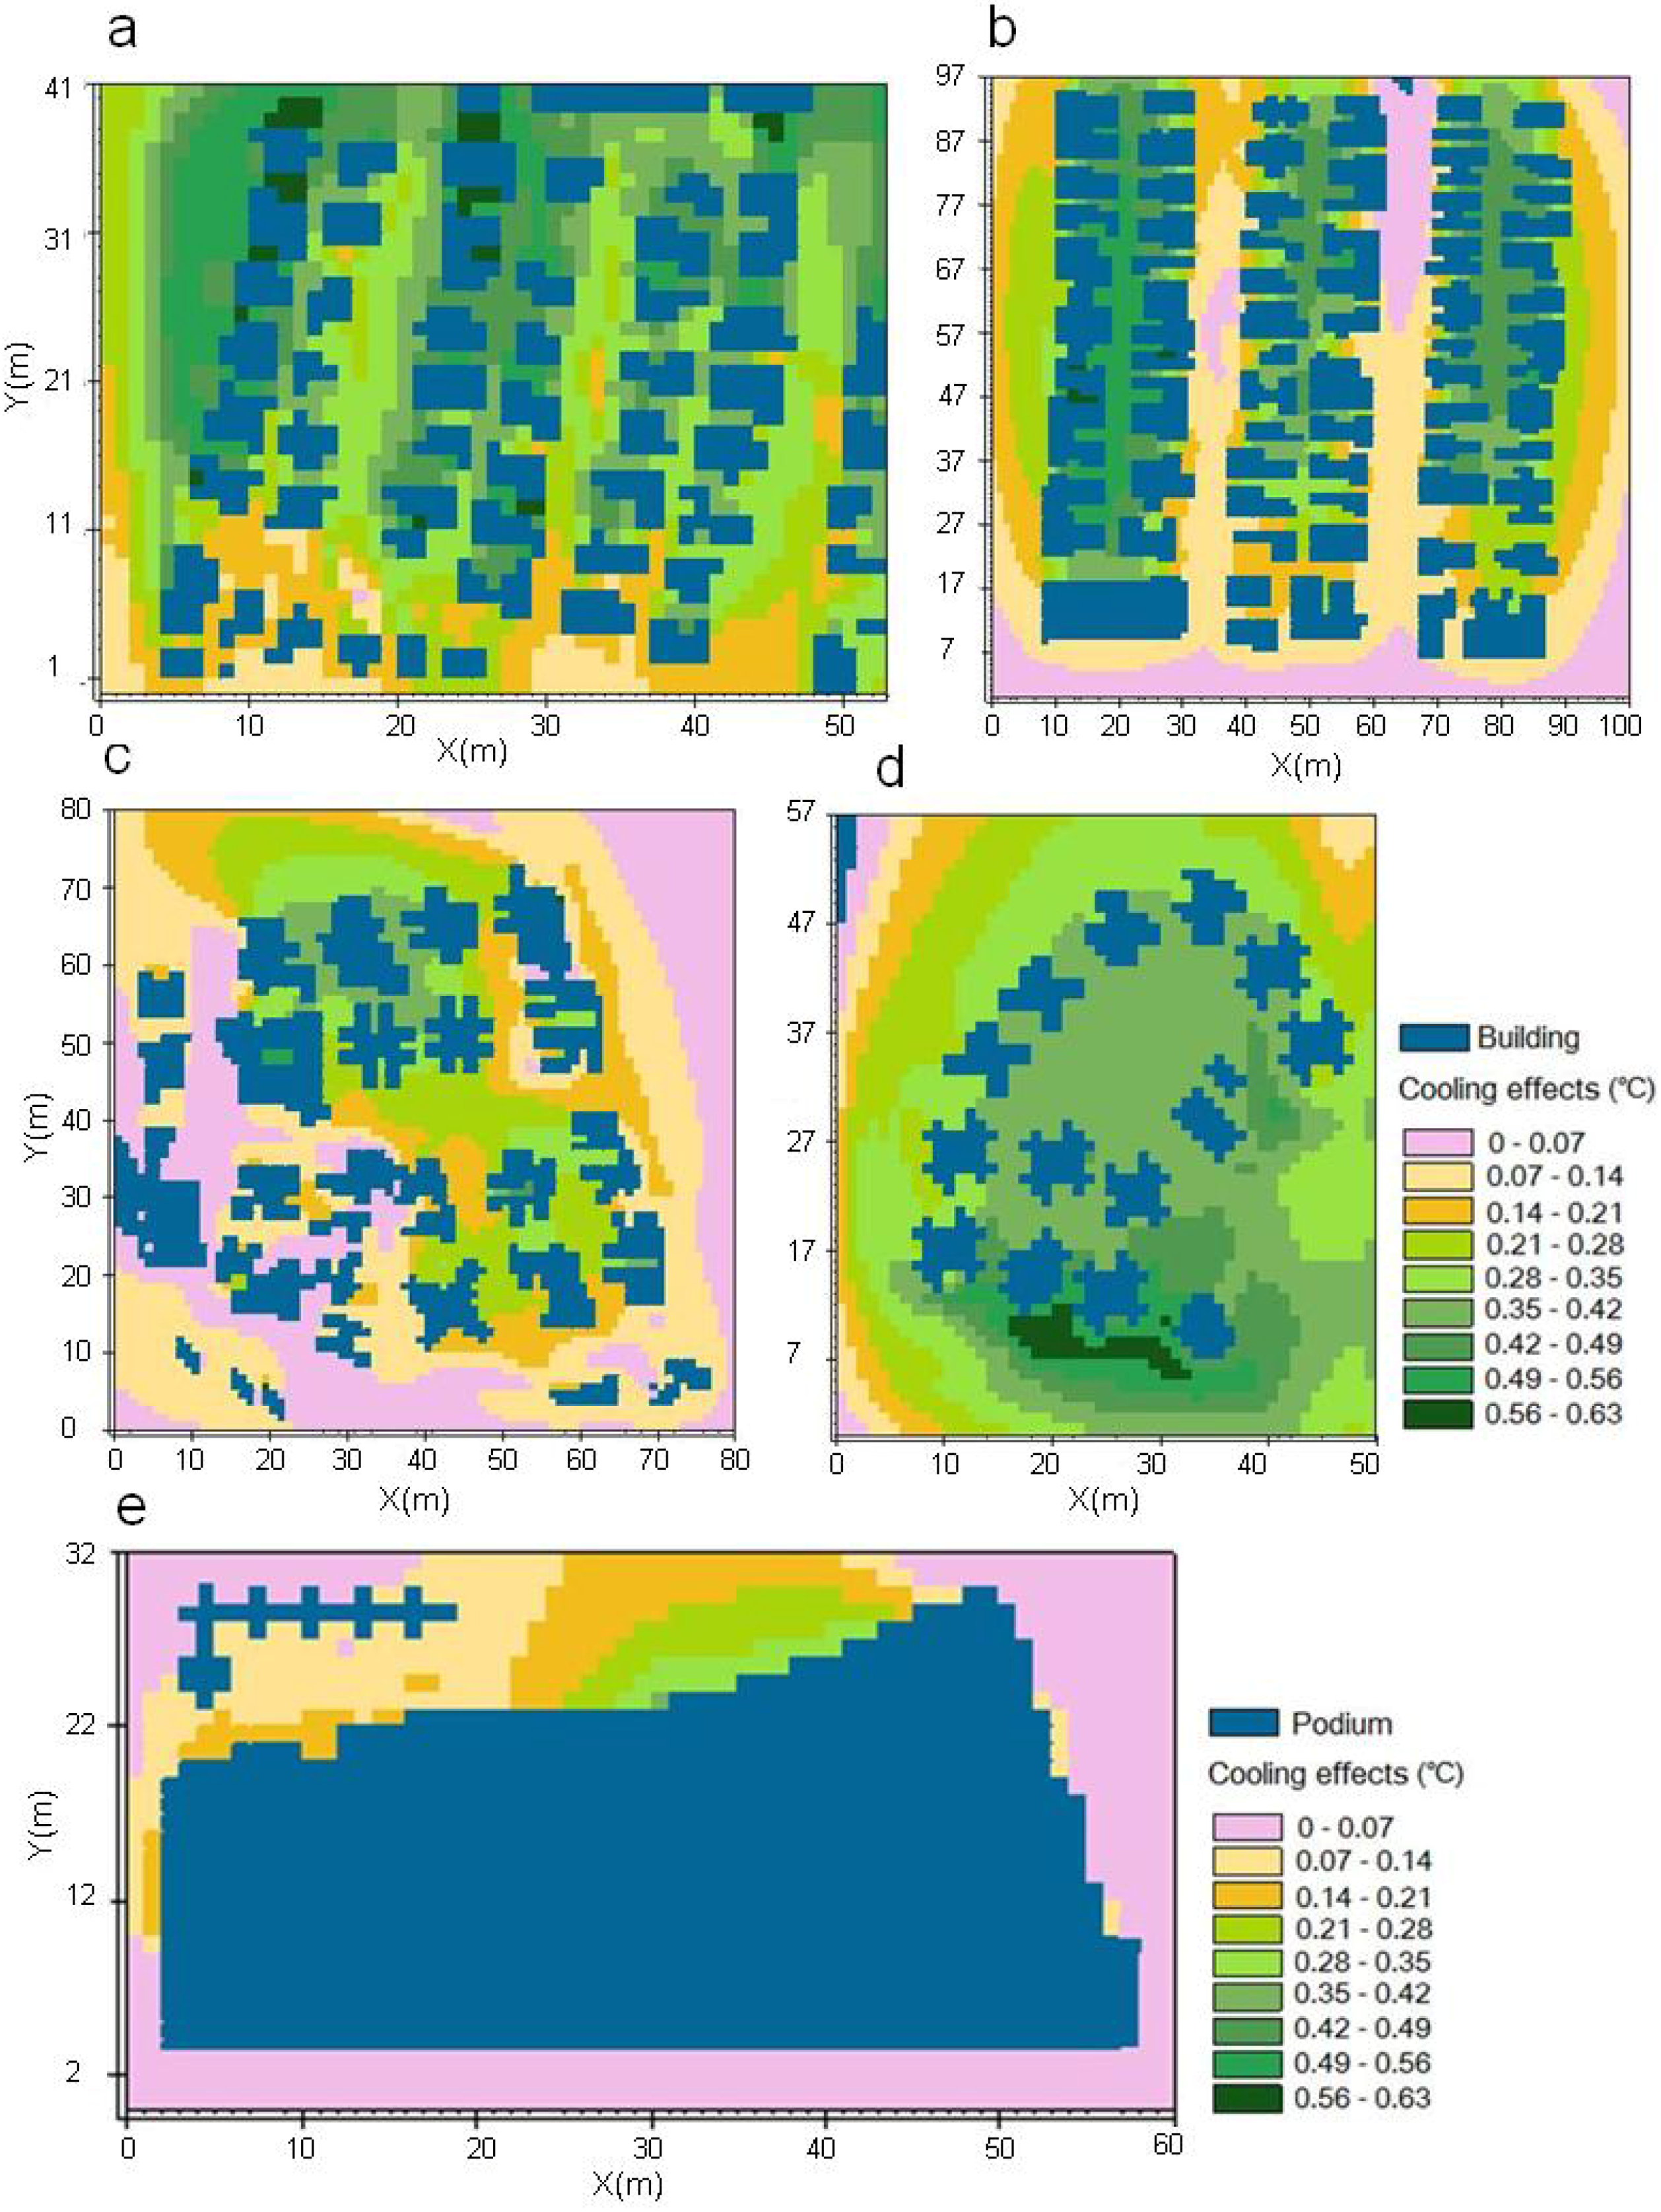
Figure 7.
Horizontal distribution of cooling effects for EGR at the pedestrian level at 14:00 (cooling effects refer to the air-temperature differences between the bare and green-roof scenarios). (a) KT; (b) KC; (c) BC; (d) CM; (e) MF.
Figure 7.
Horizontal distribution of cooling effects for EGR at the pedestrian level at 14:00 (cooling effects refer to the air-temperature differences between the bare and green-roof scenarios). (a) KT; (b) KC; (c) BC; (d) CM; (e) MF.
Figure 8.
Horizontal distribution of cooling effects for IGR at the pedestrian level at 14:00 (cooling effects refer to the air-temperature differences between the bare and green-roof scenarios). (a) KT; (b) KC; (c) BC; (d) CM; (e) MF.
Figure 8.
Horizontal distribution of cooling effects for IGR at the pedestrian level at 14:00 (cooling effects refer to the air-temperature differences between the bare and green-roof scenarios). (a) KT; (b) KC; (c) BC; (d) CM; (e) MF.
In KC, BC and CM, the horizontal temperature gradients are steeper (
Figure 7 and
Figure 8). The cooling effect is notably subdued and diminishes to zero at some localized spots for EGR. Even though KC is low-rise, the dense packing of buildings has hindered air movement and cool-air spread at the pedestrian level. The pedestrian-level cooling effect of green roofs of low-rise buildings, evident in KT, has been largely nullified by the compact building configuration. The open-set middle-rise of BC with relatively high site coverage is less amenable to cooling at the pedestrian level. In contrast, the compact high rise of CM with relatively lower site coverage permits some homogenization of cooling at the pedestrian level. This finding has pertinent implications on urban design in a compact city, hinting that a high-rise development mode can shrink building footprints to afford more street-level open spaces, with a bonus of a more favorable neighborhood microclimate.
Comparing with green roofs, the green podium at MF site exhibits minimal pedestrian-level cooling effects. Both EGR and IGR only cool a confined area contiguous to the north boundary (downwind direction) of the podium (
Figure 7e and
Figure 8e). At the west side of the same boundary, the spillover cooling impact is literally blocked by a row of adjacent buildings oriented perpendicular to the S-N wind direction. The cooling effect is limited despite the low podium elevation, at < 0.4 °C for EGR, and 0.5 °C for IGR (
Table 4). The contrasts between MF and the other four sites in pedestrian-level cooling effect suggest the possible impacts of green-space fragmentation. For two green spaces with comparable area and shape, the one broken up by many buildings (such as MF) might be less capable of improving the neighborhood microclimate than the less fragmented one.
4.2. Vertical Cooling Effects
The previous sections manifested that green-roof cooling effects are not restricted to the rooftop layer, but can extend down to the ground with the help of vertical advection. This section explores the magnitude and gradient of temperature reduction at different elevations (from the ground to the top floor) of the buildings at the center of each study site (
Figure 9,
Table 5). These data offer a basis to estimate energy savings of individual buildings and the entire community.
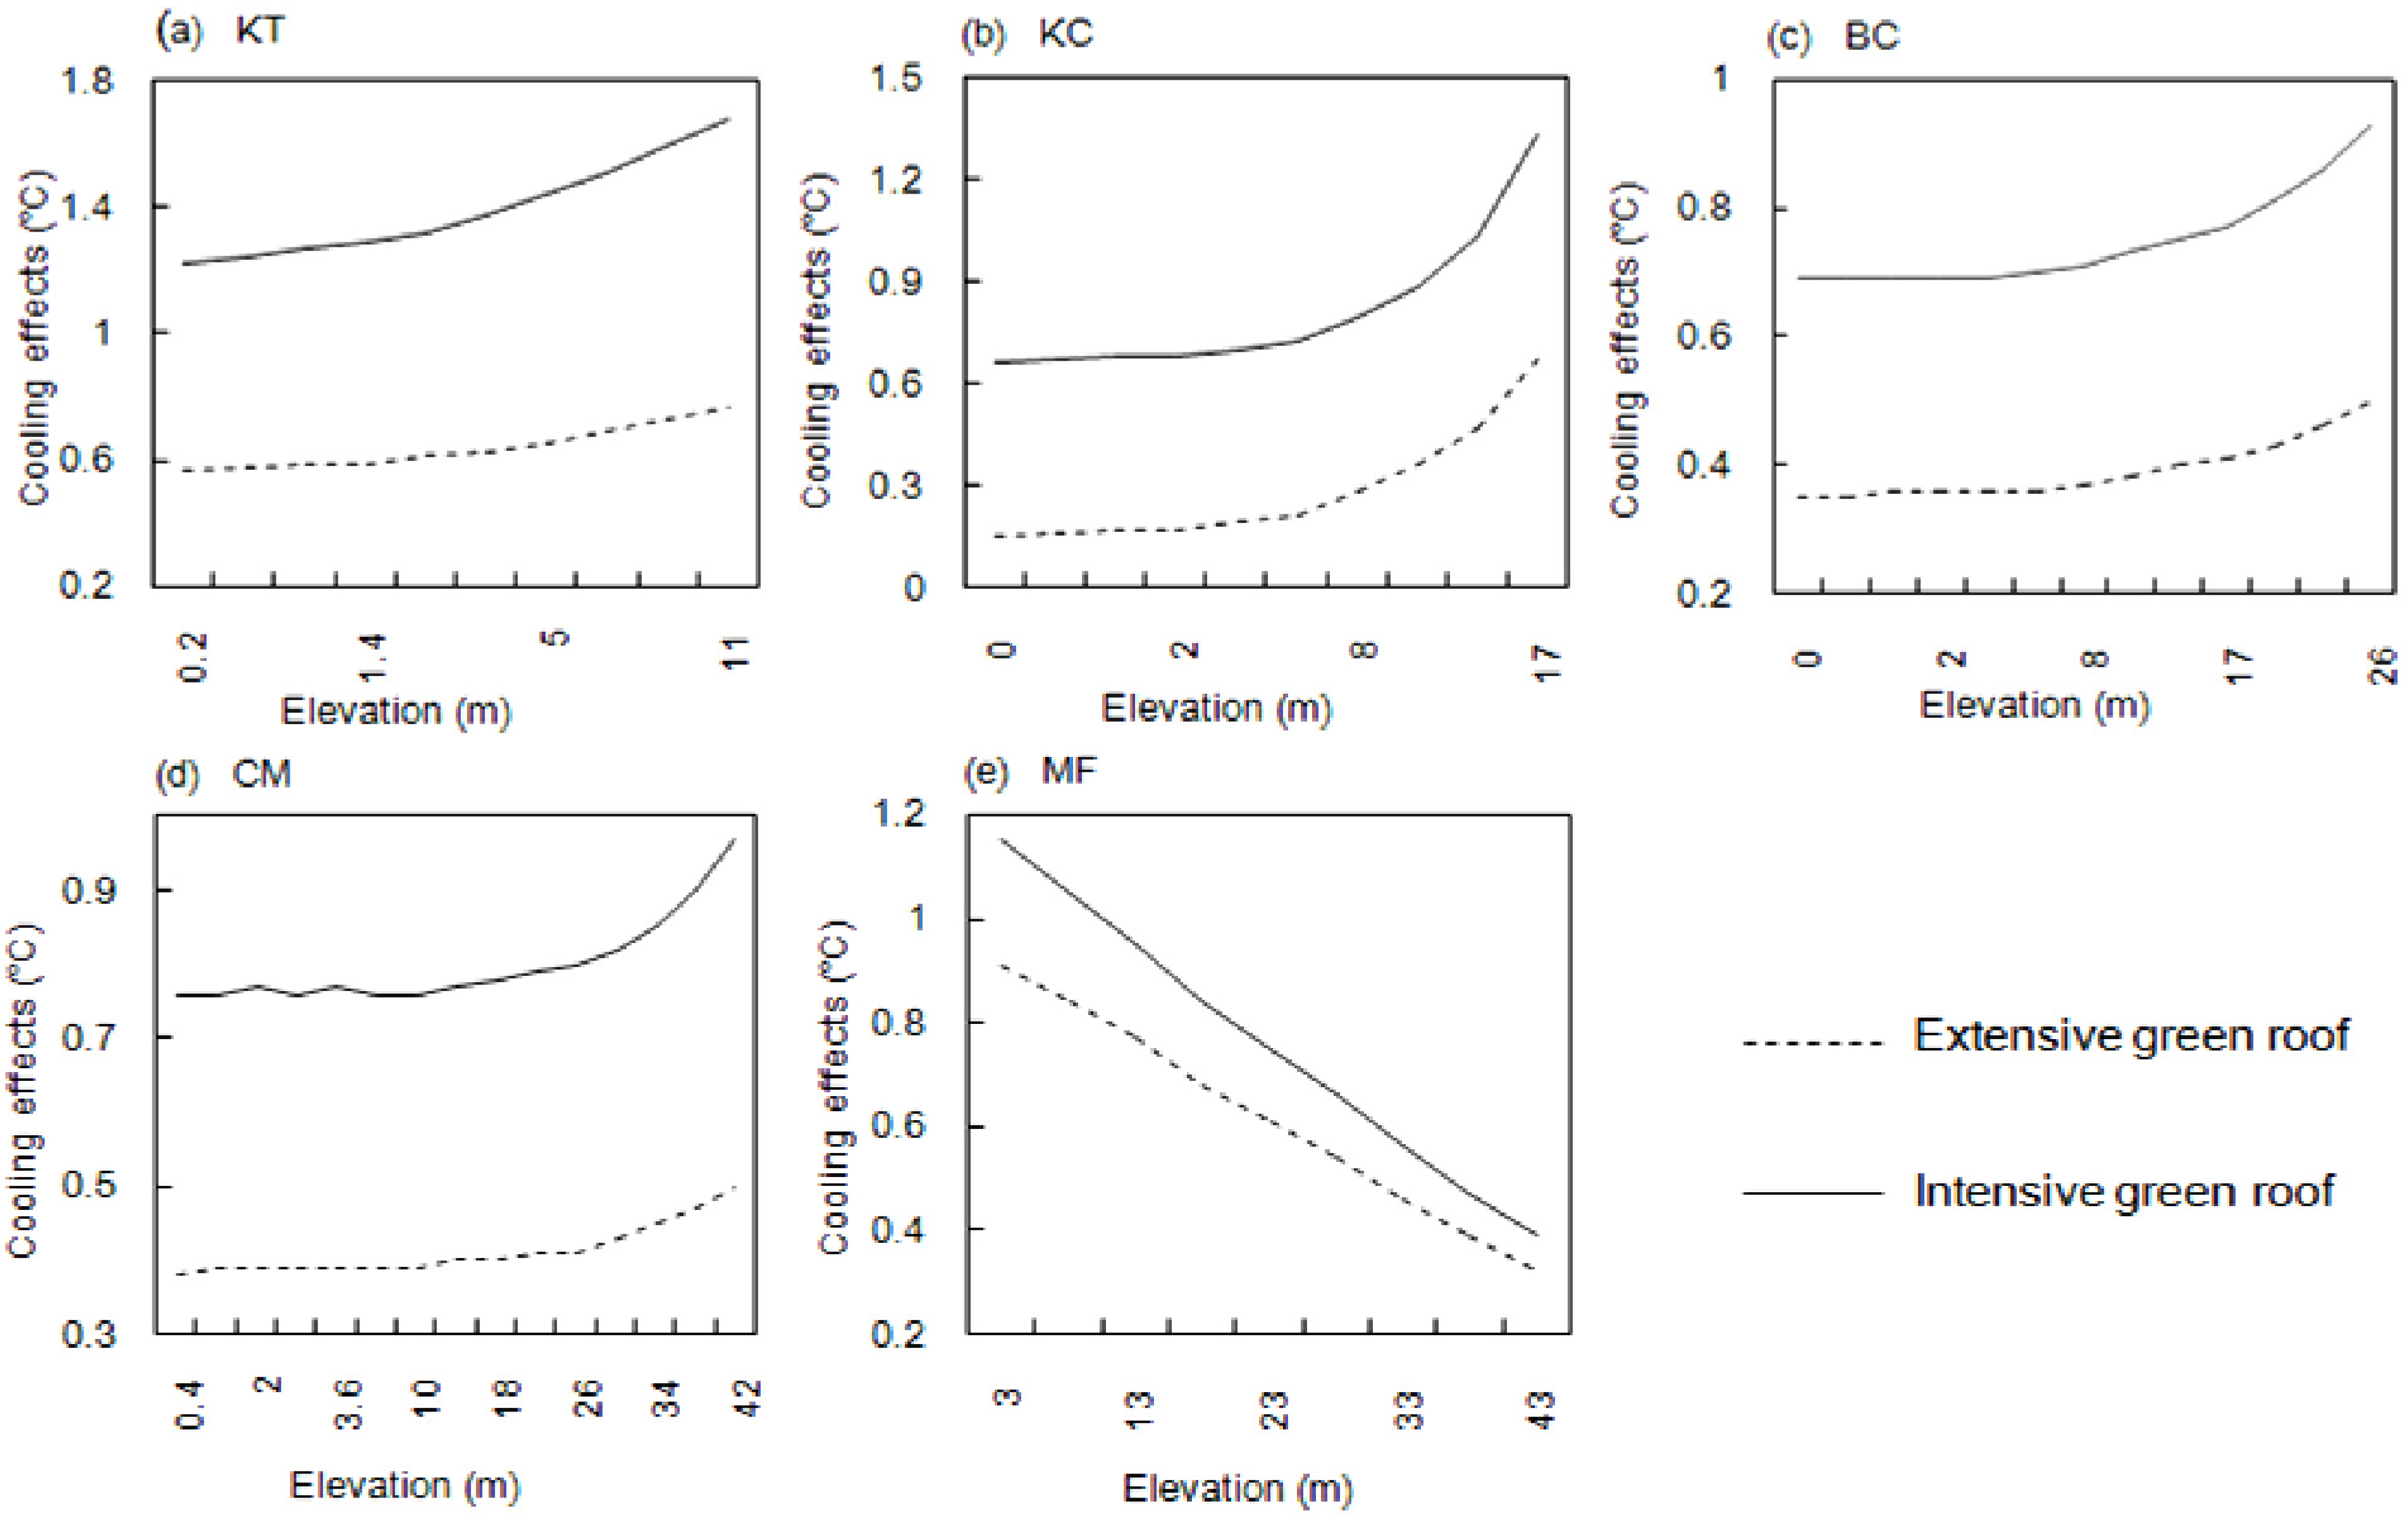
Figure 9.
Vertical distribution of cooling effects for EGR and IGR; the y-axis shows the magnitude of temperature reduction.
Figure 9.
Vertical distribution of cooling effects for EGR and IGR; the y-axis shows the magnitude of temperature reduction.
Table 5.
Vertical gradient of cooling effects (°C) for two green-roof types and three vertical positions in five study sites.
Table 5.
Vertical gradient of cooling effects (°C) for two green-roof types and three vertical positions in five study sites.
| Green-roof scenario | Vertical position | Study site |
| KT | KC | BC | CM | MF |
| Extensive green roof | Roof | 0.8 | 0.7 | 0.5 | 0.5 | 0.9 |
| Top floor | 0.7 | 0.5 | 0.5 | 0.5 | 0.4 |
| Ground floor | 0.6 | 0.2 | 0.4 | 0.4 | 0.9 |
| Intensive green roof | Roof | 1.7 | 1.3 | 0.9 | 1.0 | 1.2 |
| Top floor | 1.6 | 1.0 | 0.9 | 0.9 | 0.5 |
| Ground floor | 1.3 | 0.7 | 0.7 | 0.8 | 1.2 |
MF assumes a reverse vertical gradient with maximum cooling at the ground floor (1.2 °C) near the podium surface, decreasing to 0.5 °C at the top floor. This pattern echoes the dominant proximal cooling effect of podium greening on low floors of the residential units, and the prominent linear height-decay cooling trend. Thus the cooling effect of podium-level greening has a notably curtailed ability to ascend, contrasting with the fair ability of roof-level cooling to descend.
For EGR, top floor apartments derive more benefits from green roof installation with cooling around 0.5–0.7 °C (
Figure 9). For IGR, the equivalent values are significantly higher and have more variations, at 1.6 °C, 1.0 °C, 0.9 °C and 0.9 °C, respectively, for KT, KC, BC and CM. In low-rise sites, the cooling magnitude on the ground floor reaches 1.3 °C for KT, but at only 0.7 °C for KC. The lower site coverage of KT has brought effective vertical advection to extend and sustain green-roof cooling down to the ground floor. The difference in cooling performance between the top and ground floors is limited. For KC with higher site coverage, despite its equally low-rise buildings, the green-roof cooling effect drops quickly from the top to middle floor, and remains relatively subdued but stable at the low floors.
In mid-rise and high-rise sites BC and CM, the cooling magnitude on the ground floor remains at around 0.4 °C for EGR and around 0.7 °C for IGR (
Figure 9). On the top floor, the cooling magnitude rises to 0.5 °C and 0.9 °C, respectively, for EGR and IGR. Similar to KC, these two sites with higher building site coverage experience faster drop in cooling magnitude on the higher floors.
4.3. HTC Effects
We investigated the diurnal PET at both rooftop-podium and pedestrian levels under three roof scenarios (bare roof, and EGR and IGR) at each study site. The receptors for calculation of PET were placed in the middle of the main road in each of the study sites and they were free from shading by adjacent building structures or trees.
4.3.1. Rooftop-Podium Level HTC Effects
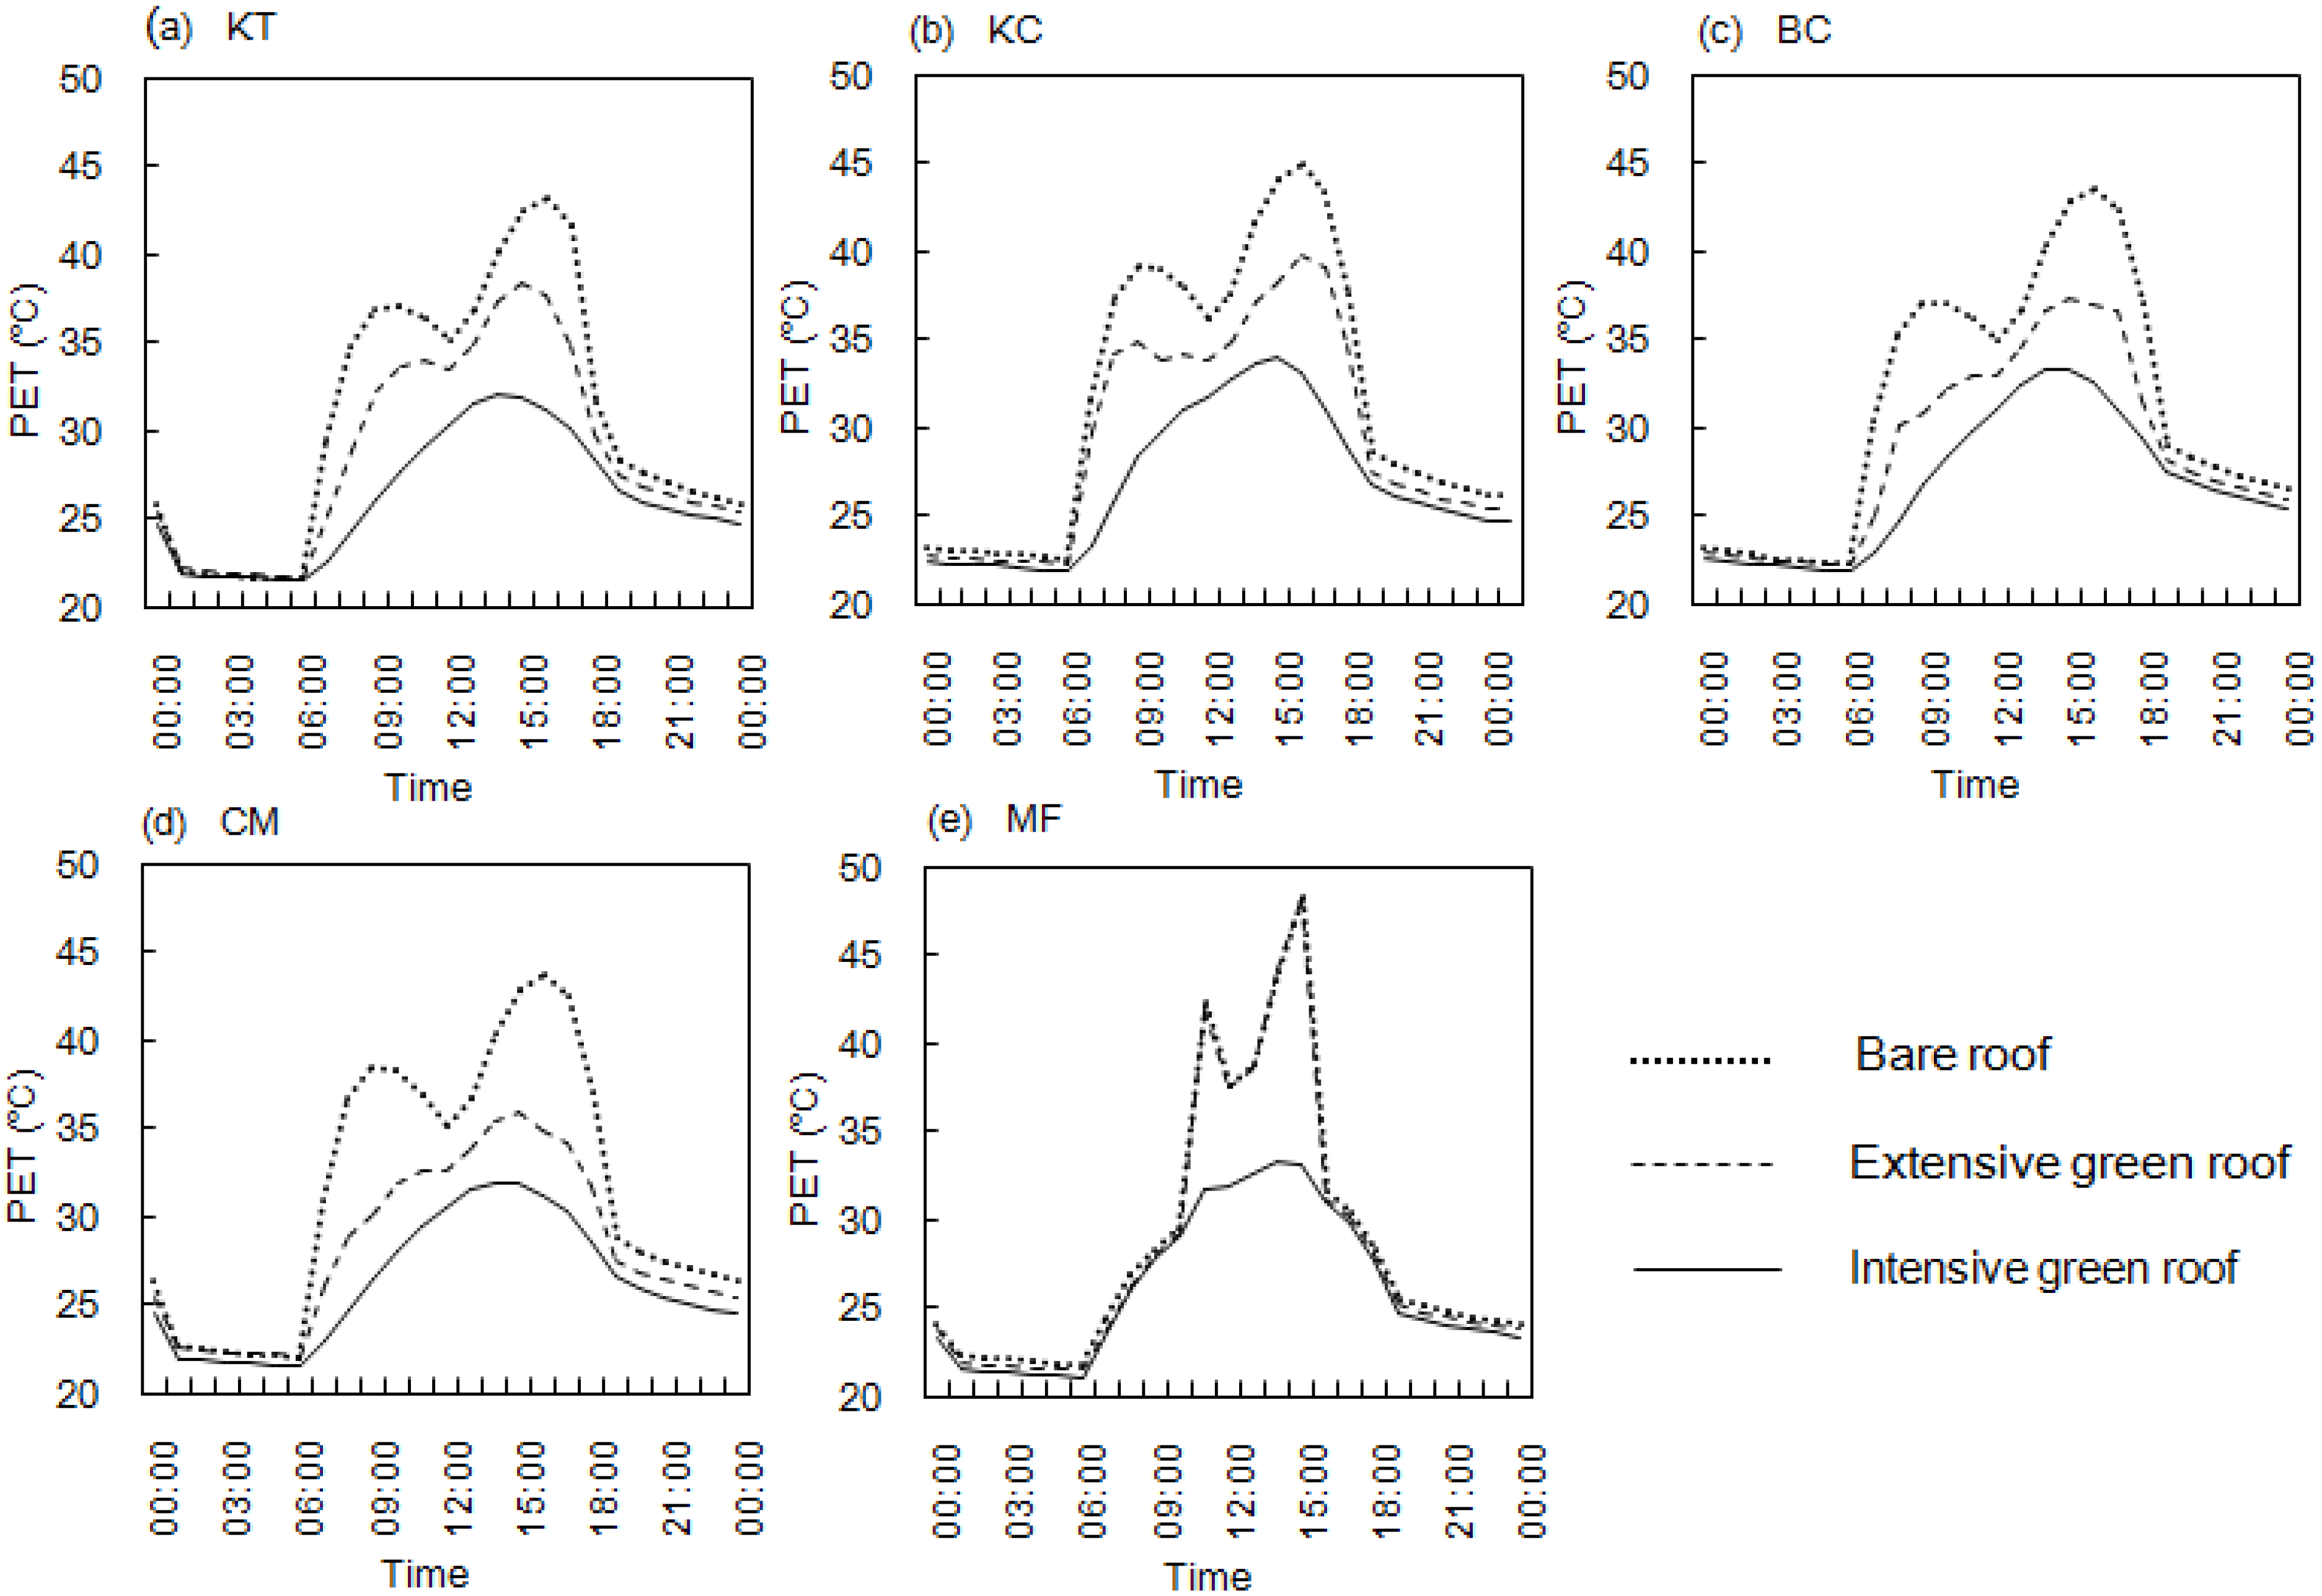
Figure 10 shows the diurnal rooftop-podium level PET under the three scenarios in each site. The 24-hour PET cycle under bare roof in each study site could be demarcated into four episodes. The short period from 00:00 to 06:00 records a “comfortable” late nighttime with PET ≤ 23°C. Upon sunrise, PET rises drastically from 23 °C to 35 °C, indicating a “warm” early morning rooftop ambience. The long episode from 10:00 to 18:00 witnesses a “hot” to “very hot” daytime thermal environment with PET exceeding 35 °C. After sunset till 00:00, the early nighttime PET remains in the range of 25–28 °C, reflecting a “slightly warm” ambience.
Figure 10.
Diurnal PET circle under the three scenarios of bare roof, EGR and IGR at the rooftop-podium level.
Figure 10.
Diurnal PET circle under the three scenarios of bare roof, EGR and IGR at the rooftop-podium level.
Daytime PET drops dramatically towards early nighttime, depressing the HTC from “very hot” to “hot” level for EGR, and to “warm” level for IGR. In contrast, the late nighttime PET has smaller difference amongst the three scenarios. The contrast of daytime and nighttime PET mitigation indicates the dominant role of radiation mitigation (MRT) in HTC improvement. In daytime, it could be achieved by reducing upward reflective radiation from EGR, and trimming both upward longwave and downward solar radiation by IGR.
It is observed that scenarios EGR and bare roof show a double wave in the diurnal course, but IGR is not showing such a curve. The PET in EGR and bare roof scenarios are principally governed by solar radiation so they respond promptly to changes in solar radiation. In contrast, the dense tree canopies of IGR could provide shading so the influence of solar radiation is not as rapid as the EGR and bare roof.
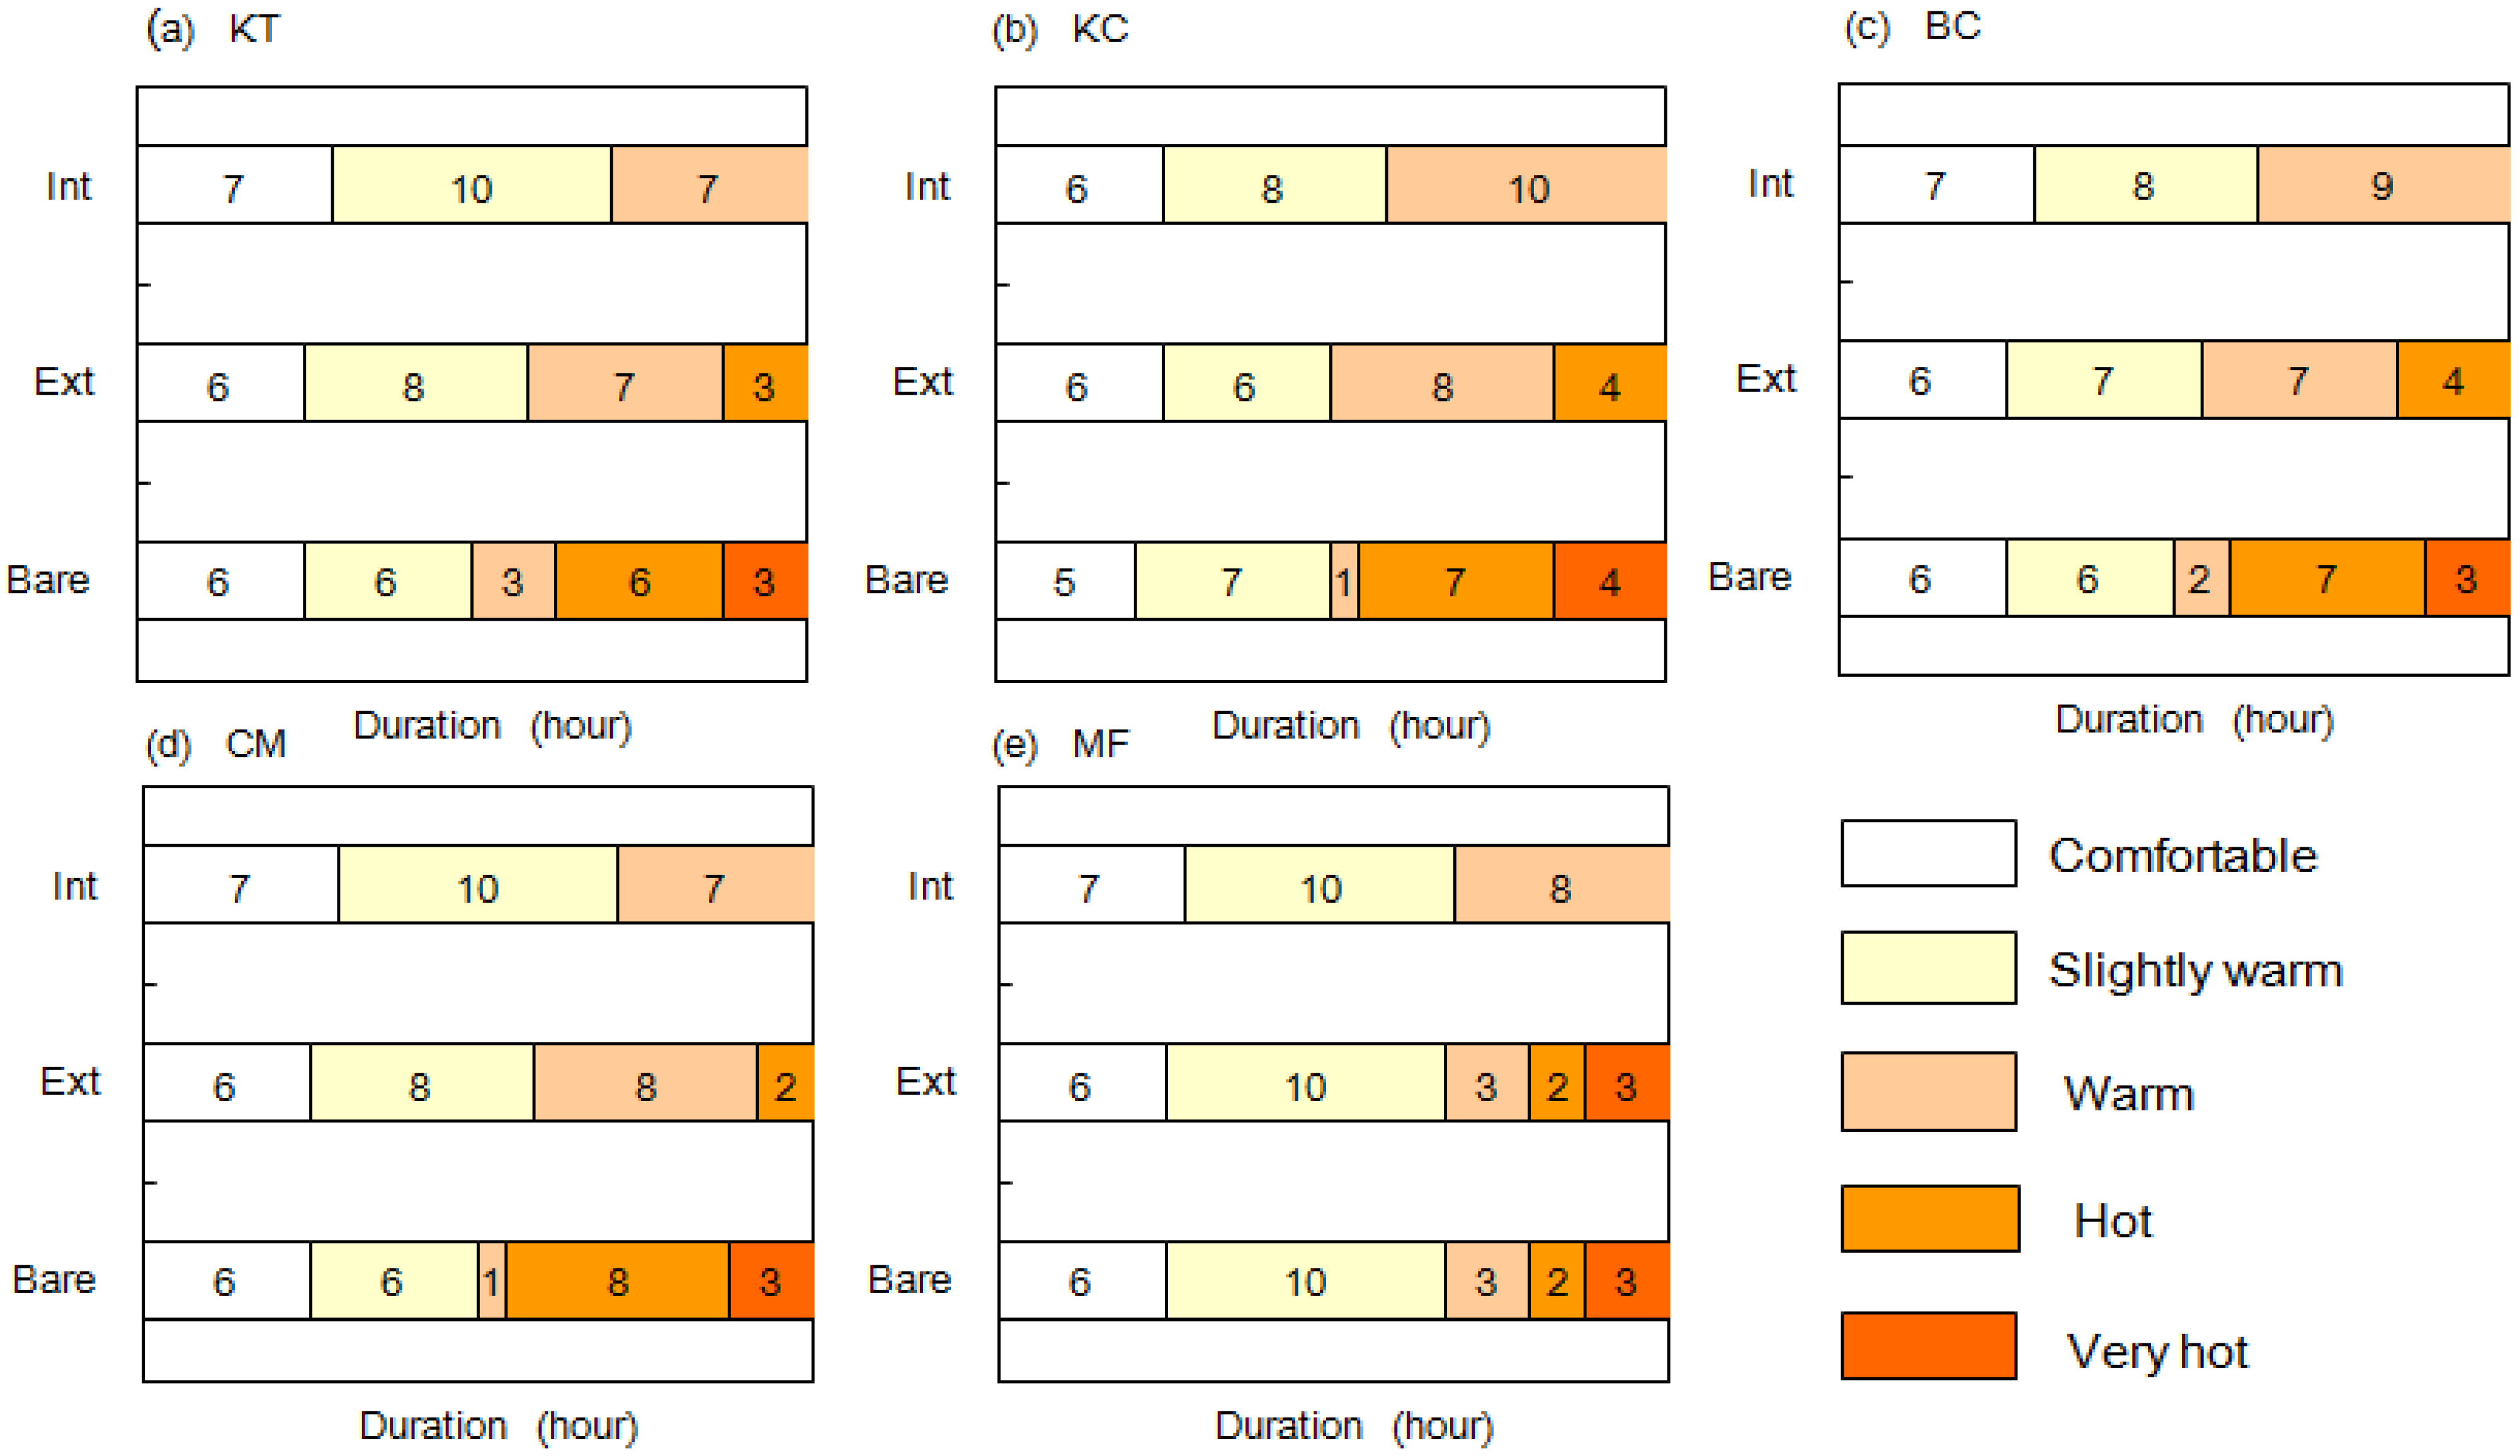
Figure 11 highlights the time durations in a day under strong heat stress (“hot” to “very hot” thermal perception) vis-à-vis the less stressful classes in relation to bare, EGR and IGR scenarios in each study site. The bare roofs experience around 3 h of “very hot” and 2–8 h of “hot” periods in daytime. EGR witness no “very hot” sensation, with “hot” period reduced to 3−4 h. For IGR, both “hot” and “very hot” sensations are absent, whilst sustaining “comfortable”, “slightly warm” and “warm” periods throughout the day.
Figure 11.
Thermal perception under the three roof scenarios at rooftop-podium level (Ext, Int and Bare denote respectively EGR, IGR and bare-roof scenarios).
Figure 11.
Thermal perception under the three roof scenarios at rooftop-podium level (Ext, Int and Bare denote respectively EGR, IGR and bare-roof scenarios).
Overall, the ample residential rooftop spaces that hitherto have remained pervasively bare in Hong Kong exhibit long durations of uncomfortable thermal condition on typical sunny summer days. Collectively, they denote a wasted resource that contributes to the aggravating UHI effect with implications on human comfort, heat stress and health. Green roofs can drastically suppress PET, resulting in much more comfortable rooftop-podium ambience in different types of residential sites. In a compact city like Hong Kong with scarce street-level greenspaces, the elevated roofs and podiums offer significant greening alternatives and potentials to provide thermally comfortable and visually pleasant venues for recreational and amenity purposes.
4.3.2. Pedestrian-Level HTC Effects
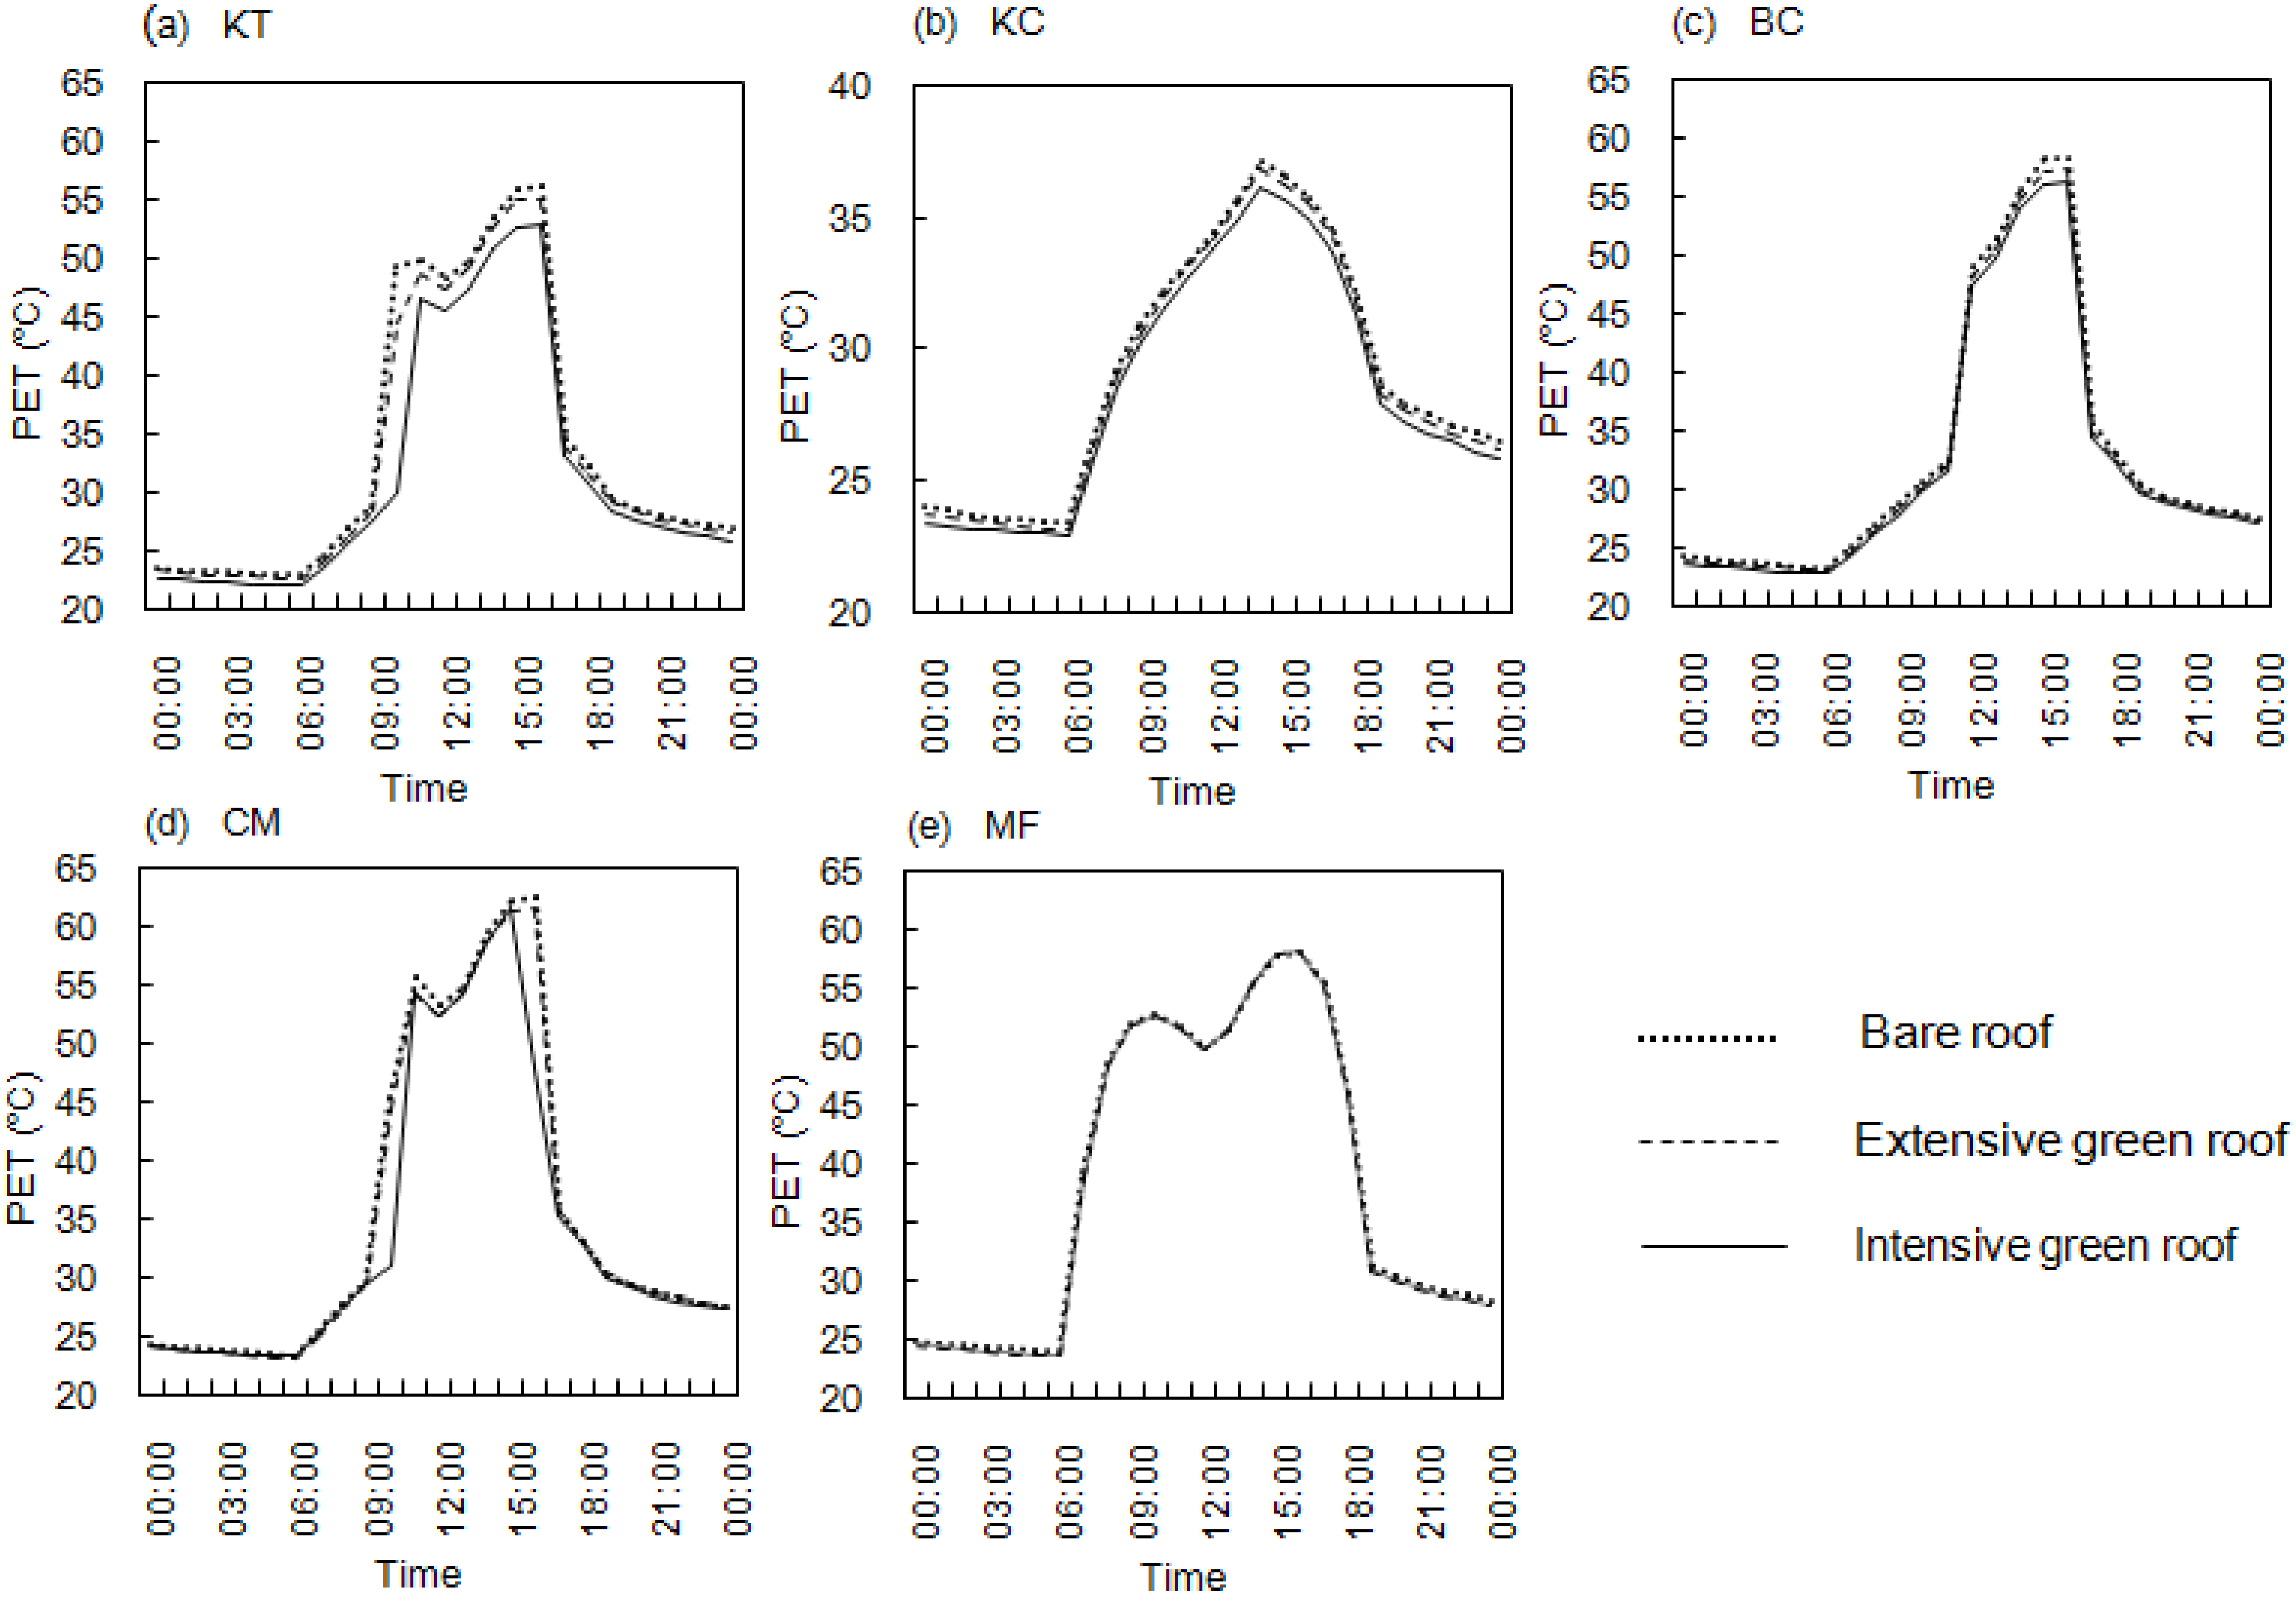
The pedestrian-level spaces under the existing bare roof scenario have a similar long duration of high PET in the daily cycle, except for a short late nighttime period from 00:00 to 06:00, when PET is in the “comfortable” zone (
Figure 12). Daytime pedestrian-level PET shoots up to 62 °C in the afternoon, much higher than the rooftop-podium level. This might be related to the additional reflective radiation from building facades and limited ventilation. Green roof installation brings little change to the pedestrian-level HTC. EGR can barely reduce PET, whereas IGR can lower PET up to several degrees but hardly change the “very hot” situation. This is understandable since the outdoor PET is dominantly determined by radiation, which at the pedestrian-level can hardly be modified by greenery situated on the rooftop. However, it should be noted that the reduction of air-conditioning heat emission due to neighborhood-scale cooling has not been incorporated in the estimation HTC effects.
Figure 12.
Diurnal PET circle under the three scenarios of bare roof, EGR and IGR at the pedestrian level.
Figure 12.
Diurnal PET circle under the three scenarios of bare roof, EGR and IGR at the pedestrian level.
5. Conclusions
In the context of global and local climate change, the intensifying UHI effect and heat stress especially of compact tropical cities call for the mobilization of the largely untapped rooftop spaces to bring climate amelioration, energy conversation and more comfortable urban environment. This study investigated the effects of community-scale green-roof installation on neighborhood microclimate and human thermal comfort through numerical microclimatic modeling. The findings, implications, limitations and recommendations for future studies are summarized as follows:
(1) Similarities between the simulated and observed air temperature verify that the climate model ENVI-met can offer sensitive and reliable simulation of the microclimatic dynamics of subtropical green roofs in built-up areas at the neighborhood scale. However, due to difficulties in conducting on-site microclimate measurements over large urban areas, the ENVI-met model was validated based on monitoring data from three closely spaced experimental sites. The reliability of the simulation results can further be improved by using more verification sites and with greater spatial variations.
(2) The widespread installation of green roofs across a neighborhood can bring improvements in neighborhood-scale microclimate. Horizontally, the cool enclaves can cover a large proportion of a site. The horizontal variations of cooling effects at the rooftop-podium level ranges from 0.1 to 1.6 °C for EGR, and 0.2–2.1 °C for IGR. The equivalent values for cooling effects at the pedestrian level are 0.0–0.7 °C and 0.0–1.7 °C, respectively. Vertically, cooling effects can extend from the rooftop down to the ground floor to benefit building dwellers. The top floor can be cooled by 0.4−0.7 °C for EGR, and 0.5–1.6 °C for IGR. The ground floor could be cooled by 0.2–0.9 °C and 0.7–1.3 °C, respectively.
(3) Green roofs can profoundly improve the thermal comfort level at the rooftop-podium level. Within a hot sunny summer day, EGR could reduce “hot” and “very hot” periods by 6–9 h, and IGR could reduce 9–11 h. The findings reflect the great potential of green roofs and podiums to provide comfortable outdoor recreational and amenity spaces for urban dwellers. However, green roofs can hardly change the thermal comfort level at the ground level. The results suggested the importance of increasing accessibility of green roofs in order to improve the health and life quality of urban residents.
(4) Vegetation types display notable influence on green-roof cooling and thermal comfort effects. Intensive green roofs significantly outperform the extensive with reference to both in situ and spillover cooling effects, at both the rooftop and street levels. The cooling effects of 6 m tall dense trees are about twice as much as the 3 cm tall dense grasses. The contrast of HTC effects between the two green roof types is particularly pronounced owing largely to the shading effects of tree canopy. For the sake of simplification, this study only simulated two typical green-roof types both with uniform plant features. Future studies might need to investigate green roofs with more diverse plant species, soil types, complex biomass structures, and vegetation coverage that are relevant to the local urban environment.
(5) The study found potential impacts of urban design factors on green-roof effects, with particular reference to building height, site coverage, development density and main street orientation. Both rooftop and pedestrian level cooling effects tend to be more pronounced in low-rise sites. Besides, lower site coverage might facilitate the vertical and lateral advection of green-roof cool air to bring cooling more effectively to the pedestrian level. In summary, our study suggested that low-rise and low-density sites with main streets aligned with wind direction might be the most desirable for roof greening as wind can effectively push the cooling loci of green roofs towards the downwind part both at the rooftop and pedestrian levels.
(6) Due to the limited number of study sites, we were not able to quantify the impacts of urban design factors. Nonetheless, the potentially influential design factors identified in this study can serve the basis for further parametric studies. Based on more simulation scenarios and statistical analysis, future studies might provide quantitative information on how each design factors could be adjusted in certain urban areas to achieve desirable outdoor thermal environment.
(7) The reduction in neighborhood-scale air temperature could lead to notable decrease in air-conditioning energy consumption. A cost-benefit analysis taking into account in situ energy savings and upstream CO2 avoidance is recommended for future studies to identify the most cost-effective sites for green-roof implementation aiming at urban climate amelioration at the neighborhood scale.


