Thermal CFD Analysis of Tubular Light Guides

Abstract
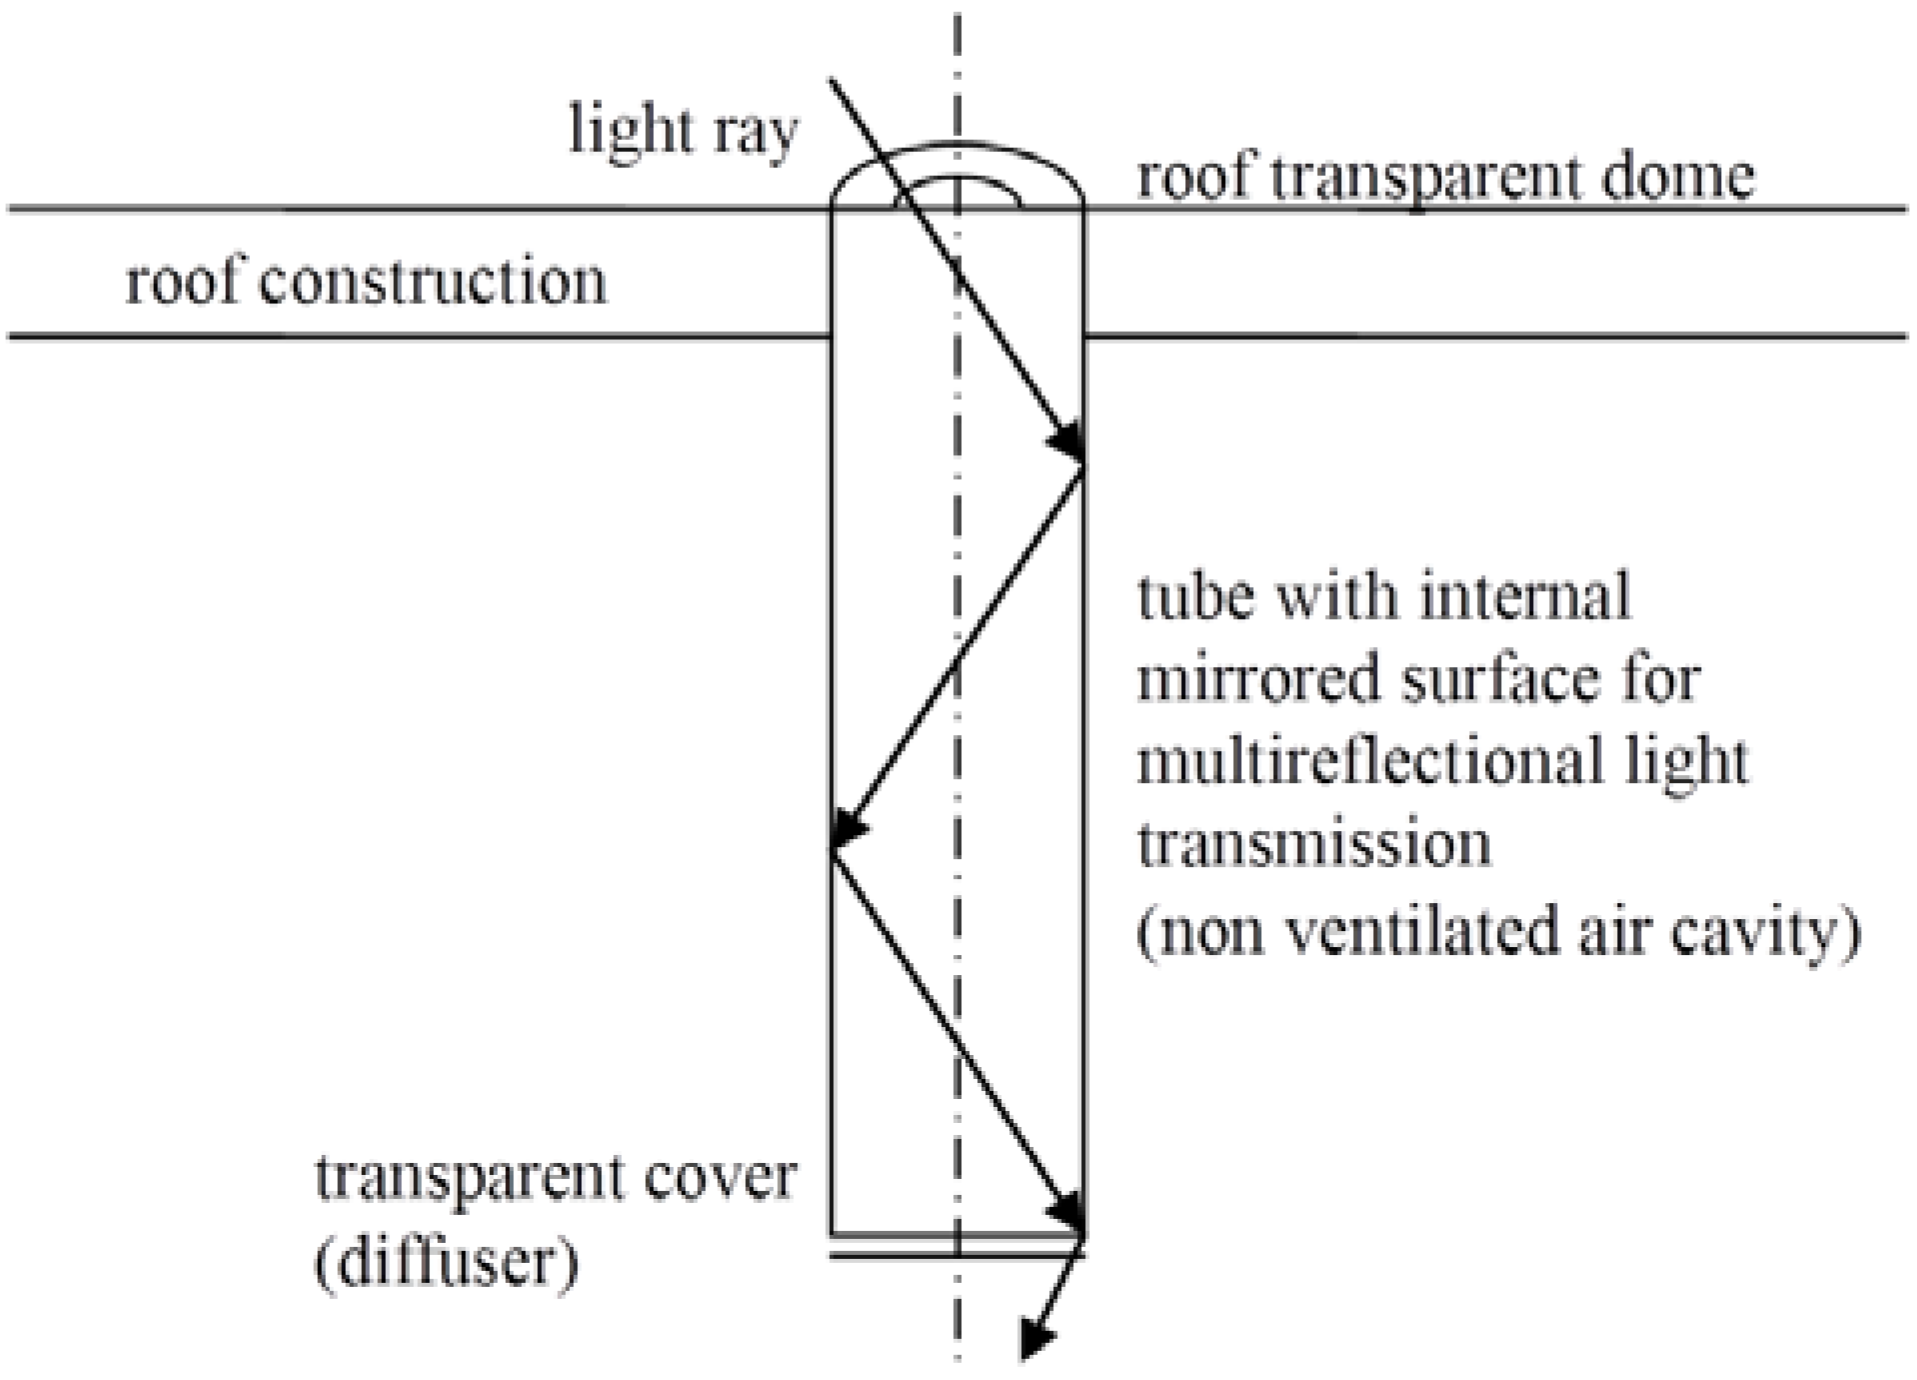
:1. Introduction
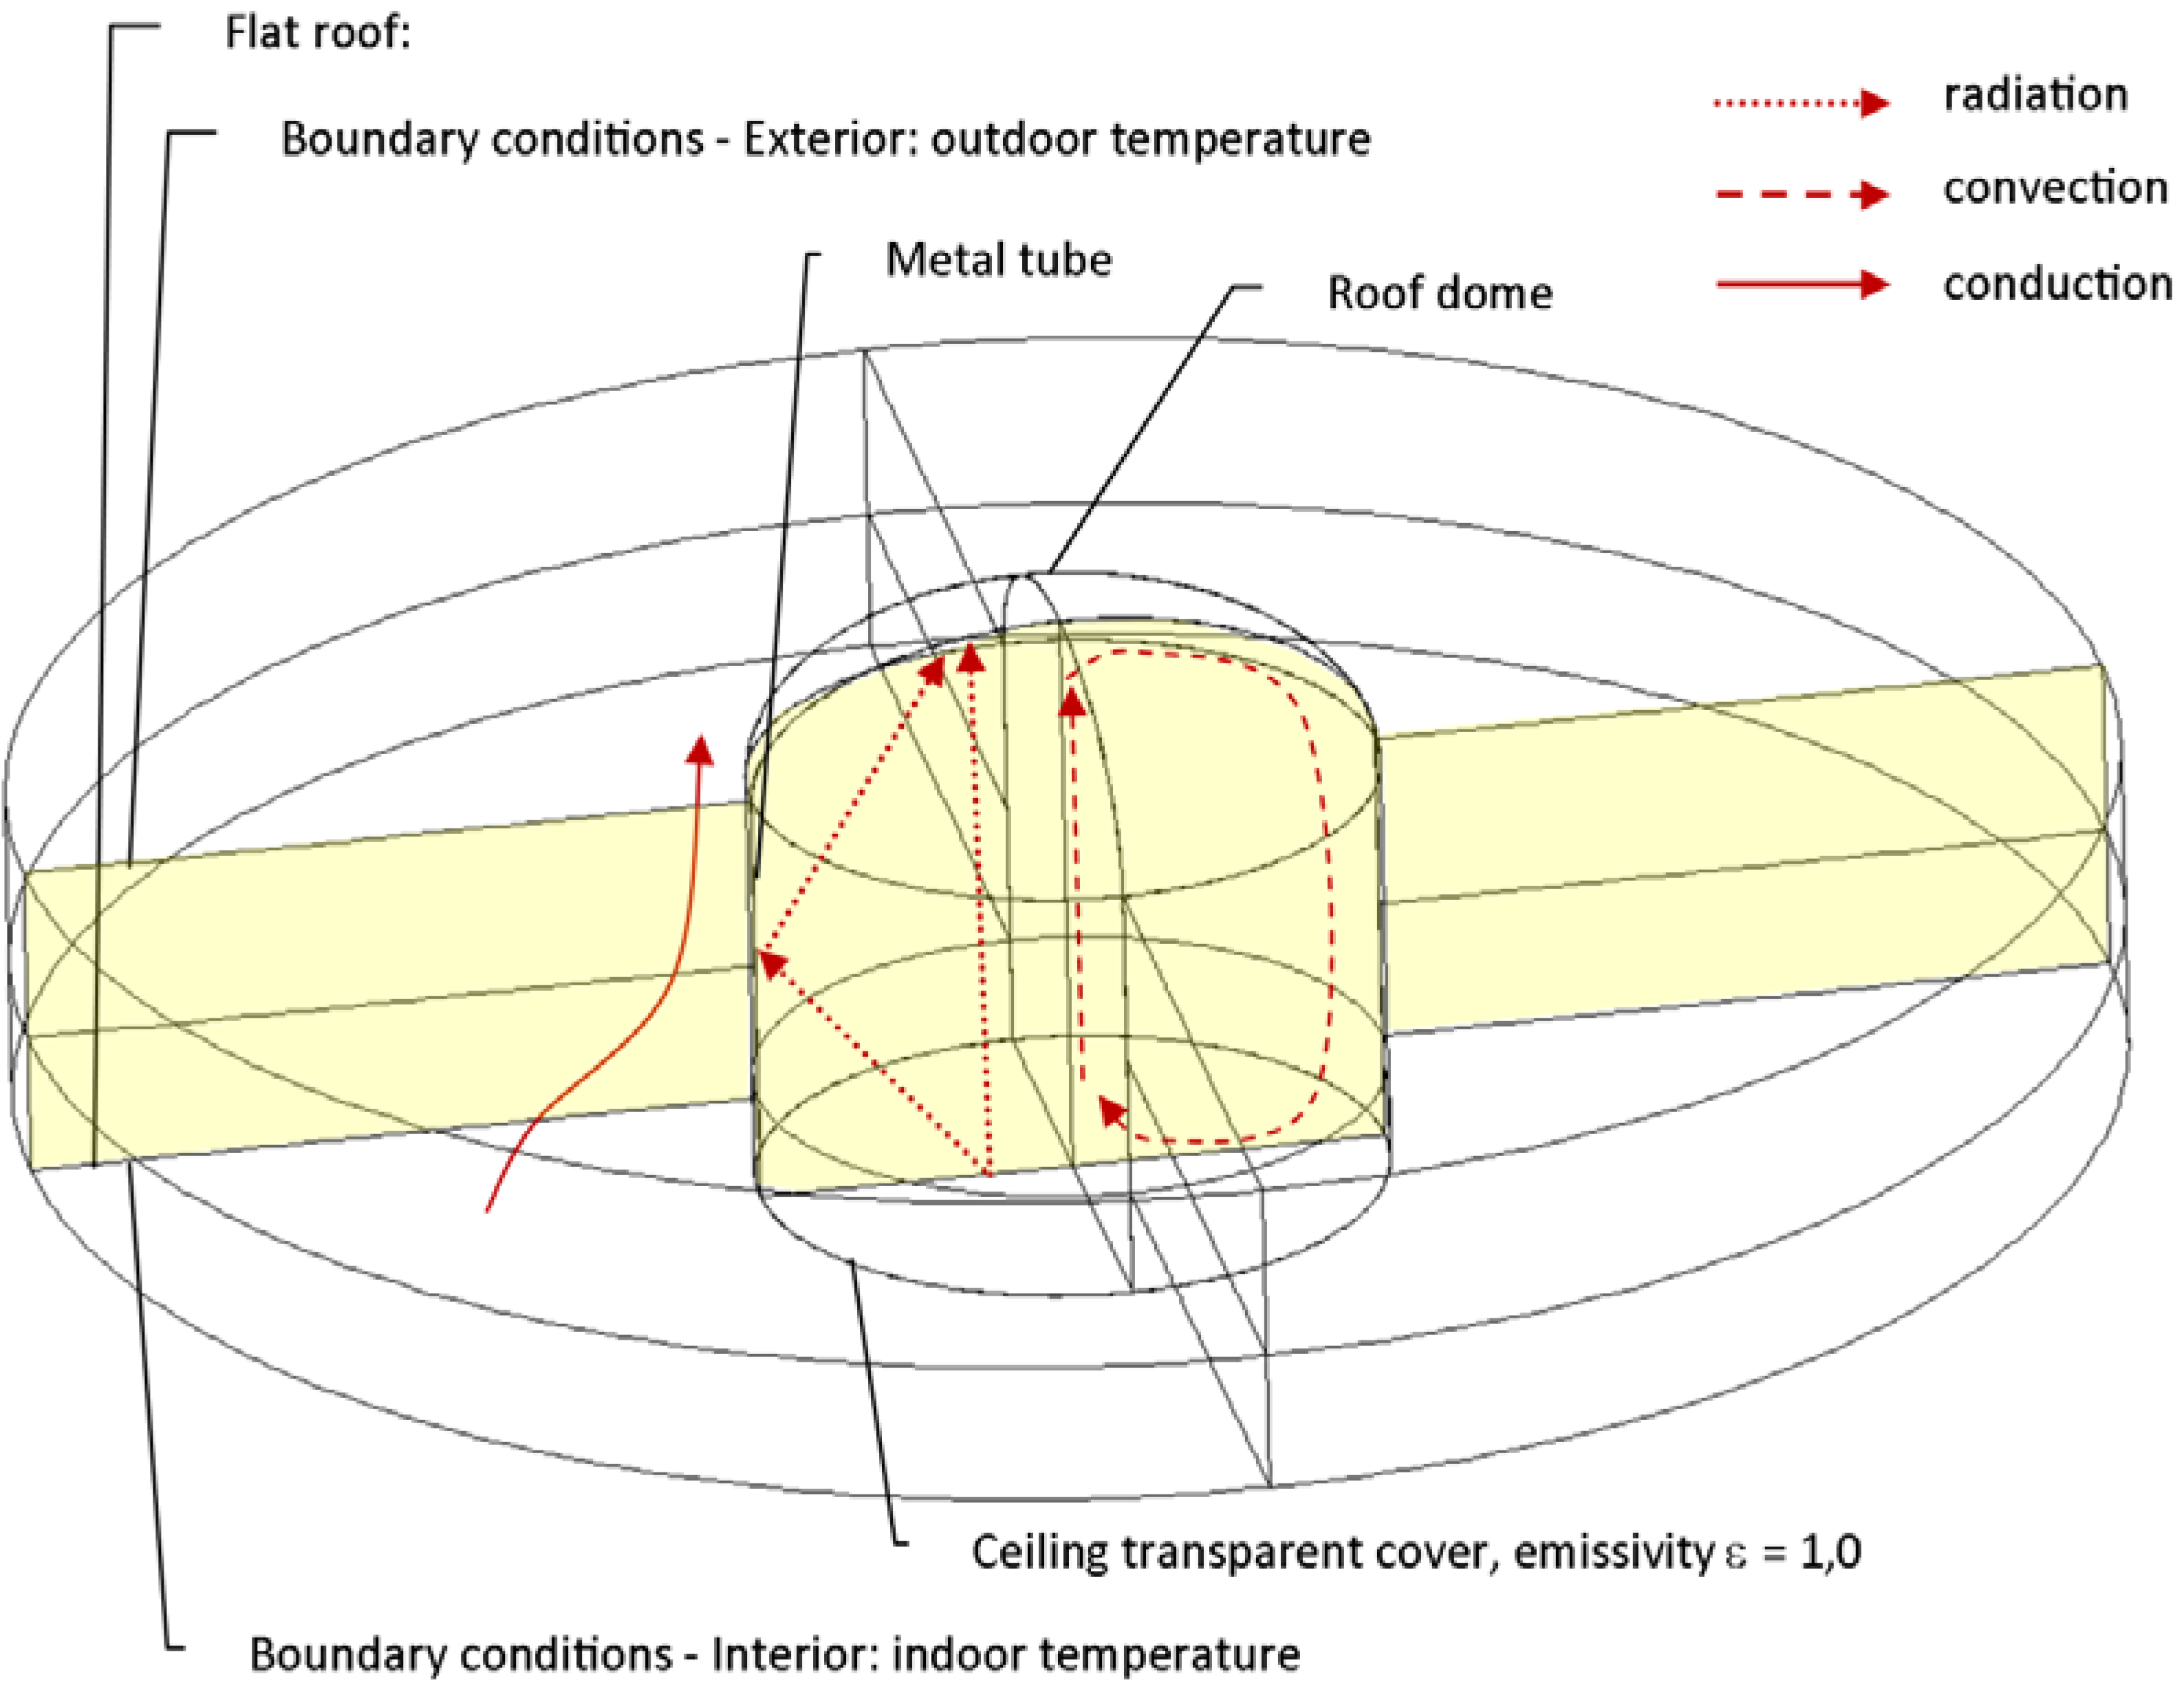
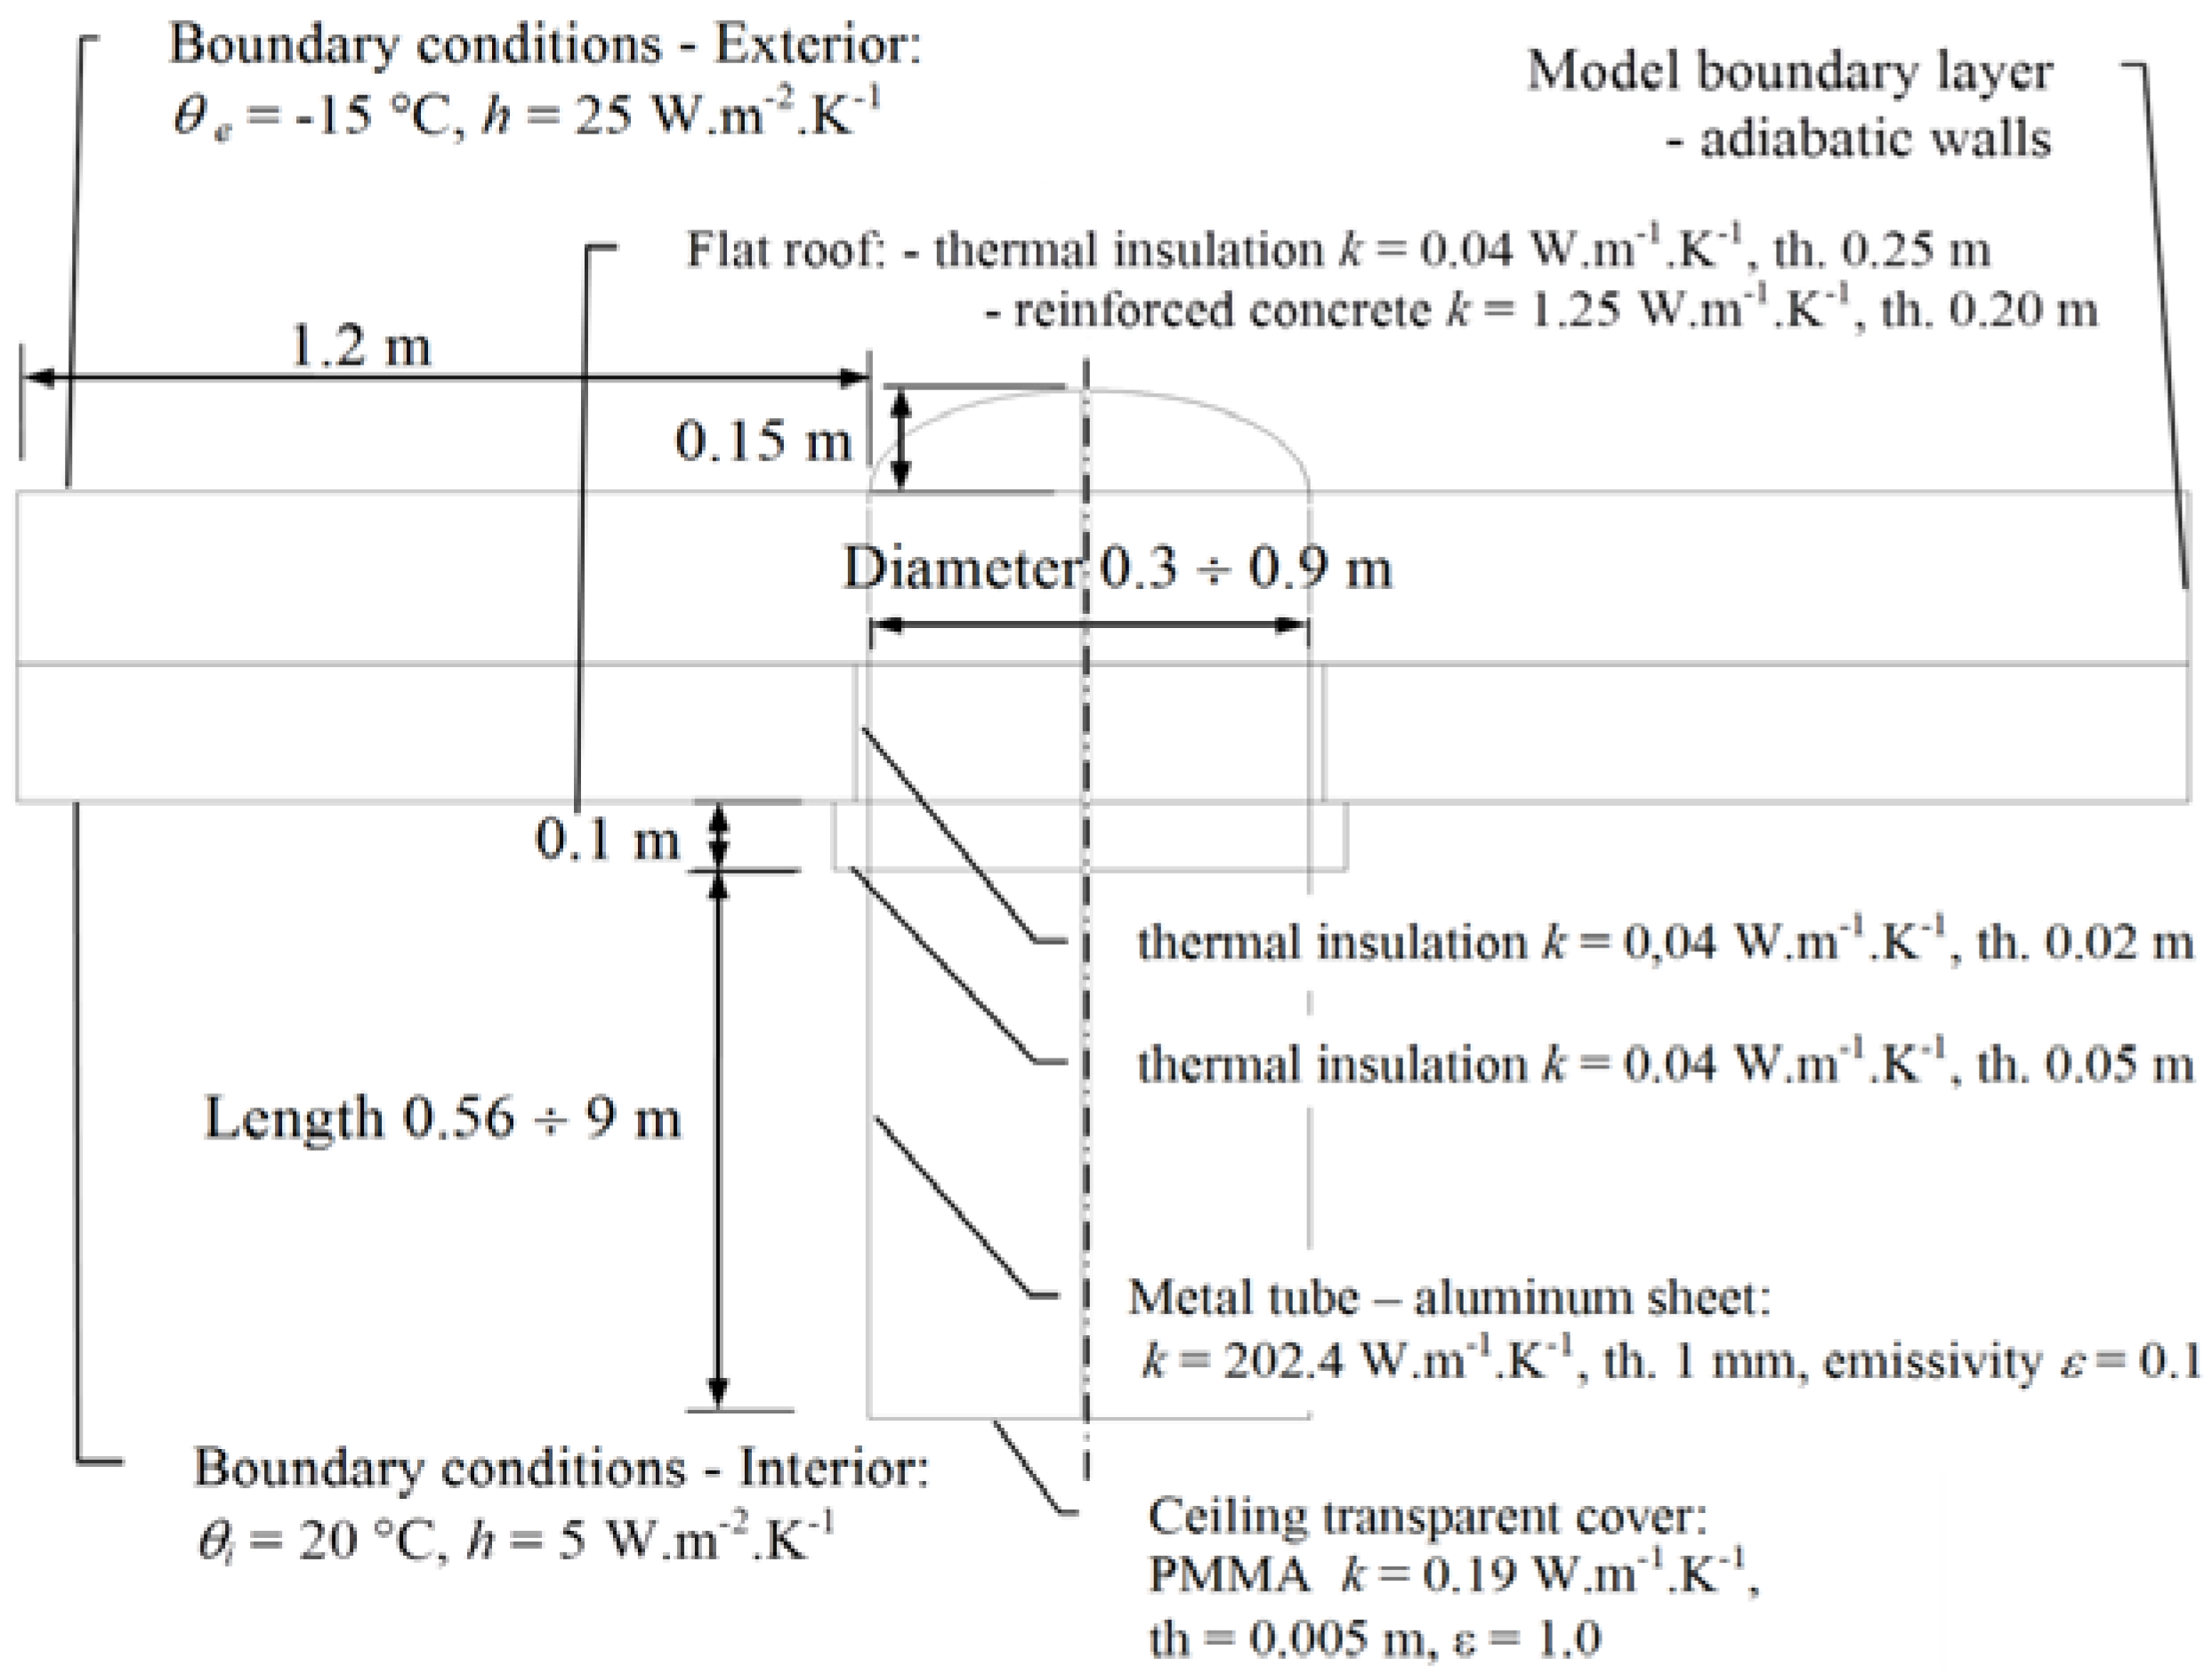
2. CFD Model

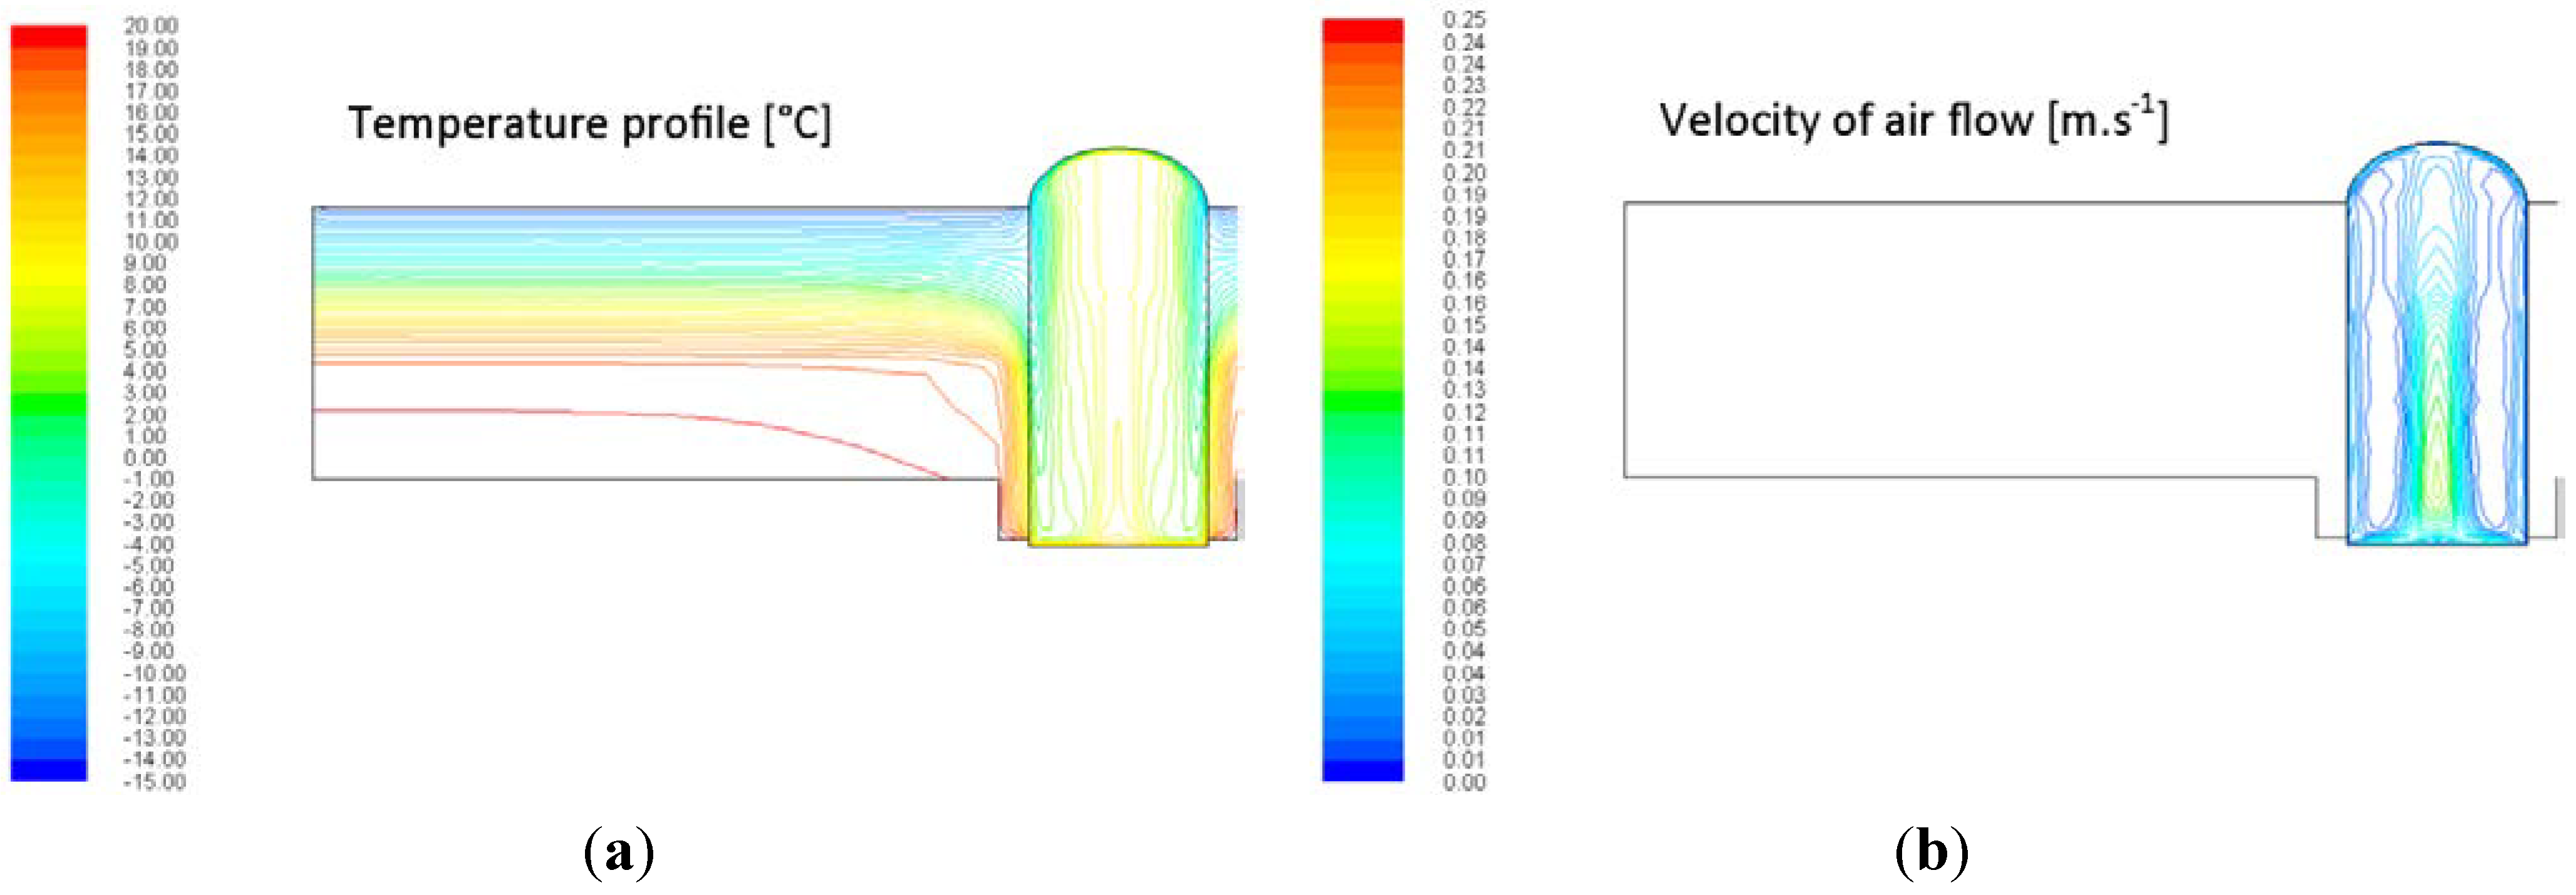
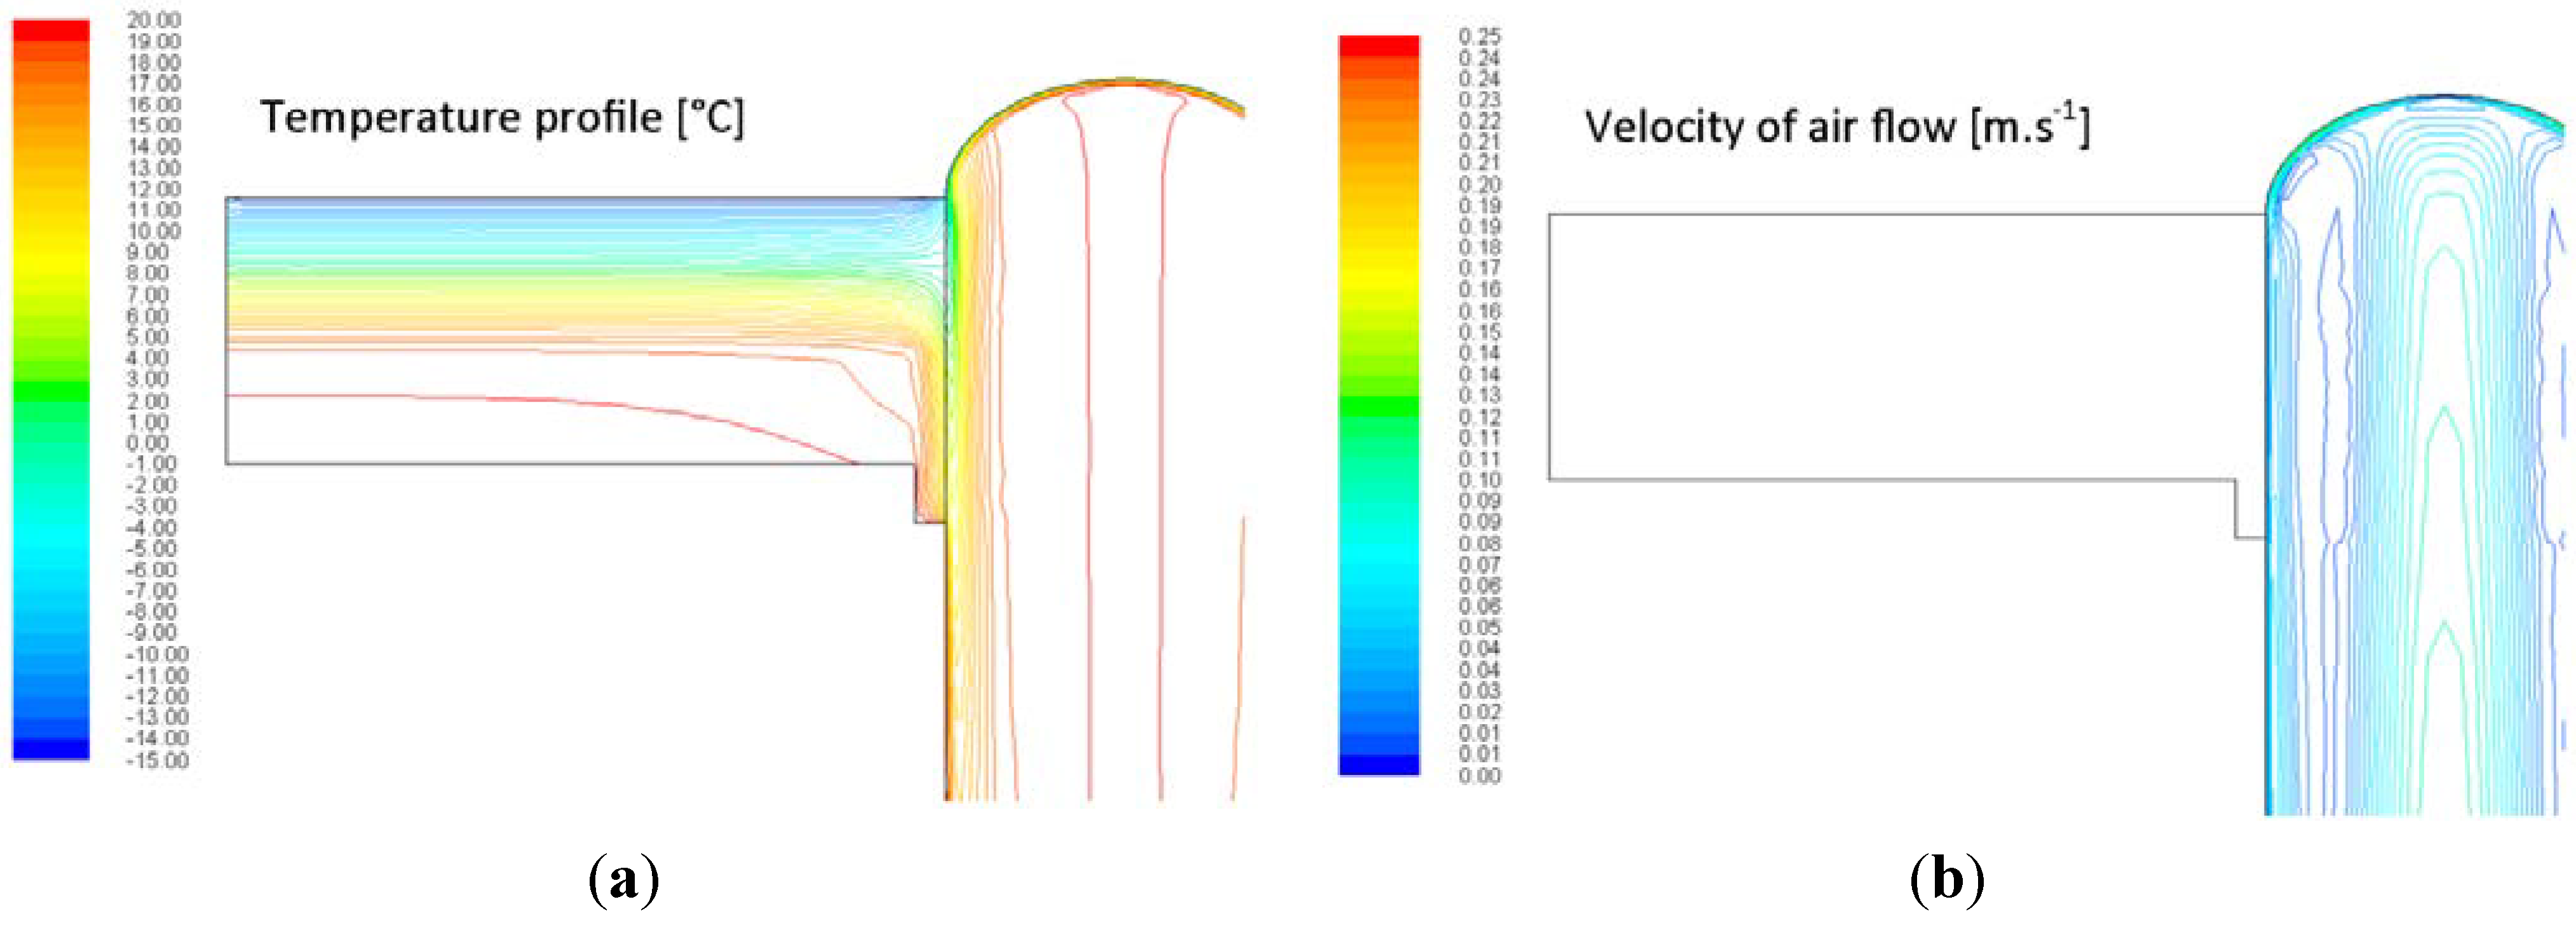
- Simulation of thermal profile and determination of heat loss through tubular light guides;
- Specification of potential condensation risks on internal surface of the light guide tube at the interface between the tube and the roof construction;
- Simulation of air flow within tubular light guides under specified boundary conditions.
- Outdoor temperature interval is set to −15 °C and +15 °C to correspond with the winter and spring/autumn seasons of the temperate climate of the Central Europe region;
- Indoor temperature +20 °C and relative humidity of indoor air 50%.
2.1. Physical Models
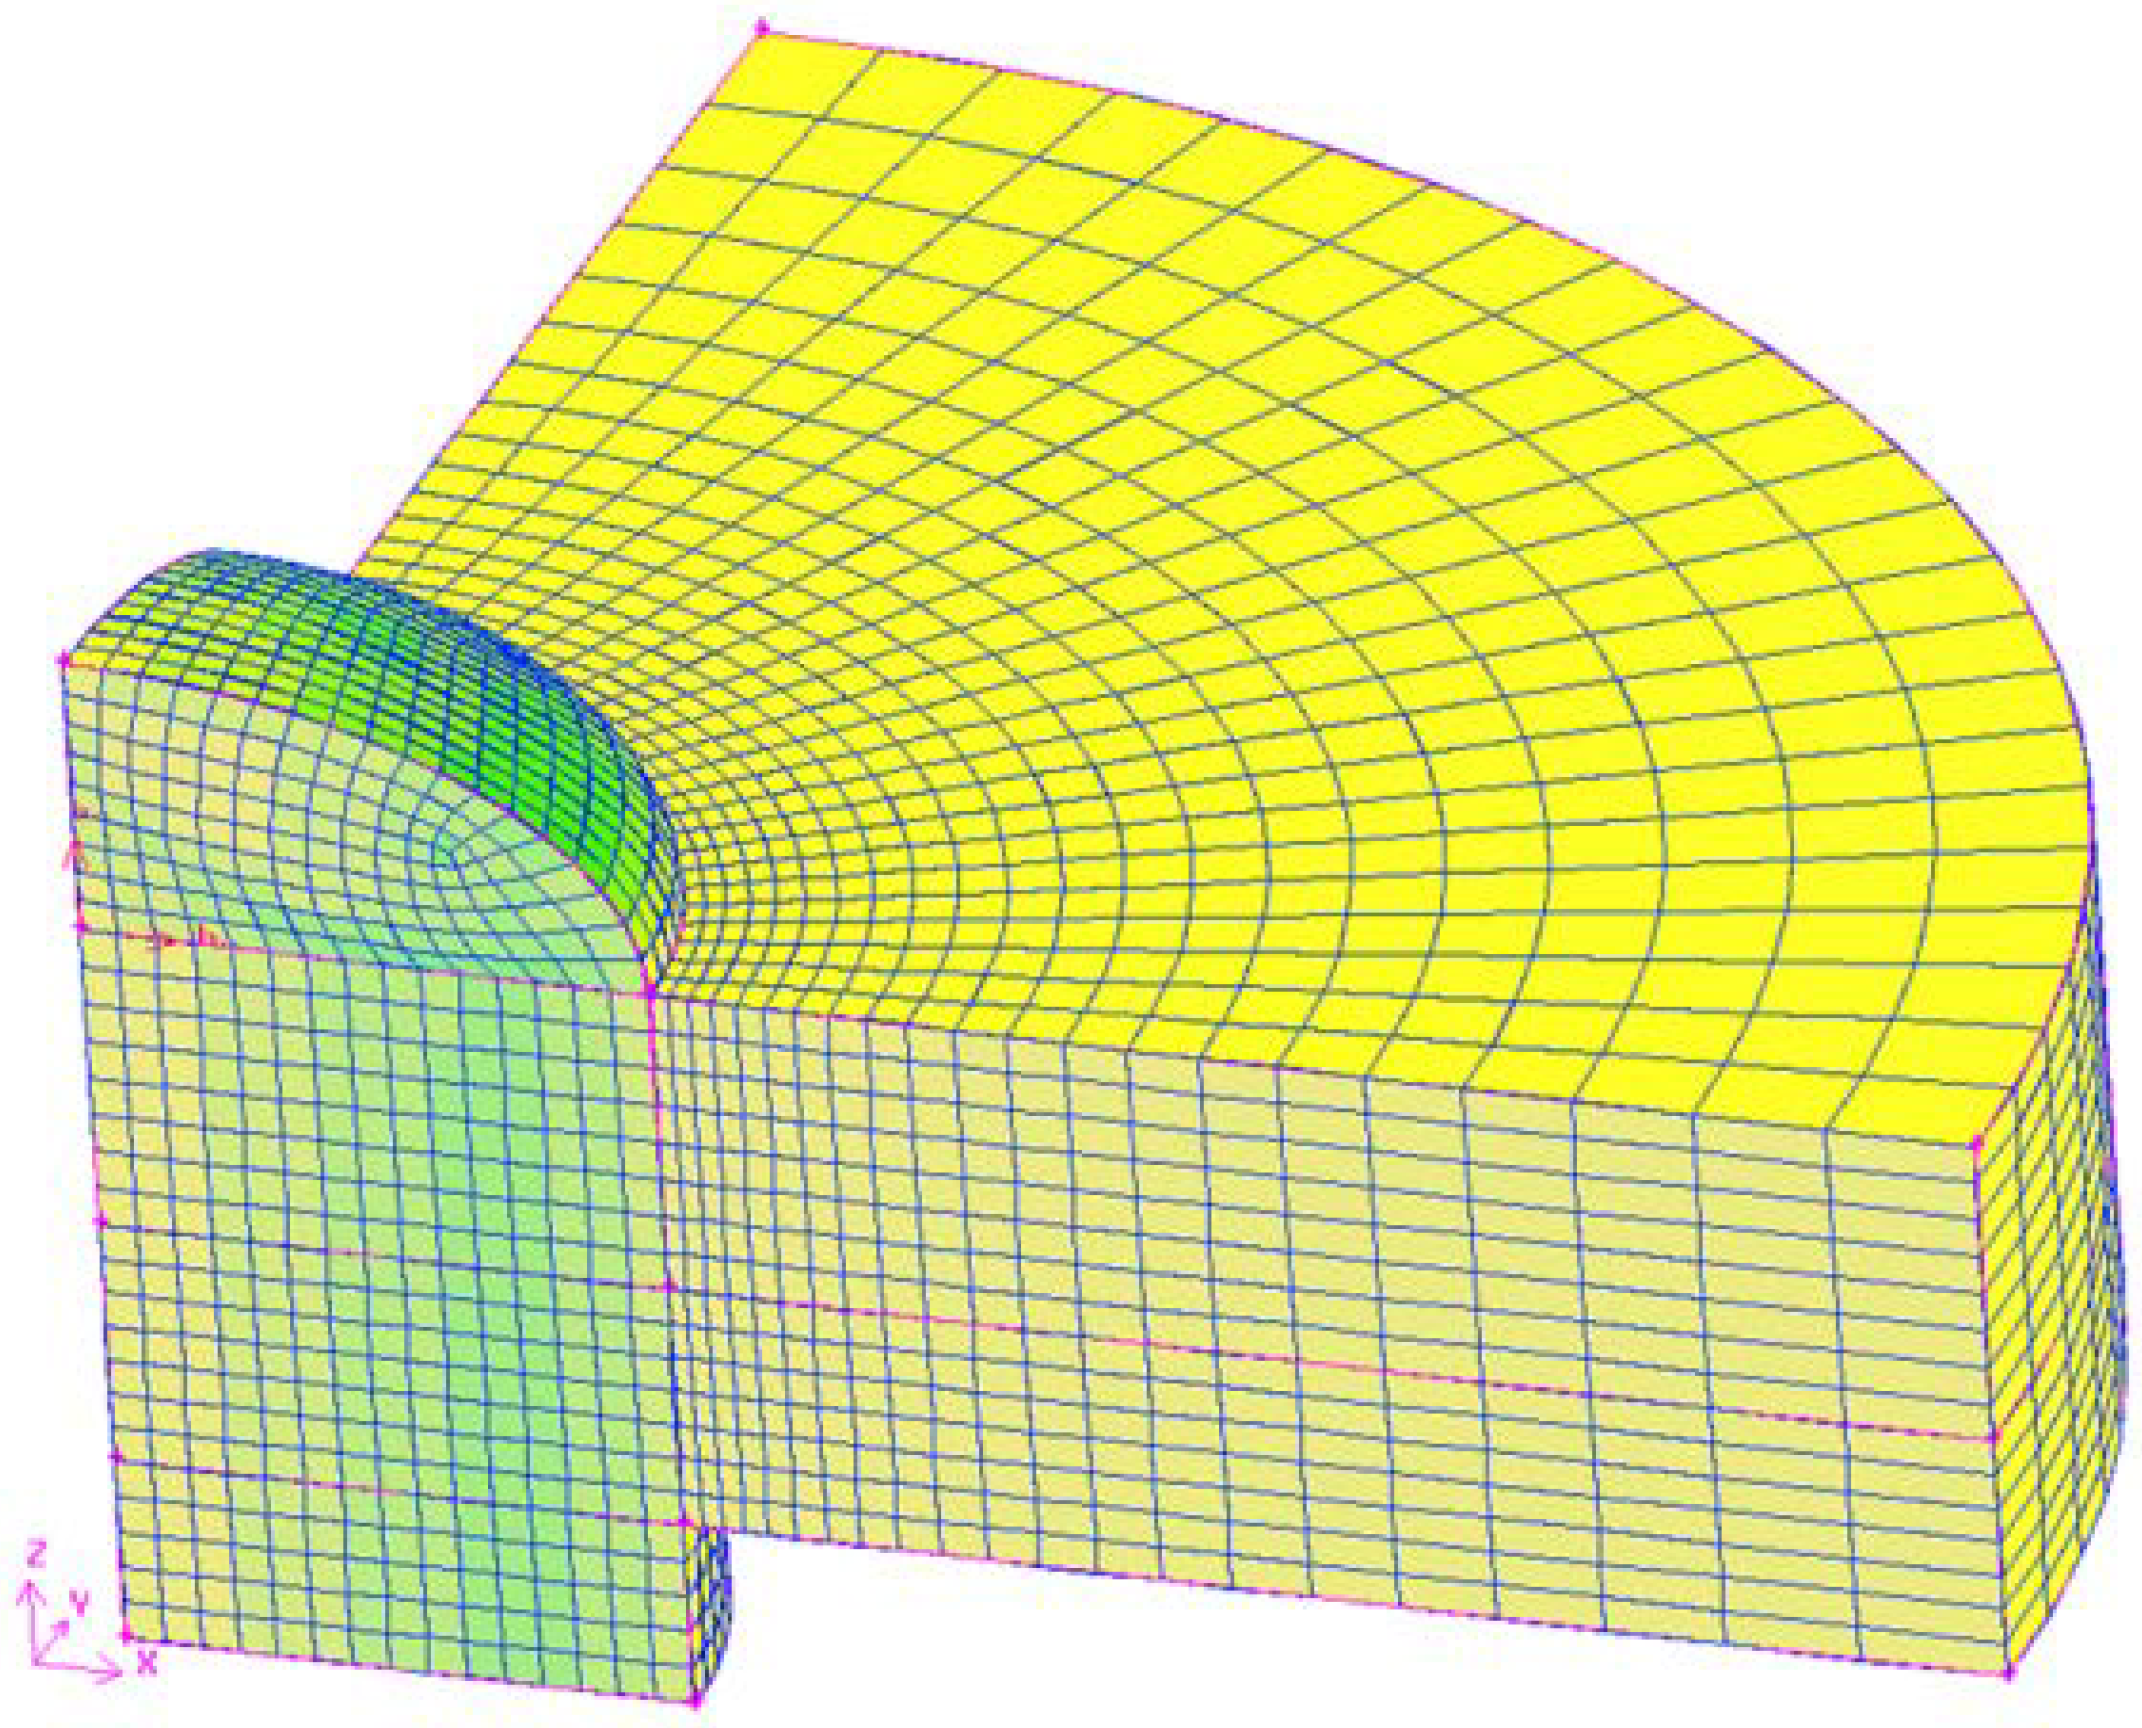
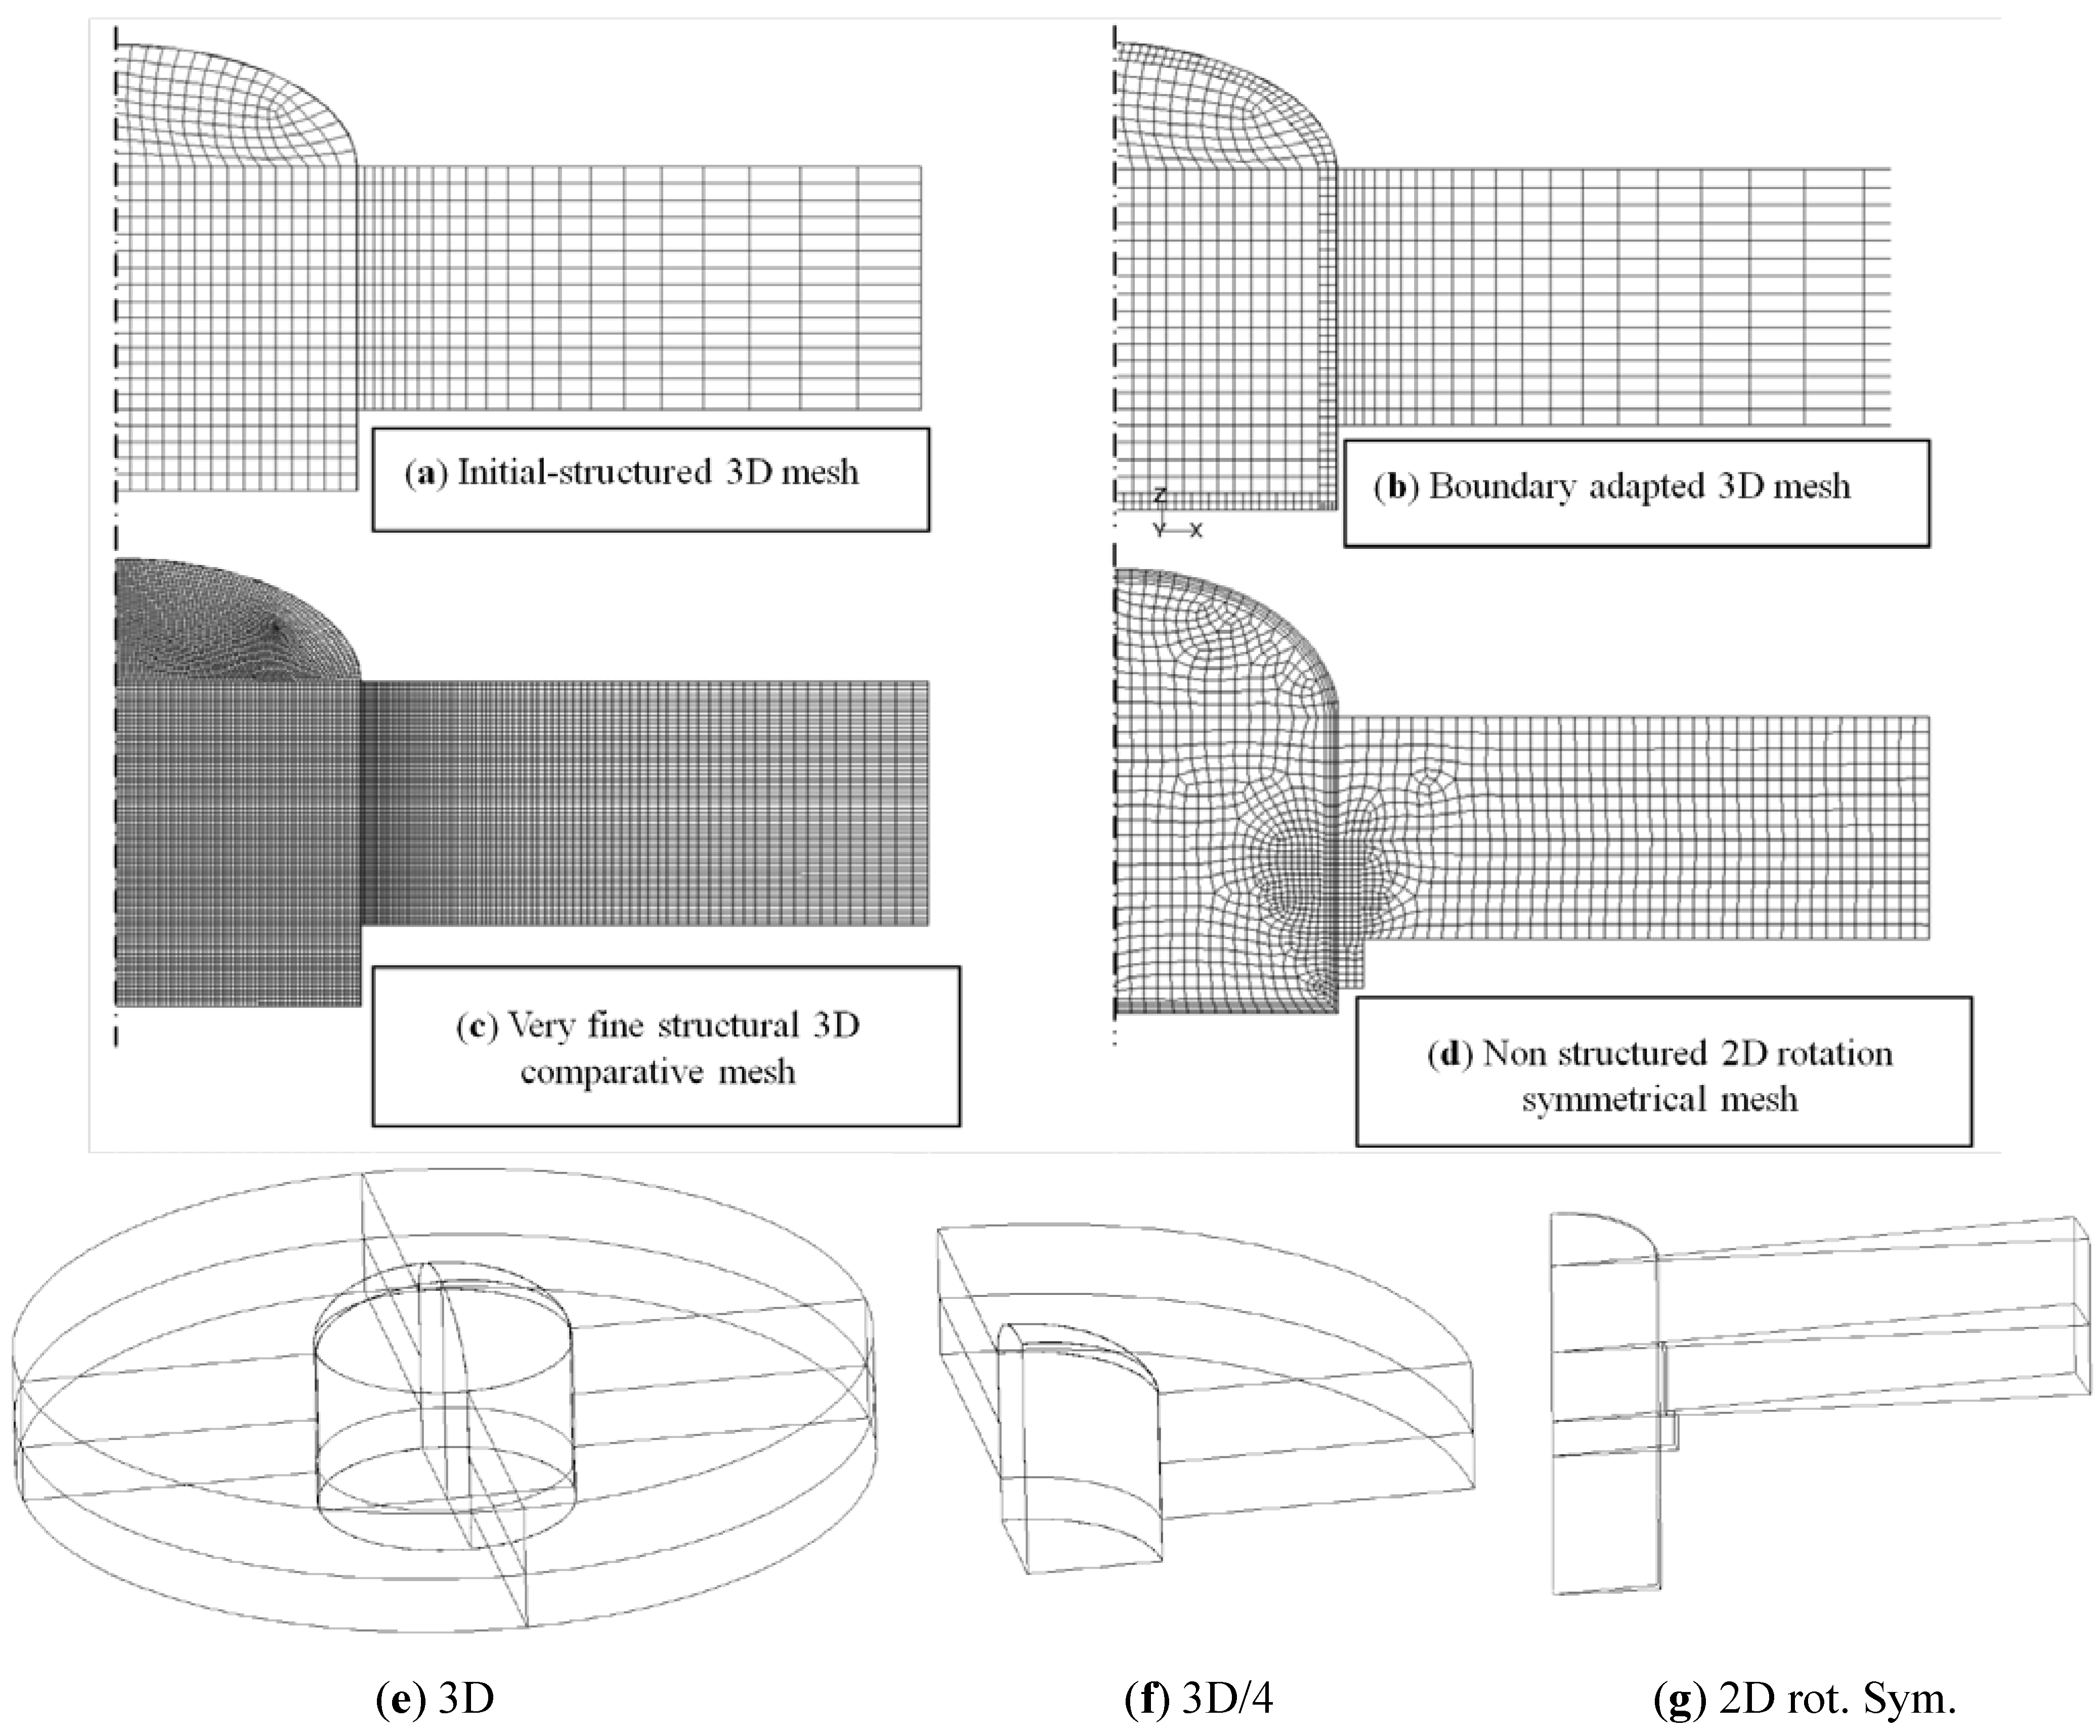
2.2. Geometric Models


- The mesh adaptation on the internal surfaces of the light guide serves for the fine discretisation of boundary layers. It is essential for the simulation model accuracy;
- Widening of the horizontal mesh distances in the detail of the roof construction connected with the light guide tube is useful for reduction of the simulation time;
- 3D model discretisation of very thin metal tube (thickness 1 mm) needs the discretisation of millimetre fractions in the tube and also in the part of the roof construction that is in contact with the tube. The very fine discretisation extends the simulation time;
- The simplified model was created on the “shell conduction” method. In this model the light guide tube is substituted with a virtual layer of cells for simulation of heat transfer along the model its surface;
- The 2D rotation symmetrical model with unstructured mesh gives results that are comparable to the 3D models. The simple model offers possibility of more calculation results and geometric variations at a given simulation time;
- Performed mesh variants serve to show that the mesh independence of the geometric model is achieved.
2.3. The Final 2D Simplified Model

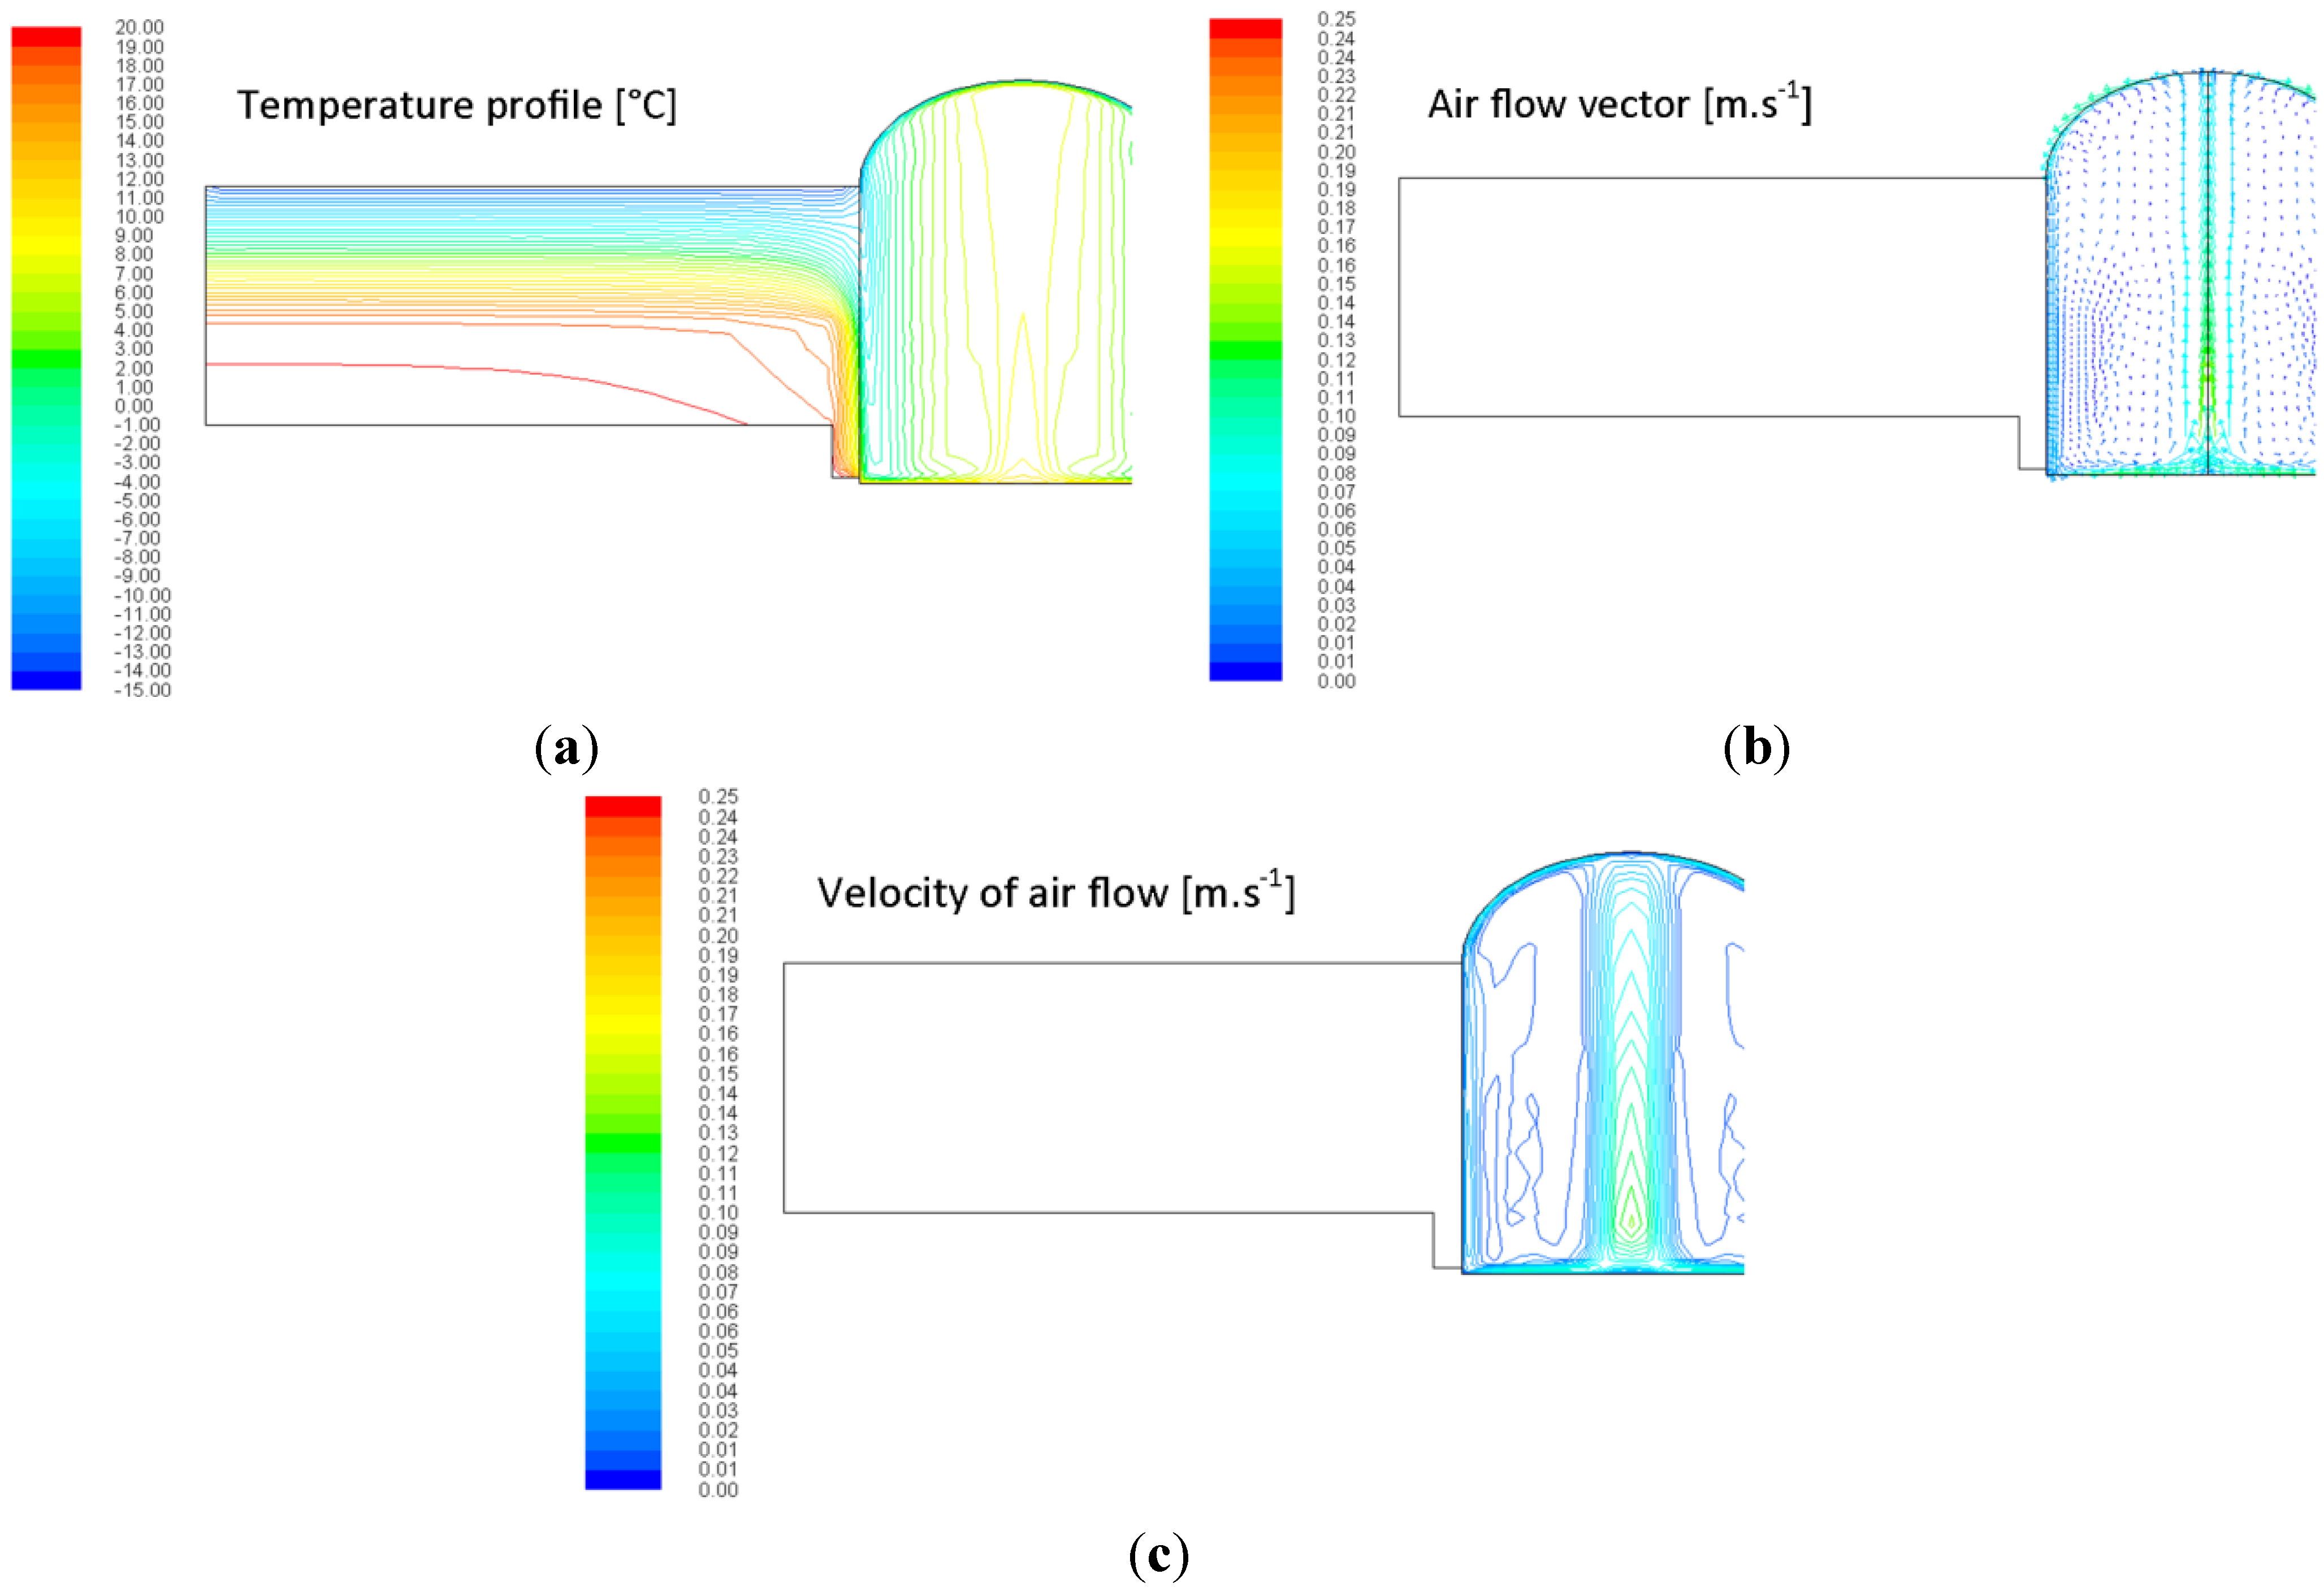
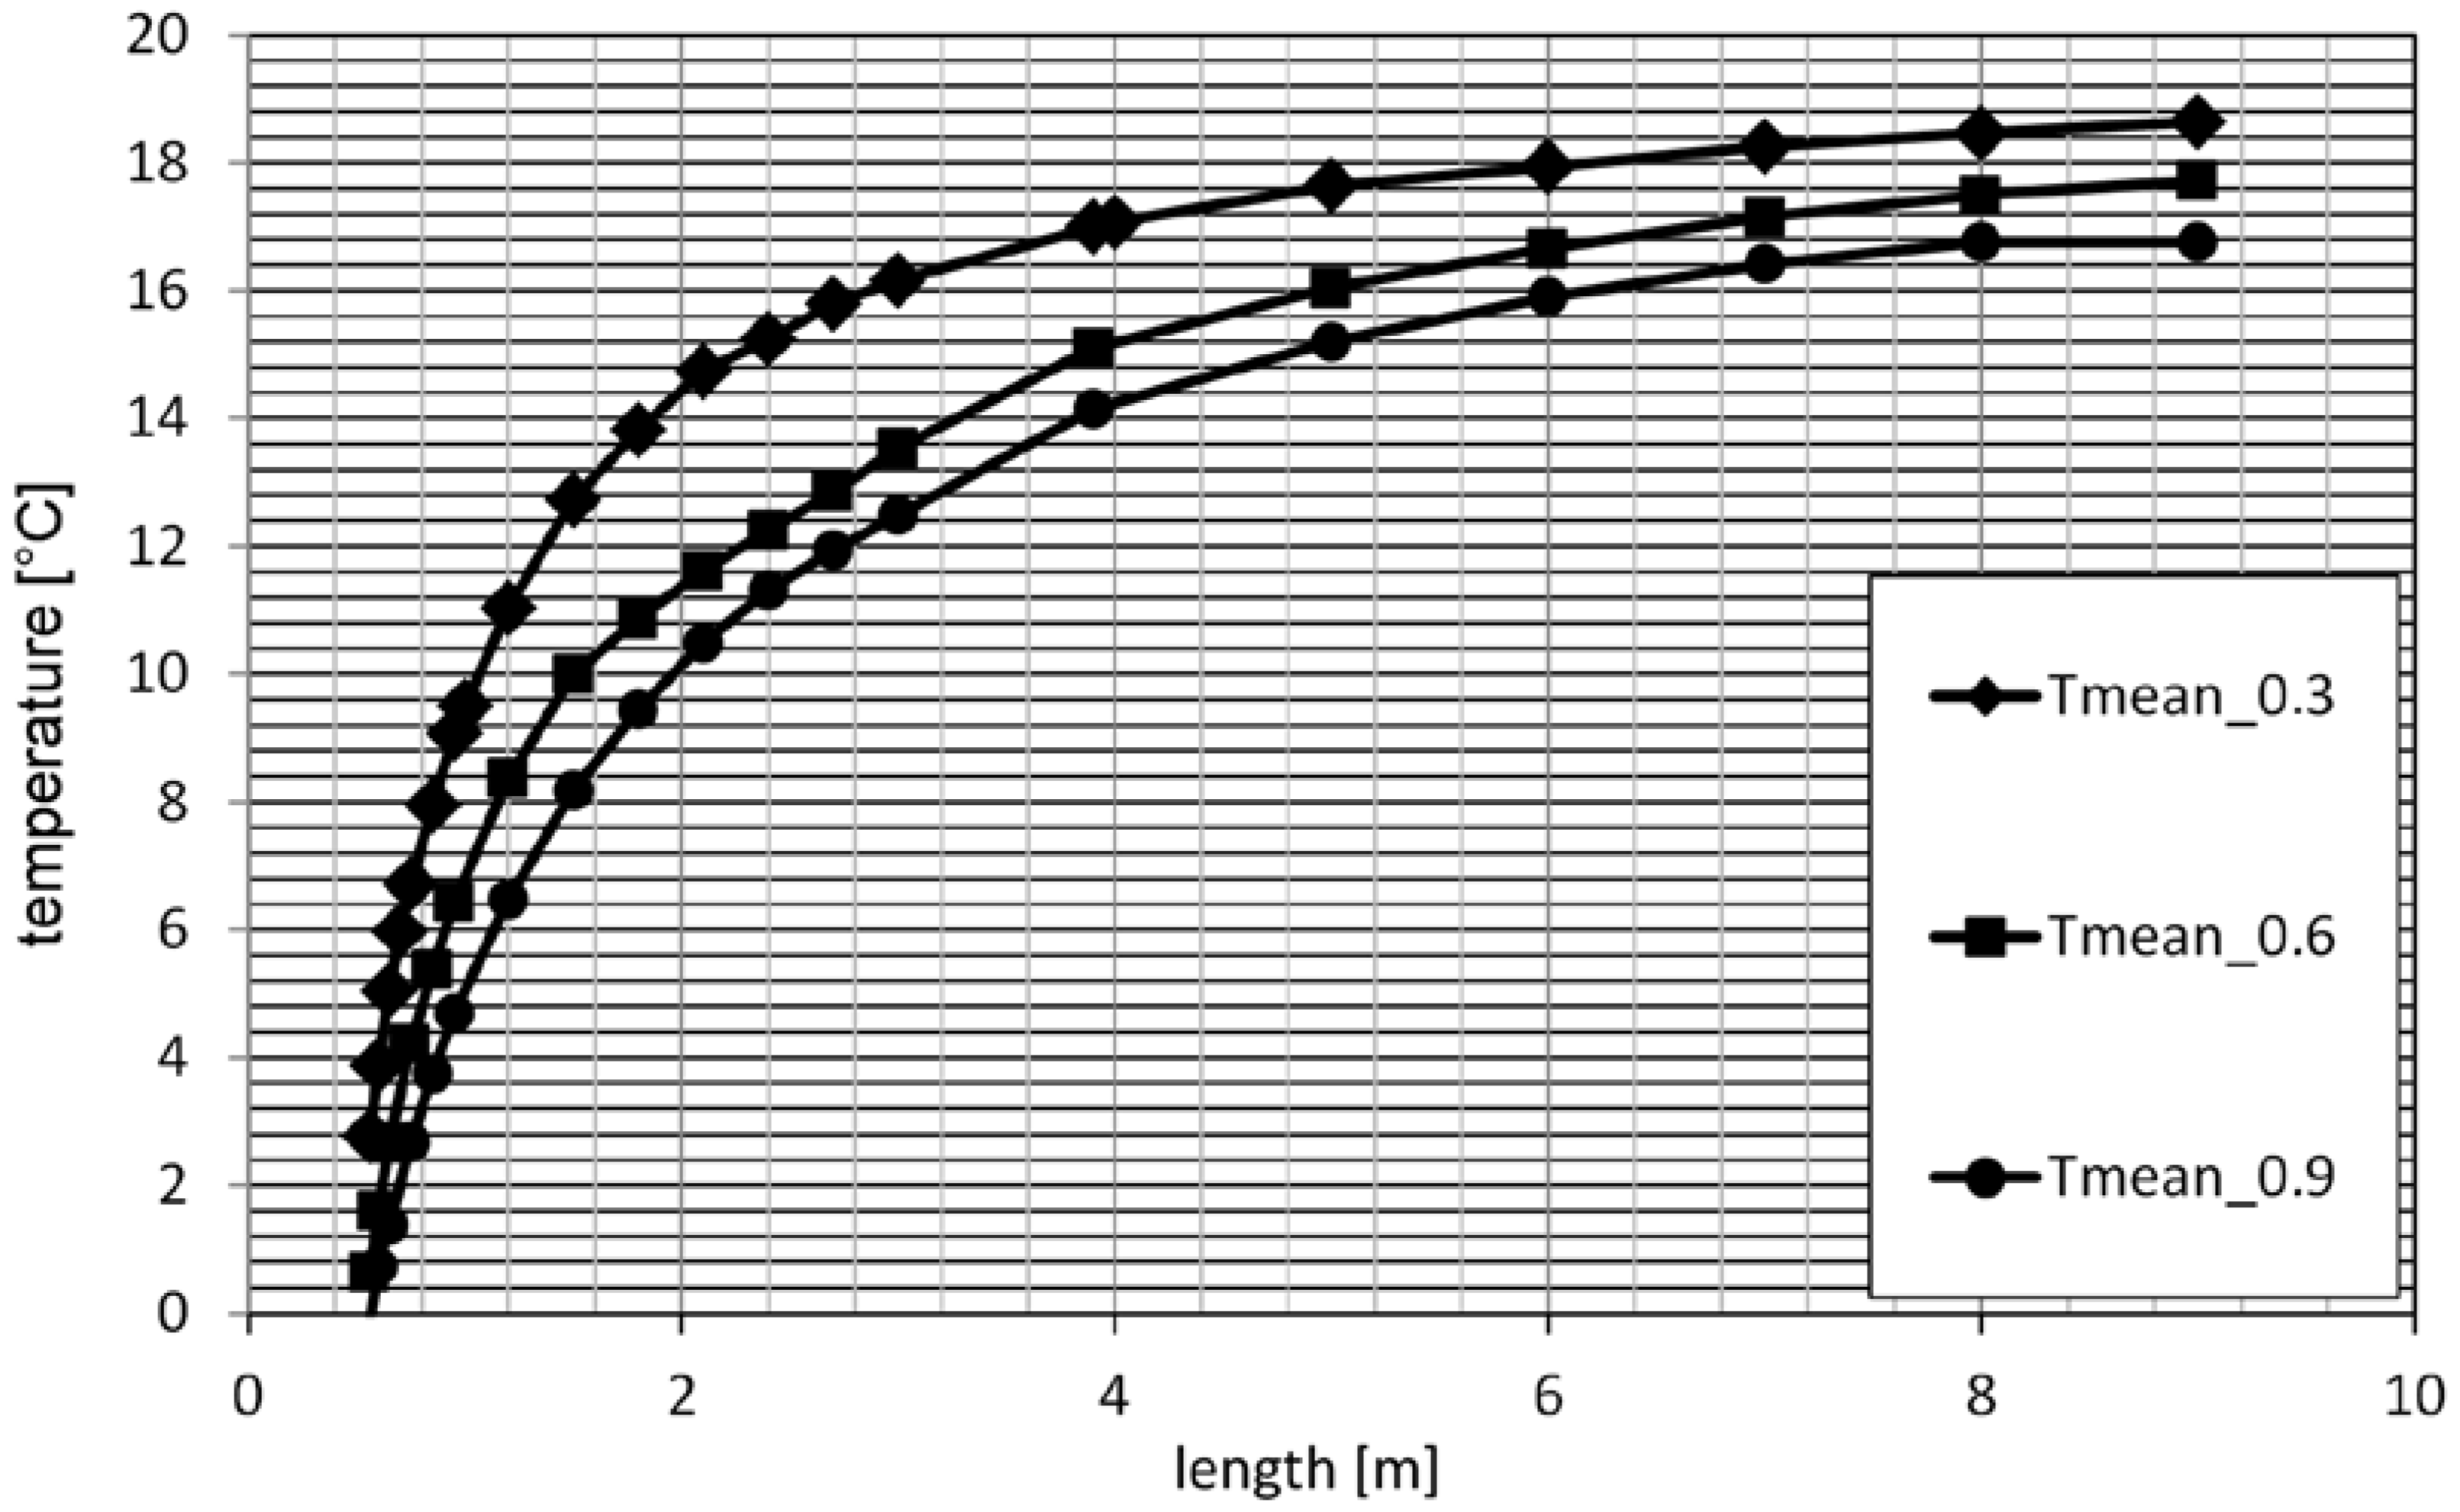
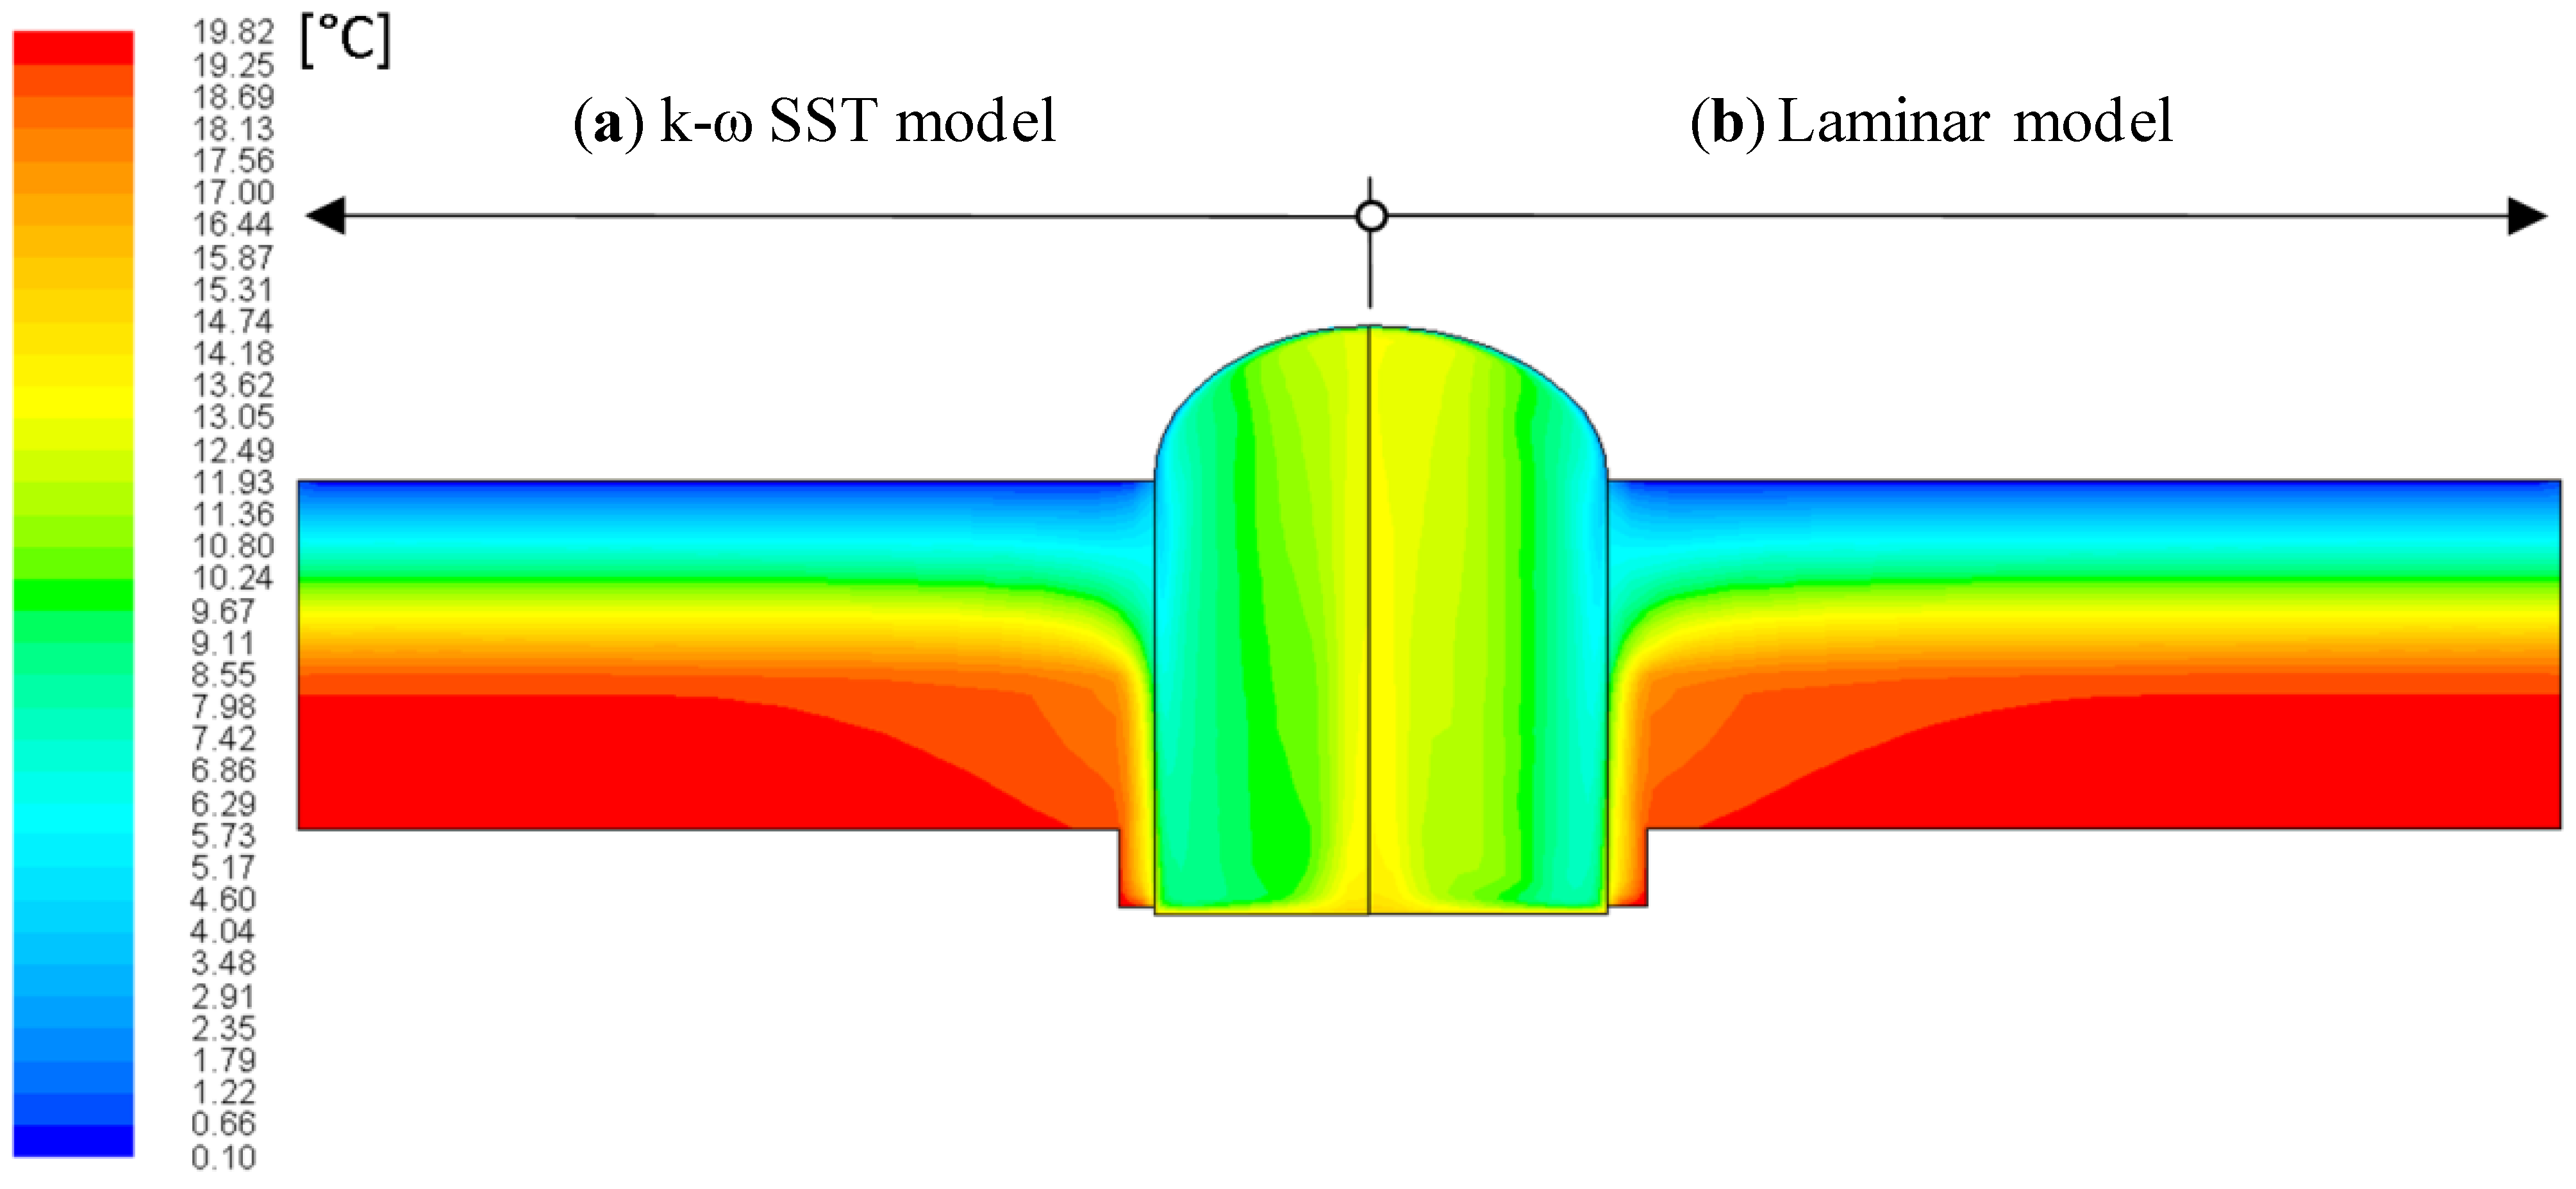
3. Results and Discussion

- Average temperature in the tubular light guide—difference about 7% (for temperatures in °C) and max difference 0.35% (compared temperatures in K);
- Minimal internal surface temperatures—difference max 6% (compared temperatures in °C) and max difference 0.30% (compared temperatures in K);
- Total heat flux and heat loss—difference to 7%;
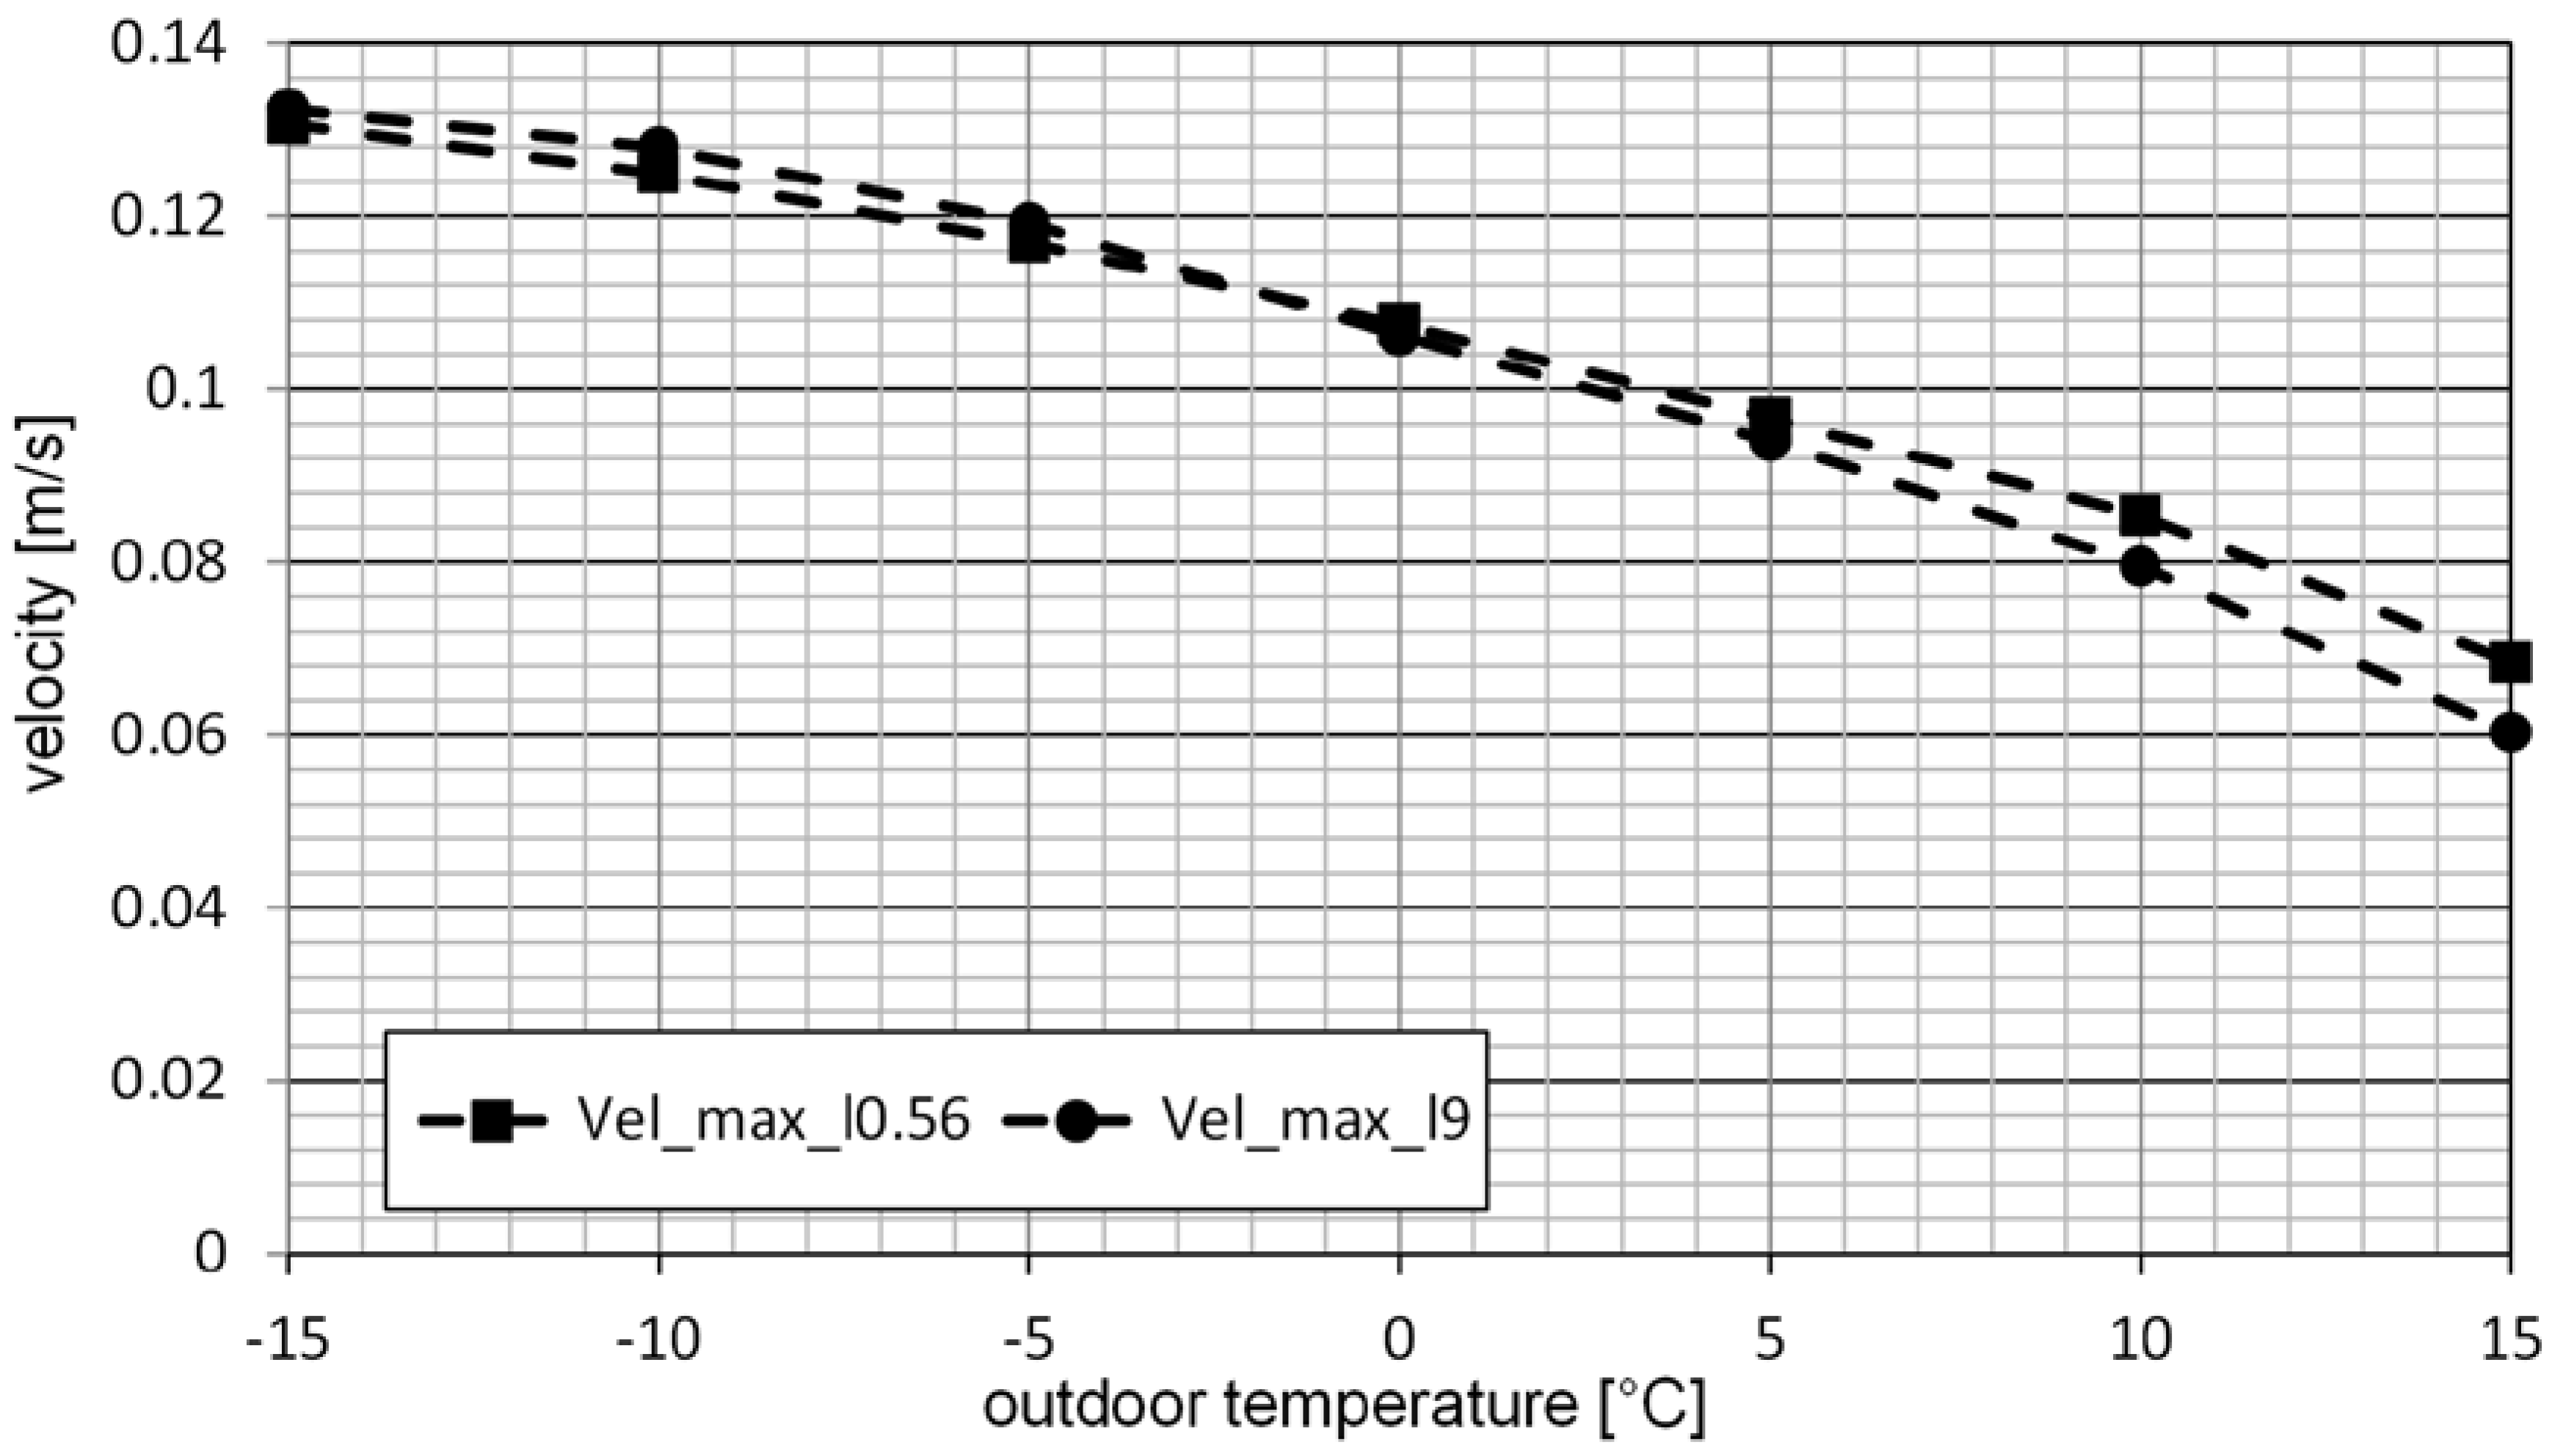
- Maximal accessible velocity of air flow in the whole domain—to 50% (max. velocity is lower than 0.15 m·s−1);


- L3D is thermal coupling coefficient (W·K−1).
- Uj is thermal transmittance of the j element in the studied detail (W·m−2·K−1).
- Aj is area of the j element in the studied detail (m2).
- Ψ is linear thermal transmittance (W·m−1·K−1).
- b is length of the linear thermal bridge (m).


Example of the Real Evaluation of Tubular Light Guides

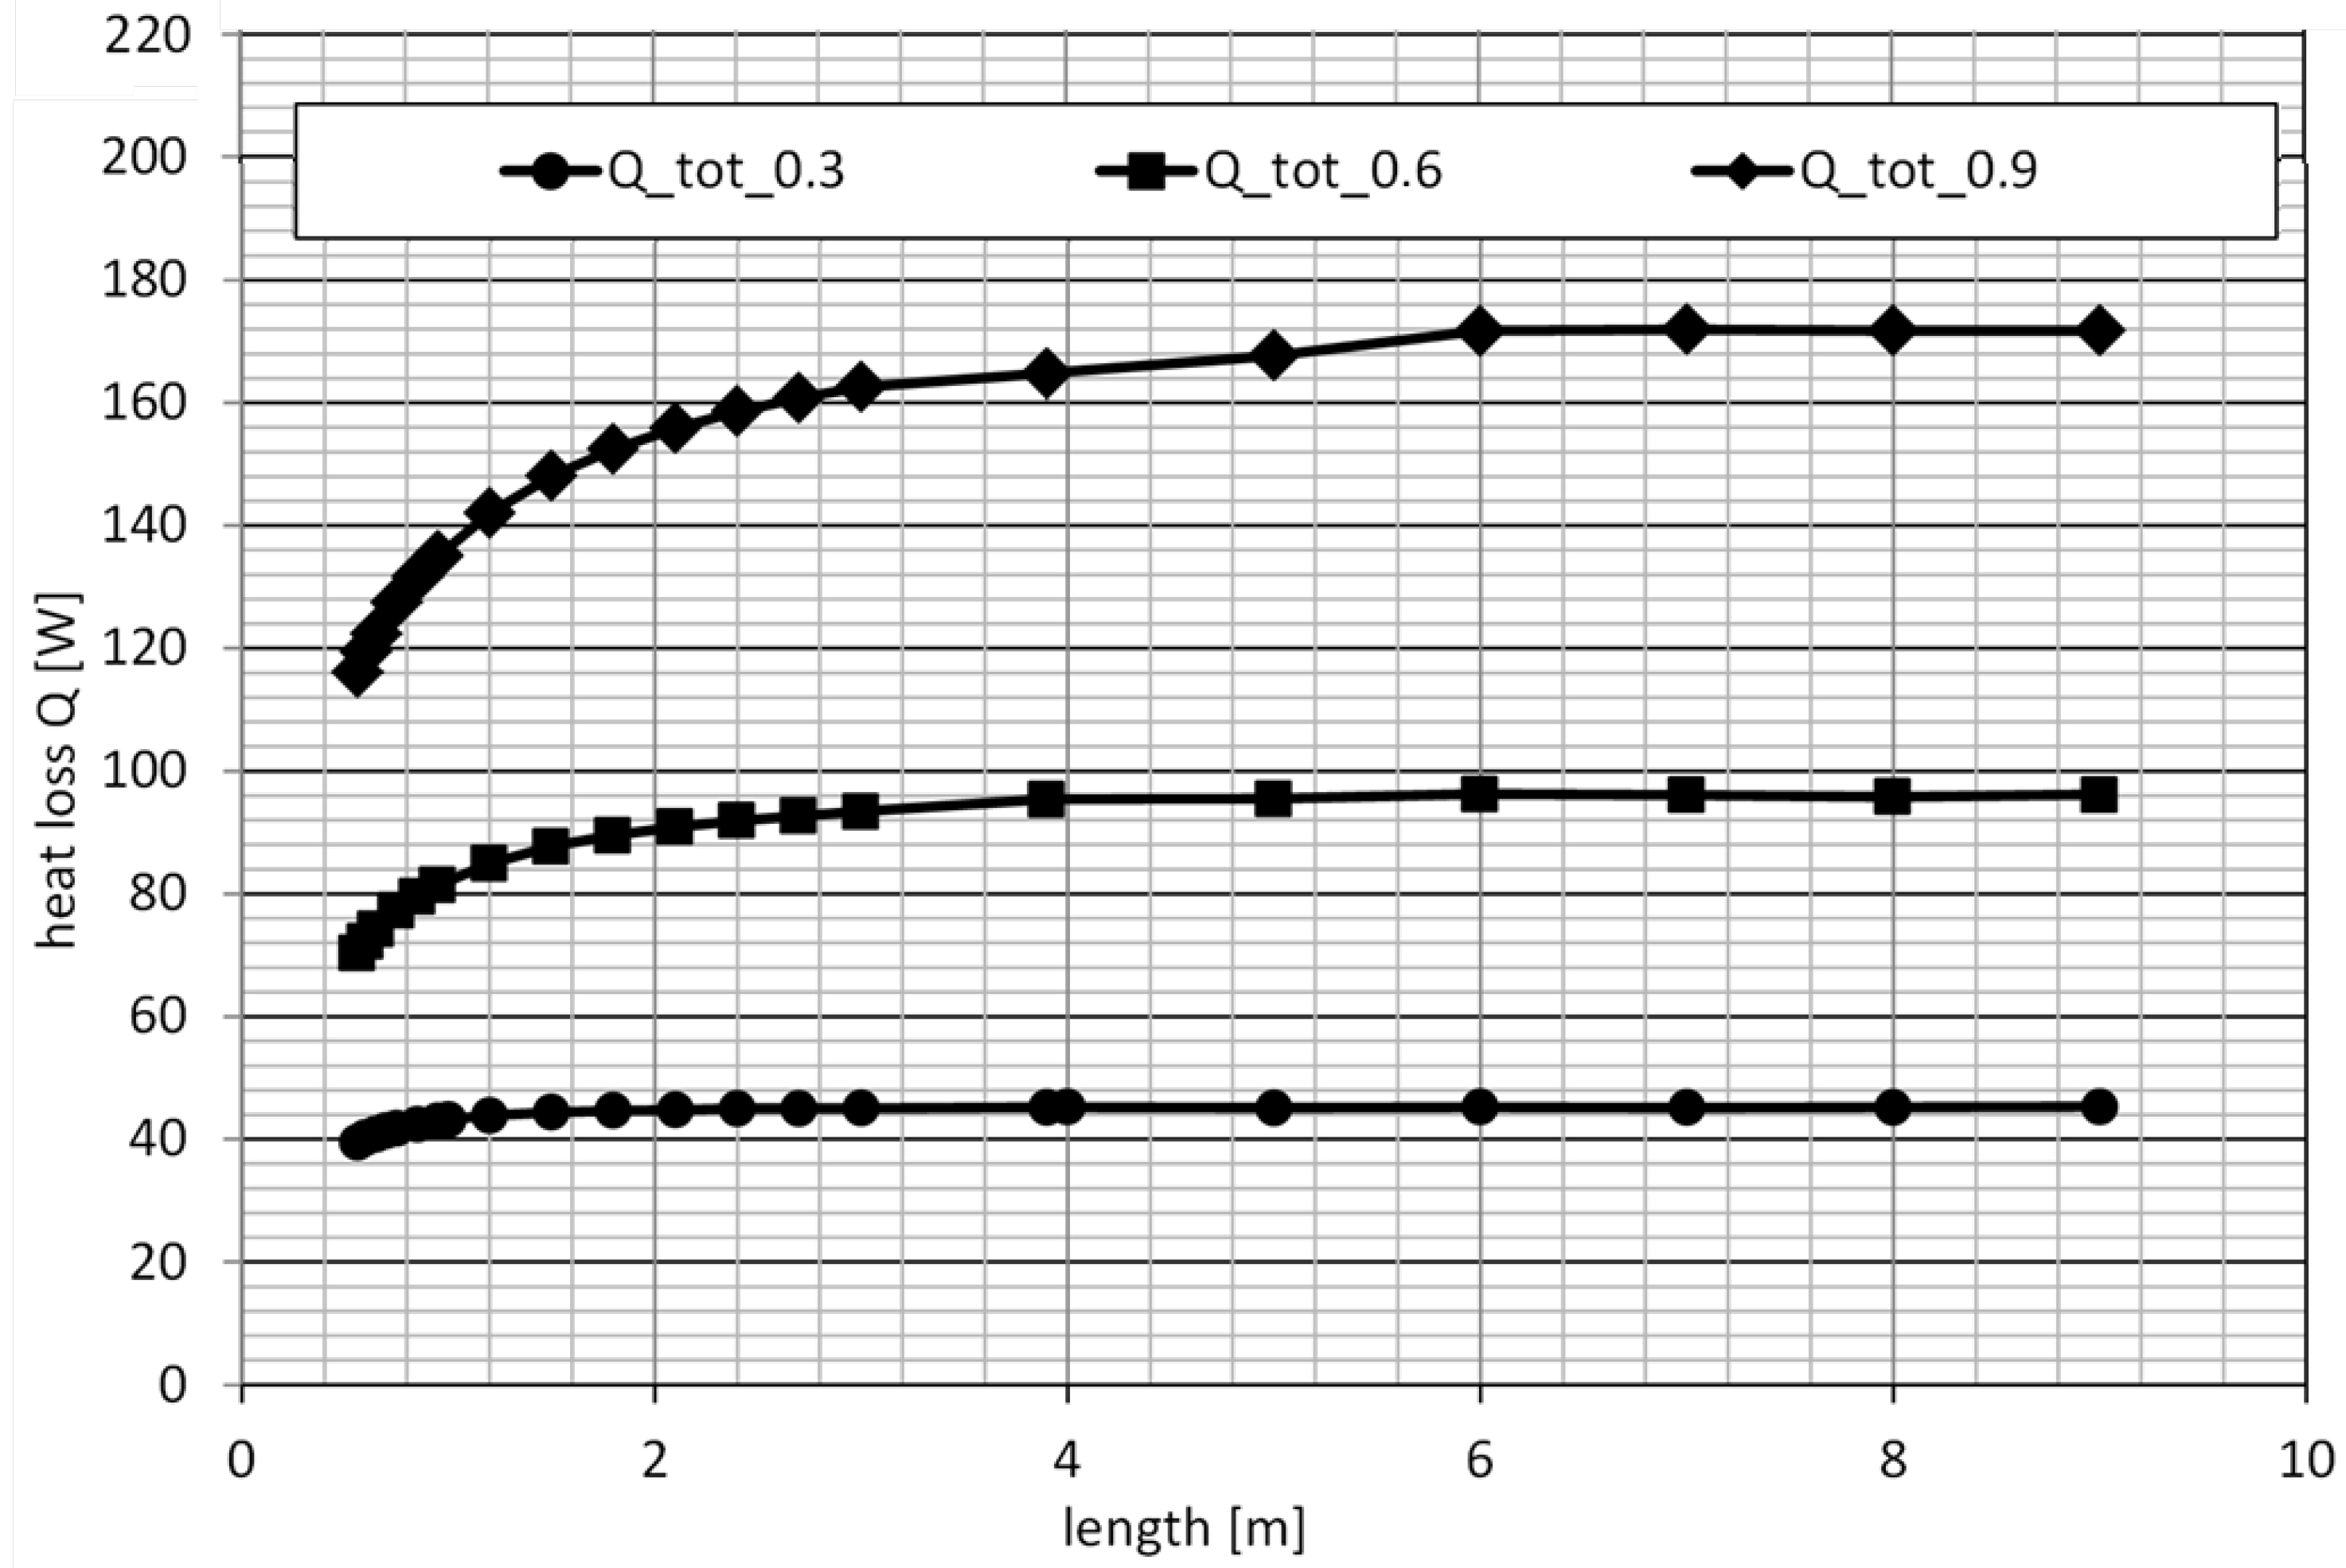
| Length | Tubular light guide diameter | ||||||||
|---|---|---|---|---|---|---|---|---|---|
| d = 0.30 m | d = 0.60 m | d = 0.90 m | |||||||
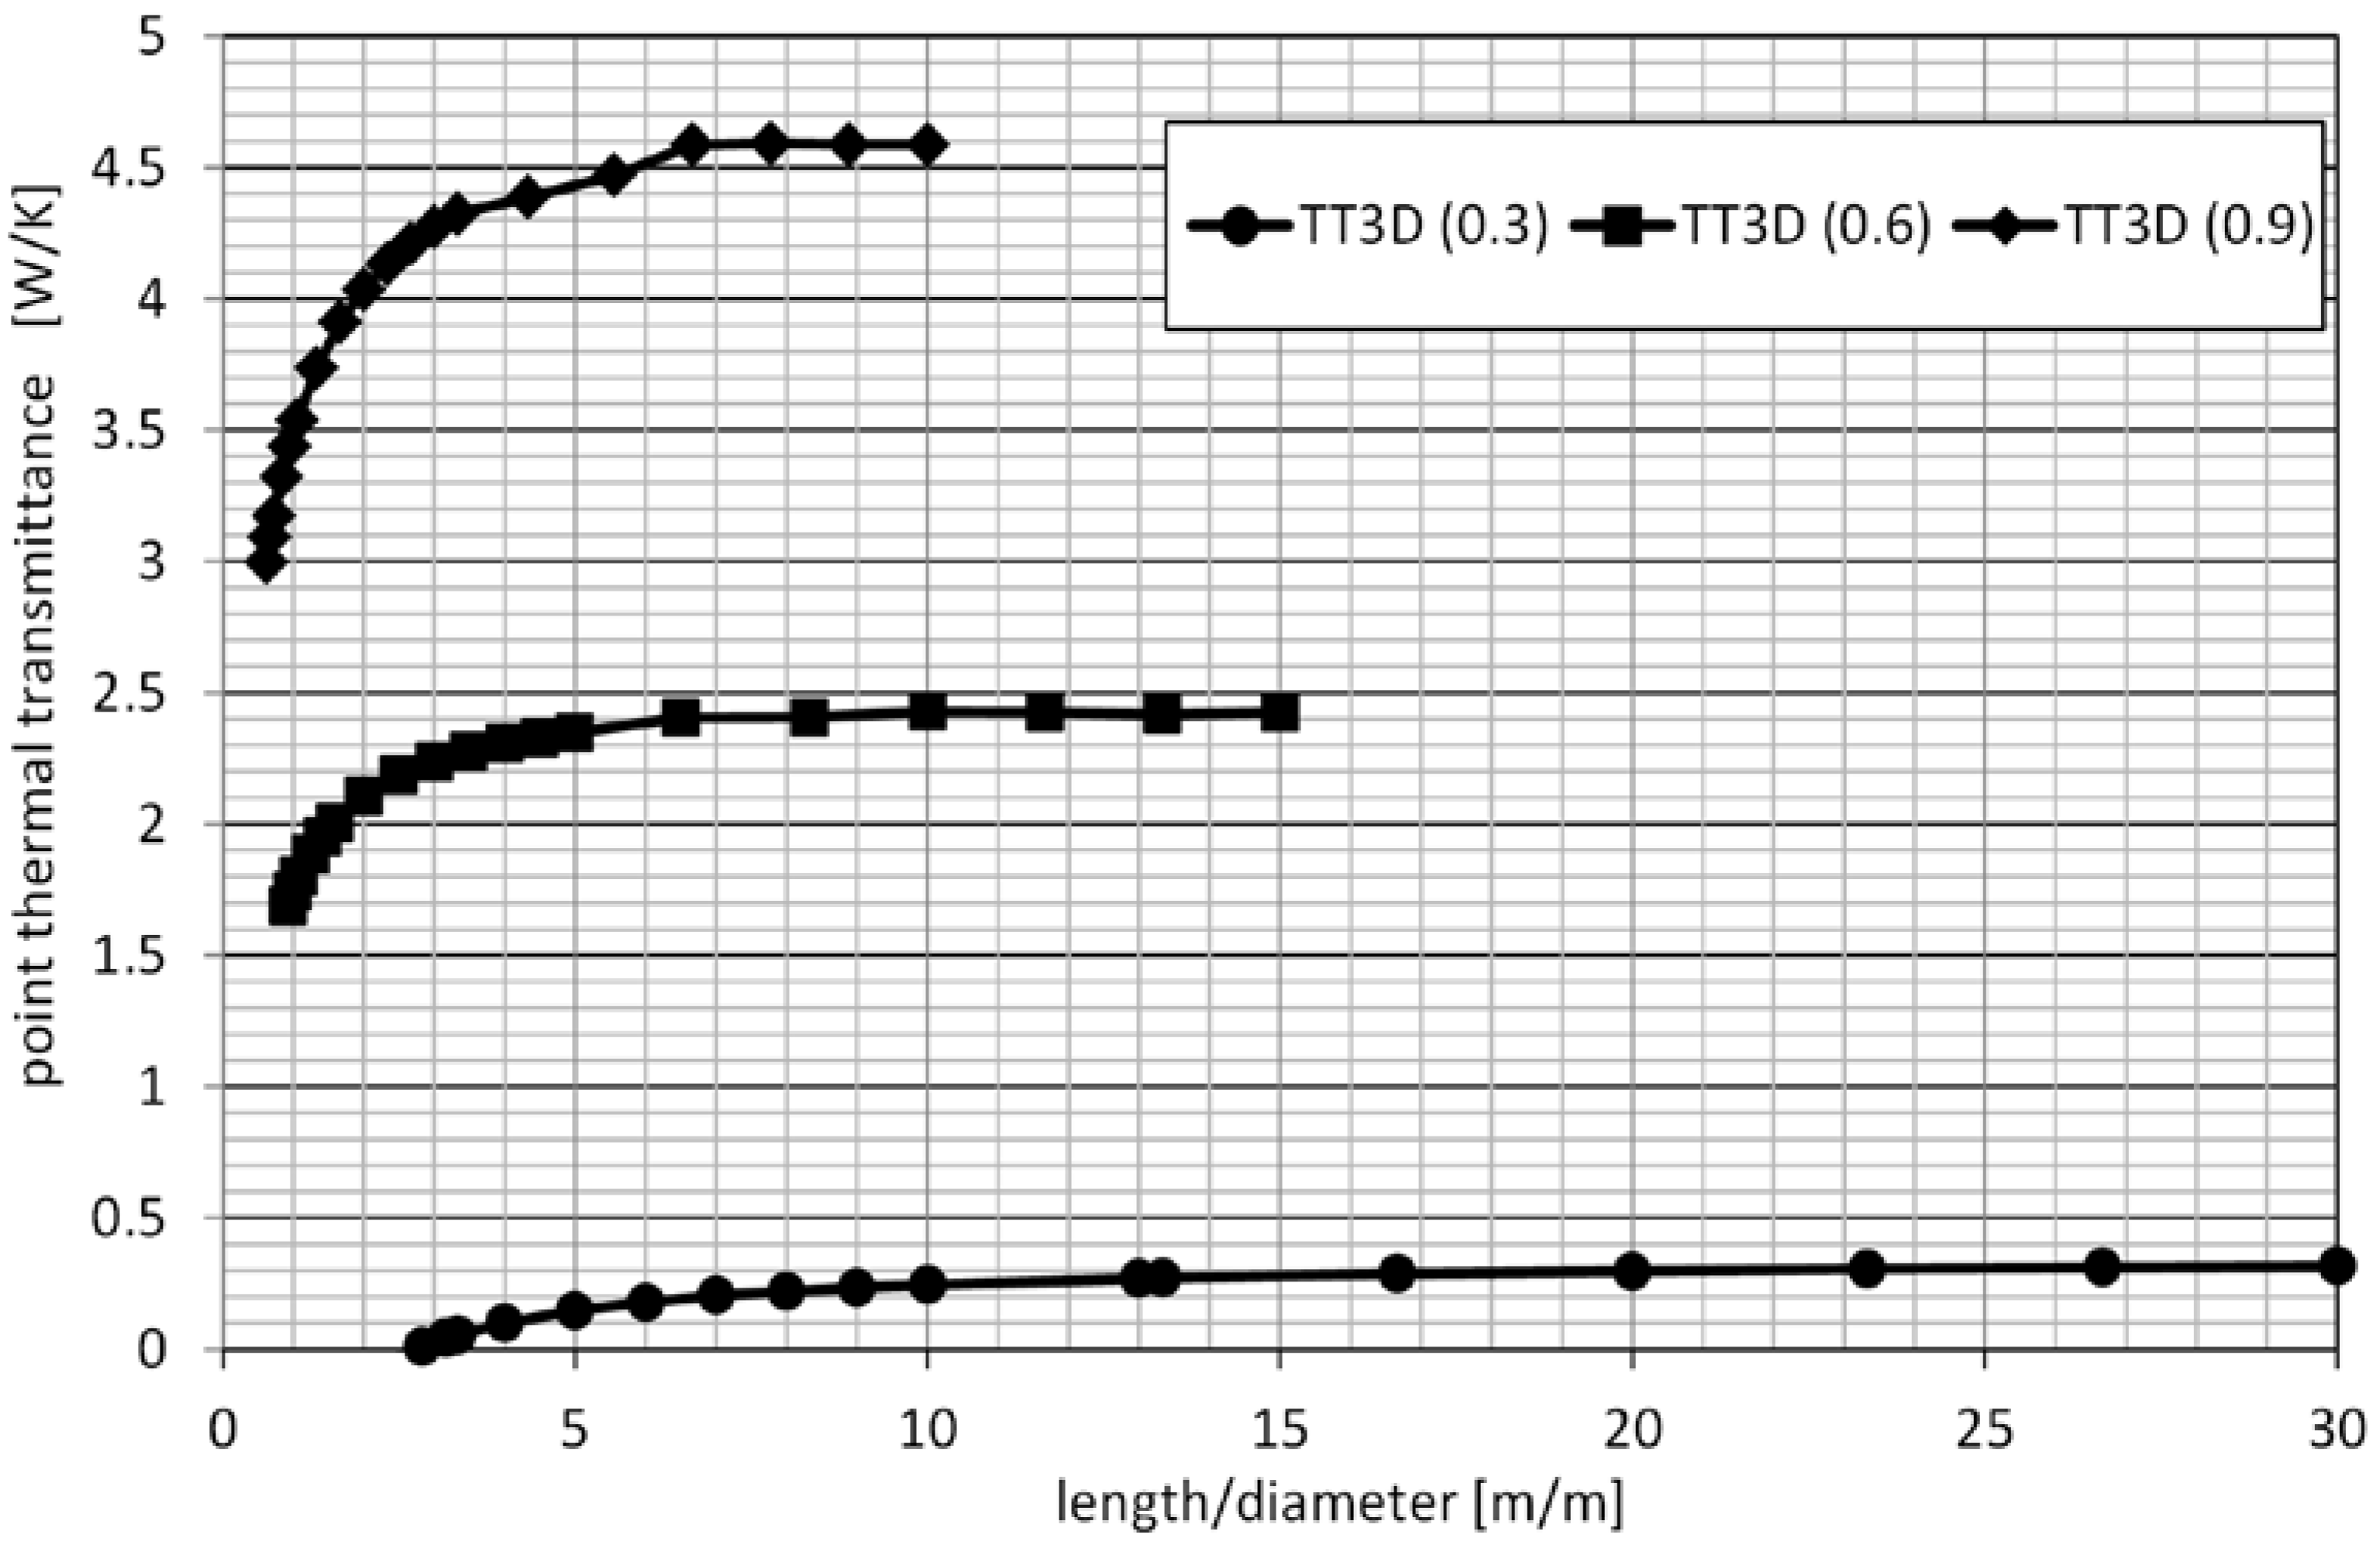
| L (m) | TTE (-) | TT3D (W/K) | Q (W) | TTE (-) | TT3D (W/K) | Q (W) | TTE (-) | TT3D (W/K) | Q (W) |
| 0.56 | 0.9648 | −0.1391 | 39.5 | 0.9822 | 1.6885 | 70.3 | 0.9881 | 2.9965 | 116.1 |
| 1.00 | 0.9381 | 0.0544 | 43.2 | 0.9685 | 2.0055 | 81.4 | 0.9788 | 3.5365 | 135.0 |
| 9.00 | 0.5775 | 0.3172 | 45.3 | 0.7549 | 2.4250 | 96.1 | 0.8277 | 4.5864 | 171.8 |
- Variation I: 1 × TLG, d = 0.60 m, length 1.0 m: Total heat loss by TLG = 70 W—the tubular light guide increases the heat transmission loss by 74%.
- Variation II: 2 × TLG, d = 0.30 m, length 1.0 m: Total heat loss by TLG = 3.8 W—the tubular light guide increases heat transmission loss by 4%.
4. Conclusions
Acknowledgments
Conflicts of Interest
Nomenclature
| d | diameter (m) |
| l | length (m) |
| L3D | thermal coupling coefficient (W·K−1) |
| A | area (m2) |
| b | length of the linear thermal bridge(m) |
| Ψ | linear thermal transmittance (W·m−1·K−1) |
| Q | heat loss (W) |
| k | thermal conductivity (W·m−1·K−1) |
| ε | emissivity (-) |
| h | heat loss coefficient (W·m−2·K−1) |
| T | local temperature (K) |
| U | thermal transmittance (W·m−2·K−1) |
| TT3D | point thermal transmittance (W·K−1) |
| TTE | Tube transmission efficiency |
| t | an exponent in TTE (-) |
| ρr | specular reflectance (-) |
| Z | portion of the zenithal sky (°) |
References
- Whitehead, L. Overview of Hollow Light Guide Technology and Applications. In Proceedings of the International Daylighting Conference, Ottawa, ON, Canada, 11 May 1998; pp. 197–204.
- Swift, P.D.; Smith, G.B. Cylindrical mirror light pipes. Solar Energy Mater. Solar Cells 1995, 36, 159–168. [Google Scholar] [CrossRef]
- Shao, L.; Riffat, S.B. Daylighting using light pipes and its integration with solar heating and natural ventilation. Light. Res. Technol. 2000, 32, 133–139. [Google Scholar] [CrossRef]
- Tillenkamp, F. Integrated Light Pipe/Passive Stack Ventilation/Solar Heating Cooling Unit on Pilot-Plant Scale (TRIPLESAVE Unit) and Related Know How. In Community Research and Development Information Service; CORDIS: Winterthur, Suisse, 2003; Available online: http://cordis.europa.eu/result/report/rcn/26896_de.html (accessed on 22 August 2013).
- Zastrow, A.; Wittwer, V. Daylighting with Fluorescent Concentrators and Highly Reflective Silver-Coated Plastic Films: A New Application for New Materials. In Optical Materials Technology for Energy Efficiency and Solar Energy Conversion V, Proceedings of the SPIE 692, Innsbruck, Austria, 15 April 1986; pp. 93–100.
- Carter, D.J. The measured and predicted performance of passive solar light pipe systems. Light. Res. Technol. 2002, 34, 39–52. [Google Scholar] [CrossRef]
- Kocifaj, M.; Darula, S.; Kittler, R. HOLIGILM: Hollow light guide interior illumination method—An analytic calculation approach for cylindrical light-tubes. Solar Energy 2008, 82, 247–259. [Google Scholar] [CrossRef]
- Oliveira, A.C.; Silva, A.R.; Afonso, C.F.; Varga, S. Experimental and numerical analysis of natural ventilation with combined light/vent pipes. Appl. Therm. Eng. 2001, 21, 1925–1936. [Google Scholar] [CrossRef]
- Varga, S.; Oliveira, A.C. Ventilation terminals for use with light pipes in buildings: A CFD study. Appl. Therm. Eng. 2000, 20, 1743–1752. [Google Scholar] [CrossRef]
- Siren, K.; Helenius, T.; Shao, L.I.; Smith, S.; Ford, B.; Diaz, C.; Oliveira, A.; Varga, S.; Borth, J.; Zaccheddu, E. Combining Light Pipe and Stack Ventilation-Some Development Aspects. In World Renewable Energy Congress; Pergamon: Amsterdam, the Netherlands, 2000; pp. 395–400. [Google Scholar]
- Lv, S.Z. CFD Research of the Light-Pipe System with the Function of Natural Ventilation. Master’s Thesis, Beijing University of Technology, Beijing, China, 2007; p. 240. [Google Scholar]
- Fei, D. The Research of Lighting and Ventilation by Light Pipe in Primary and Middle School Classroom. Master’s Thesis, Harbin Institute of Technology, Harbin, China, 2010; p. 232. [Google Scholar]
- Taengchum, T.; Chirarattananon, S.; Exell, R.H.B.; Kubaha, K.; Chaiwiwatworakul, P. A study on a ventilation stack integrated with a light pipe. Appl. Therm. Eng. 2013, 50, 546–554. [Google Scholar] [CrossRef]
- Muñoz, J.; Abánades, A. Analysis of internal helically finned tubes for parabolic trough design by CFD tools. Appl. Energy 2011, 88, 4139–4149. [Google Scholar] [CrossRef]
- Harrison, S.J.; McCurdy, G.G.; Cooke, R. Preliminary Evaluation of the Daylighting and Thermal Performance of Cylindrical Skylights. In Proceedings of the International Daylight Conference, Ottawa, ON, Canada, 11 May 1998; pp. 205–212.
- Callow, J.M. Daylighting Using Tubular Light Guide Systems. Ph.D. Thesis, University of Nottingham, Nottingham, United Kingdom, 2003; p. 252. [Google Scholar]
- Vos, B.H. Condensation in flat roofs under non-steady-state conditions. Build. Sci. 1971, 6, 7–15. [Google Scholar] [CrossRef]
- Probert, S.D.; Thirst, T.J. Design and performance of roofs. Appl. Energy 1980, 6, 79–97. [Google Scholar] [CrossRef]
- Batty, W.J.; O’Callaghan, P.W.; Probert, S.D. Energy and condensation problems in buildings. Appl. Energy 1984, 17, 1–14. [Google Scholar] [CrossRef]
- Aounallah, M.; Belkadi, M.; Adjlout, L.; Imine, O. Computation of turbulent buoyant flows in enclosures with low-Reynolds-number k-ω models. Int. J. Heat Technol. 2005, 23, 123–129. [Google Scholar]
- Hussain, S.; Oosthuizen, P.H.; Kalendar, A. Evaluation of various turbulence models for the prediction of the airflow and temperature distributions in atria. Energy Build. 2012, 48, 18–28. [Google Scholar] [CrossRef]
- ANSYS Inc. ANSYS FLUENT Theory Guide. ANSYS Help System: Release 14.0; ANSYS Inc.: Canonsburg, PA, USA, 2011. [Google Scholar]
- Sikula, O.; Mohelnikova, J. CFD Simulation of Thermal Behaviour of Tubular Light Guides. In SOLARIS 2011; Brno University of Technology: Brno, Czech Republic, 10 August 2011; pp. 252–258. [Google Scholar]
- Menter, F.R. Two-equation eddy-viscosity turbulence models for engineering applications. AIAA J. 1994, 32, 1598–1605. [Google Scholar] [CrossRef]
- Menter, F.R. Review of the shear-stress transport turbulence model experience from an industrial perspective. Int. J. Comput. Fluid Dyn. 2009, 23, 305–316. [Google Scholar] [CrossRef]
- Balaji, C.; Hölling, M.; Herwig, H. Combined laminar mixed convection and surface radiation using asymptotic computational fluid dynamics (ACFD). Heat Mass Transf. 2007, 43, 567–577. [Google Scholar] [CrossRef]
- Varol, Y.; Öztop, H.F.; Özgen, F.; Koca, A. Experimental and numerical study on laminar natural convection in a cavity heated from bottom due to an inclined fin. Heat Mass Transf. 2012, 48, 61–70. [Google Scholar] [CrossRef]
- Choi, S.-K.; Kim, S.-O. Turbulence modeling of natural convection in enclosures: A review. J. Mech. Sci. Technol. 2012, 26, 283–297. [Google Scholar] [CrossRef]
- International Organization for standardization (ISO). Thermal Bridges in Building Construction—Heat Flows and Surface Temperatures: Detailed calculation; International Standard, UNI EN ISO 10211:2008; ISO: Geneva, Switzerland, 2008. [Google Scholar]
- ASHRAE Handbook, Fundamentals, (S-I Edition); The American Society of Heating, Refrigerating and Air-Conditioning Engineers: Atlanta, GA, USA, 2001.
- Al-Marwaee, M.; Carter, D. Tubular guidance systems for daylight: Achieved and predicted installation performances. Appl. Energy 2006, 83, 774–788. [Google Scholar] [CrossRef]
© 2013 by the authors; licensee MDPI, Basel, Switzerland. This article is an open access article distributed under the terms and conditions of the Creative Commons Attribution license (http://creativecommons.org/licenses/by/3.0/).
Share and Cite
Šikula, O.; Mohelníková, J.; Plášek, J. Thermal CFD Analysis of Tubular Light Guides. Energies 2013, 6, 6304-6321. https://doi.org/10.3390/en6126304
Šikula O, Mohelníková J, Plášek J. Thermal CFD Analysis of Tubular Light Guides. Energies. 2013; 6(12):6304-6321. https://doi.org/10.3390/en6126304
Chicago/Turabian StyleŠikula, Ondřej, Jitka Mohelníková, and Josef Plášek. 2013. "Thermal CFD Analysis of Tubular Light Guides" Energies 6, no. 12: 6304-6321. https://doi.org/10.3390/en6126304
APA StyleŠikula, O., Mohelníková, J., & Plášek, J. (2013). Thermal CFD Analysis of Tubular Light Guides. Energies, 6(12), 6304-6321. https://doi.org/10.3390/en6126304