Article

Corn Stover and Wheat Straw Combustion in a 176-kW Boiler Adapted for Round Bales

Agriculture and Agri-Food Canada, Soils and Crops Research and Development Centre, 2560 Hochelaga Blvd., Quebec City, QC G1V 2J3, Canada
*
Author to whom correspondence should be addressed.
Energies 2013, 6(11), 5760-5774; https://doi.org/10.3390/en6115760
Submission received: 7 September 2013 / Revised: 19 October 2013 / Accepted: 23 October 2013 / Published: 4 November 2013
(This article belongs to the Special Issue Biomass and Biofuels 2013)

Abstract

:
Combustion trials were conducted with corn stover (CS) and wheat straw (WS) round bales in a 176-kW boiler (model Farm 2000). Hot water (80 °C) stored in a 30,000-L water tank was transferred to a turkey barn through a plate exchanger. Gross calorific value measured in the laboratory was 17.0 and 18.9 MJ/kg DM (dry matter) for CS and WS, respectively. Twelve bales of CS (1974 kg DM total, moisture content of 13.6%) were burned over a 52-h period and produced 9.2% ash. Average emissions of CO, NOx and SO2 were 2725, 9.8 and 2.1 mg/m3, respectively. Thermal efficiency was 40.8%. For WS, six bales (940 kg DM total, MC of 15%) were burned over a 28-h period and produced 2.6% ash. Average emissions of CO, NOx and SO2 were 2210, 40.4 and 3.7 mg/m3, respectively. Thermal efficiency was 68.0%. A validation combustion trial performed a year later with 90 CS bales confirmed good heating performance and the potential to lower ash content (6.2% average).

1. Introduction

In Canada, the five major cultivated grains are wheat, canola, corn, barley and soybeans, with a total yearly production of 65 Mt [1]. According to Lal [2], corn and soybeans have a straw/grain ratio of 1, while it is 1.5 for wheat, barley and canola. Residual biomass production (straw and stover) is thus well above 70 Mt per year. It is estimated that 30% to 60% of this amount may be harvested sustainably without affecting the future productivity of cropped areas [3].
Meanwhile, the use of crop residues as a solid fuel for energy has been discussed and analyzed for several decades. In 1981, Lockeretz [4] compared costs and benefits of using crop residues for energy. The author suggested renewable energy policies to be developed in close coordination with soil conservation programs. The issue still needs to be addressed today, especially for corn stover (CS) as an intensive crop [5,6,7]. Considering 30% removal of stover and straw, a very large quantity of biomass (>20 Mt/yr) is still potentially available for various applications such as cellulosic feedstock for distillation, food processing, co-firing, combined heat and power generation, hot water and building heating. In contrast with fossil fuels, crop residues are generally more dispersed over a large territory, have a high moisture content, a low bulk density, and a low heating value [8]. In many cases, decentralized usage of crop residues can be profitable in remote areas where natural gas or woody biomass are costly and not produced locally [9].
The use of crop residues as a solid fuel for heating can be implemented with existing technology on a small scale, as long as exhaust air quality is well controlled. However, combustion of such biomasses can cause different problems like fouling, slagging, bed material agglomeration, and premature corrosion of the furnace metallic components [10]. The high level of alkalis (chloride, potassium) in crop residues may lead to aerosol formation, resulting in ash melting temperature drop, fouling and emission issues. An additive like clay may help to reduce the alkali release from straw and CS [11]. Another way to achieve this, and lower the moisture content as well, is to harvest CS in the spring after winter washing [12].
The combustion of round bales of CS, cotton stalks and soybean residues was done in 1981 by Sumner et al. [13] for the purpose of grain drying. They observed mitigated success with CS because of its relatively high bale density compared to cotton stalks (142 vs. 99 kg/m3) and incomplete combustion of the bale core. Today, many efficient straw burners with power ranging from 35 to 5000 kW are commercially available, mainly manufactured in Europe.
A poultry (turkey) farm in Port Williams, Nova Scotia, Canada, recently converted a propane heating system to a biomass heating facility using round bales of straw [14]. As the farmer produces his own wheat and corn grain for feeding, a substantial amount of straw and stover is available. The combustion equipment was originally designed and recommended for cereal straw-type bales. The objective of this research was to evaluate the potential use of CS bales in the same boiler without major modifications. The experimental approach was to evaluate flue gas emissions, residual ash, and the energy balance of wheat straw (WS) and CS combustion in the Farm 2000 boiler designed for burning round bales.

2. Material and Method

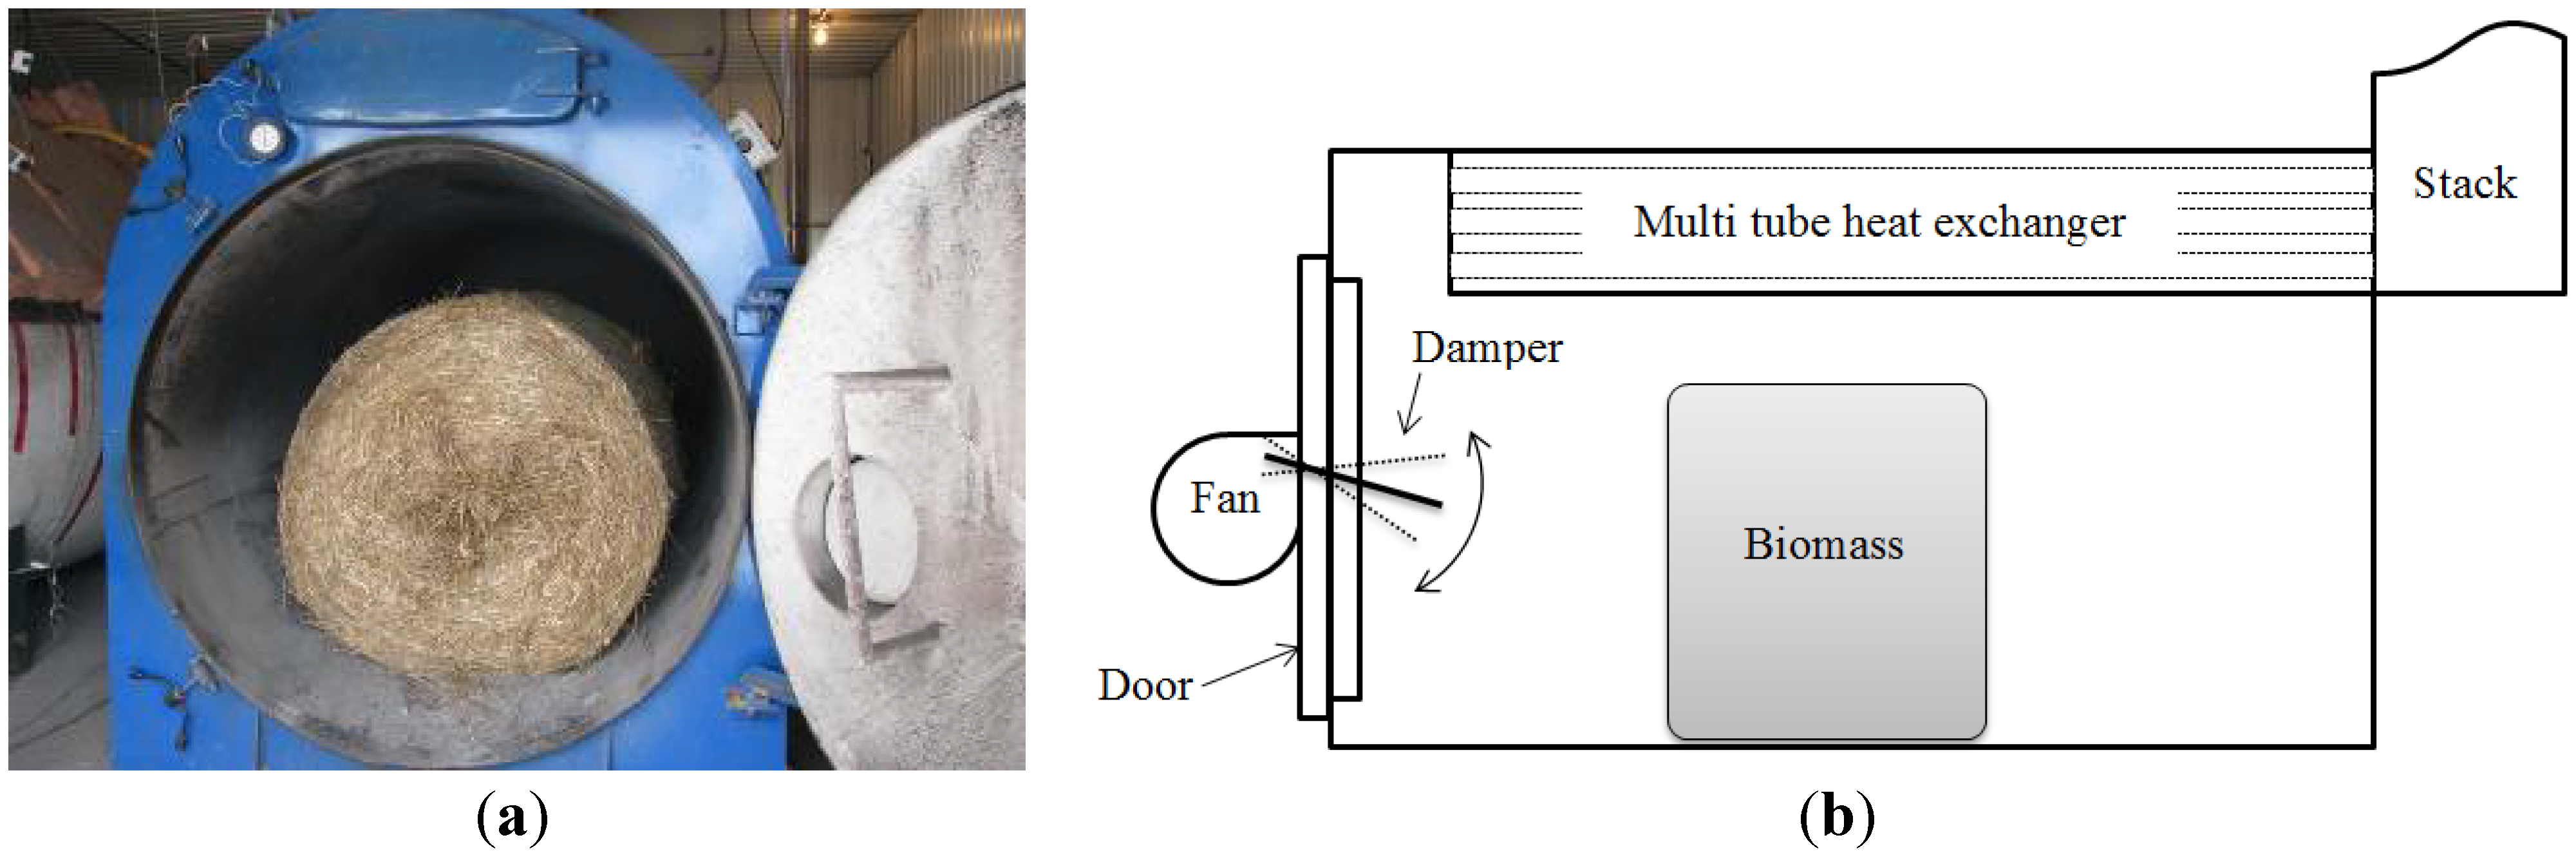
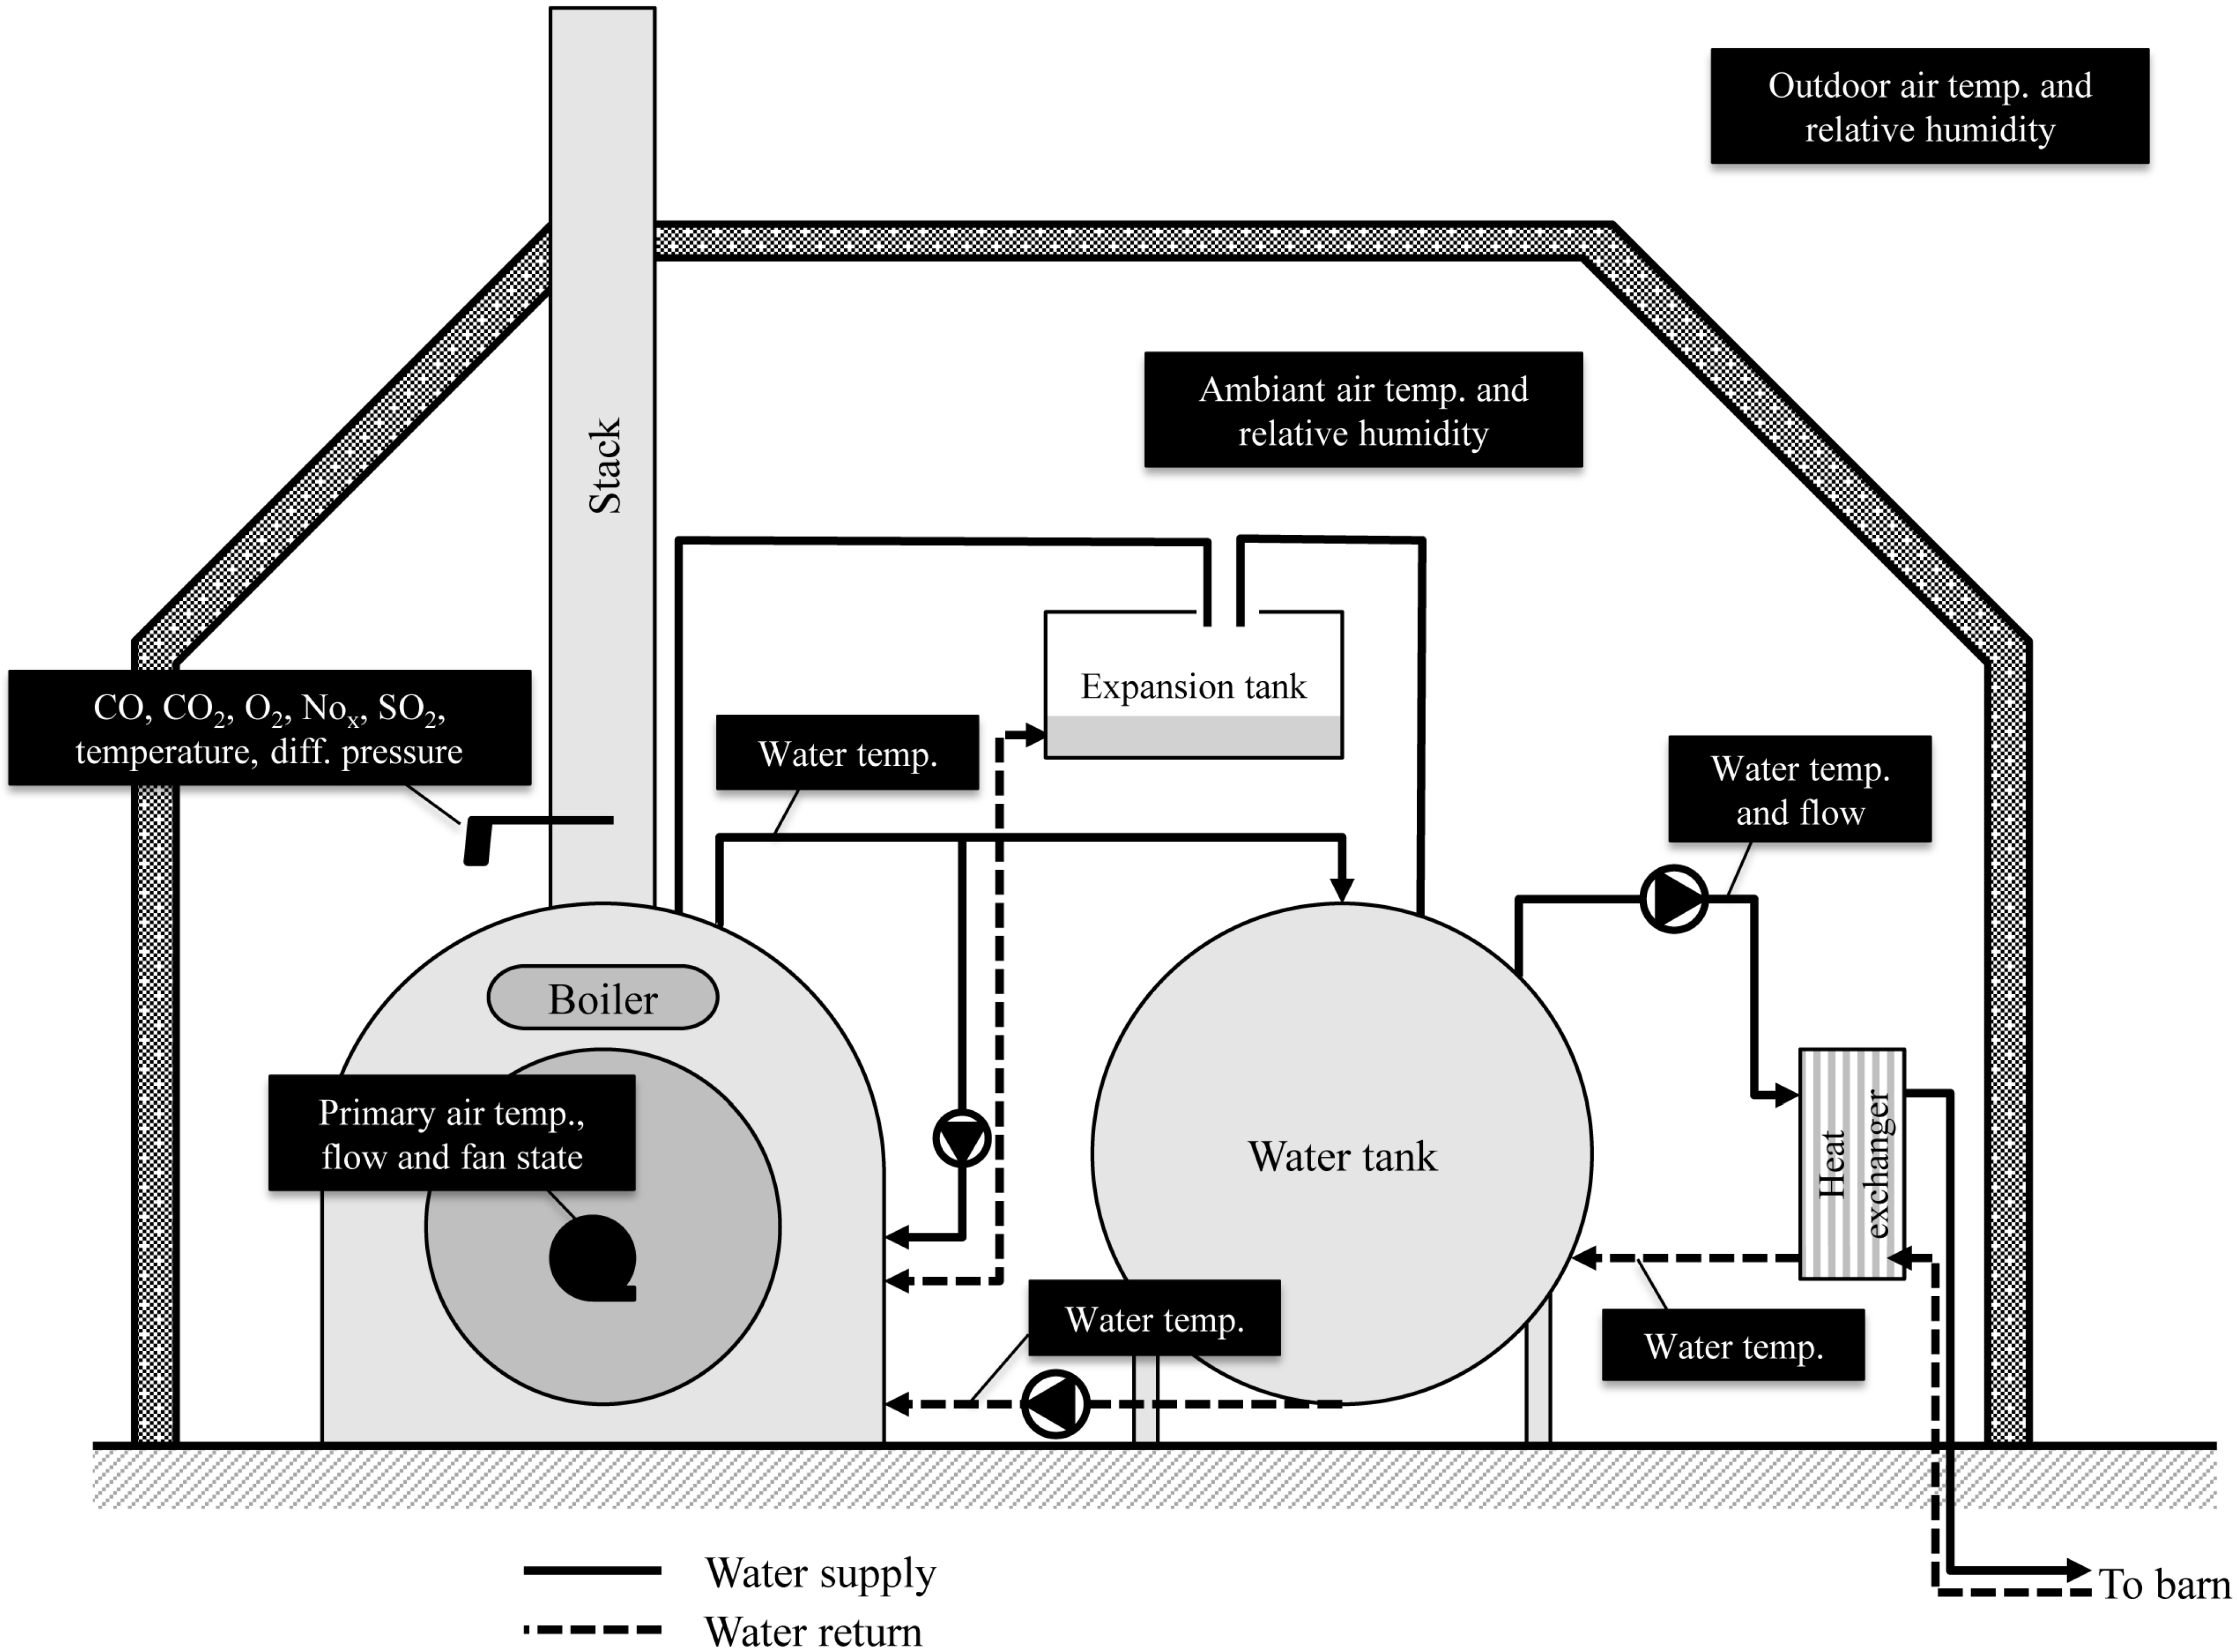
2.1. Biomass Boiler, Hydronics System and Barn Description

The heating system consists of a straw bale burner that transfers energy to hot water up to 80 °C which is used to maintain warm temperatures in a poultry barn. The boiler is a Farm 2000 model BB254/2 (Teisen Products Ltd., Worcestershire, UK) that can hold up to two round bales of 1.52 m diameter and 1.22 m width (Figure 1a). The rated output power is 176 kW with two loads per day (four bales) according to the manufacturer. Bales are loaded with a tractor through a large frontal opening normally closed by a well-sealed door. Heat is transferred to a 3500-L water jacket by a multi tube heat exchanger. Flue gas is exhausted by a 362-mm diameter stack without any filtering system. The boiler includes a partially automated primary air controller. The fan and damper assembly is mounted on the front door (Figure 1b). Based on operator experience, the damper downward travel time and fan intensity are adjusted prior to combustion. For WS, the low speed fan setting and the damper downward movement were used during the first 20 min, and then the full fan speed was utilized until the end of bale combustion. For CS, the low speed and damper downward movement were set at 40 min, and then fan setting was adjusted at full speed until the end of bale combustion.
Figure 1. (a) The combustion chamber; and (b) a schematic of boiler’s main components.
Energies 06 05760 g001
Hot water is stored in a 30,000-L water tank (2.45 m diameter, 6.5 m length) prior to being pumped through a 352-kW plate exchanger where heat is transferred to the barn. The tank is partially insulated with six-inch rockwool (R24) on the upper half plus a Flex foil (R4) jacket on all surfaces of the tank. Water is pumped to the storage tank with a centrifugal pump (rated 18 m3/h at 65 kPa head pressure). A similar pump delivers the water flow to the barn. All pipes are in steel except the underground high-density polyethylene (HDPE) pipes that link the boiler room to the barn network. A propane boiler is located in the barn for backup, for high heating demand periods and during biomass boiler maintenance.
The barn has two floors of 91.4 m × 13.4 m for a total heated volume of 6541 m3. Each floor has six 22-kW heat exchangers, each mounted with an axial fan, to maintain the set point temperature according to flock growing stage, humidity control and ventilation rate. Normal air temperature is 36 °C at day one, gradually decreases down to 19 °C at day 50 of turkey bird life and is maintained constant thereafter. Air exchange rate is about 2500 m3/h at day one and gradually increases up to 40,000 m3/h at day 70 for each floor. For each 77-day growing cycle, the barn can hold up to 14,000 turkeys (7000 per floor).

2.2. Monitoring Devices

Standalone data acquisition devices (HOBO logger from ONSET Corp., Bourne, MA, USA) were installed in different locations in the boiler room to measure water and air temperature and pump states (Figure 2). Water temperatures were taken with surface thermocouples at boiler exit (primary flow), boiler return, tank exit and tank return. Air temperatures were taken at the boiler intake (primary air) and inside and outside the boiler room. Relative humidity was also monitored inside and outside the boiler room. Primary air fan state and pump state were logged. Temperature, relative humidity and state were sampled every 5 min. Primary flow was monitored periodically using an ultrasonic flow meter (Hoskin Scientific, model DMTFH-12-A, Saint-Laurent, QC, Canada).
Figure 2. Schematic of the heating system (boiler room), probe location and description.
Energies 06 05760 g002
Flue gases were monitored with a portable combustion analyzer (Bacharach, model ECA 450, New Kensington, PA, USA). The gas sampling probe was located at the bottom of the stack and a temperature probe was mounted upstream in the boiler’s primary air blower. Sampling rate was 5 min. Measured parameters were oxygen (O2, %), carbon monoxide (CO, mg/m3), nitric oxide (NO, mg/m3), nitrogen dioxide (NO2, mg/m3), sulfur dioxide (SO2, mg/m3), flue gas temperature (°C), and differential pressure (mbar). From these parameters, calculations were performed by the analyzer for CO2 (%), NOx (mg/m3), combustion efficiency (%), and excess air ratio. The combustion efficiency is defined as the net calorific value (NCV) of the fuel minus the sum of heat losses in unburned components exiting the stack divided by NCV. The excess air ratio is the amount of air that exceeds the need for a stoichiometric combustion.

2.3. Biomass Characterization Prior to Combustion

WS bales were harvested on the same farm where the boiler is located in Port Williams, Nova Scotia, Canada. They were formed with a fixed chamber round baler (Claas ROLLANT 250 without chopper, Claas, Harsewinkel, Germany) in fall 2011 and stored under shelter. Meanwhile, CS bales were harvested in spring 2011 in Sainte-Hélène-de-Bagot (Québec, Canada) according to a procedure developed by Lizotte and Savoie [15]. Because of the high moisture content of CS at grain harvest in late fall, which is between 35% and 50% [12] and the slow natural drying at that time of the year, stover was collected in the following spring to facilitate dry storage without further treatment after baling. Indeed, six months after grain harvest, a Hiniker model 5610 flail cutter-windrower (Hiniker Company, Mankato, MN, USA) collected from 30% to 50% of the residual corn fiber that had dried down naturally to less than 15% moisture. The stover bales were formed with a variable chamber round baler (New Holland 648, New Holland, PA, USA), stored under shelter and transported by truck in January 2012 to Nova Scotia.
Prior to combustion, every bale of WS and CS was weighed, measured (diameter and length), and sampled for moisture content (MC) determination, ash, and energy content. A sample of at least 100 g was extracted from each bale with a core probe (31 mm diameter, 61 cm long). Samples were weighed in a paper bag and oven dried for 24 h at 103 °C for MC determination. Gross calorific value (GCV) and ash content were determined in the laboratory with a calorimeter (Parr 6100 Oxygen Bomb Calorimeter with 1108P Oxygen Combustion Bomb, Parr Instrument Company, Moline, IL, USA) to meet standard EN 14918:2009 [16]. Ash content was measured with an ash analyzer (LECO TGA701 Thermogravimetric Analyzer, LECO, St. Joseph, MI, USA), complying with standard ASTM D7582-10 [17].

2.4. Combustion Procedure

As the combustion rate depends on the heating needs and biomass properties, conservative assumptions were made to plan the experiment. According to the boiler operator, a single bale can provide heat for up to 4 h. Within the limited time scheduled to perform the experiment and a definite number of bales available, six bales of WS within a 24-h period followed by twelve bales of CS within a 48-h period were burnt. Prior to each biomass type trial, the combustion chamber and the tube heat exchanger were cleaned while ashes were removed using a tractor front-end loader. Each bale was loaded in the combustion chamber at a distance between 1.25 and 1.5 m from the door. Primary air fan settings were adjusted according to the operation manual. Only one bale at a time was loaded and burned except during the night when two bales were placed typically at 11 p.m. until the next morning. During combustion trials, process air and water conditions, pump state, and flue gases were monitored continuously to ensure proper energy balance calculations. At the end of a trial (six WS bales or twelve CS bales), ashes were removed and weighed using a high capacity floor scale (0.2 kg resolution).

2.5. Energy Balance Calculation

An energy balance was calculated for each bale load as described by Equation (1). The total energy available from the bale load (EFuel) was estimated from the NCV which is the GCV estimated experimentally and corrected for moisture content and hydrogen, as explained in Section 3.1 below. Temperature data were collected every 5 min in the boiler (TB), in the water tank (TT), at the hot water outlet (TO) and at the water return (TR) from the heat exchanger. An average water flow (m’, in kg/s) was measured and a standard heat capacity was considered (cp, 4.18 J/g/°C). The energy loss (ELoss) was the sum of energy dissipated to the surroundings, the chimney stack and the ash box. These losses were not measured but estimated as a group from other terms. The change in stored energy in the boiler and in the tank was estimated as a function of mass of water (mB and mT, respectively) and temperature change during the combustion. The energy transfer was measured at each measurement interval (i), for the total number of intervals (n). The change in energy in the boiler and the tank need to be estimated simply between the first (i = 1) and the last (i = n) interval. The energy balance equation can be expressed as follows:
E F u e l =   E L o s s +   m B c P   ( T B n   T B 1 ) + m T   c P ( T T n T T 1 ) +   i = 1 i = n     m c P ( T O i   T R i   )   Δ t i
Energy loss can be estimated since all other terms are measured and calculated experimentally.

2.6. Combustion Validation Trials with CS

A second set of combustion trials was done between January and April 2013 with 90 CS bales that were harvested on the farm in Nova Scotia during spring 2012. CS bales for the 2013 validation trial were formed with a fixed chamber round baler (Claas ROLLANT 250 without chopper) which resulted in lower density than bales used in the previous 2012 trial (which were formed with the variable chamber baler). Between spring 2012 and winter 2013, CS bales were stored under shelter. The purpose of this second set of trials was to validate combustion rate, ash content and ash rate removal. All bales were measured and weighed at harvest; they were weighed again just before being burned. One bale out of five was sampled for moisture content. No energy balance was performed during these validation trials. Ashes were collected and weighed after each trial which comprised 30 bales.

3. Results and Discussion

3.1. Biomass Characteristics

Table 1 reports average properties of WS and CS bales used for the January 2012 combustion trials. For WS bales, average moisture content and bale mass were 14.6% and 183.2 kg, respectively. Bale diameter and width averaged 1.47 m and 1.20 m, respectively, while average density was 77.1 kg DM/m3. For the CS bales, moisture content and mass averaged at 13.6% and 190.2 kg, respectively. Diameter was 1.32 m and width was 1.15 m. Thus, CS bale density was 104.5 kg DM/m3 and 35% higher that WS bale density.
All samples were analyzed in the laboratory for GCV and ash content. NCV was determined using Equation (2) [18], where GCV units are MJ/kg fuel (dry basis—d.b.); w is moisture content in % (wet basis—w.b.); and h is concentration in hydrogen (5.5% d.b. as estimated in the literature for straw and stover [19]). This equation is a good estimate for any woody and herbaceous biomass fuel:
N C V = G C V ( 1 w 100 ) 2.444 w 100 2.444 h 100 8.936 ( 1 w 100 )   [ M J k g ,   w . b . ]
Table 1. Characteristics of wheat straw (WS) and corn stover (CS) bales measured in the laboratory.
ParameterUnitWS (six bales)CS (twelve bales)
Ave.S.D.Min.Max.Ave.S.D.Min.Max.
Moisture content%14.60.713.615.513.61.412.717.7
Bale masskg183.213.7166.6198.6190.212.4163.4206.8
kg DM156.511.9144.0170.7164.512.5134.5180.4
Diameterm1.470.031.431.521.320.041.251.39
Widthm1.200.001.201.201.150.021.121.18
Volumem32.040.091.912.161.580.111.401.76
Densitykg/m390.28.779.6103.8120.86.7112.0131.8
kg DM/m377.17.668.889.2104.56.396.1114.2
Gross calorific valueMJ/kg d.b.18.910.3318.5519.4717.040.8715.9018.72
Net calorific valueMJ/kg w.b.14.770.2314.5415.0713.350.7412.5114.98
Total gross energyMJ/bale2955.9188.72731.63167.52800.5227.52422.13226.1
Total net energyMJ/bale2702.7169.92503.42894.42540.1216.62189.92957.9
Ash content% d.b.1.820.221.592.1411.705.325.0922.14
GCV (MJ/kg d.b.) averaged 18.91 for WS and 17.04 for CS (Table 1). NCV based on average moisture content were 14.77 and 13.35 MJ/kg w.b., respectively. Ash content obtained with the thermogravimetric analyzer (TGA) was 1.82% for WS and 11.70% for CS. Ash for WS had a small range (1.59% to 2.14%) compared to CS (5.09% to 22.14%). According to Van Loo and Koppejan [18], ash has a negative contribution to GCV. Analyses showed that the high ash content of CS resulted in a lower GCV compared to WS.

3.2. Combustion Trials

Six WS bales were burned from 15:40 on 23 January 2012 to 19:55 on 24 January 2012 (about 28 h; Table 2). Bales were placed one at a time in the furnace except during the night when two WS bales were placed together (bales number S3 and S21). The average combustion time per bale was 280 min with an average burning rate of 33.52 kg DM/h for WS.
The 12 CS bales burned over a period of 52 h from 20:00 on 24 January to 23:55 on 26 January. Average combustion time per bale was 9% shorter compared to WS (255 vs. 280 min) while CS bales were 5% heavier than WS bales (165 vs. 157 kg DM). The biomass burning rate was therefore 15% higher for CS than for WS (38.69 vs. 33.52 kg DM/h). The higher burning rate of CS was partly related to the average lower exterior temperature (0 vs. 5.4 °C) during CS trial and the lower net calorific value of CS (13.35 vs. 14.77 MJ/kg w.b.).
The quantity of ash removed from the boiler is shown in Table 3. It includes ash in the combustion chamber, in the heat exchanger and in the bottom stack. It does not include fly ash in the flue gas which was not monitored. Ash produced by the combustion of 48 WS bales for normal heating (between 13 January 2012 and 23 January 2012) was weighed and identified as the “pre-combustion trial” (PCT). This PCT was followed by individual bale monitoring. Ash content of WS bales during the PCT was 1.70%; it was 2.55% on average during the six individual WS bale combustion. These ash levels were comparable to the level measured in the laboratory (1.82%). However, they were lower than those reported in the literature, which ranged from 2.69% to 13.5% d.b. with an average of 6% d.b. [19]. Ash production rates were 0.53 and 0.86 kg/h for the 48 and 6 WS bale trials, respectively. CS ash content after the 12-bale combustion trial averaged 9.17% d.b., which was lower than the TGA value (11.70% d.b.). Various ash levels for CS are reported in the literature: 4% for standing stalk, unwashed [20] and 5.9% for small stover bales harvested in the spring six months after grain harvest [21]. Higher values and variations observed for ash content of CS are probably linked to the harvesting method and soil contamination. Actually, the Hiniker mower-windrower tended to mix soil dust into the stover. The contamination depends on machinery operation, soil type and moisture, frost cover and distance of rotary parts from ground level. Ash production rate during the combustion of the 12 CS bales averaged 3.5 kg/h, i.e., more than four times higher than ash production with WS bales. This implies that ash removal operations and multi tube exchanger cleaning will be more frequent with CS than with WS.
Table 2. Combustion trial loading sequence with burning duration and rate (2012 trials).
Bale IDMC (%)Mass (kg)Mass (kg DM)Start date and timeEnd date and timeDuration (min)Burning rate (kg DM /h)Ext. temp. (°C)
WS
S114.4193.2165.401/23 15:4001/23 18:5519550.880.1
S214.0198.6170.701/23 19:0001/23 23:1525540.172.0
S313.6166.6144.001/23 23:1501/24 09:3562029.935.5
S2115.0194.4165.2Dual burning with S3
S415.1174.0147.801/24 09:4001/24 13:4524536.1911.2
S515.5172.2145.601/24 13:5001/24 19:5536523.938.3
Ave.14.6183.2156.5--280 a33.525.4
Sum-1099.0938.7--1680--
CS
C613.1198.2172.301/24 20:0001/24 23:3021049.225.8
C713.7168.6145.501/24 23:3501/25 06:2541021.303.4
C812.8190.0165.701/25 06:3001/25 10:5526537.523.3
C913.8191.6165.201/25 11:0001/25 14:5523542.184.1
C1012.9195.2170.001/25 15:0001/25 18:2020050.991.7
C1112.8206.8180.401/25 18:2501/25 22:4025542.44−0.4
C1213.9199.0171.301/25 22:4501/26 03:5531033.15−0.5
C1313.8190.4165.201/26 04:0001/26 07:4522543.79−3.3
C1412.8191.6166.101/26 07:5001/26 11:4023043.61−1.7
C1512.7197.4172.401/26 11:4501/26 15:3523044.970.0
C1612.9190.4165.901/26 15:4001/26 20:4030033.18−6.0
C1717.7163.4134.501/26 20:4501/26 23:5519042.46−6.4
Ave.13.6190.2164.5--25538.690.0
Sum-2282.61974.4--3060--
a: Average per bale.
Table 3. Ash content from pre-combustion trial (PCT) WS and individually monitored WS and CS bales during January 2012 combustion trials.
BiomassBales burnedMass burnedAccumulation periodAsh and unburned contentAsh production rate
--kg DMhkg% d.b.kg/h
PCT WS487517240127.61.700.53
WS6938.72824.02.550.86
CS121974.452181.09.173.48

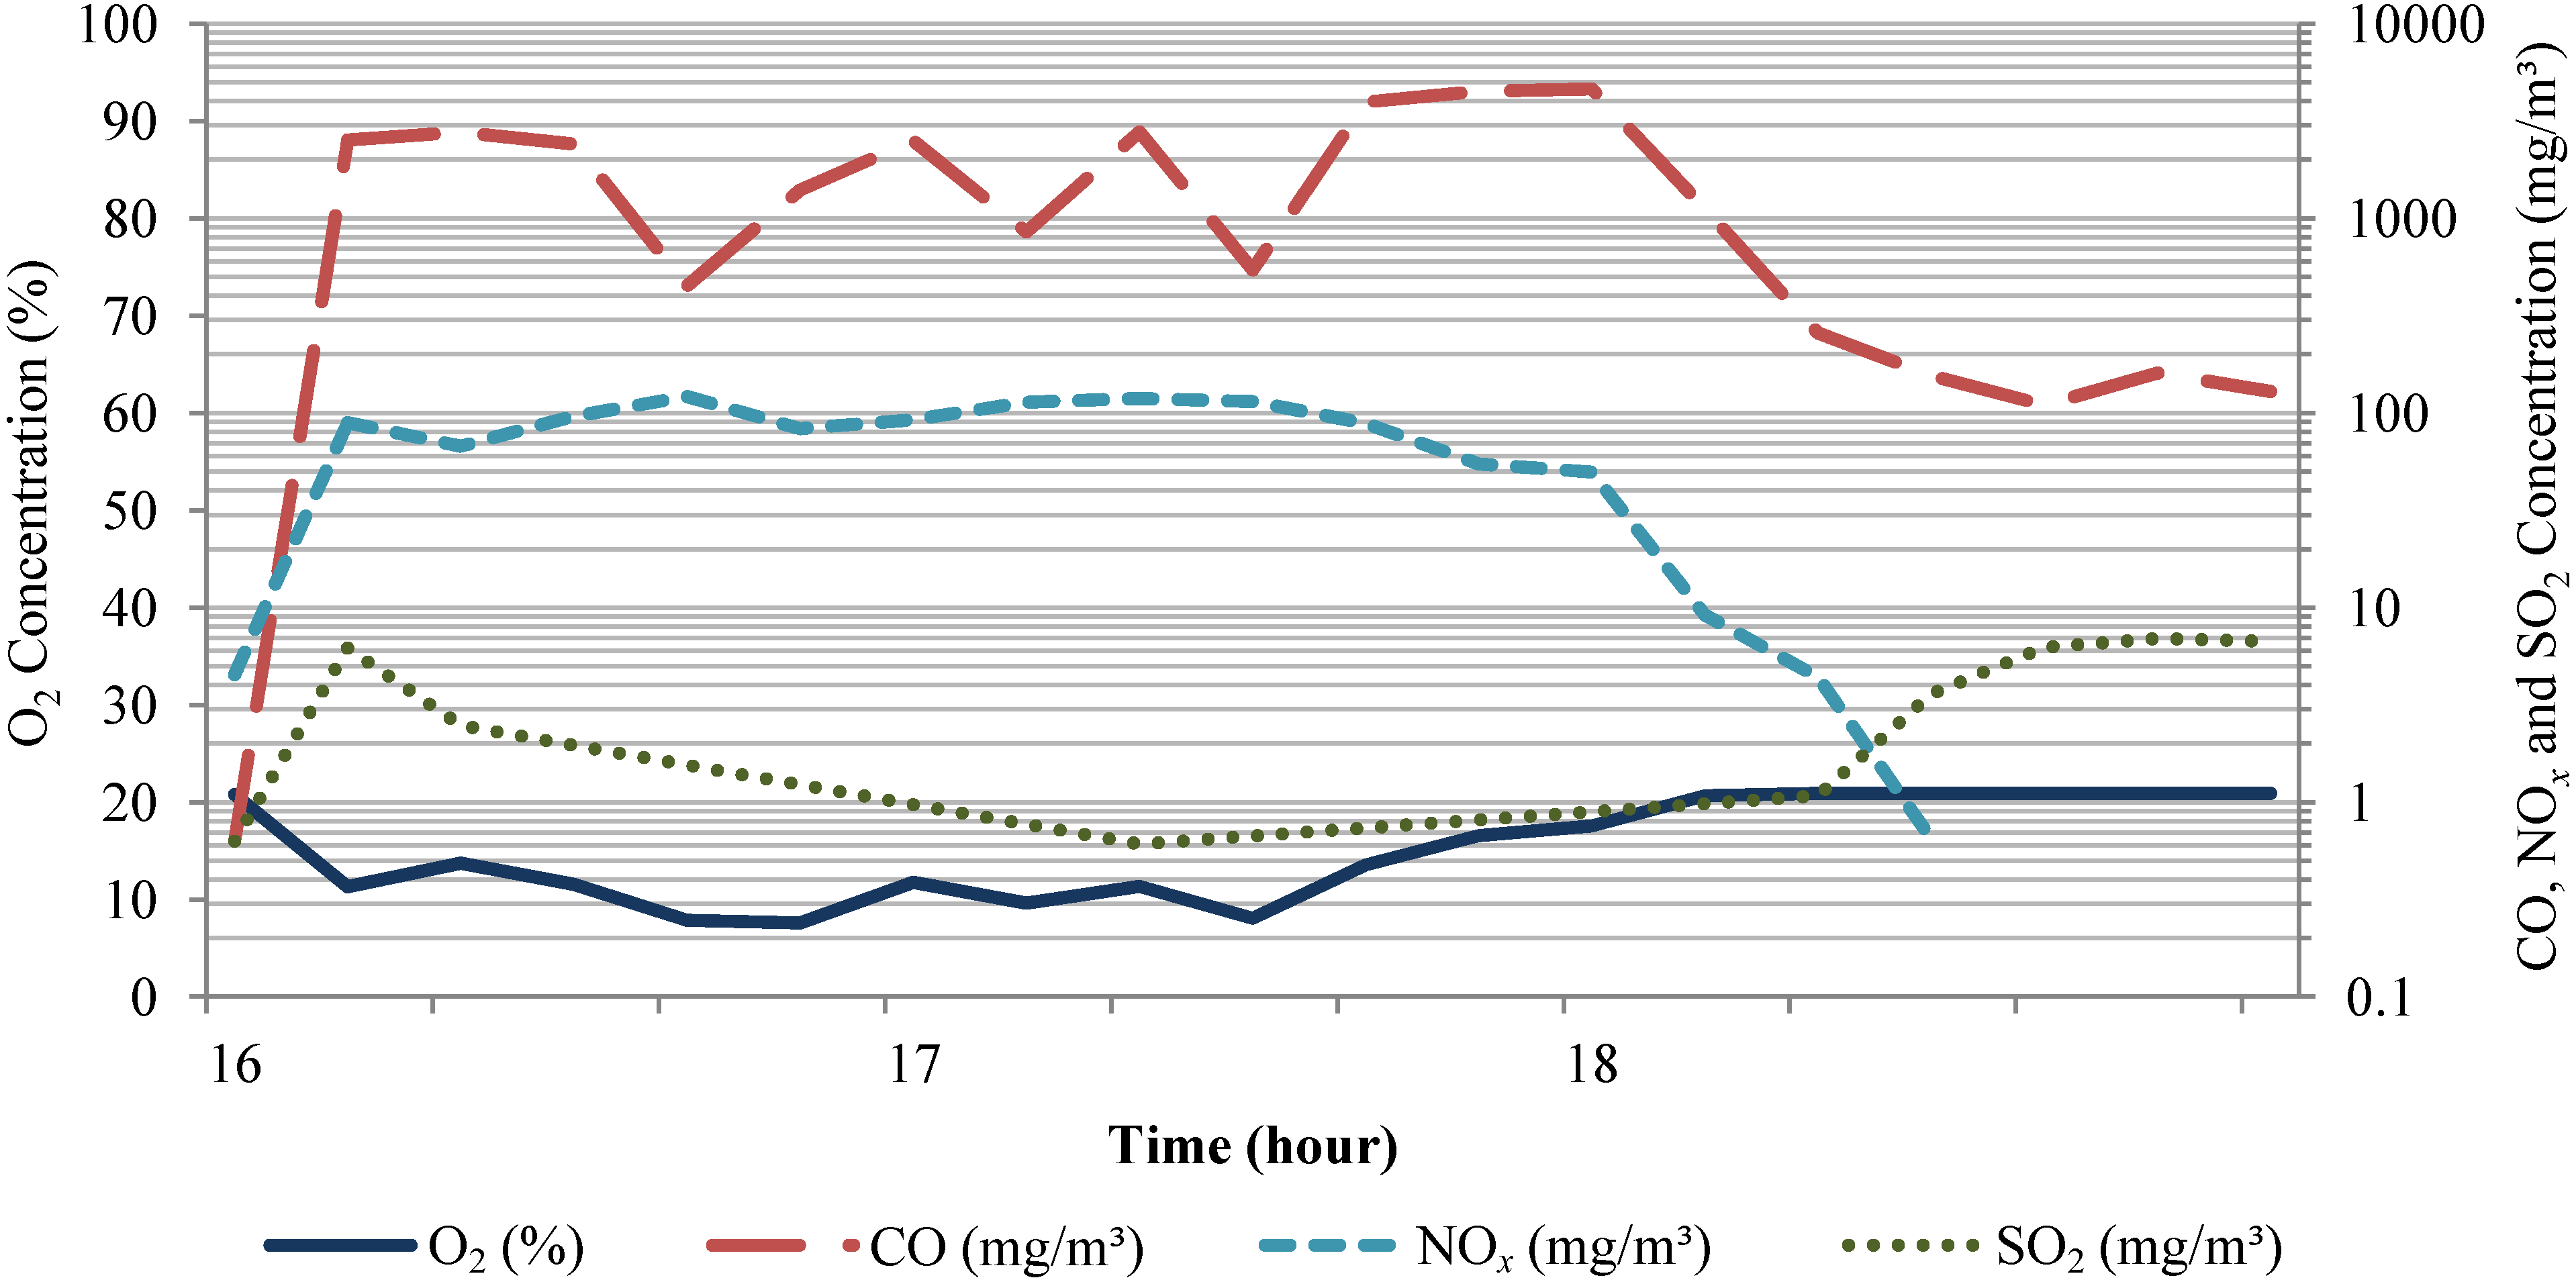
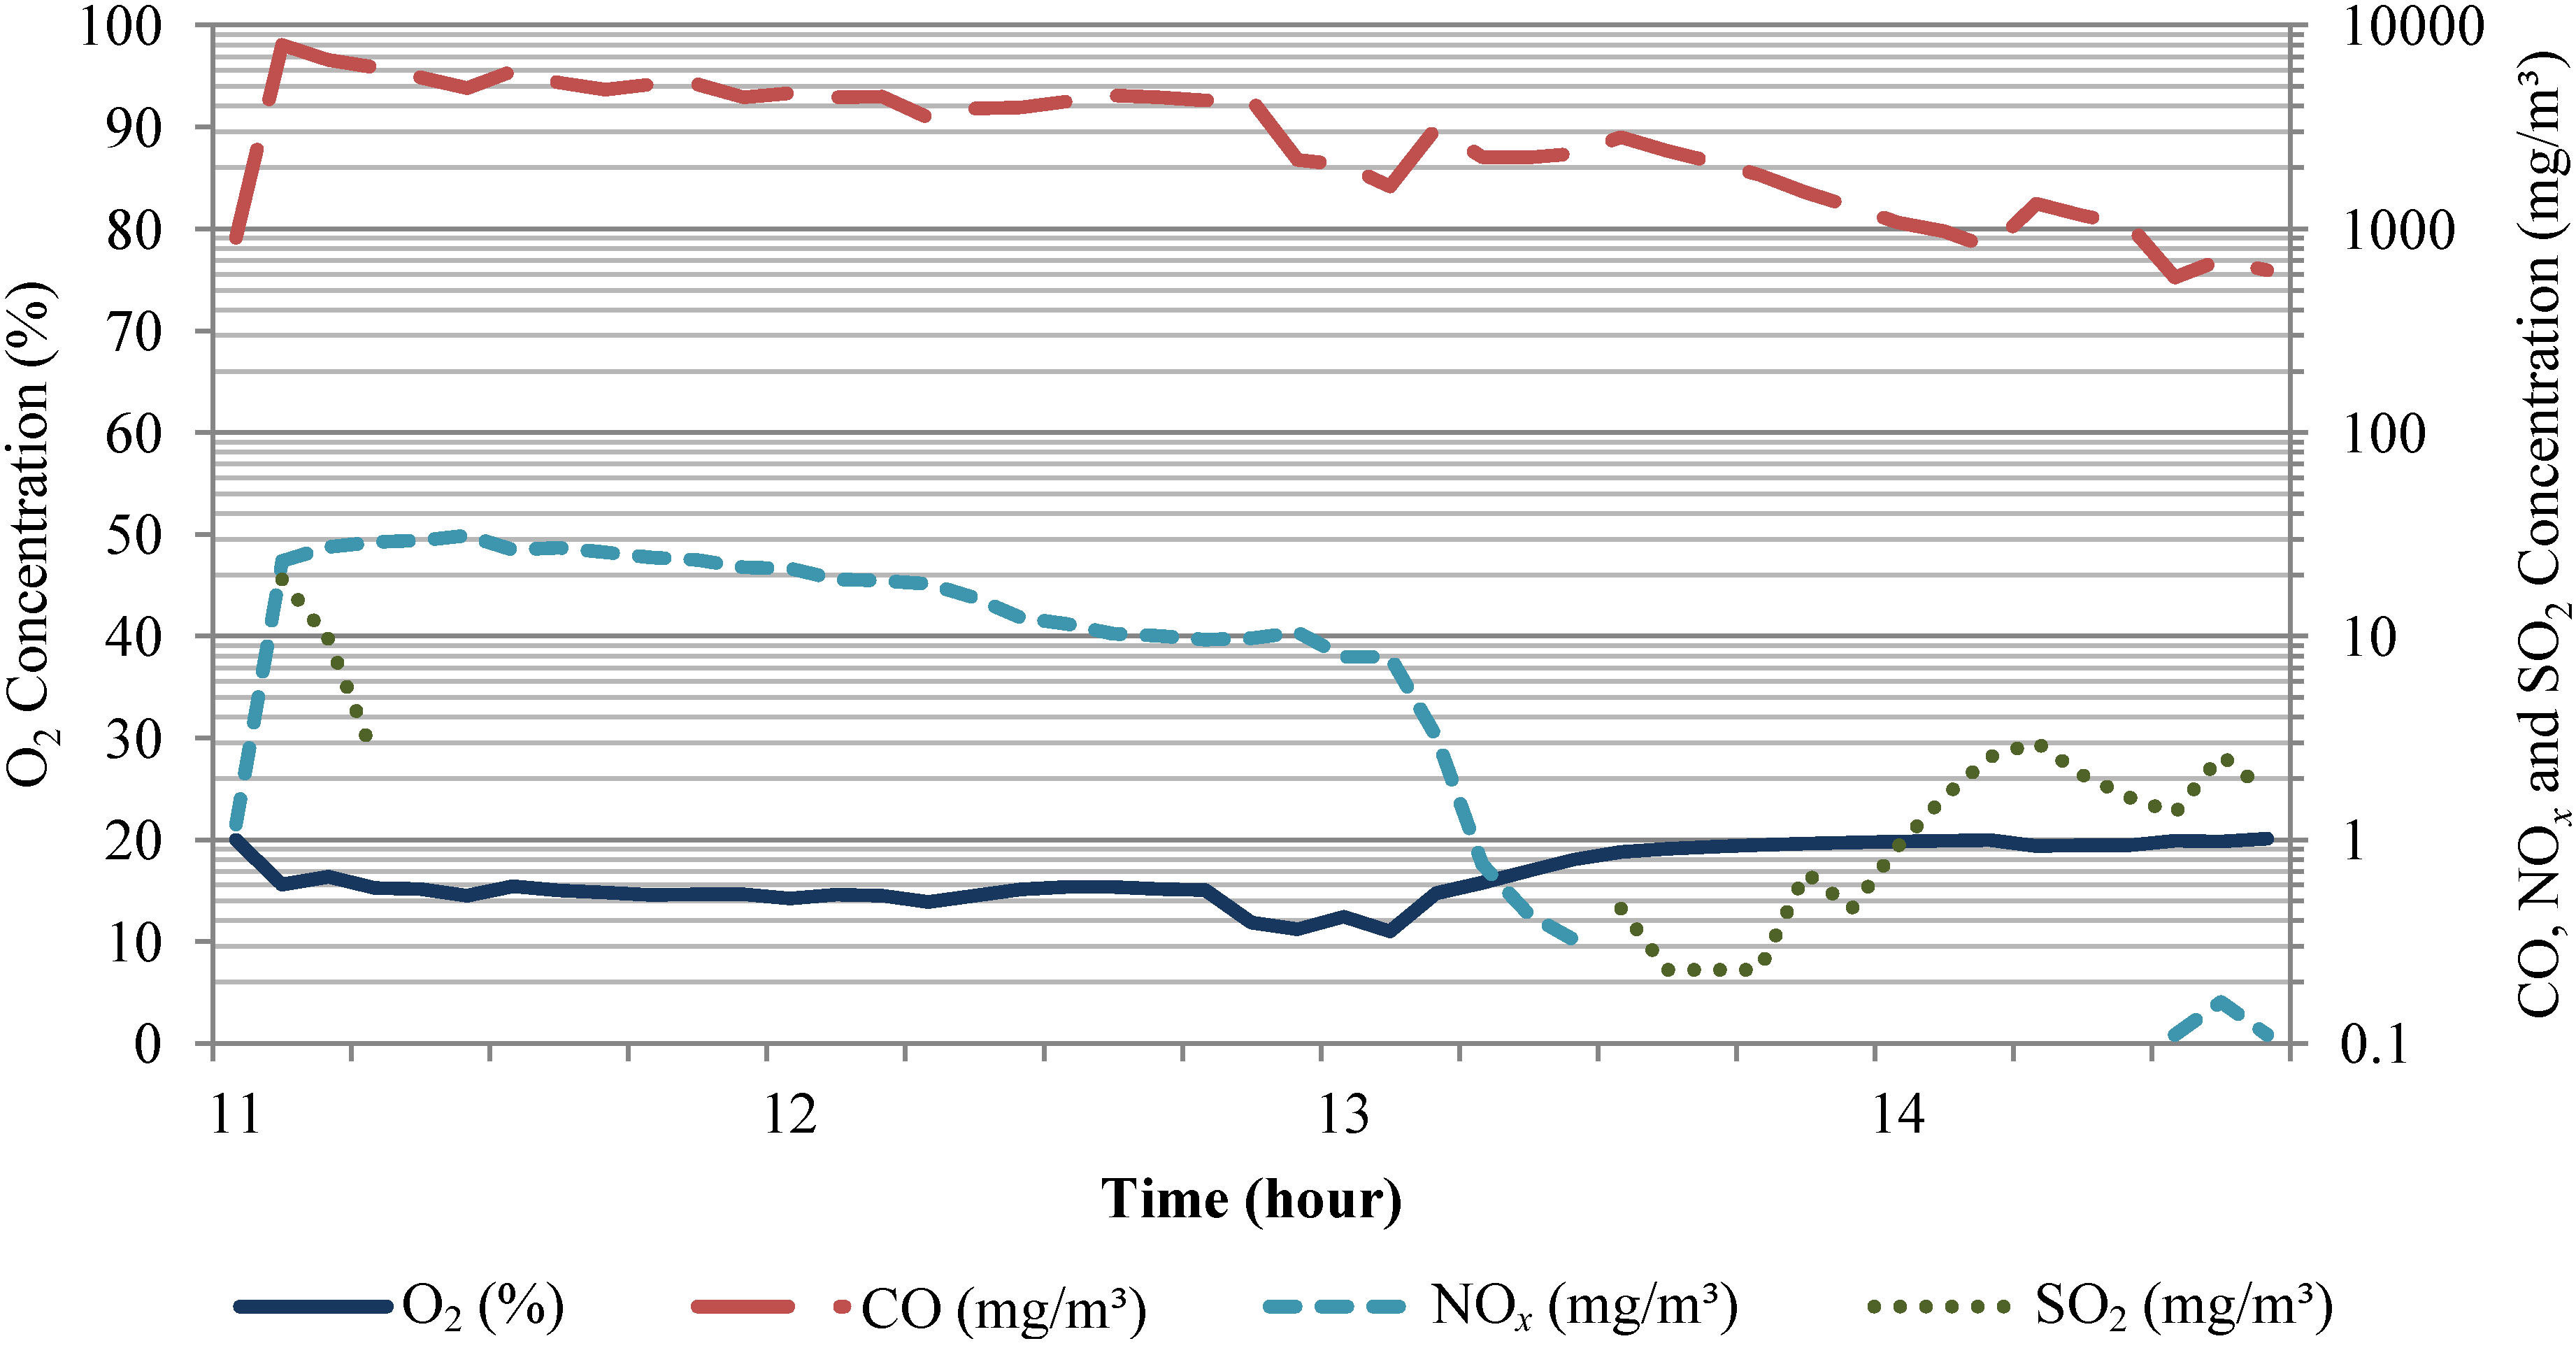
3.3. Flue Gas Emissions

Table 4 reports gas emissions during the 2012 combustion trials of some individually monitored bales, including supplementary WS bales S22 and S23.
Table 4. Flue gas emission measurements for WS and CS bale combustion.
Bale IDStack Temp. (°C)Intake Temp. (°C)Mass air flow (kg/s)Eff. (%)Excess air ratio (%)O2 (%)CO2 (%)CO (mg/m3)NOx (mg/m3)SO2 (mg/m3)
-Ave.Ave.Ave.Ave.Ave.Ave.Ave.Ave.Max.Ave.Max.Ave.Max.
WS
S1275.027.10.3068.918113.77.435337148108.8179.07.976.3
S2249.330.80.2770.211015.110.01644462258.3121.41.86.9
S3–S21181.634.30.2670.813517.09.52357899911.391.48.024.3
S22181.822.80.2467.417816.87.5171936046.117.30.73.0
S23206.026.20.2863.122017.36.41799436617.436.50.11.4
Ave.218.728.20.3068.116516.08.22210-40.4-3.7-
CS
C7139.034.90.2169.623518.56.7172476042.312.54.710.4
C8195.924.00.2768.524116.66.73132778210.229.32.633.1
C9200.524.00.2869.020315.47.0356479153.211.31.113.0
C14212.419.10.2867.621915.56.53592857116.836.23.695.0
C15194.928.50.2568.522716.46.33238800510.631.31.219.0
C16195.123.00.2367.916616.48.0177460236.717.30.84.6
C17213.825.90.2763.921817.06.62053693919.144.70.711.2
Ave.193.125.60.2667.821516.66.82725-9.8-2.1-
Concentrations reported are at pressure, temperature and O2 levels within the stack (not normalized at O2 reference). Average stack temperatures were 219 and 193 °C for WS and CS, respectively. Average primary air mass flow was 0.30 and 0.26 kg/s, respectively. Combustion efficiency was calculated by the analyzer based on measured parameters. Similar combustion efficiencies of about 68% were obtained for WS and CS. Excess air ratio was higher for CS, averaging at 215% compared to 165% for WS. Average oxygen levels were around 16% for both biomasses, which is higher than normally observed in literature (between 5% and 8% for a continuously fed grate furnace [18]). Since the combustion process is a batch type and fuel-air contact was not homogenous, higher excess of air for CS did not reduce CO level compared to WS (2725 vs. 2210 mg/m3). Average NOx and SO2 were 40.4 and 3.7 mg/m3 for WS and 9.8 and 2.1 mg/m3 for CS, respectively. The combustion of CS in a bale boiler has demonstrated higher levels of CO, but lower levels of SO2 and NOx, when compared to continuous combustion of CS pellets in a pellet boiler where CO, SO2 and NOx were 54, 100 and 252 mg/m3, respectively [22]. However, there is no Canadian legislation regarding in-stack emission limits for CO, NOx, and SO2, but only for surrounding air quality. Beauchemin and Tampier [23] reported that German legislation for small 50–100 kW straw furnaces built before 2008 limits CO emissions to less than 2000 mg/m3; the limitation is reduced as furnace output power increases. The NOx concentration is limited to 200 mg/m3 for wood furnace under 2 MW (at 11% vol. O2). The Farm 2000 boiler would meet the German requirement for NOx but not for CO. A more efficient combustion could be obtained by adding an oxygen sensor within the stack to vary primary air flow.
Figure 3 and Figure 4 show typical flue gas emissions for WS and CS. Oxygen level in exhaust gases was lower for the first 2 h and then increased to normal concentration (around 20%) when less biomass was available for combustion according to primary air input. CO levels are relatively stable for the first 2 h and then decrease (for a single bale batch). Higher concentrations of NOx were generally observed when O2 was lower, particularly for WS (about 20 to 100 mg/m3 of NOx) and stover (10 to 30 mg/m3 of NOx).
Figure 3. Typical flue gas emission concentrations for WS (bale S1 shown).
Energies 06 05760 g003
Figure 4. Typical flue gas emission concentrations for CS (bale C14 shown).
Energies 06 05760 g004

3.4. Energy Balance

Table 5 shows energy balance for each trial. Losses were calculated by difference as described in Equation 1. Thermal efficiency is the ratio of accumulated and output energies over total fuel energy (biomass NCV). For WS, total bale energy content was 16,216 MJ. About 9500 MJ (59%) were transferred from the hot water tank to the barn’s plate heat exchanger and 1400 MJ were accumulated at the end of the trial. Total losses (by difference) were 5190 MJ for an overall thermal efficiency of 68%. With an operation period of 1680 min (28 h), the average output power of the boiler was 108 kW. For CS, total bale energy content was 30,481 MJ. Energy transferred to the heat exchanger was 13,332 MJ (about 44% of total NCV) while energy accumulated in the tank was −960 MJ (less energy than initially available). Total losses were calculated at 18,036 MJ with a thermal efficiency of 40.8%. The average output power was only 68 kW based on a 3060 min (52 h) trial duration. In all cases, there was no significant energy accumulation in the boiler water jacket itself. The thermal efficiency differences between CS and WS can partially be explained by the bale characteristics and the boiler design. As the CS bales were denser, less biomass area was in contact with the primary airflow to make them burn properly compared to lower density WS bales. According to the gas analyzer data, excess air ratio was higher for CS (215% vs. 165%) which may lower the combustion temperature in the combustion chamber (193 °C for CS vs. 219 °C for WS, see Table 4), and affects simultaneously the boiler’s thermal efficiency, operational reliability and environmental performance (emissions from the unit) [24]. The Industrial Boiler Owners indicates that boiler efficiency can be increased by 1% for each 15% reduction in excess air [25]. It has also been demonstrated in the literature that biomass fuels with high ash content will produce more fly ash that may deposit on the surface of boiler tubes, which decrease the efficiency of heat transfer in the boiler [26]. A soot layer of 0.8 mm thick can reduce heat transfer by as much as 12% [27]. For biomass fuels with high ash content it is best to have an automatic heat exchanger cleaning system to maintain boiler efficiency.
Table 5. Energy balance for WS and CS 2012 combustion trials.
Biomass typeBiomassBoilerTankTotal lossesThermal
NCV (MJ)Accumulated (MJ)Output (MJ)Accumulated (MJ)(By difference) (MJ)Efficiency (%)
WS16,216117.79,5091,4005,19068.0
CS30,48172.813,332−96018,03640.8

3.5. Combustion Validation Trials Results

Table 6 reports data for three 30-bale validation combustion trials in 2013 with CS. Most of the time, combustion was conducted with a single bale at a time. However, two bales at a time were put in the boiler in some cases, especially during the night. Average bale mass was 175.4 kg (153.5 kg DM) and moisture content was 12.5%. With an average diameter and width of 1.4 m and 1.22 m, respectively, the dry matter density of CS bales in 2013 was 82.7 kg DM/m3, 21% lower than density of CS bales in 2012 (104.5 kg DM/m3). The first validation trial was conducted over a nine-day period where the average combustion period per bale was 412 min and average combustion rate was 27.1 kg DM/h. Trial 2 in 2013 was done over an effective period of 14 days. The average combustion time per bale was higher than trial 1 with 624 min/bale. Thus, the average combustion rate was lower at 19.0 kg DM/h. For the third trial, 12 days were necessary to burn the last 30 bales. The average interval between two bale loadings was longer (671 min) but the combustion rate was about the same as trial 2 (19.5 kg DM/h). These differences may be explained by the lower heating need during trial 3 (higher outdoor temperature) and longer overnight periods without loading.
Table 6. Average data for 30-bale CS combustion validation (2013 trials).
TrialMCBale massStart dateEnd dateDurationBurning rateExt. temp.
%kgkg DMmin/balekg DM/h°C
113.3182.4158.12013-01-302013-02-0841223.0−4.7
2a12.4176.4154.52013-02-172013-03-2362414.8−2.3
311.7167.5147.92013-04-122013-04-2353716.56.1
Ave.12.5175.4153.5--52417.6−0.3
a: Trial 2 was interrupted from 26 February until 17 March for mechanical maintenance (broken pump).
Compared to the 2012 trial, bales in 2013 were lighter (153.5 vs. 164.5 kg DM), had a lower density (82.7 vs. 104.4 kg DM/m3), and had a slightly lower moisture content (12.5 vs. 13.6%). Average combustion time per bale in 2013 was more than double and burning rate was half the value obtained in 2012. Even if average outdoor temperature was similar (0 vs. −0.3 °C), energy consumption was lower than in the 2012 trial. According to the farmer, more birds were placed in the barn, thus generating more of their own heat. Also, ventilation was improved, which keeps the barn drier, and less heat was required.
Table 7 reports total mass burned and ash produced in 2013. The average dry matter burned during each trial was 4605 kg over an average period of 262 h of continuous operation. Ash collected in 2013 represented 7.90%, 5.75% and 4.93% d.b. of total mass burned for trial 1, 2 and 3, respectively. The average 2013 CS ash content was lower (6.19%) than the 2012 CS ash content (9.17%); it was still higher than 2012 WS ash content (1.7% and 2.55% for PCT and individual bale trial, respectively). The average ash production rate with CS in 2013 was three times lower than in the CS 2012 trial (1.09 vs. 3.48 kg/h) but only twice more than WS (0.56 kg/h weighted average). Burning CS will require more maintenance than WS. However, with good production management practices (i.e., barn ventilation, flock size, clean stover harvest), biomass consumption can be lowered as well as boiler maintenance.
Table 7. Ash content and production rate for CS (2013 trials).
TrialBales burnedTotal mass burnedAccumulation periodAsh contentAsh production rate
kg DMhkg% d.b.kg/h
1304,743.2206.2374.67.901.82
2304,634.0312.2266.45.750.85
3304,437.9268.3219.04.930.82
Ave.304,605.0262.2286.76.191.09
Sum9013,815.0786.7860.0--

4. Conclusions

Combustion trials of WS and CS bales in two consecutive years in a Farm 2000 commercial boiler showed differences between biomass characteristics, energy balance, ash content and flue gas emissions. Both biomasses were relatively dry (14.6% and 13.6%), but CS bales harvested in 2011 with a variable chamber baler were 35% denser than WS bales harvested with a fixed chamber baler (104.5 vs. 77.1 kg DM/m3). CS bales harvested in 2012 with a fixed chamber baler had an average density of 82.7 kg DM/m3 which resulted in a more complete combustion with less ash and unburned residues. The heating system’s overall thermal efficiency was 68% with WS and 41% with high density CS in the first year. Ash content of CS was considerably higher than ash in WS in 2012 (9.2% for CS vs. 1.7% for a pre-combustion trial of WS and 2.55% for individual WS bale combustion trials in 2012). The lower density CS bales in the second year produced one third less ash and unburned residue (6.2%) than in the previous year with high density CS bales. The highest CO levels were observed with CS in the first year (average of 2725 mg/m3 with a peak at 8571 mg/m3) while NOx emissions were higher for WS (40.4 vs. 9.8 mg/m3). The limited insulation, heat losses in the flue gas, the high ash content of the biomasses and the basic combustion process controller (mainly for oxygen input) contributed to reduce overall system efficiency. Thus, the Farm 2000 has good potential for heat production using baled CS as a complementary energy source to WS if special attention is focused on harvesting methods to reduce ash content and to maintain low-to-medium bale density. These trials also highlighted the importance of using combustion technologies that are adapted to solid fuels in order to achieve lower emissions and higher thermal efficiency.

Acknowledgments

Authors acknowledge Agriculture and Agri-Food Canada (AAFC) and Natural Resources Canada through the Canadian Bioenergy Innovation Network for supporting this research. They also thank Tim Ansems for his excellent collaboration and access to his installations.

Conflicts of Interest

The authors declare no conflict of interest.

References

  1. Agriculture and Agri-Food Canada. Canada: Outlook for Principal Field Crops. Available online: http://www.agr.gc.ca/pol/mad-dam/index_e.php?s1=pubs&s2=fco-ppc&s3=php&page=fco-ppc_2013-04-17 (accessed on 17 April 2013).
  2. Lal, R. The role of residue management in sustainable agricultural systems. J. Sustain. Agric. 1995, 5, 51–78. [Google Scholar] [CrossRef]
  3. Wilhelm, W.W.; Johnson, J.M.E.; Karlen, D.L.; Lightle, D.T. Corn stover to sustain soil organic carbon further constrains biomass supply. Agron. J. 2007, 99, 1665–1667. [Google Scholar] [CrossRef]
  4. Lockeretz, W. Crop residues for energy: Comparative costs and benefits for the farmer, the energy facility, and the public. Energy Agric. 1982, 1, 71–89. [Google Scholar] [CrossRef]
  5. English, A.; Tyner, W.E.; Sesmero, J.; Owens, P.; Muth, D.J. Environmental tradeoffs of stover removal and erosion in Indiana. Biofuels Bioprod. Bioref. 2013, 7, 78–88. [Google Scholar] [CrossRef]
  6. Kludze, H.; Deen, B.; Weersink, A.; van Acker, R.; Janovicek, K.; De Laporte, A.; McDonald, I. Estimating sustainable crop residue removal rates and costs based on soil organic matter dynamics and rotational complexity. Biomass Bioenergy 2013, 56, 607–618. [Google Scholar] [CrossRef]
  7. Taheripour, F.; Tyner, W.E.; Fiegel, J. Development of Corn Stover Biofuel: Impacts on Corn and Soybean Markets and Land Rotation. In Proceedings of the Agricultural & Applied Economics Association’s AAEA & CAES Joint Annual Meeting, Washington, DC, USA, 4–6 August 2013.
  8. Bennett, A.S.; Bern, C.J.; Richard, T.L.; Anex, R.P. Corn grain drying using corn stover combustion and CHP systems. Trans. ASABE 2007, 50, 2161–2170. [Google Scholar] [CrossRef]
  9. Villeneuve, J.; Palacios, J.H.; Savoie, P.; Godbout, S. A critical review of emission standards and regulations regarding biomass combustion in small scale units (<3 MW). Bioresour. Technol. 2012, 111, 1–11. [Google Scholar]
  10. Leino, T.J.; Aho, M.J.; Gynther, S.J.; Ruuskanen, T.A.; Häkkinen, M.H. Experiences from a novel sensor for fireside corrosion monitoring during grate combustion of corn stover/wood chip blends. Energy Fuels 2013, 27, 5653–5662. [Google Scholar] [CrossRef]
  11. Leiser, S.; Cieplik, M.K.; Smit, R. Slagging behavior of straw and corn stover and the fate of potassium under entrained-flow gasification conditions. Energy Fuels 2012, 27, 318–326. [Google Scholar] [CrossRef]
  12. Lizotte, P.-L.; Savoie, P. Spring harvest of corn stover. Appl. Eng. Agric. 2011, 27, 697–703. [Google Scholar] [CrossRef]
  13. Sumner, H.R.; Sumner, P.E.; Hammond, W.C.; Monroe, G.E. Indirect-fired biomass furnace test and bomb calorimeter determinations. Trans. ASAE 1983, 26, 238–241. [Google Scholar] [CrossRef]
  14. Teisen Products Ltd. Farm 2000. Available online: http://www.farm2000.co.uk (accessed on 1 May 2013).
  15. Lizotte, P.-L.; Savoie, P. Spring harvest of corn stover for animal bedding with a self-loading wagon. Appl. Eng. Agric. 2013, 29, 25–31. [Google Scholar] [CrossRef]
  16. Solid Biofuels. Determination of Calorific Value; Standard Number BS EN 14918:2009; British Standards Institution: London, UK, 2010.
  17. Standard Test Methods for Proximate Analysis of Coal and Coke by Macro Thermogravimetric Analysis; ASTM D7582-10; ASTM International: West Conshohocken, PA, USA, 2010.
  18. Van Loo, S.; Koppejan, J. The Handbook of Biomass Combustion and Co-firing; Earthscan: London, UK, 2008. [Google Scholar]
  19. BIOBIB—A Database for Biofuels. Available online: http://cdmaster2.vt.tuwien.ac.at/biobib/biobib.html (accessed on 20 March 2012).
  20. Schmidt, A.; Zschetzsche, A.; Hantsch-Linhart, W. Analyse von biogenen Brennstoffen; TU Wien, Institut für Verfahrens-, Brennstoff- und Umwelttechnik: Vienna, Austria, 1993. [Google Scholar]
  21. Morissette, R.; Savoie, P.; Villeneuve, J. Combustion of corn stover bales in a small 146-kW boiler. Energies 2011, 4, 1102–1111. [Google Scholar] [CrossRef]
  22. Xiong, S.; Burvall, J.; Orberg, H.; Kalen, G.; Thyrel, M.; Ohman, M.; Boström, D. Slagging characteristics during combustion of corn stovers with and without kaolin and calcite. Energy Fuels 2008, 22, 3465–3470. [Google Scholar] [CrossRef]
  23. Beauchemin, P.A.; Tampier, M. Emissions from Wood-Fired Combustion Equipment; Envirochem Services Inc: North Vancouver, BC, Canada, 2008. [Google Scholar]
  24. Basu, P.; Cen, K.F.; Jestin, L. Boilers and Burners; Springer: New York, NY, USA, 2000. [Google Scholar]
  25. Guide to Low-Emission Boiler and Combustion Equipment Selection; ORNL/TM-2002/19; Oak Ridge National Laboratory (ORNL): Oak Ridge, TN, USA, 2002.
  26. Biedermann, F.; Obernberger, I. Ash-Related Problems during Biomass Combustion and Possibilities for a Sustainable Ash Utilization; Elsevier Ltd.: Oxford, UK, 2005. [Google Scholar]
  27. Cleaver-Brooks. Boiler Efficiency Guide. Available online: http://www.cleaver-brooks.com/uploadedFiles/Internet_Content/Reference_Center/Insights/Boiler%20Efficiency%20Guide.pdf (accessed on 14 October 2013).

