1. Introduction
Reservoirs are one of the most efficient tools for integrated water resource development and management. With the rapid development of the economy, the function of reservoirs has become more and more important to help meet society’s energy and water requirements. By altering the spatial and temporal distribution of runoff, reservoirs serve many purposes, such as flood control, hydropower generation, navigation, recreation,
etc. [
1]. Reservoir operation and management are one of the most complex problems for the integrated water resource development and management [
2]. Various reservoir operation models and method have been proposed and reviewed by many authors [
3,
4,
5,
6,
7]. However, it is difficult to find a single model or technique to solve the operation of a multi-reservoir system [
8].
Most of the reservoir systems in the world are still managed on fixed and predefined operating rules based on different simulation models. This is mainly due to institutional, rather than technological and mathematical limitations [
9,
10]. Simulation is a modeling technique that is used to approximate the behavior of a system on the computer, representing all the characteristics of the system largely by a mathematical or algebraic description [
4]. In a pure simulation model, reservoir releases are determined by a set of predetermined operating rules. A series of simulation rules can be modified and improved until model results are judged acceptable. The earliest simulation model appearing in the literature seems to be the study performed by the U.S. Army Corps of Engineers in 1953 for the operational study of six reservoirs on the Missouri River [
4]. Since then, simulation models have been widely used for planning and managing complex water resource systems.
In addition, optimization models involve allocating resources, developing stream flow regulation strategies and operating rules, and making real-time release decisions within the guidelines of the operating rules [
6]. Optimization models are commonly used for hydropower reservoir operations with different time scales, ranging from seasonal operation planning to daily, hourly, and real-time operations. An extensive literature exists on the application of optimization techniques to the operation of hydropower reservoir systems. Various optimization models based on linear programming (LP), non-linear programming (NLP), dynamic programming (DP), genetic algorithms (GA), artificial neural network (ANN),
etc., for reservoir operation are also very common in the academic literature [
11,
12,
13,
14,
15,
16,
17,
18,
19].
Since the hydropower reservoir operation is a stochastic and even highly nonlinear problem, DP is an appropriate choice [
20]. DP is an approach that divides the original optimization problem, with all of its variables, into a set of smaller optimization problems, each of which needs to be solved before the overall optimum solution to the original problem can be identified [
21]. A network of nodes and links can represent each discrete DP problem. DP methods find the best way to get to any node in that network. The nodes represent possible discrete states that can exist and links represent the decisions one could make to get from one state to another. DP is particularly suitable when dealing with sequential decision processes and presents several advantages [
21,
22]. However, the DP method not always represents a significant advantage, especially when dealing with multi-reservoir problems. One limitation of DP is its handling of multiple state variables. Each of these state variables would need to be discretized. As the number of state variable increases, the number of discrete combinations of state variable values increases exponentially. This is called the dynamic programming “curse of dimensionality”. This shortcoming typically limits the application of discrete dynamic programming to problems with three or four state variables. It has motivated many researchers to search for ways of reducing the number of possible discrete states required to find an optimal solution for large multi-state problems. Various modifications have been performed on the original DP formulation to mollify the “curse of dimensionality” of discrete dynamic programming, including coarse grid/interpolation techniques, dynamic programming successive approximations (DPSA), incremental dynamic programming (IDP) or discrete differential dynamic programming (DDDP) [
8]. Although these methods alleviate the dimensionality problem, they fail to vanquish it completely. Progressive optimality algorithm (POA) proposed by Howson and Sancho in 1975 is an effective method of reducing the dimensionality difficulties of multi-state decision problems [
23].
China is the world’s most populous country and has had a rapidly growing economy in the past thirty years. A stable, economic and clean energy system has been established to support sustainable economic and social development. As a clean, renewable, pollution-free and low cost energy, hydropower energy has been developed as a priority project. China has become the world’s largest producer of hydroelectric power, which plays an important role in China's energy development strategy. As a large number of cascade hydropower plants have been built in recent years, attention has been focused on improving the operational effectiveness and efficiency of multi-reservoir systems.
The purpose of this paper was to develop joint operation models for the Three Gorges cascade and Qingjiang cascade reservoirs based on the objective functions of maximizing hydropower generation and revenue. The progressive optimality algorithm is used to solve the models and the results are compared with design operation rules.
2. Three Gorges and Qingjiang Cascade Reservoirs
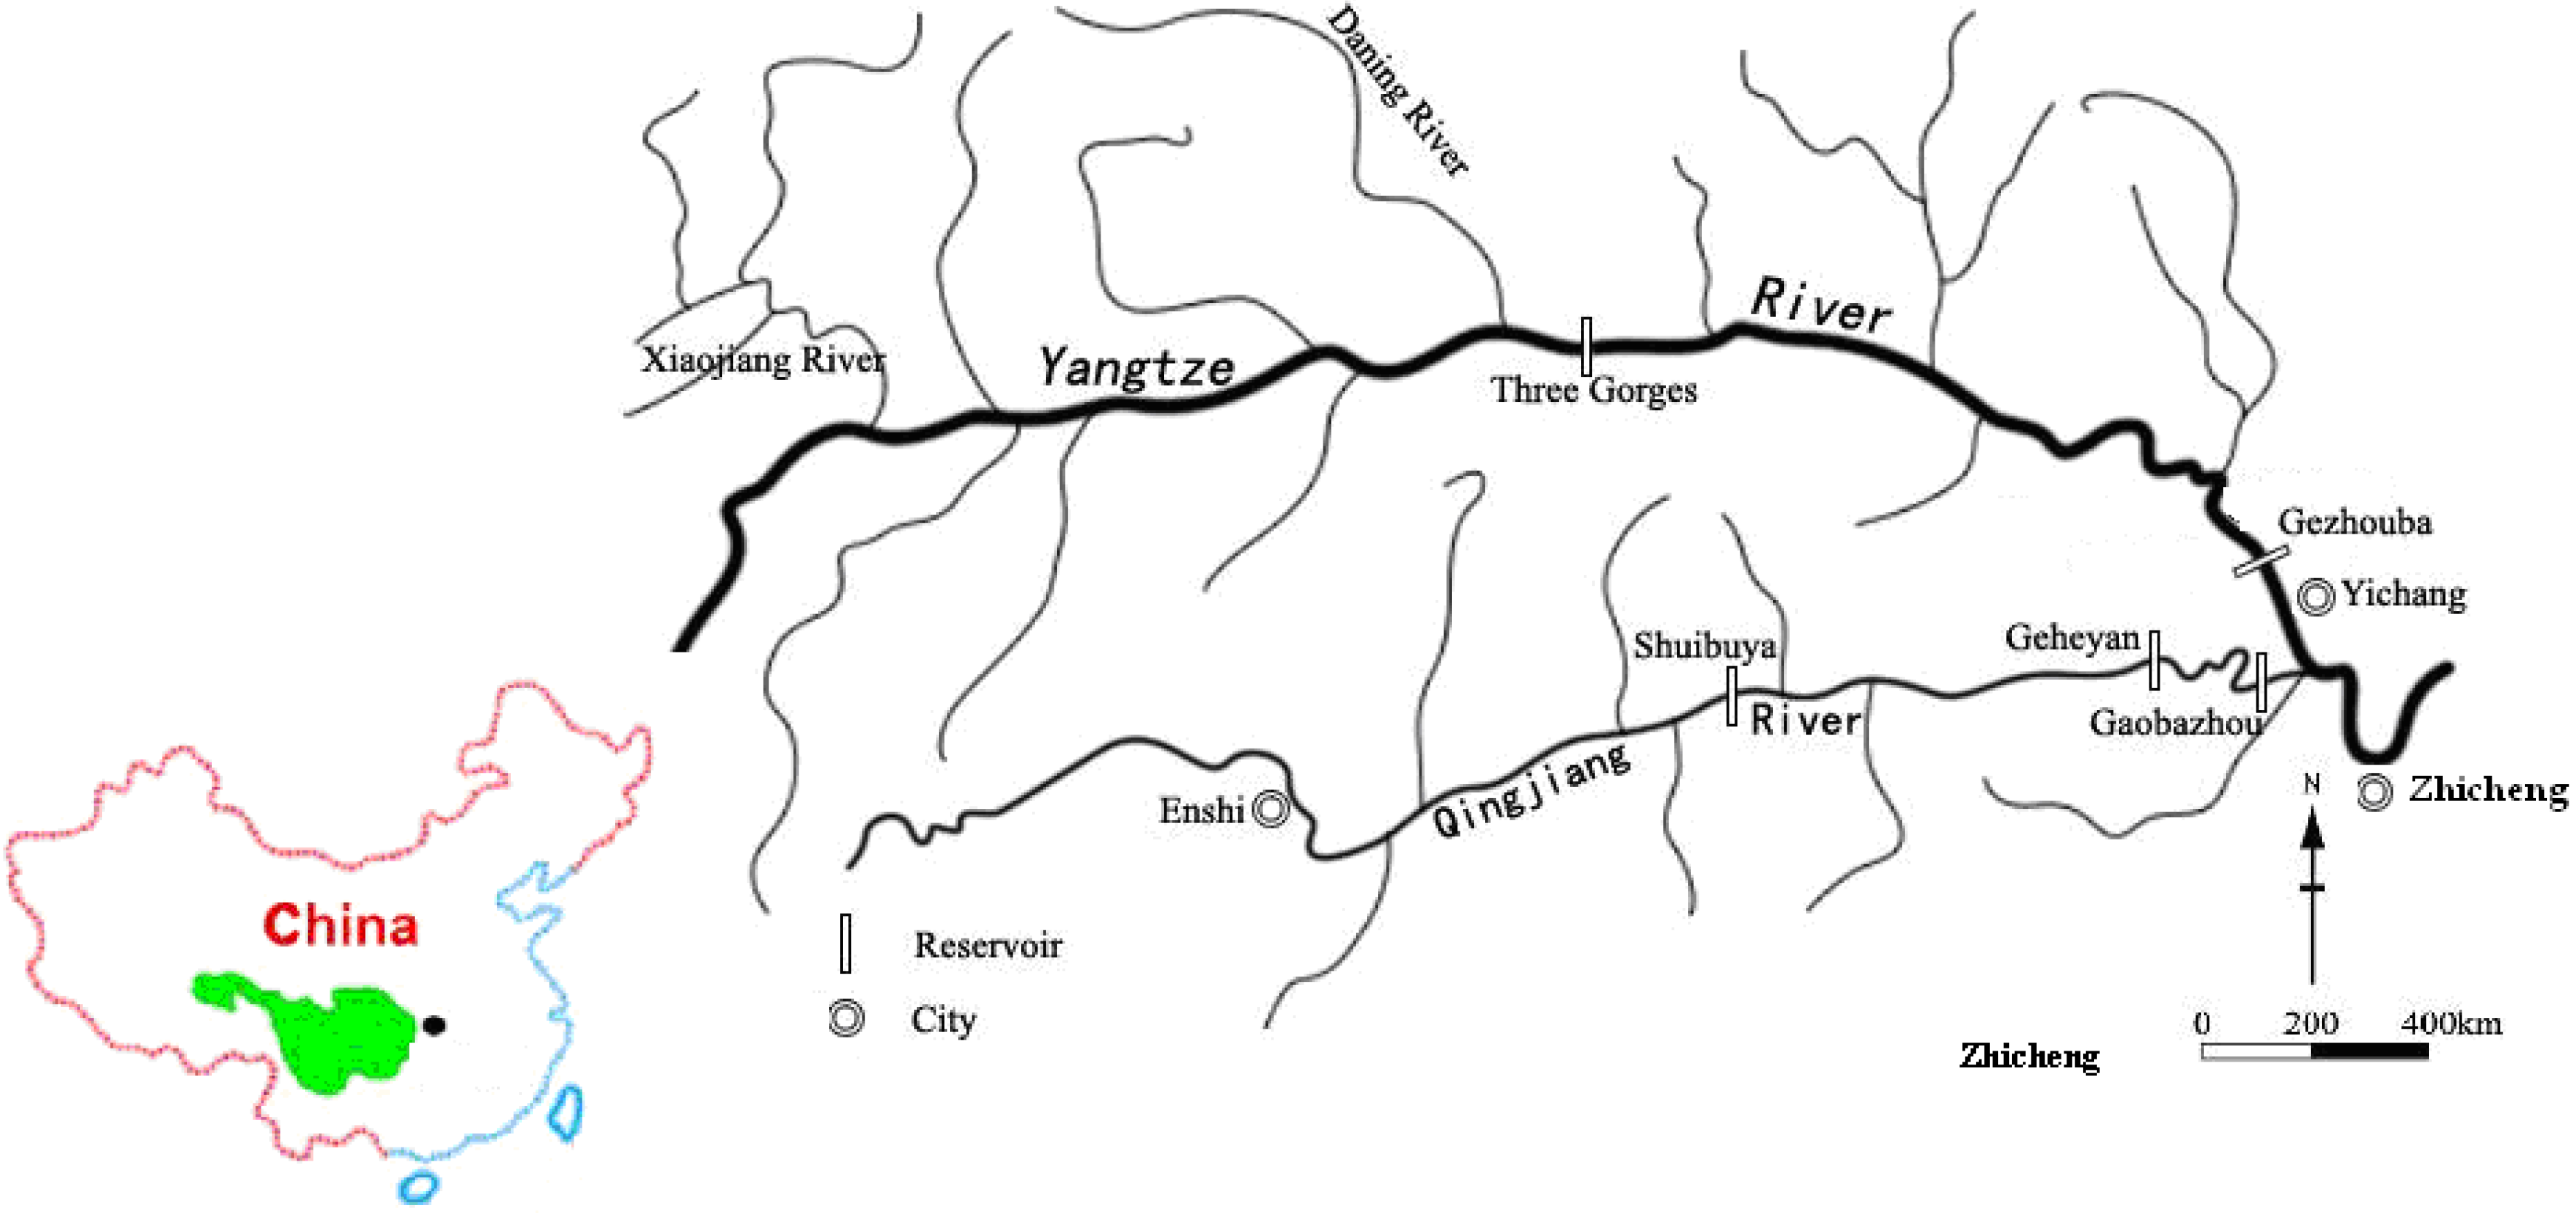
With a length of more than 6300 km, the Yangtze River is the largest river in China and the third in the world. It contains a huge hydropower resource, and 53.4% of the available amount can be developed. With the completion of the Three Gorges Project and Shuibuya reservoir in 2009, the world’s largest cascade hydropower plant was formed near the city of Yichang in Hubei Province. This multi-reservoir system consists of the Three Gorges cascade reservoirs (Three Gorges, Gezhouba) and the Qingjiang cascade reservoirs (Shuibuya, Geheyan, Gaobazhou). These five reservoirs are located in the same geographical and climatic zone. The total installed capacity is 24,200 MW and the average annual hydropower generation is 110 billion kWh. The location of Three Gorges cascade and Qingjiang cascade reservoirs is shown in
Figure 1.
The Three Gorges Reservoir (TGR) is a vitally important and backbone project in the development and harnessing of the Yangtze River in China. The upstream of Yangtze River is intercepted by the TGR, with a length of main course about 4.5 × 10³ km and drainage area of one million km2. The reservoir has a surface area of about 1080 km2, an average width of about 1100 m, a mean depth of about 70 m and a maximum depth near the dam of about 170 m. With all the profiles being narrow and deep, the TGR retains the long narrow belt shape of the original river section and is a typical river channel-type reservoir. The TGR is the largest water conservancy project ever undertaken in the world, with a normal pool level at 175 m and a total reservoir storage capacity of 39.3 billion m3, of which 22.15 billion m3 is flood control storage and 16.5 billion m3 is a conservation regulating storage volume, accounting for approximately 3.7% of the dam site mean annual runoff of 451 billion m3. The project consists of three major parts, i.e., the large dam across the Yangtze River, the hydropower plants and the navigation structures. There are 14 and 12 sets of hydraulic turbo generators installed in the left and right powerhouses, respectively. Thus the 26 sets of hydraulic turbo generators, with 700 MW for each set, total 18,200 MW installed capacity, will produce an annual electricity output of 84.7 billion kWh.
Figure 1.
The location of the Three Gorges cascade and Qingjiang cascade reservoirs.
Figure 1.
The location of the Three Gorges cascade and Qingjiang cascade reservoirs.
The Gezhouba reservoir is located at the lower end of the TGR in the suburbs of Yichang City, 38 km downstream of the TGR. The dam is 2606 m long and 53.8 m high, with a total storage capacity of 1.58 billion m3 and a maximum flood discharging capability of 110,000 m3/s. The two hydropower plants have 21 generating units with a total installed capacity of 2715 MW and an annual output of 15.7 billion kWh.
The Qingjiang River is one of the main tributaries of Yangtze River and its basin area is 17,600 km
2. The mean annual rainfall, runoff depth and annual runoff are approximately 1460 mm, 876 mm and 423 m
3/s, respectively. The total length of the mainstream is 423 km with a hydraulic drop of 1430 m. Along the Qingjiang River, a three-step cascade of reservoirs (Shuibuya, Geheyan and Gaobazhou) has been constructed from upstream to downstream. The main functions of these cascade reservoirs are power generation and flood control. The characteristic parameter values of these five reservoirs are given in
Table 1.
Table 1.
List of characteristic parameter values of these five reservoirs.
Table 1.
List of characteristic parameter values of these five reservoirs.
| Reservoir | Unit | TGR | Gezhouba | Shuibuya | Geheyan | Gaobazhou |
|---|
| Total storage | 108 m3 | 393 | 15.8 | 42 | 34 | 5.4 |
| Flood control storage | 108 m3 | 221.5 | - | 5.0 | 5.0 | - |
| Crest elevation | m | 185 | 70 | 409 | 206 | 83 |
| Normal water level | m | 175 | 66 | 400 | 200 | 80 |
| Flood limited water level | m | 145.0 | - | 391.8 | 193.6 | - |
| Install capability | MW | 18200 | 2715 | 1840 | 1212 | 270 |
| Average price | Yuan/kWh | 0.250 | 0.175 | 0.380 | 0.360 | 0.414 |
| Annual generation | billion kWh | 84.7 | 15.7 | 3.41 | 3.04 | 0.93 |
| Regulation ability | | seasonal | daily | multi-year | annual | daily |
3. Joint Operation Models
The aim of joint operation for the Three Gorges and Qingjiang Cascade reservoirs is to obtain as much hydropower revenue as possible in an electricity market. For comparative study, maximum hydropower generation and maximum hydropower revenue are both chosen as objective functions, respectively.
3.1. Maximum Hydropower Generation
If all hydropower plants meet the required water supply and initial power supply, the objective is to generate maximum power from the whole system. The objective function can be described as follows:
where
T is the total number of the computation time interval index;
n is the total number of reservoirs in the multi-reservoir system;
i is the index for the number of reservoirs; Δ
t is the time interval;
t is the index for the current period;
Pt is the output of power in the
tth period;
ηi,t is the hydropower generation efficiency of
ith reservoir in
tth period;
is the release through the reservoir turbines of the
ith reservoir in the
tth period;
Hi,t is the difference between reservoir water level and tail-race water level of
ith reservoir in
tth period;
E is the sum of the hydropower generation of the reservoirs.
3.2. Maximum Hydropower Revenue
Considering the constraints of the electric power system of hydropower plants, the adjusted objective function can be written as:
where
F is the revenue of reservoirs;
Ei,t is the sum of hydropower generation of the
ith reservoir in the
tth period;
Ci,t is the price of hydropower generation of the
ith reservoir in the
tth period.
3.3. Subject to the Following Constraints
(1) Water balance equation:
(2) Reservoir water level limits:
(3) Comprehensive utilization of water required at downstream reservoir limits:
(4) Power generation limits:
(5) Boundary conditions limit:
Where
Vi,t is the storage of the
ith reservoir in the
tth period;
Ii,t is the inflow of the
ith reservoir in the
tth period;
Qi,t is the average of outflow of the
ith reservoir in the
tth period;
EPi,t is the sum of evaporation and leakage of the
ith reservoir in the
tth period;
Zi,t is the water level of the
ith reservoir in the
tth period;
ZLi,t is the minimum water level of the
ith reservoir in the
tth period;
ZUi,t is the maximum water level of the
ith reservoir in the
tth period;
QLi,t is the minimum discharge capacity of the
ith reservoir for downstream ecological requirements in the
tth period;
QUi,t is the maximum discharge capacity of the
ith reservoir in the
tth period and it is limited by the downstream flood prevention limitations;
Ni,t is the output of power of the
ith reservoir in the
tth period;
NXi,t is the installed capacity of the
ith reservoir;
PLi,t is the firm capacity of the
ith reservoir in the
tth period;
PUi,t is the maximum power capacity limit of the
ith reservoir in the
tth period;
Zi,1 is the water level at the of the
ith reservoir at first period;
Zi,b is the water level of the
ith reservoir at the beginning;
Zi,T+1 is the water level of the
ith reservoir at the (
T+1) th period; and
Zi,e is the water level of the
ith reservoir at the end. The constraint conditions of flood control for optimal models as follows: (a) the existing constraint conditions of every reservoir should be satisfied; (b) the discharge in the Zhicheng hydrological control station should not exceed 56,700 m
3/s.
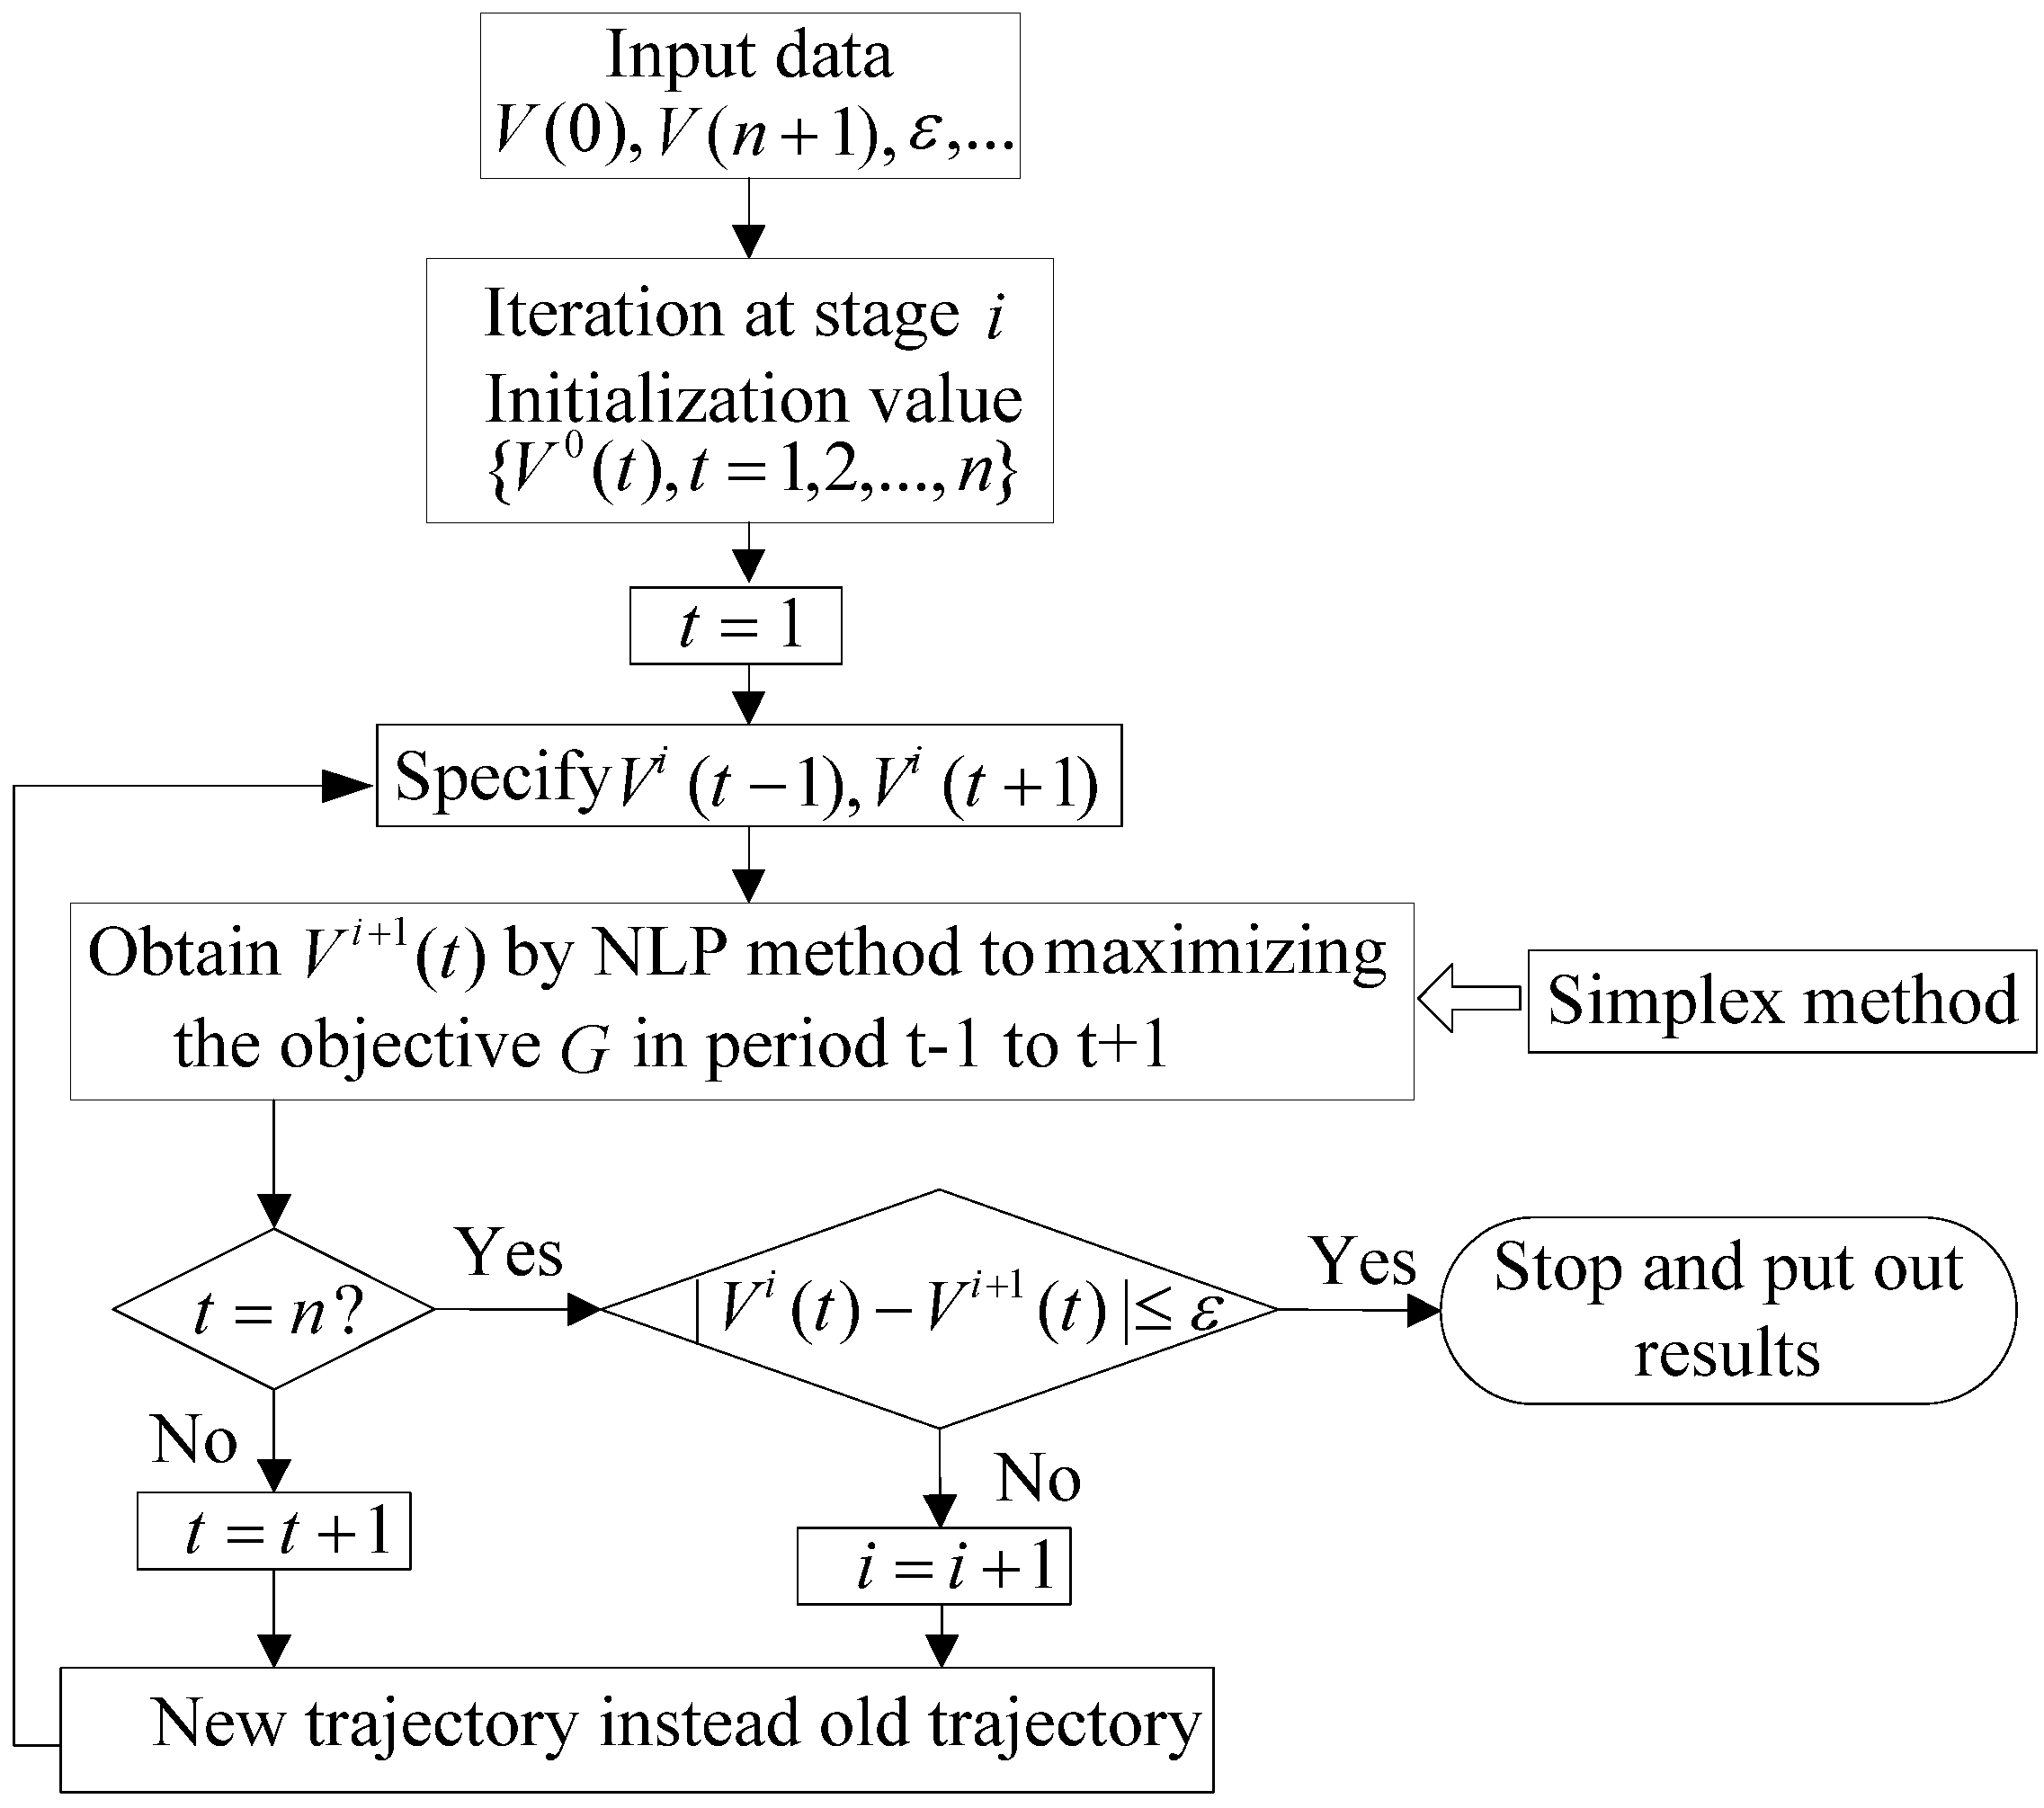
3.4. Progressive Optimality Algorithm
The POA divides a multi-stage problem into several two-stage problems. It can be described iteratively to solve the optimization of a two-stage problem, while the other stage variables remain fixed. After solving the problem at the stage below, the next two-stage problem will be considered, and the optimal result of the previous stage problem is the next initial condition. The algorithm continues its iterations until the difference between the current value of every state variable and the value at the last iteration is less than the specified precision limit. When this condition is reached, the resulting values represent the optimal path as they satisfy the principle of progressive optimality.
The simplex method is one of the best known algorithms for multidimensional constrained optimization [
23,
24]. The method does not require any derivative information, which makes it suitable for problems with non-smooth functions. It can also be used for problems with discontinuous functions, which occur frequently in statistics and experimental mathematics. The simplex method frequently gives significant improvements in the first iterations and quickly produces quite satisfactory results.
Howson and Sancho [
25] have given the detail description of the POA algorithm and shown that the solution obtained is optimal. Turgeon used the principle of progressive optimality to minimize total production cost (including power imports and exports) of a multi-reservoir system [
26]. Since the joint operation of Three Gorges and Qingjiang cascade reservoirs is a multi-dimensional and multi-stage optimization problem, POA was selected and used to solve the proposed model. The initial values were chosen based on the operation results of the design rules.
For clarity, we will use the following terminology throughout: K is the length of the time series; I1, I2,…,Ik−1 is the inflow series of reservoir; Z1 is the initial water level, Zn+1 is the final water level; B(VK−1,VK) is the benefit from the (K−1)th period to Kth period; VK,VK−1 are the storages in the Kth and (K−1)th period. The algorithm to be described iteratively solves this optimization of a two-stage problem, i.e.,
The optimization of reservoir operation proceeds is illustrated in
Figure 2.
Figure 2.
Sketch of progressive optimality algorithm (POA) to solve the reservoirs’ optimal operation.
Figure 2.
Sketch of progressive optimality algorithm (POA) to solve the reservoirs’ optimal operation.
4. Results and Discussion
The inflows of the Three Gorges cascade and Qingjiang cascade reservoirs from five consecutive years (from 1982 to 1987) were selected for comparative study. The 1982–1983 period corresponded to wet years, 1984–1985 were normal years and 1986–1987 were dry years. These five years represent different meteorological and hydrological characteristics as well as reservoir release patterns. The proposed model has been successfully applied to the multi-reservoir system and daily data is used in this study. For comparative study, three different operation modes are selected and described as follows:
- (1)
Operation based on reservoir design rules;
- (2)
Optimal operation of individual cascade reservoirs;
- (3)
Joint optimal operation of two cascade reservoirs.
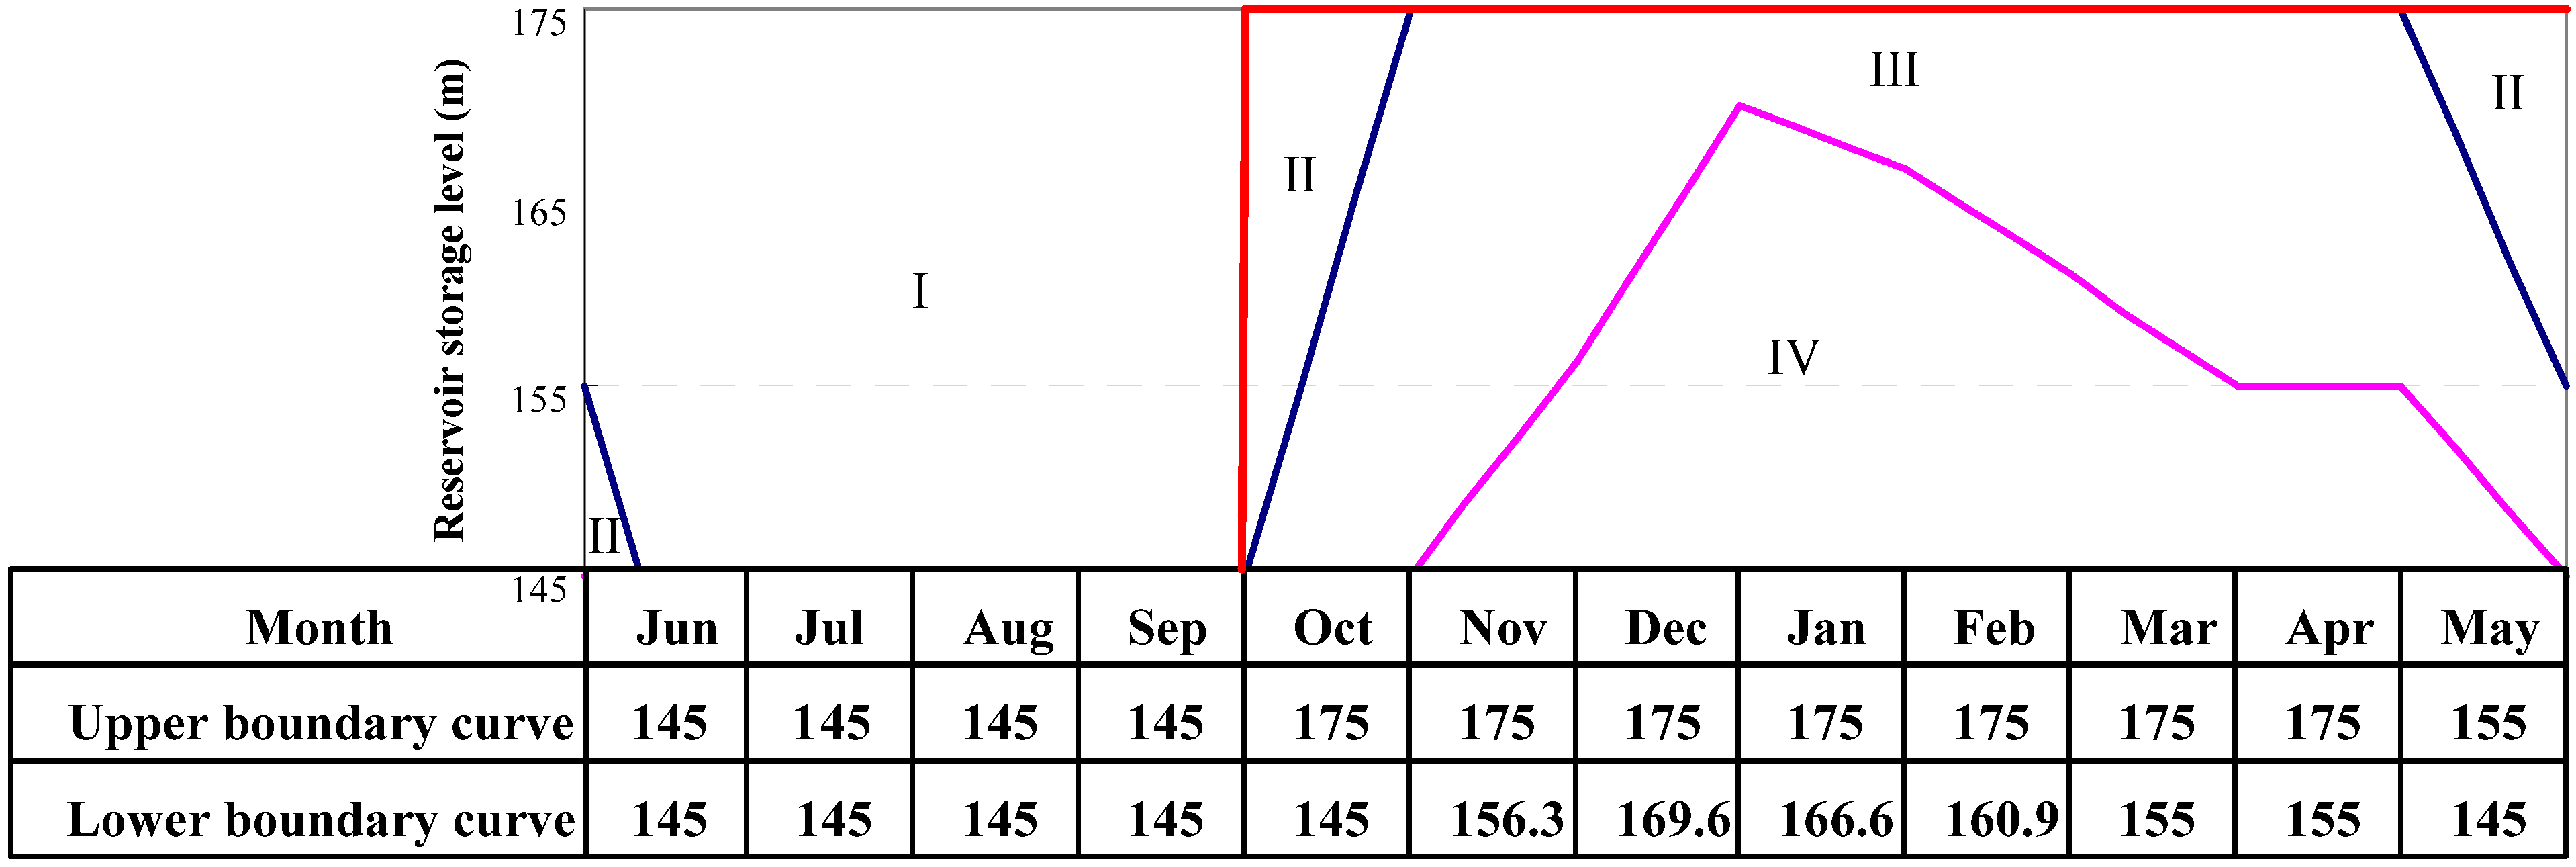
Only the designed operating rule curves of the Three Gorges reservoir and Shuibuya reservoir have been described briefly. The designed operating rule curves of the Three Gorges reservoir is shown in
Figure 3. From the end of May to the beginning of June, the reservoir water level will be lowered to 145 m (flood limited water level, FLWL). In October, the reservoir water level will be raised gradually to the normal pool level of 175 m. From November to the end of April in the following year, the reservoir should be kept at as high water level as possible to generate more electrical power. The reservoir water level will be lowered further, but should not fall below 155 m before the end of April to satisfy navigation conditions.
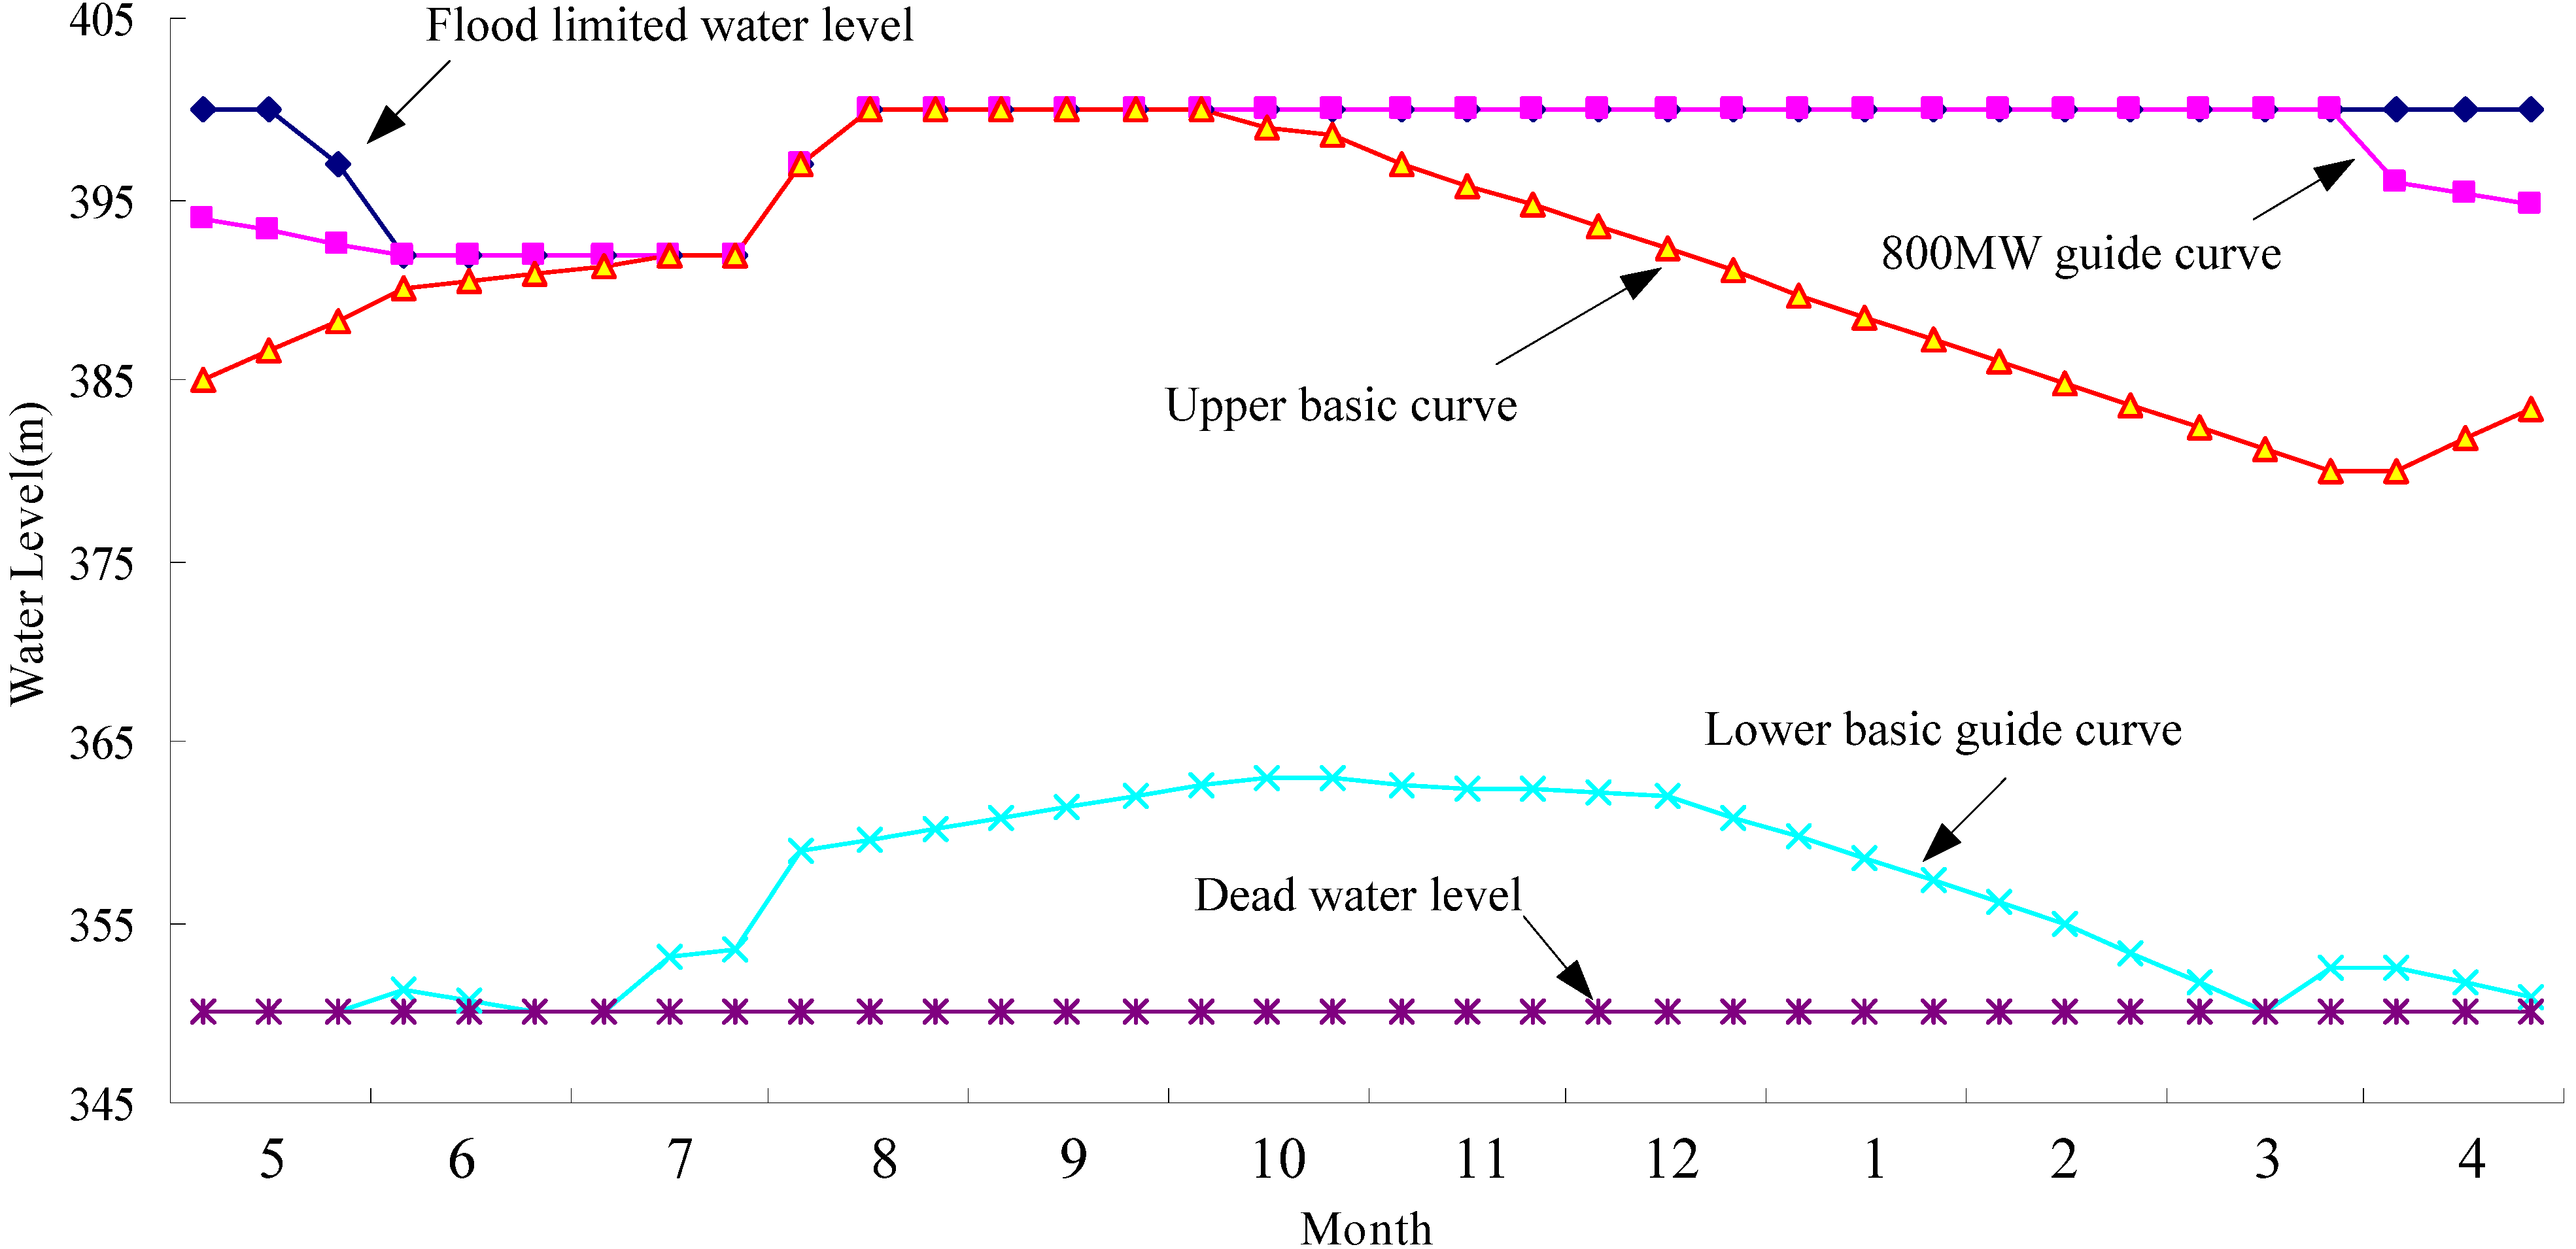
The designed operating rule curves of the Shuibuya reservoir are shown in
Figure 4, in which the whole storage space is divided into five operational zones. If the water level rises to FLWL or into the flood prevention zone during flood season, the reservoir is operated according to designed flood control rules. Otherwise, the hydropower plant is operated between the upper and lower basic guide curves.
Figure 3.
Designed operating rule curves of the Three Gorges reservoir.
Figure 3.
Designed operating rule curves of the Three Gorges reservoir.
Figure 4.
Designed operating rule curves of the Shuibuya reservoir.
Figure 4.
Designed operating rule curves of the Shuibuya reservoir.
Choosing maximum hydropower generation as the objective function, the results of annual hydropower generation (HG) and spilled water (SW) calculated by these three operation modes are summarized in
Table 2. It is shown that joint operation of two cascade reservoirs can generate extra power (5.992 billion kWh, or an increase of 5.70%) annually in comparison with operation based on reservoir design rules, and can generate 2.158 billion kWh of extra power or an increase of 1.98% annually in comparison with the optimal individual operation of the cascade reservoirs. Between them, the Qingjiang and Three Gorges cascade reservoirs could generate an extra 0.804 billion kWh and 5.189 billion kWh, respectively, compared with design rules. The total spilled water by the joint operation of the two cascade reservoirs is reduced to about 84.125 billion m
3, of which the Qingjiang and Three Gorges cascade reservoirs are reduced by 5.384 billion m
3 and 78.741 billion m
3, respectively.
Table 2.
Estimated hydropower generation (billion kWh) and spilled water (billion m3) by the objective function of maximum hydropower generation.
Table 2.
Estimated hydropower generation (billion kWh) and spilled water (billion m3) by the objective function of maximum hydropower generation.
| Mode | | Qingjiang Cascade | | Three Gorges Cascade | | Total | Total Revenue |
|---|
| | Shuibuya | Geheyan | Gaobazhou | Subtotal | Three Gorges | Gezhouba | Subtotal | (billionYuan) |
|---|
| (1) | HG | 4.142 | 3.409 | 0.922 | 8.473 | 83.486 | 13.097 | 96.583 | 105.056 | 26.336 |
| SW | 0.899 | 1.860 | 4.340 | 7.100 | 48.501 | 154.565 | 203.066 | 210.166 | |
| (2) | HG | 4.420 | 3.665 | 1.097 | 9.181 | 84.507 | 15.202 | 99.709 | 108.890 | 27.229 |
| SW | 0.351 | 0.460 | 1.263 | 2.074 | 46.720 | 97.393 | 144.113 | 146.186 | |
| (3) | HG | 4.406 | 3.748 | 1.122 | 9.277 | 86.168 | 15.604 | 101.772 | 111.048 | 27.750 |
| SW | 0.348 | 0.453 | 0.914 | 1.716 | 38.184 | 86.141 | 124.325 | 126.040 | |
| (2)/(1) | HG | 0.278 | 0.256 | 0.175 | 0.708 | 1.021 | 2.105 | 3.126 | 3.834 | 0.893 |
| | 6.70% | 7.51% | 18.96% | 8.36% | 1.22% | 16.07% | 3.24% | 3.65% | 3.39% |
| SW | −0.548 | −1.400 | −3.078 | −5.026 | −1.781 | −57.172 | −58.953 | −63.980 | |
| | −60.97% | −75.27% | −70.91% | −70.79% | −3.67% | −36.99% | −29.03% | −30.44% | |
| (3)/(1) | HG | 0.264 | 0.339 | 0.200 | 0.804 | 2.682 | 2.507 | 5.189 | 5.992 | 1.414 |
| | 6.38% | 9.96% | 21.68% | 9.48% | 3.21% | 19.14% | 5.37% | 5.70% | 5.37% |
| SW | −0.551 | −1.407 | −3.426 | −5.384 | −10.317 | −68.424 | −78.741 | −84.125 | |
| | −61.32% | −75.63% | −78.93% | −75.84% | −21.27% | −44.27% | −38.78% | −40.03% | |
| (3)/(2) | HG | −0.014 | 0.083 | 0.025 | 0.095 | 1.661 | 0.402 | 2.063 | 2.158 | 0.521 |
| | −0.31% | 2.28% | 2.29% | 1.04% | 1.97% | 2.64% | 2.07% | 1.98% | 1.91% |
| SW | −0.003 | −0.007 | −0.348 | −0.358 | −8.536 | −11.252 | −19.788 | −20.146 | |
| | −0.88% | −1.43% | −27.58% | −17.27% | −18.27% | −11.55% | −13.73% | −13.78% | |
The hydropower generation and spilled water during flood season (FS) and non-flood season (NFS) were also estimated and are listed in
Table 3 and
Table 4. Compared with operation based on reservoir design rules, the joint operation of two cascade reservoirs can generate an extra 2.908 billion kWh during the flood season and 3.084 billion kWh during the non-flood season. During the flood season, the Qingjiang and Three Gorges cascade reservoirs are increased by 0.867 billion kWh and 2.041 billion kWh; while in non-flood season, they are increased by 0.036 billion kWh and 3.148 billion kWh, respectively. Correspondingly, as shown in
Table 4 the spilled water of the Qingjiang and Three Gorges cascade reservoirs is reduced about 5.049 billion m
3 and 66.067 billion m
3 in the flood season, and about 0.336 billion m
3 and 12.674 billion m
3 in the non-flood season, respectively. Therefore, joint operation of two cascade reservoirs can not only increase hydropower generation, but also can improve water utilization efficiency significantly, especially during the flood season.
Table 3.
Estimated hydropower generation (billion kWh) by objective function of maximum hydropower generation during flood season and non-flood season.
Table 3.
Estimated hydropower generation (billion kWh) by objective function of maximum hydropower generation during flood season and non-flood season.
| Mode | | Qingjiang Cascade | Three Gorges Cascade | Total |
|---|
| | Shuibuya | Geheyan | Gaobazhou | Subtotal | Three Gorges | Gezhouba | Subtotal |
|---|
| (1) | FS | 1.965 | 1.135 | 0.239 | 3.339 | 41.435 | 4.671 | 46.106 | 49.445 |
| NFS | 2.177 | 2.274 | 0.683 | 5.034 | 42.051 | 8.426 | 50.477 | 55.611 |
| (2) | FS | 1.999 | 1.702 | 0.484 | 4.185 | 39.853 | 6.431 | 46.283 | 50.469 |
| NFS | 2.420 | 1.963 | 0.613 | 4.996 | 44.654 | 8.772 | 53.425 | 58.421 |
| (3) | FS | 2.006 | 1.701 | 0.500 | 4.206 | 41.355 | 6.792 | 48.146 | 52.353 |
| NFS | 2.401 | 2.048 | 0.622 | 5.070 | 44.813 | 8.812 | 53.625 | 58.695 |
| (2)/(1) | FS | 0.034 | 0.568 | 0.245 | 0.846 | −1.582 | 1.760 | 0.178 | 1.024 |
| NFS | 0.243 | −0.312 | −0.070 | −0.038 | 2.603 | 0.346 | 2.948 | 2.810 |
| (3)/(1) | FS | 0.041 | 0.566 | 0.261 | 0.867 | −0.080 | 2.121 | 2.041 | 2.908 |
| NFS | 0.224 | −0.226 | −0.061 | 0.036 | 2.762 | 0.386 | 3.148 | 3.084 |
| (3)/(2) | FS | 0.006 | −0.002 | 0.017 | 0.021 | 1.502 | 0.361 | 1.863 | 1.884 |
| NFS | −0.020 | 0.085 | 0.009 | 0.074 | 0.159 | 0.041 | 0.200 | 0.274 |
Table 4.
Estimated spilled water (billion m3) by objective function of maximum hydropower generation during flood season and non-flood season.
Table 4.
Estimated spilled water (billion m3) by objective function of maximum hydropower generation during flood season and non-flood season.
| Mode | | Qingjiang Cascade | Three Gorges Cascade | Total |
|---|
| | Shuibuya | Geheyan | Gaobazhou | Subtotal | Three Gorges | Gezhouba | Subtotal |
|---|
| (1) | FS | 0.879 | 1.783 | 4.090 | 6.752 | 41.254 | 144.874 | 186.128 | 192.880 |
| NFS | 0.020 | 0.078 | 0.250 | 0.348 | 7.247 | 9.691 | 16.938 | 17.286 |
| (2) | FS | 0.351 | 0.460 | 1.216 | 2.027 | 46.720 | 92.066 | 138.786 | 140.813 |
| NFS | 0.000 | 0.000 | 0.047 | 0.047 | 0.000 | 5.327 | 5.327 | 5.373 |
| (3) | FS | 0.348 | 0.453 | 0.902 | 1.703 | 38.184 | 81.877 | 120.061 | 121.764 |
| NFS | 0.000 | 0.000 | 0.012 | 0.012 | 0.000 | 4.264 | 4.264 | 4.276 |
| (2)/(1) | FS | −0.528 | −1.323 | −2.875 | −4.725 | 5.466 | −52.808 | −47.342 | −52.067 |
| NFS | −0.020 | −0.078 | −0.203 | −0.301 | −7.247 | −4.365 | −11.611 | −11.913 |
| (3)/(1) | FS | −0.531 | −1.329 | −3.188 | −5.049 | −3.070 | −62.997 | −66.067 | −71.116 |
| NFS | −0.020 | −0.078 | −0.238 | −0.336 | −7.247 | −5.427 | −12.674 | −13.010 |
| (3)/(2) | FS | −0.003 | −0.007 | −0.314 | −0.323 | −8.536 | −10.190 | −18.725 | −19.049 |
| NFS | 0.000 | 0.000 | −0.035 | −0.035 | 0.000 | −1.062 | −1.062 | −1.097 |
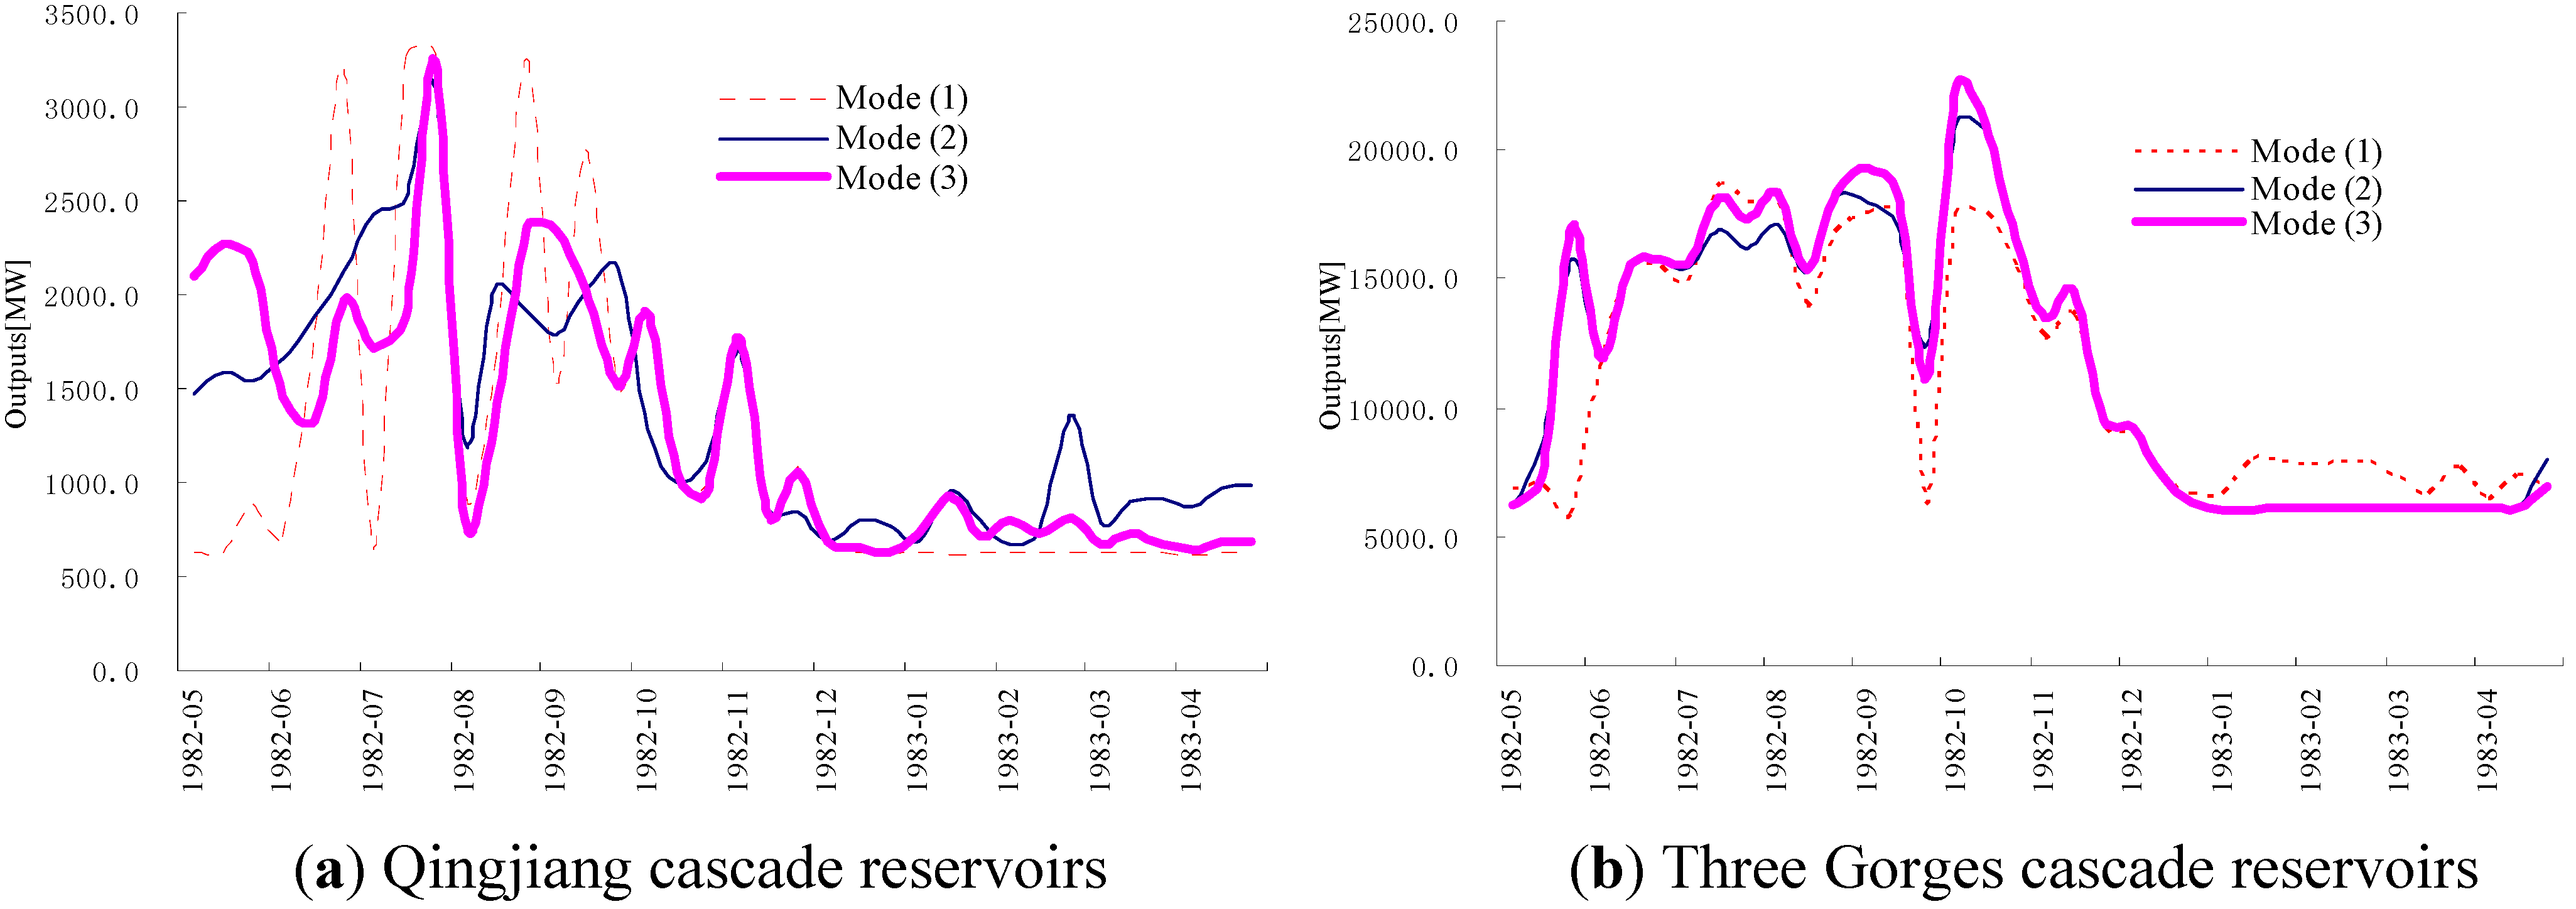
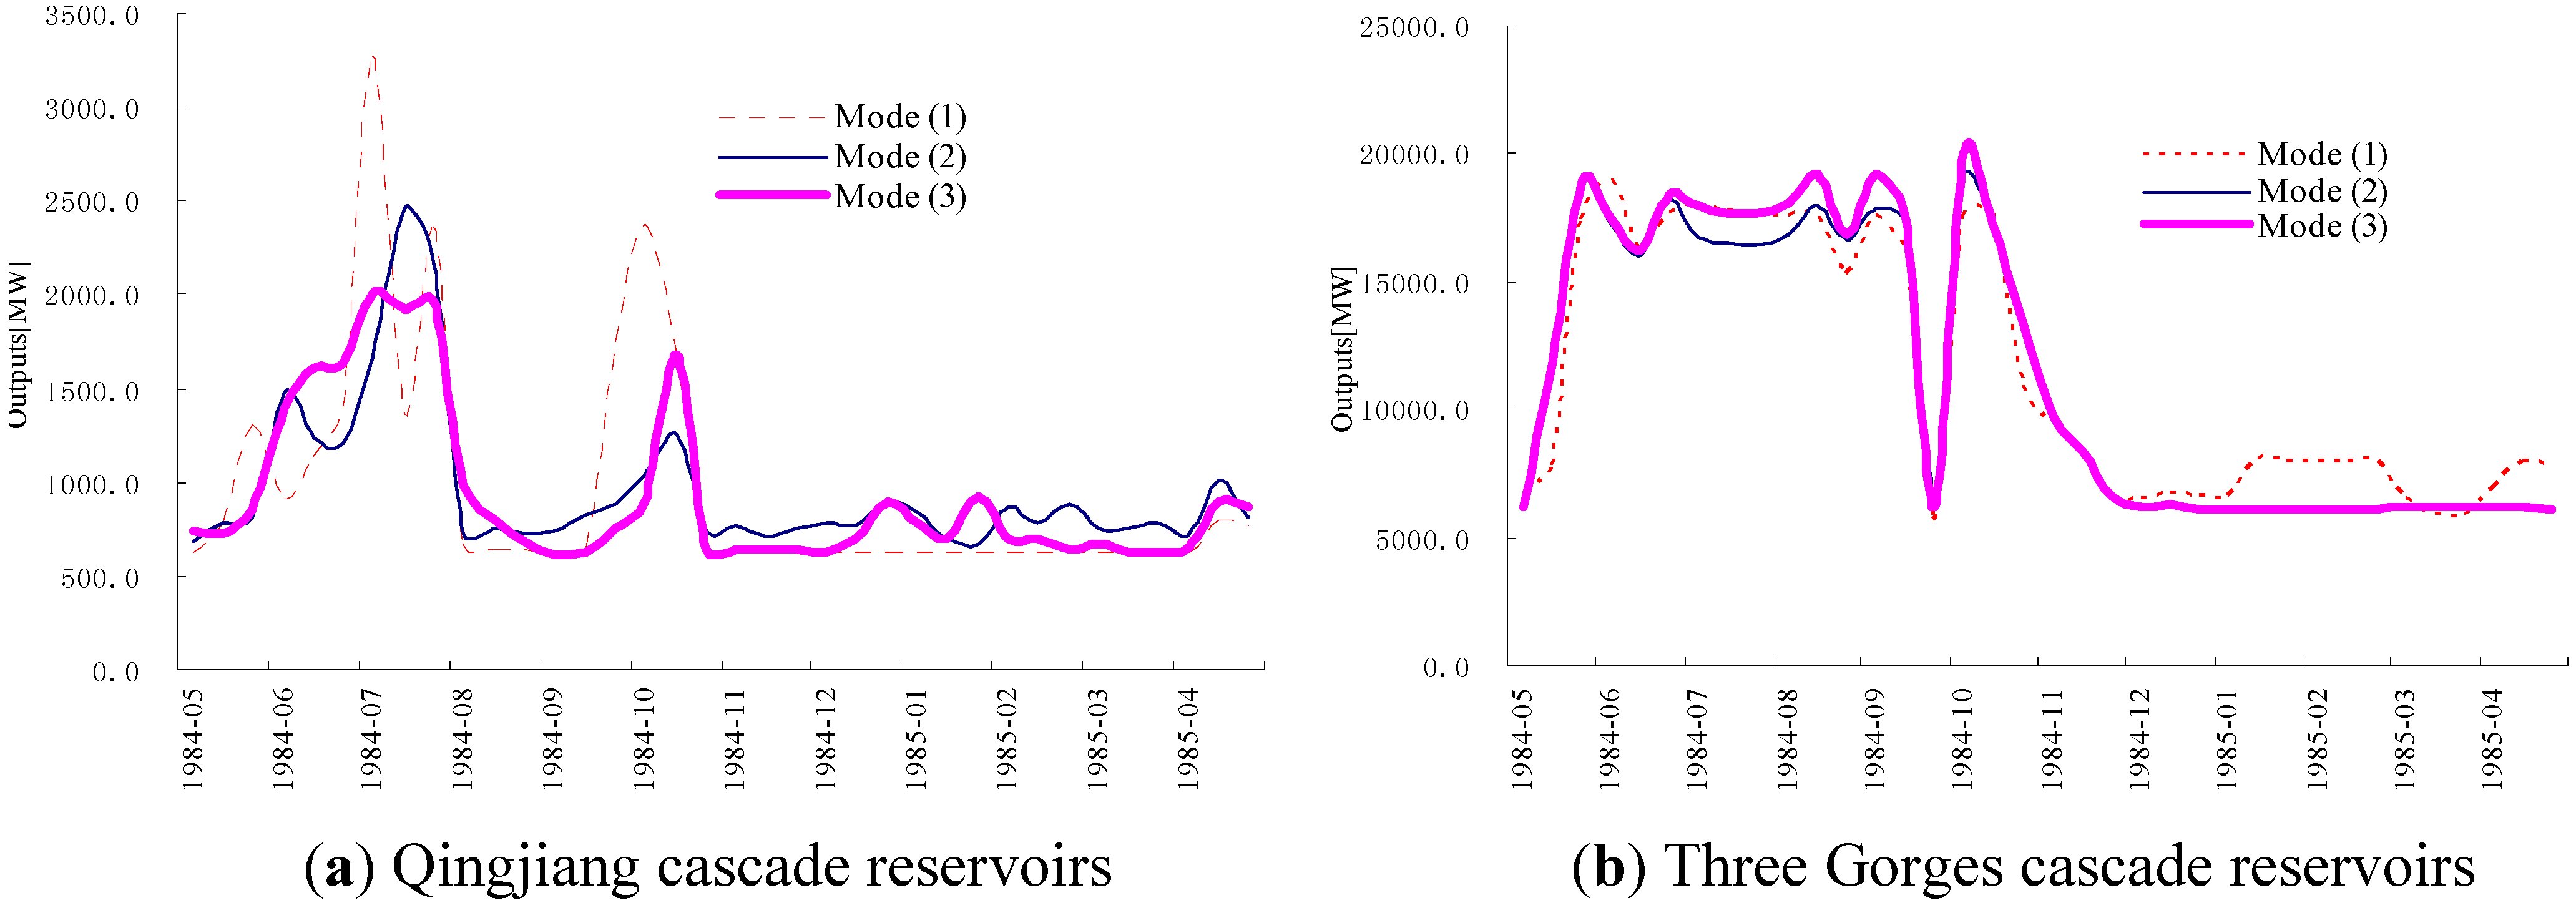
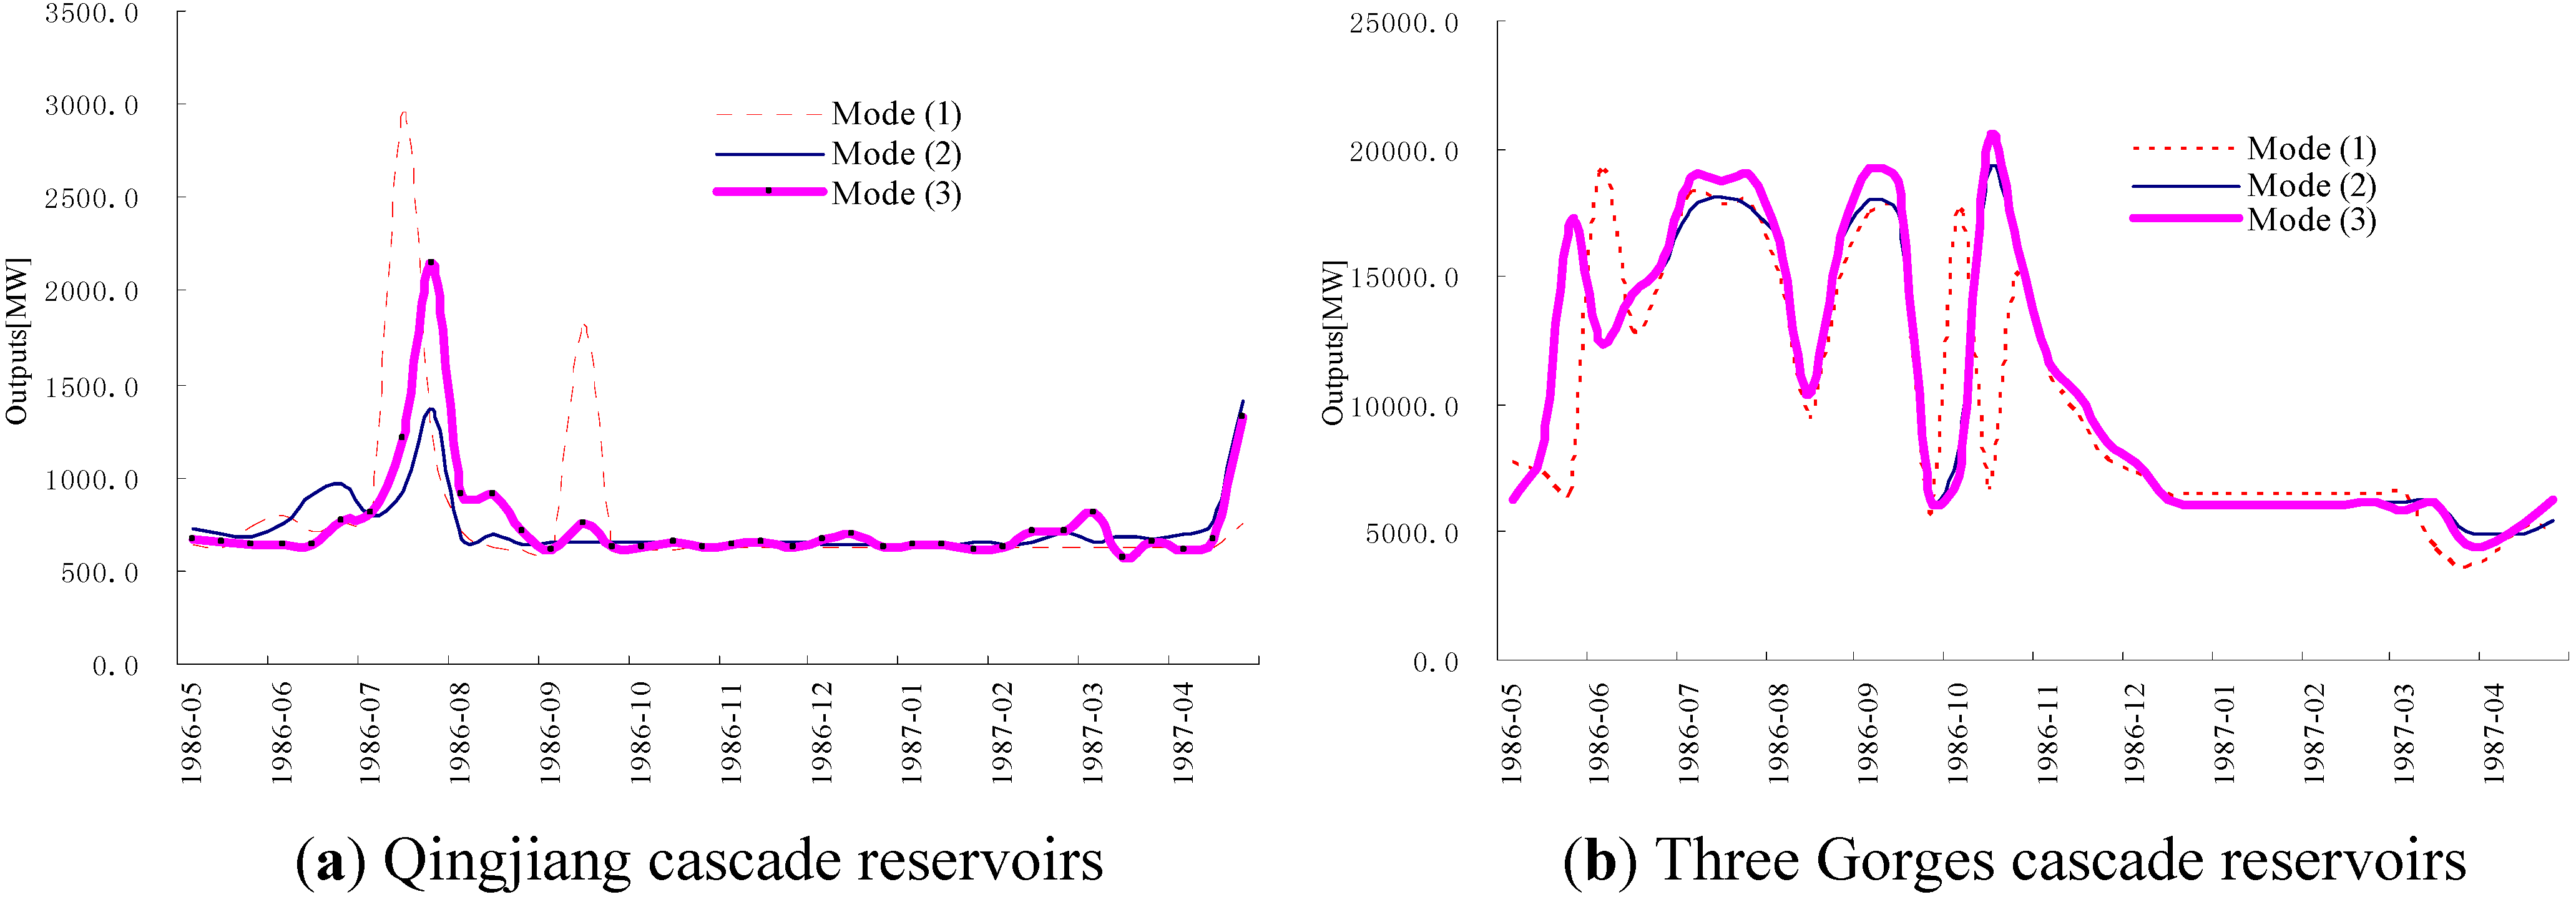
The hydropower outputs of the three operation modes for the Qingjiang cascade and Three Gorges cascade reservoirs in wet years, normal years and dry years are shown in
Figure 5,
Figure 6 and
Figure 7, respectively.
Figure 5.
Comparison of the outputs for three operation modes (wet year).
Figure 5.
Comparison of the outputs for three operation modes (wet year).
Figure 6.
Comparison of the outputs for three operation modes (normal year).
Figure 6.
Comparison of the outputs for three operation modes (normal year).
Figure 7.
Comparison of the outputs for three operation modes (dry year).
Figure 7.
Comparison of the outputs for three operation modes (dry year).
As shown in
Figure 5a,
Figure 6a and
Figure 7a, the outputs of the Qingjiang cascade reservoirs under operation mode (3) are larger than that of operation mode (2) during the flood season, and less than that during the non-flood season.
Figure 5b,
Figure 6b and
Figure 7b show that the outputs of the Three Gorges cascade reservoirs under operation mode (3) are larger than that of operation mode (2) for the whole year. Since the TGR is a seasonal adjustment reservoir, it could be considered as a compensated reservoir.
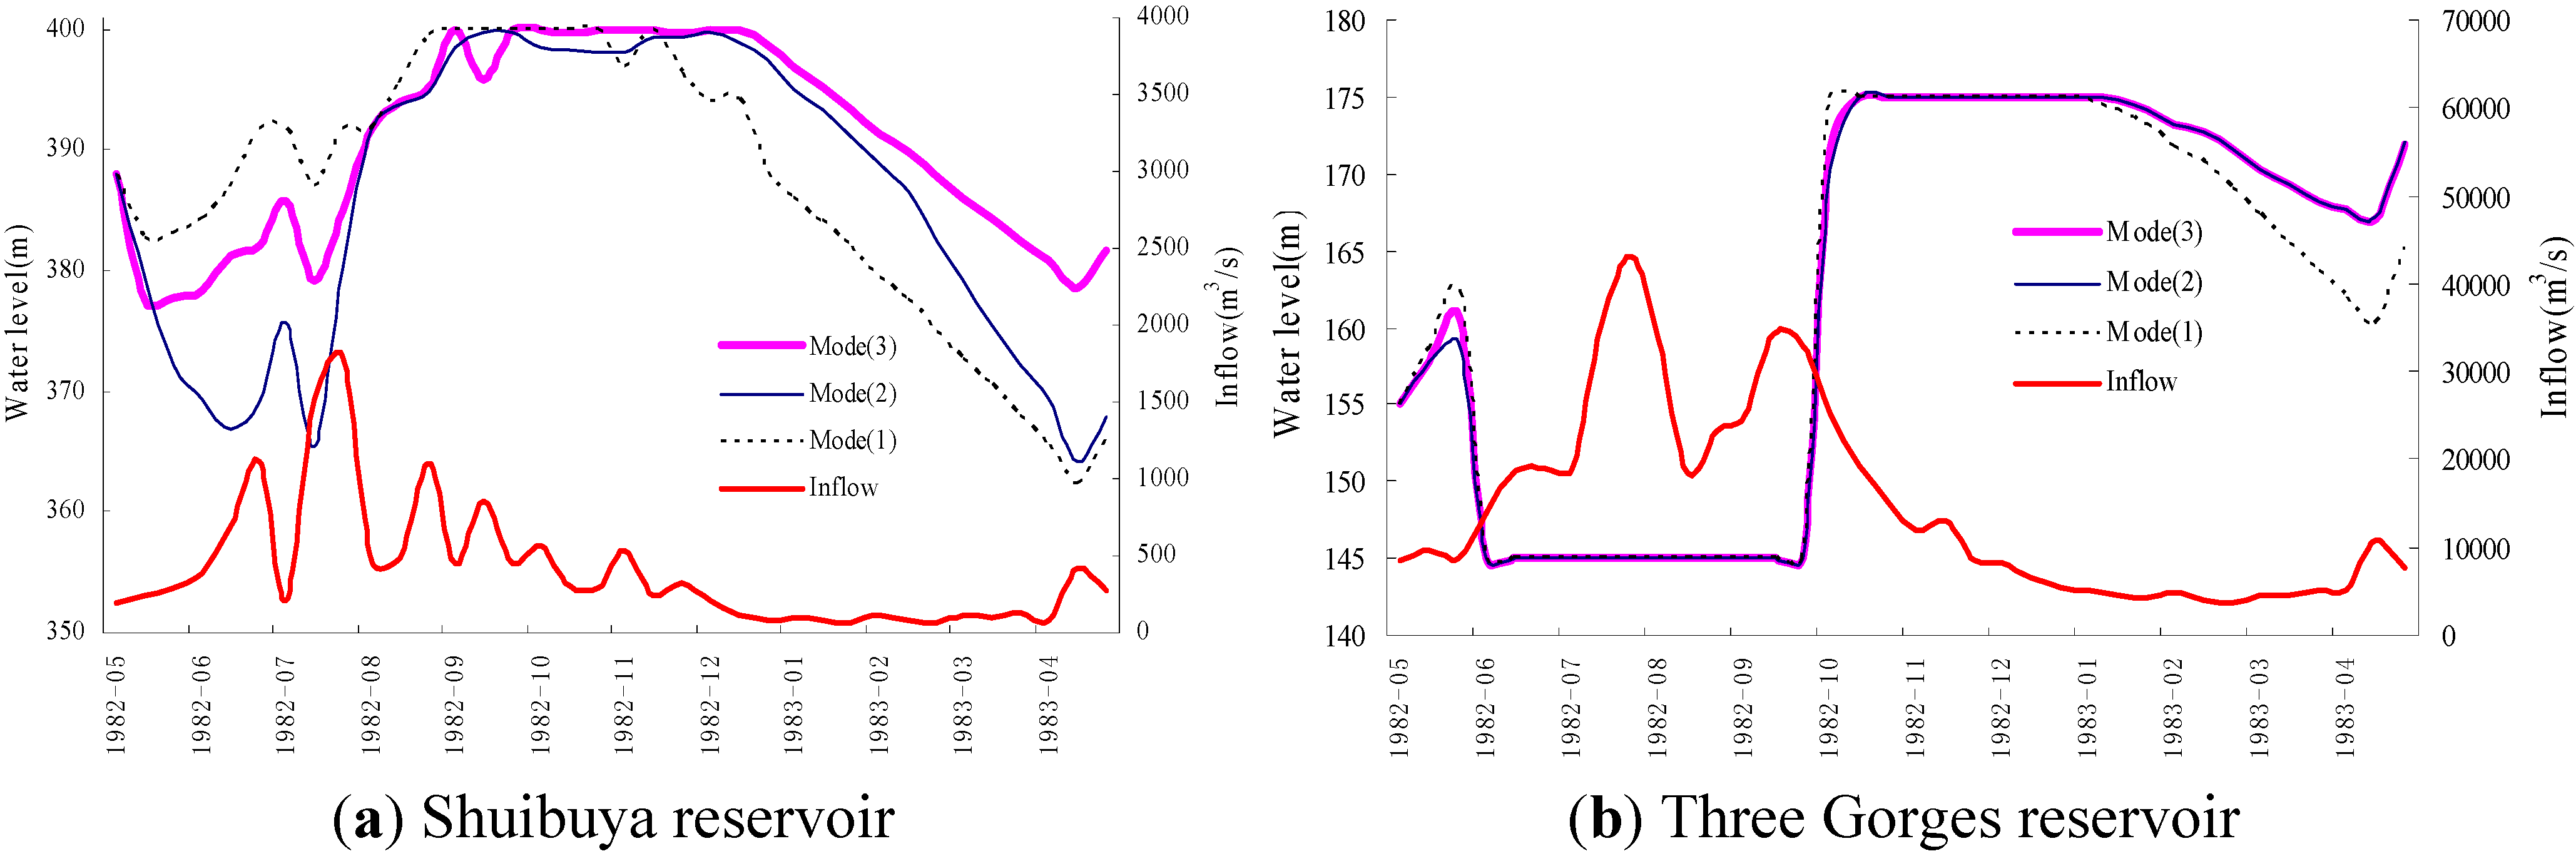
Comparison of water levels estimated by the three operation modes for the Shuibuya reservoir and TGR are shown in
Figure 8. According to
Figure 5a and
Figure 7a, the output of operation mode (1) is increased as the inflow of the Qingjiang River is raised from June to July; while from August to December the output is reduced as the inflow slowly declines, and the reservoir water level is raised gradually to the normal pool level. After the end of December, the output should be kept to the minimum requirement value and the water level is slowly dropped since the inflow is small during the dry season. The water level of mode (3) is less than that of mode (1) when the Shuibuya reservoir is unfilled, and is larger than that of mode (1) after the reservoir is filled. Similarly, the water level of TGR for mode (3) is more than that of mode (1) during the non-flood season. The reason is the operation of mode (1) is based on design rules, while the operation of mode (3) is based on maximum power generation in the multi-reservoir system.
Figure 8.
Comparison of water levels for three operation modes (wet year).
Figure 8.
Comparison of water levels for three operation modes (wet year).
As shown in
Figure 8b, from the end of May to the beginning of June, the water level of TGR is lowered to the flood limited water level (FLWL) of 145 m. During the flood season (from the middle of June to the end of September), the reservoir has to be operated at this low level. In October, the water level is raised gradually to the normal pool level of 175 m and the power output is reduced. From November to the end of April in the following year, the reservoir is kept at as high a water level as possible for regulating the peak electrical load of the network.
Table 5 lists hydropower generation and spilled water of three operation modes estimated by objective function of maximum hydropower revenue. It is shown that the joint optimal operation of two cascade reservoirs can increase revenue by 1.450 billion Yuan or 5.44%, and total spilled water is reduce 82.871 billion m
3 or a decrease of 39.43%, annually in comparison with operation mode based on the design rules.
Table 5.
Estimated hydropower generation (billion kWh) and spilled water (billion m3) by objective function of maximum hydropower revenue.
Table 5.
Estimated hydropower generation (billion kWh) and spilled water (billion m3) by objective function of maximum hydropower revenue.
| Mode | | Qingjiang Cascade | | Three Gorges Cascade | | Total | Total revenue |
|---|
| | Shuibuya | Geheyan | Gaobazhou | Subtotal | Three Gorges | Gezhouba | Subtotal | (billionYuan) |
|---|
| (1) | HG | 4.142 | 3.409 | 0.922 | 8.473 | 83.486 | 13.097 | 96.583 | 105.056 | 26.336 |
| SW | 0.899 | 1.860 | 4.340 | 7.100 | 48.501 | 154.565 | 203.066 | 210.166 | |
| (2) | HG | 4.397 | 3.600 | 1.005 | 9.002 | 84.639 | 15.155 | 99.794 | 108.796 | 27.157 |
| SW | 0.498 | 0.648 | 1.910 | 3.056 | 46.720 | 98.011 | 144.730 | 147.786 | |
| (3) | HG | 4.423 | 3.605 | 1.040 | 9.068 | 86.132 | 15.573 | 101.705 | 110.773 | 27.786 |
| SW | 0.388 | 0.511 | 1.482 | 2.382 | 38.184 | 86.729 | 124.913 | 127.295 | |
| (2)/(1) | HG | 0.255 | 0.191 | 0.083 | 0.529 | 1.153 | 2.058 | 3.211 | 3.740 | 0.821 |
| | 6.15% | 5.60% | 8.99% | 6.24% | 1.38% | 15.71% | 3.32% | 3.56% | 3.12% |
| WW | −0.401 | −1.212 | −2.430 | −4.044 | −1.781 | −56.554 | −58.336 | −62.380 | |
| | −44.61% | −65.16% | −56.01% | −56.96% | −3.67% | −23.02% | −18.40% | −19.70% | |
| (3)/(1) | HG | 0.281 | 0.196 | 0.118 | 0.595 | 2.646 | 2.476 | 5.122 | 5.717 | 1.450 |
| | 6.78% | 5.74% | 12.83% | 7.02% | 3.17% | 18.91% | 5.30% | 5.44% | 5.22% |
| SW | −0.511 | −1.349 | −2.858 | −4.718 | −10.317 | −67.836 | −78.153 | −82.871 | |
| | −56.82% | −72.52% | −65.85% | −66.45% | −21.27% | −43.89% | −38.49% | −39.43% | |
| (3)/(2) | HG | 0.281 | 0.196 | 0.118 | 0.595 | 2.646 | 2.476 | 5.122 | 1.977 | 0.629 |
| | 0.60% | 0.13% | 3.52% | 0.74% | 1.76% | 2.76% | 1.91% | 1.82% | 2.32% |
| SW | −0.110 | −0.137 | −0.428 | −0.674 | −8.536 | −11.282 | −19.817 | −20.491 | |
| | −22.05% | −21.12% | −22.37% | −22.05% | −18.27% | −11.51% | −13.69% | −13.87% | |
5. Conclusions
The optimal operation modes for individual and joint cascade reservoirs were established based on the objective functions of maximizing hydropower generation and hydropower revenue. The progressive optimality algorithm was used to solve these operation modes in this study. The Three Gorges cascade and Qingjiang cascade reservoirs in China was selected as a case study, and the results can be summarized as follows:
(1) Compared to the operation mode based on the design rules, the joint operation of the two cascade reservoirs by maximizing the hydropower generation objective function could generate an extra 5.992 billion kWh for an increase of 5.70% annually.
(2) Since the regulation ability of reservoirs and price of hydropower plants are different, joint optimal operation of the two cascade reservoirs by maximizing hydropower revenues objective function performs best, and increases revenues 1.45 billion Yuan for an increase of 5.44% annually in comparison with the operation modes based on the design rules.
(3) Joint operation of the two cascade reservoirs can not only increase hydropower generation, but also improve water utilization efficiency significantly, especially during the flood season. Compared to the operation mode based on the design rules, the joint operation mode can generate an extra 2.908 and 3.084 billion kWh, and reduce spilled water 5.384 and 78.741 billion m3 during the flood season and the non-flood season, respectively.


