Article

Textural Characterization and Energetics of Porous Solids by Adsorption Calorimetry

1
Department of Chemistry, Faculty of Science, National University of Colombia, Bogota, Colombia
2
Research Group on Porous Solids and Calorimetry, Department of Chemistry, Faculty of Science, University of the Andes, Bogota, Colombia
*
Author to whom correspondence should be addressed.
Energies 2011, 4(6), 928-947; https://doi.org/10.3390/en4060928
Submission received: 20 February 2011 / Revised: 13 April 2011 / Accepted: 28 April 2011 / Published: 10 June 2011

Abstract

:
An adsorption microcalorimeter was designed and built in our laboratory and used for the determination of differential adsorption heats in different samples of porous solids: activated carbon granules, activated carbon pellets, an activated carbon monolith and a zeolite sample. This work shows the relationship between adsorption heat and the pore size of different porous solids using adsorption of NH3, CO and N2O. The result shows that the thermal effect can be related with textural properties and superficial chemical groups of the studied porous solids. The values of differential heats of N2O adsorption in the investigated systems have shown that this interaction is weaker than that with CO. Small amounts of N2O are chemisorbed in the investigated systems. For the room temperature adsorption of N2O, the strongest active sites for the interaction with Brönsted acid groups in the ACM structure were identified. The values determined are between −60 kJ/mol and −110 kJ/mol for ZMOR and ACM, respectively, for the adsorption of N2O and −95 kJ/mol and −130 kJ/mol for the adsorption of CO.

1. Introduction

It is widely accepted that knowledge of adsorption heats is vital in the description of gas-solid interactions. These obviously provide information about the energetics of surface processes. In some simple cases, however, inferences can be made from the adsorption heats on the structure of the surface itself.
Chemisorption and catalysed reactions, like any chemical reaction, are associated with changes in enthalpy and can therefore be studied by means of calorimeters. Many calorimeters, operating on different principles, have indeed been used for this purpose, as reported in a brief review [1]. Adsorption calorimeters are particularly convenient for these studies [2]. They offer a number of advantages which will be illustrated by means of selected examples.
Adsorption calorimetry, preferably in association with other physico-chemical or physical techniques, can be used to describe the surface properties of a solid. For instance, it has been shown that differential heats of the adsorption of ammonia may serve to quantitatively describe the surface acidity in a small-pore zeolite, e.g., H-ZSF15, thus complementing the information provided by infrared spectroscopy [3]. Information on the bond’s energy, deduced from calorimetric data, is needed to achieve a theoretical description of the adsorbate-adsorbent bond. It has also been shown, for instance, that, in the case of the adsorption of hydrogen on nickel-copper alloys, a correlation between heats of adsorption and surface magnetic properties can be demonstrated. This correlation indicates that the energy of the bond between adsorbed hydrogen and nickel atoms is regulated by the electron density of states, near the Fermi level, for the metal’s surface [4].
Adsorption of at least one of the reagents is a necessary step in all heterogeneously catalysed reactions. Calorimetric investigations of the adsorptions of pure reagents on the catalysts may therefore provide some information on the catalytic reaction itself. It appears, for instance, that an inverse linear correlation exists between the activity of silver catalysts for the epoxidation of ethylene and the bonding energy of oxygen at their surfaces [5]. The change of enthalpy associated with the reaction is, of course, not modified by the presence of the catalyst. Therefore, thermochemical cycles, based on experimentally determined heats of adsorption of the interaction of reagents, introduced successively at the catalyst’s surface, may give an indication of the most probable reaction mechanism in the case of “simple” catalytic reactions. The recorded heat of the reaction, however, may differ from the expected one when secondary reactions, eventually leading to the activation or deactivation of the catalyst, take place. The calorimetric study of the catalytic reaction when a steady state of activity is not yet established may therefore provide information on the catalyst’s evolution or even on the reaction mechanism. These applications of calorimetry have been illustrated by various studies on the combustion of carbon monoxide on divided nickel oxide catalysts at 300 K and 473 K [6,7].
In this work we present the synthesis and characterization of porous solids and use of adsorption calorimetry for establishing the relationship between the adsorption heat and the pore size of different porous solids. This used NH3, CO and N2O to relate the effect of their different system diameter, molecular and physicochemical characteristics with respect to heats of adsorption.

Thermodynamics of Adsorption—Theoretical Considerations [8]

It is to be expected that thermodynamic relationships between the free energy, enthalpy, and entropy of adsorption should be derivable. In particular, a very useful relationship is the one between the temperature variation of the adsorbate pressure and the heat of adsorption, i.e., the appropriate version of the Clausius-Clapeyron equation. All variables presented here are properties intensive and the symbols used are:
  • P = pressure of the adsorptive
  • H = enthalpy of the adsorptive, kJ mol−1
  • T = temperature, K
  • R = the gas constant ¼ 8.314 J mol−1 K−1
  • S = entropy, kJ mol1 K1
  • ns= number of moles adsorbed, mol g−1
  • qst = isosteric heat of adsorption (referenced to the adsorptive gas phase), kJ mol−1
  • Qi = integral heat of adsorption, kJ
  • gi = calorimetric heat measured, Jg1
  • X = moles of an specie of gas
  • Es = internal energy of the adsorbent, kJ
  • Eg = internal energy of the adsorbate, kJ
  • E = internal energy, kJ
  • qd =differential heat of adsorption, kJ mol−1
  • A = total surface area, m2 g−1
  • nd = corresponding number of moles
  • Hg = the enthalpy of the adsorptive (in the gas phase), kJ mol−1
  • E s ¯ = internal energy parcial molar of solid
  • μg = chemical potential of the gas phase
  • μs = chemical potential of the solid phase
  • Г = moles of gas adsorbed area
  • Vg = gas adsorbed in volume
  • Ss = entropy of the solid phase
  • π = pressure of the adsorbed layer
  • m i s = mass
It can be recalled that the Clausius-Clapeyron equation:
d ln P d T = Δ H R T 2
is a specialization of the more general relationship in a one-component system:
( P T ) V = ( S T ) P
Very commonly, investigators in the field of adsorption have used Equation (1) and, by analogy with Equation (2), they used the restriction that the number of adsorbed moles, ns, be held constant. Equation (1) then becomes:
( ln P T ) n s = q S T R T 2
Here, qst, is called the isosteric heat of adsorption, and the relationship of this quantity to other thermodynamic quantities has been discussed in the literature [9,10,11,12,13] and will be considered only briefly here.
Consider the process for ns moles of species X:
n s X ( g a s , P , T ) = n s X ( a d s o r b e d , Γ , T )
The integral heat of adsorption, Qi is then given by:
Q i = E g E s
or, per mole:
g i = E g E s
where the small capital denotes that the quantity is on a per mole basis, thus E = E / n , where the quantity gi corresponds to a calorimetric heat measured in such a way that no PV work is done, as, for example, if the adsorption is allowed to occur by opening a stopcock between the adsorbent and the gaseous phase, with both vessels being immersed in the same calorimeter.
A second experimental quantity of importance is the differential heat of adsorption, qd, which given by:
q d = ( Q n d ) A , T
where A now denotes the total surface area. Alternatively, qd may be written as:
q d = ( E g n s ) A , T ( E s n s ) A , T = E g ¯ E s ¯
where the bar over a quantity indicates that it is a partial molar one.
One usually assumes ideal gaseous behaviour for the adsorbate, so:
q d = E g E s ¯
and, of course:
q d + R T = H g E s ¯
It is now necessary to consider in more detail the nature of the q obtained when a Clausius-Clapeyron type equation, such as Equation (3), is used. The condition for equilibrium between X in the gaseous phase at (P,T) and on the adsorbent at (Γ,T) is:
μ g ( P , T ) = μ s ( Γ , T )
and, for any small variation in conditions:
( μ g P ) T d P + ( μ g T ) P d T = ( μ s Γ ) T d Γ + ( μ s T ) Γ d T
For the case of Γ held constant:
( P T ) Γ = [ ( μ s T ) Γ ( μ g T ) P ] ( μ g P ) T
Alternatively, μs may be regarded as a function of π and T rather than of Γ and T and, correspondingly, one obtain:
( P T ) π = ( μ s T ) π ( μ g T ) P ( μ s P ) T
For the gaseous phase:
T ( μ g T ) P = μ g H g = T S g
( μ g P ) T = V g
For the surface phase from: [ d E s = T d S s + i μ i d m i s + γ A ] :
d E s = T d S s π d A + μ s d n s
or:
E s ¯ = T S s + μ s
and:
( μ s T ) P = S s ¯ = ( 1 T ) ( μ s E s ¯ ) R T 2
On substituting Equations (15) and (18) into Equation (13) and making the usual approximation that Vg = RT/P, one obtains:
( ln P T ) Γ = ( H g E s ¯ ) R T 2
Since the left-hand side of Equation (18) is defined, by convention, as giving the isosteric heat, qst, divided by RT2, it follows that:
q s t = H g E s ¯ = q d + R T
Notice that it is strictly Γ and not ns that is to be held constant; the difference involves the change in the total surface area with temperature and is usually neglected. In actual calorimetric measurements, the heat of adsorption is believed to lie between qd and qst since usually there is some exchange of work between portions of the gas and not all of the gas lies within the calorimeter. The difference between these two quantities, RT, is again frequently neglected.
To evaluate Equation (14), Equation (16) is integrated, giving:
E s = T S s π A + μ s + n s
or:
E s = T S s ( π Γ ) + μ s
On differentiating Equation (23) and comparing it with Equation (16), one obtains:
0 = S s d T ( 1 Γ ) d μ + d n s
or:
( μ s T ) π = S s = ( 1 T ) d T ( μ E π Γ )
On inserting Equation (25) and (15) into Equation (14), one obtains:
( ln P T ) π = ( H g E s π Γ R T 2 ) = q π R T 2
Thus:
q π = q i + R T π Γ
The above treatment shows that depending upon whether d ln P/dT (ok) is evaluated at constant Γ or constant π, one obtains a measure of the differential or of the integral heat of adsorption. From these, one may obtain the corresponding entropies of adsorption, since:
H g E s ¯ = T ( S g S s ¯ )
and:
H g E s π Γ = T ( S g S s )
The quantities qst, E s ¯ , and S s ¯ are easier to obtain since all that is needed is the equilibrium pressure for a given amount of adsorption at two temperatures. On the other hand, the quantities qst, Es, and, especially, Ss may be more informative since these give the average or integral values. In the application of Equation (26), however, the film pressure π must be obtained by integration according to the Gibbs equation, so that it is necessary to know the complete isotherm. These procedures have been discussed in the literature [9,10,11,12,13,14,15,16,17,18,19,20,21,22,23,24,25,26,27,28,29,30].

2. Results and Discussion

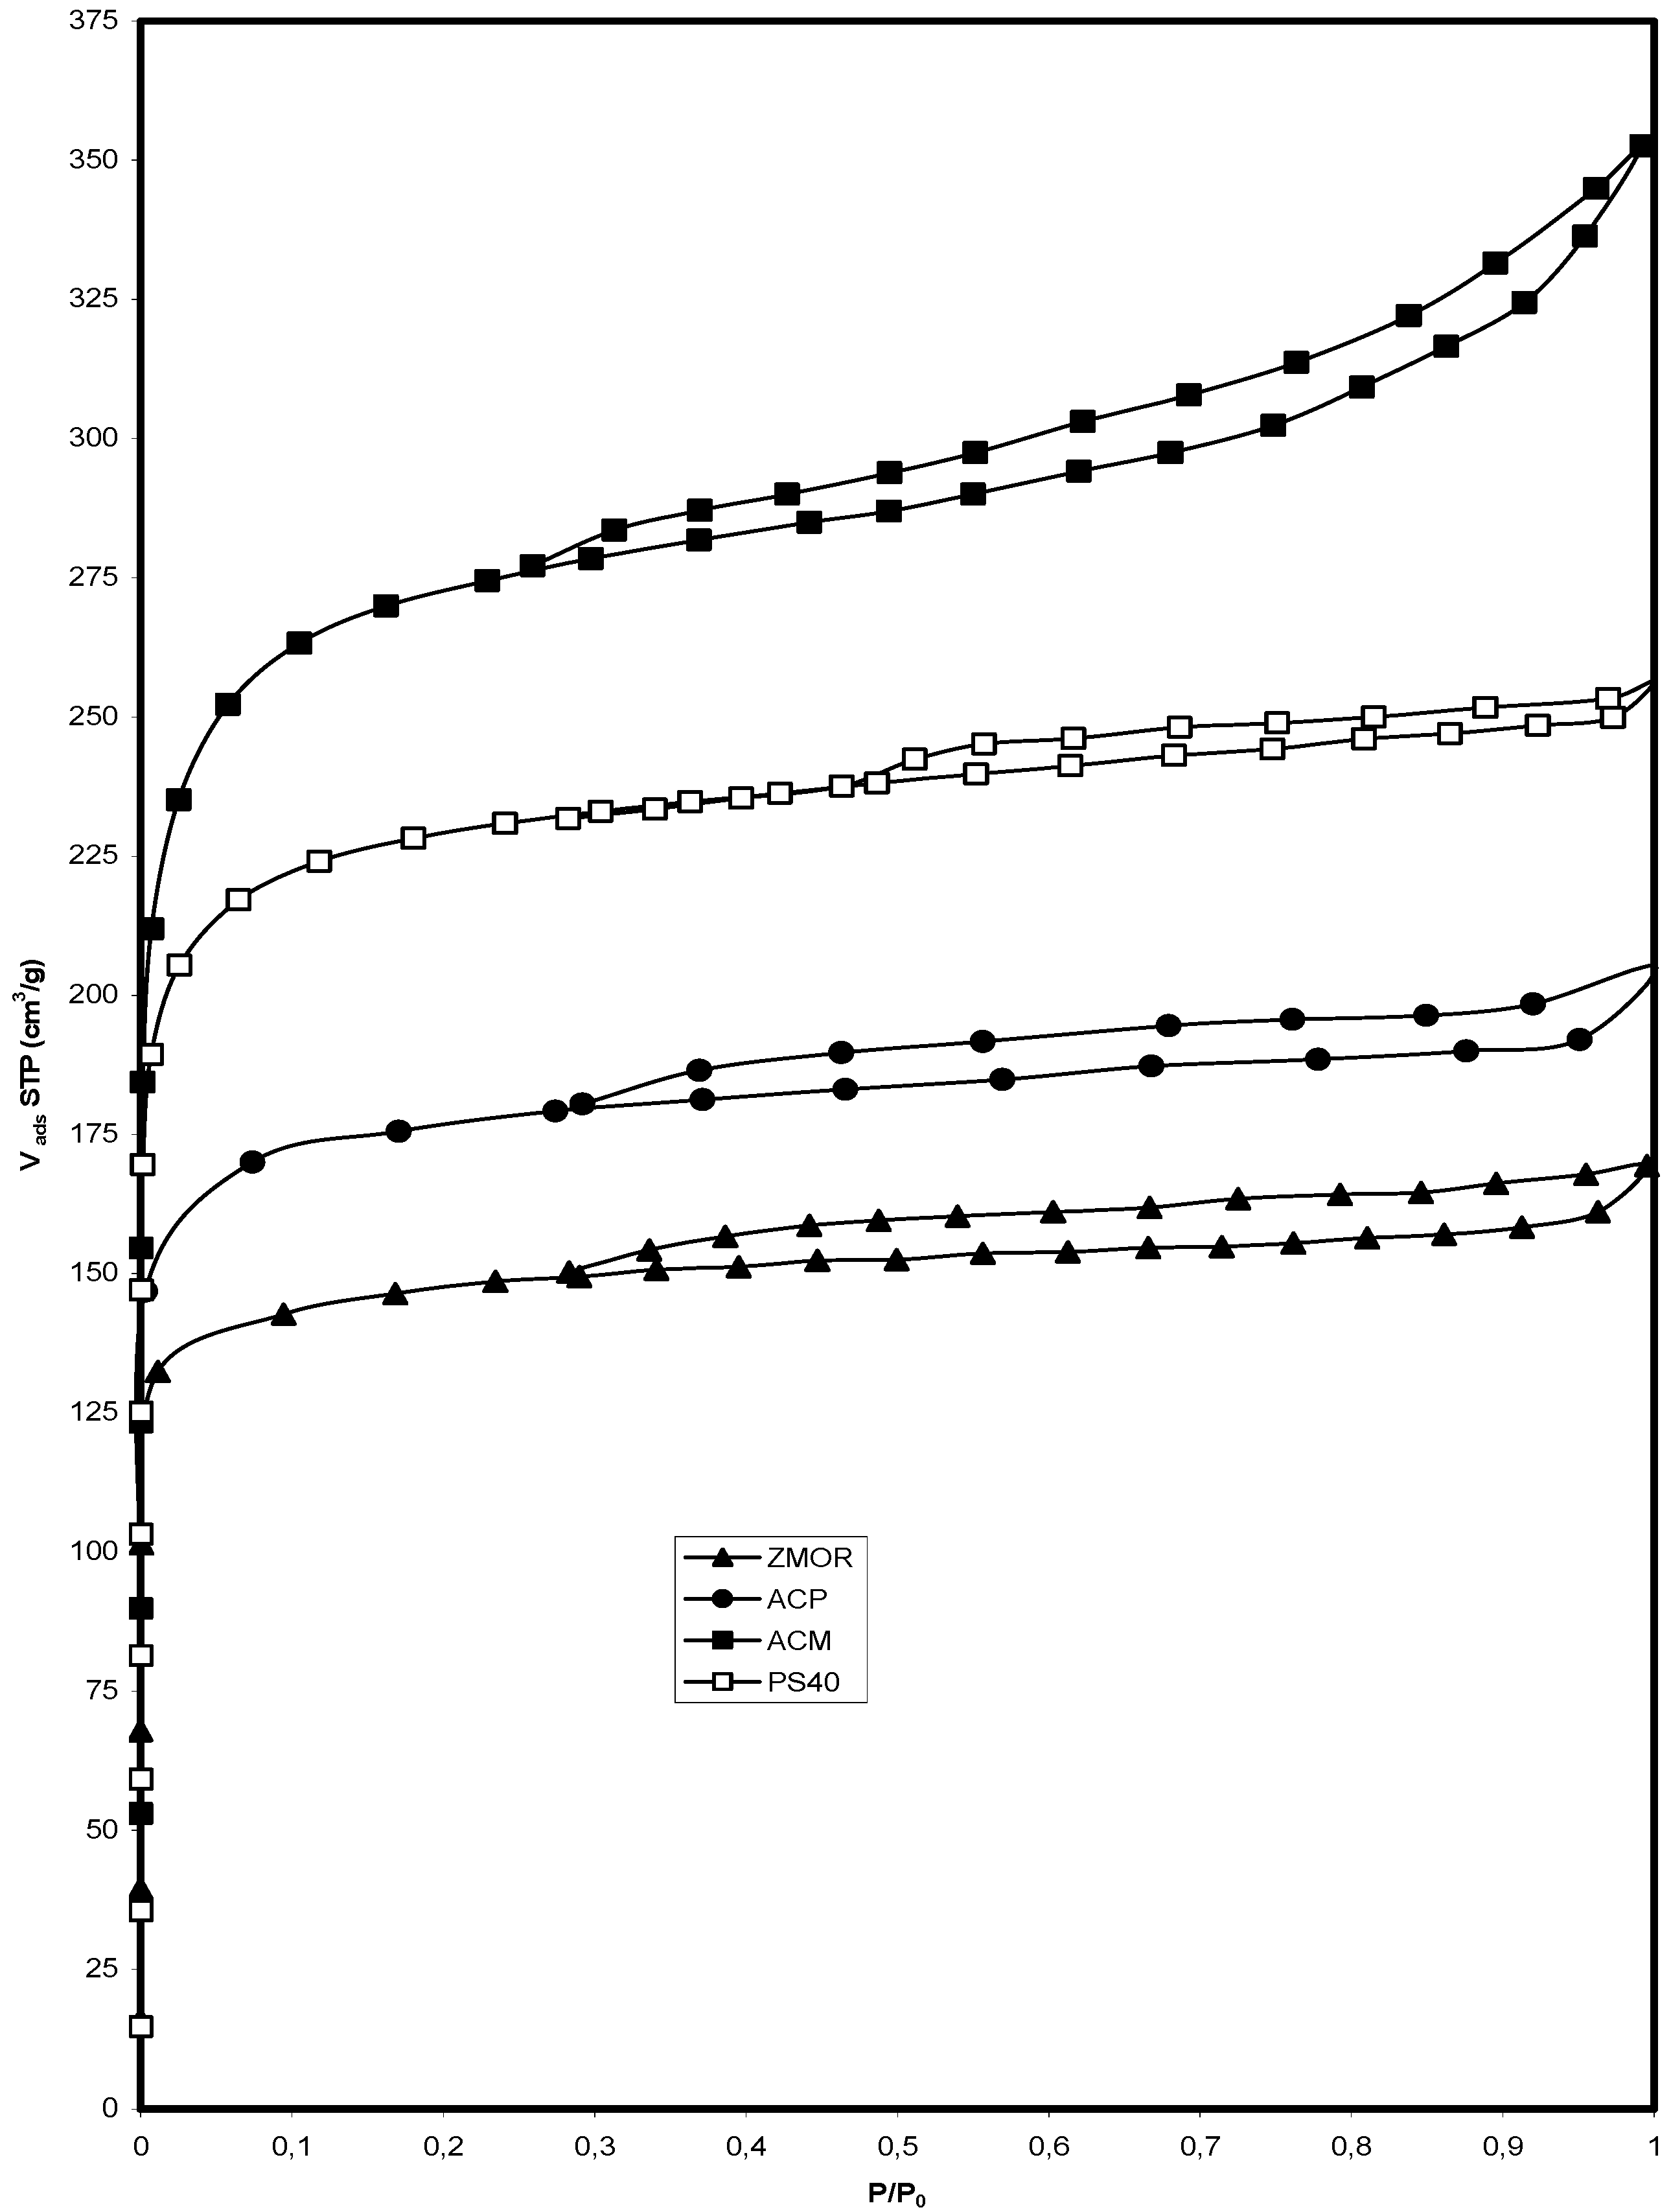
2.1. Isotherms of Nitrogen at 77 K

Figure 1 shows selected adsorption–desorption isotherms N2 at 77 K for porous solids. They give illustrative examples for the shape and behaviour of the N2 adsorption isotherms for these solids. All the isotherms belong to a mixed type in the IUPAC classification, type I at low relative pressures (P/P0) and type IV at intermediate and high relative pressures. In their initial part, they are of type I with an important uptake at low relative pressures, characteristic of microporous materials.
Figure 1. N2 Adsorption isotherms at 77 K of the porous solids used in this research.
Energies 04 00928 g001
However, the knee of the isotherms is wide, no clear plateau is attained and a certain hysteresis slope can be observed at intermediate and high relative pressures, all these facts indicating the presence of large micropores and mesopores (type IV). This is shown by the average pore diameter values, Dp varying between 094 and 2.50 nm (Table 1). Note that for all isotherms (Figure 1), adsorption and desorption lines overlap completely in the low relative pressure range, while the hysteresis loop exists in the relative pressure region (P/P0 > 0.4), which is mainly due to the presence of ink-bottle type of pores [10,11,12,13], among other factors such as the presence of slit-shaped pores. The ink-bottle type of pores have a larger pore size in the bottle body, which results in the occurrence of hysteresis in the high relative pressure region [12]. From a comparison of these isotherms presented in Figure 2, a larger amount of adsorption and a hysteresis loop is found for the solids PS40 and ACM.
The activated carbons ACP and PS40 exhibit a type H4 hysteresis, characteristic of materials made up of slit shaped pores but whose pore size distribution is mainly in the microporous range. On the other hand, for activated carbon ACM, the isotherms exhibit a hysteresis loop intermediate between types H4 and H3, both typical for materials containing slit-shaped pores. The adsorbed nitrogen volume increases for the samples from ZMOR to ACM, indicating a wider pore size distribution for those samples. Thus, ZMOR, ACP and PS40 correspond to porous solids that containing a majority of micropores and few mesopores with a relatively small external area, whereas ACM belong to the mesoporous type porous solids with a more important external surface area. This statement is confirmed by the physical properties listed in Table 1. The other hand for the ZMOR the hysteresis loop of the nitrogen adsorption/desorption isotherms should result from the intercrystalline voids of the zeolite particles since each particle consists of many primary crystals. Recent investigation using mercury-intrusion porosity proved the existence of intercrystalline voids in the zeolite particle. Table 1 lists physical properties of porous solids including SBET, Smicro, Smeso, Vtot, Vmicro, Vmeso and Dp [8]. For the porous solids obtained have a SBET and Vtot, the surface area varies from 1078 m2/g to 510 m2/g and pore volume total varies from 0.53 cm3/g to 0.27 cm3/g.
Table 1. Physical properties deduced from N2 adsorption at 77 K on porous solids prepared in this work.
SampleSBET
(m2/g)
Smic
(m2/g)
Sext
(m2/g)
Vmic
(cm3/g)
Vmes
(cm3/g)
Vtot
(cm3/g)
Dp
(nm)
ZMOR51052330.230.040.272.50
ACP81079080.280.080.361.45
PS40958880110.360.060.421.02
ACM1078890230.440.090.530.94
The width of the distribution increased from ACM to ZMOR. The ACM exhibited a maximum at 0.94 nm, which became displaced towards larger pore sizes in ZMOR (2.50 nm). An increase in the pore volume and a displacement towards higher pore sizes was clearly noticed in each sample. Finally, the mesopore volume also increased from ACP > ACM > ZMOR > PS40. Mesopores only represent between 22.22% 14.28 an of the total pore volume of the activated carbon used, whereas they amounted to 14.81% in the ZMOR sample. From the above results and the impregnation, it can be deduced that the ACs used were at all impregnation ratios essentially microporous. The other hand, the mesoporous and microporous ZSM-5 has a lesser degree compared to activated carbons.
The D values reflected the characteristics of microporous structures (i.e., pore diameter <2 nm). These results were consistent with the data of the N2 adsorption isotherms of the Langmuir type. The AC also exhibited a narrow pore size distribution that was essentially microporous. It was noted that these micropores were often the major contributors to the adsorption of adsorbate molecules small enough to penetrate. However, transport within these pores can be severely limited by steric effects.

2.2. Analyze of Chemical Superficial

The total amounts of acidic groups and pH values of the synthesized solids are listed in Table 2. The total amounts of acidic groups of the porous solids employed in this research were determined by the Boehm titration method. It is revealed that the total amount of acidic groups of all solids is larger in ACM than that for ZMOR. The amounts of acidic groups on the surface of the solids increased in the order ACM > PS40 > ACP > ZMOR as a result of the different nature of each of the solids employed in this investigation. Different acidic group present variable acid intensity. There are different kinds and amounts of acidic groups produced on the surface of solid after different acid treatment.From Table 2, it is found that the largest amount of total acidic groups was produced on solid ACM. The amount of total acidic groups is 3.124 mmol/g, which is 5.5 times large of that of the ZMOR. However, there are stronger increments of total amounts of acidic groups between of the different samples. It is noted that traces of acid protons might remain in the pores of the ACs, though, which were washed by large amounts of water.
Table 2. Surface pH value and amount of total acidic groups of the samples synthesized.
SamplesTotal Acidic Groups Amount (mmol/g)pH NH3
ZMOR0.5679.50
ACP1.3453.77
PS401.9983.66
ACM3.1243.34

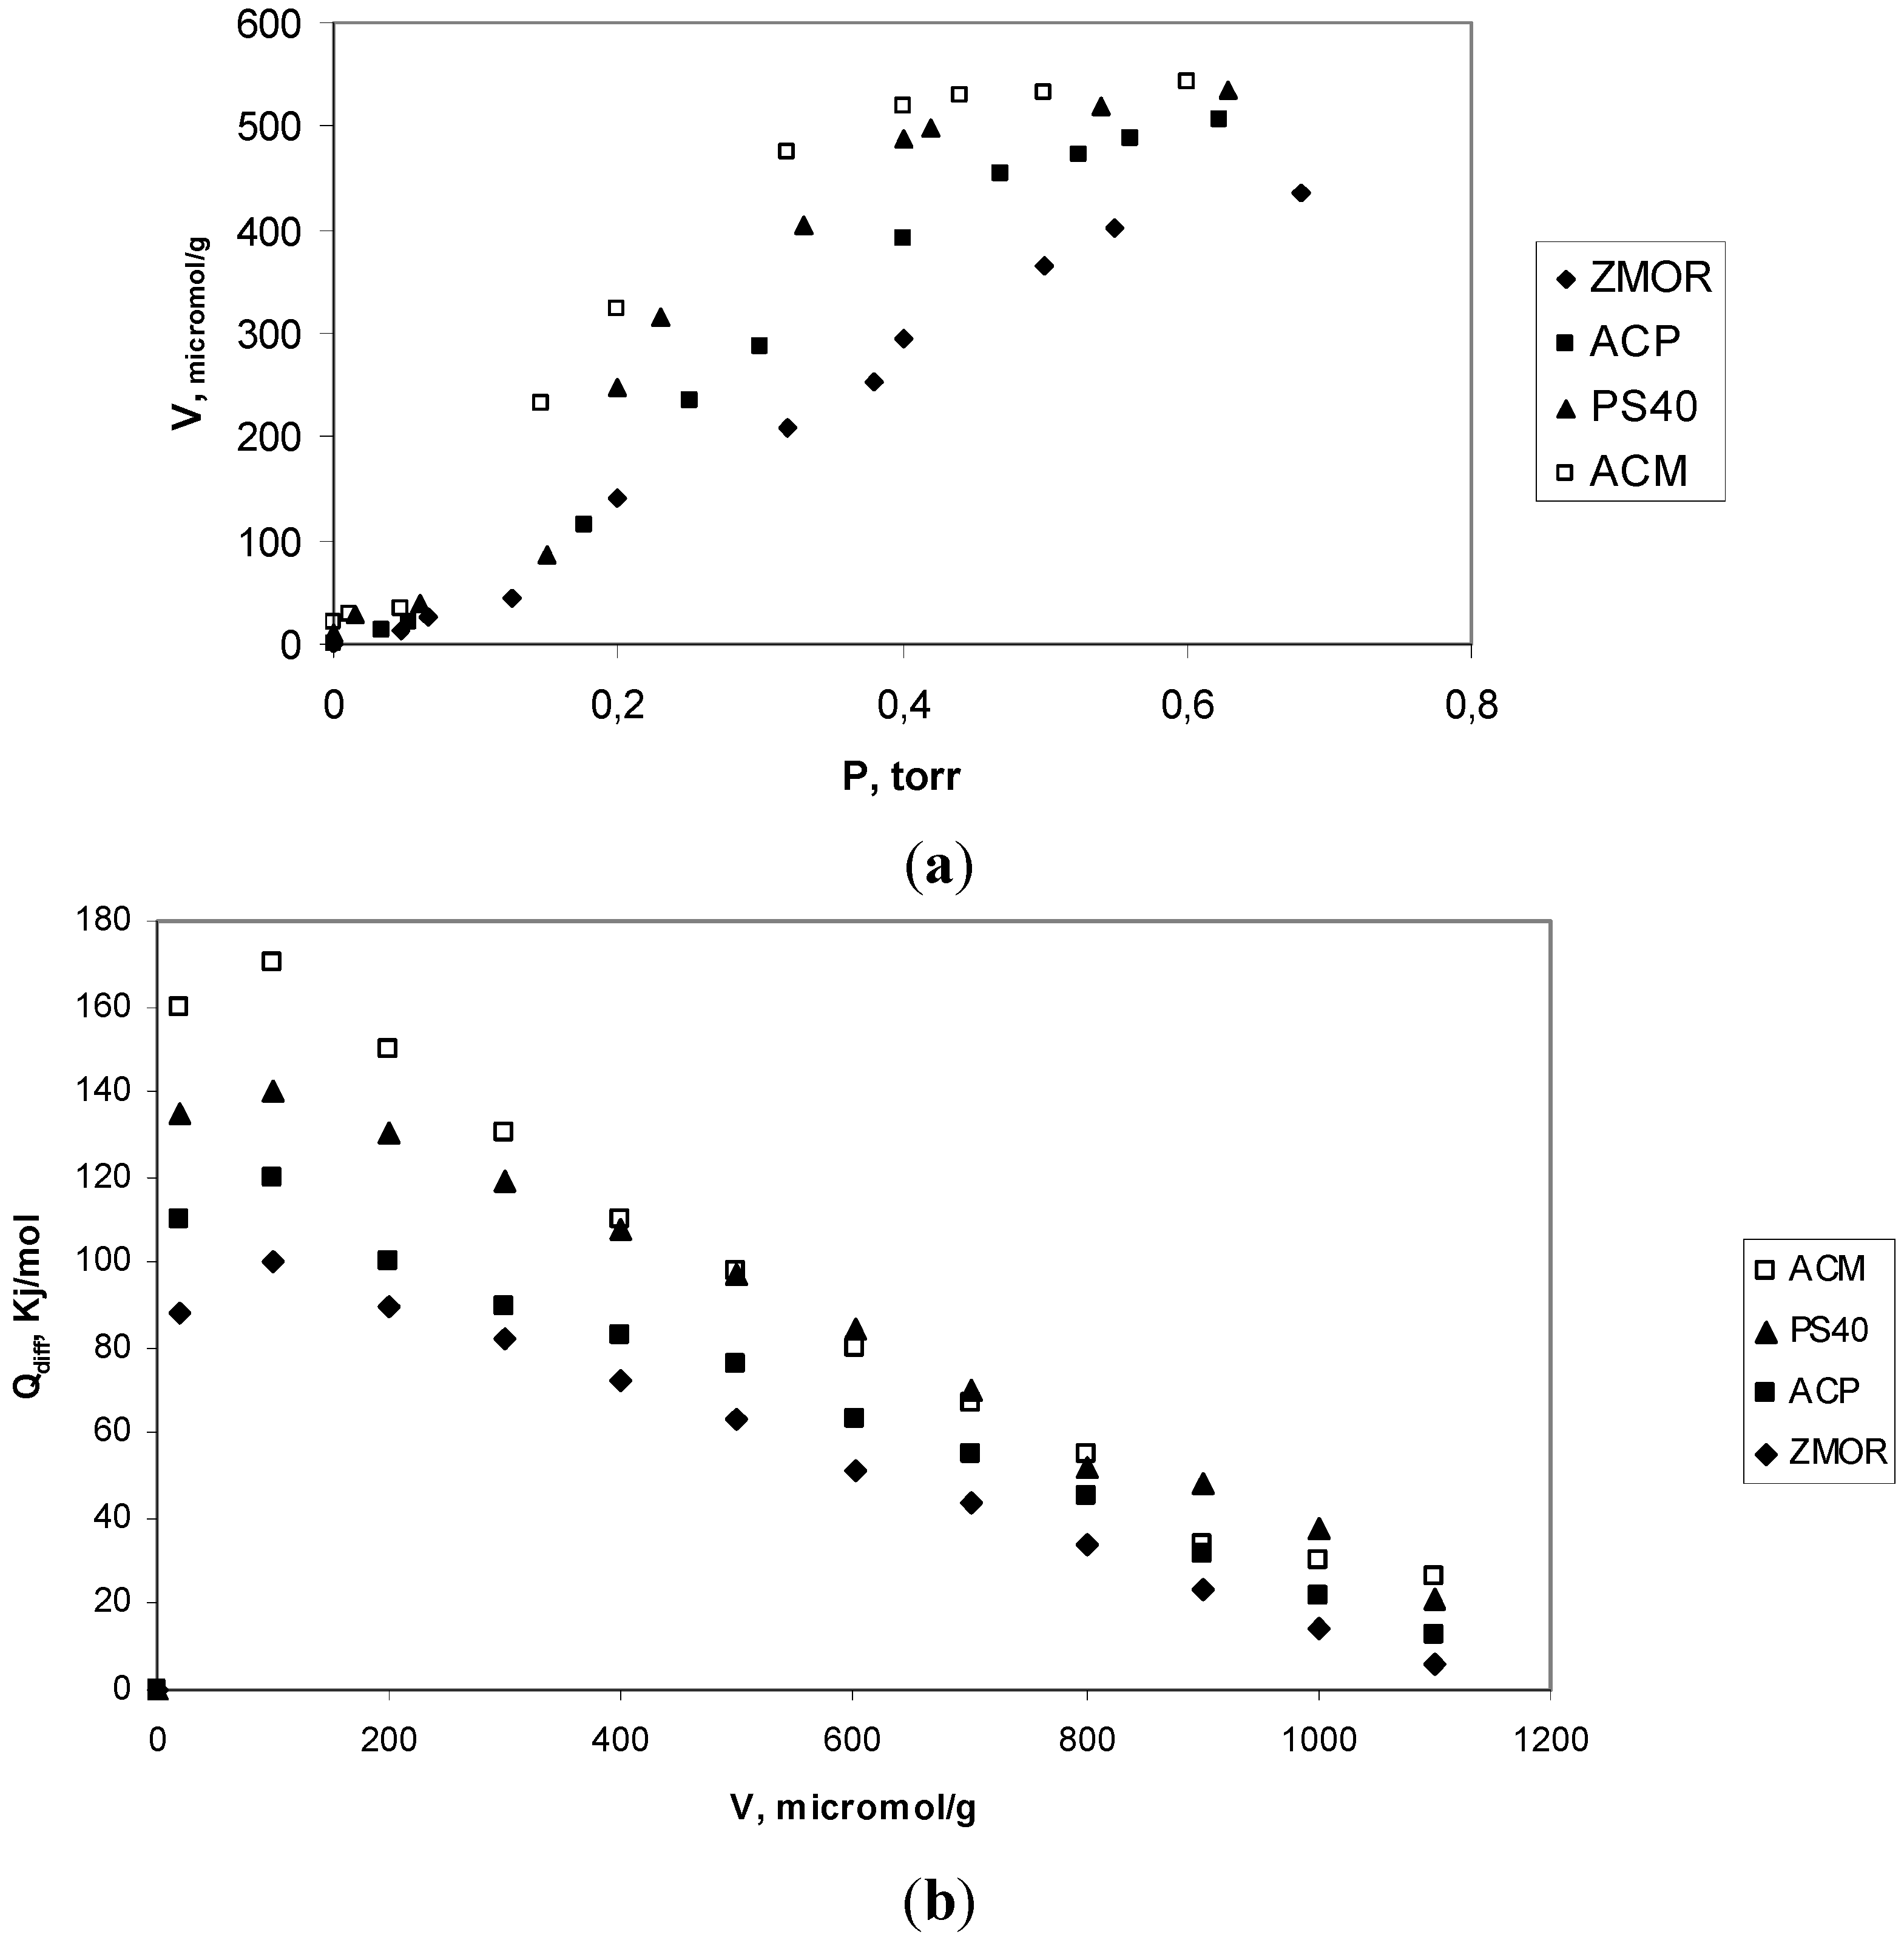
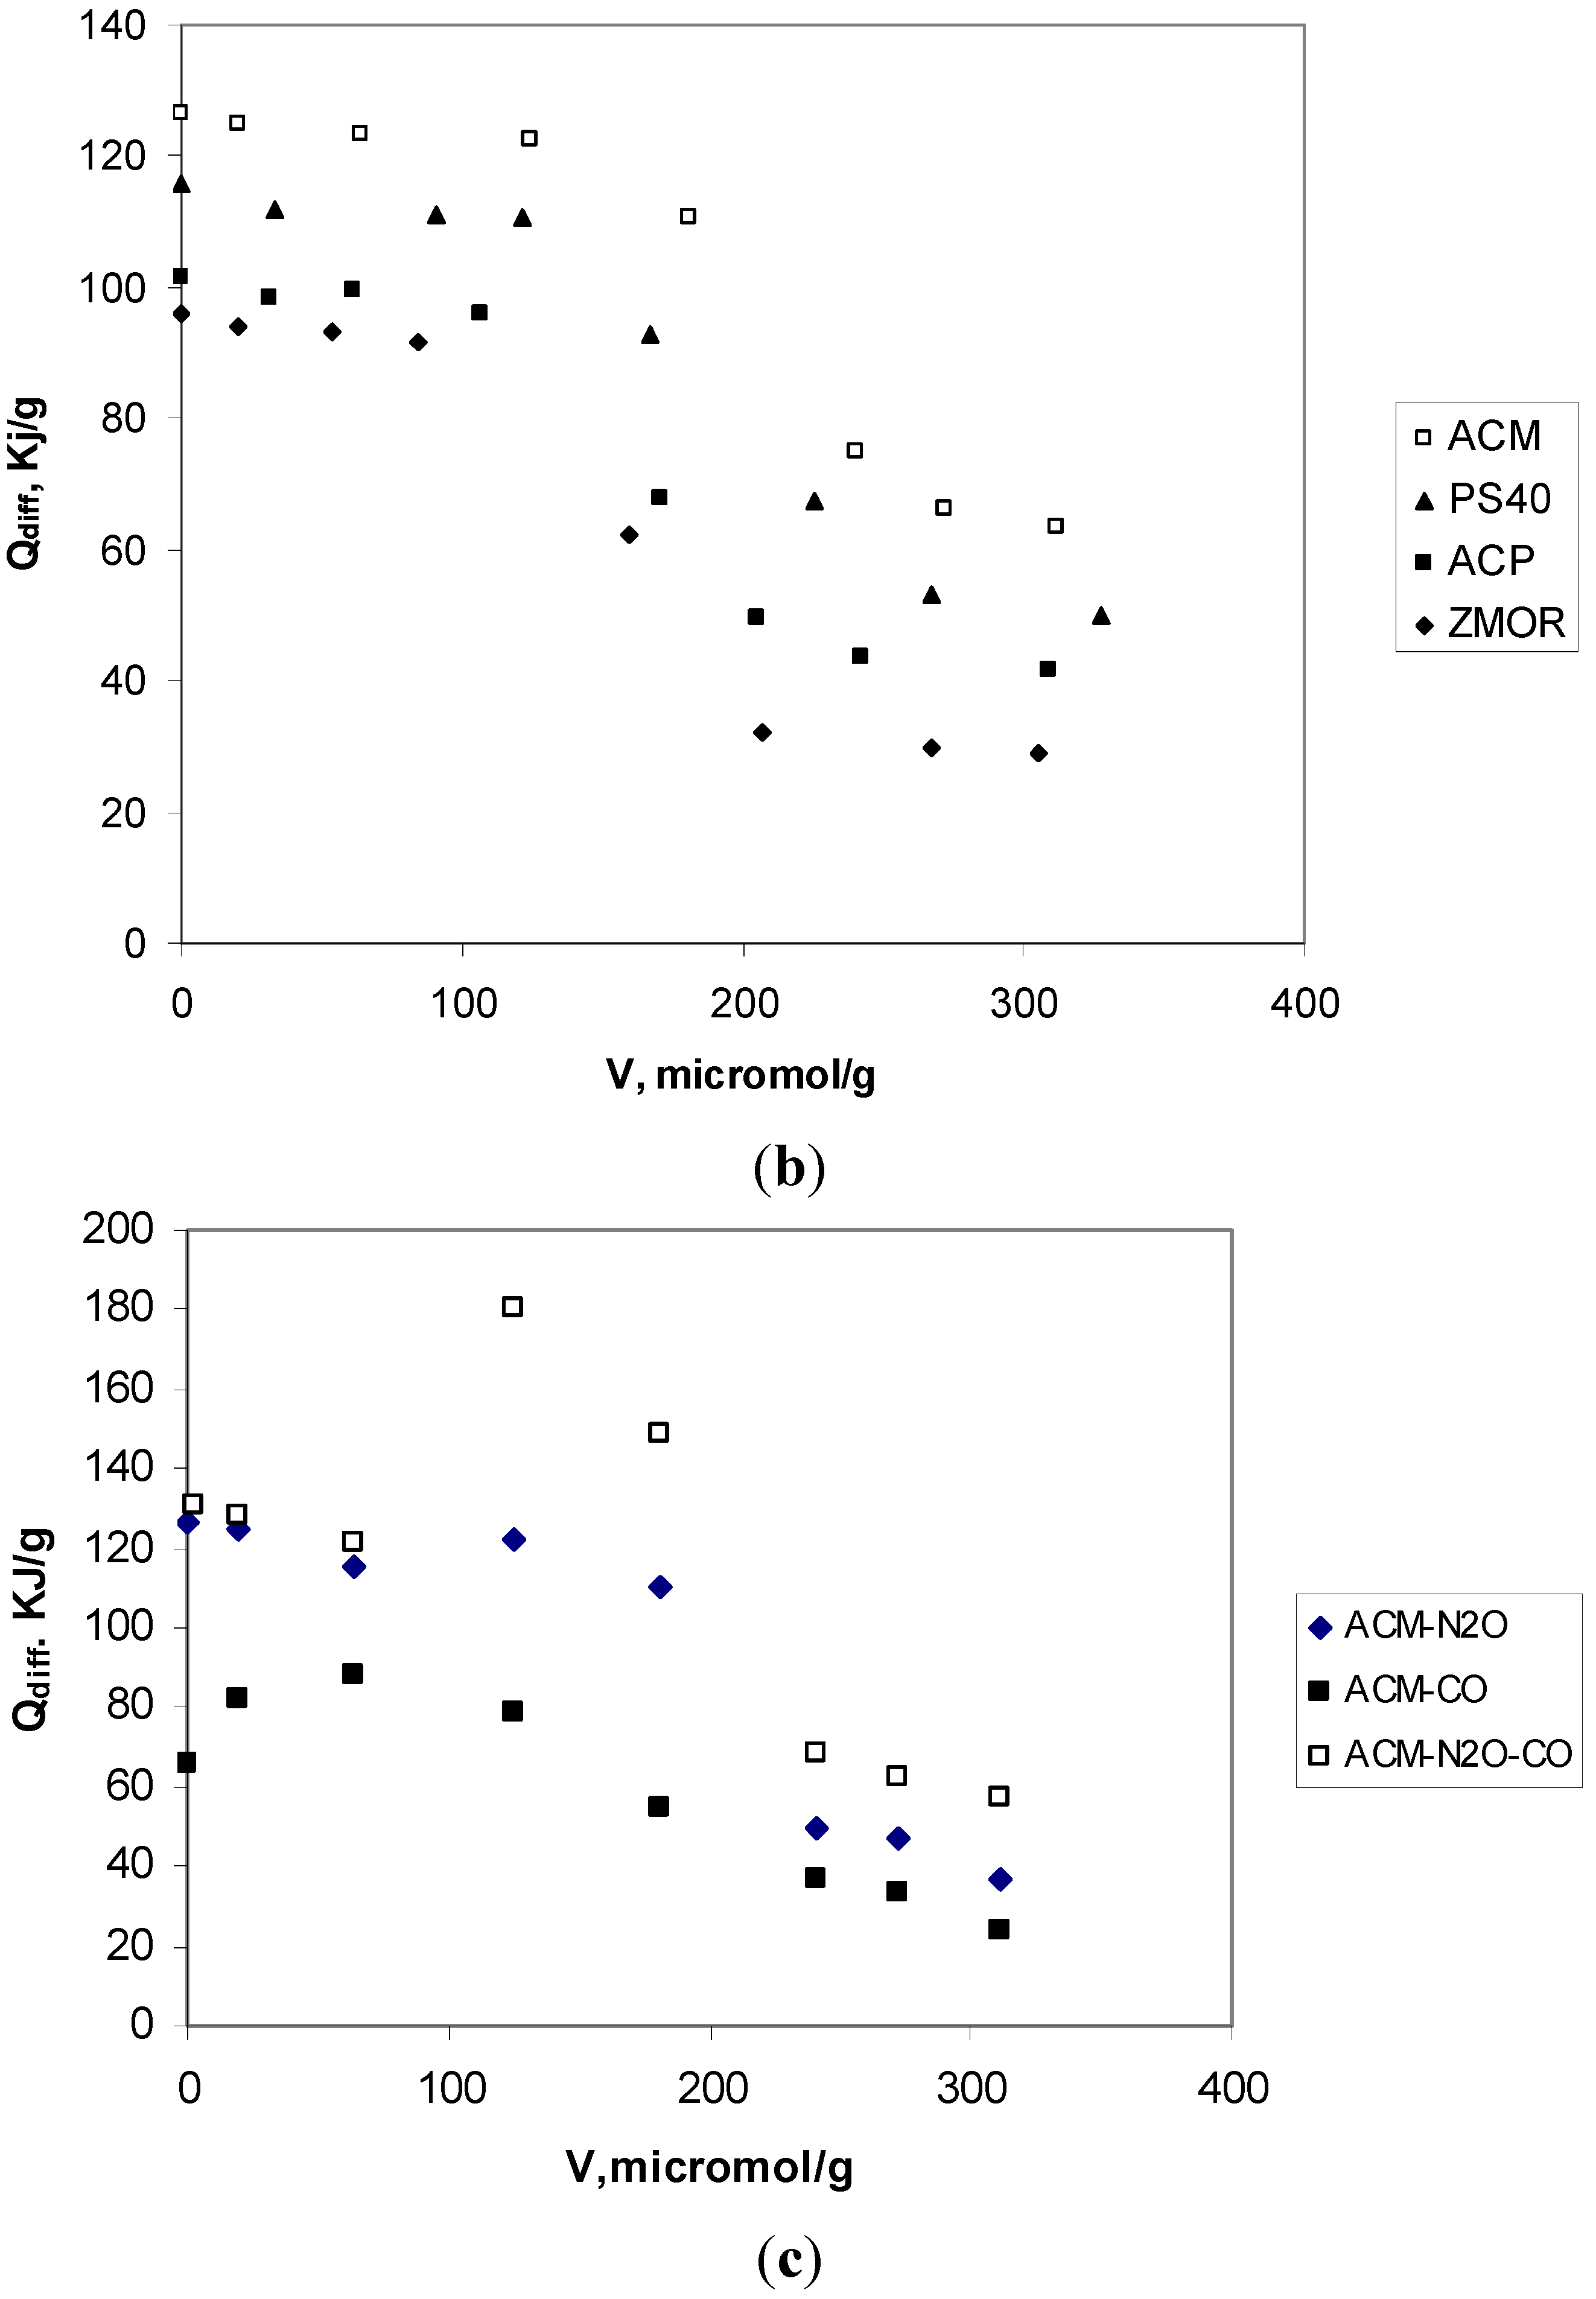
2.3. Analyze of Results Adsorption Calorimetry of Gases

In order to better describe the nature and strength of active sites that reveal of differential in chemistry surface of the porous solids studied, ammonia adsorption experiments were also performed in this work. The adsorption of ammonia was done at 403 K, because the value of irreversibly adsorbed ammonia at this temperature is believed to correlate with the number of strong active sites present [31]. Figure 2a presents the volumetric isotherms of NH3 adsorption on each one synthesized samples: ZMOR, ACP, ACM and PS40. Figure 2b presents the differential heats of adsorption on the same samples, while Table 3 compiles the values of irreversibly adsorbed NH3 molecules and the data concerning the thermal effects of adsorption. The analysis of all these data reveals that, as a consequence of the characteristics different of porous solids in this study, a whole number of active sites for ammonia adsorption increase, while the values of Virr are quite similar; with the exception of ZMOR because to its chemical nature, the volume is slightly inferior about the other solids under study. This shows that the adsorption calorimetry technique is very sensitive and is capable of the differences in the structures of solids.
Figure 2. The adsorption of ammonia on the samples synthesized. (a) volumetric isotherm of NH3 adsorbed at 403 K; (b) differential heats of adsorption of NH3.
Energies 04 00928 g002
Table 3. Quantitative (number of moles per gram of porous solid; number of molecules per cation) and energetic data (integral heat of adsorption per gram of porous solid and initial differential heat of adsorption) on the adsorption of NH3 on Porous solids synthetized in this work.
SampleVirr
(μmol H3/g)
NH3 molecules/group cacarboxQint
(J/g solid)
Qdiff
(kJ/mol)
ZMOR4430.65488
ACP505.83.1 ≈ 394110
PS40510.52.1 ≈ 2116135
ACM534.51.2 ≈ 1145160
Importantly, as a result of adsorption up to 26.7 Pa equilibrium pressure, a strongly bound di-amino complex with Brönsted acid type acids was produced on ACM and PS40 samples. It is noticeable that samples with less pore diameter and greater surface area produced stronger active sites for ammonia adsorption: differential heat profiles obtained for ACM and PS40 clearly show a significant increase of Qdiff in the case of the other samples (ACP and ZMOR). However, it has to be noticed here that there is also the decrease of both Virr value and initial differential heat of NH3 adsorption in the case of ACP (see Figure 3b and Table 3), as it was found in the case of N2O adsorption. Instead of di-amino complexes being formed between two ammonia molecules strongly bonded to the Brönsted acid groups in the ACP sample, in the case of ZMOR, only one ammonia molecule is probably that can be chemisorbed per one carboxylic group of the samples. Similarly to nitrous oxide adsorption it could be concluded that ammonia molecules cannot access all superficial groups in the structure. All these data can be understood as indicating the possible presence of different surface groups in the porous solids synthesized in this work, and nature, for example between ZMOR and PS40. The profiles of differential heats versus gas uptake (μmol/g), for both N2O and CO adsorption on all samples are presented in Figure 3a,b. It is evident that differential heats of adsorption of N2O are lower than those of CO, indicating a weaker interaction. Differential heats of N2O adsorption between 100 and 20 kJ/mol were determined. Taking into account the amounts of irreversibly adsorbed N2O, it can be inferred that only those N2O molecules bonded with differential heats higher that 60 kJ/mol are chemisorbed ones. It is evident from Figure 3a that an insignificant number of such strong sites exists in a ZMOR sample. On the contrary, the highest amount of the strongest sites for N2O adsorption is found in the ACM sample that exhibits a different distribution of active sites in comparison with the other samples (see Figure 3a). The results presented so far are a clear indication that samples with higher surface area and minor diameter pore have stronger active sites in CO adsorption that in N2O adsorption.
Figure 3. Differential heats of adsorption on ACM at 323 K: (a) adsorption of N2O; (b) adsorption of CO; (c) adsorption of CO on ACM previously contacted with N2O. In all cases, the samples were activated at 973 K in vacuum.
Energies 04 00928 g003aEnergies 04 00928 g003b
Therefore, it could be concluded that CO would be adsorbed primarily in the case of possible competitive co-adsorption of these two gases. Here, the experiment of CO adsorption on the ACM sample previously contacted with N2O was performed. Before the CO adsorption, N2O was adsorbed at RT and subsequently, pumped at the same temperature. After that, the adsorption of CO was completed. In that way, carbon monoxide was adsorbed on the surface partly covered with strongly bonded N2O molecules. Figure 4c shows the obtained differential heats of CO adsorption. The profiles Qdiff versus gas uptake (μmol/g) obtained for single adsorption (of CO or N2O) are presented on the same figure for the comparison. It is important to notice that the profile obtained for CO adsorption on the surface previously contacted with N2O is almost identical to that one obtained for the adsorption of CO on an empty surface, but only in the first part of adsorption procedure. It is evident from all presented results that the investigated sample posses a bigger number of sites active for CO adsorption, in comparison with those active in N2O adsorption. A first part of profile Qdiff versus CO uptake, identical to that one found in the adsorption of CO on one empty surface could be considered as a result of CO adsorption on unoccupied active sites. After the adsorption on these unoccupied sites, the increase of differential heats of CO adsorption, compared with those obtained in the case of CO adsorption on an “empty” surface, was obtained. This result could be comprehended as an indication of possible reaction between adsorbed nitrous oxide and carbon monoxide from the gas phase.
In order to observe the consistency between the amount adsorbed and the heat produced in the adsorption establishing a relationship like that proposed Pudipeddi, et al. [32] in which it is proposed that the amounts of heat as a function of relative pressure, allows one to find the amount adsorbed in the monolayer, Vm, and enthalpy that occurs in the adsorption of the first layer of adsorbate H1. Figure 4 shows the heat curves for the of amount ammonia adsorbed depending on the relative pressure, observing that the tendency of the curves is similar and from these you can find the values given for the case specific determinations were made for adsorption of ammonia on the sample ACM is a value for the constant C which is equal to exp [(H1 − HL)/RT] of 10.61 and the amount adsorbed in the monolayer 330.6 μmol/g, which corresponds to the sample with higher adsorption for ammonia.
Figure 4. Heats absorbed for ammonia in function of relative pressure.
Energies 04 00928 g004

3. Experimental Section

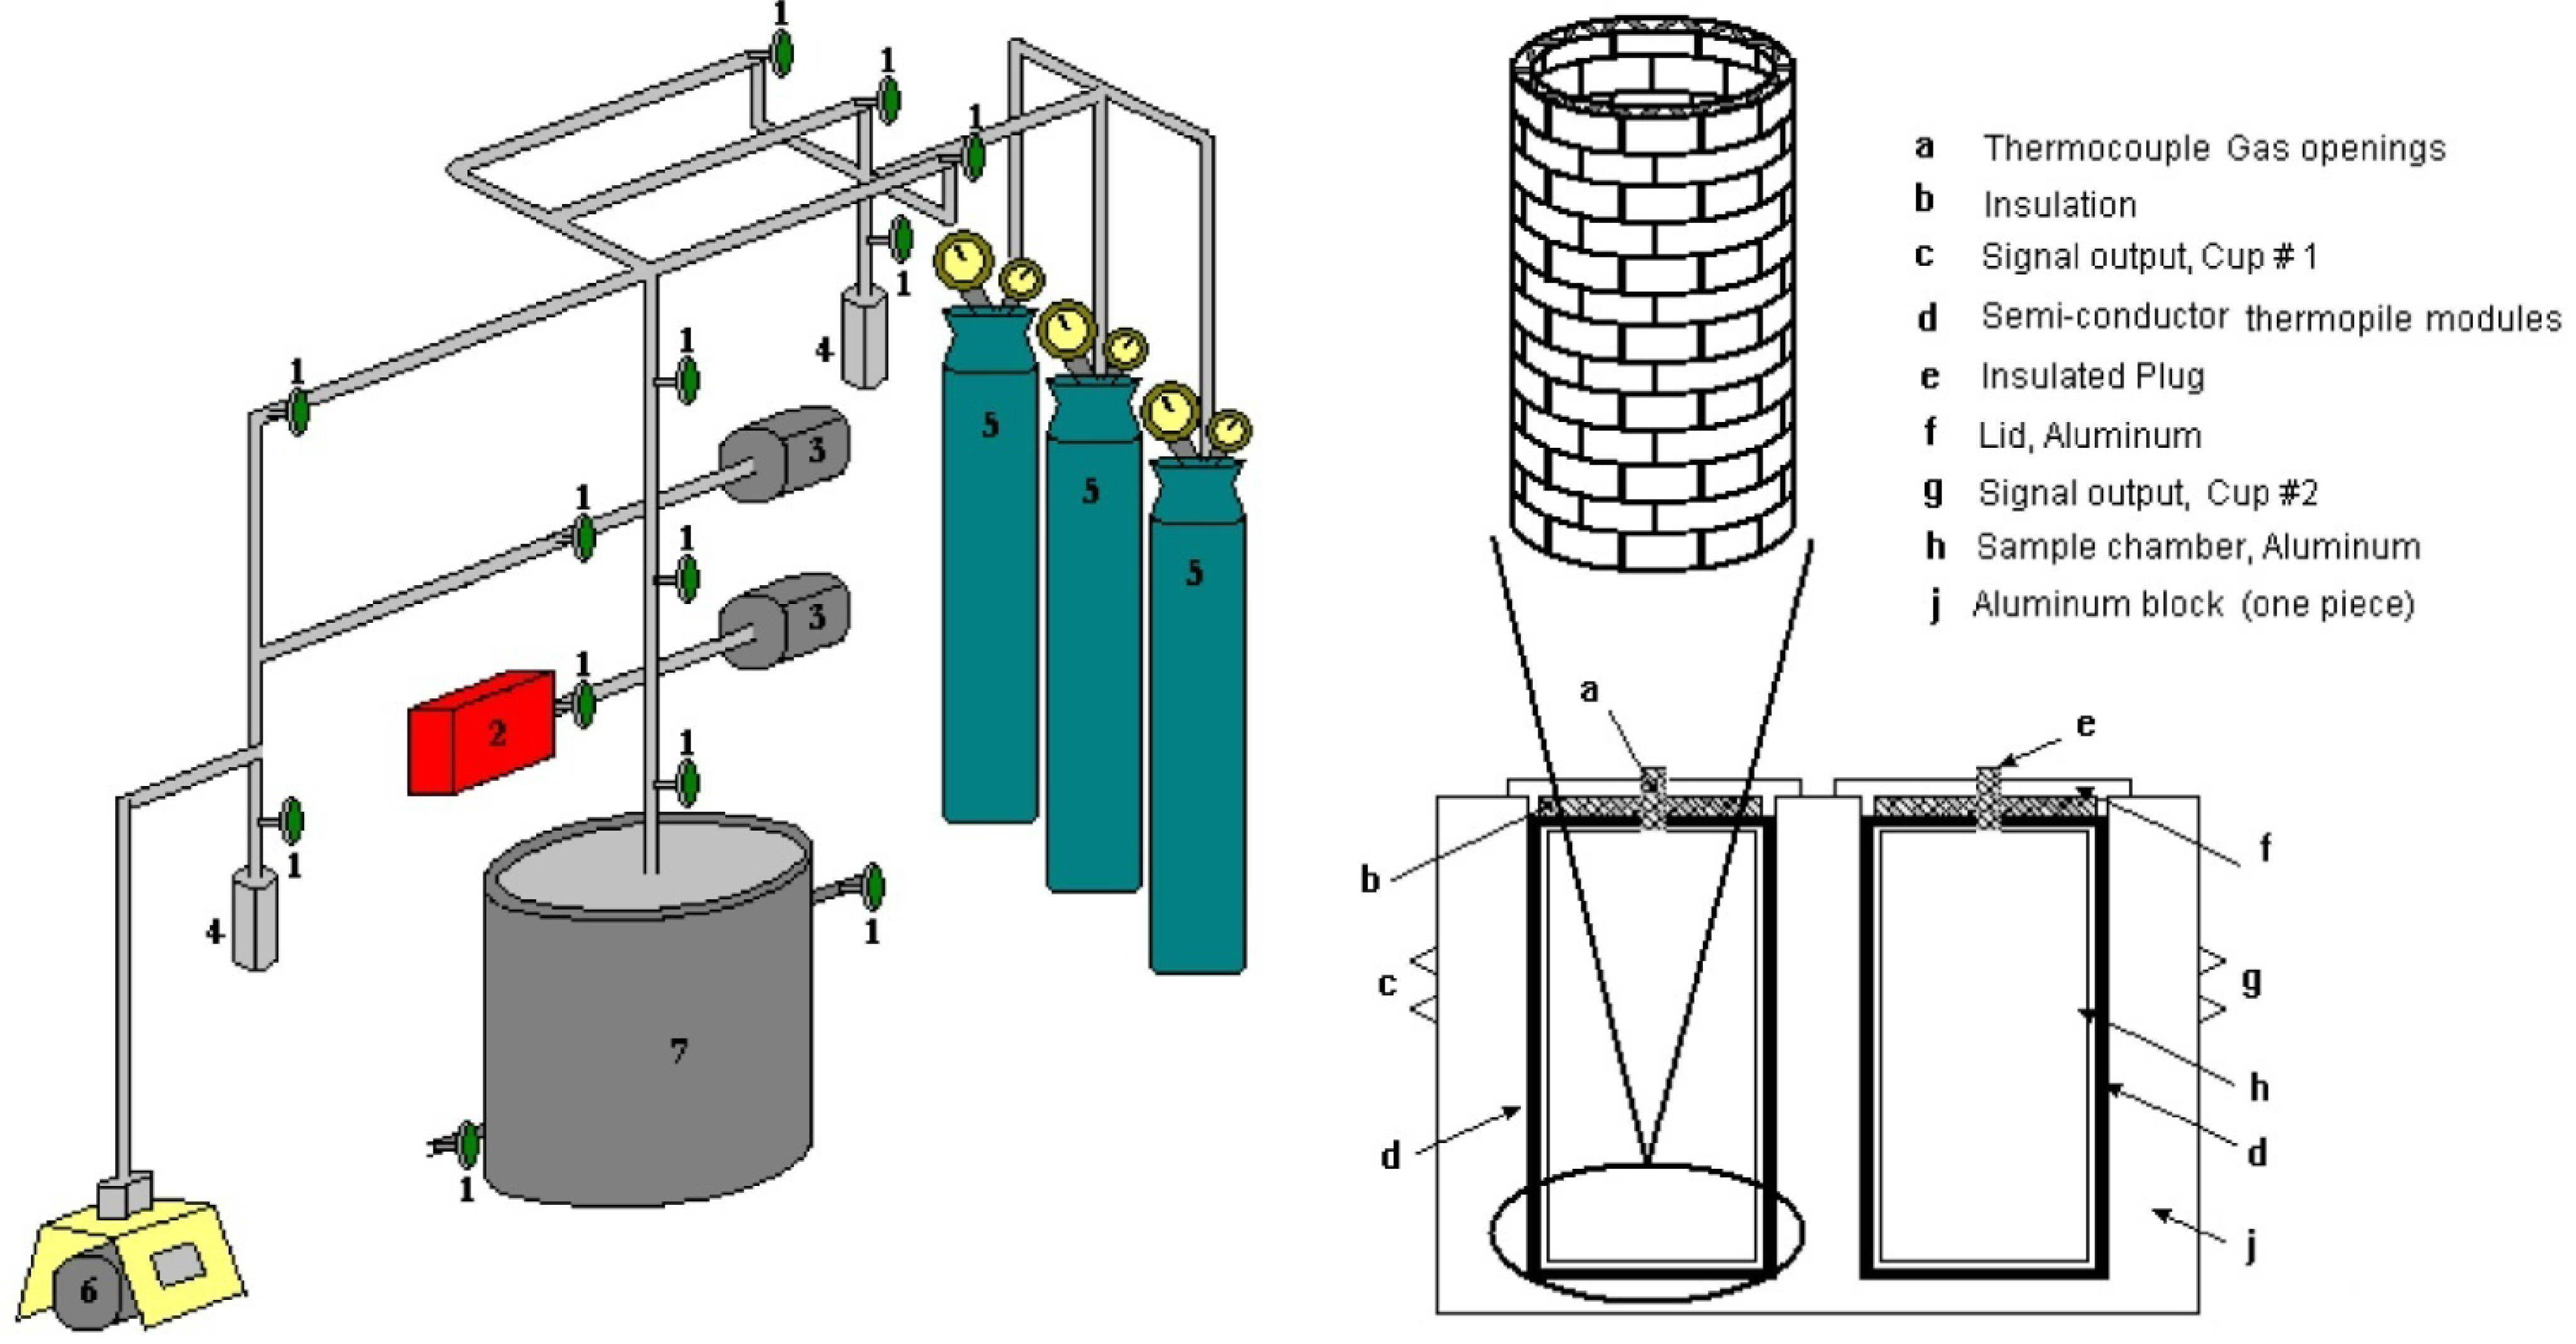
3.1. Description of the Newly Built Microcalorimeter

In Figure 5 must be in numerical order a schematic diagram is shown of the cells and the peripheral equipment used in this work [29,30]. The system was set to achieve a vacuum of about 10−4 Pa. A portion of the dosage section was constructed in Pyrex glass using valves with a hermetic seal to avoid leaks. To minimize the gas leaks and have a better control on their dosage, the glass system was coupled to a stainless steel device with high precision valves. It was necessary to put a valve between the dosage section and the calorimetric cells to control the gas injection velocity. The leak velocity was kept under 10−1 Pa min−1 to ensure exact measurements of the equilibrium pressures and to minimize the contamination of the sample with atmospheric oxygen. The connections between the glass and the steel devices were specially made with O-rings to avoid gas leaks.
Figure 5. Schematic of an adsorption microcalorimeter: 1. Precision valves, 2. Calibration volume, 3. Pressure transducter of full pressure, 4. Cold Trap, 5. Injection gases, 6. High-vacuum pump, and 7. Adsorption microcalorimeter.
Energies 04 00928 g005
The calorimeter is compound composed of an aluminium central block that acts as a heat deposit and is isolated from the surroundings to maintain the temperature of interest, and two thermal transducers imbibed in the aluminium block assembled in a twin-type system in order to operate as the sample and the reference cells. The sensors are put into the aluminium block and are perfectly adjusted to prevent air convection currents that could generate fluctuations in the baseline, which is a contribution from this design compared to other calorimeters reported in the literature [1]. The high thermal conductivity and the big mass of the aluminium block adds enough baseline stability to the equipment to integrate the signals of the heat response curves generated by the micromolar dosage of some of the gases. The aluminium block is surrounded by a heater constructed from mica which is connected to a power source and isolated from the stainless steel chamber useful for working at temperatures of about 77 K. A temperature controller keeps the block in the desired adsorption temperature range ±0.1 K.
The heat flux signals are measured by assembling the transducer, which is built to the required specifications by the International Thermal Instruments CorpTM (Del Mar, CA, USA). Each unit contains thermopiles, which consist of hundreds of thermo elements that operate under the Seebeck Effect, connected in series in a “thimble-type” configuration that permits them to completely surround the glass-built calorimetric cells (these cells are interchangeable for similar ones built from stainless steel) and allows their removal for treatments at high temperatures. A thermal diffuser plate, inserted between the cell and the thermopiles, ensures good heat distribution through the surface of the thermo battery. The thermal transducer units both in the sample and in the reference should have units with a similar sensitivity. To correctly evaluate the thermal effect signals, it is necessary to properly study the base line stability of the thermo element signals.
The samples are put into the calorimetric cells via a 5 mm diameter glass tube (or stainless steel tube). The maximum accepted volume of sample is 5 cm3, which corresponds to 2 mm of the 30 mm long cell, since 20 mm of the cell are not in contact with the thermo elements. The samples, especially powders, can be compressed (107–108 Pa) to improve the layer conduction or the inter-particular diffusion of the adsorbate molecules.

Design of the Calorimetric Cell

Taking into account the fact that quartz is a poor heat conducer compared to metals, the glass cells were built as thin as possible in the walls in contact with the heat flux sensors. The design of this piece of equipment is simple. It consists of cells 5 mm in diameter and 40 mm long with walls made of glass and stainless steel, which are easily coupled hermetically to the adsorption system. These cells are used for the treatment of samples with static gases.

3.2. Samples Used

3.2.1. Preparation of the Carbon Monolith

The monolith used in this research was synthesized according to [30]. Husks from Colombian coffee beans were impregnated with an aqueous solution of phosphoric acid following a variation of the incipient wetness method, as described elsewhere. This consisted of the dropwise addition (while stirring the solid to facilitate homogeneous absorption of the liquid) of the amount of aqueous solution (1.4 mL g−1 coffee bean husks) necessary to produce swelling until incipient wetness. A concentration of H3PO4 in aqueous solution was used as impregnant agent, which will be expressed as impregnation ratio (Xp, wt%), defined as (gram H3PO4 per g coffee bean husks) ×/100. Impregnation ratio of 150 wt% were used. After impregnation, the samples were dried for 4 h at 383 K in air. Pyrolysis treatment (activation) was carried out in a vertical tubular reactor made of quartz, using 10 g of impregnated and dried material in all cases. The treatment was performed at a constant heating rate of 10 K min−1 and with an argon (99.999% pure) flow of 50 STP cm3 min−1, which was maintained during both heating and cooling. An activation temperature of 723 K and a soaking time of 1 h were used. After cooling the solid pyrolysis residue to room temperature it was washed with Milli-Q distilled water until the conductivity of the washing liquids was reduced to <5 μS cm−1 (measured with a pH/conductivity meter Mettler Toledo, model MPC227,US). The resulting ACs were dried at 383 K for 12 h in a vacuum furnace. This sample was labelled as ACM.
The monolith was prepared by pressing at 2.0 kPa at temperature of 423.15 K. The final shape of the monolith was 5 mm in thickness and 12 mm in diameter.

3.2.2. Granular Activated Carbon

Granular activated carbon (GAC) produced from peach stones by the two-stage thermal method using carbon dioxide as the activating agent was primarily used in this work. This GAC was labelled as PS40, since the burn-off percentage achieved during the activation was 40%. This experimental method followed a previously reported method [31]. The synthesized GAC was sieved (to obtain particles in the size range of 1.0–1.6 mm), thoroughly washed with Bowling Milli-Q water, dried at 283 K for 12 h and stored in a desiccator until use in the ozone decomposition experiments.

3.2.3. Activated carbon pellets

This research followed a procedure reported in the literature [30]. Anhydrous cellulose microcrystal powder (Merck Co. Ltd., Whitehouse Station, NJ, USA) was used as the raw material. The size of the crystals was about 15 mm. About 2.0 g of the raw material was placed between the pistons in the die and a mechanical pressure, P, was applied to them for 1 min with an oil hydraulic machine. The pressure range was from 0 to 100.0 MPa. After the compression, the raw material was ejected from the die in the form of columnar pellets. The pellets were then carbonized by an electric furnace at the rate of 10 K min−1 up to 1073 K under nitrogen. The nitrogen flow rate and the carbonization period were 500 cm min−1 and 6 h, respectively. When the carbonization process had finished, the nitrogen was replaced with carbon dioxide. To activate the carbon pellets, they were heated at the rate of 10 K min−1 from 1073 to 1173 K under carbon dioxide. The carbon dioxide flow rate was 500 cm min−1. The activation periods ranged from 6 to 19 h. The samples were gradually cooled to room temperature under carbon dioxide after the activation period. This sample was labelled ACP.

3.2.4. Zeolite

NaY was a commercial sample from Union Carbide. This sample was labelled as ZMOR.

3.3. Pore Structure Characterization

The BET surface area and porous properties of each AC were determined from N2 adsorption experiments. The porous solids were characterized by N2 adsorption at 77 K using a Quantachrome model 3B Autosorb (Quantachrome Instrumens, Boynton Beach, Miami, FL, US). The porous solids samples was outgassed for 24 h at 573 K to remove any moisture or adsorbed contaminants that may have been present on their surface. The manufacturer’s software can provide BET surface area (SBET) of the carbons by applying the BET equation to the adsorption data. The microporous surface (Smicro) and external surface (Sext), as well as the micropore volume (Vmi) were evaluated by the t-plot method, and mesopore volume (Vme) was estimated by the Barrett–Joyner–Halenda (BJH) method [11]. The total pore volume was evaluated by summation of microporous and mesoporous volumes. The mean pore diameter, Dp, was calculated from Dp = 4VT/S [8], where VT is the total volume of pores, and S is the BET surface area.

3.4. Chemical Characterization

The pH of the samples in suspension provides information about the average acidity and basicity of the surface. A sample of 1.0 g of dry porous solid powder was added to 50 mL deionized water and the suspension was stirred overnight to reach equilibrium. Then the solution was filtered and the pH of the filtrate was measured by a Sartorius pH Meter (PB-20). The amounts of total surface acidic groups of the solids were determined according to the method of Boehm [11]. One gram of AC sample was placed in 50 mL of 0.05 N sodium hydroxide solution. The vials were sealed and shaken for 24 h and then 5 mL of the filtrate was pipetted and the excess of base was titrated with HCl. The numbers of acidic sites were calculated from the amount of NaOH that reacted with carbon.

3.5. Determination of Adsorption Heats

The ammonia (or CO and N2O) dynamic adsorption was studied using the adsorption microcalorimter design in our laboratory fitted with a thermal conductivity detector. The heats and amounts of adsorption/desorption have been obtained after applying dead volume corrections to the raw results. The arrival of ammonia, or CO and N2O to the downstream detector, which was a thermal conductivity detector, was accurately determined for each case from blank experiments in which the calorimetric cell was filled with a low surface area solid, such as quartz sand, producing negligibly small heat effects and uptakes of NH3 (or CO and N2O). In situ electrical calibration was carried out for each experiment. Before the measurements the samples were purged with N2 at 403 K for 24 h. Then the N2 flow was exchanged by a 5% NH3/N2 mixture (or 5% CO/N2 and 5% N2O/N2). Heats of adsorption and the corresponding amounts of adsorbed ammonia (or CO and N2O) were measured. The data were collected every second and measured the rates of heat evolution, in microvolts, and the rates of NH3 (or CO and N2O) uptake or release in nanomoles per second. After saturation of the sample was complete, desorption was performed by switching the mixture to N2. In all cases, the amount desorbed and heat produced in the desorption were smaller than those in the adsorption cycle. Therefore, both chemisorption and reversible adsorption takes place during the initial saturation. Following desorption of the reversible component of the initial adsorption, a second adsorption-desorption cycle which is reversible, was measured. The heats and amounts of the reversible adsorption are then subtracted from the combined quantities obtained in the initial cycle, the difference representing irreversible adsorption assumed to be chemisorption. Changes in the differential molar heats of desorption taking place during the adsorption processes can be calculated by dividing the rates of heat evolution by the corresponding adsorption quantities.

4. Conclusions

Using a modern adsorption microcalorimeter built in our laboratory, we established the adsorption heats of various porous solids and correlated these values with pore size. Adsorption isotherms were determined. The porous solids used had a microporosity and mesoporosity with isotherms of types I at the beginning of adsorption and then the characteristics of type IV. This work showed that adsorption calorimetry can be used to measure the porosity of activated carbons, with results consistent with their textural properties.
The values of differential heats of N2O adsorption in the investigated systems have shown that this interaction is weaker than that with CO. Small amounts of N2O are chemisorbed in the investigated systems. For the room temperature adsorption of N2O, the strongest active sites for the interaction with Brönsted acid groups in the ACM structure were identified. The values determined are between −60 kJ/mol and −110 kJ/mol for ZMOR and ACM, respectively, for the adsorption N2O and −95 kJ/mol and −130 kJ/mol for the adsorption of CO. On the other hand, the thermal effects were associated with surface area and the functional groups of surface in solids.

Acknowledgements

The authors thank the Departments of Chemistry of the Universidad Nacional de Colombia, Universidad de Los Andes (Colombia) and Universidad Nacional de San Luis (Argentina) and the Master Agreement established between these institutions. Special gratitude is expressed to the Fondo Especial de Investigaciones de la Facultad de Ciencias de la Universidad de Los Andes (Colombia) for its partial financial support.

References

  1. Gravelle, P.C. Calorimetry in adsorption and heterogeneous. Catal. Rev. Sci. Eng. 1977, 16, 37–110. [Google Scholar] [CrossRef]
  2. Sircar, R.; Cao, D.V. Heat of adsorption. Chem. Eng. Technol. 2002, 25, 945–949. [Google Scholar] [CrossRef]
  3. Auroux, A.; Vedrine, J.C.; Gravelle, P.C. Differential molar heats of adsorption of ammonia on silicious mordenites at high temperature. In Adsorption at the Gas-Solid and Liquid-Solid Interface; Rouquerol, J., Sing, K.S.W., Eds.; Elsevier Science Publishers: Amsterdam, The Netherlands, 1982; pp. 305–322. [Google Scholar]
  4. Prinsloo, J.J.; Gravelle, P.C. Volumetric and calorimetric study of the adsorption of hydrogen, at 296 K, on silica-supported nickel and nickel-copper catalysts. J. Chem. Soc. Faraday Trans. 1980, 76, 2221–2228. [Google Scholar] [CrossRef]
  5. Auroux, A.; Gravelle, P.C. Comparative study of the bond energy of oxygen at the surface of supported silver catalysts and of the activity of these catalysis for ethylene epoxidation. Thermochim. Acta 1981, 47, 333–342. [Google Scholar]
  6. Gravelle, P.C.; Teichner, S.J. Carbon monoxide oxidation and related reactions on a highly divided nickel oxide. Advan. Catal. 1969, 20, 167–266. [Google Scholar]
  7. Gravelle, P.C. Netsu, Ondo Sokutei to Netsu Bunseki; Kagaku Gijitsu-Sha Pub: Tokyo, Japan, 1980; pp. 21–42. [Google Scholar]
  8. Adamson, A.W. Physical Chemistry of Surface; Interscience Publishers: London, UK, 1960. [Google Scholar]
  9. Brunauer, S. The Adsorption of Gases and Vapors, Vol I; Princeton University Press: Princeton, NJ, USA, 1945. [Google Scholar]
  10. Hill, T.L. statistical mechanics of adsorption V. thermodynamics and heat of adsorption. J. Chem. Phys. 1949, 17, 520–536. [Google Scholar] [CrossRef]
  11. Hill, T.L. Statistical mechanics of adsorption IX. Adsorption thermodynamics and solution thermodynamics. J. Chem. Phys. 1950, 18, 246–257. [Google Scholar] [CrossRef]
  12. Everett, D.H. The thermodynamics of adsorption. Part III—Analysis and discussion of experimental data. Trans. Faraday Soc. 1957, 46, 957–973. [Google Scholar] [CrossRef]
  13. Hill, T.L.; Emmett, P.H.; Joyner, L.G. calculation of thermodynamic functions of adsorbed molecules from adsorption isotherm measurements: Nitrogen on graphon. J. Am. Chem. Soc. 1951, 73, 5102–5110. [Google Scholar] [CrossRef]
  14. Rouquerol, F.; Rouquerol, J.; Sing, K.S.W. Adsorption by Powders and Porous Solids; Academic Press: San Diego, CA, USA, 1999. [Google Scholar]
  15. Rouquerol, J.; Avnir, D.; Fairbridge, C.W.; Everett, D.H.; Haynes, J.M.; Pernicone, N.; Ramsay, J.D.F.; Sing, K.S.W.; Unger, K.K. Recommendations for the characterization of porous solids (Technical Report). Pure Appl. Chem. 1994, 66, 1739–1758. [Google Scholar]
  16. Do, D.D. Adsorption Analysis: Equilibria and Kinetics; Imperial College Press: Singapore, 1998. [Google Scholar]
  17. Moreno, J.C.; Giraldo, L. Setups for simultaneous measurement of isotherms and adsorption heats. Rev. Sci. Instr. 2005, 76, 1–8. [Google Scholar] [CrossRef]
  18. Huertemendia, M.; Giraldo, L.; Parra, D.; Moreno, J.C. Adsorption microcalorimeter and its software: Design for the establishment of parameters corresponding to different models of adsorption isotherms. Instrum. Sci. Technol. 2005, 33, 645–660. [Google Scholar] [CrossRef]
  19. Steckler, D.K.; Goldberg, R.N.; Ferrari, Y.B.; Buckley, T.J. High precision microcalorimetry: Apparatus, procedures, and biochemical applications. J. Res. Nat. Bur. Stand. 1986, 91, 113–121. [Google Scholar] [CrossRef]
  20. Gunn, S.R. comparison standards for solution calorimetry. J. Am. Chem. Soc. 1965, 69, 2902–2913. [Google Scholar]
  21. Russell, D.J.; Thomas, D.; Hansen, L.D. Batch calorimetry with solids, liquids and gases in less than 1 mL total volume. Thermochim. Acta 2006, 446, 161–167. [Google Scholar] [CrossRef]
  22. Lerchner, J.; Wolf, G.; Auguet, C.; Torra, V. Accuracy in integrated circuit (IC) calorimeters. Thermochim. Acta 2002, 382, 65–76. [Google Scholar]
  23. Lerchner, J.; Wolf, A.; Wolf, G.; Fernandez, I. Chip calorimeters for the investigation of liquid phase reactions: Design rules. Thermochim. Acta 2006, 446, 168–175. [Google Scholar] [CrossRef]
  24. Moreno, J.C.; Giraldo, L. influence of thermal insulation of the surroundings on the response of the output electric signal in a heat conduction calorimetric unit. Instrum. Sci. Technol. 2005, 33, 415–425. [Google Scholar] [CrossRef]
  25. Garrone, E.; Ghiotti, G.; Giamello, E.; Fubini, B. Entropy of adsorption by microcalorimetry. Part 1. J. Chem. Soc. Faraday Trans. 1 1981, 77, 2613–2620. [Google Scholar] [CrossRef]
  26. Giraldo, L.; Huertas, J.I.; Valencia, A.; Moreno, J.C. A Heat conduction microcalorimeter for the determination of the immersion heats of activated carbon into phenol aqueous solutions. Instrum. Sci. Technol. 2003, 31, 385–397. [Google Scholar] [CrossRef]
  27. Yff, B.T.S.; Royall, P.G.; Brown, M.B.; Martin, G.P. An investigation of calibration methods for solution calorimetry. Int. J. Pharm. 2004, 269, 361–372. [Google Scholar] [CrossRef] [PubMed]
  28. Barata-Rodríguez, P.M.; Mays, T.J.; Moggridge, G.D. Structured carbon adsorbents from clay, zeolite and mesoporous aluminosilicate templates. Carbon 2003, 41, 2231–2246. [Google Scholar] [CrossRef]
  29. Garcia-Cuello, V.S.; Moreno-Piraján, J.C.; Giraldo-Gutierréz, L.; Sapag, K.; Zgrablich, G. A new microcalorimeter of adsorption for the determination of differential enthalpies. Microporous Mesoporous Mater. 2009, 120, 239–245. [Google Scholar] [CrossRef]
  30. Garcia-Cuello, V.S.; Moreno-Piraján, J.C.; Giraldo-Gutierréz, L.; Sapag, K.; Zgrablich, G. Adsorption microcalorimeter design and electric calibration. J. Therm. Anal. Calorim. 2009, 97, 711–715. [Google Scholar] [CrossRef]
  31. Baquero, M.C.; Giraldo, L.; Moreno, J.C.; Suarez-Garcia, F.; Martinez-Alonso, A.; Tascon, J.M.D. Activated carbons by pyrolysis of coffee bean husk in presence of phosphoric acid. J. Anal. Appl. Pyrol. 2003, 70, 779–784. [Google Scholar] [CrossRef]
  32. Pudipeddi, M.; Sokoloski, T.D.; Duddu, S.P.; Carstensen, J.T. quantitative characterization of adsorption isotherms using isothermal microcalorimetry. J. Pharm. Sci. 1996, 85, 381–386. [Google Scholar]

