1. Introduction
Since the beginning of the Industrial Revolution, the world’s population has continued to increase, adding each subsequent billion in a span of fewer years than ever before. The world hit the 4 billion mark in 1974, 5 billion just 13 years later, in 1987, and passed the 6 billion milestone 12 years later in 1999 [
1]. The world population is likely to reach 7 billion in the latter half of 2011, again in a span of 12 years [
2]. Population growth has led to land use change through intensification of agriculture, and improved contemporaneous increases in average standards of living have substantially increased energy use [
1]. Changing land use and increased fossil fuel combustion for meeting the growing energy demand are the primary causes for augmented carbon dioxide (CO
2) concentration in the atmosphere [
3]. The anthropogenic contribution in global warming is substantial and is evident in the rising global and ocean temperatures, extensive melting of snow and ice, and rise in the global average sea level [
3]. The need for quantification of anthropogenic fossil fuel CO
2 emissions in the atmosphere at finer spatial and temporal resolutions has been felt by the scientific and policymaking communities since the last decade [
4]. From the policy-making perspective it is necessary to construct emission inventories in order to monitor and agree upon emission reduction targets [
5]. Spatial distribution of emissions is also an important input to “atmospheric-inversion” methods, which combine CO
2 concentration measurements with transport and process models to estimate land and ocean CO
2 sources and sinks [
6,
7,
8,
9]. Anthropogenic CO
2 emissions disrupt the equilibrium of the carbon cycle and makes it all the more important to monitor the spatial distribution of CO
2 emissions.
Most of the existing inventory on the spatial distribution of CO
2 emissions is available on a national basis. The U.S. Department of Energy’s Carbon Dioxide Information Analysis Center (CDIAC) and the International Energy Agency (IEA) provide a global database of CO
2 emissions for countries. The national geographic distribution of CO
2 emissions has been disaggregated to finer resolutions (1° grid resolution) using population density grids as proxy measures [
10,
11,
12,
13]. Although the population density grid provides a reasonably good proximate measure of CO
2 emissions at a spatial resolution of 1°, it is not capable of providing satisfactory maps depicting geographic distribution of CO
2 emissions at a resolution finer than this. This is because the population density grids do not depict transportation links and emissions from power stations. Moreover, the census data on which these population density grids are based are collected at specific spatial units and disaggregating these data to the source regions is problematic [
13].
From a satellite remote sensing perspective, it is possible to measure the CO2 concentration in the atmosphere at coarse spatial resolution using high spectral resolution infrared interferometer data. Examples of such systems include the Japanese Greenhouse Gas Observing Satellite (GOSAT) and NASA’s planned Orbiting Carbon Observatory (OCO). With data from these systems the CO2 signal from major urban centers are diffused and spatially offset from the sources due to the coarse spatial resolution, atmospheric transport, mixing, and retention of CO2 in the atmosphere. Thus it is difficult to discern increases or decreases in CO2 emissions from specific cities or towns from systems such as GOSAT by themselves. Application of inversion methods to detect changes in fossil fuel carbon emissions would require surface maps of fossil fuel CO2 emissions. There are databases that list the locations and estimated emissions for electric power utilities (e.g., Carbon Monitoring for Action “CARMA”). This leaves the spatial distribution of non-point sources (from vehicles, homes and businesses) as a major gap in the mapping of fossil fuel CO2 emissions that would enable inversion modeling changes in emissions based on GOSAT or OCO style data.
The Defense Meteorological Satellite Program’s Operation Linescan System (DMSP-OLS) satellite-observed nightlight data acts as a suitable proximate measure for mapping the distribution of CO
2 emissions at a finer spatial resolution. Elvidge
et al. [
14] was the first to identify the correlation between lit area of lights and CO
2 emissions. Doll
et al. [
15] built upon this relationship and created the first global grid of CO
2 emissions at 1° × 1° resolution. A 6-month 1-kilometer stable light composite acquired between October 1994 and March 1995 was used in this study. Country level relationships between lit area and CO
2 emissions were used to create global maps of these parameters. This map was then compared to CDIAC’s CO
2 emissions map. Comparison with CDIAC’s CO
2 emissions map showed that the emissions map created from the nighttime lights resulted in an underestimation of CO
2 emissions for most countries. However, the nighttime lights image did a superior job in mapping the spatial distribution of the emissions [
16]. Under- and over-estimation of CO
2 emissions predicted from the nighttime image is expected because countries usually have more or less emissions than what is predicted from the nighttime lights, as the lights and CO
2 emissions do not always have a direct linear relationship. This was observed in the case of many of the former Soviet Republics by Doll
et al. [
15]. The authors noted that many of the former Soviet Republics appeared to have more emissions than what was predicted from the nighttime lights [
16].
Other recent efforts at developing a fine resolution CO
2 emissions map is the one by Rayner
et al. [
17].They developed a “model-data synthesis” approach called the “Fossil Fuel Data Assimilation System” (FFDAS). Using two main datasets—the gridded population data and satellite observed nighttime lights they produced global fossil fuel CO
2 emission fields based on the Kaya identity. Realizing the saturation of the nighttime lights as a major problem in areas of high light intensity, they developed a “global correction factor” which was used to correct the saturation errors in the nighttime lights image. Then, these ‘corrected’ spatial data were used to create the fine resolution CO
2 emissions map.
Oda and Maksyutov [
13] have developed a global high resolution annual CO
2 emission inventory for the years 1980–2007, named Open-source Data Inventory of Anthropogenic CO
2 emission (ODIAC) to inform the observational data collected by satellites such as the Japanese Greenhouse gas Observing SATellite (GOSAT), especially for CO
2 emissions regional flux inversions study. They estimated national emissions using global energy consumption statistics. Emissions from power plants were estimated separately using the Carbon Monitoring for Action (CARMA) database. The CARMA CO
2 emissions were directly mapped on power plant locations using the coordinate information, and the residual emissions (total emissions minus power generation emission) were distributed using the nighttime lights image as a proxy. Since the nighttime image is available in 30 arc-second grid (approximately 1 km), the CO
2 emission map was also mapped at a resolution of 1 km
2. In order to correct for the saturation of lights in the city centers in the stable light images, Oda and Maksyutov [
13] obtained radiance values from the 1996–1997 radiance-calibrated nighttime image, and using a conversion equation converted the digital number (DN) values between 0–254 for all the stable light images of the years 1980–2007 to radiance values. Oda and Maksyutov [
13] determined the spatial distribution of emissions based on a linear correlation between nightlights and CO
2 emissions, and also assumed it to be uniform over different countries, though in actuality the relationship maybe strongly country-dependent. They have discussed these drawbacks in their paper.
Gurney
et al. [
18] at Purdue University have created a Vulcan U.S. fossil fuel CO
2 emissions inventory for the year 2002. The total carbon emissions grid is available in 10 km as well as 0.1 degree resolution and the sectoral carbon emissions are available at 0.1 degree resolution. The Vulcan dataset was developed based on fine scale reported inventory by individual source economic sectors, and is perhaps the best available carbon emissions inventory available for the U.S. at such a fine spatial and temporal resolution. The Vulcan dataset will be discussed in greater details in a later section.
In this paper, we have built upon the previous efforts at creating a global CO2 emissions grid from the nighttime satellite image and population grid and have tried to address some of the drawbacks of the previous studies. Two separate models were built, Model 1 and Model 2. Model 1 was developed based solely on the statistical correlation between the nighttime lights and selected Vulcan sectors. The coefficient derived from Model 1 was applied to the nighttime lights of the world to estimate global CO2 emissions. Since the Vulcan emissions data for the U.S. is the best available fine resolution data for any country of the world, it was hypothesized that the coefficients derived through Model 1 when applied to the global nighttime image would provide fairly accurate estimations of CO2 emissions for other countries as well. However, Model 1 did not provide satisfactory results and so Model 2 was developed. In Model 2, CO2 emissions were allocated using a combination of DMSP nighttime lights and DOE Landscan population count data.
3. Methods and Results
The estimated CO2 emissions grid of the world which was created from the DMSP-OLS nighttime lights image and the LandScan population grid were developed through experimentation with two models. Model 1, based solely on the correlation between the nighttime lights and the Vulcan dataset did not give satisfactory results, and so Model 2 was developed. The two models are discussed separately.
3.1. Model 1
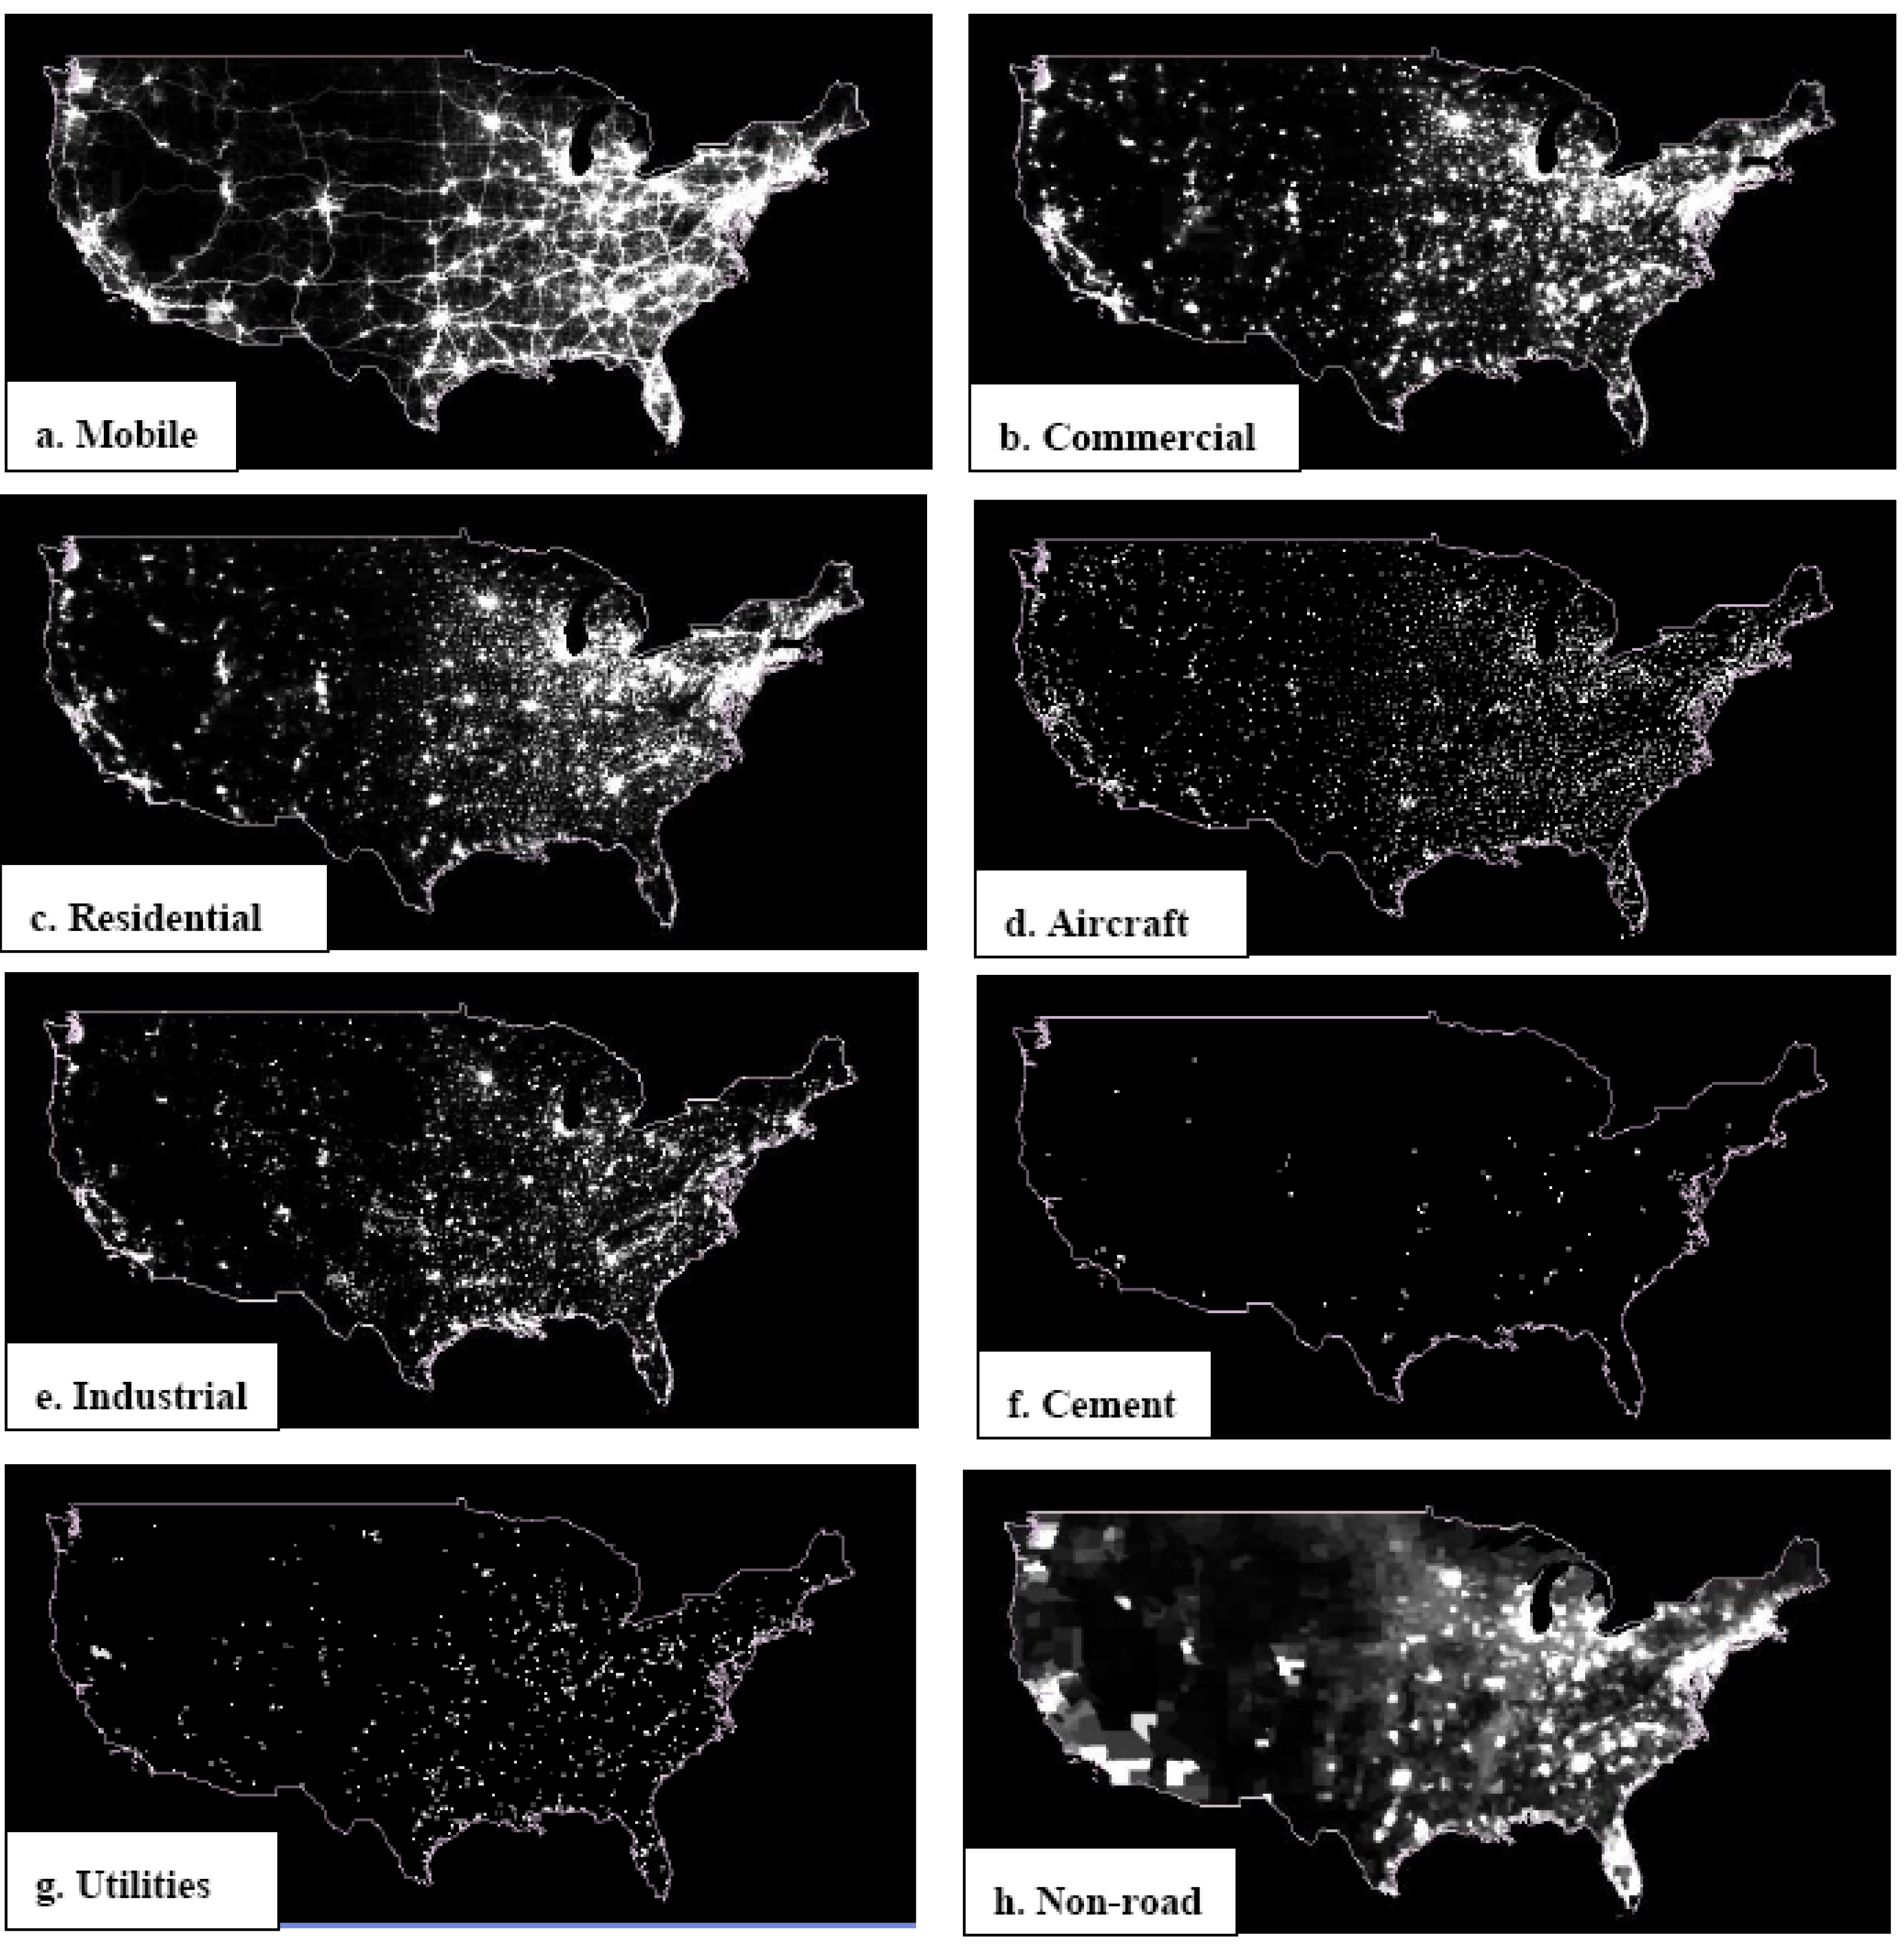
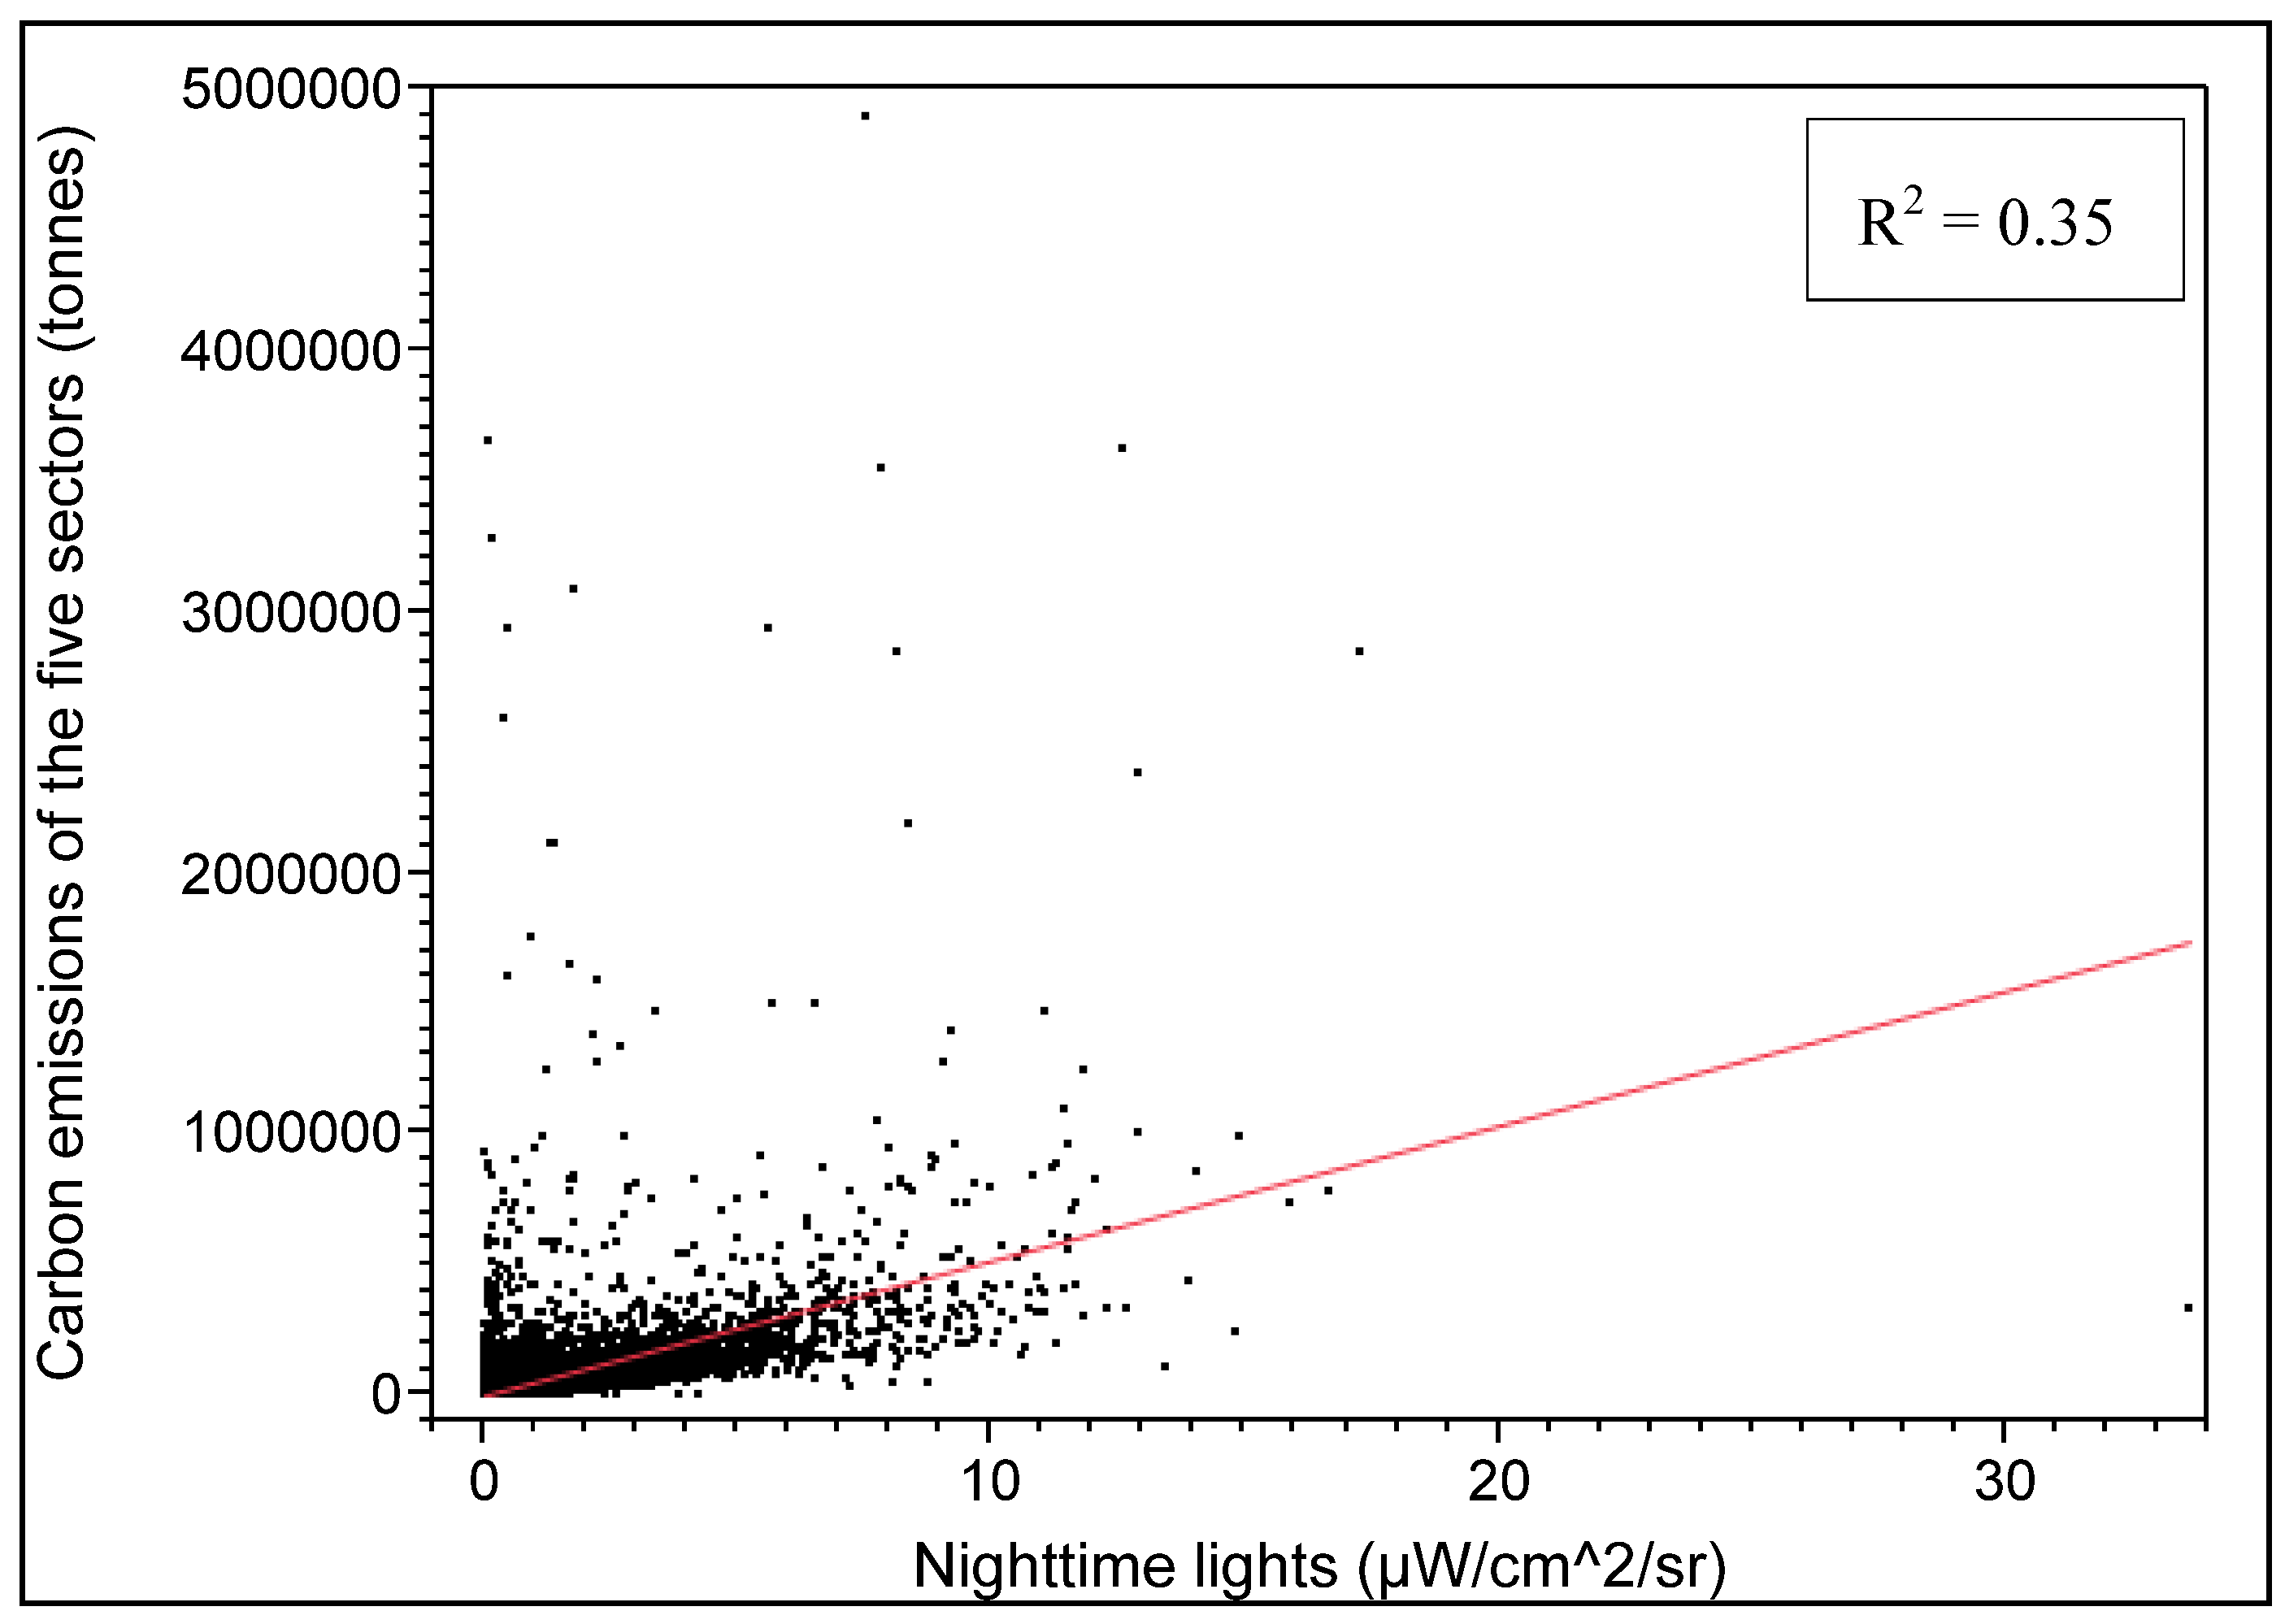
Visual comparison of the Vulcan sector images indicates that several of the sectors are correlated to nighttime lights. To investigate this further we used a stepwise linear regression to determine the best combination of Vulcan sectors for estimating the brightness of the DMSP nighttime lights. The basis of this development is that the DMSP sensor measures lighting across multiple sectors, with lights detected in residential areas, along streets and roads, in commercial centers, at airports and in industrial areas. To develop this model we first aggregated the nighttime lights to match the spatial resolution of the Vulcan data. A stepwise regression using the JMP statistical software indicated that the carbon emissions from the five sectors - mobile, commercial, residential, industrial, and aircraft sectors, which together account for about 57% of total carbon emissions in the continental U.S., also provide the best model and the highest coefficient of determination (R
2 = 0.67) when regressed against the nighttime lights of the U.S. (
Table 1). Inclusion of any or all of the remaining three sectors (utilities, non-road, and cement) in the subsequent models of the stepwise regression had a negligible effect on the correlation. The five sectors which together provide the highest R
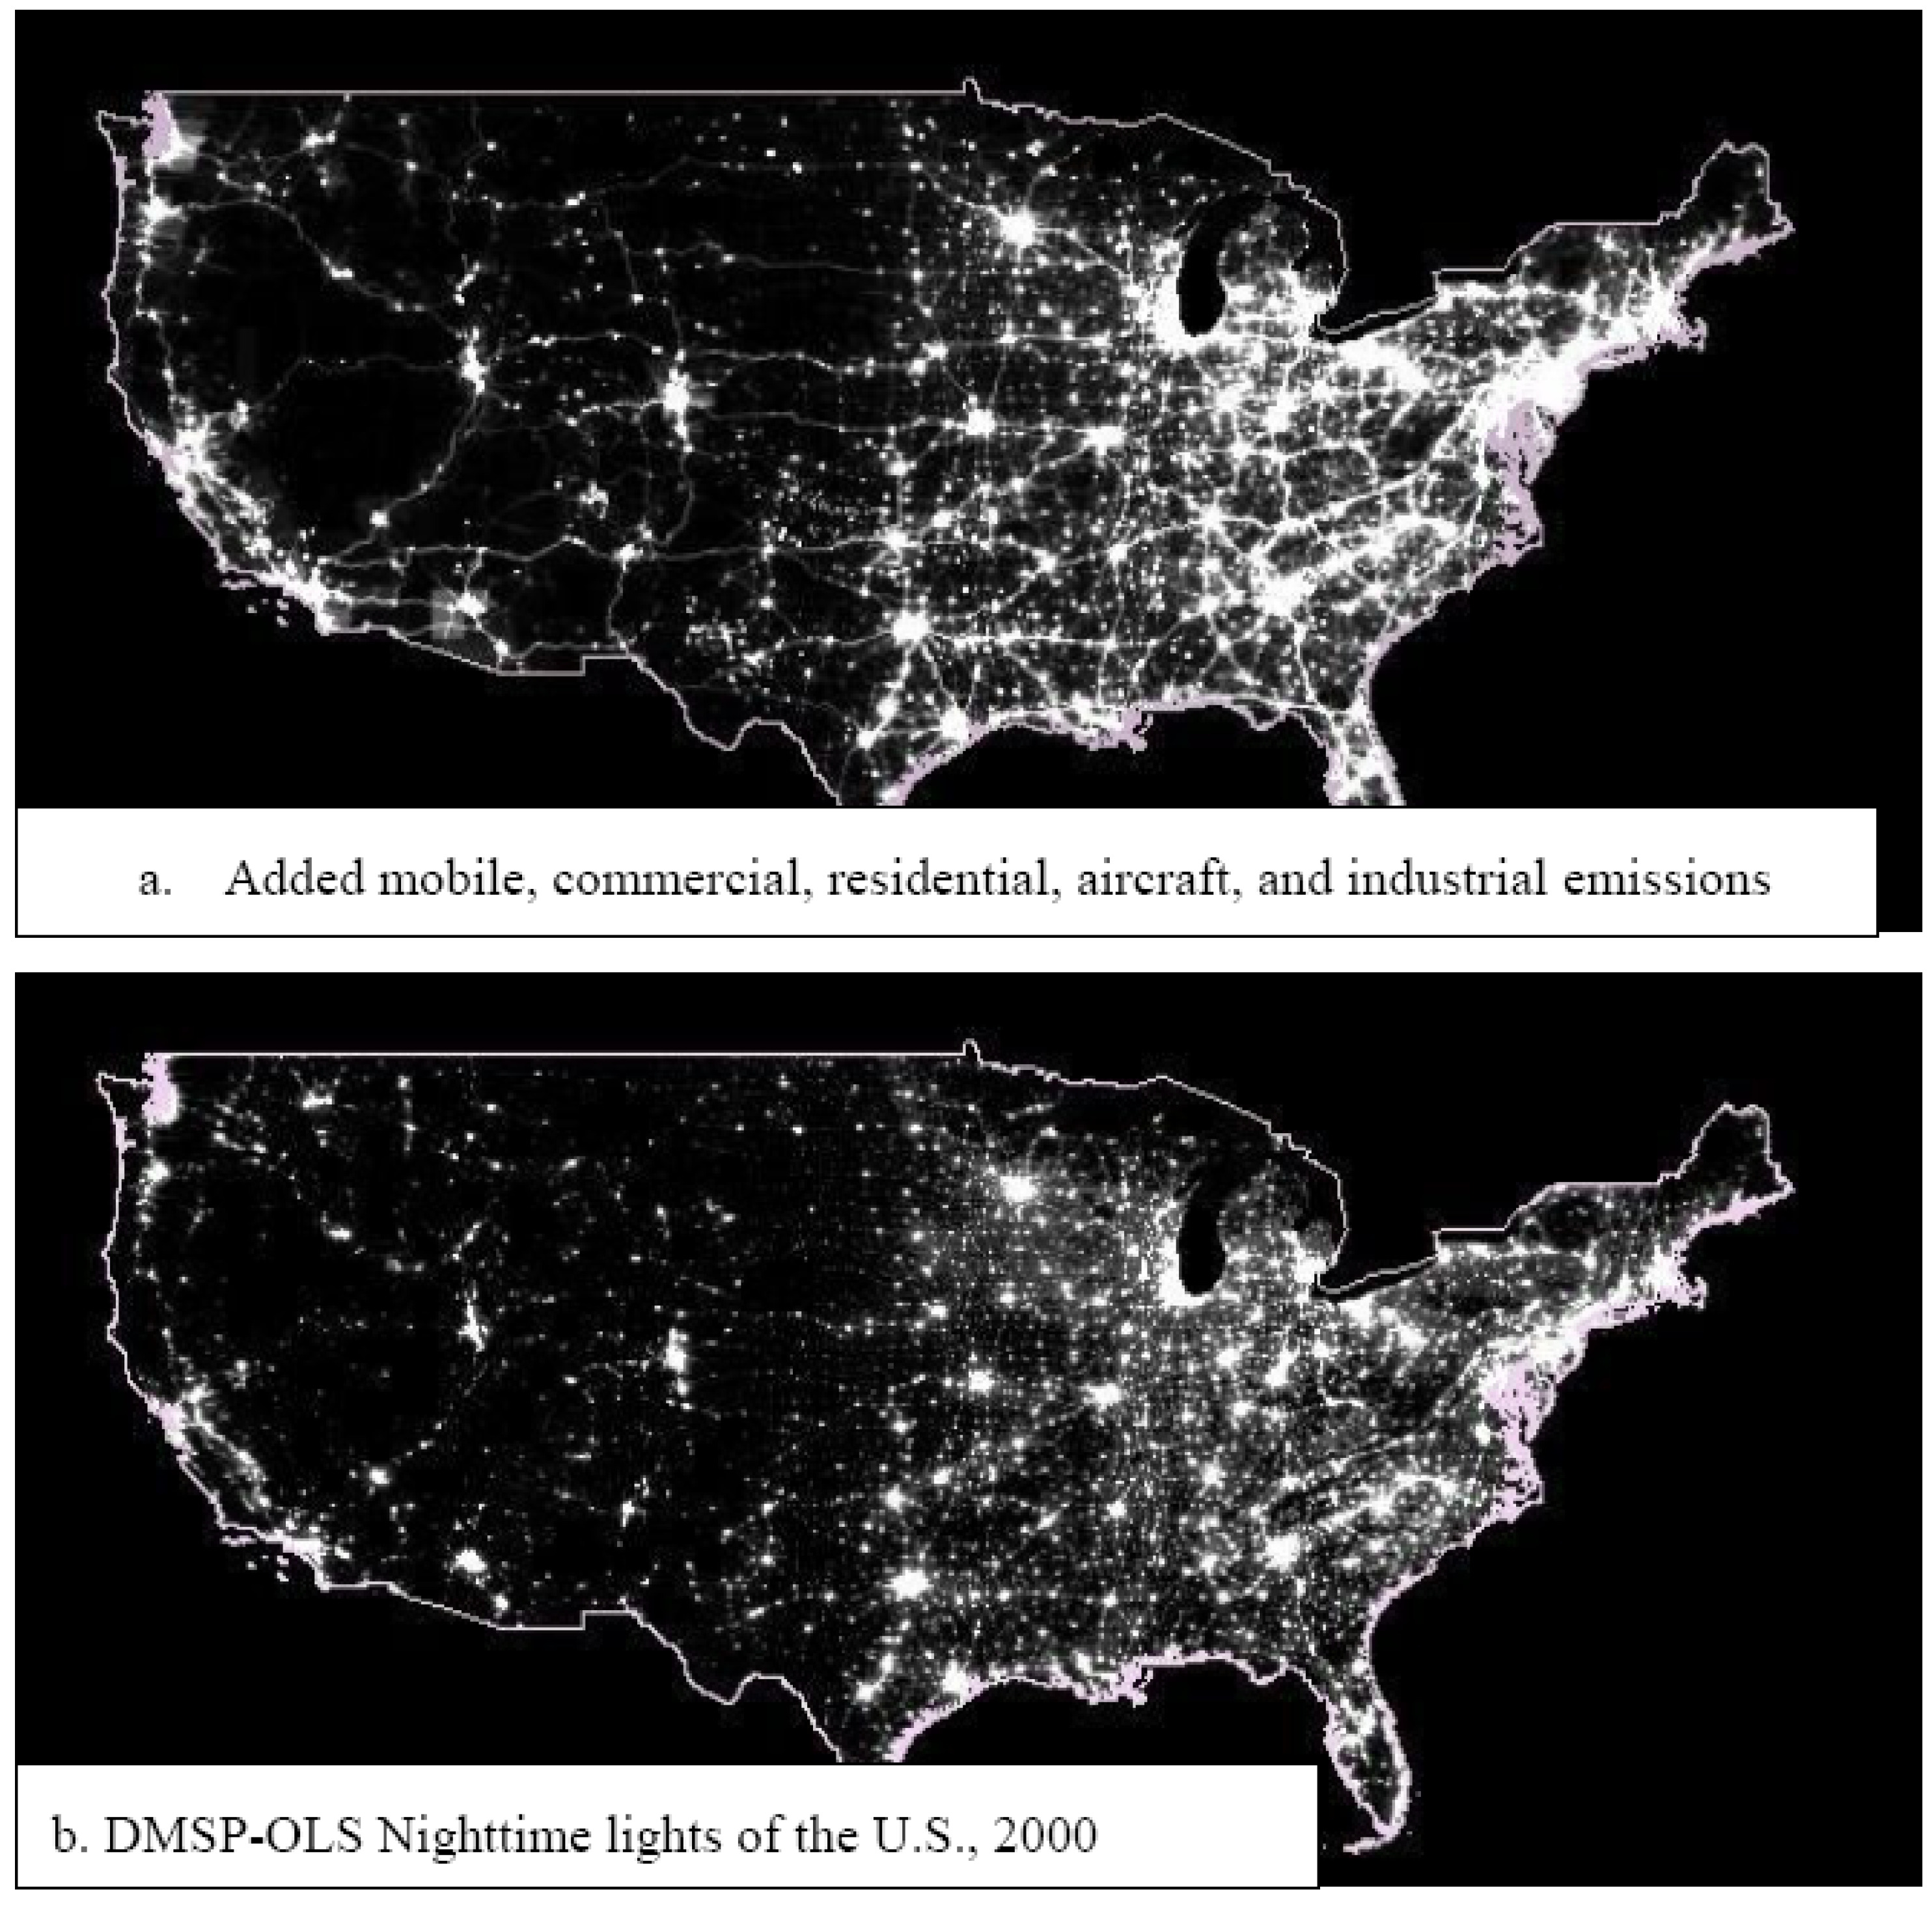
2 with the lights of the U.S. in the stepwise regression model were added up (
Figure 5a,b) and a regression model (Model 1,
Figure 6) was developed to derive the coefficient, which was applied on a global basis. For this regression model the intercept was taken as zero implying that carbon emissions are zero when the light intensity value is zero.
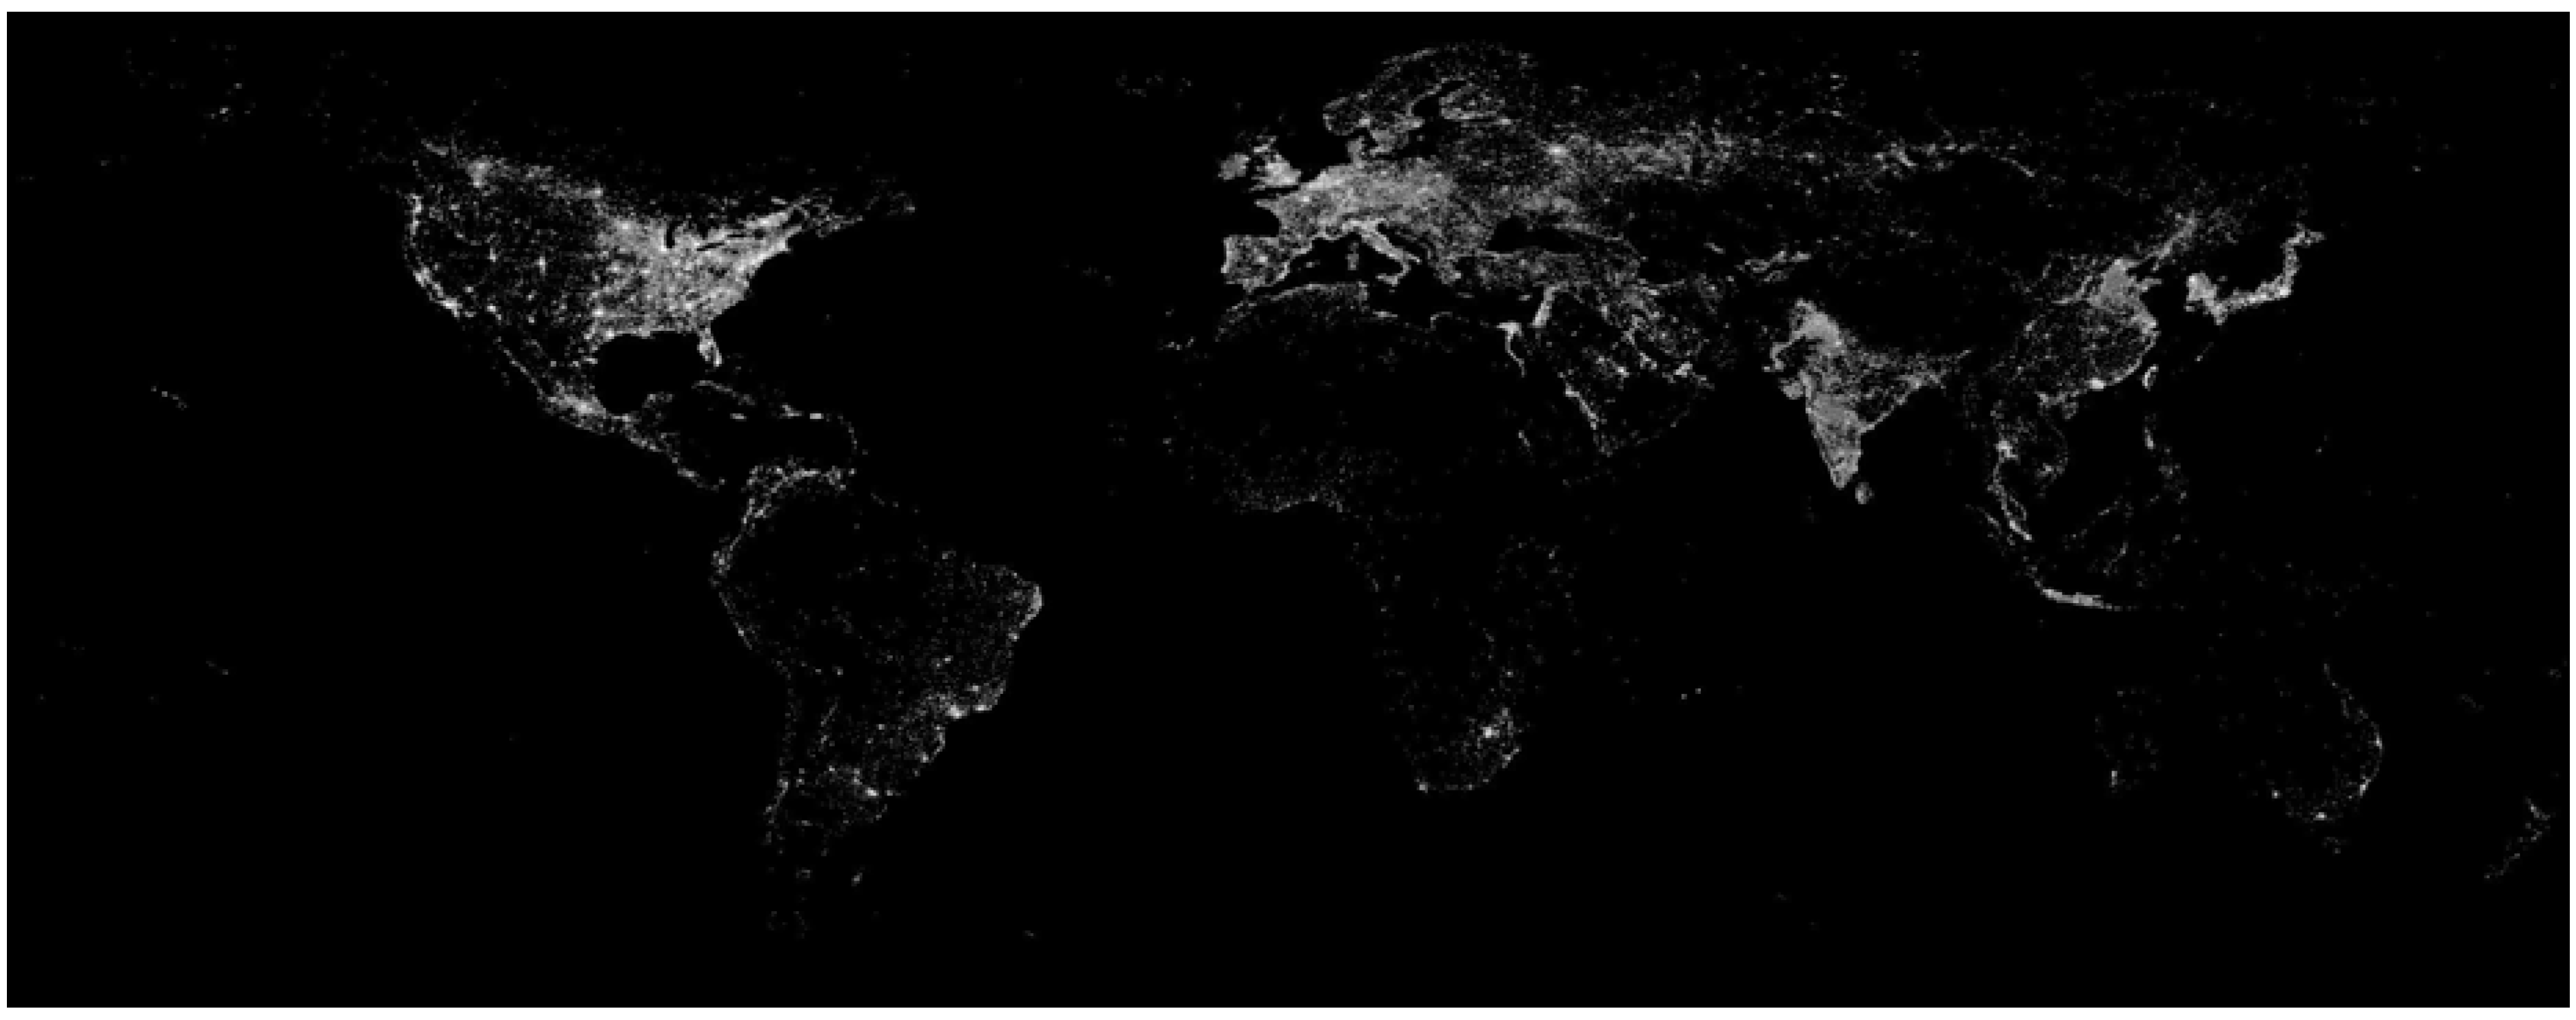
Figure 5.
(a) Vulcan mobile, commercial, residential, aircraft, and industrial sectors added together; (b) DMSP-OLS Nighttime lights of the U.S., 2000.
Figure 5.
(a) Vulcan mobile, commercial, residential, aircraft, and industrial sectors added together; (b) DMSP-OLS Nighttime lights of the U.S., 2000.
The coefficient derived through Model 1 (β
1US) was multiplied with the light intensity value in each pixel of the nighttime lights image of continental U.S., to derive the modeled carbon emissions grid of the U.S. At this point we were interested to evaluate the goodness of fit of the nighttime lights emission model vis-a-vis the five individual Vulcan sectors (mobile, residential, commercial, aircraft, industrial). An outlier image for each of the five sectors was calculated by subtracting the nighttime lights based emissions grid from the Vulcan carbon emissions grid of each of the five sectors separately, retaining only the positive values. Examination of these outlier images indicated that the nighttime lights based model was systematically underestimating the CO
2 emissions in several of the sectors. To develop a metric for this underestimation we divided the sum of the outliers in each of the sector by the total carbon emissions of each of the sectors and calculated a percentage underestimation. The underestimation was highest for the mobile and industrial sectors (
Table 1).
Figure 6.
Model 1—The regression model of the nighttime lights of the U.S. and the Vulcan carbon emissions data of the five sectors (mobile, commercial, residential, aircraft, and industrial sectors) combined.
Figure 6.
Model 1—The regression model of the nighttime lights of the U.S. and the Vulcan carbon emissions data of the five sectors (mobile, commercial, residential, aircraft, and industrial sectors) combined.
CO2p′ = β1US * Lp, (1)
where, CO2p′ = Estimated CO2 emission for each pixel p
Lp = Light intensity value for each pixel p in the nighttime lights image
β1US = slope coefficient derived through Model 1 (Value of β1 US = 51678)
The coefficient derived through Model 1 (β1US) was also multiplied with the light intensity value of each pixel (Lp) in the global nighttime lights grid and the value of 3.67 (ratio of the molecular weight of CO2 (44) to the atomic weight of carbon (12) = 44/12 = 3.67, as the Vulcan data is provided in terms of the mass of carbon atom) to get the estimated CO2 emission values for each 1 km2 pixel in the nighttime lights grid (CO2p′) (Equation1). The estimated CO2 emissions were then aggregated to the administrative units, CO2i′, where “i” corresponds to each administrative unit.
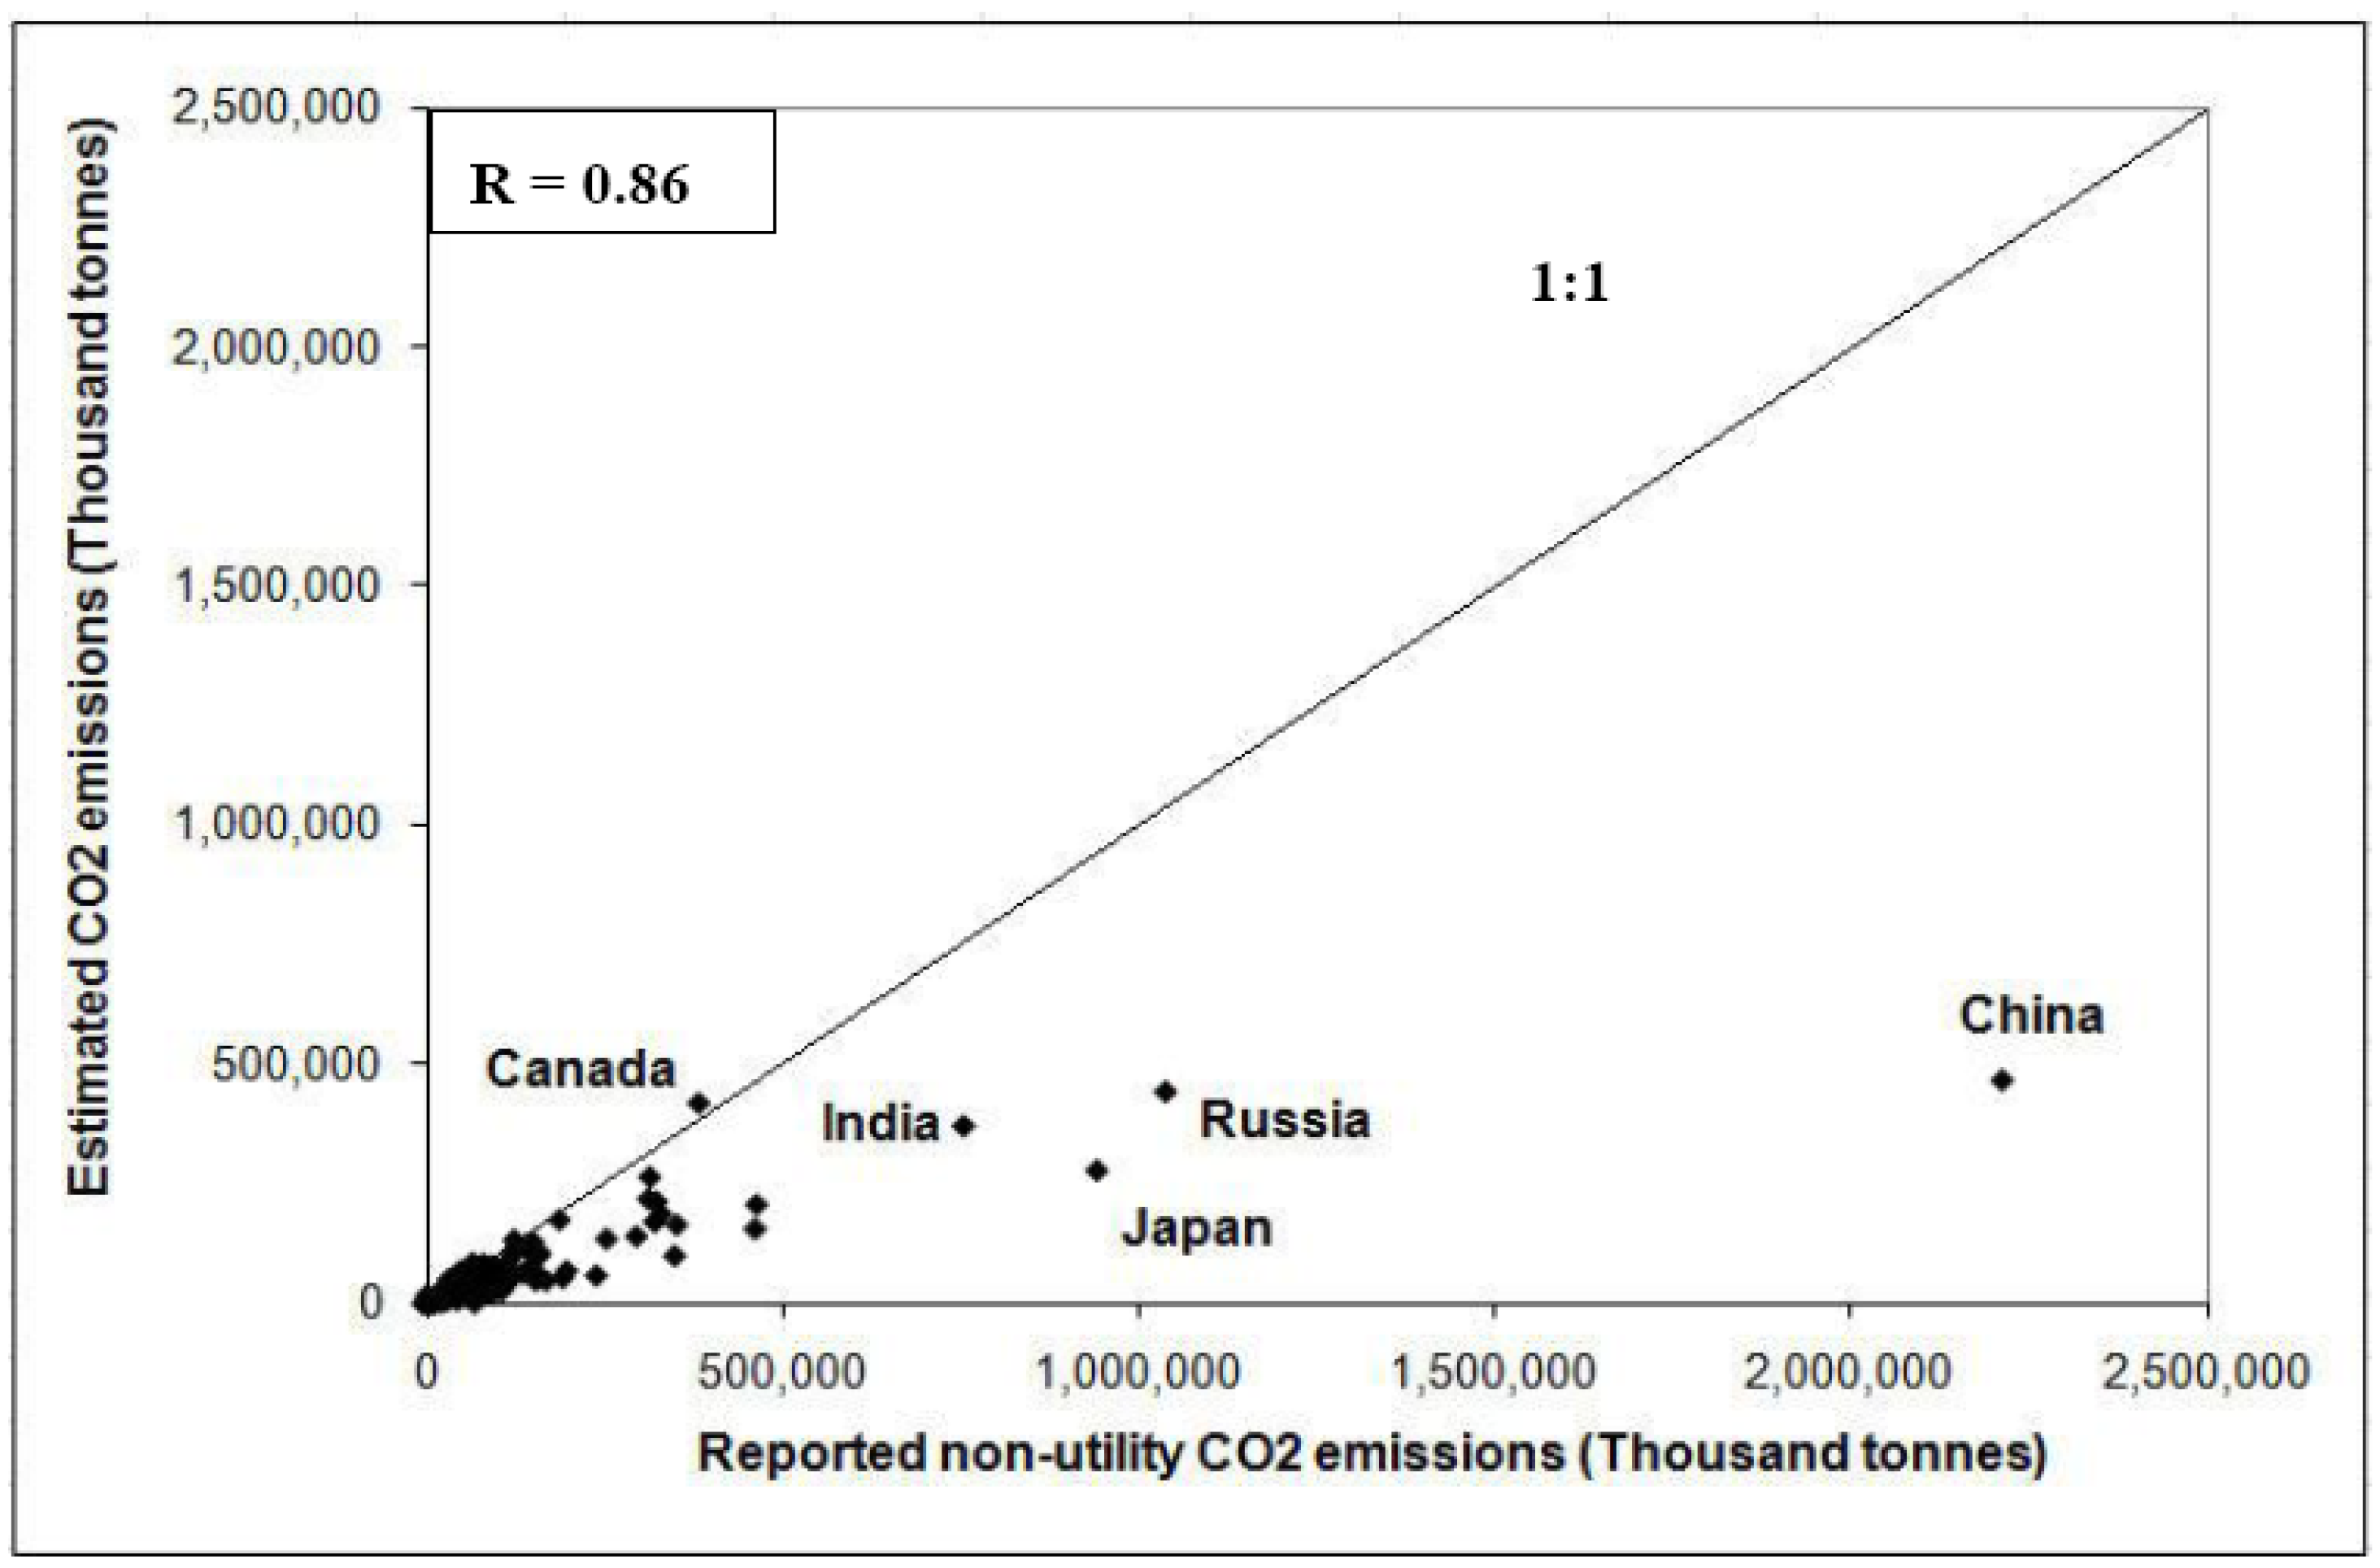
The CO
2 emissions from electric power utilities reported by CARMA and EPA were subtracted from the reported CO
2 emission values obtained from CDIAC and UNFCCC for the countries, and EPA for the states of the U.S. Plotting the aggregated estimated CO
2 emissions of the administrative units (CO
2i′) against the non-utility reported CO
2 emission values (CO
2i), provided a correlation coefficient of 0.86. However, the CO
2 emissions were underestimated for most of the administrative units, except for a few (
Figure 7).
Table 1.
Coefficient of determination derived from the stepwise regression, percentage contribution of each sector to the total carbon emissions, and the underestimation percentages of each of the five Model 1 sectors.
Table 1.
Coefficient of determination derived from the stepwise regression, percentage contribution of each sector to the total carbon emissions, and the underestimation percentages of each of the five Model 1 sectors.
| Vulcan sectoral carbon emission | R2 | % Contribution of each sector to the total carbon emissions | % Underestimation |
|---|
| Mobile | 0.6433 | 27.94 | 20.43 |
| Non-road | 0.3724 | 3.14 | |
| Residential | 0.3628 | 6.36 | 2.62 |
| Commercial | 0.3116 | 4.12 | 7.38 |
| Aircraft | 0.1398 | 1.19 | 6.25 |
| Industrial | 0.0555 | 17.56 | 37.24 |
| Utilities | 0.0130 | 38.81 | |
| Cement | 0.0011 | 0.87 | |
|
|
|
|
| Aircraft, Mobile, Residential, Commercial, Industrial | 0.6708 | 57.17 | |
| (in the stepwise regression) | | | |
Figure 7.
Reported non-utility CO2 emission values versus modeled (Model 1) CO2 emission values for the countries of the world and the states of the U.S.
Figure 7.
Reported non-utility CO2 emission values versus modeled (Model 1) CO2 emission values for the countries of the world and the states of the U.S.
3.2. Model 2
A single coefficient derived from the U.S. Model 1 resulted in underestimation of CO
2 emissions for most of the countries and even most states in the U.S. We attribute this to variations in CO
2 emissions that are independent of the quantity of light emitted to the sky and variations in lighting use patterns between countries. Similar results were alluded to in previous studies [
13,
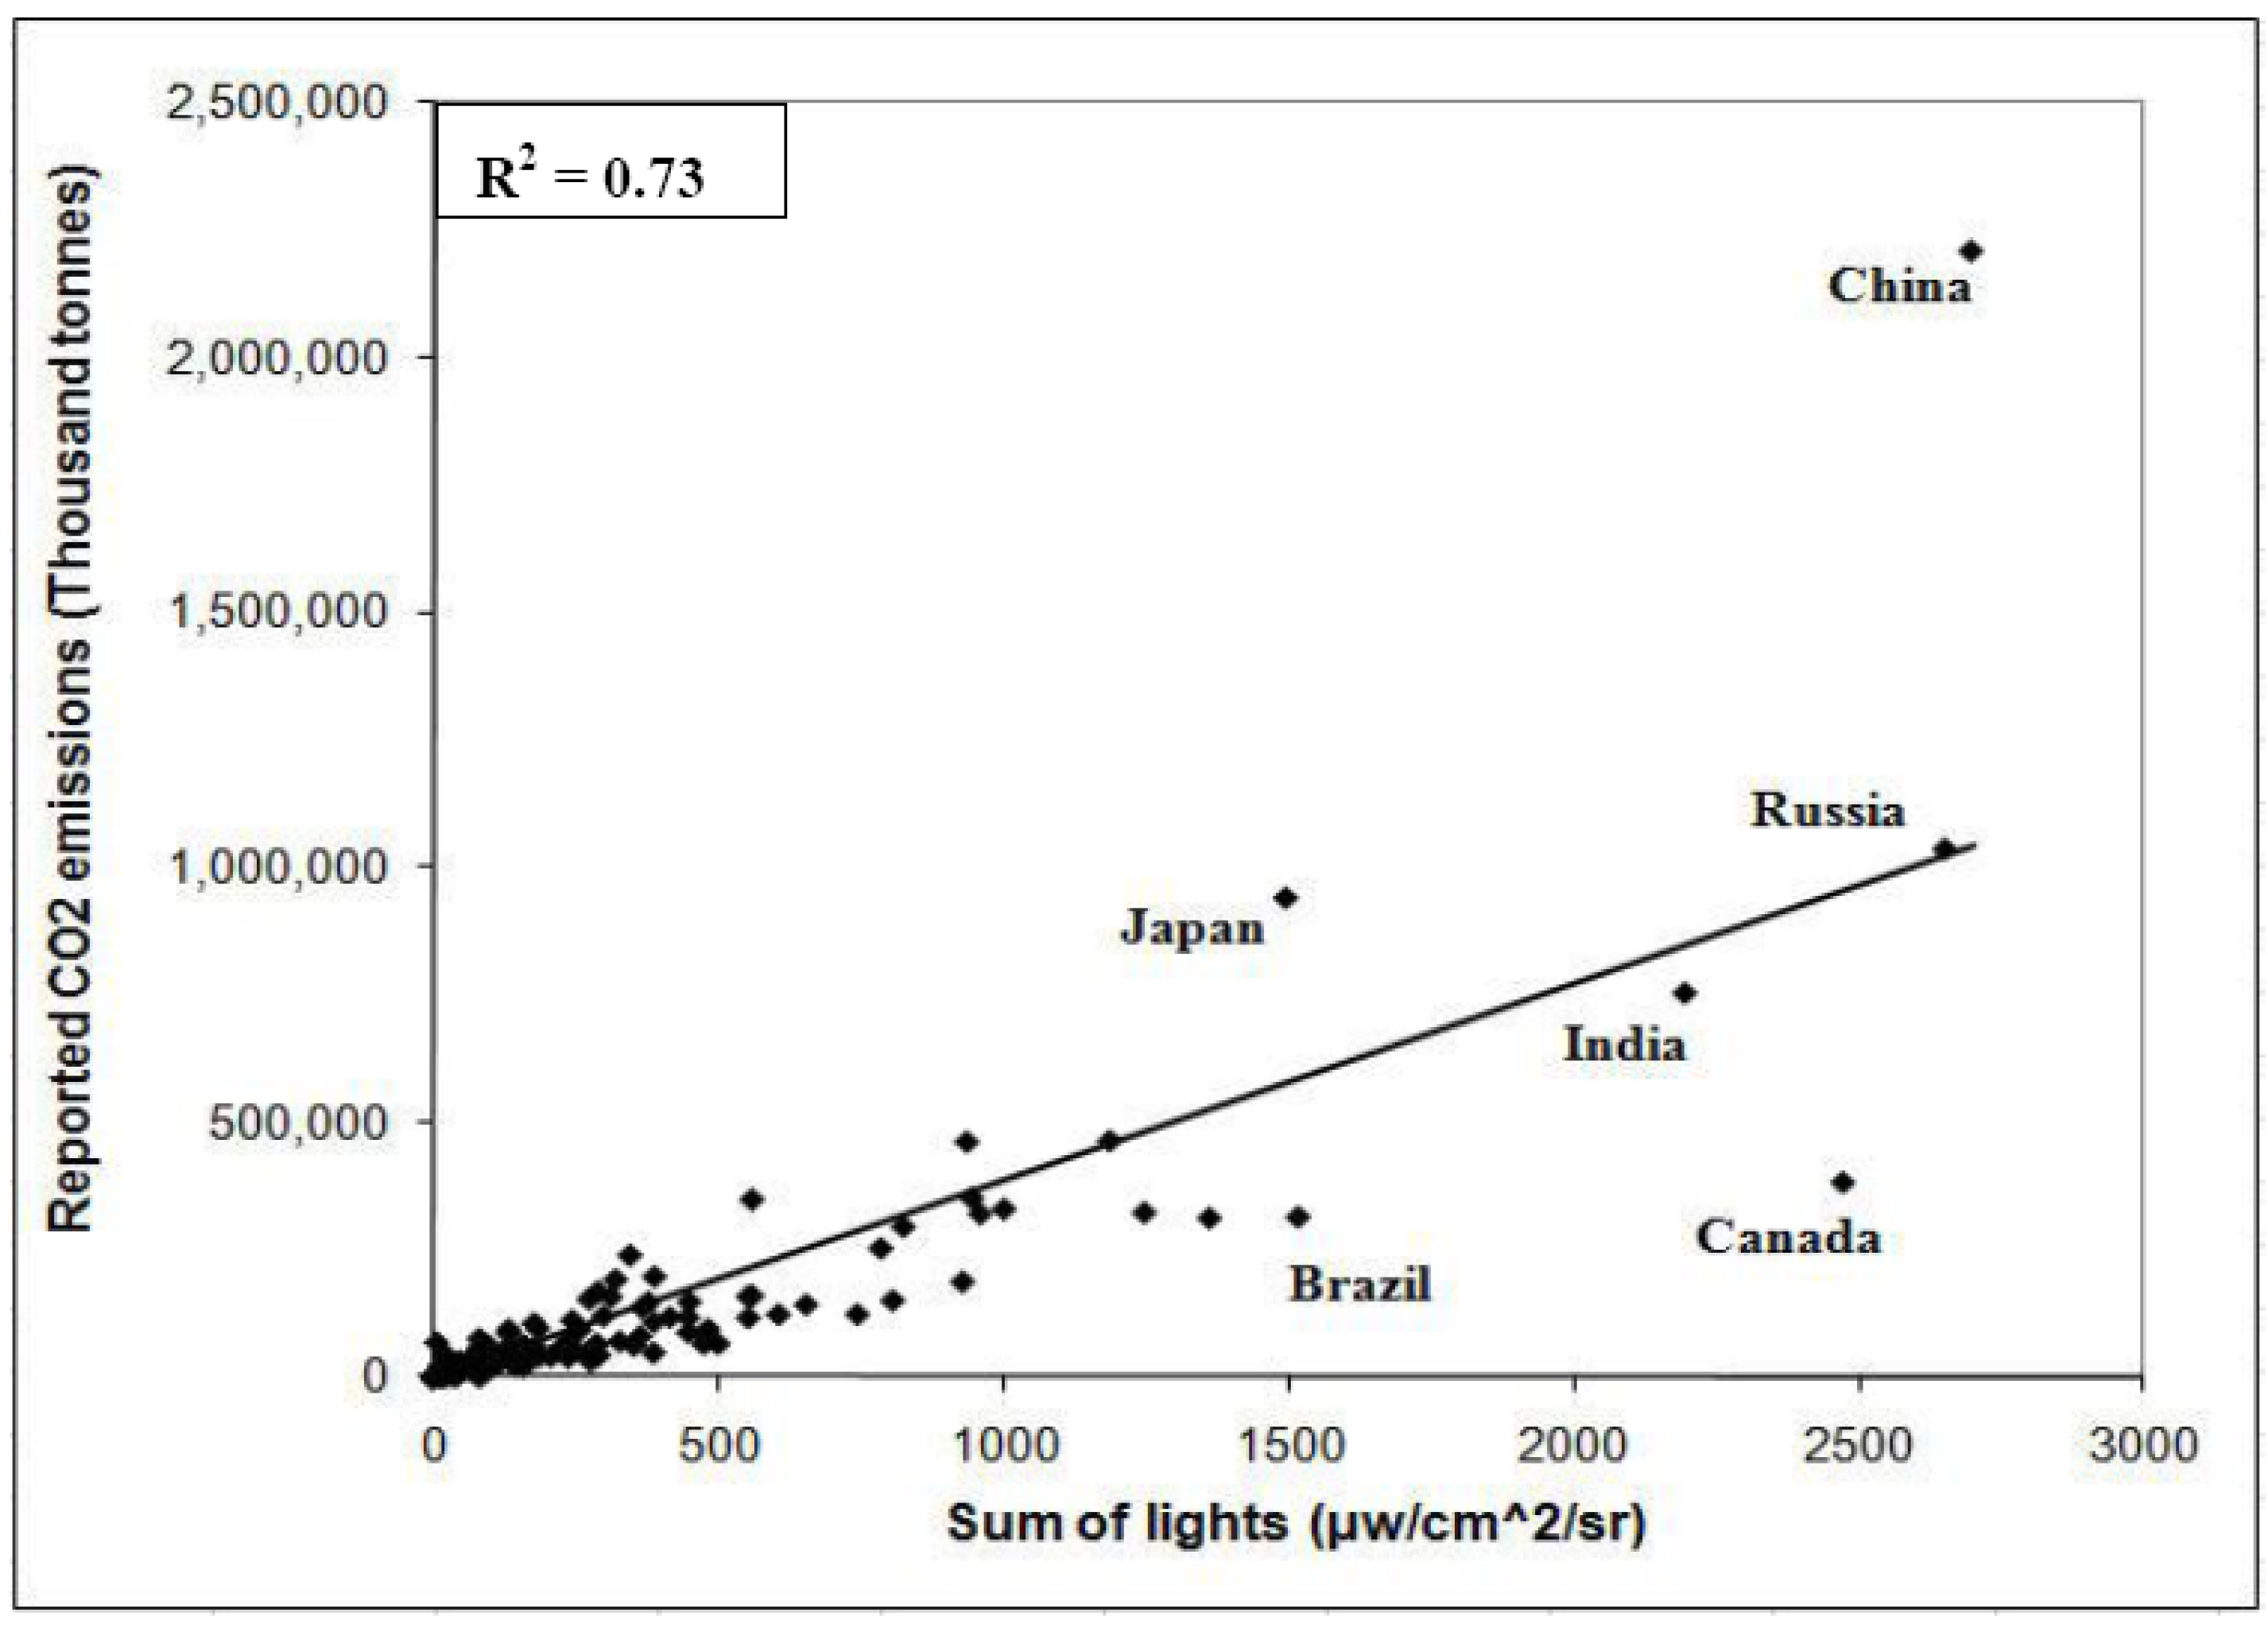
15]. Moreover, regressing the sum of lights against the reported CO
2 emission values of the administrative units (
Figure 8) show that countries such as Canada are brighter compared to their CO
2 emission values, whereas, countries such as China have higher CO
2 emission than what is estimated from the nighttime light intensity values.
Figure 8.
Regression relationship between sum of lights and reported non-utility CO2 emissions for all countries and states of the U.S.
Figure 8.
Regression relationship between sum of lights and reported non-utility CO2 emissions for all countries and states of the U.S.
Furthermore, although the nighttime lights can identify the locations for the CO
2 emissions from the lit areas of the world, there are more than 1.6 billion people living in areas with no DMSP light detections [
26].
As a result of these considerations, we began the development of a Model 2, which performs a spatial allocation of the reported CO2 emissions (minus the emissions from electric power utilities) based on nighttime lights and population count. An attempt was made to use lights and population count together; however this regression yielded a negative slope for population and negative CO2 emissions for many grid cells. To resolve this problem we developed a model which estimated CO2 emissions in lit areas based on the DMSP nighttime lights and the CO2 emissions in areas without DMSP lights based on population count. We proceeded with the assumption that people living in areas with no detected DMSP lighting have half the CO2 emissions as people living in the lit areas of an individual country.
In actuality, the CO
2 emissions per capita from the rural areas (corresponding to the darker areas of the nighttime lights image) vary from one country to another. For example, CO
2 emissions per capita in the U.S. are higher in rural (non-illuminated) areas [
27], whereas, CO
2 emissions per capita in India are lower in rural areas. Again, for the quarter of the world’s population in darkness, the percentage varies between countries. In a recent paper estimating the electrification rates of countries using the nighttime satellite image [
26] it was estimated that only about 1% of the U.S. population is in darkness, whereas about 25% of the population is in darkness in China and India. Thus, the factor with which the nighttime lights pixel should be multiplied to get the CO
2 emissions per capita from the non-illuminated rural areas is a variable. In the absence of a better known number the 0.5 factor was used as a placeholder for demonstrating the CO
2 production of non-illuminated areas. Ultimately it would be ideal to produce a map of this parameter that varies from country to country. Future research will undoubtedly improve the characterization of this parameter.
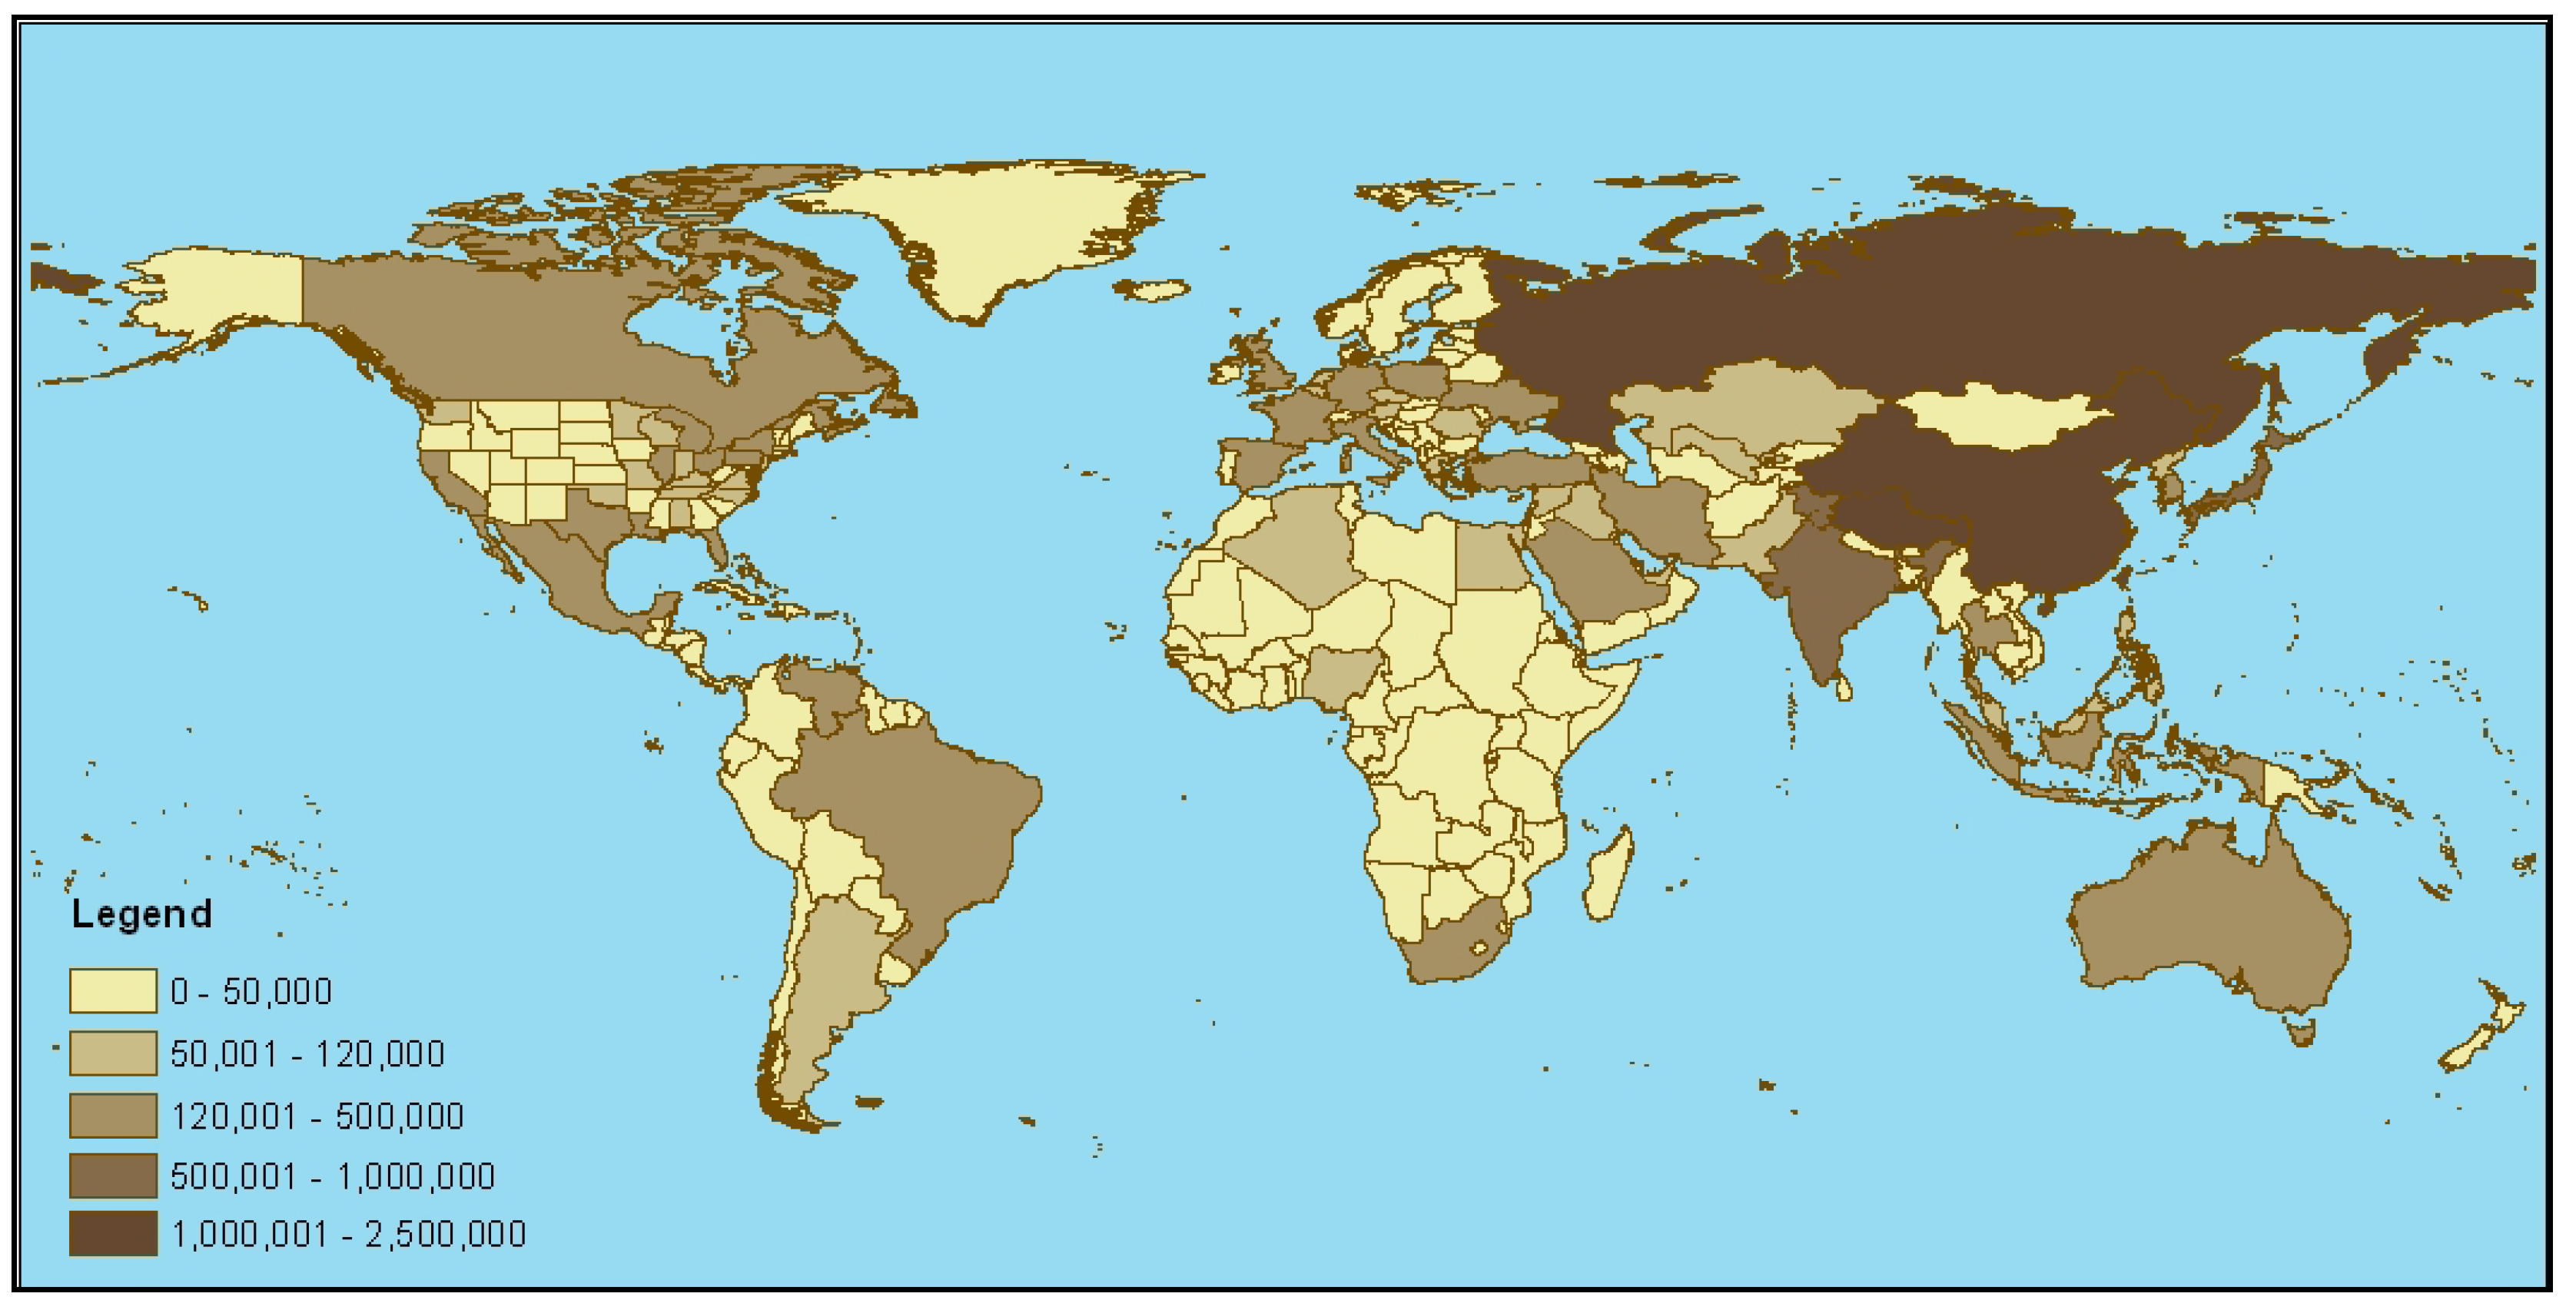
At first a mask of the lit areas of the world was created from the nighttime lights grid. This mask was overlaid on the LandScan population grid and the sum of population of the lit areas of each administrative unit was extracted (SOPLi). Similarly, a mask of the dark areas of the world was created from the nighttime image and was overlaid on the population grid to extract sum of population of the dark areas of each administrative unit (SOPDi). The reported non-utility CO2 emissions of the administrative units (CO2i) were distributed between the dark and lit areas based on the following equation (Equation 2).
Through Equation 2 the value of the variable “xi” for each administrative unit was derived. The variable xi was then multiplied with the sum of population in lit areas for each administrative unit i (SOPLi) and half of the variable xi, that is, xi/2, was multiplied with the sum of population in the dark areas for each administrative unit i (SOPDi). This provided the total CO2 emissions from the lit areas (CO2Li) and total CO2 emissions from the dark areas (CO2Di), respectively, for each administrative unit. (Equations 3 and 4).
The CO2 emissions from the lit areas (CO2Li) were then divided by the sum of lights (in radiance units) for each administrative unit (SOLLi). This yielded the CO2 emissions per radiance unit for each administrative unit. Conversely, CO2 emissions from the dark areas (CO2Di) were divided by sum of population in the dark areas (SOPDi) to get CO2 emissions per person for the dark areas for each administrative unit. In order to distribute the CO2 emissions from the lit areas, each of the lit pixels of the nighttime lights grid (Lp) was multiplied by the CO2 emissions per radiance unit for that administrative unit (Equation 5). Conversely, to distribute the CO2 emissions from the dark areas the population count in each pixel of the dark areas of the population grid (PDp) were multiplied by the CO2 emissions per person for the dark areas for that administrative unit (Equations 6).
These two separate CO
2 emissions grid from the lit areas and the dark areas of the world (CO
2Lp′ and CO
2Dp′) were added to create the final estimated CO
2 emissions grid (CO
2p′) (Equation 7,
Figure 9a).
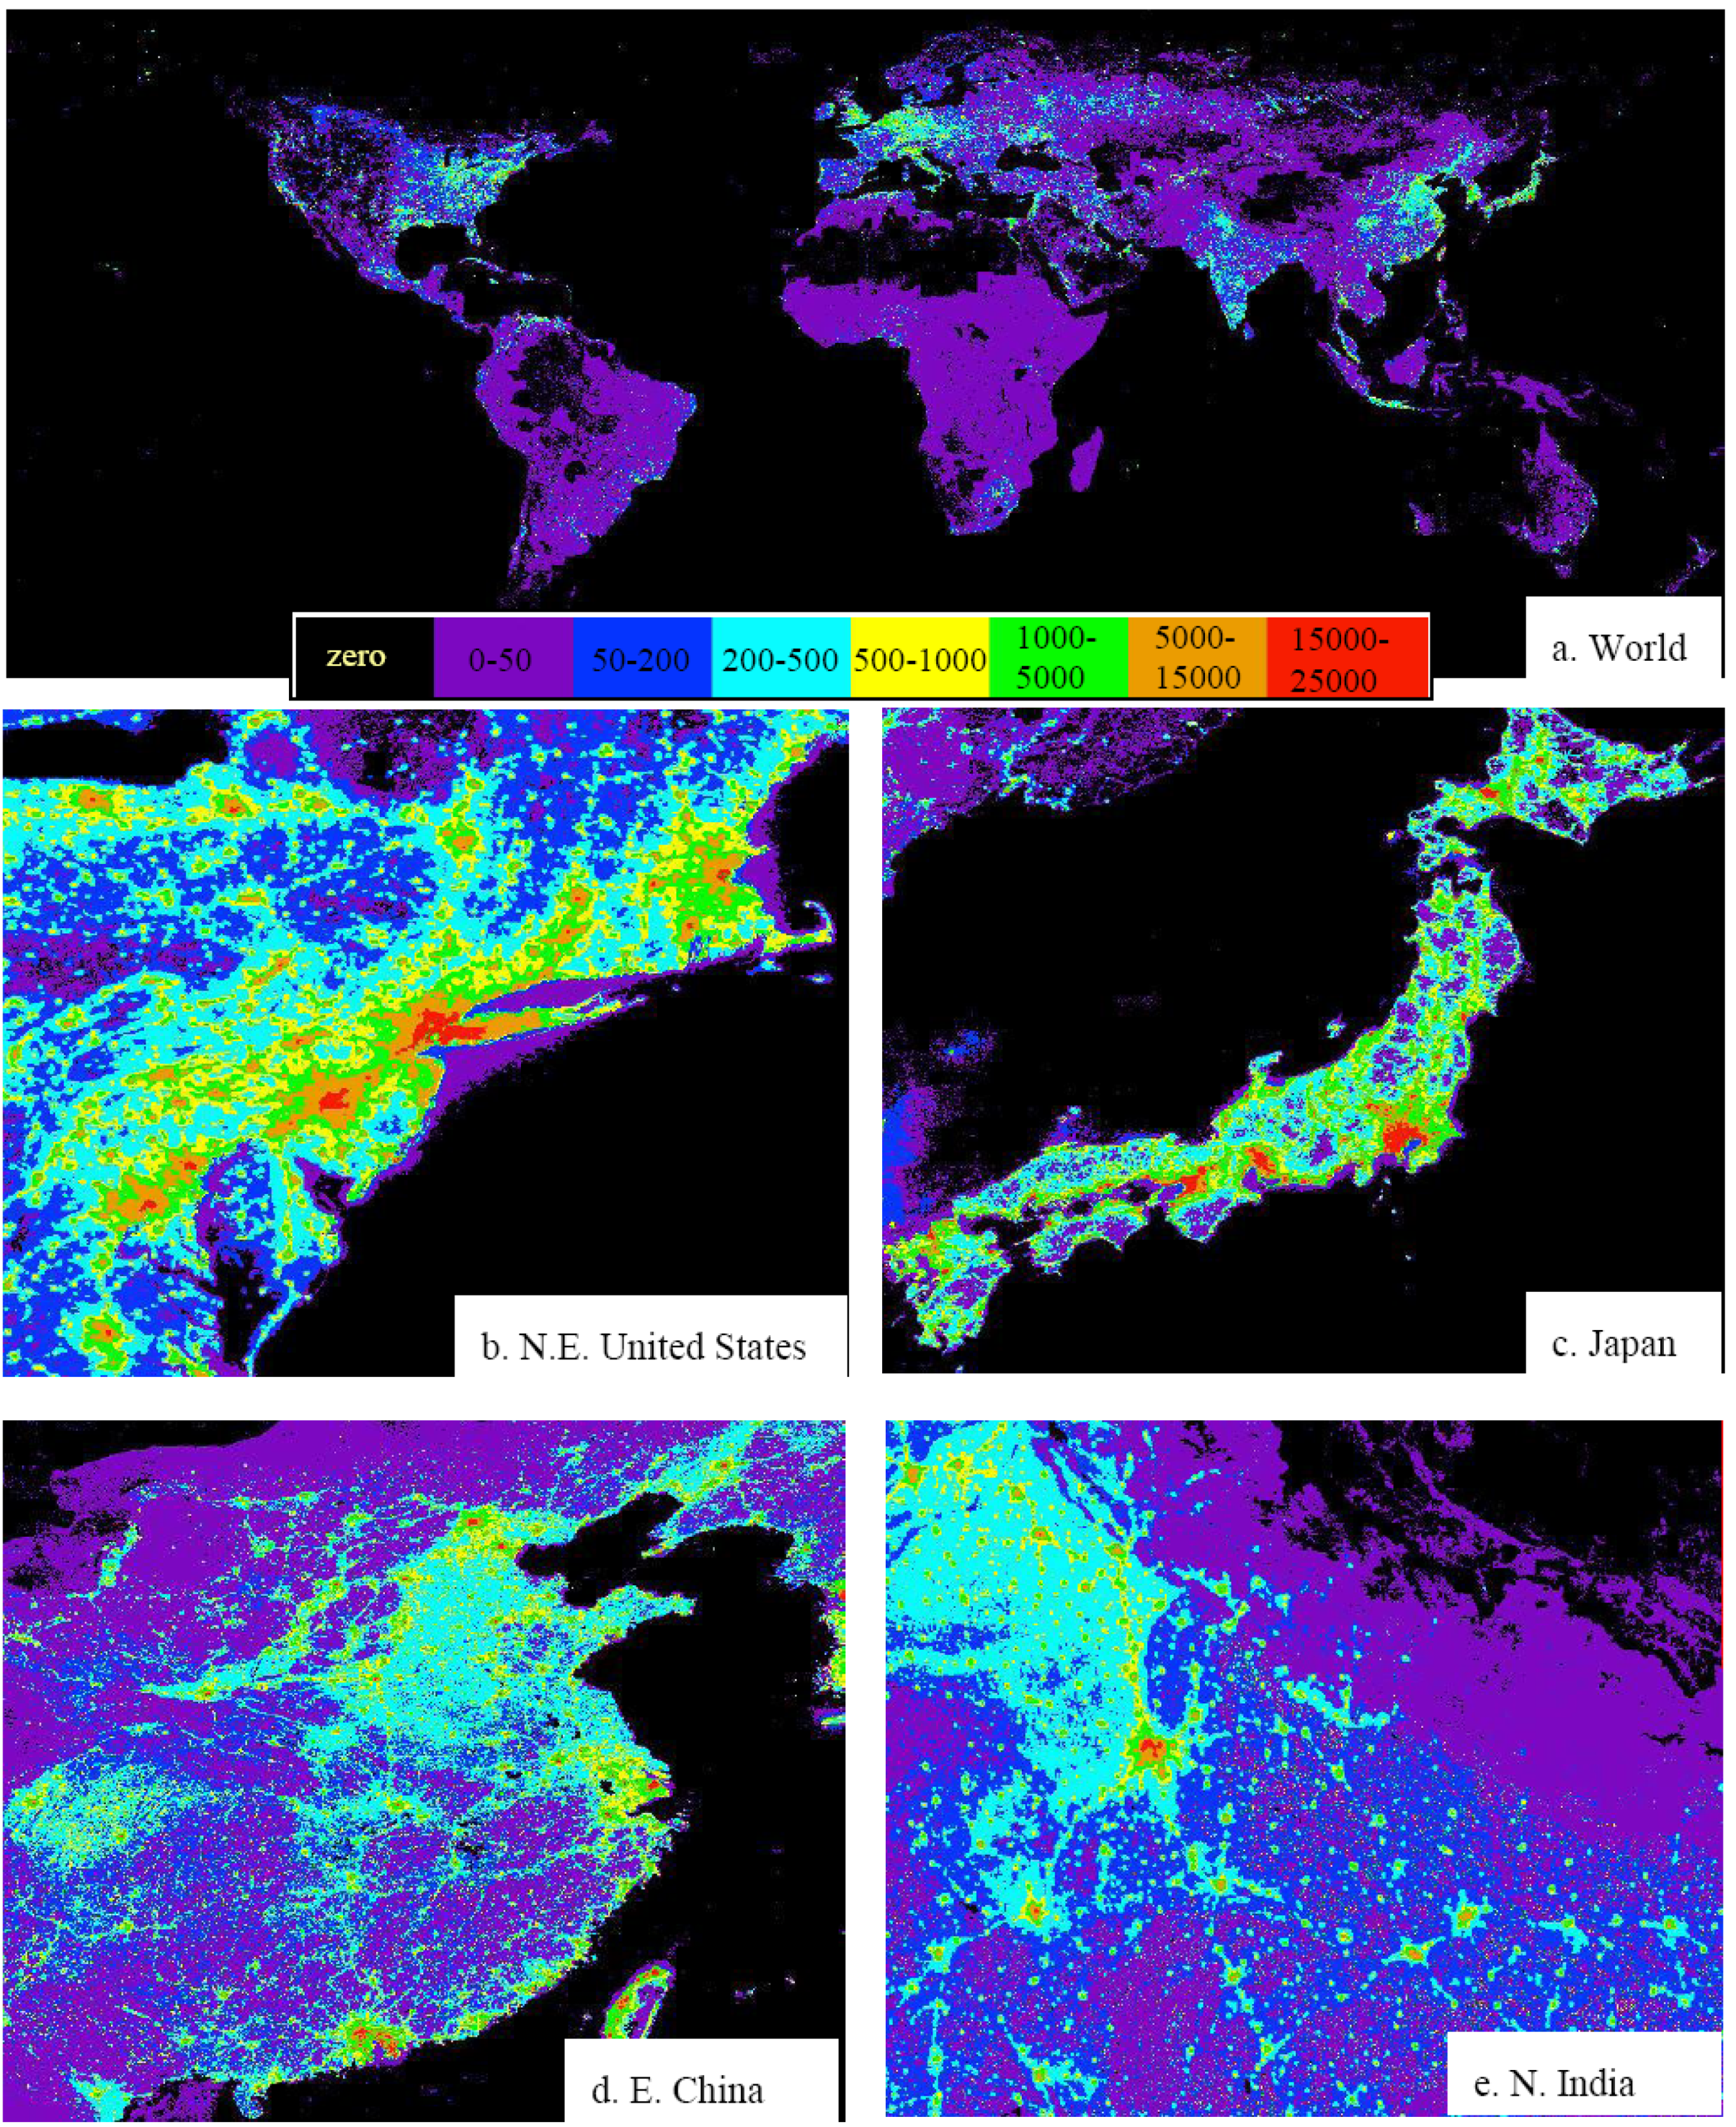
The disaggregated CO
2 emissions map represents values in tonnes assigned to 1 km
2 pixels, or CO
2 emissions in tonnes/km
2/year. In the disaggregated map the ocean pixels have a value of 0. Also, pixels in the inaccessible areas of the world, such as the high mountainous areas and deserts, with no population or nighttime lights also have a value of 0. The major cities and urban areas of the world have CO
2 emissions greater than 500 tonnes/km
2/year. Areas of the world which have population but no lights have CO
2 emissions less than 50 tonnes/km
2/year.
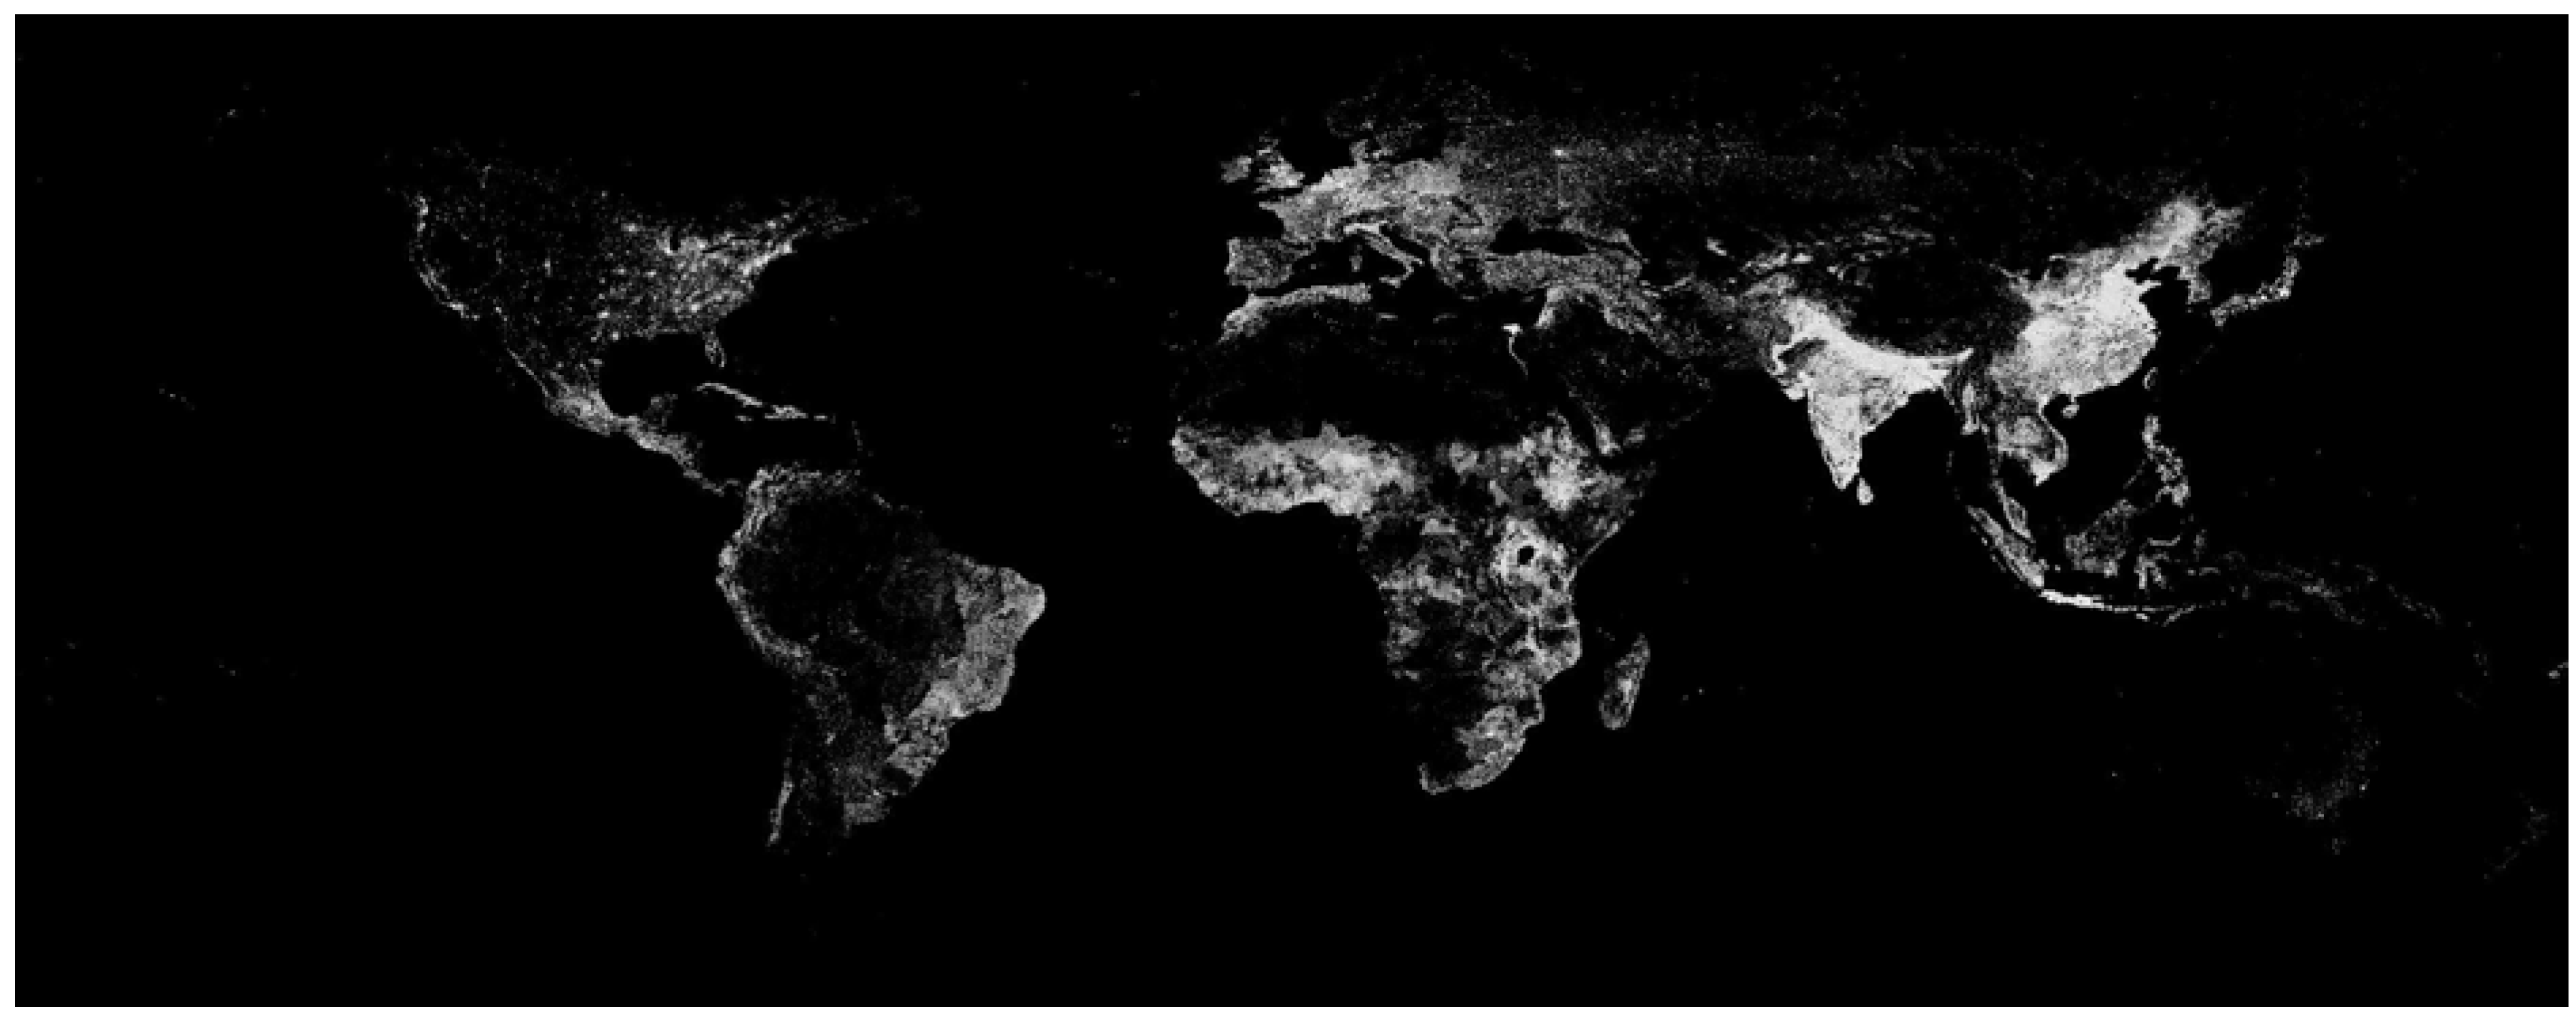
Figure 9(a) shows the CO
2 emissions grid of the world, and
Figure 9(b), (c), (d), and (e) show CO
2 emissions of North-eastern United States, Japan, Eastern China, and Northern India, respectively.
Figure 9.
Estimated CO2 emissions grid in tonnes/km2/year.
Figure 9.
Estimated CO2 emissions grid in tonnes/km2/year.
In order to check how well Method 2 worked in creating the disaggregated map of CO2 emissions, we aggregated the emissions in each pixel (CO2p′) to the level of the administrative units (CO2i′) and compared it to the reported non-utility CO2 emission values (CO2i). The relation between the estimated and reported non-utility CO2 emissions at the level of the administrative units provided a correlation of coefficient of 1, implying perfect correlation between the reported and estimated variables.
5. Discussion and Conclusion
Two separate models were built for creating a disaggregated map of global non-utility CO
2 emissions. The first model was based on a regression relationship between the nighttime lights of the U.S. and the combined carbon emissions of the five sectors (residential, commercial, aircraft, industrial, and mobile sector) of the Vulcan data. The slope coefficient derived through this relationship (CO
2 emissions per radiance) was multiplied with the global nighttime lights radiance data and this provided the estimated CO
2 emissions grid. However, when this estimated CO
2 emissions grid was aggregated to the level of the administrative units it was seen that CO
2 emissions were underestimated for almost all administrative units. Thus, it was realized that a single coefficient derived through a regression relationship developed for the U.S would not enable accurate estimations of CO
2 emissions for all administrative units. Based on the Vulcan data we found the underestimation to be highest (
Table 1) in the industrial and mobile (streets, roads and highways) sectors. We attribute this underestimation in part to the inability of a single coefficient to adequately represent the differences that exist between carbon emissions across multiple sectors. For instance, on a per square kilometer basis the CO
2 emissions from residential areas is undoubtedly lower than the emissions from a heavily trafficked highway of an industrial facility. Another aspect of the underestimation is that Model 1 assumes that the use of lighting in each country is comparable to the U.S. The vast underestimation of CO
2 emissions in China under Model 1 suggests that China uses far less lighting per person than the U.S. Previous studies [
19,
26] have indicated that there are variations in lighting types, lighting fixtures, and lighting preferences that affect the brightness of satellite observed nighttime lights. In order to address these drawbacks Model 2 was developed.
To address these shortcomings with the available data sources we developed Model 2, which uses nighttime lights grid and the LandScan population grid to model the spatial distribution of reported CO2 emissions (minus those associated with electric power utilities). The use of LandScan population grid in estimating CO2 emissions proved to be advantageous because population count can serve as a proxy for estimating CO2 emissions in areas in the world which have no satellite detected lighting. Furthermore, since in the LandScan population model, sub-national level census accounts are allocated to each grid cell based on proximity to roads, slope, and land cover; transportation links are depicted in greater details in the LandScan population grid. Thus, inclusion of the LandScan population grid in the model for estimating CO2 emissions ensured the estimation of emissions from the transport linkages. These road linkages contributed to the outlier percentages from the Vulcan mobile sector emissions when the modeled carbon emissions grid of the U.S was created from its nighttime lights. Model 2 was developed with the assumption that per capita CO2 emissions from the dark areas of the world were one-half of the per capita emission in the lit areas. On the basis of this assumption, the total reported non-utility CO2 emissions were distributed into the lit and the dark areas of the world using the nighttime lights image and the LandScan population grid. In Model 2 the total CO2 emissions are constrained to match the reported values minus the component associated with electric power utilities.
It is important to note that DMSP nighttime lights indicate the spatial distribution for the majority of CO
2 emissions but that they cannot articulate the variability that exists between sectors. If the CO
2 estimation coefficient is tuned to work well for residential and commercial sectors, the emissions for industrial and mobile will be underestimated. With higher spatial resolution and multispectral nighttime lights it would be possible to distinguish the lighting from residential, commercial/industrial, and transportation sectors [
28,
29]. While such a Nightsat sensor has not been built, the prospects for making improved CO
2 emission grids with such data are clear. It may even be possible to estimate the CO
2 emissions from electric power utilities with Nightsat data. Electric power utility emissions accounts for 40% of all carbon emissions in the United States and about one-quarter of global emissions [
25]. Thus, by excluding the utility emissions, the CO
2 emissions grid created from the nighttime lights image and population grid actually maps the distribution of about 75% of all distributed CO
2 emissions.
The method developed here is not an independent method for estimating CO2 as reported CO2 emission values were used to set the coefficients for the spatial allocation performed in each administrative unit. However, it is an easy and quick method for estimating and mapping CO2 emissions at a fine spatial resolution. Moreover, the availability of radiance-calibrated nighttime lights image has made it possible to map variability in distribution of CO2 emissions into bright urban cores, where previous nighttime lights products contained saturated data values. The NGDC at NOAA is currently producing a radiance-calibrated time series for the years 1996–97, 1999, 2000, 2003, 2004, and 2010. The method developed in this paper could be used to create disaggregate maps of CO2 emissions for all of these years. However, it should be noted that the lack of on-board calibration for the DMSP nighttime visible band complicates the direct comparison of the data values across the time series.
The greatest advantage of creating a disaggregated map of CO2 emissions is that it can be aggregated to different environmental, physical, and socio-economic units of analysis and can be easily integrated with other physical and environmental data available in gridded format. Such a fine resolution disaggregated map of CO2 emissions would also aid in CO2 emissions regional flux inversions studies. These model outputs can also inform the monitoring of the progress of countries as they move towards achieving emission reduction targets.
Although not an entirely flawless method, the second model developed in this paper provides a simple, useful, and inexpensive technique to create a fine resolution CO
2 grid of the entire planet. Model 2 was developed entirely as a proof of concept. With the availability of better CO
2 emissions data from the dark as well as the lit areas of the world we hope to refine the method and create better fine resolution CO
2 emissions grid. Our future endeavors will also include testing this methodology for estimating CO
2 emissions for other years and also to include the CO
2 emissions from gas flaring [
21] observed in DMSP nighttime lights and electric power utilities based on locations and emission estimates from organizations such as CARMA.


 ,
, 


