
Improving the Fuel Economy and Energy Efficiency of Train Cab Climate Systems, Considering Air Recirculation Modes


1
Department of Theoretical and Applied Mechanics, Agribusiness Faculty, Don State Technical University, Gagarin, 1, 344003 Rostov-on-Don, Russia
2
Department of Transport Systems, Faculty of Roads and Transport Systems, Don State Technical University, Gagarin, 1, 344003 Rostov-on-Don, Russia
3
Department of Life Safety and Environmental Protection, Faculty of Life Safety and Environmental Engineering, Don State Technical University, Gagarin, 1, 344003 Rostov-on-Don, Russia
*
Author to whom correspondence should be addressed.
Energies 2024, 17(9), 2224; https://doi.org/10.3390/en17092224
Submission received: 23 March 2024
/
Revised: 1 May 2024
/
Accepted: 2 May 2024
/
Published: 5 May 2024
(This article belongs to the Section B: Energy and Environment)
Abstract
:Current developments in vehicles have generated great interest in the research and optimization of heating, ventilation, and air conditioning (HVAC) systems as a factor to reduce fuel consumption. One of the key trends for finding solutions is the intensive development of electric transport and, consequently, additional requirements for reducing energy consumption and modifying climate systems. Of particular interest is the optimal functioning of comfort and life support systems during air recirculation, i.e., when there is a complete or partial absence of outside air supply, in particular to reduce energy consumption or when the environment is polluted. This work examines numerical models of airfields (temperature, speed, and humidity) and also focuses on the concentration of carbon dioxide and oxygen in the cabin, which is a critical factor for ensuring the health of the driver and passengers. To build a mathematical model, the Navier–Stokes equations with energy, continuity, and diffusion equations are used to simulate the diffusion of gases and air humidity. In the Ansys Fluent finite volume analysis package, the model is solved numerically using averaged RANS equations and k-ω turbulence models. The cabin of a mainline locomotive with two drivers, taking into account their breathing, is used as a transport model. The problem was solved in a nonstationary formulation for the design scenario of summer and winter, the time of stabilization of the fields was found, and graphs were constructed for different points in time. A comparative analysis of the uniformity of fields along the height of the cabin was carried out with different locations of deflectors, and optimal configurations were found. Energy efficiency values of the climate system operation in recirculation operating modes were obtained. A qualitative assessment of the driver’s blowing directions under different circulation and recirculation modes is given from the point of view of the concentration of carbon dioxide in the breathing area. The proposed solution makes it possible to reduce electricity consumption from 3.1 kW to 0.6 kW and in winter mode from 11.6 kW to 3.9 kW and save up to 1.5 L/h of fuel. The conducted research can be used to develop modern energy-efficient and safe systems for providing comfortable climate conditions for drivers and passengers of various types of transport.
1. Introduction
The optimization of configurations and operating modes of heating and ventilation systems of vehicles can reduce fuel consumption in internal combustion engines, reduce energy consumption, and extend the service life of electric vehicle batteries. In addition, the creation of a comfortable microclimate maintains optimal performance, the concentration of drivers, and conditions for the rest of transport passengers in [1,2,3,4,5].
Critical HVAC (heating, ventilation, and air conditioning) parameters include the concentration of oxygen and carbon dioxide in the cabin and directly in the breathing area. An increase in CO2 concentration to 1% can cause drowsiness, suffocation, and lead to tragic consequences [6,7]. Partial or complete air recirculation can cause this situation in the cabin and the lack of air supply from the environment.
Thus, the use of recirculation as one of the effective tools for reducing energy consumption while optimizing thermal comfort parameters requires additional study and restrictions to maintain the required gas concentrations.
The abbreviation HVAC (heating, ventilation, and air conditioning) includes rather broad concepts of studying, controlling, and optimizing microclimate parameters. In particular, these include temperature, pressure, air velocity and humidity, gas concentration, odors, illumination, etc. Civil and industrial transport, aircraft, buildings, and whole open micro-districts act as research objects. The most promising approach for the study of such problems is the use of mathematical modeling based on fundamental equations of hydrodynamics, together with advanced numerical methods.
Recommendations on temperature conditions and air quality are widely presented in various standards, in particular in the European air quality recommendations [8,9], the American Society of Heating, Refrigerating and Air-Conditioning Engineers (ASHRAE) standards [10,11], WHO, and others [12,13,14,15,16]. In particular, in [12], a review analysis is carried out on labor protection at passenger transport stations and vehicles, and in [15,16], studies are carried out in aircraft.
Analytical approaches based on balance equations [17,18,19] make it possible to obtain volume-averaged field characteristics [20,21,22]. The problems of finding heat transfer coefficients using the Nusselt criterion were considered for harvesting machines [23], off-road vehicles [24,25,26,27,28], building elements [29,30,31,32,33,34,35], car cabins [36,37,38,39,40], and engineering systems [41,42,43]. This approach involves the use of previously found heat transfer coefficients to simulate heat exchange with external regions. For example, in [24], the temperature regime in the interior of an SUV was studied depending on the fan rotation speed. In [25], the assessment of thermal comfort in the vehicle interior was conducted, considering solar radiation. The article [41] considered numerical modeling and heat transfer in concentric and eccentric cavities of rotation. The work [43] discusses conjugate heat transfer in an anode roasting furnace. In article [40], a method is proposed to calculate heat transfer coefficients for a multilayer car cabin wall that considers forced convective heat exchange between internal and external air. The article also compares the results obtained numerically and analytically based on various applied theories.
The complex geometry of vehicle cabins makes the use of analytical methods impossible. To directly determine the values of thermal comfort fields at each point of the internal domain, the solution of three-dimensional hydrodynamic equations using CFD analysis is required [44,45,46,47,48,49]. Therefore, in the aforementioned studies [50,51], CFD investigations were conducted on vehicle ventilation systems in tropical climates. A study was conducted on ACH in airplanes, cars, and buses, as well as the impact of passenger arrangement on cabin air flow structure.
Works [52,53,54,55,56,57,58,59] investigate climate control systems, considering the use of various controllers to obtain values of carbon dioxide concentrations in various areas [60,61], and control systems for damper drives. Experimental measurements of air quality, temperature profile, and energy consumption in the cabin of an electric vehicle are given in [53,55]. The articles [62,63,64,65,66,67] evaluate safety in terms of temperature factors when vehicles are heated from direct sunlight.
The economic justification for various air conditioning systems for electric buses is given in [68,69,70], and an assessment of the economic efficiency of using a heat pump system is given. Studies have been conducted on humidity and the effective removal of condensation from fogging on the internal surfaces of a car [54,71,72].
Researchers developed a mathematical model in [73] to examine how viral particles are transmitted within car interiors, specifically from air intake deflectors and the driver’s respiratory tract.
The above review showed that despite the large number of studies, there is currently no clear methodology for analyzing the control of the climate system of transport crews. Therefore, in each specific case, it is necessary to conduct experimental studies.
This work aims to develop a method for studying the climate system operation in a railroad locomotive cabin [74] with two drivers (driver and assistant driver), as seen in Figure 1. In particular, a solution was obtained in the form of the speed fields, temperature, humidity, carbon dioxide concentration, and oxygen. Primary attention is paid to studying the values of air concentrations during breathing, which is a critical factor for ensuring the health of the driver and passengers. In particular, the normal level of carbon dioxide concentration according to ASHRAE standards [10,11] is considered as being less than 600 ppm (0.06%); when the value reaches 1000 ppm (0.1%), drowsiness already occurs; and a value of more than 2500 (0.25%) is considered hazardous to health.
The mathematical model is built based on hydrodynamic equations: the Navier–Stokes equations and the energy and continuity equations. To model humidity and gas concentration, a diffusion equation has been added to the system.
Winter and summer temperature scenarios are considered as heating and cooling modes of air in the cabin, respectively. The problem was solved in a nonstationary formulation, the times of field stabilization were found, and graphs of the values of velocities, temperatures, humidity, and gas concentrations were constructed in different areas of the cabin at different times. The values of power consumption (energy efficiency) for various modes of operation of the climate system are also plotted. A comparative analysis of the uniformity of fields along the height of the cabin with different locations of deflectors was carried out, and optimal configurations were found. A qualitative assessment of the driver’s blowing directions under different circulation and recirculation modes is given from the point of view of the concentration of carbon dioxide in the breathing area. As a verification, a comparison was made with experimental data on measuring microclimate indicators at workplaces for the mainline diesel locomotive 2TE25K.
The significance of this work is as follows. The constructed numerical algorithm allows for the research and optimization of all necessary air flows inside the cabin. In particular, it allows researchers to study changes in the concentration of carbon dioxide in the cabin and in the inhaled air, including studying different degrees of air recirculation to increase energy efficiency. This model allows researchers to study the issues of the effective operation of life support systems in the absence of external air in critical situations and external air pollution, and it also allows for the simulation of the spread of harmful substances when entering the cabin and their effective removal.
2. Materials and Methods
2.1. Problem Statement
The approach is based on the Navier–Stokes equations, in which liquids are represented as a continuous continuum [3,4]. The system of equations consists of relations of moments (1), continuity (2), energy (3), and relations for an ideal gas (Cliperon–Mendeleev) (4); to model air humidity and gas concentrations, diffusion Equations (5)–(7) are used [75,76]:
The main variables here are the following: u is the velocity of the medium; is density; p is pressure; T—temperature; is the mass fraction of substance i; is the diffuse flow of substance i; is the turbulent Schmidt number; and where is the only tensor.
Gas parameters: refers to the viscosities; λ and are thermal conductivity and specific heat capacity; R and M are the gas constant and the molar mass; is the turbulent Schmidt number; is the turbulent viscosity; are the mass diffusion coefficients; and are the thermal diffusion coefficients (thermal diffusion coefficients).
At the boundaries of the region Ω with normal n, fixed field values are specified. For temperatures and concentrations, their flows are additionally specified:
Thus, partial differential Equations (1)–(7) with boundary conditions (8) and (9) represent a system of closed boundary value problems of air motion.
2.2. Geometry Model
Figure 2 and Figure 3 show a flat diagram and a 3D model of the cabin of the mainline freight diesel locomotive 2TE25K [74]. Air enters the cabin through the deflectors, which are shown in orange in Figure 3a, and exits through the exhaust valve located in the floor, shown in blue in Figure 3b. In this diagram, the inlet deflectors are located on the sides of the windshield, in front of the front feet, and under the windshield. Below in this work, cases of other blowing configurations are also studied.
3. Results
3.1. Numerical Analysis
To numerically solve the boundary differential problem (1)–(8), CFD analysis was used. This method consists of replacing the main variables with Reynolds-averaged ones [77,78,79,80,81,82] and using new RANS equations. In this case, there is a need to use turbulence models.
The Ansys CFD (Ansys Fluent) finite volume analysis package was used to obtain the numerical results and the settings are shown in Table 1. Figure 4 shows a polygonal mesh of the surface of the locomotive cab half, which was constructed using Ansys Meshing.
The numerical method chosen was “Simplex” based on the “Pressure-Based” solver. The turbulence model was used , proposed by Ansys Fluent by default, although to increase the speed of calculation in such problems it may be more preferable to use the turbulence model. A special transport model was used to simulate humidity.
Table 2 shows the number of iterations of convergence of the stationery and transition problems depending on the number of cells and grid nodes, as well as the values of the specified residuals. The quality of the grid (Table 2 and Table 3) was assessed by the value of the mesh orthogonality parameter. For these tasks, this value is within acceptable values [77]. First, the tetragonal mesh was built in Ansys Meshing, then it was converted into a polygonal conformal mesh inside Ansys Fluent Meshing, which allows for the reduction in the number of elements by increasing the number of nodes.
For the nonstationary time integration problem, a fixed time step s was chosen. This value was set based on recommendations in [77]:
Here, is the characteristic size; in this case, the average cell size is 25 mm; and v is the characteristic speed. The characteristic speed for (10) is taken to be 0.7 and obtained based on the speed values at the entrance deflectors and several preliminary calculation operations. For these values, s. For a given step, according to (10), the flow will cover a distance of no more than one cell.
As a turbulence model for the RANS equation, two-parameter models of isotropic turbulence [77,78] were chosen: the model (transfer equations are written for the kinetic energy of turbulence and the specific dissipation rate of turbulent energy ) and the model (transport equations are written for the kinetic energy of turbulence and the rate of dissipation of turbulent energy ). For these problems, they show almost identical results, but the model converges 30% faster. The model does not include complex nonlinear wall damping functions required for the model, and therefore it is more accurate and more stable and is recommended for use by default as a universal model in the latest versions of Ansys Fluent [77].
The Species Transport model in Ansys Fluent calculates the concentrations of water vapor, oxygen, and carbon dioxide. The mixing and transport of chemicals can be modeled by solving conservation equations, which describe convection, diffusion, and reactions for each component. No chemical reactions occur in this solution.
3.2. Task Parameters
The train cabin is made of a metal frame of a multilayer wall. Table 1: The outside of the cabin is sheathed with 2.5 mm thick steel sheets welded to the frame, and the inside is lined with 3 mm thick perforated aluminum sheets. To ensure good sound insulation and thermal insulation, the internal surfaces of the sheets and frame are covered with anti-noise mastic, and between the sheets of outer and inner cladding, packages of glass plates or insulation, in particular polyethylene foam, covered with polyamide film are installed into the frame.
In order to consider heat exchange with the environment, convective heat transfer was used to model the cabin wall and external domain (8). As an applied theory for obtaining heat transfer coefficients α, the Jurgens formula was used [40]. Parameter values are given in Table 4.
A comparative analysis of thermal characteristics using applied theories and directly taking into account the external environment as a separate domain is given in [40].
Using Formula (11) for the wall thickness of 0.0375 m, the values of the coefficient = 1.04 (heat transfer coefficient) can be obtained. The composition of the wall is presented in Table 3.
Here, is the external air speed (train speed); are the thermal conductivity of the i-th wall and the thickness; and α is the thermal conductivity coefficient for the walls.
For a train speed of 16.7 m/s, the heat transfer coefficient of the wall was 1.04 and that of the windows was 38.14 .
For numerical and experimental purposes, a train moving at a constant speed was considered. It was assumed that the climate system in the train was not operating and that velocities, temperatures, and concentrations had constant values according to the values given below. Then, the climate system was set to operate at the initial moment of time. Initial and boundary conditions were set (Table 5 and Table 6) with equipment characteristics [83].
The problem was solved for summer and winter modes; accordingly, the cooling and heating of the cabin were modeled in the time domain.
To estimate the value of the amount of water vapor in the air, it is more convenient to use values relative to humidity in %. Arden Buck’s formulas [84] can be used to translate the values:
To determine the mass and thermal diffusion coefficients in Equation (7) for an ideal gas, the kinetic theory relations available in Ansys [78] were used. In general, these coefficients depend on the temperature, pressure, and composition of the mixture.
Table 7 presents the average values of diffusion coefficients in the volume for the winter and summer regimes.
3.3. Breathing Simulation
In this case, the breathing rate from time t of one driver is given by a periodic function:
Here, is the volume of inhaled air per breath, m3; —time of one breath, s; and is the inhalation–exhalation surface area (nasal or oral surfaces), m2.
The concentration of carbon dioxide and humidity during respiration were specified over time by piecewise constant functions (set 1) in accordance with Table 3.
The assumption in this case is that the concentration of carbon dioxide in exhaled air remains unchanged, regardless of the increase in inhaled air concentration. However, as a complication, it is possible to assume a variable concentration of exhaled carbon dioxide, depending on the inhaled one.
3.4. Numerical Results
Initially, a nonstationary problem was solved. The process was studied until the onset of a stable state, and the time to achieve stabilized parameters and the values of the parameters at each time step were determined.
The following Figure 5, Figure 6, Figure 7, Figure 8, Figure 9, Figure 10, Figure 11 and Figure 12 show the values of solving nonstationary problems over time for the summer and winter modes. The initial and boundary conditions were set in accordance with Table 4, Table 5, Table 6, Table 7 and Table 8.
Temperatures and carbon dioxide concentrations are given:
- Average values at the entrances and exits from the cabin (designation in the Figures below: “Inlets” and “Outlets”);
- Average value in the cabin (designation in the Figures below: “in Volume”);
- Average value on the driver’s inhalation–exhalation surface (designation in the Figures below: “Breath”);
- In front of the driver’s face at the intersection of two lines (hereinafter referred to as the Center), as seen in Figure 4 (designation in the Figures below: “In center”).
In addition, Figure 8 and Figure 9 show the graphs of carbon dioxide concentration obtained in the recirculation mode for the summer mode: values in the center (in “center” Rec) and the average value in the cabin (“in Volume Rec”).
It is necessary to explain how the recirculation mode works in climate systems. Air in the circulation mode after leaving the cabin through the valve (outlet) enters the pipe space, and then completely (or partially in case of partial recirculation) comes back to the inlet. Thus, for the mathematical formulation at the inputs of the values of concentrations of carbon dioxide and water vapor, we need to set not the data from Table 4 but those values that are obtained in the previous iteration at the output (, where —time step). That is, the values of inlet concentrations will increase with time. The values of inlet temperatures and velocities, on the other hand, will not change because they are regulated by the climate system. In such a mathematical formulation, we are expected to obtain a decrease in energy consumption (required power of the climate system) but also an increase in the concentration of carbon dioxide and humidity in the cabin.
The field stabilization time was about 300 s. Table 9 shows the results of average values by the cabin volume and in front of the driver’s face in the center for a time of 300 s.
The power of the climate system according to heat balances in summer was 3122 W, and in winter it was 11,624 W. Power in this case is calculated using the following formula:
where is the mass air flow rate, is the heat capacity of the air, and ∆T is the temperature difference at the inlet and outlet to the climate system.
Figure 13 shows the power values of the climate system for the summer and winter modes in the full circulation and full recirculation modes, respectively. Power in the recirculation mode is reduced by the climate system using cooled or heated air from the cabin rather than from outside. In the recirculation modes, power is reduced by a factor of 5 in the summer mode and by a factor of 3 in the winter mode.
4. Comparison with Experimental Data
Verification was carried out on the basis of a comparison with the experiment of measuring microclimate parameters at workplaces for the mainline diesel locomotive 2TE25K—Protocol No. 125/1 dated 25 September 2020. The measurements were carried out by the Meteoskop-M, seen in Figure 20a [87], a microclimate parameter meter, with serial number 220516, in accordance with the standards [88]. The error of “Meteoscop-M” is ±0.2 °C.
According to this technique, measurements are carried out at a distance of 0.15 m and 1.5 m from the cabin floor; only average values are recorded in the protocol. Table 10 shows the temperatures obtained numerically and as a result of measurements. Numerical values were recorded at a height of 0.15 m and 1.5 m from the cabin floor on the vertical axis, as seen in Figure 20b and Figure 21.
The difference between numerical calculations and the experiment was 3.5% and 7.4%, respectively.
5. Discussion
Based on the distribution of fields obtained above, the following patterns can be identified in the behavior of air flows and value fields in the cabin of a diesel locomotive:
- The nature of the distribution of speeds and temperatures is significantly uneven.
- Limit values are reached in the areas of greatest airflow, located under the windshield.
- Areas of air “stagnation” are located in the upper corners of the cabin.
- In the winter mode, flow velocities reach higher values at a distance from the deflectors, which is caused by higher air temperatures in the winter mode.
For a more detailed study of the unevenness of the fields, Figure 22, Figure 23, Figure 24 and Figure 25, graphs of the distribution of temperatures and velocities on the vertical (OY) and horizontal (OZ) axes were constructed. Dashed lines mark the intersections with the driver and the seat. The results of magnitude distributions along the OX axis are not presented in this paper due to space limitations.
Calculations were performed for three extra deflector locations and blowing speeds to evaluate their influence, while maintaining a total flow rate of 380 for the summer mode:
- (a)
- The deflector located under the windshield has been reduced in area by half. The total incoming flow speed increased to 0.7 m/s;
- (b)
- The deflector located under the windshield was moved to the cab roof without changing the area. The flow velocity took on the initial value of 0.4 m/s;
- (c)
- The deflector located under the windshield has been reduced in area by half. A deflector of the same size was located on the roof. The flow velocity took on the initial value of 0.4 m/s.
To numerically assess the impact of the location of the air intake deflectors, Table 11 shows the difference in values on the vertical axis, as seen in Figure 4b, at a distance of 0.15 m and 1.5 m from the floor. The problem was solved in a stationary formulation. The smallest values are highlighted in green, i.e., values for which the location of the deflectors gives the most uniform picture of the distribution of values along the height on a given axis.
Thus, the most uniform picture of the location of the temperature field is provided by the option with the location of deflectors on the roof, and for the fields of speeds, relative humidity, and carbon dioxide concentration, this is provided by the simultaneous location of deflectors on the roof and under the windshield.
Humidity. Maximum relative humidity values are reached in winter due to significantly lower ambient temperatures. Relative humidity limits are located along the cabin trim and above the window area.
Above the front window, a value greater than 100% is reached, which in real conditions leads to condensation and at low temperatures can lead to freezing of surfaces. It is worth noting that this mathematical theory, and, directly, the use of the diffusion equation, can be applied quite accurately for relative humidity values from 0% to 100% and can predict the very fact of the formation of the “dew point”. If this range is exceeded, it is necessary to use models that take into account the phase transition of water vapor from gaseous to liquid and solid states.
Carbon dioxide. In full circulation mode (air intake outside the cabin), the average values of carbon dioxide concentration in the cabin practically do not increase, which is caused by a much greater influx of air with a higher oxygen content than carbon dioxide entering during breathing.
For the summer regime in the time range of 30–80 s, as seen in Figure 6, an increase in CO2 concentration is observed. A detailed examination of the fields’ slices over time shows that up to a range of 30 s, exhaled air spreads downward from the breathing area; then, as the cabin space cools, it begins to rise; and after a range of 80 s, it spreads upward. Thus, in the range of 30–80 s, a “stagnation” zone is formed in front of the driver’s face. A similar behavior of the air environment can be seen in Figure 14, Figure 15, Figure 16, Figure 17 and Figure 18, in which the flows from the windowsill deflectors propagate down and up for the summer and winter modes, respectively. This fact is caused not only by the temperature ratio of the flows but also by the complex field of air velocities.
In full recirculation mode in Figure 8 and Figure 9, we see the expected increase in carbon dioxide values over time.
Based on the calculations performed, the following assumptions and recommendations can be made for effectively reducing the concentration of carbon dioxide depending on the circulation mode:
- For the full circulation mode (air intake from outside), the most effective will be the flow that “blows away” the air from the driver’s breathing area towards the outlet valves. In this case, the most optimal would be, in particular, the location of the air deflectors on the roof of the cabin. Thus, Figure 26 shows a three-dimensional graph of CO2 streamlines for the summer mode when exhaling with a deflector on the roof. It can be seen that the exhaled air is almost immediately blown towards the outlet valve.
- For full or partial recirculation mode, the blowing flow should remove air from the breathing area to the far edges of the cabin, mixing it as much as possible. In this case, a more complex configuration of deflectors will be most effective, for example, the simultaneous operation of deflectors located under the front window and on the roof.
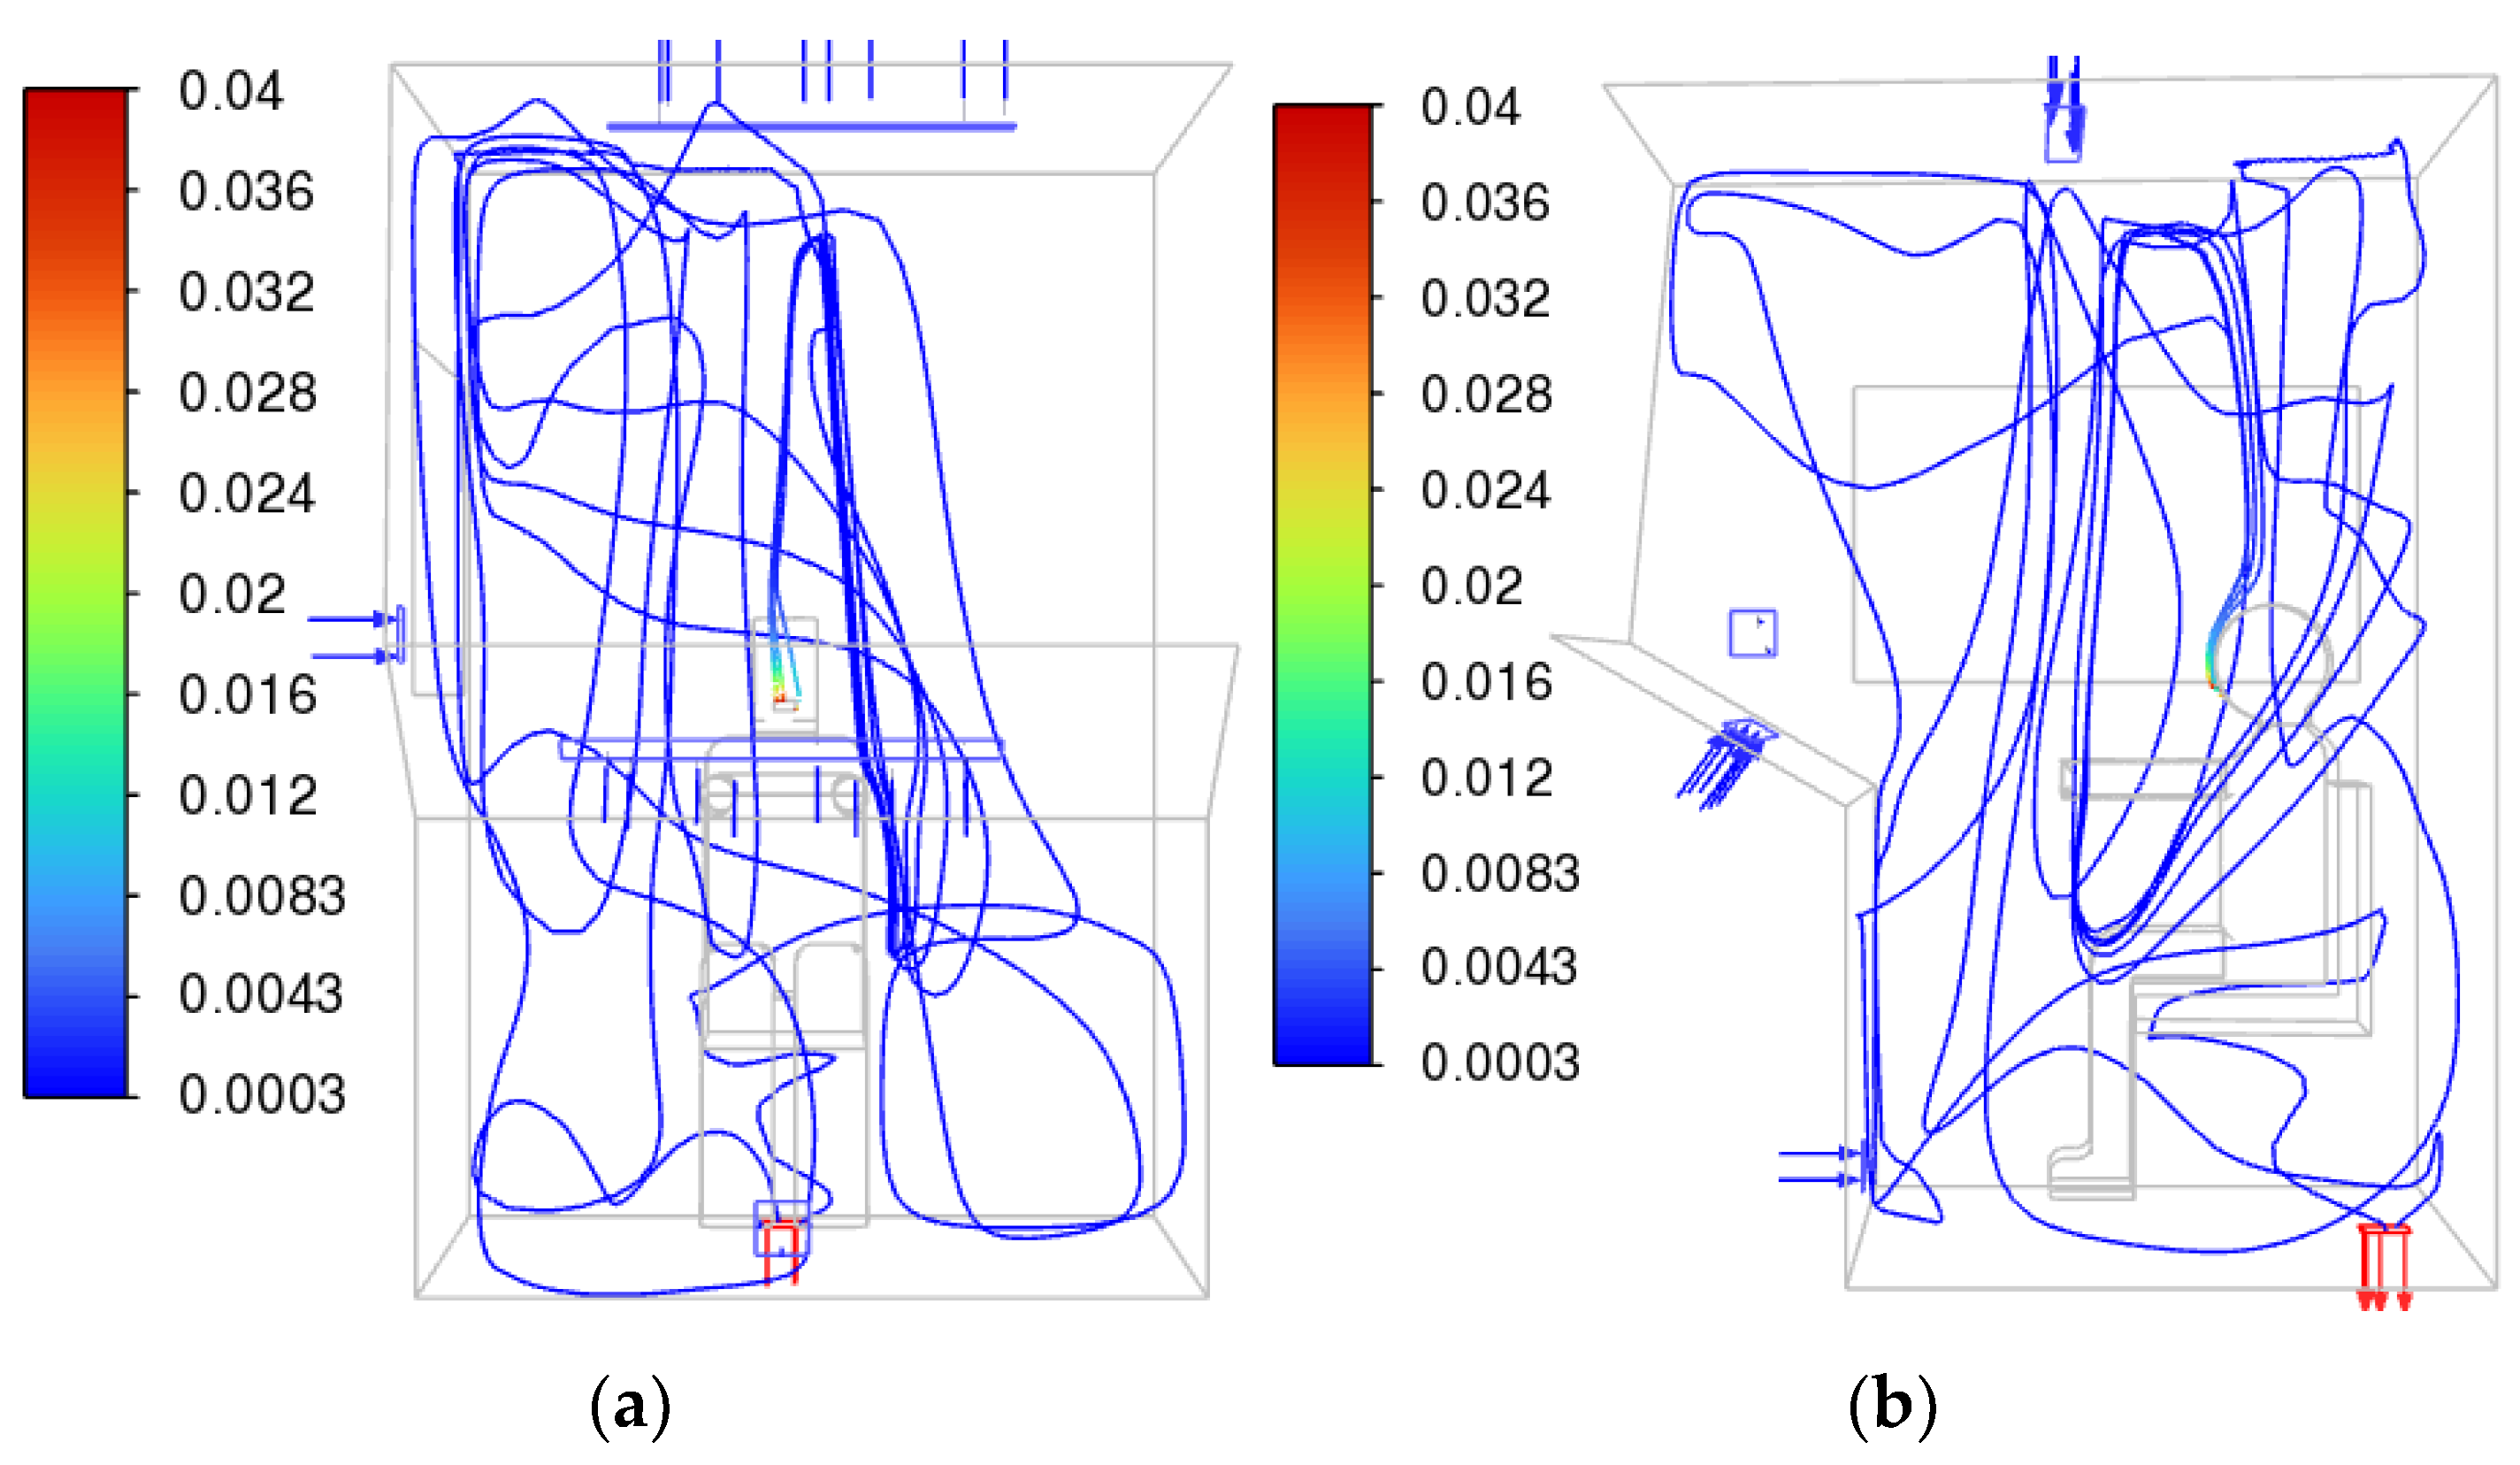
Thus, Figure 27 shows a three-dimensional graph of CO2 streamlines for the summer mode during exhalation with deflectors on the roof and under the windshield. It can be seen that the exhaled air has a rather complex trajectory and spreads throughout the entire volume of the cabin.
6. Conclusions
The following main results were obtained:
- 1.
- Fields and graphs of the distribution of temperatures, speeds, humidity, and carbon dioxide concentrations in the time range for summer and winter regimes were constructed. A comparison was made with experimental data on measuring microclimate indicators at workplaces of the mainline diesel locomotive 2TE25K. The differences be-tween the numerical calculations and experiment were 3.5% and 7.4%, respectively.
- 2.
- The proposed solution makes it possible to reduce electricity consumption from 3.1 kW to 0.6 kW and in the winter mode reduce it from 11.6 kW to 3.9 kW and save up to 1.5 L/h of fuel. For the winter regime, areas of “dew point” formation and condensation formation were identified.
- 3.
- The fields of carbon dioxide concentration were studied as a function of time and for various operations of the input deflectors. A local time range for the increase in CO2 concentration in summer due to air stagnation in the breathing area has been identified. Recommendations are given for the optimal maintenance of oxygen levels for various air circulation modes:
- a.
- For the full circulation mode (air intake from outside), the most effective will be the flow that “blows away” the air from the driver’s breathing area towards the outlet valves. In this work, as an example, the operation of an injection deflector on the roof of the cabin is considered;
- b.
- For full or partial recirculation mode, the blowing flow should remove air from the breathing area to the far edges of the cabin, mixing it as much as possible. In this case, the most effective would be a more complex configuration of deflectors, for example, the simultaneous operation of deflectors located under the front window and on the roof.
- 4.
- The recirculation mode allows for a significant reduction in climate system output and an increase in energy efficiency by recycling pre-cooled or heated cabin air rather than outside air. Thus, full recirculation modes increase energy efficiency by a factor of 5 for the summer mode and by a factor of 3 for the winter mode.
The presented model allows researchers to study and optimize the operation of climate systems, including for improving energy efficiency and reducing transport pollutant emissions, considering the maintenance of thermal comfort parameters and maximum permissible concentrations of carbon dioxide. This method can also simulate the entry and spread of harmful substances in the vehicle cabin.
It is proposed to consider the following as further research in this work:
- Addition of equations to the mathematical model reflecting the phase transitions of water vapor for more accurate modeling when the relative humidity exceeds 100%;
- Considering solar radiation on heat exchange in the cabin;
- Conducting experimental measurements of fields for various deflector operating schemes, including CO2 concentration fields;
- Extended numerical study of the full recirculation mode, the influence of the deflectors, as well as the behavior of experimental measurements for this case;
- Also quite interesting is the study of excess pressure in the cabin, which is necessary, among other things, to prevent the entry of dust and pollutants through leaks in the cabin casing, bypassing the filter elements of the climate system. These studies have already been conducted and are being prepared for publication.
The conducted research can be used to develop modern energy-efficient and safe systems for providing comfortable climate conditions for drivers and passengers of various types of transport.
Author Contributions
Conceptualization, I.P. and A.N.B.; methodology, I.P. and A.N.B.; software, I.P.; validation, I.P. and A.N.B.; formal analysis, I.P.; investigation, I.P., A.N.B. and B.M.; resources, B.M.; data curation, I.P.; writing—original draft preparation, I.P. and A.N.B.; writing—review and editing, I.P. and A.N.B.; visualization, I.P.; supervision, B.M.; project administration, B.M.; funding acquisition, A.N.B. and B.M. All authors have read and agreed to the published version of the manuscript.
Funding
This research received no external funding.
Data Availability Statement
The original contributions presented in the study are included in the article.
Acknowledgments
The authors would like to acknowledge the administration of Don State Technical University for their resources and financial support.
Conflicts of Interest
The authors declare no conflicts of interest.
Nomenclature
| HVAC | Heating, ventilation, and air conditioning |
| CFD | Computational Fluid Dynamics |
| Velocity of the Medium | |
| Density | |
| Pressure | |
| Temperature | |
| Mass Fraction of Substance | |
| Diffuse Flow of Substance | |
| Turbulent Schmidt Number | |
| Viscosities | |
| Thermal Conductivity | |
| Specific Heat Capacity | |
| Gas Constant | |
| Molar Mass | |
| Turbulent Schmidt Number | |
| Thermal Diffusion Coefficients |
References
- Mikhailov, M.V.; Guseva, S.V. Microclimate in the Cabins of Mobile Vehicles; Engineering: Moscow, Russia, 1977; 230p. [Google Scholar]
- Panfilov, I.A.; Soloviev, A.N.; Matrosov, A.A.; Meskhi, B.C.; Polushkin, O.O.; Rudoy, D.V.; Pakhomov, V.I. Finite element simulation of airflow in a field cleaner. IOP Conf. Ser. Mater. Sci. Eng. 2020, 1001, 012060. [Google Scholar] [CrossRef]
- Bordbari, M.J.; Nasiri, F. Networked Microgrids: A Review on Configuration, Operation, and Control Strategies. Energies 2024, 17, 715. [Google Scholar] [CrossRef]
- Bhagat, R.K.; Davies Wykes, M.S.; Dalziel, S.B.; Linden, P.F. Effects of ventilation on the indoor spread of COVID-19. J. Fluid Mech. 2020, 903, F1. [Google Scholar] [CrossRef]
- Meskhi, B.; Rudoy, D.; Lachuga, Y.; Pakhomov, V.; Soloviev, A.; Matrosov, A.; Panfilov, I.; Maltseva, T. Finite Element and Applied Models of the Stem with Spike Deformation. Agriculture 2021, 11, 1147. [Google Scholar] [CrossRef]
- Russi, L.; Guidorzi, P.; Pulvirenti, B.; Aguiari, D.; Pau, G.; Semprini, G. Air Quality and Comfort Characterisation within an Electric Vehicle Cabin in Heating and Cooling Operations. Sensors 2022, 22, 543. [Google Scholar] [CrossRef] [PubMed]
- Basciotti, D.; Dvorak, D.; Gellai, I. A Novel Methodology for Evaluating the Impact of Energy Efficiency Measures on the Cabin Thermal Comfort of Electric Vehicles. Energies 2020, 13, 3872. [Google Scholar] [CrossRef]
- World Health Organization. Air Quality Guidelines: For Europe, 2nd ed.; World Health Organization: Copenhagen, Denmark, 2000. [Google Scholar]
- Lombardi, L.; Castaldi, M.J. Energy Recovery from Residual Municipal Solid Waste: State of the Art and Perspectives within the Challenge to Climate Change. Energies 2024, 17, 395. [Google Scholar] [CrossRef]
- ANSI/ASHRAE Standard 62.1-2010; Ventilation for Acceptable Indoor Air Quality. ANSI: Washington, DC, USA. Available online: http://arco-hvac.ir/wp-content/uploads/2016/04/ASHRAE-62_1-2010.pdf (accessed on 23 March 2024).
- Wang, G.; Yu, Y.; Zhang, C. Optimization Control Strategy for Transition Season Blinds Balancing Daylighting, Thermal Discomfort, and Energy Efficiency. Energies 2024, 17, 1543. [Google Scholar] [CrossRef]
- Zhonghua, Y.; Fang, Y.; Za, Z. Health protection guideline of passenger transport stations and transportation facilities during COVID-19 outbreak. Chin. J. Prev. Med. 2020, 54, 359–361. [Google Scholar] [CrossRef]
- Mor, G.; Cipriano, J.; Gabaldon, E.; Grillone, B.; Tur, M.; Chemisana, D. Data-Driven Virtual Replication of Thermostatically Controlled Domestic Heating Systems. Energies 2021, 14, 5430. [Google Scholar] [CrossRef]
- Delgado, C.J.; Alfaro-Mejía, E.; Manian, V.; O’Neill-Carrillo, E.; Andrade, F. Photovoltaic Power Generation Forecasting with Hidden Markov Model and Long Short-Term Memory in MISO and SISO Configurations. Energies 2024, 17, 668. [Google Scholar] [CrossRef]
- Salari, M.; Milne, R.J.; Delcea, C.; Kattan, L.; Cotfas, L.A. Social distancing in airplane seat assignments. J. Air Transp. Manag. 2020, 89, 101915. [Google Scholar] [CrossRef] [PubMed]
- Talaat, K.; Abuhegazy, M.; Mahfoze, O.A.; Anderoglu, O.; Poroseva, S.V. Simulation of aerosol transmission on a Boeing 737 airplane with intervention measures for COVID-19 mitigation. Phys. Fluids 2021, 33, 033312. [Google Scholar] [CrossRef] [PubMed]
- Baehr, H.D.; Kabelac, S. Thermodynamik; Springer: Berlin/Heidelberg, Germany, 2012; 667p. [Google Scholar] [CrossRef]
- Hurnik, M.; Ciuman, P.; Popiolek, Z. Eddy–Viscosity Reynolds-Averaged Navier–Stokes Modeling of Air Distribution in a Sidewall Jet Supplied into a Room. Energies 2024, 17, 1261. [Google Scholar] [CrossRef]
- Kuzovlev, V.A. Technical Thermodynamics and Basics of Heat Transfer, 2nd ed.; Higher School: Moscow, Russia, 1983; 335p. [Google Scholar]
- Beskopylny, A.; Chukarin, A.; Meskhi, B.; Isaev, A. Modeling of Vibroacoustic Characteristics of Plate Structures of Vehicles during Abrasive Processing. Transp. Res. Procedia 2021, 54, 39–46. [Google Scholar] [CrossRef]
- Lv, X.; Wu, W.-T.; Lv, J.; Mao, K.; Gao, L.; Li, Y. Study on the Law of Pseudo-Cavitation on Superhydrophobic Surface in Turbulent Flow Field of Backward-Facing Step. Fluids 2021, 6, 200. [Google Scholar] [CrossRef]
- Vlasov, M.N.; Merinov, I.G. Application of an Integral Turbulence Model to Close the Model of an Anisotropic Porous Body as Applied to Rod Structures. Fluids 2022, 7, 77. [Google Scholar] [CrossRef]
- Soloviev, A.N.; Oganesyan, P.A.; Skaliukh, A.S.; Duong, L.V.; Gupta, V.K.; Panfilov, I.A. Comparison between applied theory and final element method for energy harvesting non-homogeneous piezoelements modeling. In Advanced Materials; Springer Proceedings in Physics; Springer: Cham, Switzerland, 2017; Volume 193, pp. 473–484. [Google Scholar] [CrossRef]
- Karthick, L.; Prabhu, D.; Rameshkumar, K.; Prabhu, T.; Jagadish, C.A. CFD analysis of rotating diffuser in a SUV vehicle for improving thermal comfort. Mater. Today Proc. 2022, 52, 1014–1025. [Google Scholar] [CrossRef]
- Hemmati, S.; Doshi, N.; Hanover, D.; Morgan, C.; Shahbakhti, M. Integrated cabin heating and powertrain thermal energy management for a connected hybrid electric vehicle. Appl. Energy 2021, 283, 116353. [Google Scholar] [CrossRef]
- Panfilov, I.A.; Ustinov, Y.A. Harmonic vibrations and waves in a cylindrical helically anisotropic shell. Mech. Solids 2012, 47, 195–204. [Google Scholar] [CrossRef]
- Bandi, P.; Manelil, N.P.; Maiya, M.P.; Tiwari, S.; Thangamani, A.; Tamalapakula, J.L. Influence of flow and thermal characteristics on thermal comfort inside an automobile cabin under the effect of solar radiation. Appl. Therm. Eng. 2022, 203, 117946. [Google Scholar] [CrossRef]
- Tan, L.; Yuan, Y. Computational fluid dynamics simulation and performance optimization of an electrical vehicle Air-conditioning system. Alex. Eng. J. 2022, 61, 315–328. [Google Scholar] [CrossRef]
- Beskopylny, A.; Kadomtseva, E.; Strelnikov, G. Numerical study of the stress-strain state of reinforced plate on an elastic foundation by the Bubnov-Galerkin method. IOP Conf. Ser. Earth Environ. Sci. 2017, 90, 012017. [Google Scholar] [CrossRef]
- Sukhinov, A.; Belova, Y.; Chistyakov, A.; Beskopylny, A.; Meskhi, B. Mathematical Modeling of the Phytoplankton Populations Geographic Dynamics for Possible Scenarios of Changes in the Azov Sea Hydrological Regime. Mathematics 2021, 9, 3025. [Google Scholar] [CrossRef]
- Lyapin, A.; Beskopylny, A.; Meskhi, B. Structural Monitoring of Underground Structures in Multi-Layer Media by Dynamic Methods. Sensors 2020, 20, 5241. [Google Scholar] [CrossRef] [PubMed]
- Broatch, A.; Olmeda, P.; Plá, B.; Dreif, A.; Onorati, A.; Marinoni, A. Numerical assessment of integrated thermal management systems in electrified powertrains. Appl. Therm. Eng. 2023, 221, 119822. [Google Scholar] [CrossRef]
- Steinstraeter, M.; Buberger, J.; Minnerup, K.; Trifonov, D.; Horner, P.; Weiss, B.; Lienkamp, M. Controlling cabin heating to improve range and battery lifetime of electric vehicles. eTransportation 2022, 13, 100181. [Google Scholar] [CrossRef]
- Lei, S.; Xin, S.; Liu, S. Separate and integrated thermal management solutions for electric vehicles: A review. J. Power Sources 2022, 550, 232133. [Google Scholar] [CrossRef]
- Beskopylny, A.N.; Meskhi, B.; Stel’makh, S.A.; Shcherban’, E.M.; Mailyan, L.R.; Veremeenko, A.; Akopyan, V.; Shilov, A.V.; Chernil’nik, A.; Beskopylny, N. Numerical Simulation of the Bearing Capacity of Variotropic Short Concrete Beams Reinforced with Polymer Composite Reinforcing Bars. Polymers 2022, 14, 3051. [Google Scholar] [CrossRef]
- Singh, S.; Abbassi, H. 1D/3D transient HVAC thermal modeling of an off-highway machinery cabin using CFD-ANN hybrid method. Appl. Therm. Eng. 2018, 135, 406–417. [Google Scholar] [CrossRef]
- Chang, T.-B.; Sheu, J.-J.; Huang, J.-W.; Lin, Y.-S.; Chang, C.-C. Development of a CFD model for simulating vehicle cabin indoor air quality. Transp. Res. Part D Transp. Environ. 2018, 62, 433–440. [Google Scholar] [CrossRef]
- Ahmed Mboreha, C.; Jianhong, S.; Yan, W.; Zhi, S.; Yantai, Z. Investigation of thermal comfort on innovative personalized ventilation systems for aircraft cabins: A numerical study with computational fluid dynamics. Therm. Sci. Eng. Prog. 2021, 26, 101081. [Google Scholar] [CrossRef]
- Oh, J.; Choi, K.; Son, G.; Park, Y.-J.; Kang, Y.-S.; Kim, Y.-J. Flow analysis inside tractor cabin for determining air conditioner vent location. Comput. Electron. Agric. 2020, 169, 105199. [Google Scholar] [CrossRef]
- Beskopylny, A.N.; Panfilov, I.; Meskhi, B. Modeling of Flow Heat Transfer Processes and Aerodynamics in the Cabins of Vehicles. Fluids 2022, 7, 226. [Google Scholar] [CrossRef]
- Kaewbumrung, M.; Charoenloedmongkhon, A. Numerical Simulation of Turbulent Flow in Eccentric Co-Rotating Heat Transfer. Fluids 2022, 7, 131. [Google Scholar] [CrossRef]
- Abdel Aziz, S.S.; Saber Salem Said, A.-H. Numerical Investigation of Flow and Heat Transfer over a Shallow Cavity: Effect of Cavity Height Ratio. Fluids 2021, 6, 244. [Google Scholar] [CrossRef]
- Lahaye, D.; Nakate, P.; Vuik, K.; Juretić, F.; Talice, M. Modeling Conjugate Heat Transfer in an Anode Baking Furnace Using OpenFoam. Fluids 2022, 7, 124. [Google Scholar] [CrossRef]
- Chang, T.; Lin, Y.; Hsu, Y. CFD simulations of effects of recirculation mode and fresh air mode on vehicle cabin indoor air quality. Atmos. Environ. 2023, 293, 119473. [Google Scholar] [CrossRef]
- Beskopylny, A.N.; Stel’makh, S.A.; Shcherban’, E.M.; Mailyan, L.R.; Meskhi, B.; Efremenko, I.; Varavka, V.; Beskopylny, N.; Dotsenko, N. Modeling and Experimental Verification of the Performance of Polymer Composite Reinforcing Bars of Different Types in Concrete of Different Density. Polymers 2022, 14, 1756. [Google Scholar] [CrossRef]
- Shcherban’, E.M.; Stel’makh, S.A.; Beskopylny, A.; Mailyan, L.R.; Meskhi, B.; Shuyskiy, A.; Beskopylny, N.; Dotsenko, N. Mathematical Modeling and Experimental Substantiation of the Gas Release Process in the Production of Non-Autoclaved Aerated Concrete. Materials 2022, 15, 2642. [Google Scholar] [CrossRef]
- Hassan, A.M.; Megahed, N.A. COVID-19 and urban spaces: A new integrated CFD approach for public health opportunities. Build. Environ. 2021, 204, 108131. [Google Scholar] [CrossRef] [PubMed]
- Motamedi, H.; Shirzadi, M.; Tominaga, Y.; Mirzaei, P.A. CFD modeling of airborne pathogen transmission of COVID-19 in confined spaces under different ventilation strategies. Sustain. Cities Soc. 2022, 76, 103397. [Google Scholar] [CrossRef] [PubMed]
- Faleiros, D.E.; van den Bos, W.; Botto, L.; Scarano, F. TU Delft COVID-app: A tool to democratize CFD simulations for SARS-CoV-2 infection risk analysis. Sci. Total Environ. 2022, 826, 154143. [Google Scholar] [CrossRef] [PubMed]
- Pirouz, B.; Mazzeo, D.; Palermo, S.A.; Naghib, S.N.; Turco, M.; Piro, P. CFD Investigation of Vehicle’s Ventilation Systems and Analysis of ACH in Typical Airplanes, Cars, and Buses. Sustainability 2021, 13, 6799. [Google Scholar] [CrossRef]
- Ravindra, K.; Agarwal, N.; Mor, S. Assessment of thermal comfort parameters in various car models and mitigation strategies for extreme heat-health risks in the tropical climate. J. Environ. Manag. 2020, 267, 110655. [Google Scholar] [CrossRef] [PubMed]
- Rajeswari Subramaniam, K.; Cheng, C.-T.; Pang, T.Y. Fuzzy Logic Controlled Simulation in Regulating Thermal Comfort and Indoor Air Quality Using a Vehicle Heating, Ventilation, and Air-Conditioning System. Sensors 2023, 23, 1395. [Google Scholar] [CrossRef] [PubMed]
- Muratori, L.; Peretto, L.; Pulvirenti, B.; Di Sante, R.; Bottiglieri, G.; Coiro, F. Optimal Control of Air Conditioning Systems by Means of CO2 Sensors in Electric Vehicles. Sensors 2022, 22, 1190. [Google Scholar] [CrossRef] [PubMed]
- Cvok, I.; Ratković, I.; Deur, J. Multi-Objective Optimisation-Based Design of an Electric Vehicle Cabin Heating Control System for Improved Thermal Comfort and Driving Range. Energies 2021, 14, 1203. [Google Scholar] [CrossRef]
- Cvok, I.; Ratković, I.; Deur, J. Optimisation of Control Input Allocation Maps for Electric Vehicle Heat Pump-based Cabin Heating Systems. Energies 2020, 13, 5131. [Google Scholar] [CrossRef]
- Alrebi, O.F.; Obeidat, B.; Abdallah, I.A.; Darwish, E.F.; Amhamed, A. Airflow dynamics in an emergency department: A CFD simulation study to analyse COVID-19 dispersion. Alex. Eng. J. 2022, 61, 3435–3445. [Google Scholar] [CrossRef]
- Mirzaie, M.; Lakzian, E.; Khan, A.; Warkiani, M.E.; Mahian, O.; Ahmadi, G. COVID-19 spread in a classroom equipped with partition—A CFD approach. J. Hazard. Mater. 2021, 420, 126587. [Google Scholar] [CrossRef] [PubMed]
- Bahramian, A.; Mohammadi, M.; Ahmadi, G. Effect of indoor temperature on the velocity fields and airborne transmission of sneeze droplets: An experimental study and transient CFD modeling. Sci. Total Environ. 2023, 858, 159444. [Google Scholar] [CrossRef]
- Sarhan, A.A.R.; Naser, P.; Naser, J. Aerodynamic Prediction of Time Duration to Becoming Infected with Coronavirus in a Public Place. Fluids 2022, 7, 176. [Google Scholar] [CrossRef]
- Li, C.; Brewer, E.; Pham, L.; Jung, H. Reducing Mobile Air Conditioner (MAC) Power Consumption Using Active Cabin-Air-Recirculation in A Plug-In Hybrid Electric Vehicle (PHEV). World Electr. Veh. J. 2018, 9, 51. [Google Scholar] [CrossRef]
- Li, R.; Liu, G.; Xia, Y.; Bantserova, O.L.; Li, W.; Zhu, J. Pollution Dispersion and Predicting Infection Risks in Mobile Public Toilets Based on Measurement and Simulation Data of Indoor Environment. Processes 2022, 10, 2466. [Google Scholar] [CrossRef]
- Lahimer, A.A.; Razak, A.A.; Sharol, A.F.; Sopian, K. Automotive cabin soak temperature control strategies for improved safety, comfort and fuel efficiency: A review. Sol. Energy 2023, 259, 416–436. [Google Scholar] [CrossRef]
- Rahvard, A.J.; Karami, S.; Lakzian, E. Finding the proper position of supply and return registers of air condition system in a conference hall in term of COVID-19 virus spread. Int. J. Refrig. 2023, 145, 78–89. [Google Scholar] [CrossRef]
- Goodson, M.; Feaster, J.; Jones, A.; McGowan, G.; Agricola, L.; Timms, W.; Uddin, M. Modeling Transport of SARS-CoV-2 Inside a Charlotte Area Transit System (CATS) Bus. Fluids 2022, 7, 80. [Google Scholar] [CrossRef]
- Wang, Z.; Galea, E.R.; Grandison, A.; Ewer, J.; Jia, F. A coupled Computational Fluid Dynamics and Wells-Riley model to predict COVID-19 infection probability for passengers on long-distance trains. Saf. Sci. 2022, 147, 105572. [Google Scholar] [CrossRef]
- Morsi, S.A.; Alexander, A.J. An Investigation of Particle Trajectories in Two-Phase Flow Systems. J. Fluid Mech. 1972, 55, 193–208. [Google Scholar] [CrossRef]
- Dennis, S.C.R.; Singh, S.N.; Ingham, D.B. The steady flow due to a rotating sphere at low and moderate Reynolds numbers. J. Fluid Mech. 1980, 101, 257–279. [Google Scholar] [CrossRef]
- Stipic, M.; Basara, B.; Schmidt, S.J.; Adams, N.A. Tabulated Chemistry Combustion Model for Cost-Effective Numerical Simulation of Dual-Fuel Combustion Process. Energies 2023, 16, 8040. [Google Scholar] [CrossRef]
- Miller, R.S.; Harstad, K.; Bellan, J. Evaluation of Equilibrium and Non-Equilibrium Evaporation Models for Many Droplets Gas-Liquid Flow Simulations. Int. J. Multiph. Flow 1998, 24, 1025–1055. [Google Scholar] [CrossRef]
- Sazhin, S.S. Advanced Models of Fuel Droplet Heating and Evaporation. Prog. Energy Combust. Sci. 2006, 32, 162–214. [Google Scholar] [CrossRef]
- Soloviev, A.N.; Panfilov, I.A.; Lesnyak, O.N.; Lee, C.Y.J.; Liu, Y.M. Numerical Simulation of Relative Humidity in a Vehicle Cabin. In Physics and Mechanics of New Materials and Their Applications; Parinov, I.A., Chang, S.H., Soloviev, A.N., Eds.; Springer Proceedings in Materials; Springer: Cham, Switzerland, 2023; Volume 20. [Google Scholar] [CrossRef]
- Chang, T.-B.; Sheu, J.-J.; Huang, J.-W. High-Efficiency HVAC System with Defog/Dehumidification Function for Electric Vehicles. Energies 2021, 14, 46. [Google Scholar] [CrossRef]
- Panfilov, I.; Beskopylny, A.N.; Meskhi, B. Numerical Simulation of Heat Transfer and Spread of Virus Particles in the Car Interior. Mathematics 2023, 11, 784. [Google Scholar] [CrossRef]
- JSC Transmashholding. Main-Line Freight Diesel Locomotive 2TE25K”: [Electronic Resource]. Available online: https://tmholding.ru/products/gruzovye/teplovozy-2te25km-3te25k2m/ (accessed on 1 May 2024).
- Fabregat, A.; Gisbert, F.; Vernet, A.; Dutta, S.; Mittal, K.; Pallarès, J. Direct numerical simulation of the turbulent flow generated during a violent expiratory event. Phys. Fluids 2021, 33, 035122. [Google Scholar] [CrossRef]
- Katre, P.; Banerjee, S.; Balusamy, S.; Sahu, K.C. Fluid dynamics of respiratory droplets in the context of COVID-19: Airborne and surfaceborne transmissions. Phys. Fluids 2021, 33, 081302. [Google Scholar] [CrossRef]
- ANSYS Inc. Fluent User’s Guide: Release 2022 R1 January 2022. ANSYS Inc.: Canonsburg, PA, USA, 2022; Available online: http://www.pmt.usp.br/academic/martoran/notasmodelosgrad/ANSYS%20Fluent%20Users%20Guide.pdf (accessed on 3 February 2023).
- Pope, S. Turbulent Flows; Cambridge University Press: Cambridge, UK, 2000; 771p. [Google Scholar] [CrossRef]
- Couto, N.; Bergada, J.M. Aerodynamic Efficiency Improvement on a NACA-8412 Airfoil via Active Flow Control Implementation. Appl. Sci. 2022, 12, 4269. [Google Scholar] [CrossRef]
- Klein, M.; Trummler, T.; Urban, N.; Chakraborty, N. Multiscale Analysis of Anisotropy of Reynolds Stresses, Subgrid Stresses and Dissipation in Statistically Planar Turbulent Premixed Flames. Appl. Sci. 2022, 12, 2275. [Google Scholar] [CrossRef]
- Yang, X.; Yang, L. An Elliptic Blending Turbulence Model-Based Scale-Adaptive Simulation Model Applied to Fluid Flows Separated from Curved Surfaces. Appl. Sci. 2022, 12, 2058. [Google Scholar] [CrossRef]
- Ghoroghi, A.; Rezgui, Y.; Wallace, R. Impact of ventilation and avoidance measures on SARS-CoV-2 risk of infection in public indoor environments. Sci. Total Environ. 2022, 838, 156518. [Google Scholar] [CrossRef] [PubMed]
- Duffin, J.; Mohan, R.M.; Vasiliou, P.; Stephenson, R.; Mahamed, S. A model of the chemoreflex control of breathing in humans: Model parameters measurement. Respir. Physiol. 2000, 120, 13–26. [Google Scholar] [CrossRef] [PubMed]
- Buck, A.L. New equations for computing vapor pressure and enhancement factor. Am. Meteorol. Soc. 1981, 20, 1962–1982. [Google Scholar] [CrossRef]
- Abouelhamd, I.; Kuga, K.; Yoo, S.S.; Ito, K. Identification of probabilistic size of breathing zone during single inhalation phase in semi-outdoor environmental scenarios. Build. Environ. 2023, 243, 110672. [Google Scholar] [CrossRef]
- LLC “NTM-Zashchita”. Microclimate: [Electronic Resource]. Available online: https://ntm.ru/products/70/7774// (accessed on 1 May 2024).
- SanPiN 1.2.3685-21; Hygienic Standards and Requirements for Ensuring the Safety and (or) Harmlessness of Environmental Factors to Humans. Resolution of the Chief State Sanitary Doctor of the Russian Federation dated 28 January 2021 No. 2 (as amended on 30 December 2022). Meganorms: Moscow Oblast, Russia, 2022.
- Kim, Y.; Lee, M.; Shin, Y.; Cho, H. Investigation of changes in Driver’s biosignals and thermal comfort according to the heating method in winter. Case Stud. Therm. Eng. 2023, 42, 102749. [Google Scholar] [CrossRef]
- KSC Group. Climatic Equipment: [Electronic Resource]. Available online: https://kscgroup.ru/produktsiya/transport/lokomotivy// (accessed on 1 May 2024).
Figure 1.
2TE25KM—mainline freight two-section diesel locomotive with AC-DC electrical transmission: (a) general view; (b) control system.
Figure 1.
2TE25KM—mainline freight two-section diesel locomotive with AC-DC electrical transmission: (a) general view; (b) control system.

Figure 2.
Typical scheme of cabin: (a) actual diagram; (b) 3D model.

Figure 3.
Geometry model for FEM analysis: (a) orange—inputs; and (b) blue—outputs.
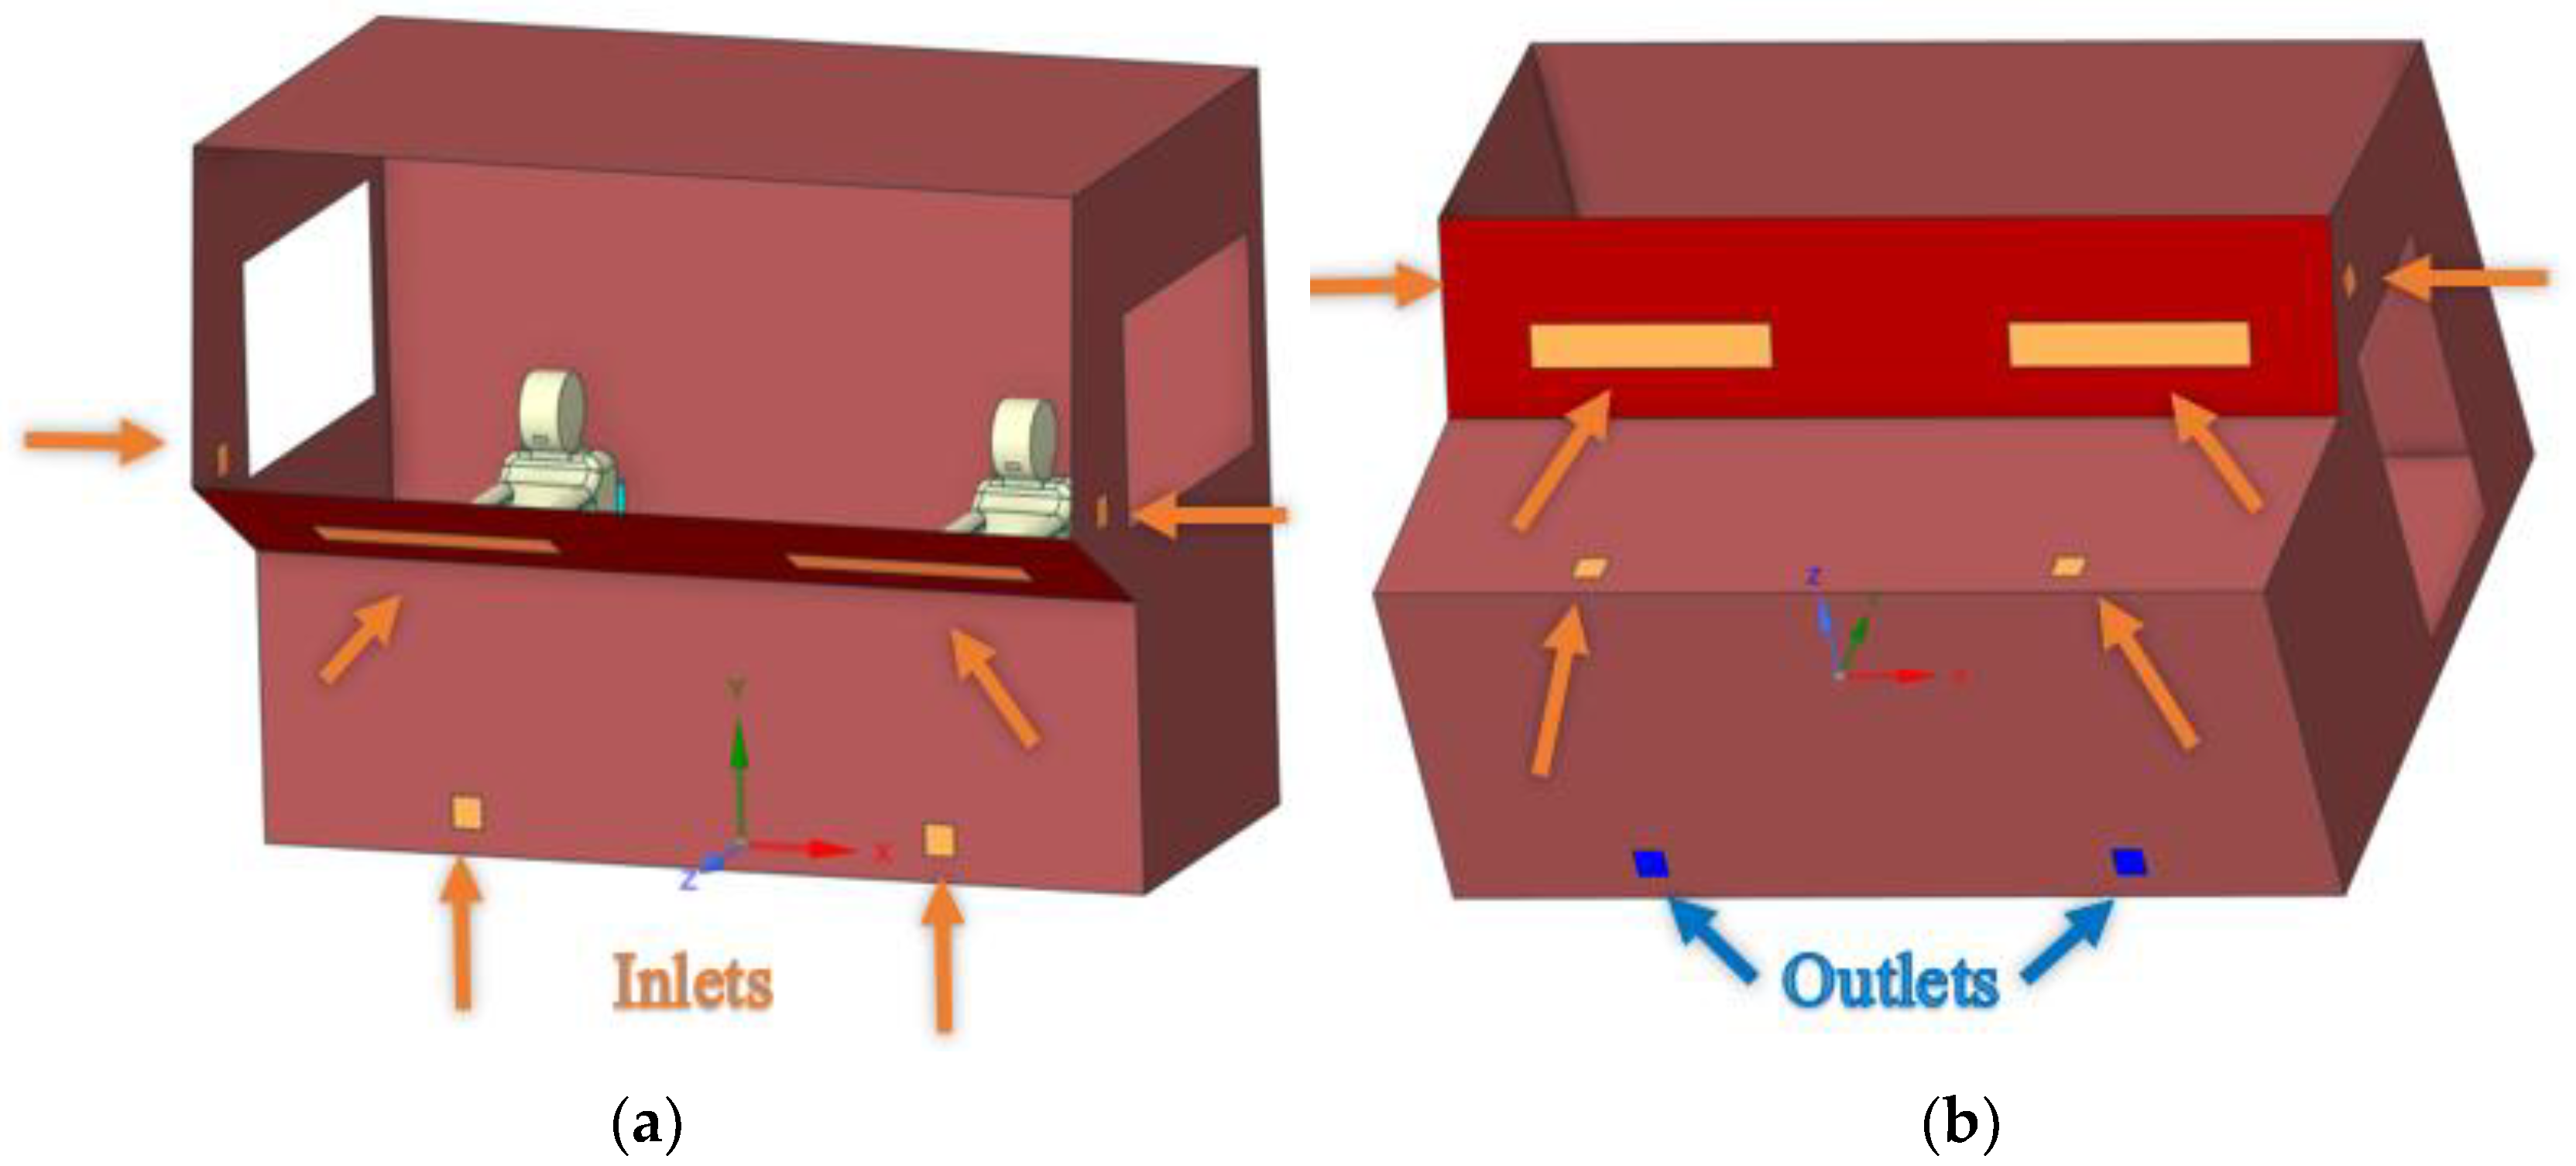
Figure 4.
Mesh of finite volumes: (a) axonometric view; (b) side view.
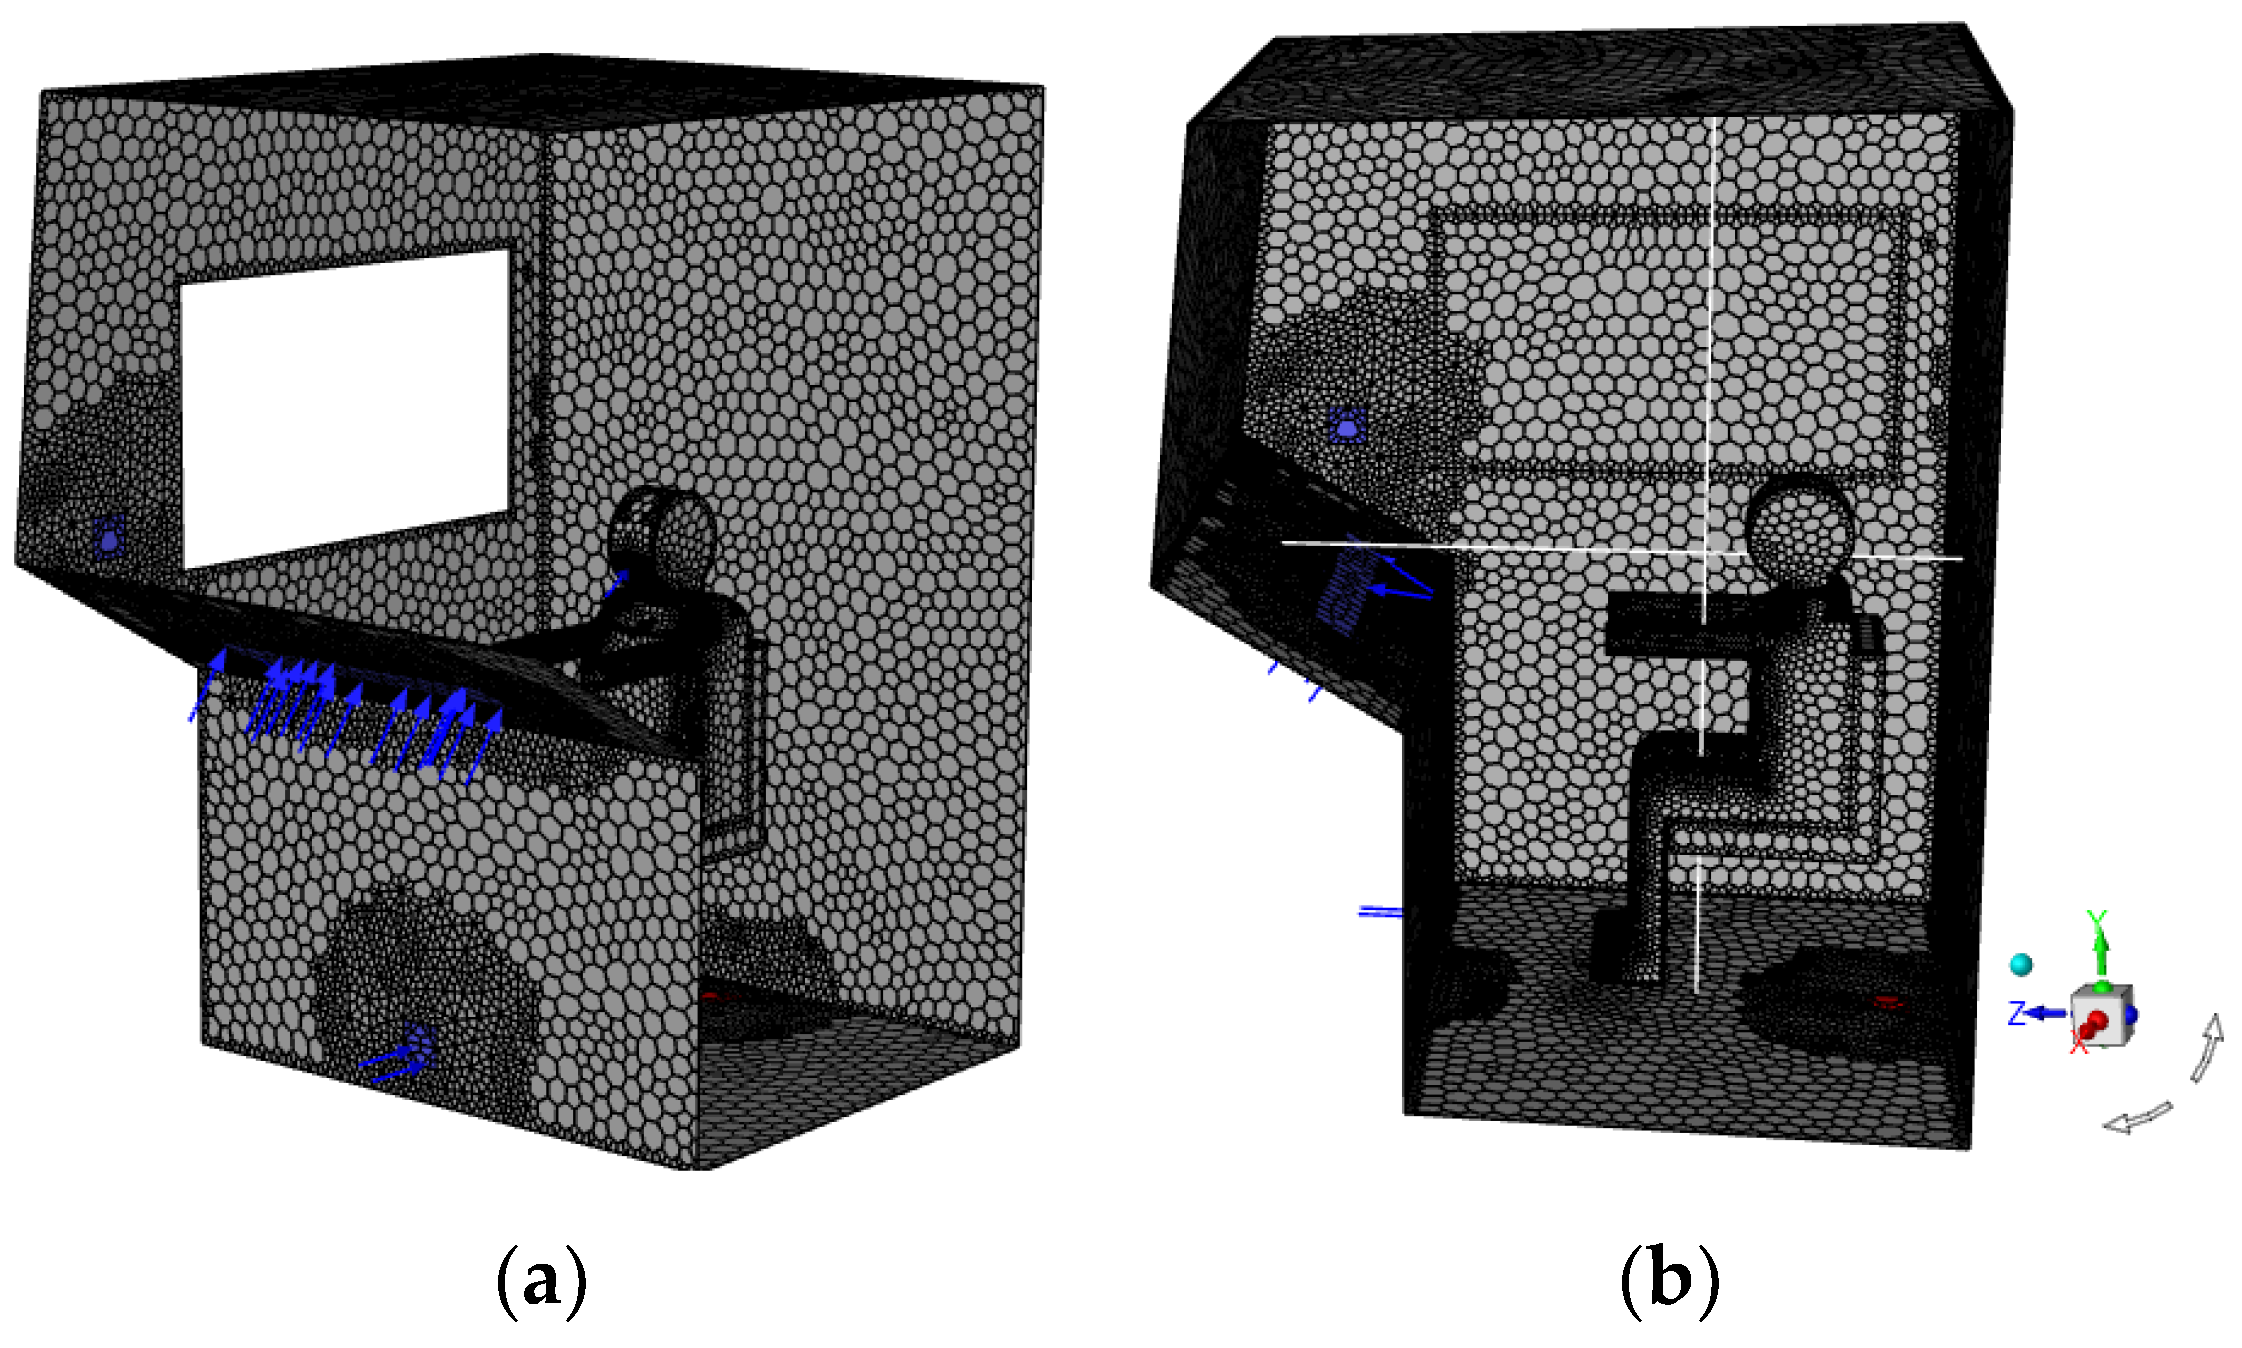
Figure 5.
Temperature values versus time in summer mode.

Figure 6.
CO2 concentration values over time in summer mode.
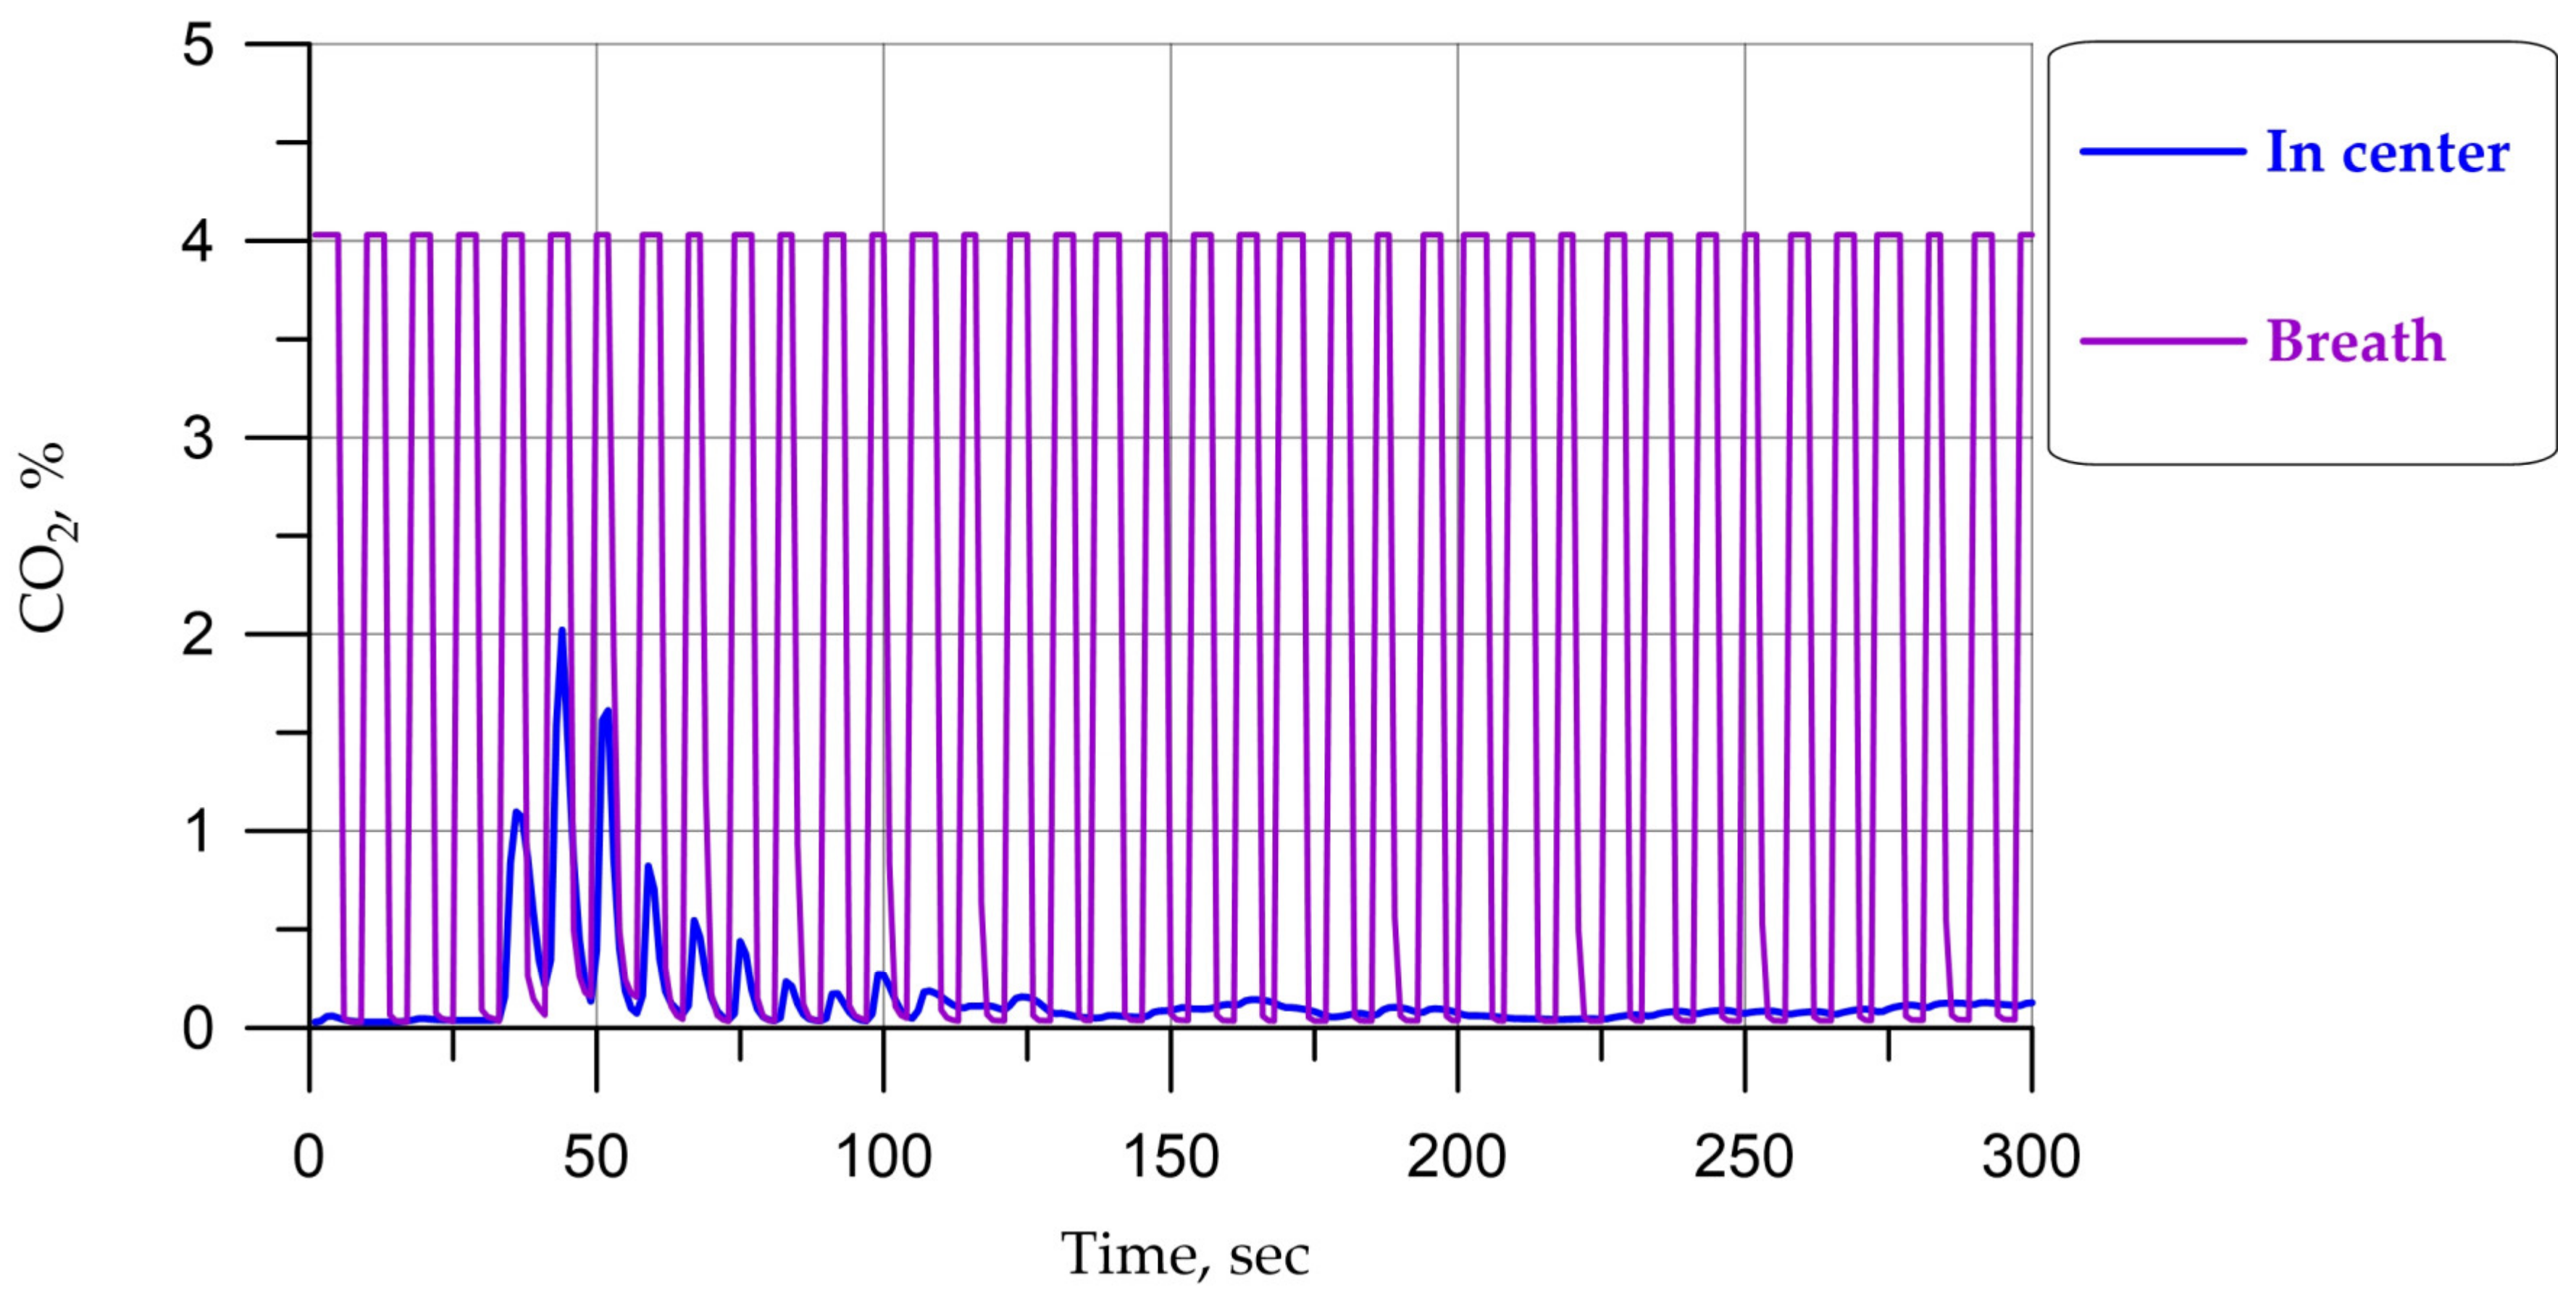
Figure 7.
CO2 concentration values over time in summer mode on the indicated surfaces.

Figure 8.
CO2 concentration values in the center over time in summer mode, as well as in recirculation mode.
Figure 8.
CO2 concentration values in the center over time in summer mode, as well as in recirculation mode.

Figure 9.
CO2 concentration values over time in summer mode on the indicated surfaces, as well as for recirculation mode.
Figure 9.
CO2 concentration values over time in summer mode on the indicated surfaces, as well as for recirculation mode.
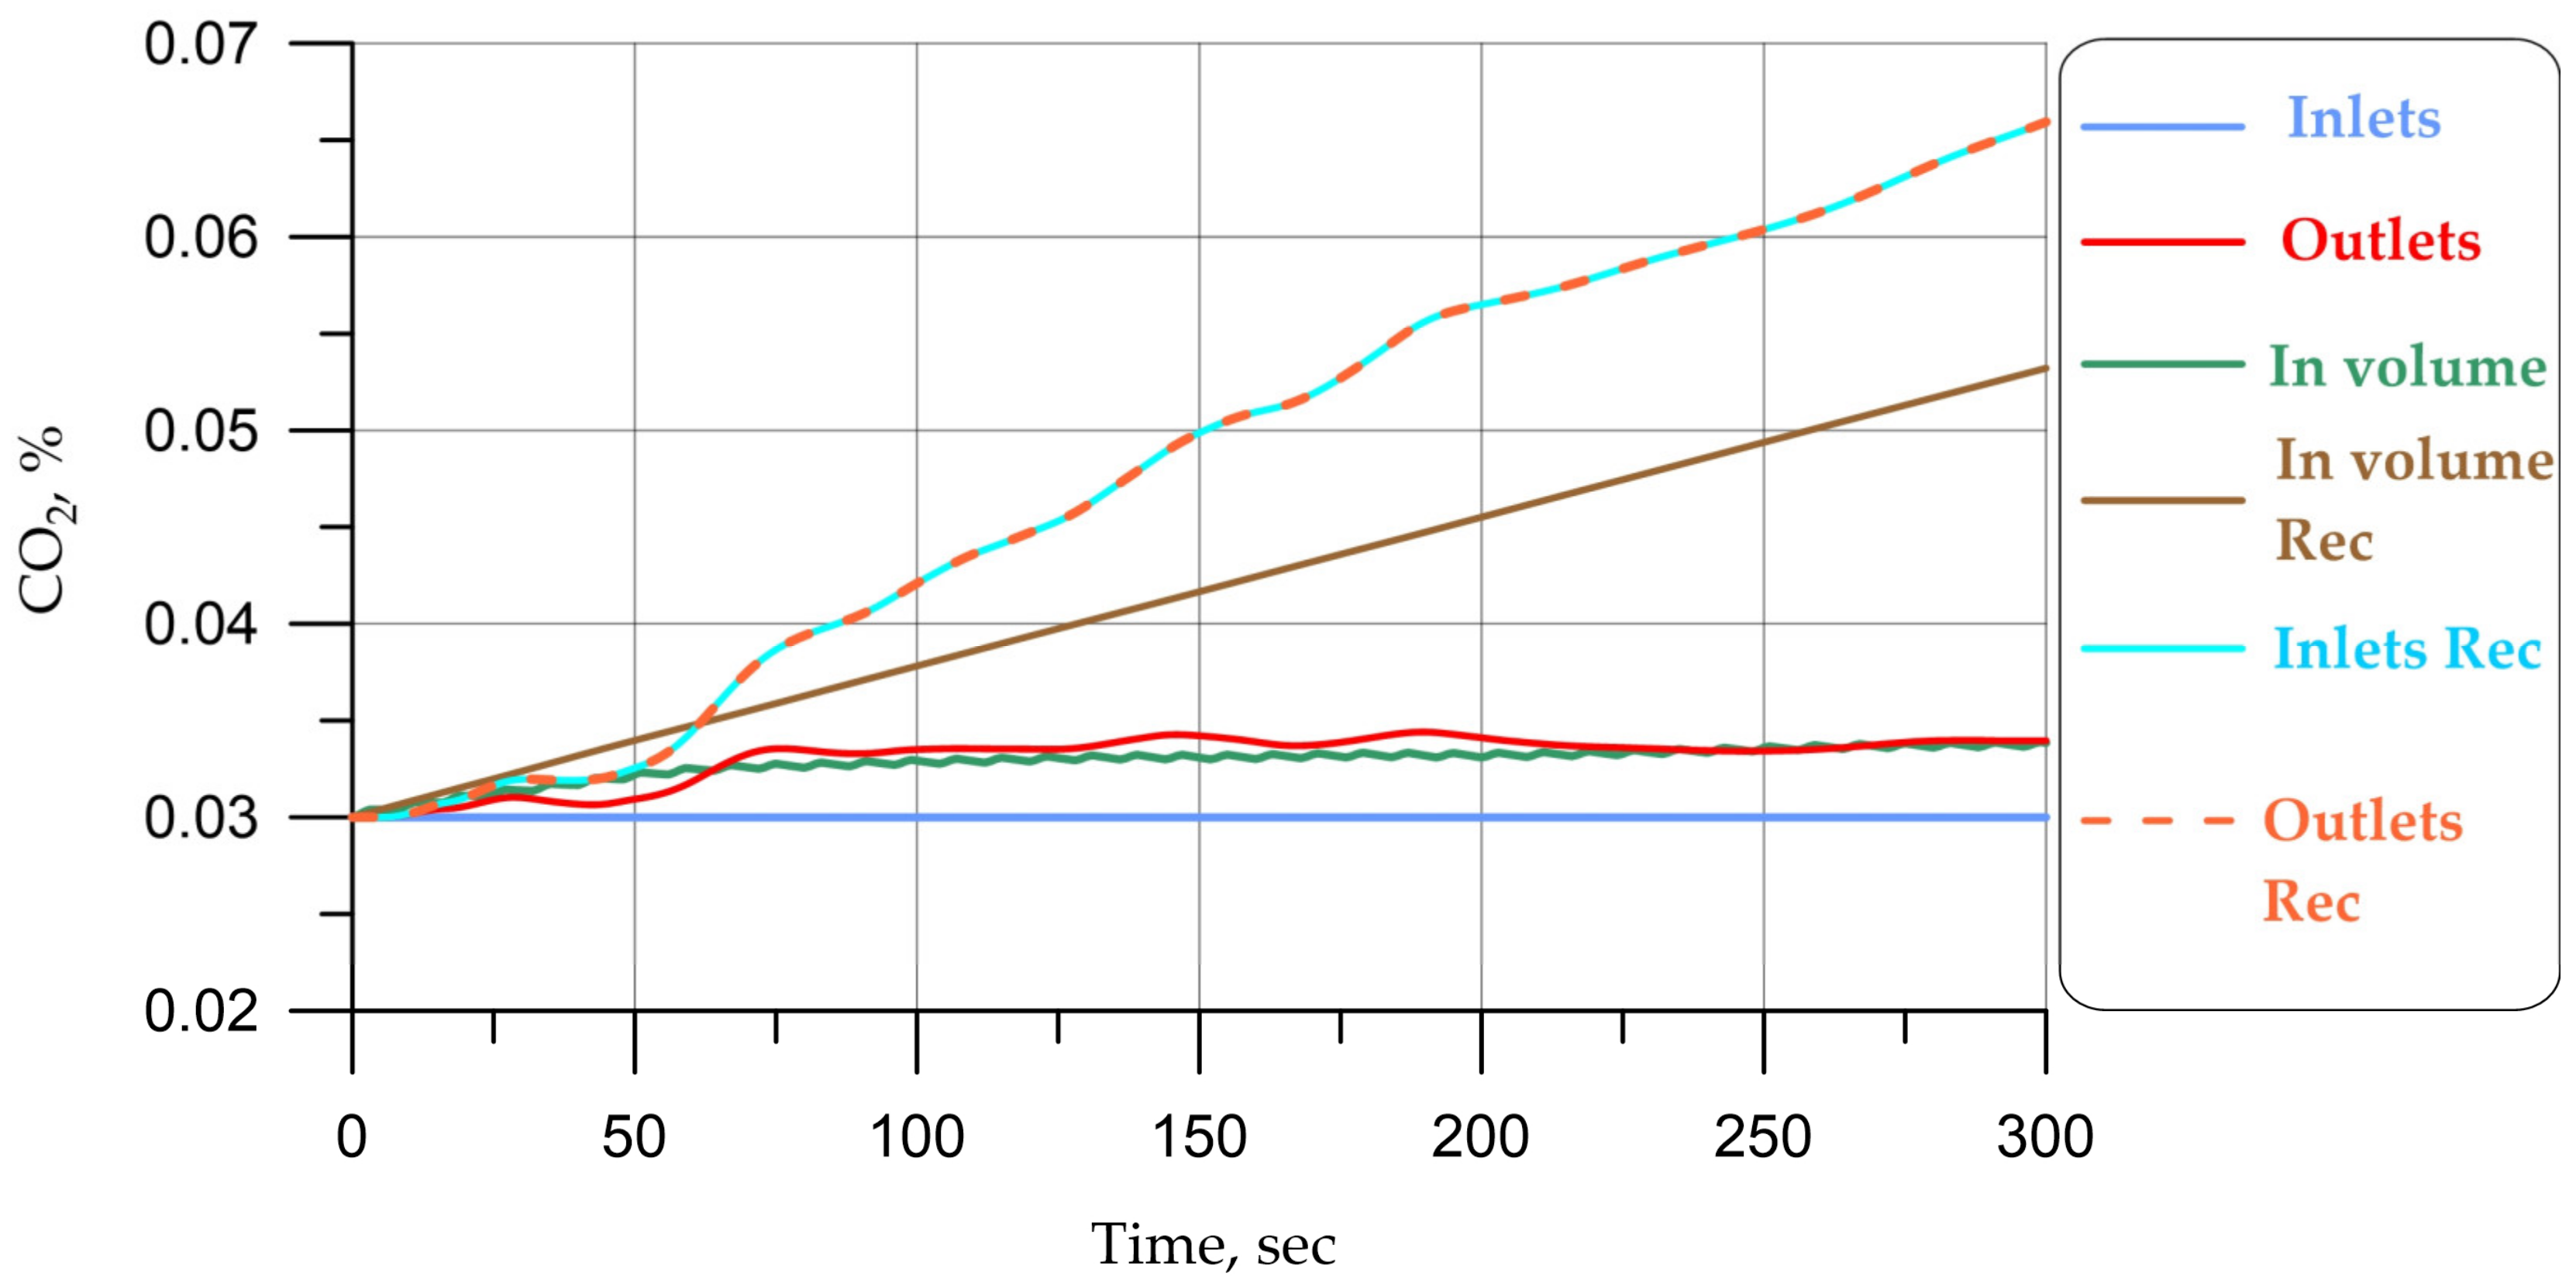
Figure 10.
Temperature values over time in winter mode.

Figure 11.
CO2 concentration values over time in winter mode.
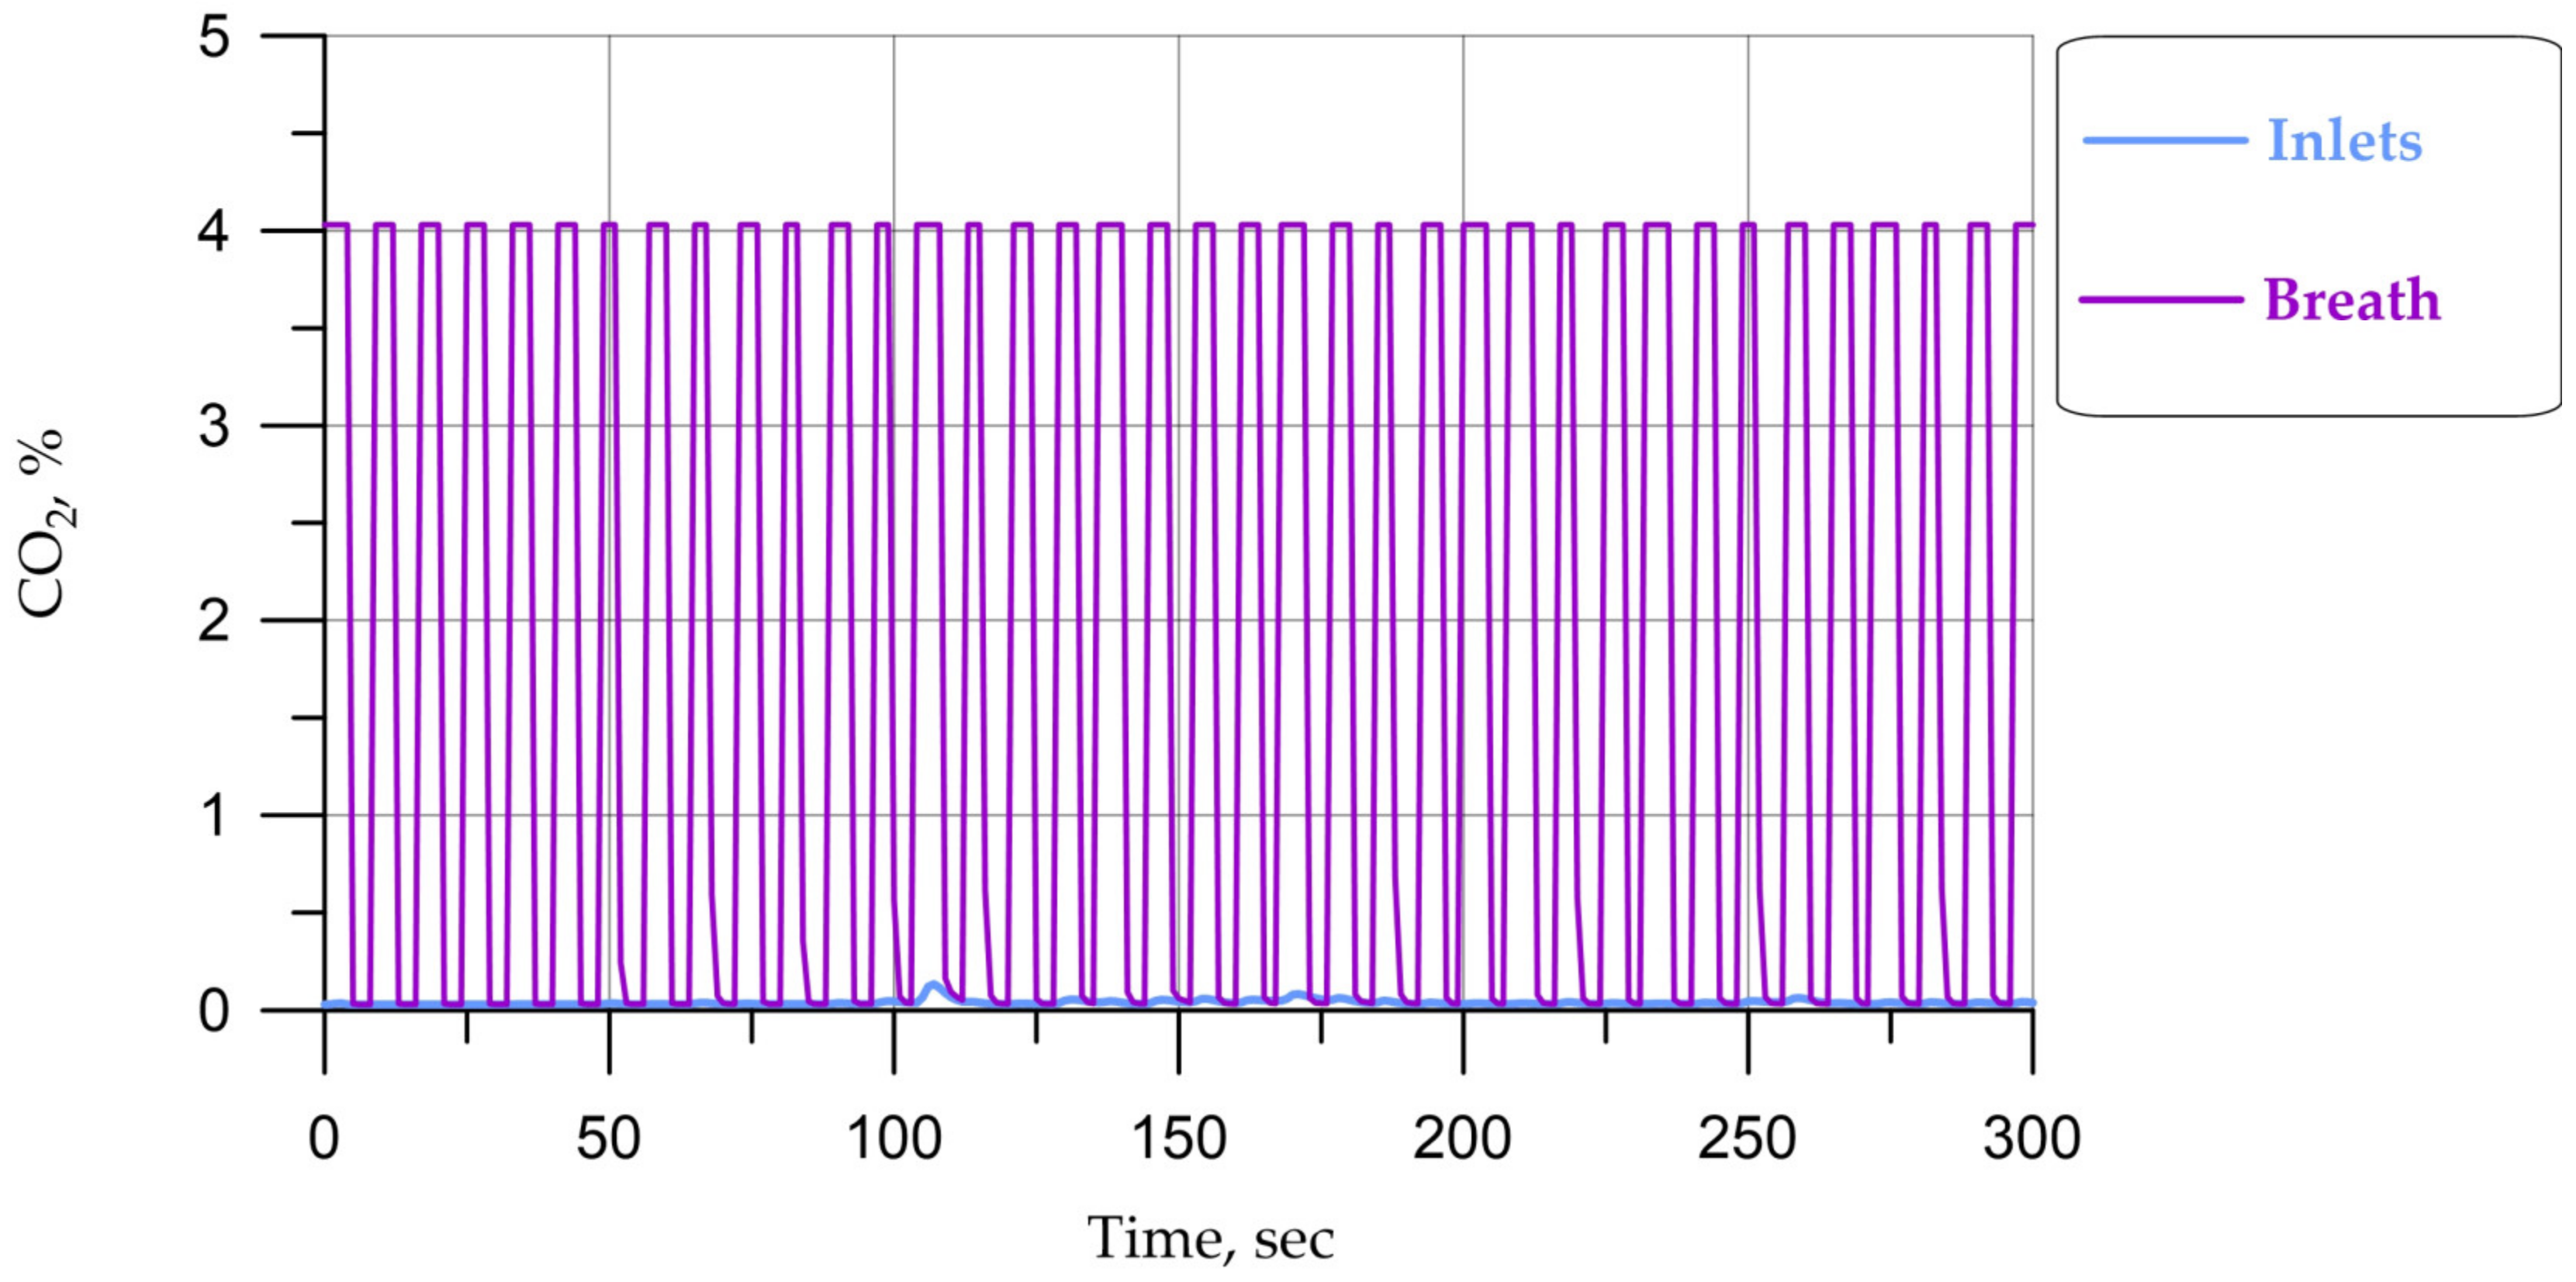
Figure 12.
CO2 concentration values over time in winter mode on the indicated surfaces.
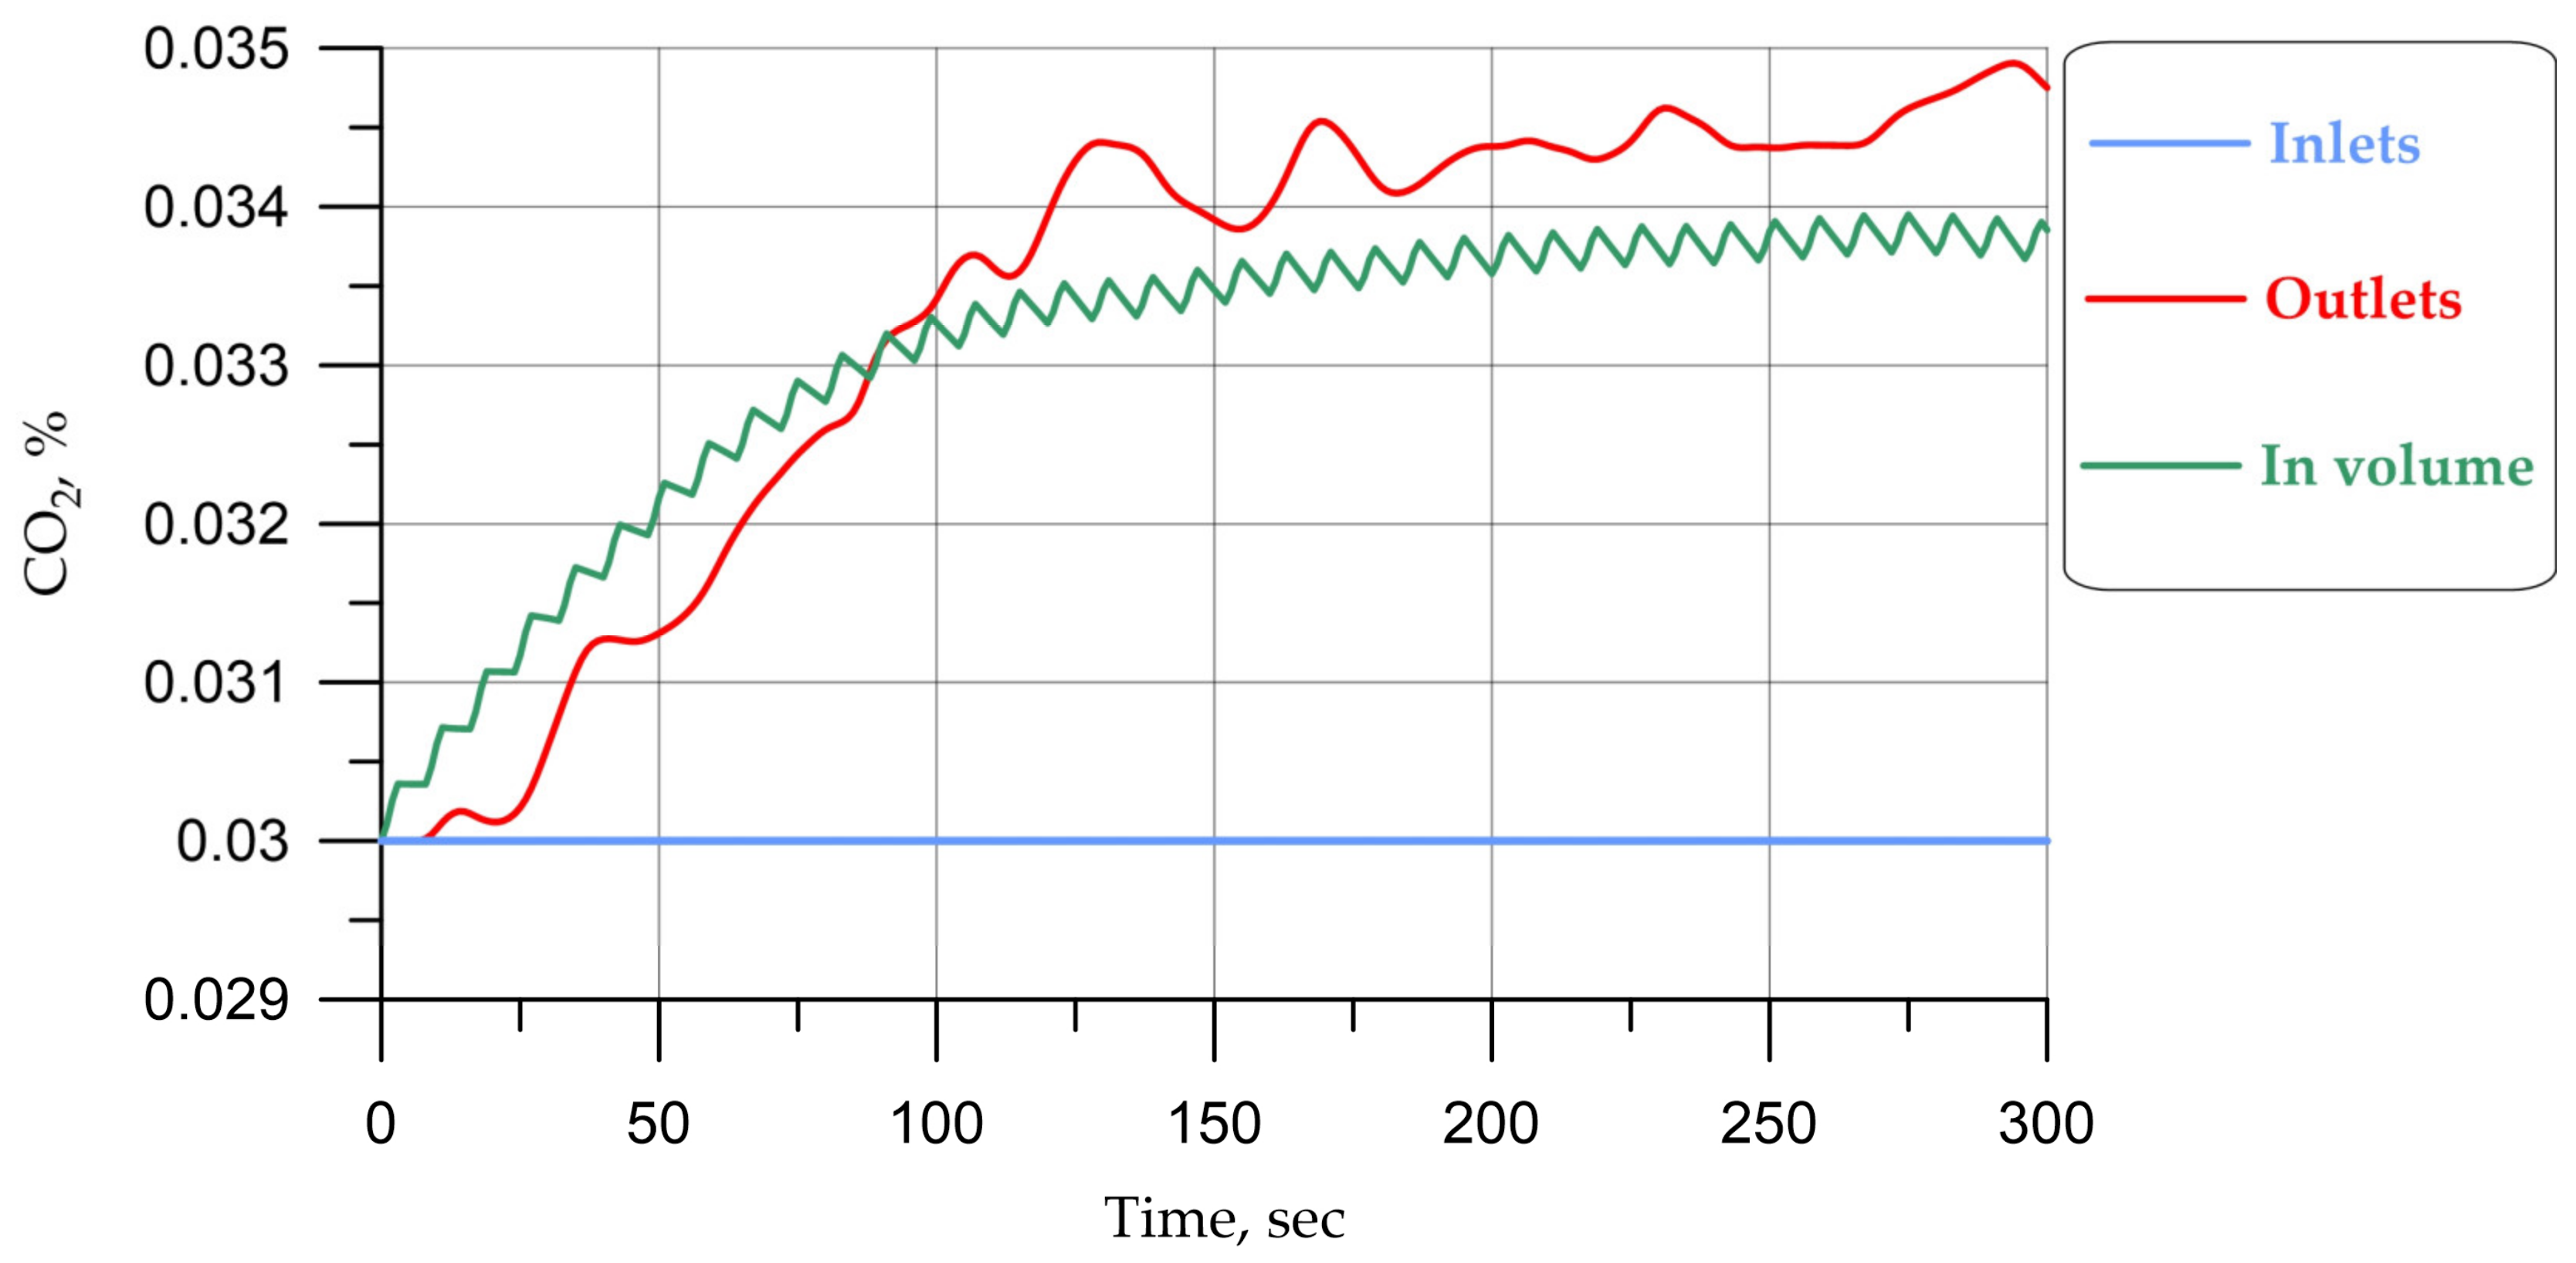
Figure 13.
Power of the climate system in circulation and recirculation mode.
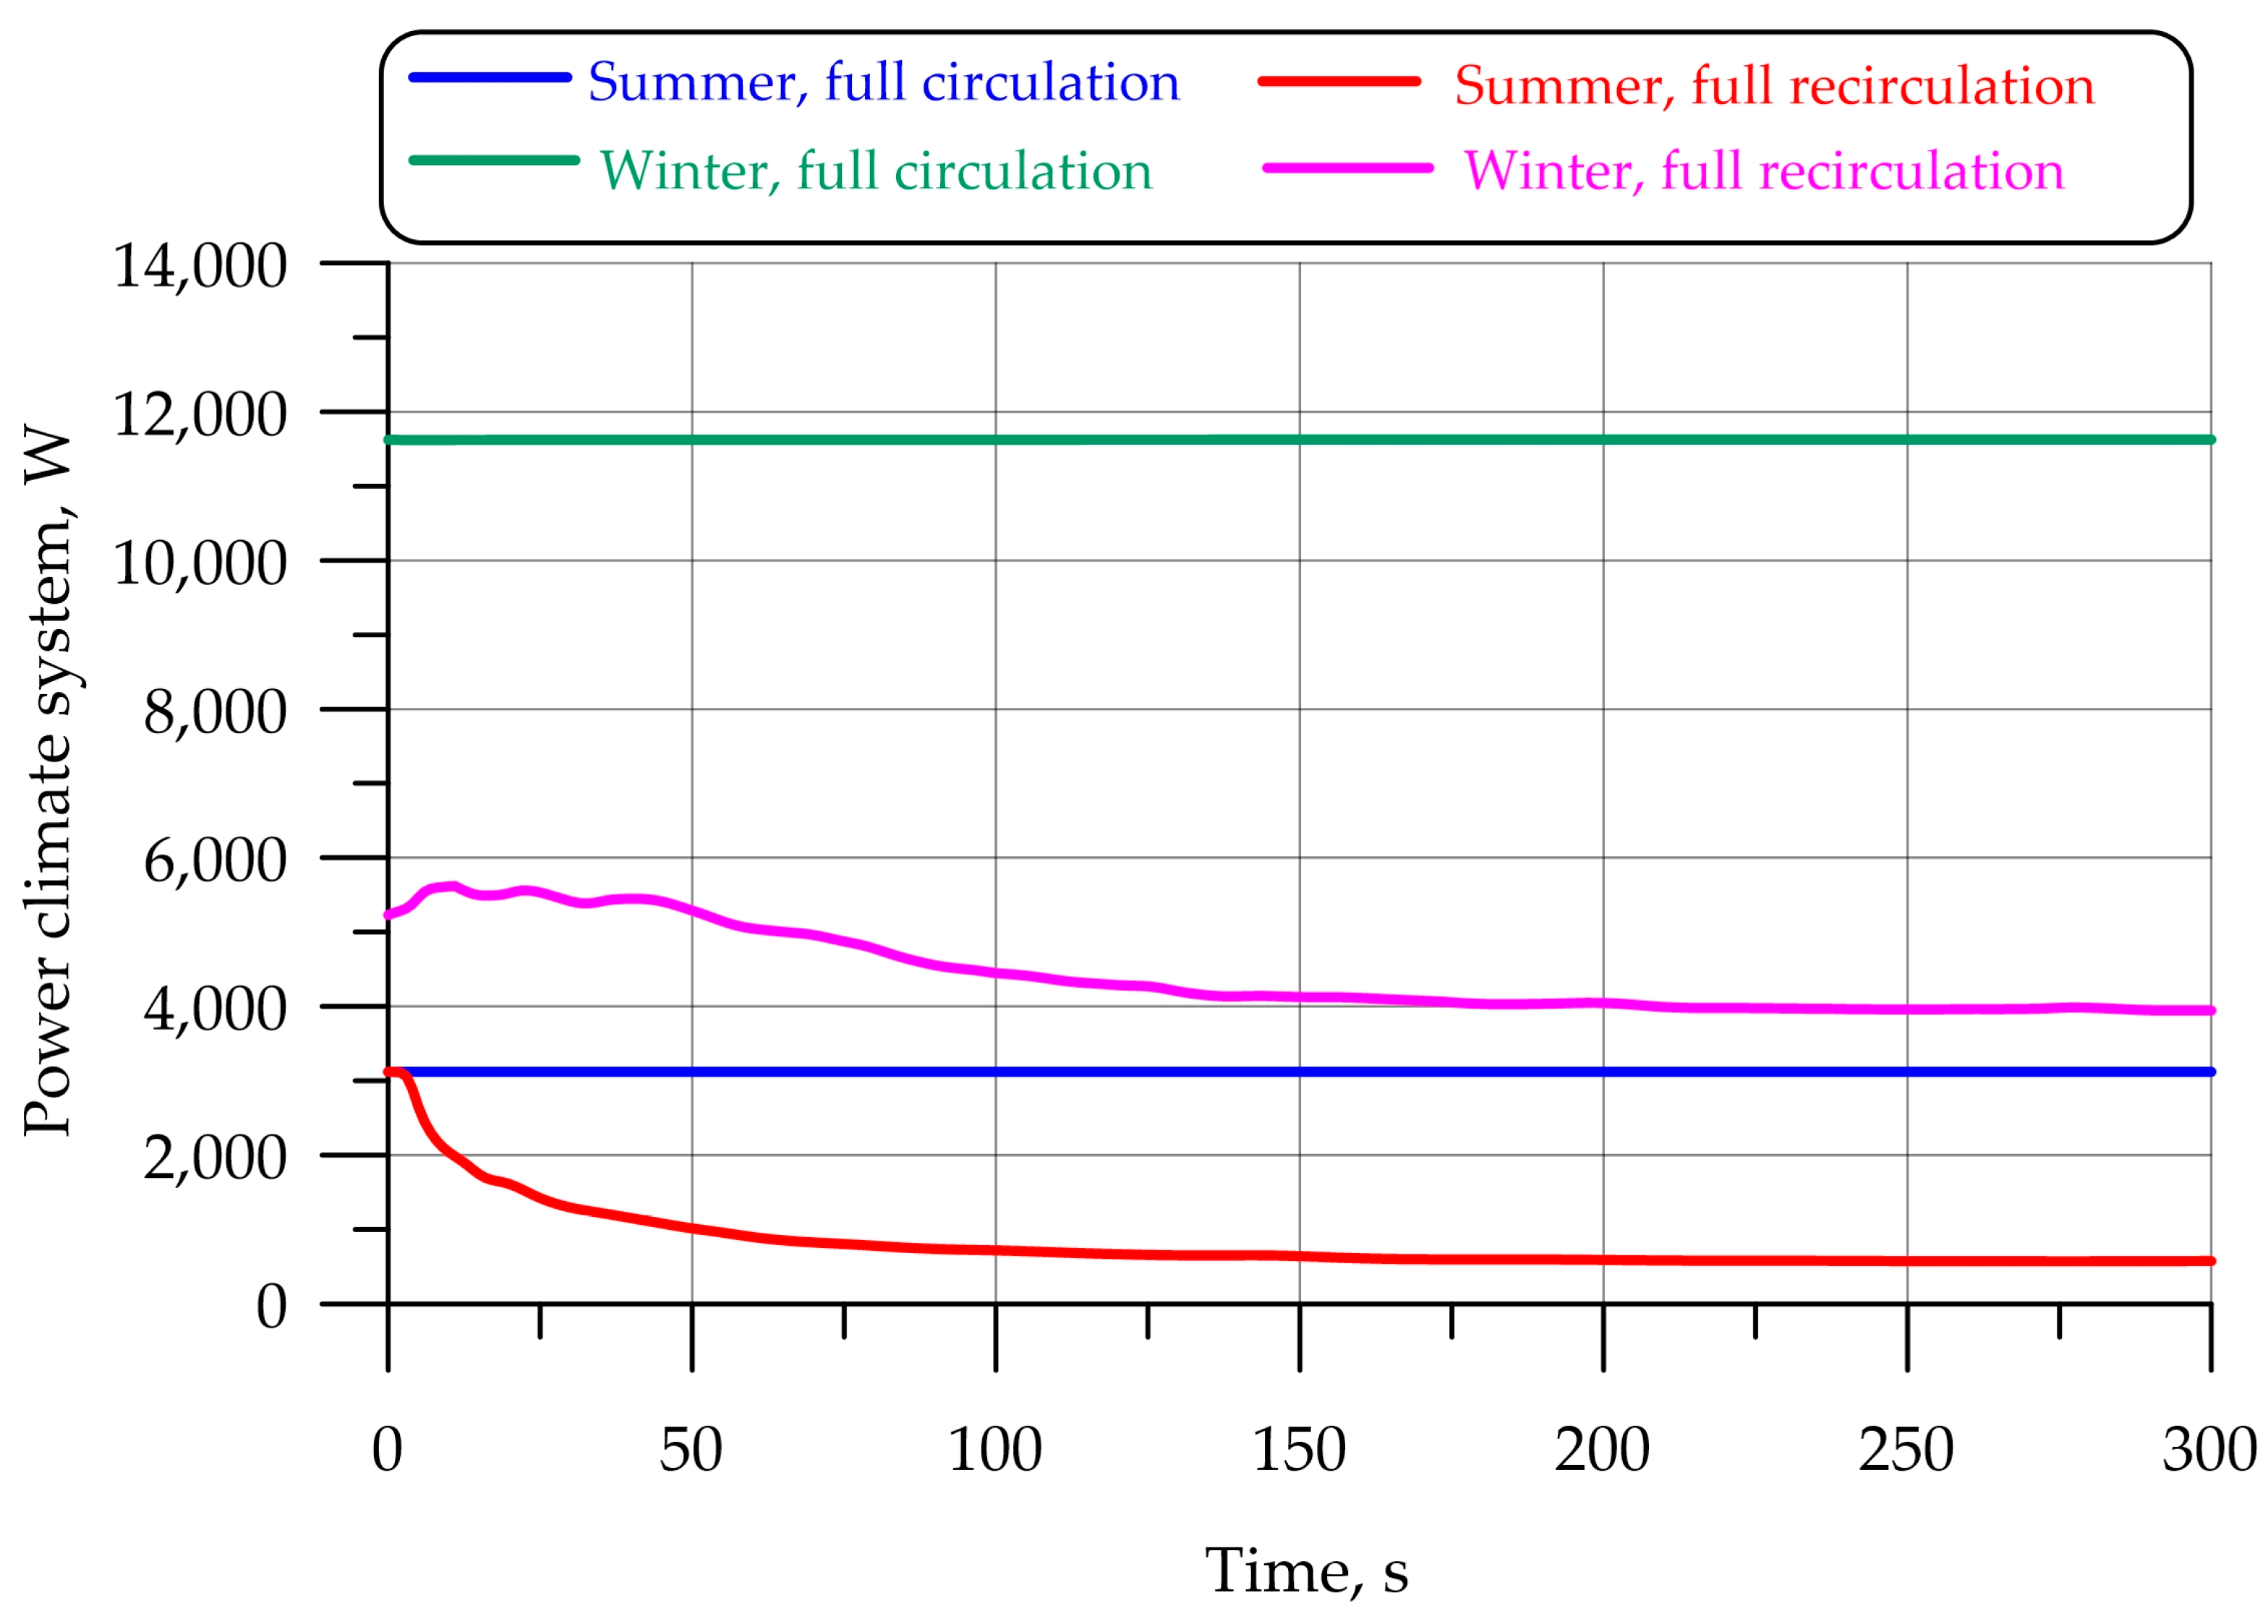
Figure 14.
Temperature, °C: (a) summer mode; (b) winter mode.
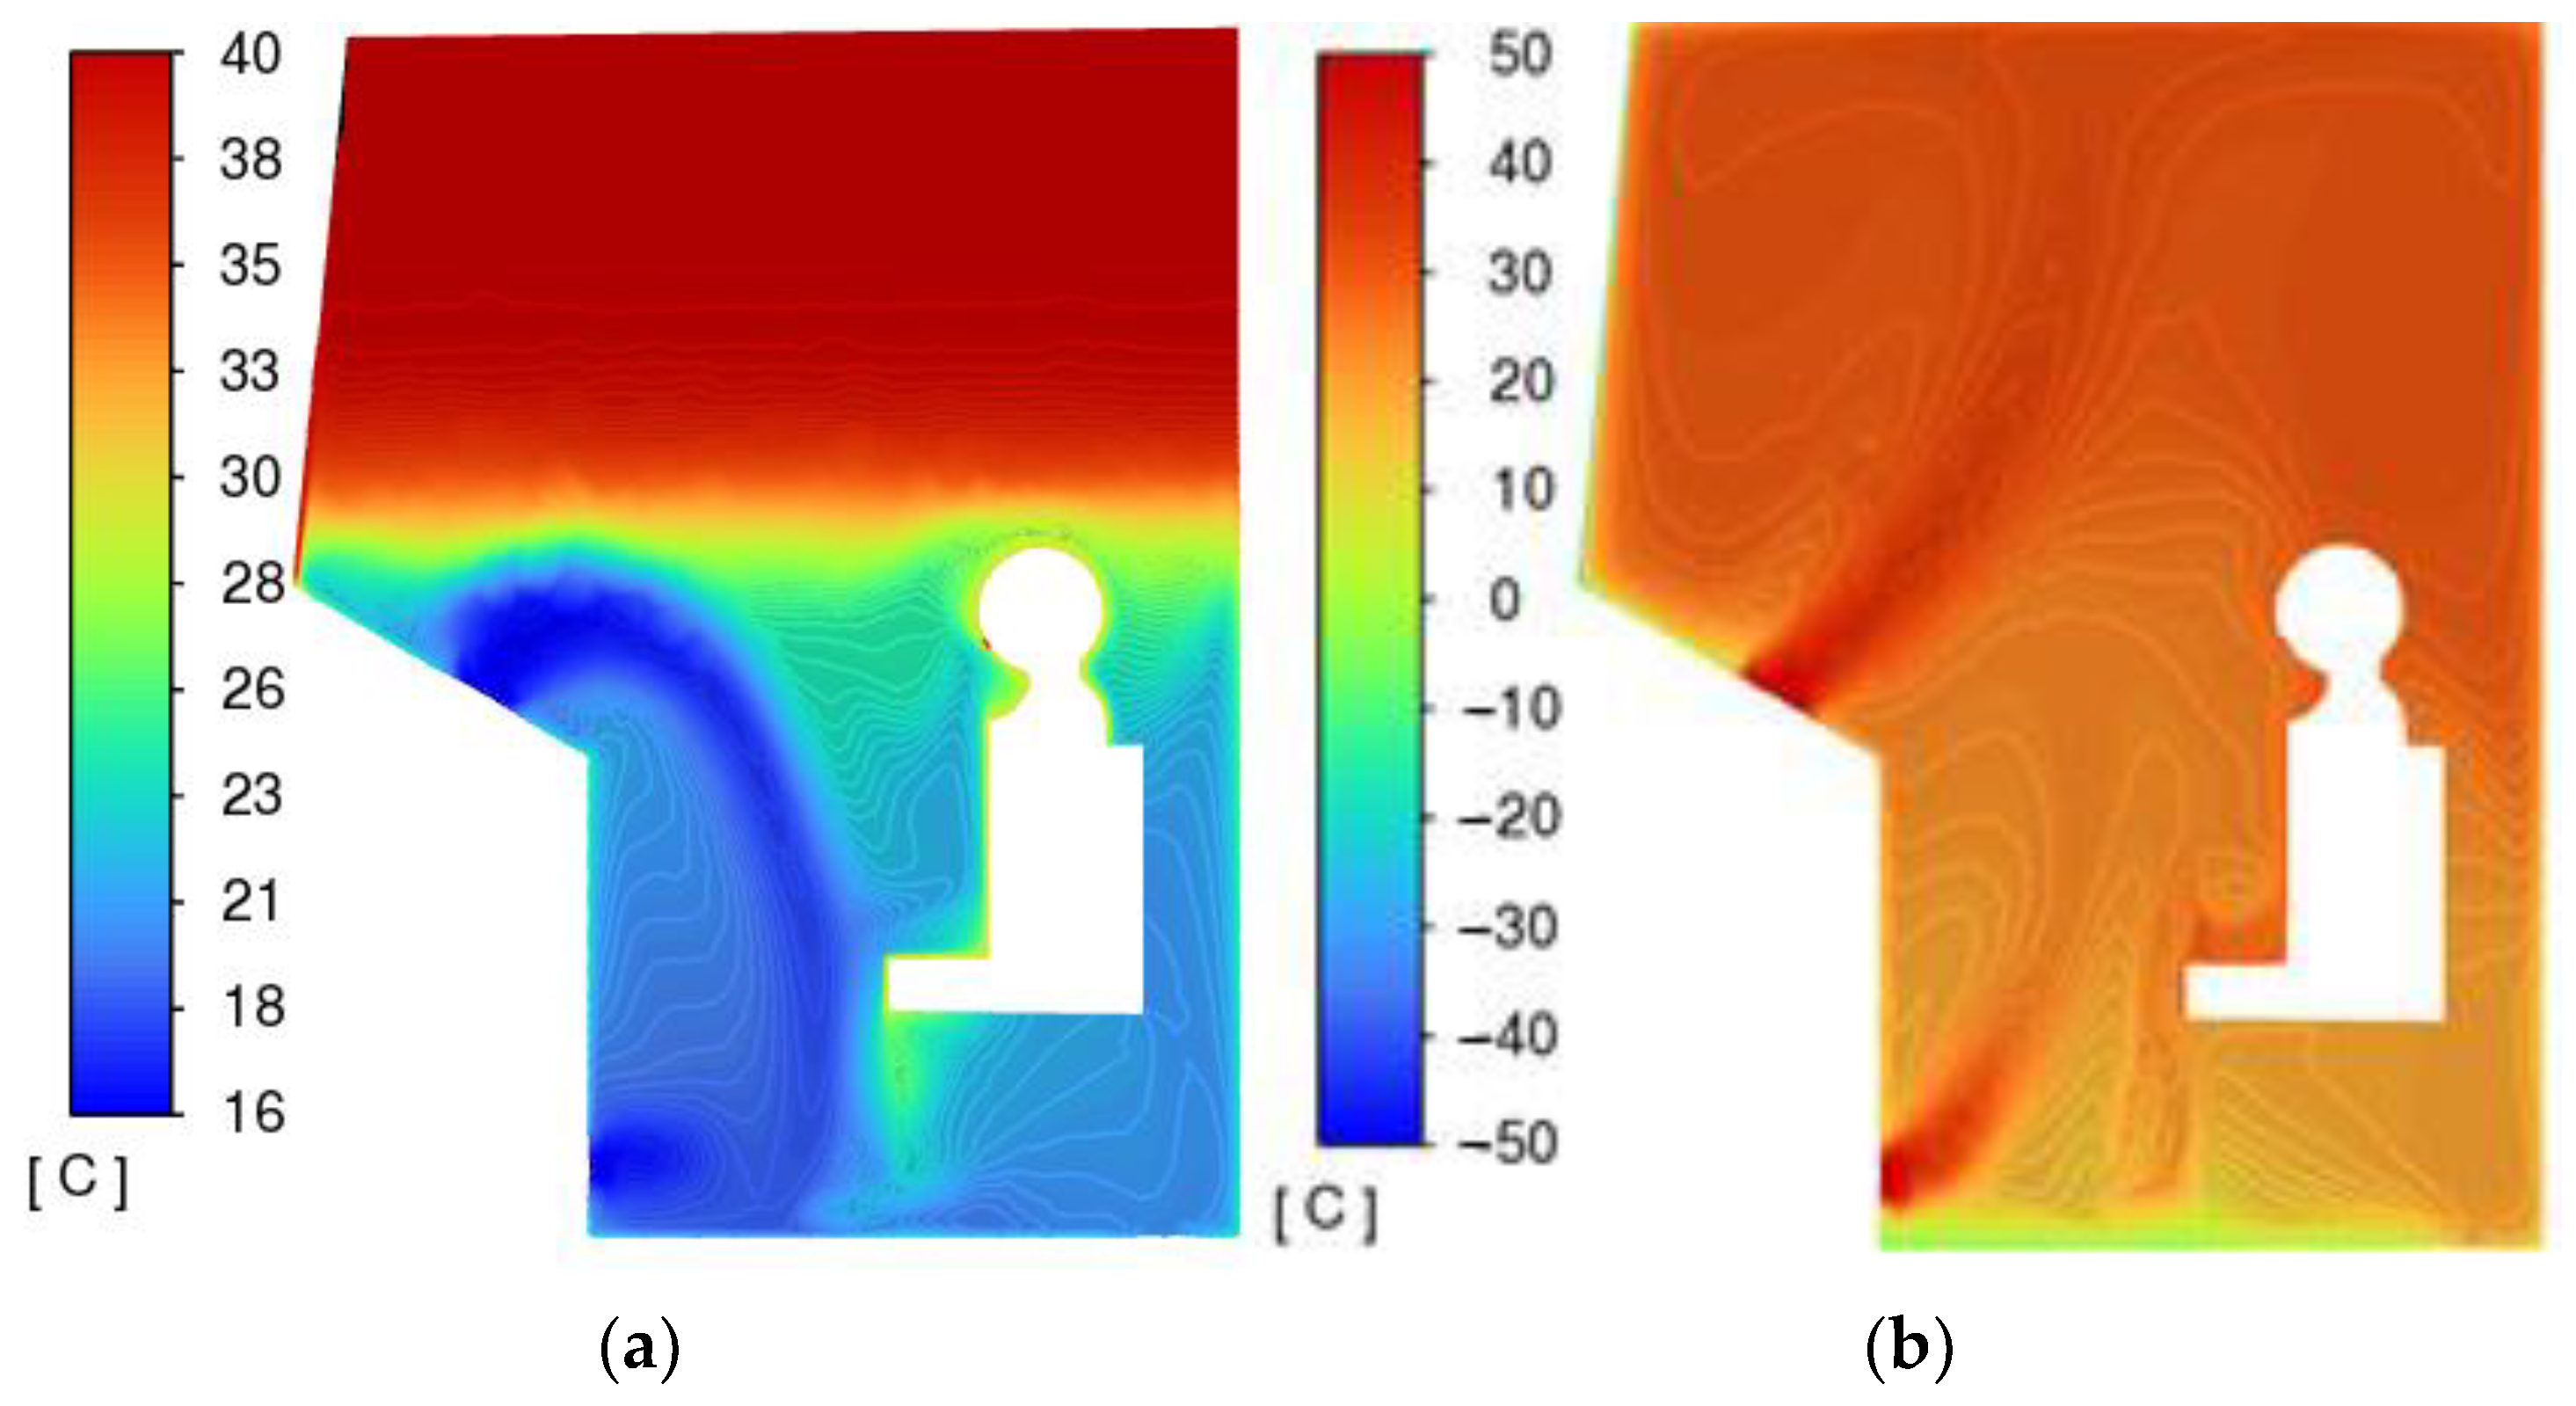
Figure 15.
Temperature on the same numerical scale, °C: (a) summer mode; (b) winter mode.
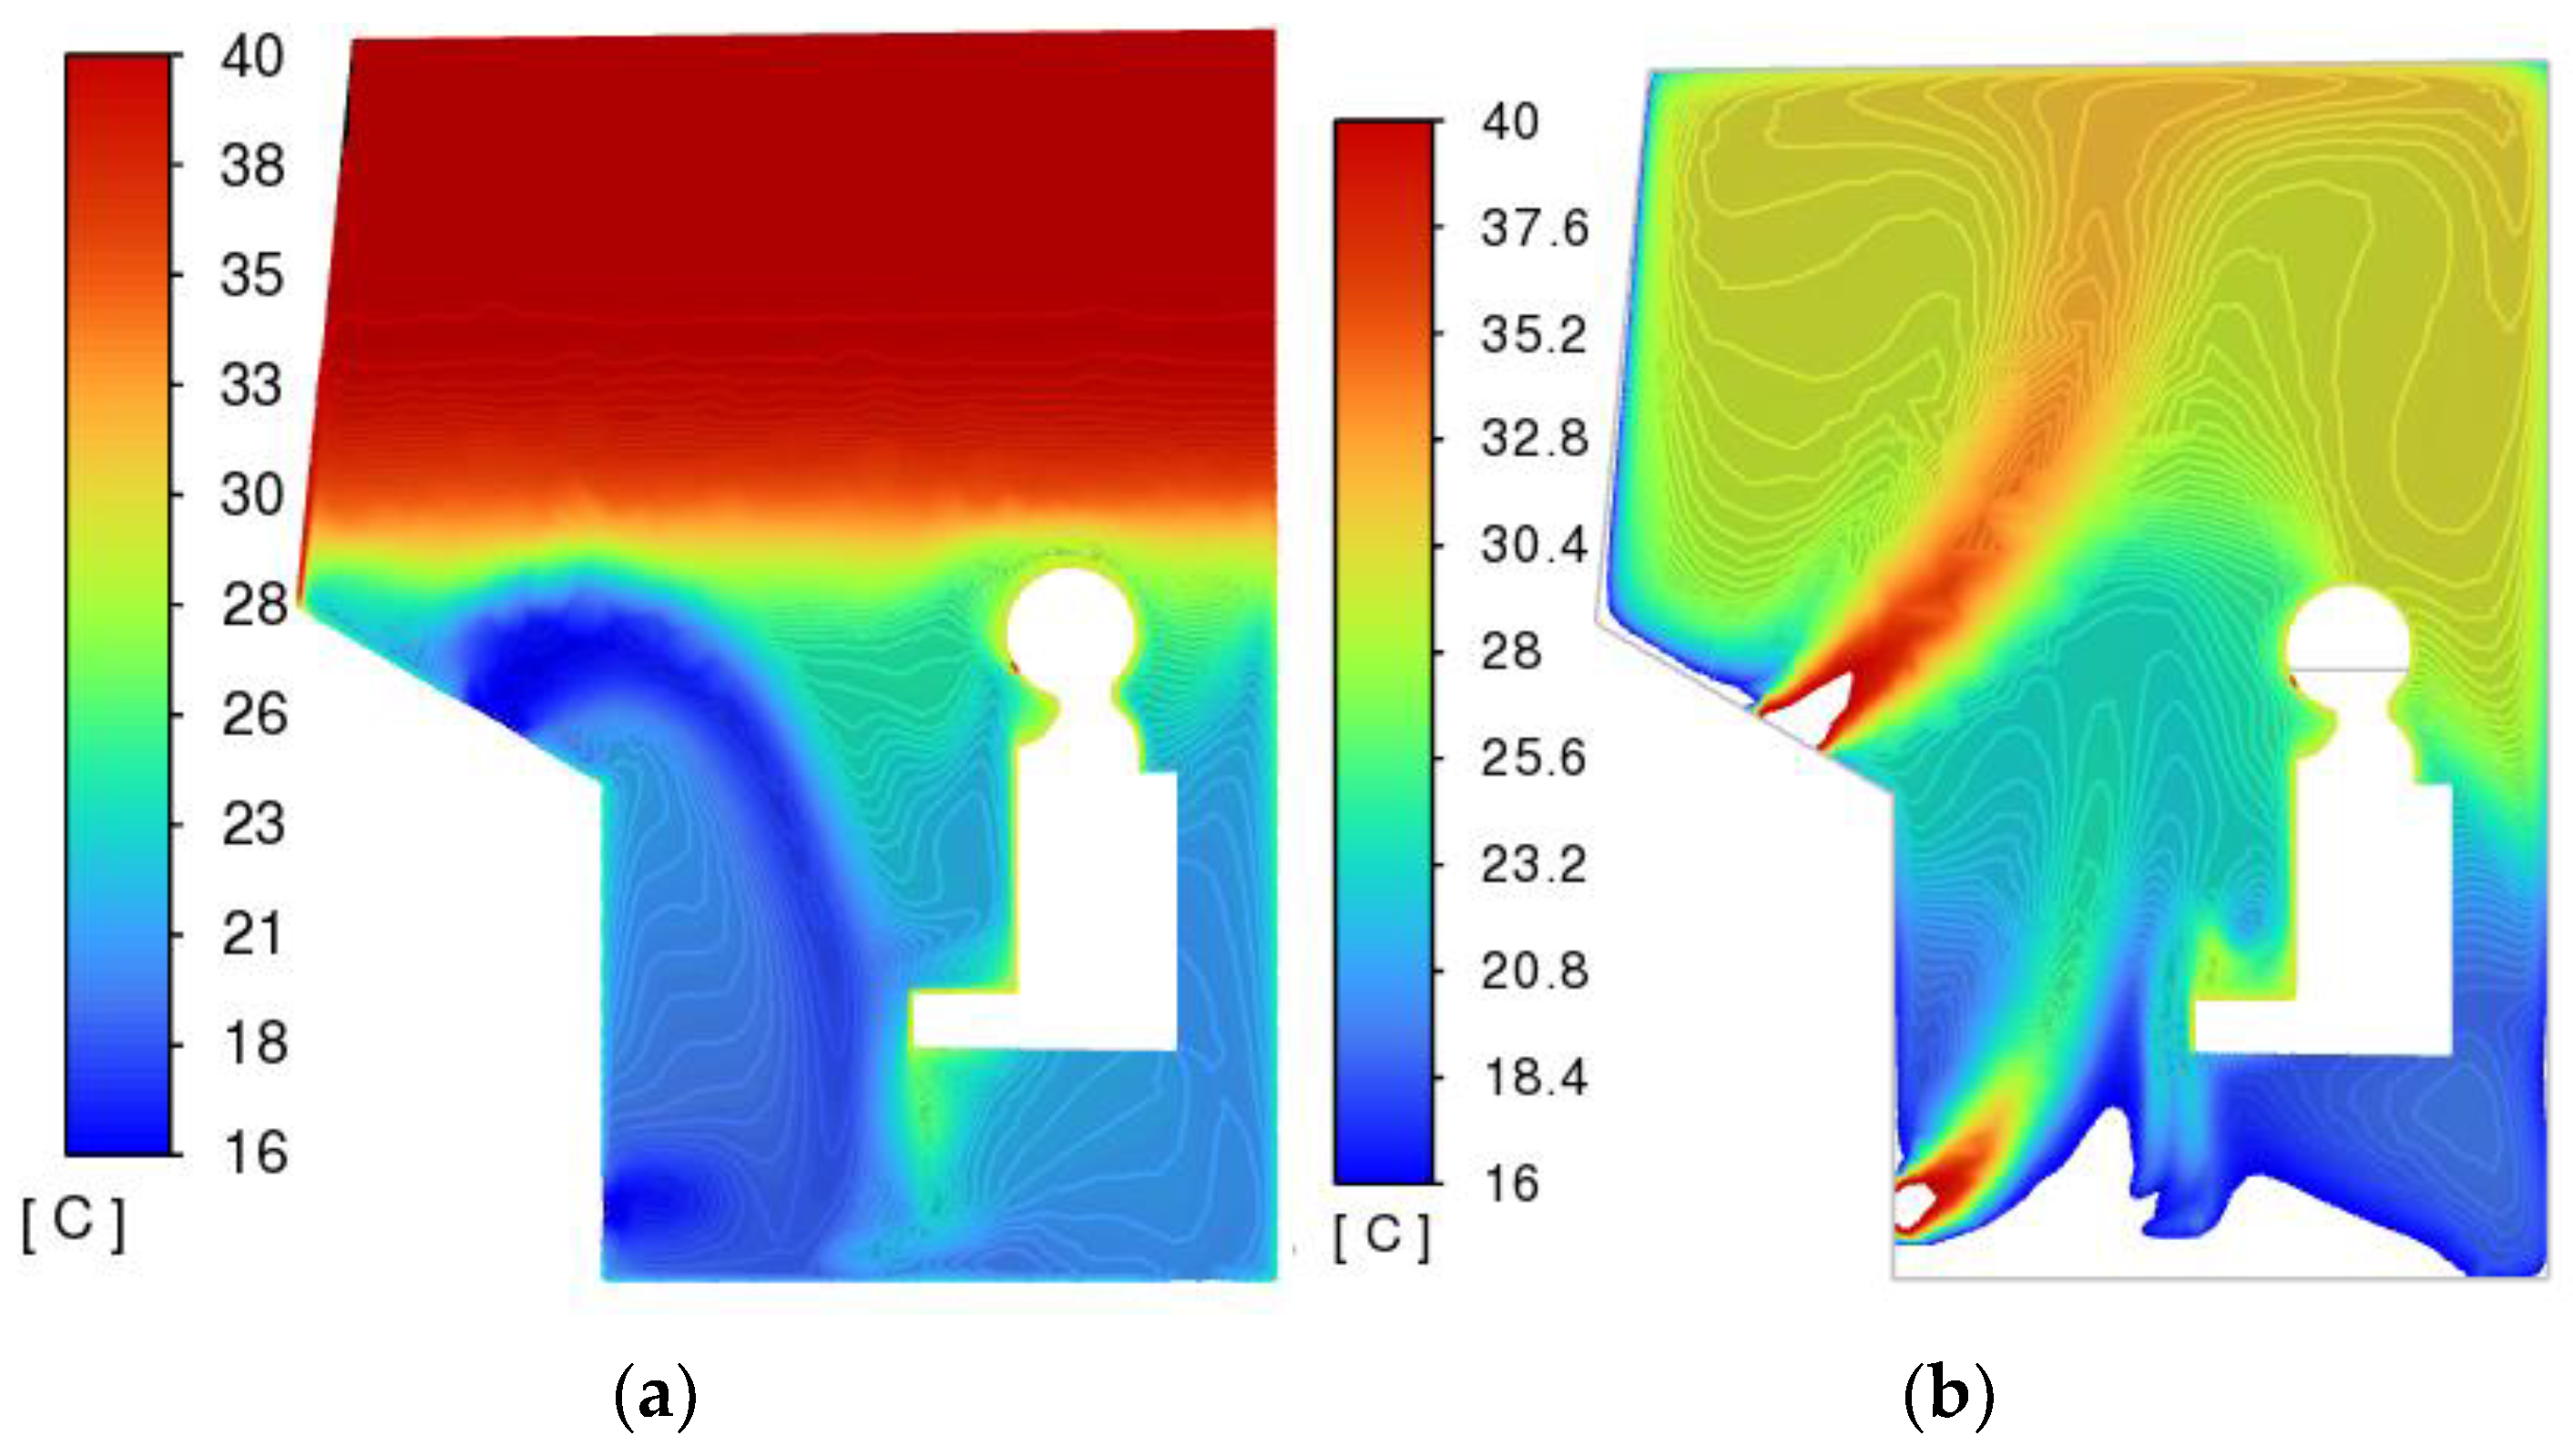
Figure 16.
Velocity field, m/s: (a)—summer mode; (b)—winter mode.

Figure 17.
Relative humidity, %: (a)—summer mode; (b)—winter mode.
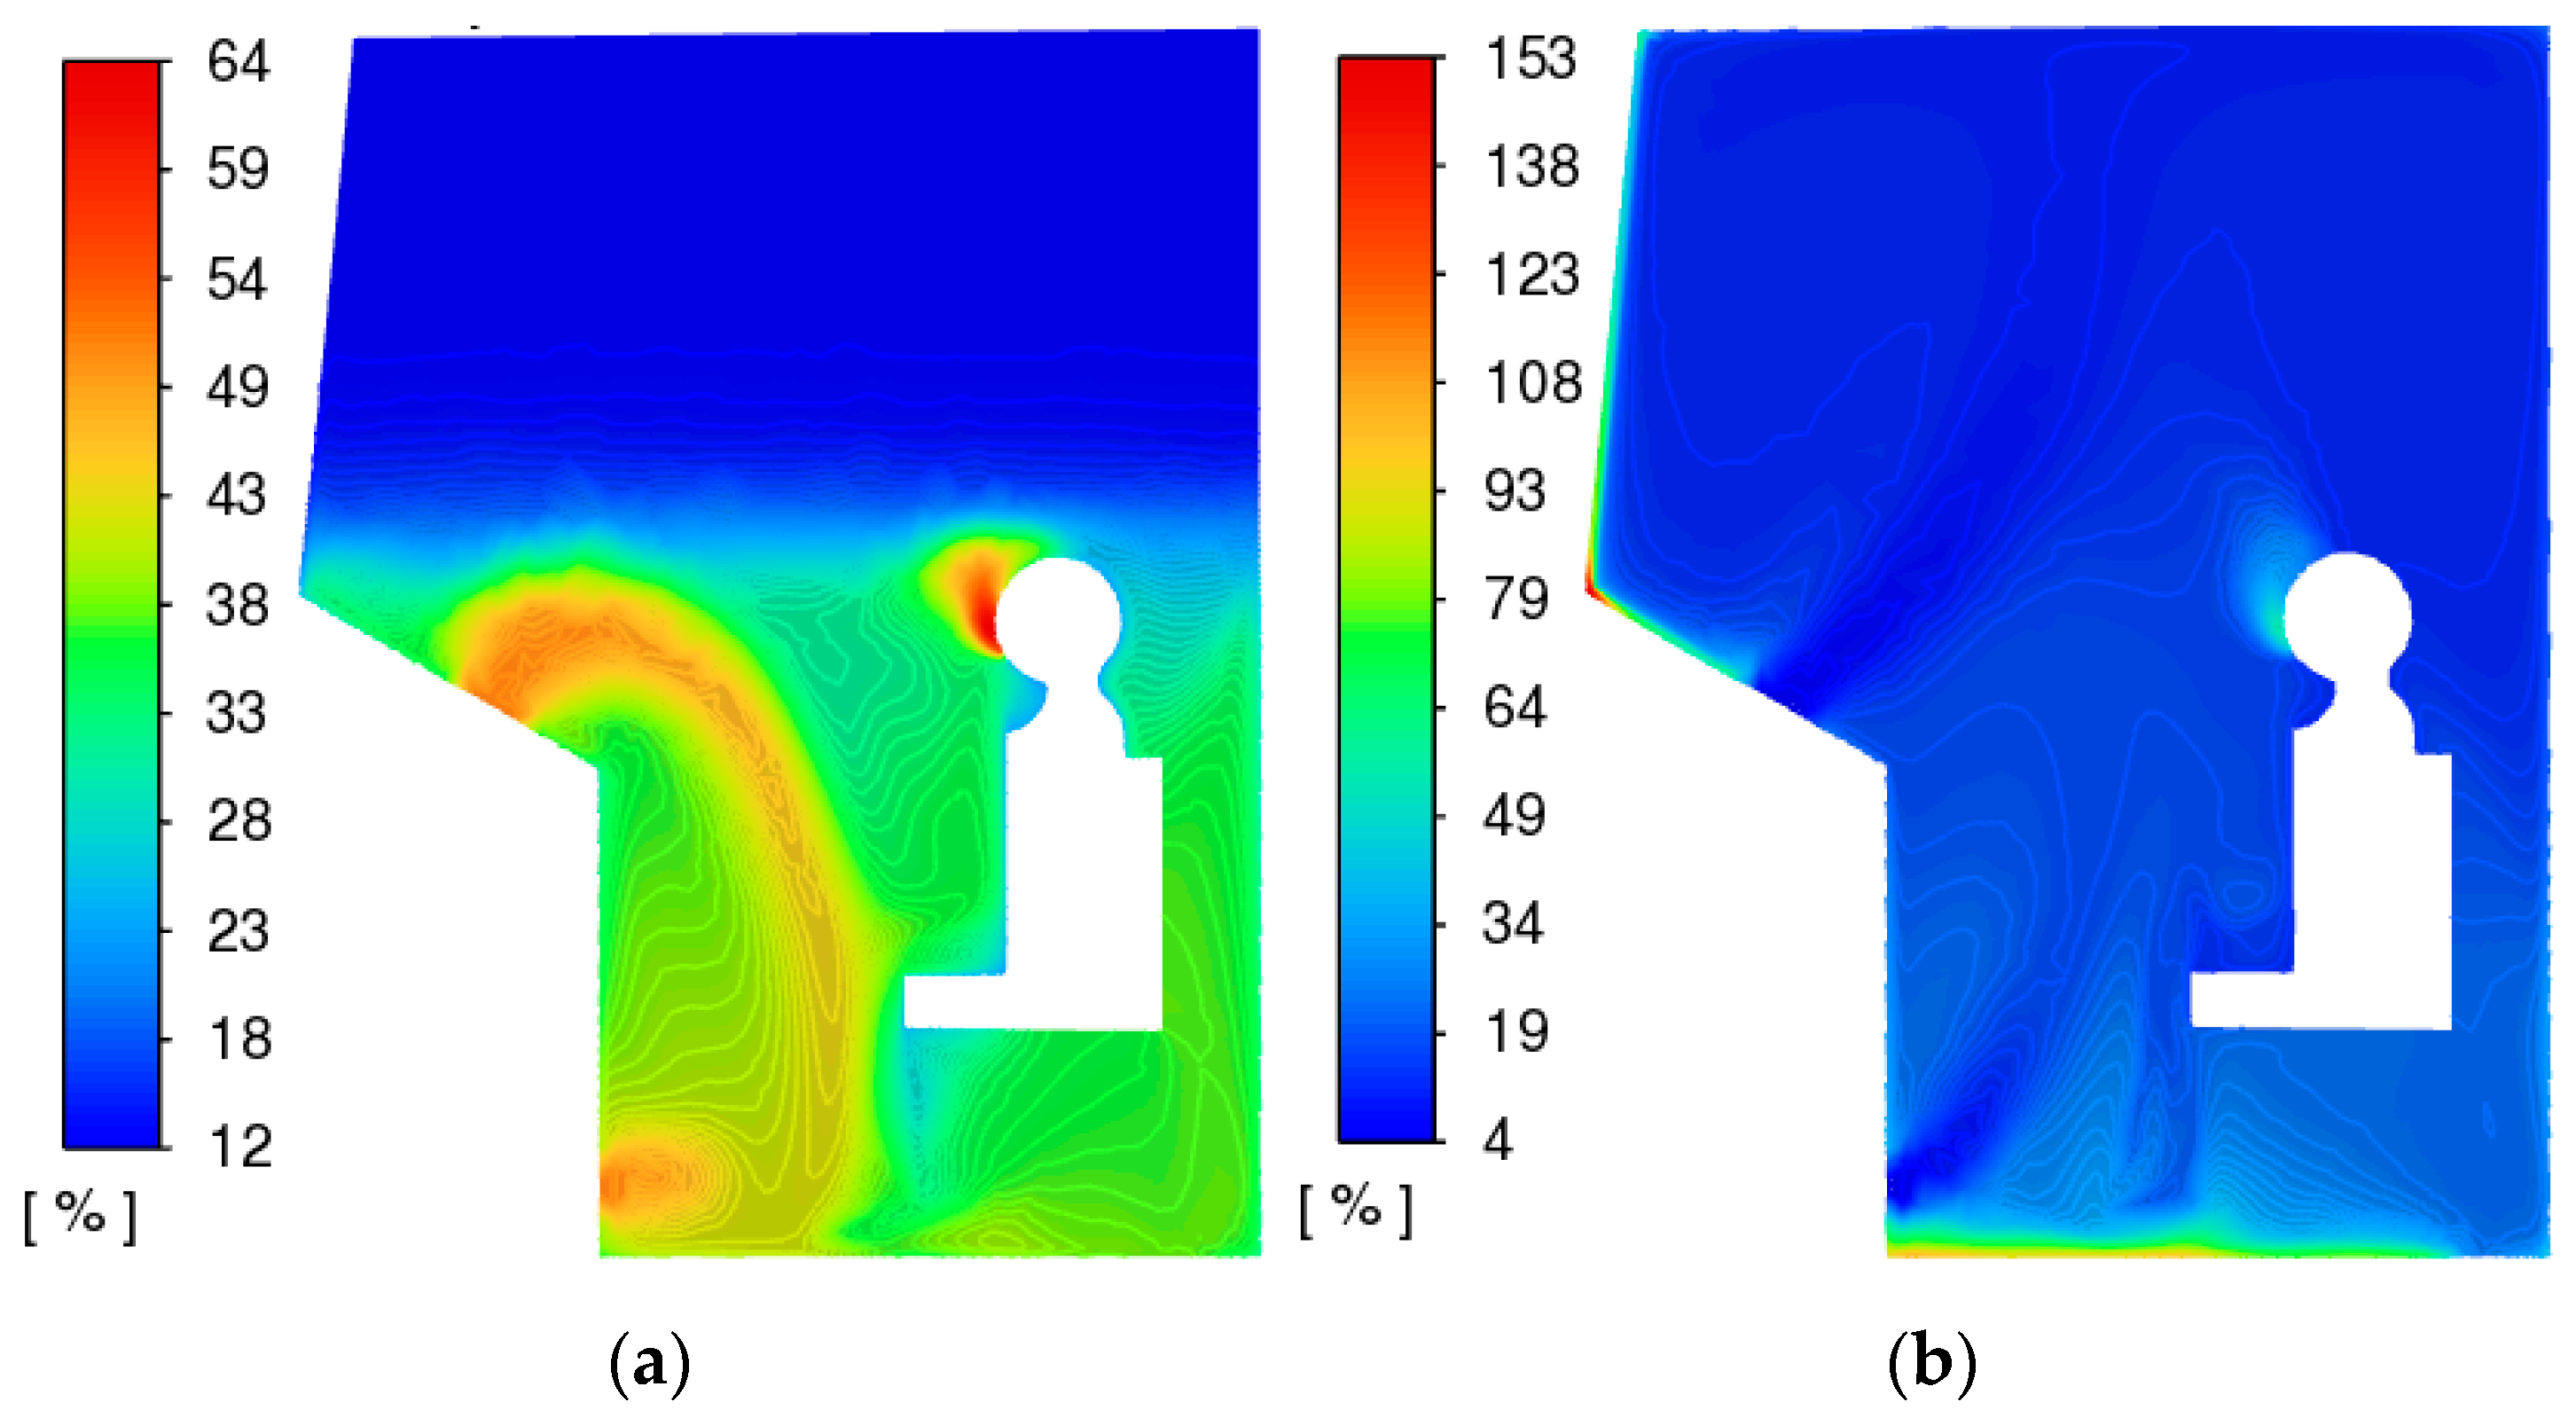
Figure 18.
Relative humidity on the same numerical scale, %: (a)—summer mode; (b)—winter mode.
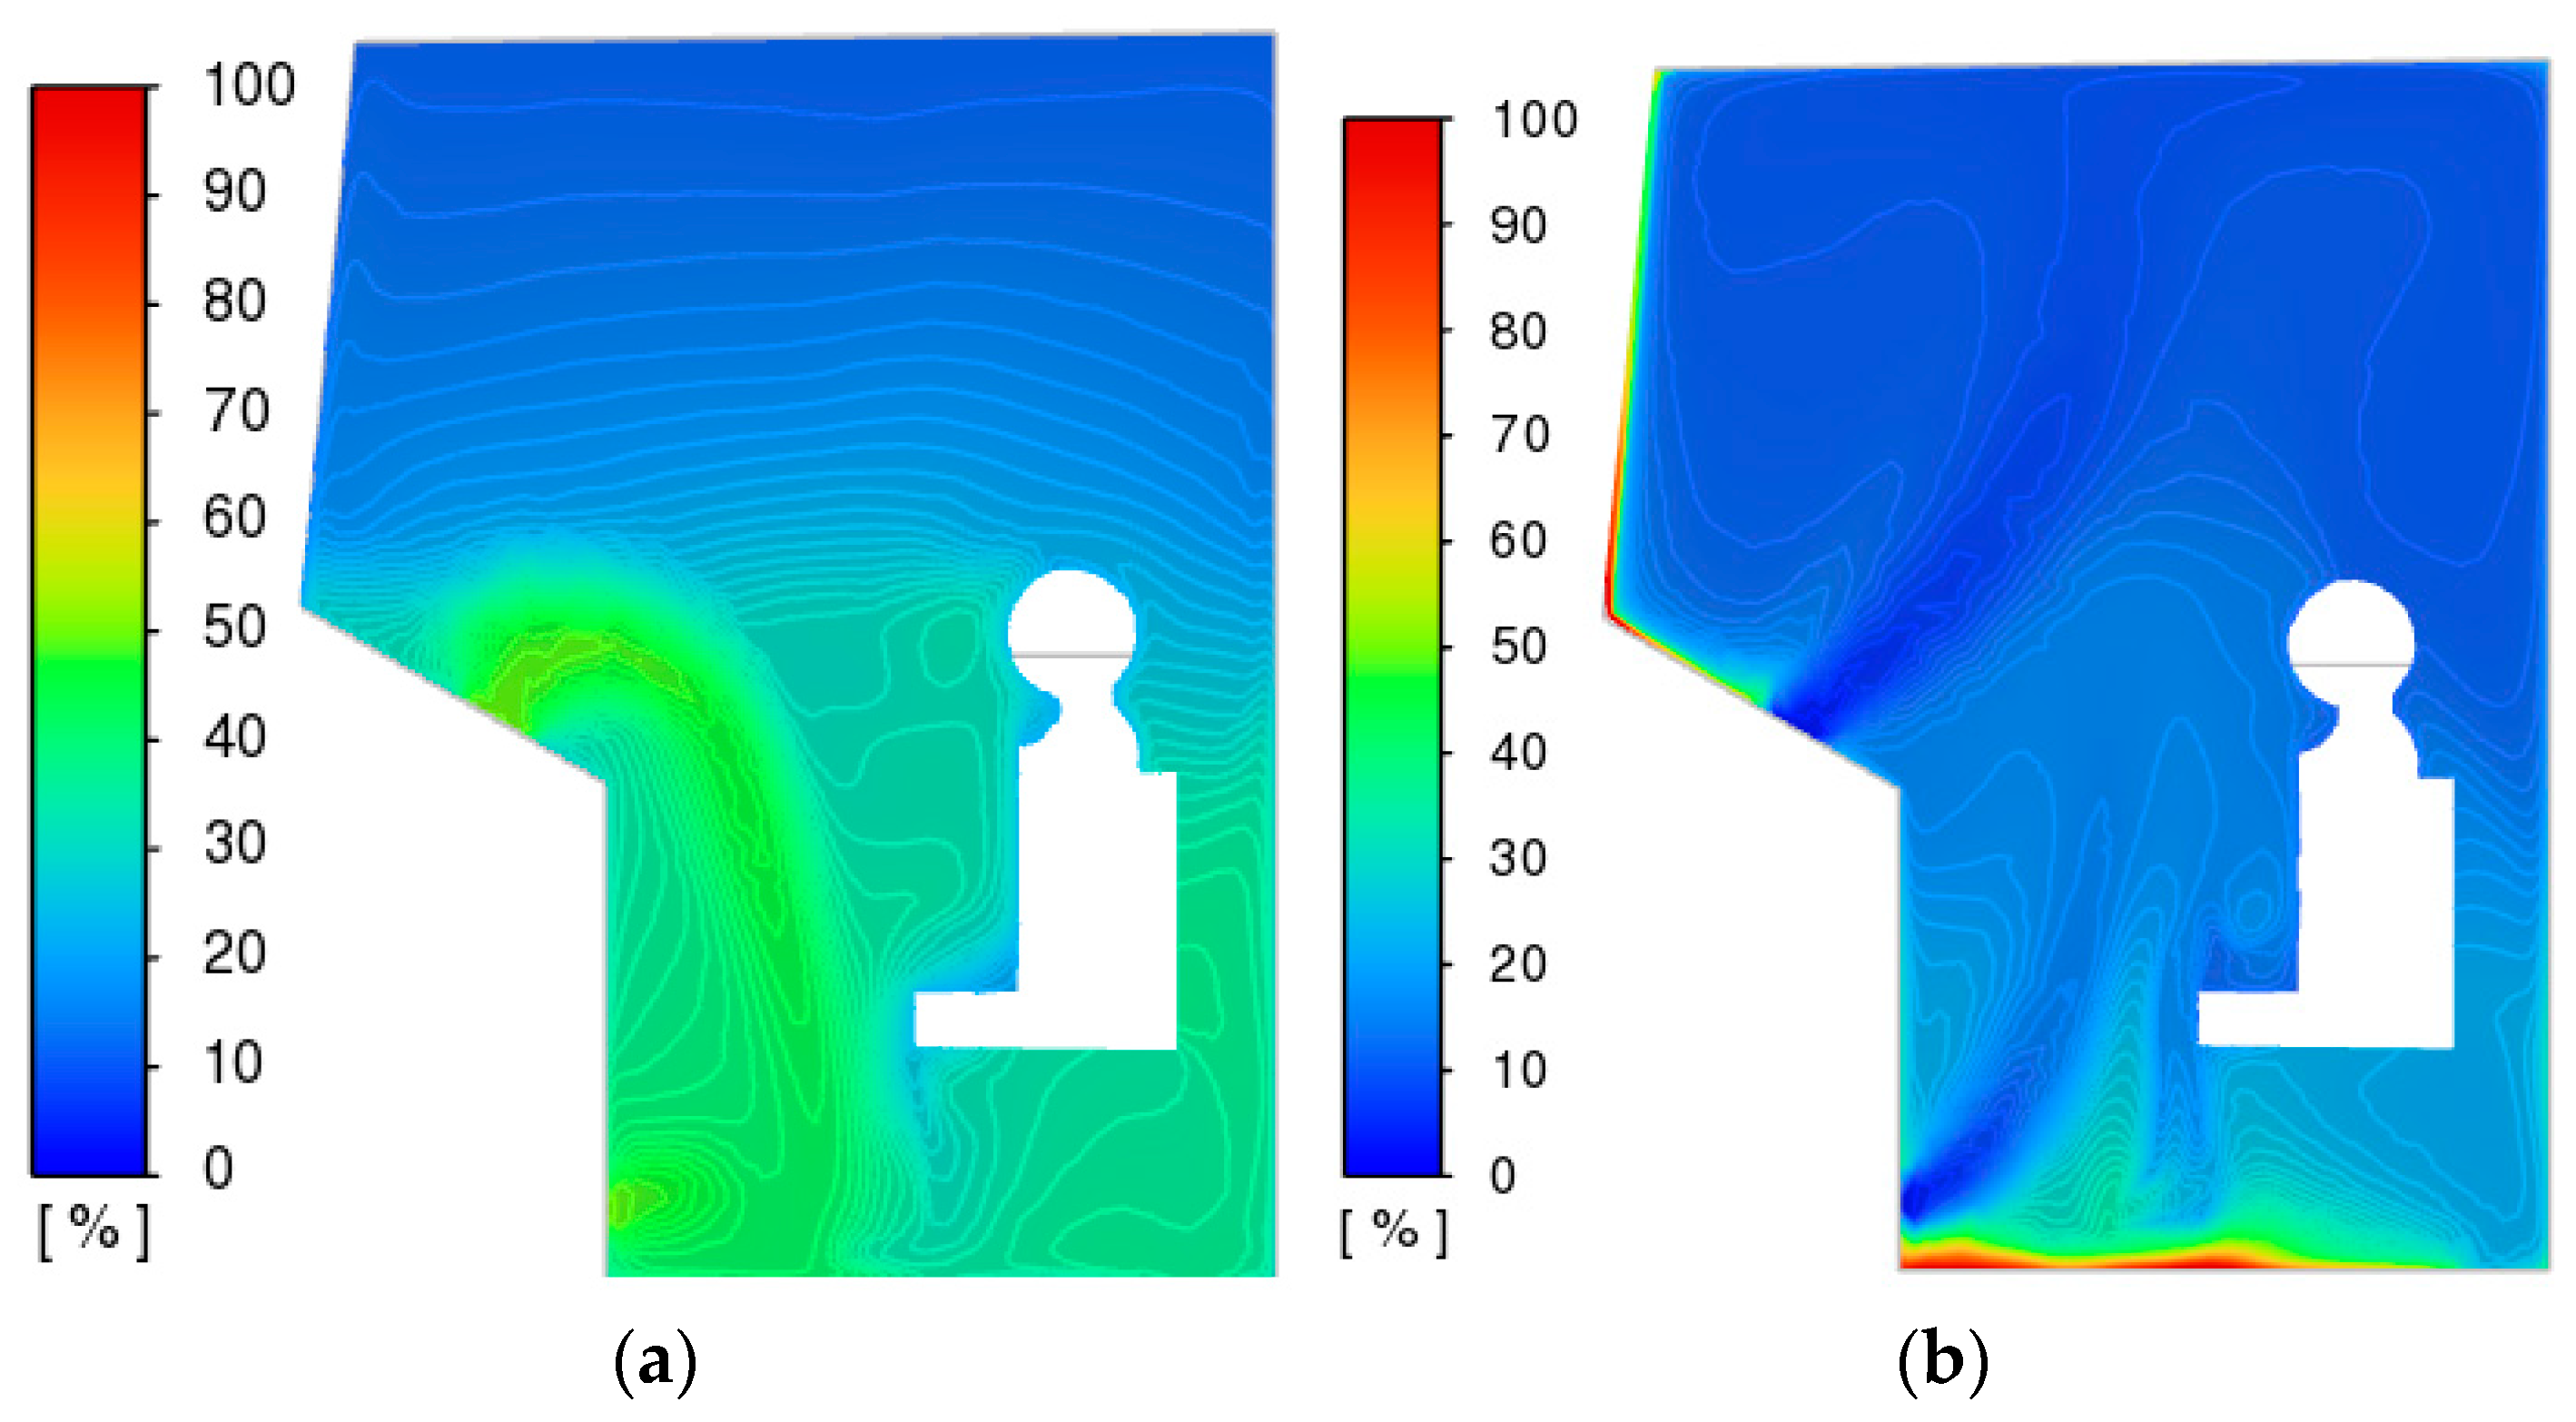
Figure 19.
Gas concentration, volume fraction: (a)—summer mode; (b)—winter mode.
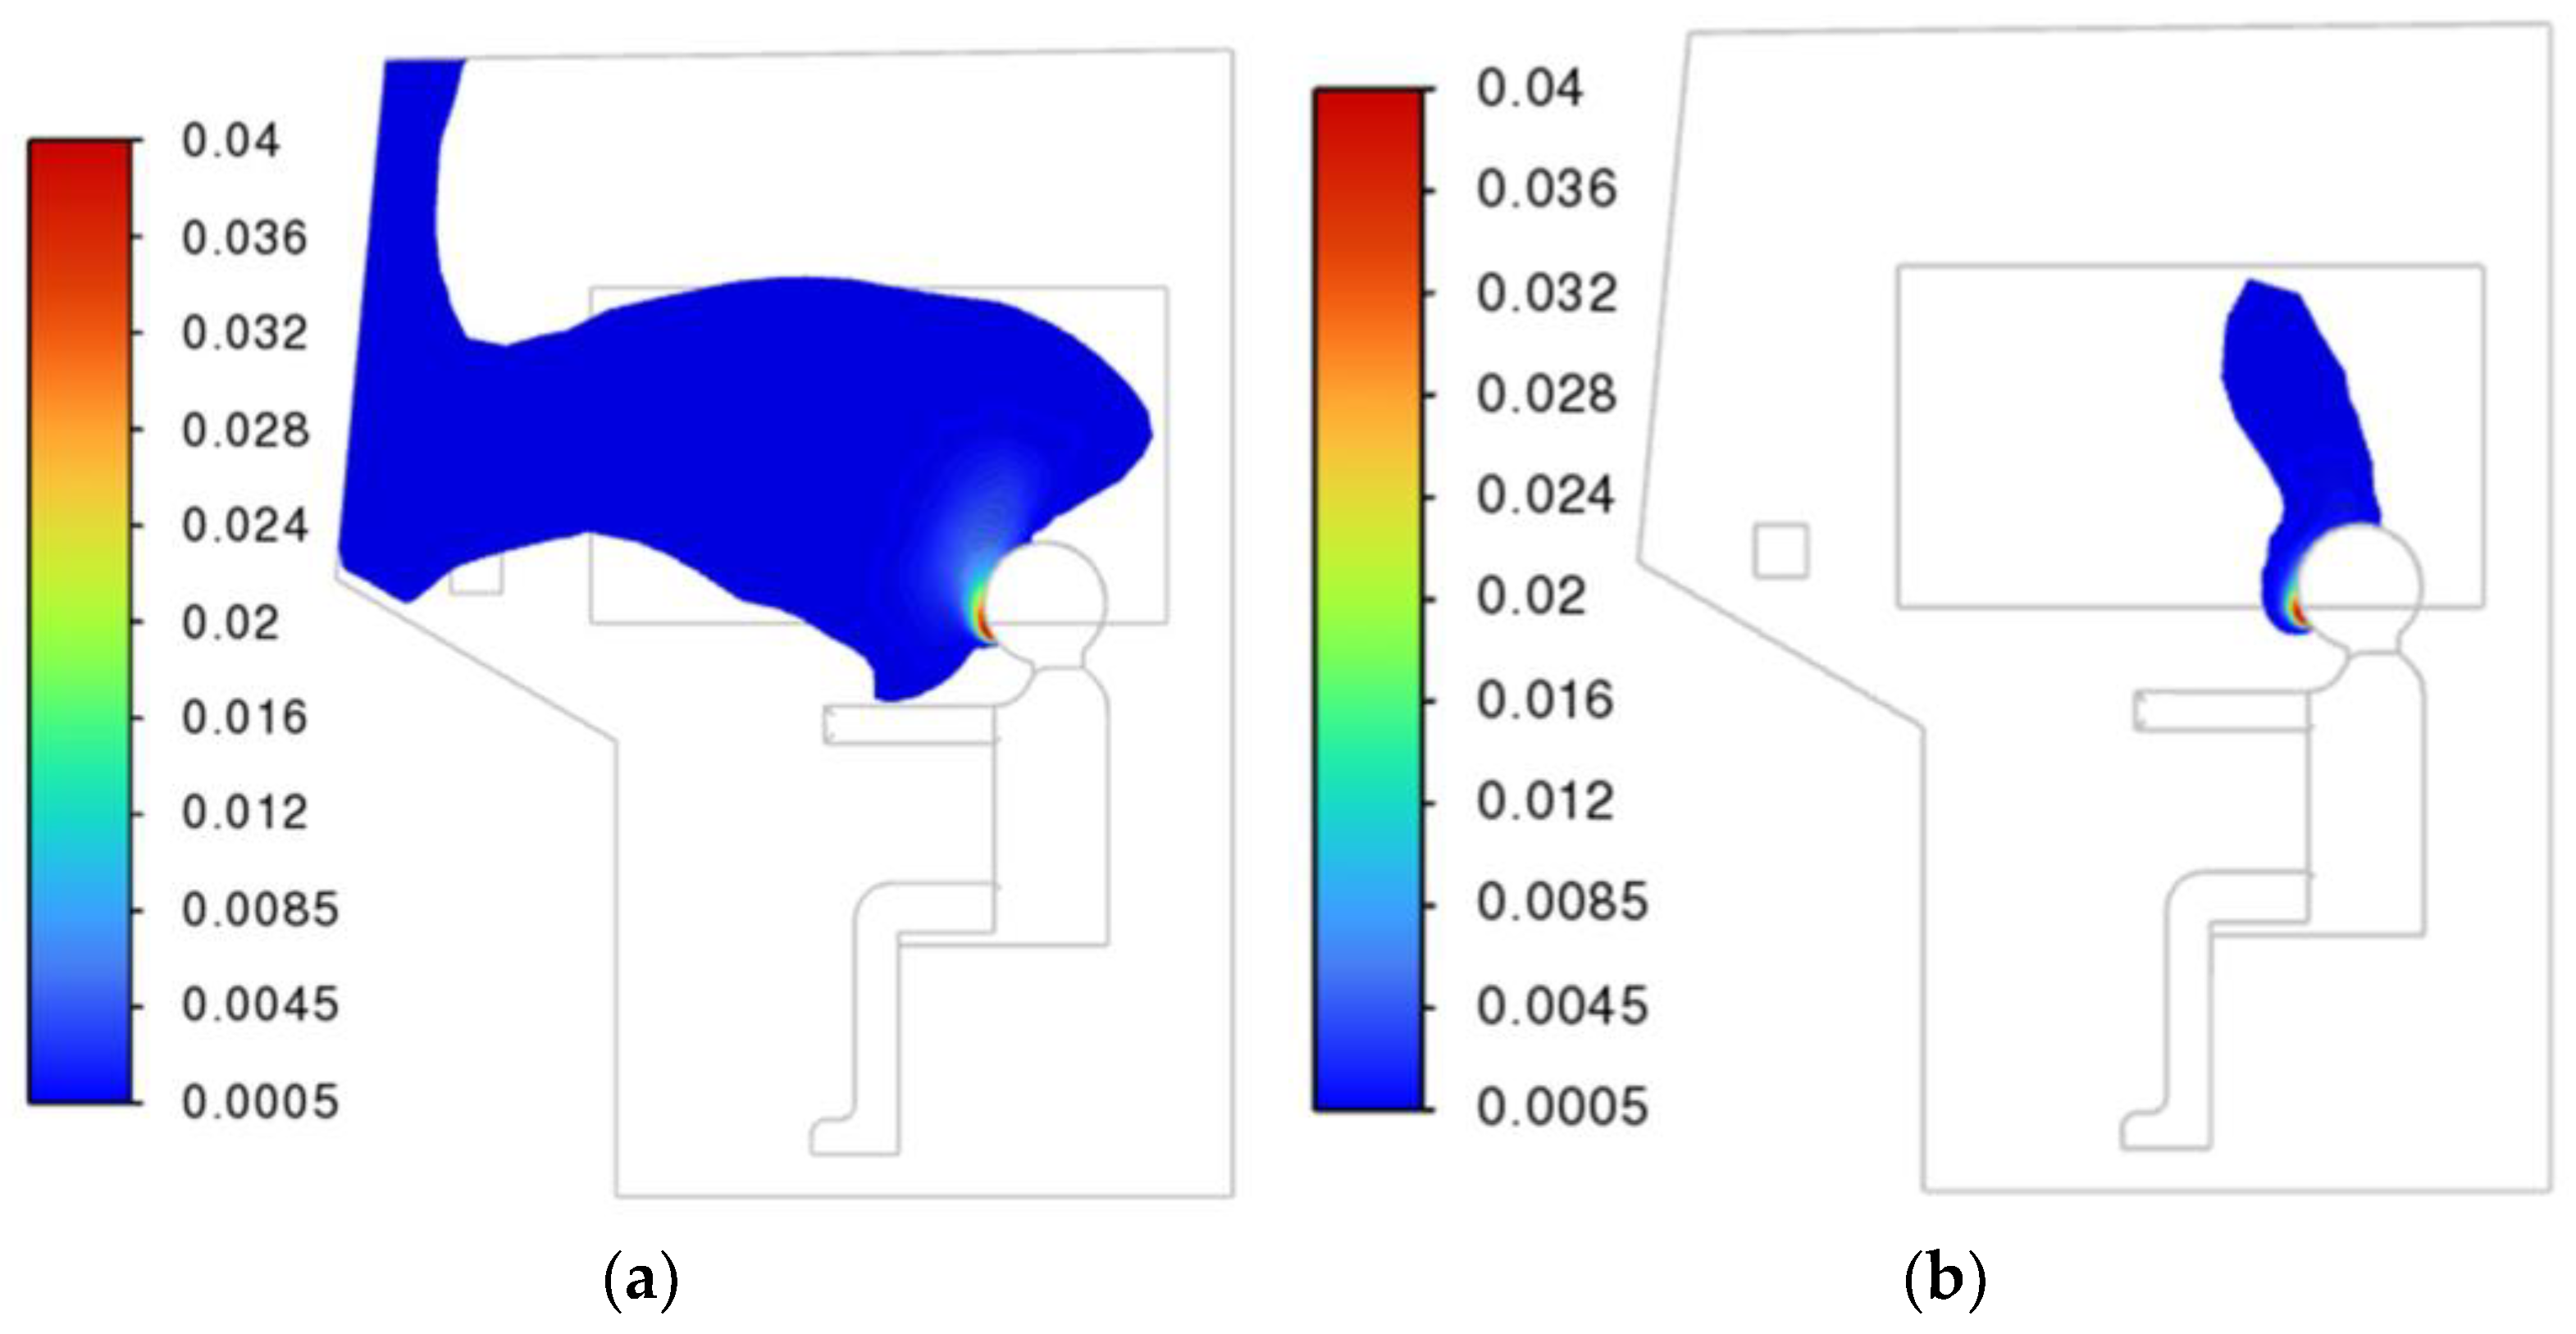
Figure 20.
Temperature measurement: (a)—Meteoskop-M [89]; (b) blue and red—points for measuring temperature.
Figure 20.
Temperature measurement: (a)—Meteoskop-M [89]; (b) blue and red—points for measuring temperature.
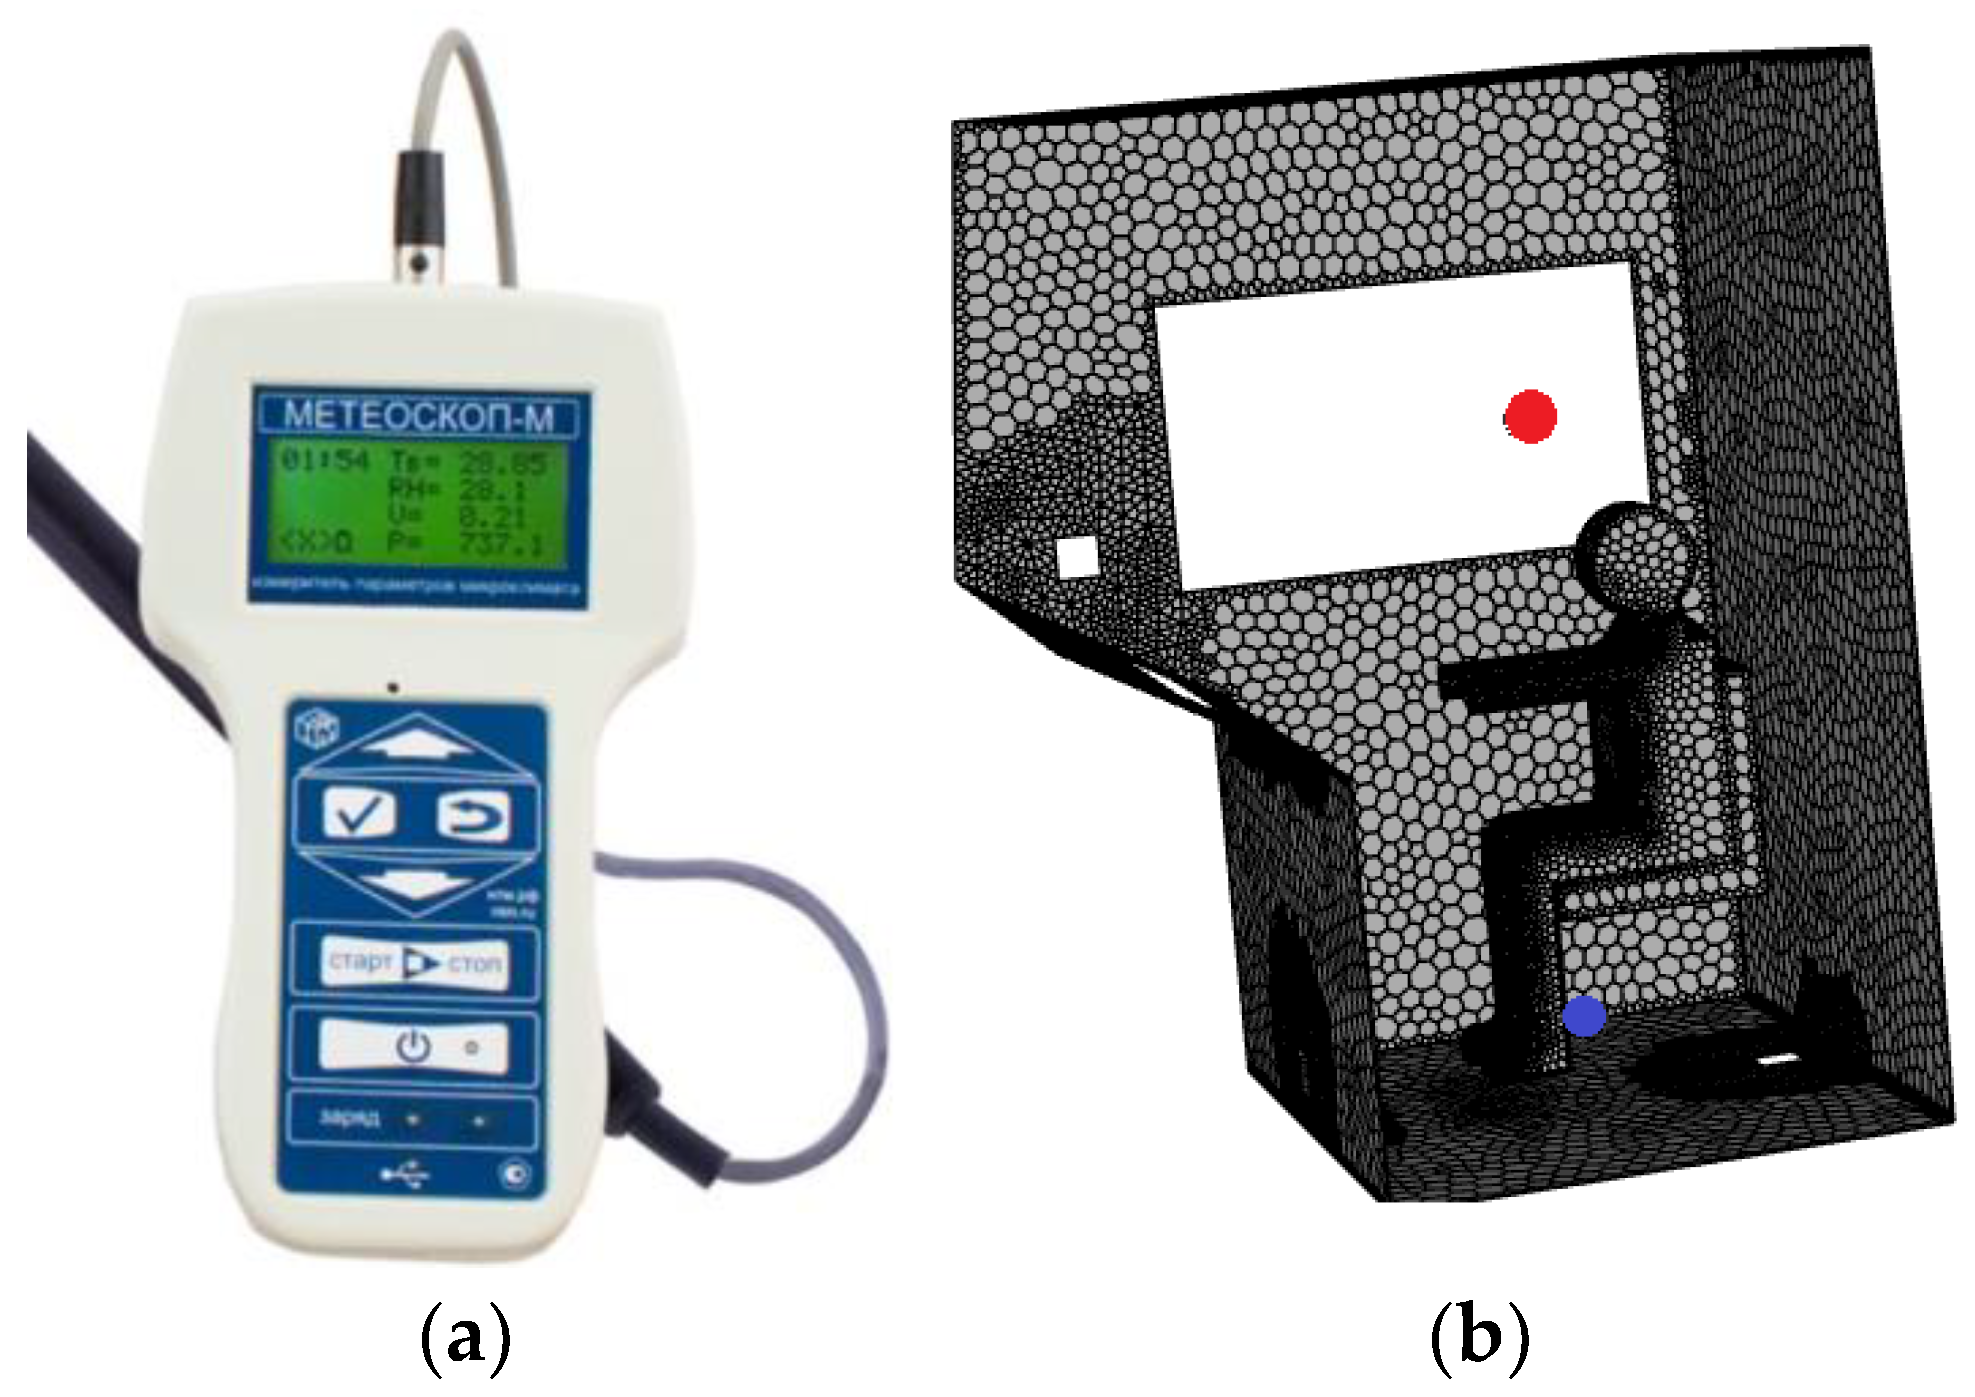
Figure 21.
Temperature measurement points: (a)—summer mode; (b)—winter mode.
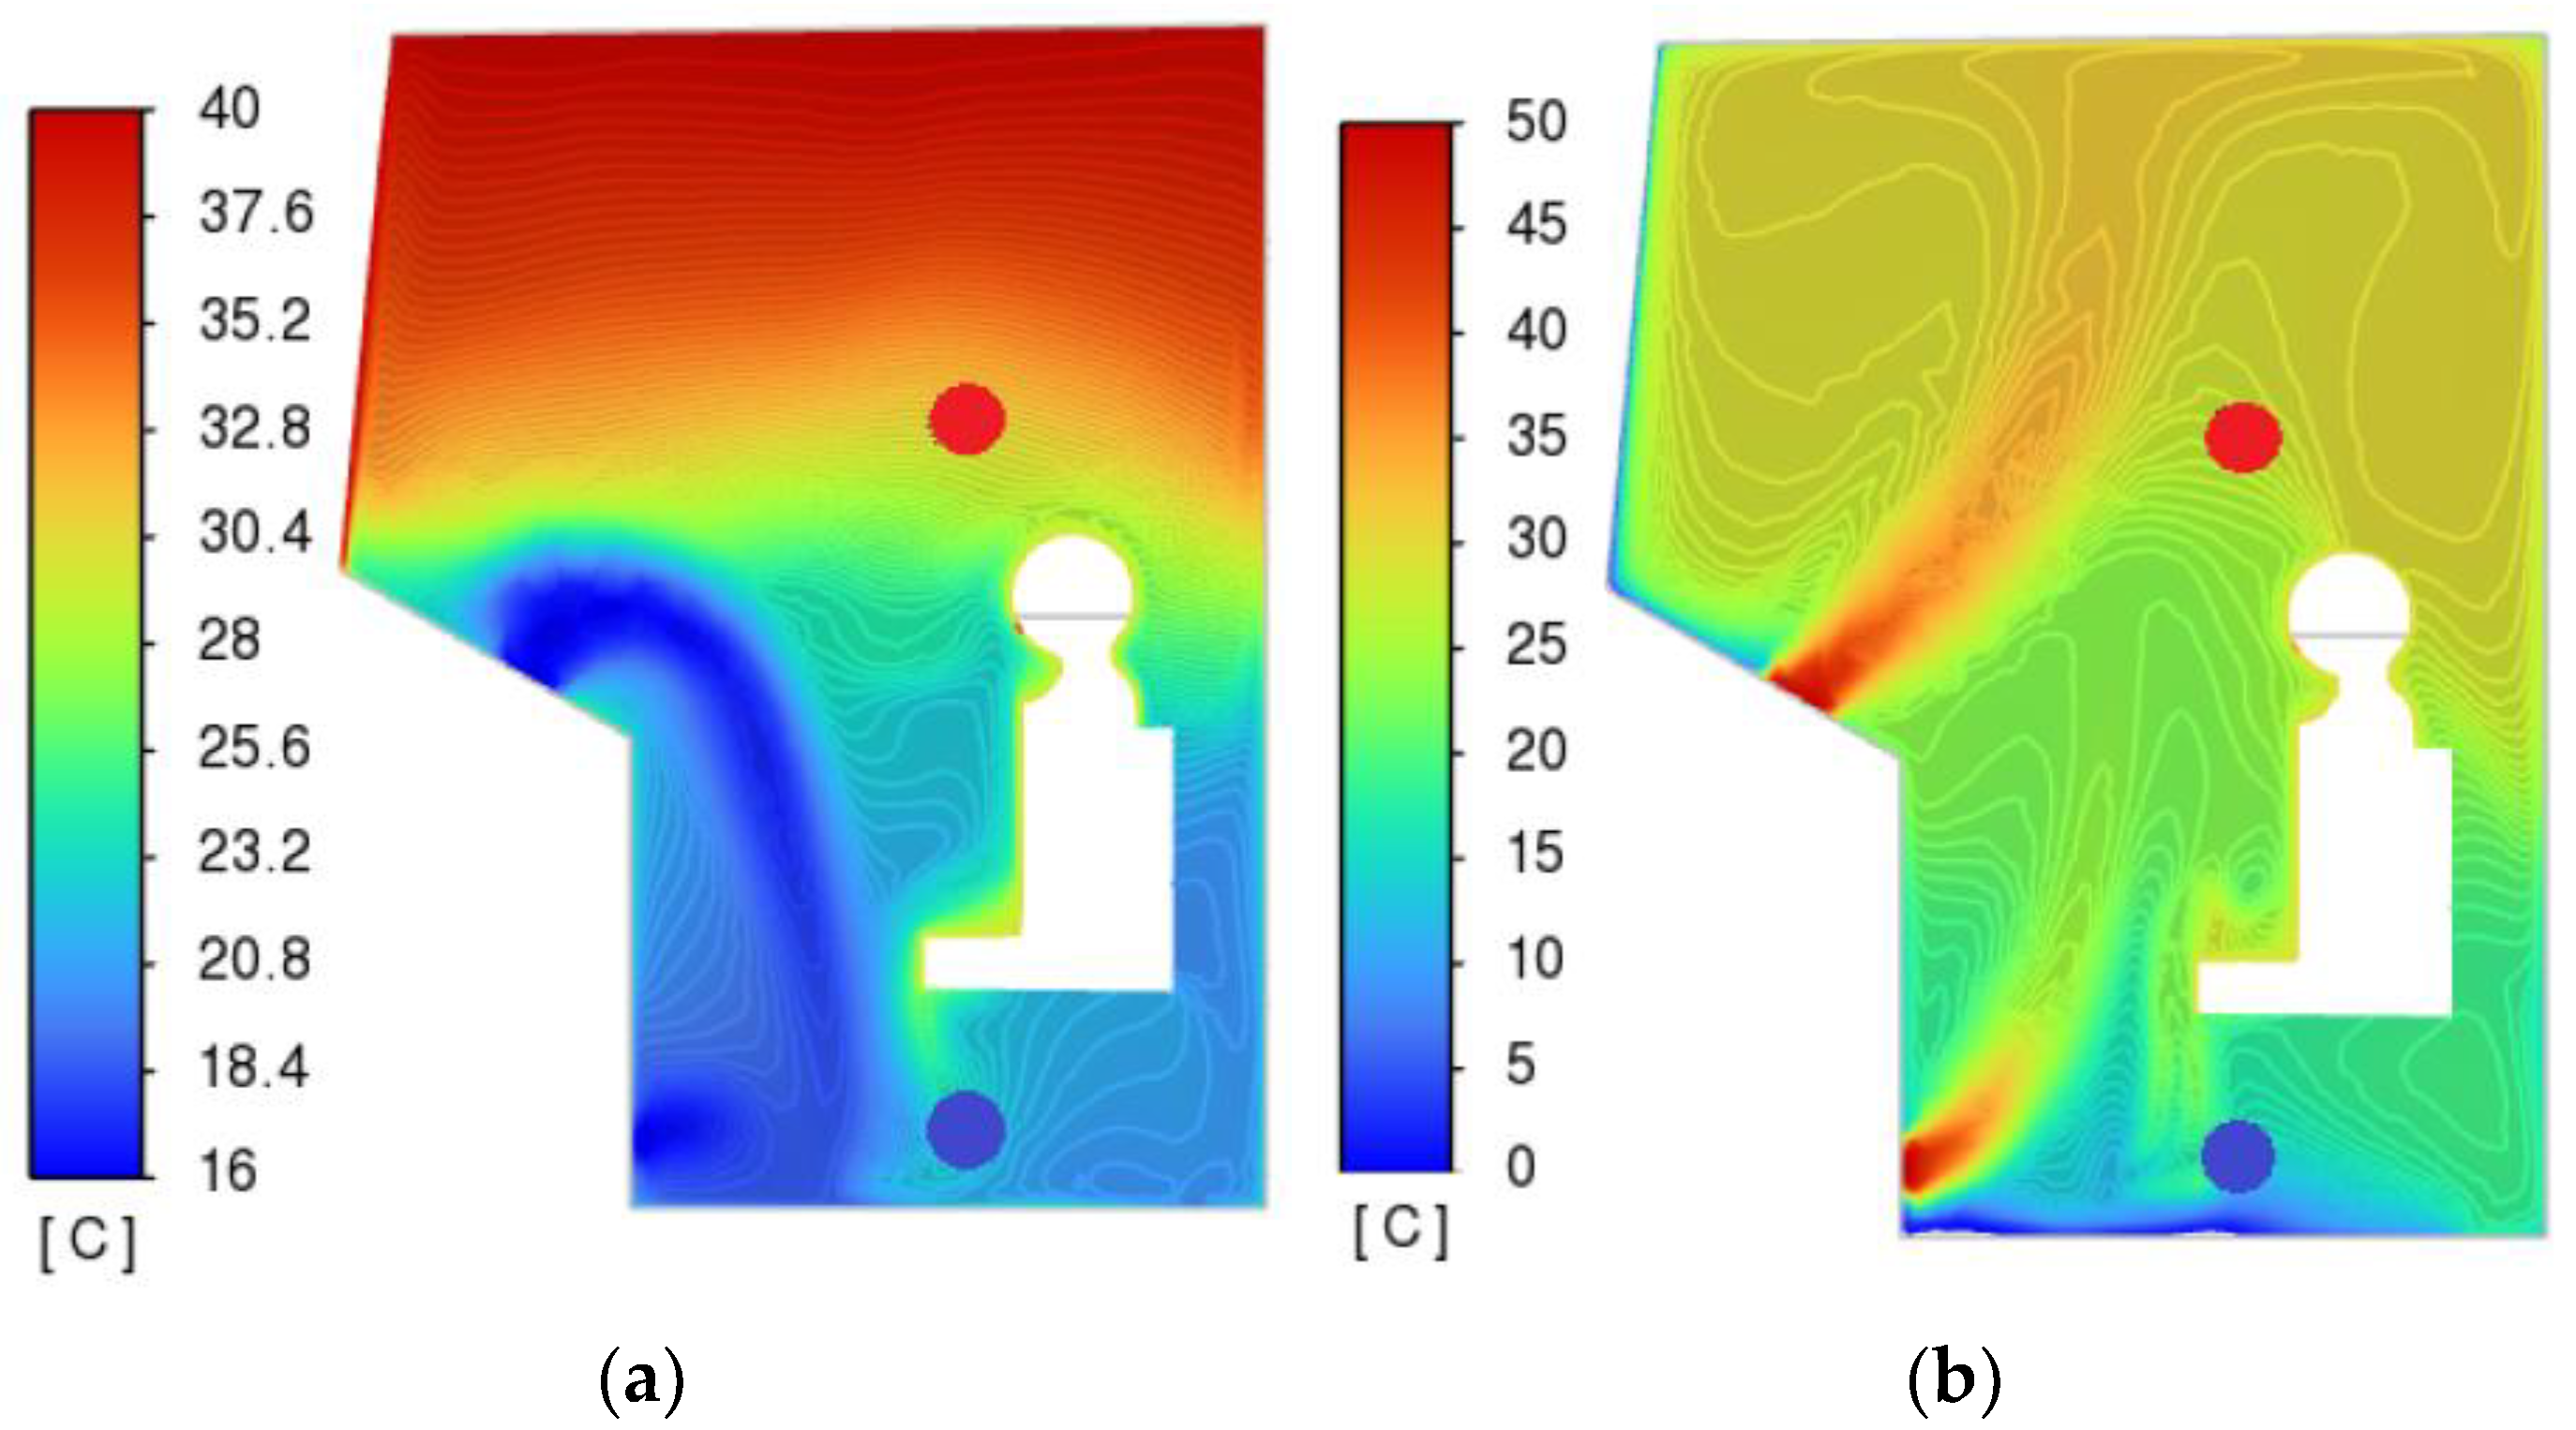
Figure 22.
Temperatures on the horizontal axis OZ.

Figure 23.
Temperatures on the vertical axis OY.

Figure 24.
Velocities on the horizontal axis OZ.
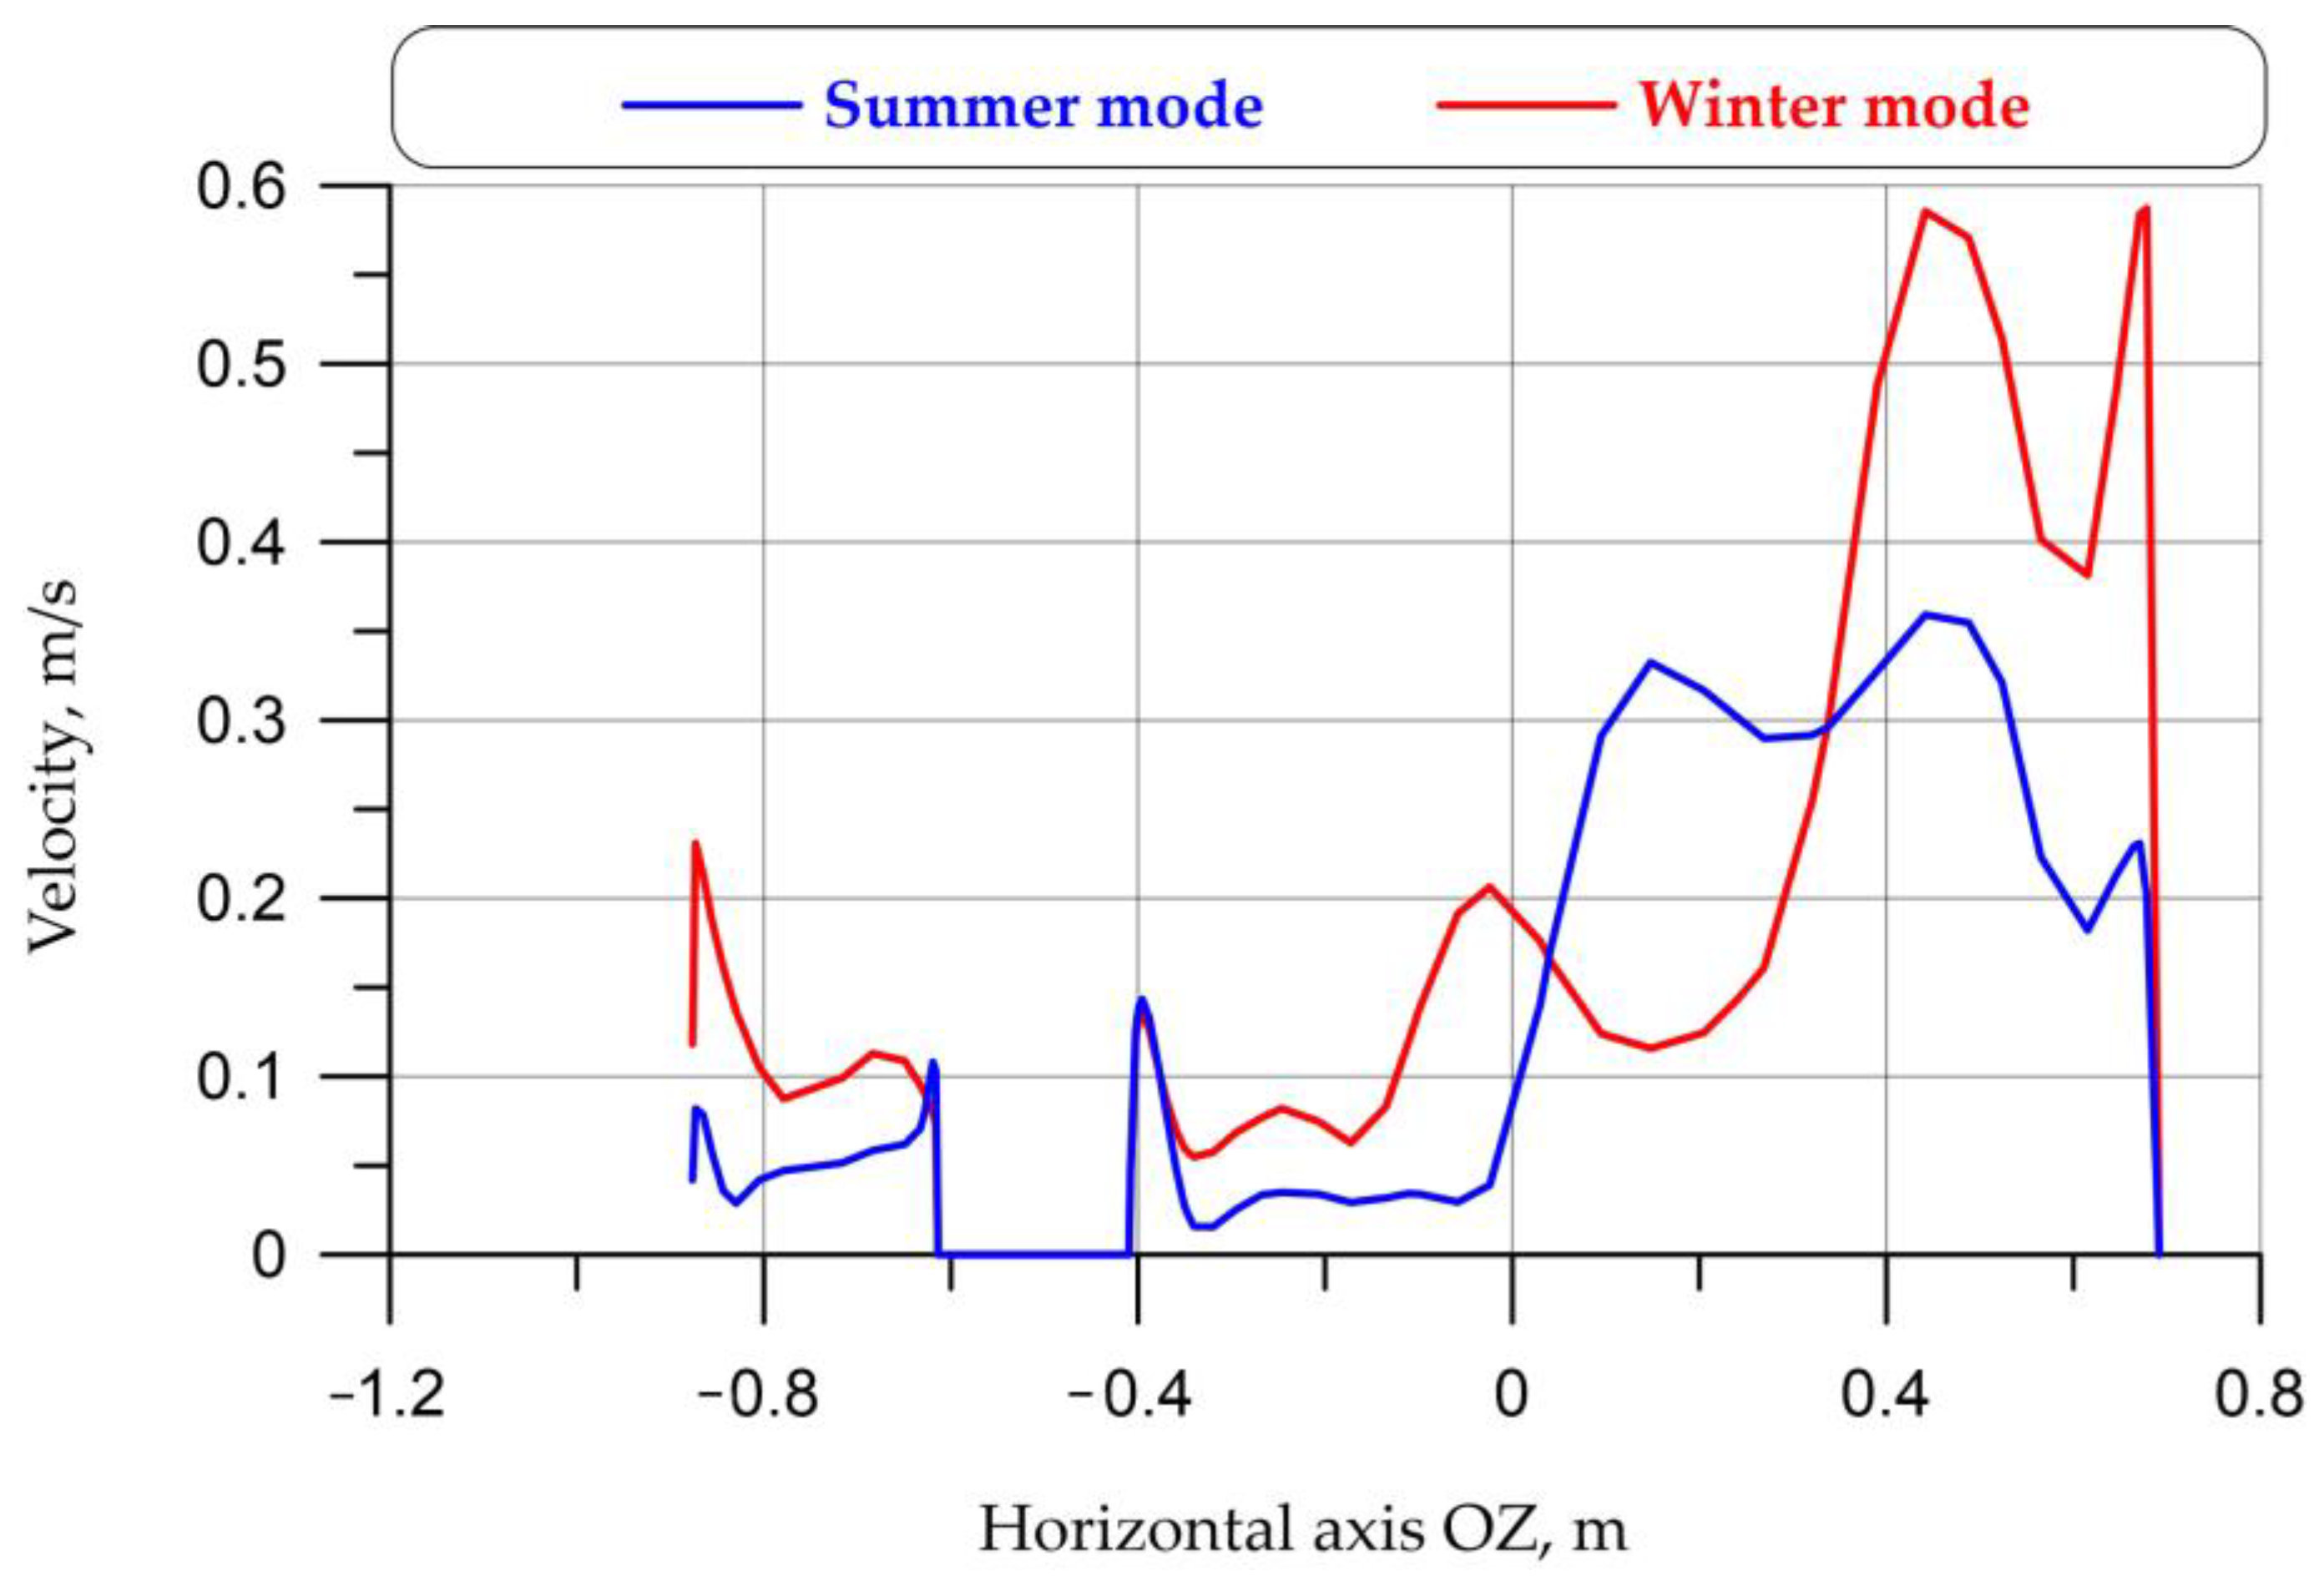
Figure 25.
Velocities on the vertical axis OY.
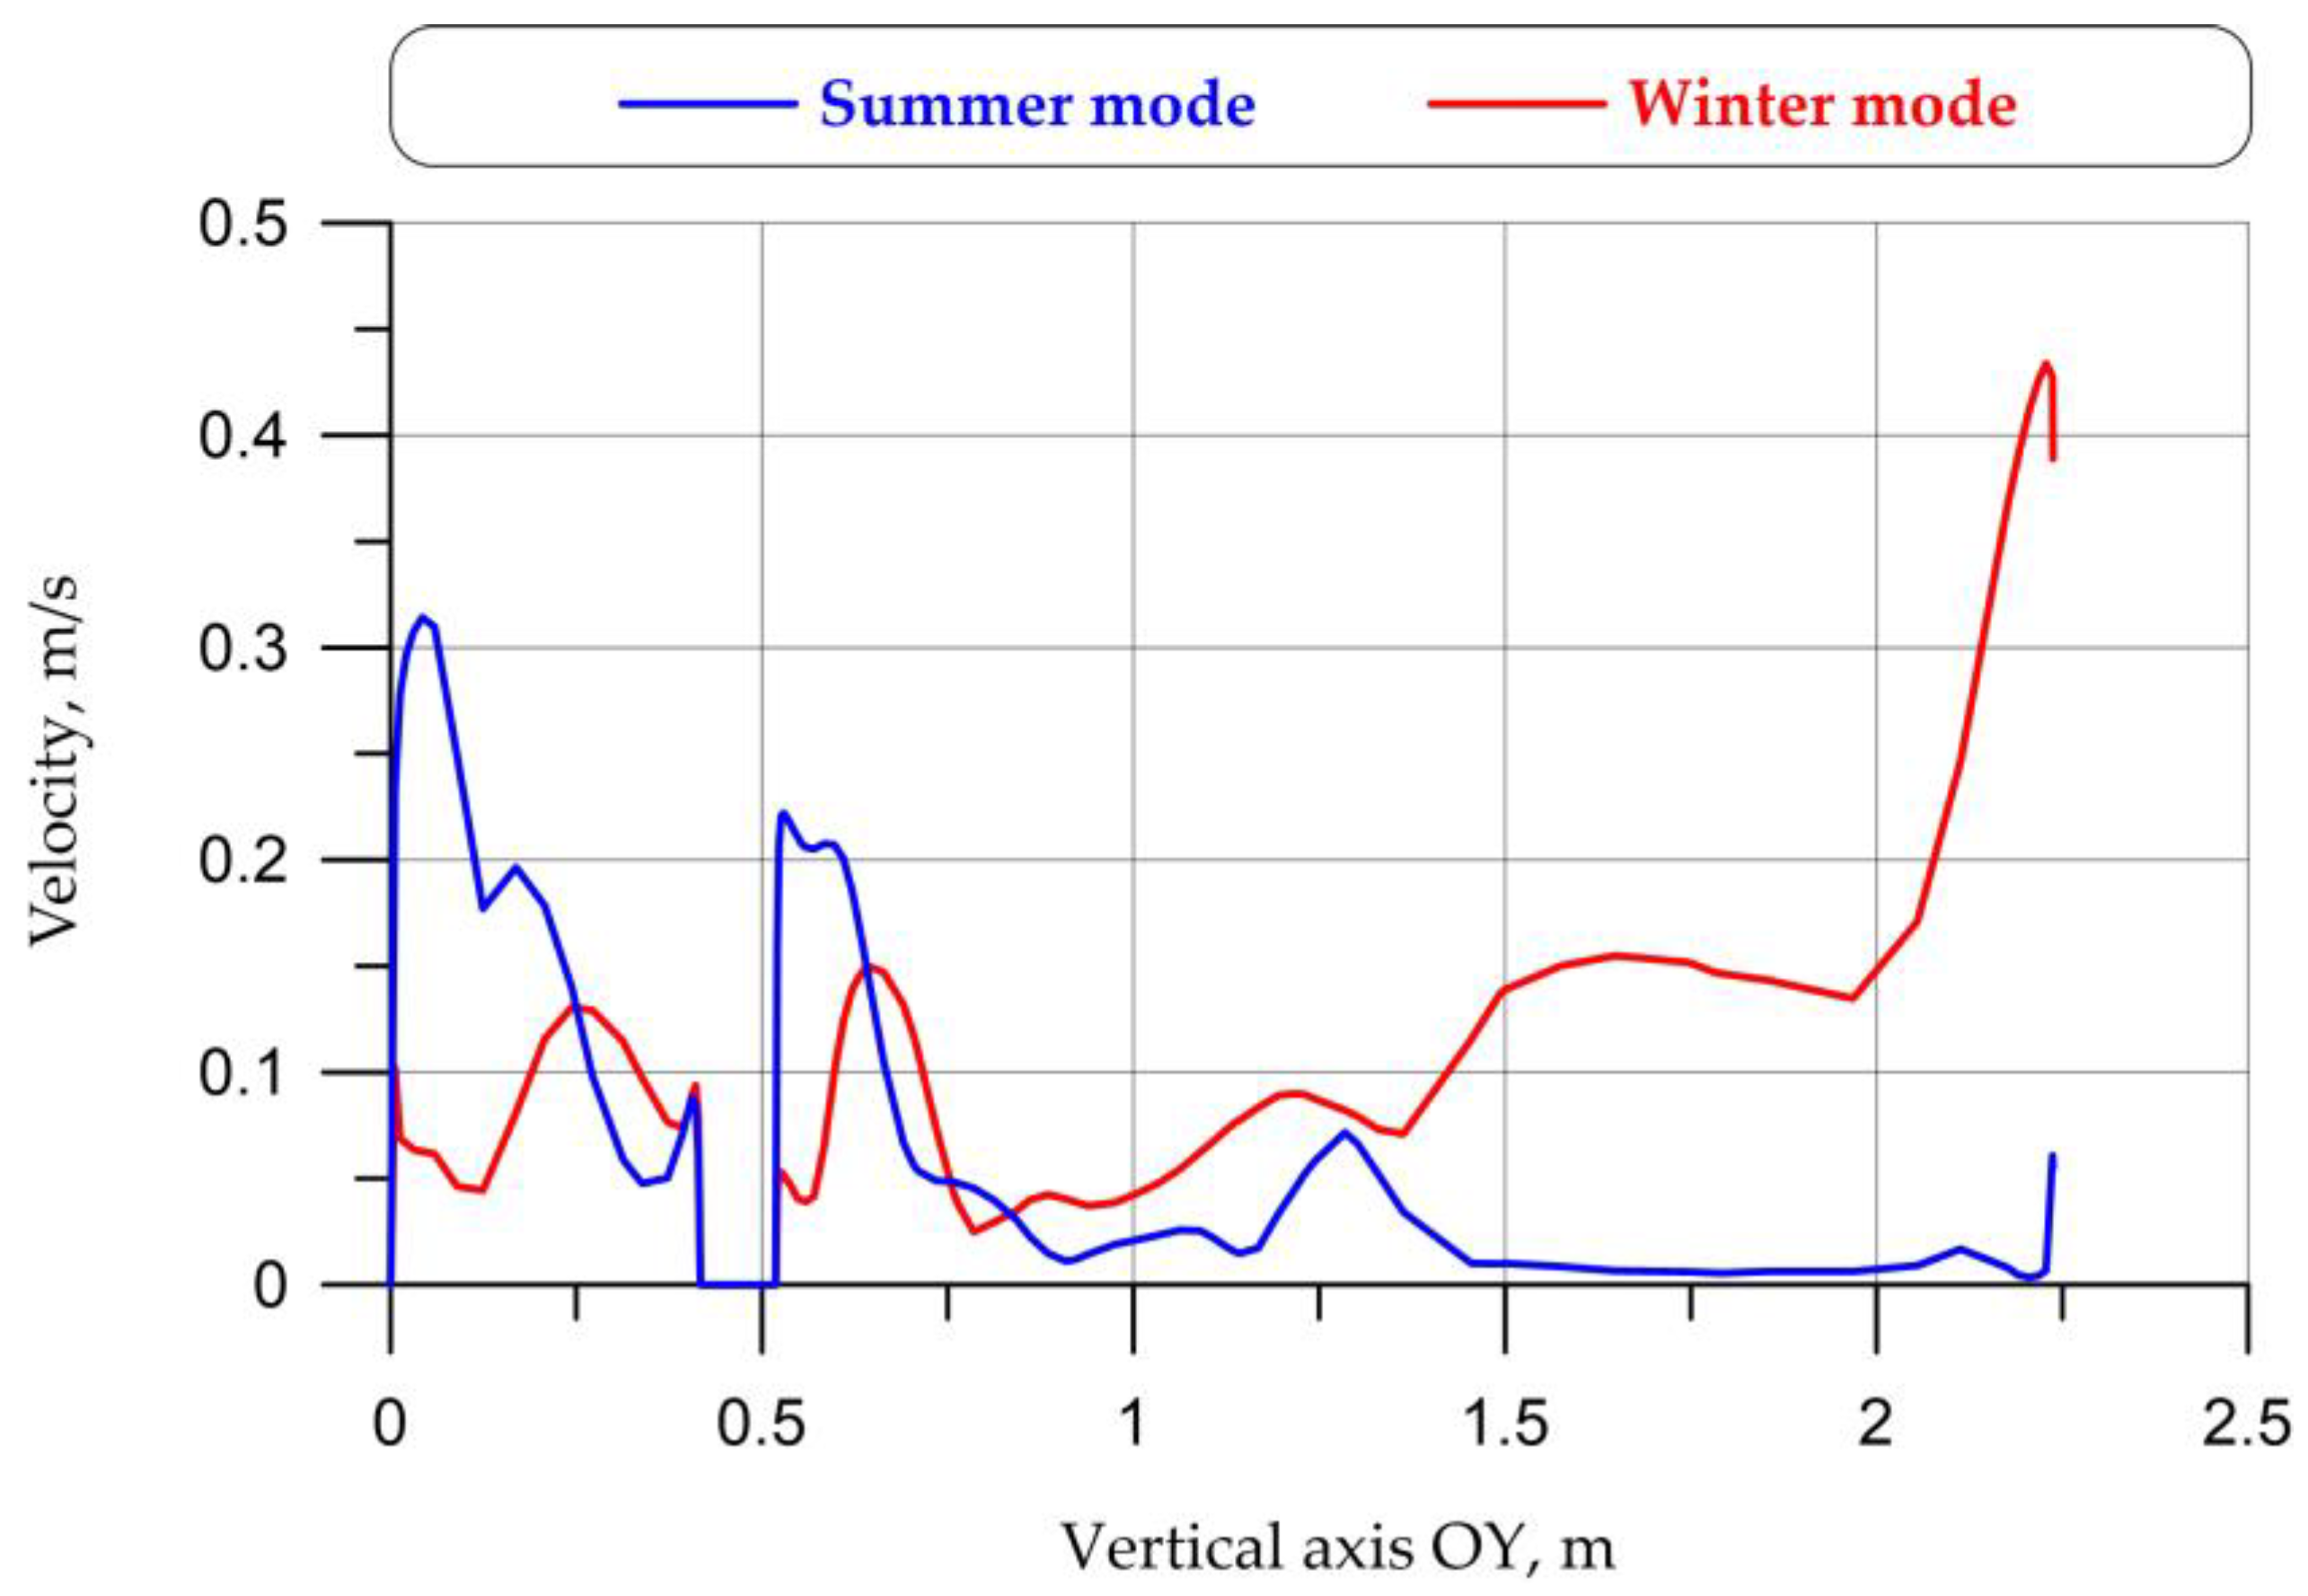
Figure 26.
CO2 streamlines for the summer mode for the case of the deflector located under the windshield: (a) frontal view; (b) side view.
Figure 26.
CO2 streamlines for the summer mode for the case of the deflector located under the windshield: (a) frontal view; (b) side view.
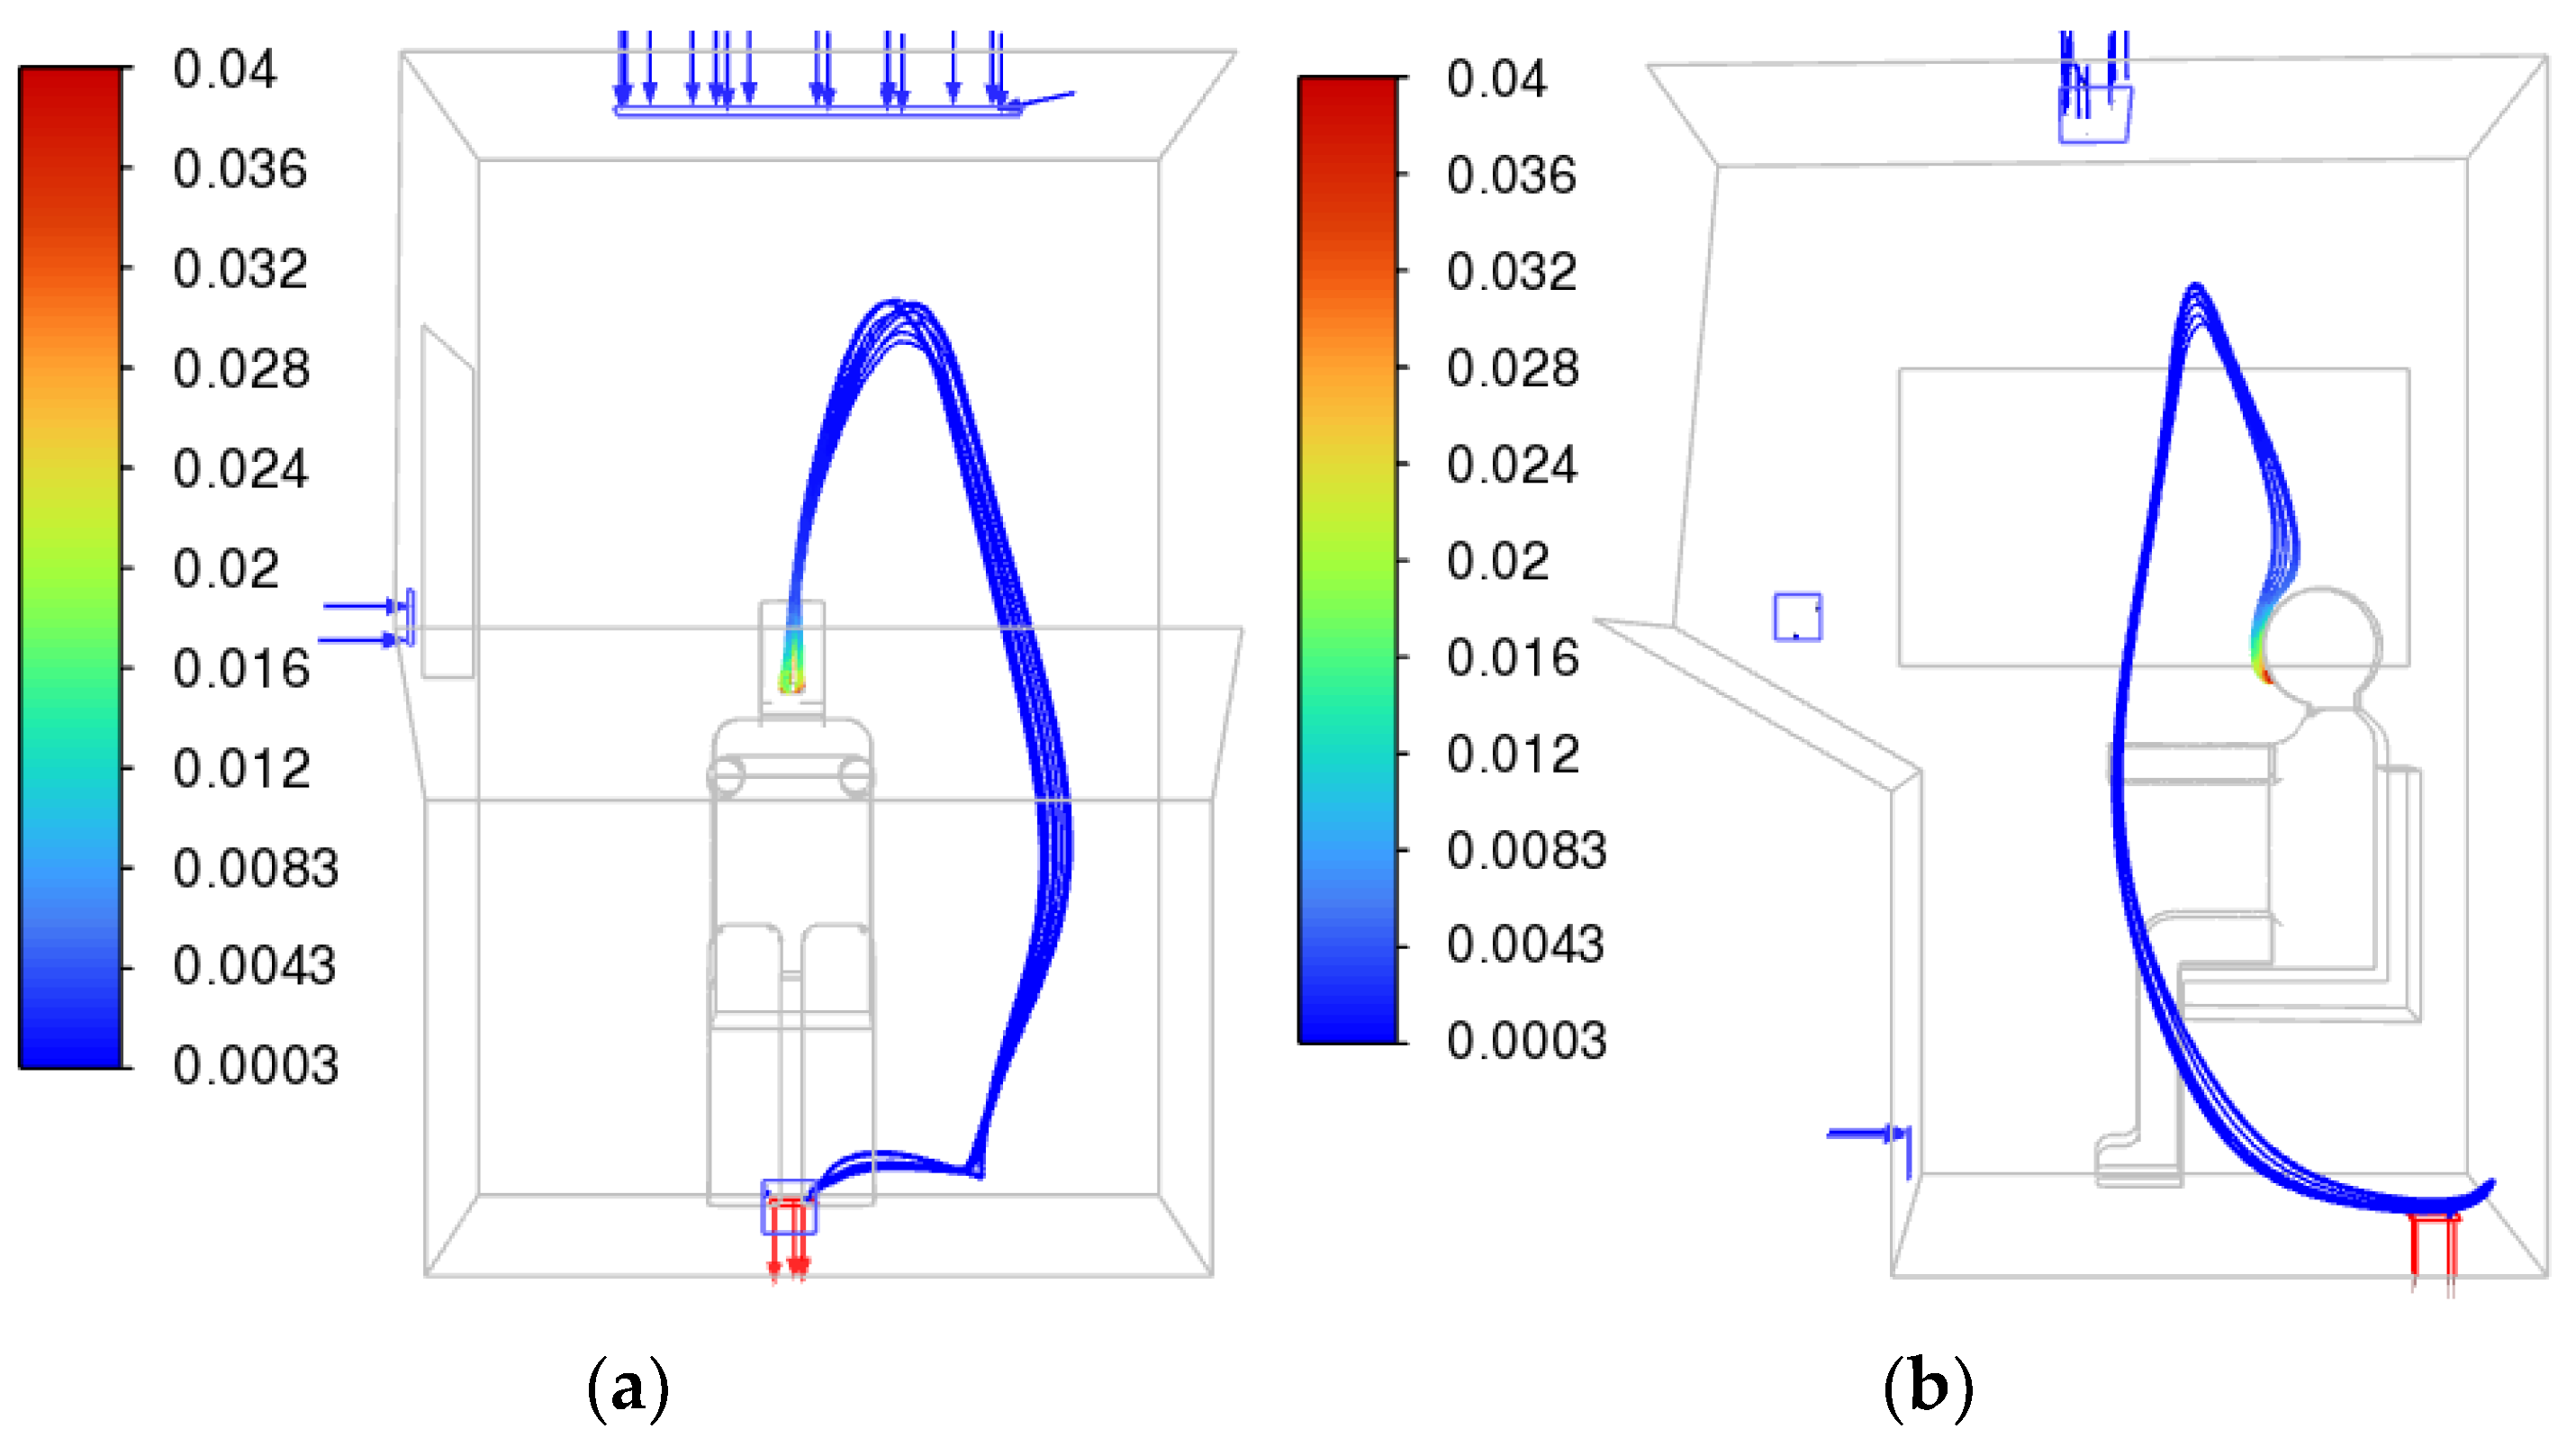
Figure 27.
CO2 streamlines for the summer mode for the case of deflectors located under the windshield and on the roof: (a) frontal view; (b) side view.
Figure 27.
CO2 streamlines for the summer mode for the case of deflectors located under the windshield and on the roof: (a) frontal view; (b) side view.

Table 1.
Boundary conditions and environment parameters for summer and winter modes.
| Num | Title | Value |
|---|---|---|
| Grid Settings | ||
| 1 | Number of cells | 489,154 |
| 2 | Number of nodes | 1,372,408 |
| 3 | Number of wall layers | 6 |
| 4 | Minimum cell area, m2 | 1.2 × 10⁻⁸ |
| 5 | Maximum cell area, m2 | 1.43 × 10⁻³ |
| The Numerical Method Settings | ||
| 6 | Solver | Pressure-Based |
| 7 | Solution Methods | Simplex |
| 8 | Turbulence model | |
| 9 | Diffusion Model | Species Transport |
Table 2.
Mesh quality.
| Num | Title | Value 1 | Value 2 | Value 3 |
|---|---|---|---|---|
| 1 | Number of cells | 489,154 | 208,264 | 187,035 |
| 2 | Number of nodes | 1,372,408 | 935,624 | 841,100 |
| 3 | Number of wall layers | 6 | 6 | 6 |
| 4 | Minimum cell area, m2 | 1.2 × 10⁻⁸ | 3.4 × 10⁻⁸ | 8.7 × 10⁻⁸ |
| 5 | Maximum cell area, m2 | 1.43 × 10⁻³ | 1.2 × 10⁻² | 1.8 × 10⁻² |
| 6 | Mesh orthogonality | 7.7 × 10⁻² | 7.0 × 10⁻² | 6.1 × 10⁻² |
| 7 | Number of iterations for convergence of a static problem | 5523 | 7677 | 11,523 |
| 8 | Number of iterations for convergence of a static problem | 76,569 | 92,263 | 116,873 |
Table 3.
Minimal mesh quality and value of residuals.
| Num | Title | Value |
|---|---|---|
| 9 | Value of residuals | 1 × 10⁻⁴ |
| Minimal mesh quality | ||
| 10 | Mesh orthogonality | 7.7 × 10⁻² |
| 11 | Variable residual values | 1 × 10⁻⁴ |
| Value of residuals |
Table 4.
Parameters for determining the heat transfer coefficient of the cabin wall.
| Material of Wall Layers | Coefficient of Thermal | Thickness of Each Layer, m |
|---|---|---|
| Cabin wall | ||
| Steel | 58 | 0.0025 |
| Bituminous mastic anti-noise layer | 0.27 | 0.003 |
| Foamed polyethylene | 0.032 | 0.03 |
| Aluminum | 203 | 0.002 |
| Wall | 0.0375 | |
| Windows | ||
| Glass | 1 | 0.01 |
Table 5.
Boundary and initial conditions and air parameters for summer and winter modes.
| Num | Title | Value |
|---|---|---|
| Summer mode | ||
| 1 | Flow temperature in inlet deflectors, °C | 16 |
| 2 | Flow velocity in the inlet deflectors, m/s | 0.4 |
| 3 | Air temperature in the cabin|t=0,°C | 40 |
| 4 | External air temperature, °C | 45 |
| 5 | Average temperature of the driver’s body, °C | 30 |
| 6 | Mass fraction of water vapor in air conditioner air | 0.006 |
| 7 | Relative humidity of water vapor in air conditioner air, % | 50 |
| 8 | Mass fraction of water vapor in the cabin at the initial moment of time | 0.0056 |
| 9 | Relative humidity in the cabin at the initial moment of time, % | 12.3 |
| 10 | CO2 concentration in air conditioner air, % | 0.03 |
| 11 | CO2 concentration in the cabin at the initial moment of time, % | 0.03 |
| Winter mode | ||
| 12 | Flow temperature in inlet deflectors, °C | 50 |
| 13 | Flow velocity in the inlet deflectors, m/s | 0.4 |
| 14 | Air temperature in the cabin|t=0, °C | 5 |
| 15 | External air temperature, °C | −50 |
| 16 | Average temperature on the human surface, °C | 30 |
| 17 | Mass fraction of heater water vapor | 0.0027 |
| 18 | Relative humidity of heater water vapor, % | 4 |
| 19 | Mass fraction of water vapor in the cabin at the initial moment of time | 0.0027 |
| 20 | Relative humidity in the cabin at the initial moment of time, % | 50 |
| 21 | CO2 concentration in air conditioner air, % | 0.03 |
| 22 | CO2 concentration in the cabin at the initial moment of time, % | 0.03 |
Table 6.
Mixture parameters for summer and winter modes.
| Num | Mixture Parameters | Value |
|---|---|---|
| 23 | Molecular weight of air, kg/kmol | 28.966 |
| 24 | Specific heat of air, J/(kg∙K) | 1006.43 |
| 25 | Molecular weight of water vapor kg/kmol | 18.0153 |
| 26 | Specific heat of water vapor, J/(kg∙K) | 2014 |
| 27 | Molecular weight of carbon dioxide, kg/kmol | 44.01 |
| 28 | Specific heat of carbon dioxide, J/(kg∙K) | 840.37 |
Table 7.
Diffusion coefficients.
| Num | Title | Value, Summer Mode | Value, Winter Mode |
|---|---|---|---|
| 1 | Coeff. mass diffusion CO2, [m2/s] | 1.58 × 10⁻⁵ | 1.56 × 10⁻⁵ |
| 2 | Coeff. mass diffusion H2O, [m2/s] | 2.37 × 10⁻⁵ | 2.35 × 10⁻⁵ |
| 3 | Coeff. mass diffusion Air, [m2/s] | 2.32 × 10⁻⁵ | 2.31 × 10⁻⁵ |
| 4 | Coeff. thermal diffusion CO2, [kg/(m s)] | 1.49 × 10⁻⁹ | 9.82 × 10⁻¹⁰ |
| 5 | Coeff. thermal diffusion H2O, [kg/(m s)] | −1.83 × 10⁻⁸ | −1.97 × 10⁻⁸ |
| 6 | Coeff. thermal diffusion Air, [kg/(m s)] | 1.68 × 10⁻⁸ | 1.87 × 10⁻⁸ |
Table 8.
Driver breathing parameters.
| Num | Title | Value |
|---|---|---|
| 1 | Exhalation temperature, °C | 36.6 |
| 2 | Volume of air inhaled per breath, liter | 0.5 |
| 3 | Breathing frequency, breathing/min | 15 |
| 4 | Time of one breath, s | 4 |
| 5 | Relative humidity of exhaled air, % | 100 |
| 6 | CO2 concentration of exhaled air, % | 4.03 |
| 7 | Inhalation–exhalation surface area, m2 | 0.00105 |
Table 9.
Results of average values by volume for a time of 300 s.
| N | Title | Summer Mode, Value | Winter Mode, Value |
|---|---|---|---|
| 1 | Temperature in volume, °C | 30.0 | 25.4 |
| 2 | Temperature in center, °C | 24.2 | 24.3 |
| 3 | Air speed in center, m/s | 0.02 | 0.06 |
| 4 | Relative humidity in volume, % | 24.9 | 17.1 |
| 5 | Relative humidity in center, % | 38.1 | 17.3 |
| 6 | CO2 concentration in volume, % | 0.034 | 0.034 |
| 7 | CO2 concentration in center, % | 0.124 | 0.039 |
Table 10.
Results of comparison of experimental measurements and numerical calculations.
| Num | Title | Numerical | Experiment | Error, % | Standard |
|---|---|---|---|---|---|
| Summer Mode | |||||
| 1 | Temperature at 0.15 m, °C | 22.5 | |||
| 2 | Temperature at 1.5 m, °C | 37.6 | |||
| 3 | Average temperature, °C | 30.1 | 32.5 | 7.4 | 20–28 |
| Winter Mode | |||||
| 4 | Temperature at 0.15 m, °C | 12.8 | |||
| 5 | Temperature at 1.5 m, °C | 28.5 | |||
| 6 | Average temperature, °C | 20.65 | 21.4 | 3.5 | 20–28 |
Table 11.
Gradient of field distribution along the vertical axis.
| N | Title | Location of Deflectors | |||
|---|---|---|---|---|---|
| Under the Windshield | On the Roof | Reduced under the Windshield | Reduced under the Windshield and on the Roof | ||
| 1 | Temperature, °C | 5.654 | 0.668 | 2.286 | 1.315 |
| 2 | Velocity, m/s | 0.105 | 0.063 | 0.179 | 0.056 |
| 3 | Relative humidity, %: | 7.297 | 2.786 | 3.756 | 1.946 |
| 4 | CO2 concentration in volume, % | 0.055 | 0.098 | 0.017 | 0.009 |
Disclaimer/Publisher’s Note: The statements, opinions and data contained in all publications are solely those of the individual author(s) and contributor(s) and not of MDPI and/or the editor(s). MDPI and/or the editor(s) disclaim responsibility for any injury to people or property resulting from any ideas, methods, instructions or products referred to in the content. |
© 2024 by the authors. Licensee MDPI, Basel, Switzerland. This article is an open access article distributed under the terms and conditions of the Creative Commons Attribution (CC BY) license (https://creativecommons.org/licenses/by/4.0/).
Share and Cite
MDPI and ACS Style
Panfilov, I.; Beskopylny, A.N.; Meskhi, B. Improving the Fuel Economy and Energy Efficiency of Train Cab Climate Systems, Considering Air Recirculation Modes. Energies 2024, 17, 2224. https://doi.org/10.3390/en17092224
AMA Style
Panfilov I, Beskopylny AN, Meskhi B. Improving the Fuel Economy and Energy Efficiency of Train Cab Climate Systems, Considering Air Recirculation Modes. Energies. 2024; 17(9):2224. https://doi.org/10.3390/en17092224
Chicago/Turabian StylePanfilov, Ivan, Alexey N. Beskopylny, and Besarion Meskhi. 2024. "Improving the Fuel Economy and Energy Efficiency of Train Cab Climate Systems, Considering Air Recirculation Modes" Energies 17, no. 9: 2224. https://doi.org/10.3390/en17092224
Note that from the first issue of 2016, this journal uses article numbers instead of page numbers. See further details here.