
Quantitative Study on the Effects of Street Geometries and Tree Configurations on the Outdoor Thermal Environment

1
China National Engineering Research Center for Human Settlements, China Architecture Design & Research Group, Xicheng District, Beijing 100044, China
2
School of Architecture, Tsinghua University, Haidian District, Beijing 100084, China
3
School of Design, Silla University, Sasang-gu, Busan 46958, Republic of Korea
4
Department of Architecture, Pusan National University, Geumjeong-gu, Busan 46241, Republic of Korea
*
Author to whom correspondence should be addressed.
Energies 2024, 17(9), 2223; https://doi.org/10.3390/en17092223
Submission received: 8 April 2024
/
Revised: 24 April 2024
/
Accepted: 30 April 2024
/
Published: 5 May 2024
(This article belongs to the Section J: Thermal Management)
Abstract
:Global warming and the urban heat island effect has aroused the attention of research on the outdoor thermal environment. As outdoor spaces often used by citizens, streets play an important role in improving the thermal environment. In this study, six factors relating to street geometries and tree configurations in Busan are measured and quantified to form 32 typical scenarios. The degree of importance of these six factors is evaluated based on ENVI-met simulation results, and GeoDetector is introduced to evaluate the interactions between the factors and their impacts on the outdoor thermal environment. This study confirms the significantly higher impact of street geometry factors on the air temperature and physiological equivalent temperature compared to tree configuration factors. Particularly, Hb/Ws shows the most significant impact during the research period. The impact of interactions between any two factors of street geometry is much higher than that of interactions between the geometry and tree configuration factors and that of interactions between the tree configuration factors. We recommend dynamically adjusting the relationship between street geometry and tree configurations in different situations to improve the outdoor thermal environment, especially at noon and in the afternoon.
1. Introduction
By 2050, approximately 70% of the population is predicted to live in cities, continuing the current trend of increasing urban populations [1]. Due to rapid urbanization, newer cities have become centers of stronger urban heat island effects rather than older ones [2]. Meanwhile, city expansion changes local atmospheric circulation [3], causing frequent occurrences of extreme weather including heatwaves and floods [4,5], which have a variety of adverse effects on human health [6,7] and ecosystems [8]. The existing urban-planning strategies require transformation to create sustainable cities and communities (SDG 11) that adapt to global climate change. Streets constitute > 80% of urban open space and play an important role in urban infrastructure [9]. As a social space, streets provide a platform for social behavior and experiences [10].
The microclimate of a city’s local districts forms the urban climate, significantly assisting in determining the urban physical environment [11]. Various biometeorological indices describe the outdoor thermal environment by linking the microclimate and human activity [12,13], including the predicted mean vote [14], PET [15], and universal thermal climate index [16]. The efficiency of using the PET for measuring tropical, subtropical, and temperate regions has been verified by existing studies on the widely used thermal comfort index [17]. Street canyons form basic geometric units [18], and their key properties can be expressed with Hb/Ws values [19]. From the perspective of vegetation configurations, increasing public green space [20], planting street trees [21,22,23], and roof greening [24,25] are considered good solutions to improve the outdoor thermal environment. However, street trees have a better cooling effect than grass and shrubs [22,26], as tree canopies block solar radiation, and reduce the TA in shadowed areas [27]. Meanwhile, transpiration by tree canopies increases environmental humidity [28,29]. Research on street trees mainly concentrates on the tree height [30,31], planting distance [11,32,33], canopy shapes [34,35,36], and green-cover ratios [37,38]. Geometric patterns and vegetation configurations have been proven to induce stronger effects than surface material and water body changes on improving the outdoor thermal environment [39,40]. Additionally, most existing studies have only focused on some factors, e.g., Dbt and Dt [11], or Hb/Ws and Os [41], in different districts and weather conditions [40] when evaluating the outdoor thermal environment. Moreover, the effects of factor interactions on the outdoor thermal environment have also not been analyzed in detail.
Recently, numerous evaluation methods including field measurements [35,42], simulations [21,26,31,32,43], combinations of field measurements and simulations [30,37,44,45,46,47], and scaled models [34,48] have been developed to study and assess the outdoor thermal environment. Toparlar et al. confirmed that 46.7% of research was focused on more than one meteorological parameter measurement [49]. Microclimate models not only contain computational fluid dynamics software, including OpenFORM [50], ANSYS Fluent [51], and ENVI-met [52], but also involve user development programs such as MMRT [53] and COSMO-DCEP [54]. Particularly, ENVI-met is considered suitable for use with appropriate validation in most studies [52], and simulation results show a strong fit with measured values under different geometrical and meteorological conditions [55,56,57,58].
This study aims to comprehensively confirm the order of importance of street canyon factors and evaluate the characteristics of the outdoor thermal environment under heatwaves through field measurements, experimental design, and ENVI-met software. Meanwhile, the impact of factor interactions on the outdoor thermal environment is evaluated using GeoDetector through spatial heterogeneity analysis of the simulated results. Furthermore, this study is anticipated to provide a reference for street planning to regenerate old cities and develop new cities in cases of extremely hot weather conditions.
2. Materials and Methods
2.1. Study Area
Busan (35°05′ N, 128°35′ E), located on the south-easternmost tip of the Korean Peninsula (Figure 1), is the economic, cultural, and educational center of southeast Korea. For this study, Nampodong, Seomyeon, and Centum City were selected as the targeted old, present, and new city-center sites to represent the urban development of Busan.
According to the Köppen–Geiger climate classification, Busan has been classified at the border of Cfa and Cwa zones [59]. Reportedly, the mean annual temperature of Busan is 14.7 °C and its average summer precipitation is 778.7 mm, accounting for 51.2% of the annual precipitation. However, Busan was hit by unprecedented heat in August 2016: the official maximum temperature recorded was 37.3 °C (the highest in 112 years), with a maximum temperature of approximately 40 °C in some areas.
2.2. Field Measurements
2.2.1. Field Measurements of the Three City-Center Sites
To explore the existing street canyons of Busan, 15 representative sites were selected for investigation in the old, current, and new city-center areas. Most of these sites were situated along main streets and contained large commercial, administrative, or official buildings. Based on street geometry, the streets were divided into grids with 20 m spacing in each representative plot. For tree configuration characteristics, the Dbt and Dt were directly measured. Additionally, the Ht was calculated by estimating the top positions of tree crowns projected parallel to a building facade through single-story building height measurements.
The measurement results for the 15 representative sites are presented in Table 1. The buildings around the main streets of Nampodong are primarily low-rise buildings, but the scale of buildings gradually increases towards the newer developed parts of the city. The selected sites were centered on commercial buildings above 6 F. Among them, the Ws of OC4 was the smallest, but the average Hb/Ws was up to 1.3. Streets in the NS and EW directions and the SENW and NESW directions were centered on the south side and north side of Seomyeon, respectively. And most buildings reached heights of 6–12 F. Compared with Nampodong, the building height and Ws values were greater in Seomyeon. As a new part of the city, the heights and scale of buildings in Centum City were significantly higher than those in Nampudong and Seomyeon. The average Hb/Ws of NC2 reached 2.8, and the Ws of NC5 was 67 m. In terms of tree configuration, Nampudong and Seomyeon had fewer street trees, most of which were unevenly distributed on both sides of the main street. To maintain natural lighting for the buildings, the tree crowns were excessively pruned despite the high Ht due to the low Dbt. In contrast, the street trees in Centum City were mainly zelkova trees, evenly distributed on both sides of the street, and had a large Dbt. Additionally, since only shrubs existed in Centum City, which had a weak shading effect, this study did not consider the impact of shrubs.
2.2.2. Scenarios Setting Based on Field Measurement Results
Mainly, the Taguchi method [60] is used to select an appropriate orthogonal array based on design parameters, including control factors and level values, obtain a large amount of data from the least number of experiments, and obtain the degree of influence through ANOVA [61]. This method finds extensive applications in engineering, biology, agriculture, and advertising.
For this study, the L32(49) orthogonal array was used to generate 32 different street canyon scenarios. Generally, an orthogonal array can select up to nine factors with four study parameters; however, only six factors with four parameters were selected for this study. The remaining three unused columns were left empty to verify the correlations between the factors. The selected factors, including the Ws, Os, Hb/Ws, Dbt, Dt, and Ht, were set in an order, as listed in Table 2, based on field measurements and street landscape guidelines from other countries. In addition, the leaf area index is not considered. The level values of the simulation scenario runs were allocated in L32, as presented in Table 3.
For this study, street canyon models were developed based on the street geometry and tree configuration feature characteristics of Busan for outdoor thermal simulation and analysis.
2.3. ENVI-Met Simulation
2.3.1. ENVI-Met Description
Developed by Bruse and Fleer [62], ENVI-met is a widely used prognostic, three-dimensional model software based on CFDs and thermodynamics for modeling air, surface, and vegetation interactions and simulating turbulence, moisture, radiation fluxes, and microclimates in outdoor environments. The analytical model adopts Navier–Stokes equations for wind flow, atmospheric flow turbulence, energy and momentum, and boundary condition parameter calculations [63].
For this study, the model structure and mathematical equations of sub-models provided by Tsoka et al. [64] and Huttner [65] were considered. The high spatiotemporal resolution of ENVI-met provided more precise measurements of the TA, RH, WVEL, mean radiant temperature, and solar radiation, thereby providing a better understanding of microclimate effects on a street-level scale.
2.3.2. Basic Model Description
According to the field measurement results, most of the street lengths between the main intersections were approximately 150 m, with secondary or branch roads between the main intersections. As shown in Figure 2, the main model was sized at 280 × 280 m and the model height was twice the height of the highest building (h = 2Hb), where the street length was set to 154 m. The surrounding area (60–70 m) excluding the core model was set as a buffer zone, and five nesting grids were added outside the model to avoid interference from wind turbulence and unevenly distributed solar radiation accumulating near the street corner within the analysis area. On both sides of the street, 12 building units were set up, and trees were lined in two rows along the street to simplify the simulation. The street tree model was determined based on the field-measured street tree data. In different scenarios, as the Ht changed, the diameter at breast height and trunk height of the street trees were adjusted proportionally. Concrete was used for the building surfaces and sidewalks, while the surface material of the lanes between two rows of street trees comprised asphalt pavement to simulate the impermeable surfaces of the city. The surface material of the buffer zone comprised the same asphalt, whereas concrete was used for the remaining blocks.
Data collected from a height of 1.4 m above the ground were used as the output data. The analysis area was located in the pedestrian section between the facades of two middle building units and lanes. The average analysis area value in each scenario was considered for further data analysis. Data analysis mainly included the TA, WVEL, MRT, and PET. The PET was calculated using BIO-met, and the input parameters used default values.
The climatic conditions of Busan from 13 August to 14 August 2016, which were the hottest days of that summer, were selected for simulation to investigate the street geometry and tree configuration and configure an acceptable outdoor thermal environment. The results from 14 August 2016 were selected for analysis and to ensure a stable state for all components and obtain accurate results. The necessary input parameters for the ENVI-met simulation are listed in Table 4, while the TA and RH data for full forcing in the simulation using data from the Busan meteorological station are listed in Table 5.
2.3.3. Simulation Verification
A portable weather station was set at 1.4–1.6 m above the pavement on a mobile cart to measure the log ambient TA, RH, and WVEL (Figure 3). The instrument parameters are listed in Table 6. Using the “Stop-and-Go” method [66], the mobile cart was moved as quickly as possible between monitoring points, where it was stationed at each point for 1 min, and recorded data after 1 min. This process was repeated for four monitoring points in each area during the measurement period.
To confirm the simulation’s accuracy, the main streets of Nampodong and Centum City were selected, and the measurement and simulation results were compared. The selected areas of Nampodong and Centum City were 260 × 160 m and 380 × 320 m, respectively. For the street geometry and tree configuration, we referred to OC3 and NC5 as the representative sites. Pavements in Nampodong mainly comprised asphalt and cement bricks, while those in Centum City used asphalt, granite bricks, and cement bricks. Table 7 shows the monitoring point locations in the verification area. Meteorological data from the ASOS were used to provide lateral boundary conditions for the simulation. Nampodong was close to the weather station, while Centum City was far away. Therefore, the validity of the weather station data used for this thermal environment research could be tested.
Field measurements were conducted in Centum City and Nampodong from 06:00 to 18:00 on 29 July 2022 and 6 August 2022, respectively. The TA and RH from the ASOS were simulated as full-forcing conditions, while WVEL and wind direction were determined from the average WVEL and dominant wind direction measured during 06:00–18:00. No or few clouds were observed during the measurement period. Details of the input data are presented in Table 8.
To ensure the same sheltering effect between the simulated and actual measurements, a fisheye lens was used to record the SVF values at the monitoring points; we then compared the measured and simulated SVF values, and revised the ENVI-met model (Table 9). After these adjustments, the SVF value calculated from the ENVI-met model was <10% of the measured value for all locations [11,67].
Figure 4 shows the correlations between the simulated and measured TA and RH. They are depicted using two indexes, namely Pearson’s r and the RMSE. Pearson’s r is a statistical measure used to assess the degree of linear correlation between a simulated value and a measured value. The RMSE is employed as a standard index to quantify the deviation between the simulated value and the measured value. The simulation results for Nampodong and Centum City had strong correlations with the measured results. The Pearson’s r of the TA and RH of Nampodong were 0.88 and 0.91, respectively, and the corresponding Pearson’s r values for Centum City were 0.84 and 0.87, respectively; all of these exceed 0.8. The RMSE values for the TA and RH of Nampodong were 1.36 °C and 7.63%, respectively, and these RMSE values for Centum City were 1.18 °C and 5.98%, respectively. Furthermore, based on the field measurement results, the street trees were modeled using the same approach as that described in Section 2.3.2, demonstrating the reliability of applying the street tree model to real-world scenarios.
In actual situations, the TA and RH were affected by complex parameters including cloud cover, wind direction, traffic flow, and heat released from machinery. Thus, the actual measured values fluctuated. The weather station was located in a mountainous area, north of Nampodong. As the surrounding plant coverage and RH were high, the simulated RH value was higher than the actual measured value. The measured TA was relatively higher than the simulated results. Thus, the selected street canyons were assumed to be on the main street, and the vehicle traffic volume had an impact on the TA. Additionally, considering measurement device errors (TA: ±0.5 °C, RH: ±3%), the difference between the actual measured and simulated values was within the allowable error range. Therefore, our simulations using ENVI-met were reliable.
2.4. GeoDetector
2.4.1. GeoDetector Description
Spatial heterogeneity refers to uneven distributions of traits, events, or their relationships across a region [68] or spatial variation in their attributes. The spatial heterogeneity between strata or areas, each comprising a number of units, is referred to as SSH [69].
Wang et al. developed GeoDetector as a new spatial analysis method to detect the interactions of two independent factors with a dependent factor [70]. Detailed explanations are available on the GeoDetector website (http://www.geoDetector.cn/ accessed on 12 December 2023). GeoDetector can be used to separately calculate and compare the q-statistic of a single factor and that of two factors after overlap to determine occurrences of interactions between two factors, the strength and direction of these interactions, and their linearity or non-linearity. For this study, the q-statistic was used to measure the degree of stratified heterogeneity [69], as follows:
where SSW denotes within the sum of squares; SST represents the total sum of squares; N and σ2 denote the unit and population variances; and L denotes the number of strata (h = 1, 2, 3, …, L).
The q-statistic ranges from 0 to 1. The larger the q-statistic, the more obvious the stratified heterogeneity of Y. A q-statistic of “1” implies complete control over the spatial distribution of the dependent variable Y by the independent variable X, whereas a q-statistic of “0” indicates no relationship of the independent variable X with the dependent variable Y. The q-value indicates that X explains q × 100% of the dependent variable Y.
2.4.2. Spatial Heterogeneity Scenario Settings
The Taguchi method was used to obtain the maximum information with the minimum number of experiments. However, considering the interactions between the factors greatly increased the number of experiments and weakened the advantages of the Taguchi method. This study considered 6 factors with a total of 32 scenarios. To evaluate the interactions between the factors, GeoDetector was introduced.
According to the GeoDetector modeling requirements, the selected 32 scenarios were arranged continuously and the factors were divided into 6 layouts. The impact of factor interactions on the TA, WVEL, and PET were analyzed. Similar to the ENVI-met model, the grid size was set to 2 m. In the 32 scenarios, excluding grids adjacent to building facades, the total number of grids was 5600 per stratum. An example of the factor layouts is presented in Figure 5.
3. Results
3.1. Characteristics of the Outdoor Thermal Environment Indices from 08:00 to 18:00
An ANOVA was used to analyze the simulation results of the orthogonal experiments and determine the important effects of factors on the outdoor thermal environment. Considering the lack of solar radiation effects at night and in the morning, changes in the street geometry and tree configuration had less impact on the thermal environment. The selected time frame lasted from 08:00 to 18:00, and the study focused on analyzing data at 13:00, when the TA was the highest.
3.1.1. TA
The hourly changes in TA from 8:00 to 18:00 and the results of the ANOVA are shown in Figure 6 and Table 10. The values of Os and Hb/Ws at all times and Ws after 11:00 were statistically significant (p < 0.01), indicating a strong correlation with the TA. The value of the TA for all factors was minimum at 08:00 and reached a peak at 13:00. The variation range before 13:00 was significantly greater than that after 13:00. At noon, solar radiation was strong, and the absorbed heat from buildings and the ground was released into the air through heat exchange. This had the strongest impact on the TA. Excluding the Os, only slight differences in the change curves at 12:00 and 14:00, 11:00 and 16:00, and 10:00 and 17:00 were observed. The building shadow area increased with Hb/Ws, causing the TA to gradually decrease. Particularly, the difference between Hb/Ws = 0.5 and 1.5 was the most apparent. A similar phenomenon was demonstrated by Morakinyo and Lam [31]. The increase in TA before and after the time of a street’s exposure to direct sunlight was higher than at other times (SENW was affected by direct sunlight from 10:00 to 12:00, and the change there was higher than that in other streets that were not exposed to direct sunlight). Compared with other Os values, the NS street was affected by direct sunlight at 13:00, causing heating and resulting in the highest TA. Although the SENW street was already affected by direct sunlight, its WVEL was slightly higher than that of the EW streets (see Section 3.2.2), resulting in a lower TA for SENW due to the greater intensity of convective heat transfer taking away more heat. Additionally, the WVEL increased with the gradual increases in WS, reducing the TA by enhancing the convective heat transfer intensity.
The improvement effect of tree configuration on the TA was limited. Particularly, the Dt at all times and the Ht from 10:00 to 15:00 were statistically significant (p < 0.05). The results confirmed that smaller Dt and higher Ht values had stronger cooling effects. Similar results were reported in research on a shallow street canyon [31]. The statistical significance and changing trend of Dbt were different from the results of Li et al. [11] due to different solar radiation and climatic conditions.
The differences between the maximum and minimum TA values at each time frame are shown in Figure 7. The maximum values of Os and Hb/Ws both exceeded 1.0 °C, with Hb/Ws exceeding 1 °C for as long as 8 h and the maximum difference reaching 2.7 °C. Although the Ws was lower compared with the Os and Hb/Ws, it was significantly higher than the three factors of tree configuration. Under heatwave conditions, the transpiration of the street trees became weak and the stomata on some leaf surfaces remained close, resulting in a relatively weak effect of changes on improving the TA. Yang and Lam [71] proved that the median value of the improvement in TA caused by ground greening was approximately 0.65 °C, and the maximum value did not exceed 1 °C.
3.1.2. WVEL
The changes in WVEL from 8:00 to 18:00 are shown in Figure 8. Since the WVEL and wind direction were not forced, the changes in WVEL at different times and scenarios were small, with a maximum of no more than 0.2 m/s. Conversely, the WVEL change trends for different factors at different times were the same. Therefore, only the data at 13:00 (typical time) were analyzed for significance, and the differences in the impacts of factor changes on the WVEL were calculated (Table 11). Changes in Os, Ws, and Hb/Ws had significant effects on the WVEL (p < 0.01), and all differences were of 0.5 m/s. The input wind direction was S–SW, and the angles between the wind direction and Os were 20°, 25°, 70°, and 65° in sequence; the smaller the angle, the higher the WVEL. The larger the Ws, the smaller the resistance encountered by the wind flow when passing through the street, and the higher the WVEL. When Hb/Ws was <1.5, the street canyon had a significant acceleration effect on the WVEL. When Hb/Ws exceeded 1.5, the WVEL decreased initially and then increased owing to the effect of downward wind.
Although the impact of tree configuration changes on the WVEL was not significant (p > 0.05), wind resistance decreased with the increase in Dbt, Dt, and Ht, thereby increasing the WVEL. Particularly, a linear growth was observed for both the Dbt and Dt. The increase in Dbt had a stronger effect, reaching 0.3 m/s, followed by the increases in Dt and Ht, which reached 0.2 and 0.1 m/s, respectively. Furthermore, when the Ht was 9 m, the WVEL suddenly dropped due to turbulence or composite interaction between factors that affected the simulation results; when the Ht exceeded 12 m, the amount of space under the tree canopies was higher, and the impact of changes in the Ht on the WVEL slowly reduced.
3.1.3. PET
The hourly results for the PET changes and ANOVA from 8:00 to 18:00 are shown in Figure 9 and Table 12. The impact of street geometry factors was statistically significant between 9:00 and 10:00 and between 12:00 and 16:00 (p < 0.05). Particularly, Hb/Ws was statistically significant (p = 0.000) at all times, indicating a significant impact of Hb/Ws. The PET value exceeded the “Very hot” standard of thermal sensitivity level during 12:00–15:00. The NS street reached the highest PET value at 14:00. The “Very hot” level of the EW street lasted 8 h, which was 2 h longer than the other orientations. The shadow of buildings reduced the PET, and radiation from the sun had a weak impact in the deep street canyons. Hb/Ws = 0.5 was greatly affected by solar radiation, and the PET rose the fastest, reaching its highest value at 13:00. From the perspective of the thermal sensitivity level, the duration of the “Very hot” level was 8 h, 5 h, 5 h, and 4 h, respectively. With the increase in Ws, the WVEL was enhanced, and more heat on the street was taken away to improve thermal comfort.
Among the tree configuration factors, the Dt was significantly affected within 08:00–09:00 and 13:00–18:00, which had a significant impact on the PET (p < 0.05). The significance of the Ht at 10:00, 13:00, and 14:00 was maintained within 0.05, but its impact at 13:00 was the greatest (p < 0.01). Additionally, although the impact of the Dbt was not significant, it linearly increased. During 11:00–14:00, the value of Dbt = 5 m was reduced by a maximum of 1.3 °C. The overall trend of the research results for the Dbt and Ht in Yang et al.’s study [30] was similar to the results found in this study. When the Dt increased from 12 to 16 m, the PET value declined because the large distance reduced wind resistance and increased the WVEL. WVEL was one of the main factors that affected the PET. A smaller value of Dt and a larger value of Ht could cause the tree crowns to overlap, covering the streets from direct solar radiation, and reduce the PET at the pedestrian height.
The hourly differences between maximum and minimum values from 8:00 to 18:00 are shown in Figure 10. At 08:00, 11:00, 14:00, and 17:00, the change in PET was very large due to the direct sun exposure on the EW, SENW, and NESW streets. The PET value in all orientations was greatly enhanced due to the high solar elevation angle at noon, and the difference was decreased. At 14:00, the improvement of Hb/Ws was approximately 2.3 times that of the Ws, and the change between 08:00 and 17:00 was relatively large. Particularly, the impact of the change in Hb/Ws on the PET was largest at 14:00, with a maximum value of 10.2 °C. Considering changes in Ws, the variable levels of PET were 4.3 and 4.5 °C at 11:00 and 14:00. Additionally, in the morning, the trees blocked solar radiation through their canopies and reduced the PET value. At noon and in the afternoon, the canopies weakened the radiation capacity. Simultaneously, the canopies released a certain amount of longwave radiation, which further weakened the cooling effect.
3.2. Analysis of Interactions
For the spatial heterogeneity analysis, six factors were used, with each factor acting as an independent variable X and the evaluating indicator (including TA, WVEL, and PET) acting as the dependent variable Y. The q-statistic of any two factor interactions was greater than the sum of the q-statistic of two independent factors. Thus, the explanation of the evaluating indicator (Y) was enhanced. Furthermore, both the independent and dependent variables showed a non-linear enhancement trend. The TA, WVEL, and PET between 8:00 and 18:00 were analyzed.
3.2.1. TA
The q-statistics regarding the impacts of interactions between two factors on the TA from 8:00 to 18:00 are shown in Figure 11. The q-statistics of Os∩Ws, Os∩Hb/Ws, and Ws∩Hb/Ws all reached 0.7 or more at 11:00, and reached their maximum values at 16:00 and 18:00, respectively. Thus, probabilities of 89.2%, 87.1%, and 89.1% were calculated for the TA being affected through interactions between the Os and Ws, between the Os and Hb/Ws, and between the Ws and Hb/Ws. Considering the interactions of street geometry factors and tree configuration factors, the interaction of Hb/Ws and tree configuration factors was always higher than that of the other two factors and tree configuration factors. Particularly, the interaction of Hb/Ws and tree configuration factors showed a higher probability (q-statistic ≥ 0.709) for the TA after 14:00, and the q-statistic of Hb/Ws∩Ht reached 0.803 at 18:00. The impact of Os∩Dt on the TA between 13:00 and 18:00 gradually increased (q-statistic ≥ 0.614), and this q-statistic was less for Os∩Dbt and Os∩Ht. Regarding the interactions of tree configuration factors, the q-statistics of Dbt∩Ht and Dt∩Ht were significantly higher than that of Dbt∩Dt. Additionally, interactions between the same factors (such as Os∩Os) represented a spatial autocorrelation of that factor. In this study, the q-statistic of Hb/Ws was between 0.347 and 0.745, showing a strong spatial autocorrelation.
3.2.2. WVEL
The q-statistics regarding the impacts of interactions between two factors on the WVEL from 8:00 to 18:00 are shown in Figure 12. In general, the interactions of all factors had a relatively low impact on the WVEL (q-statistic < 0.3).
3.2.3. PET
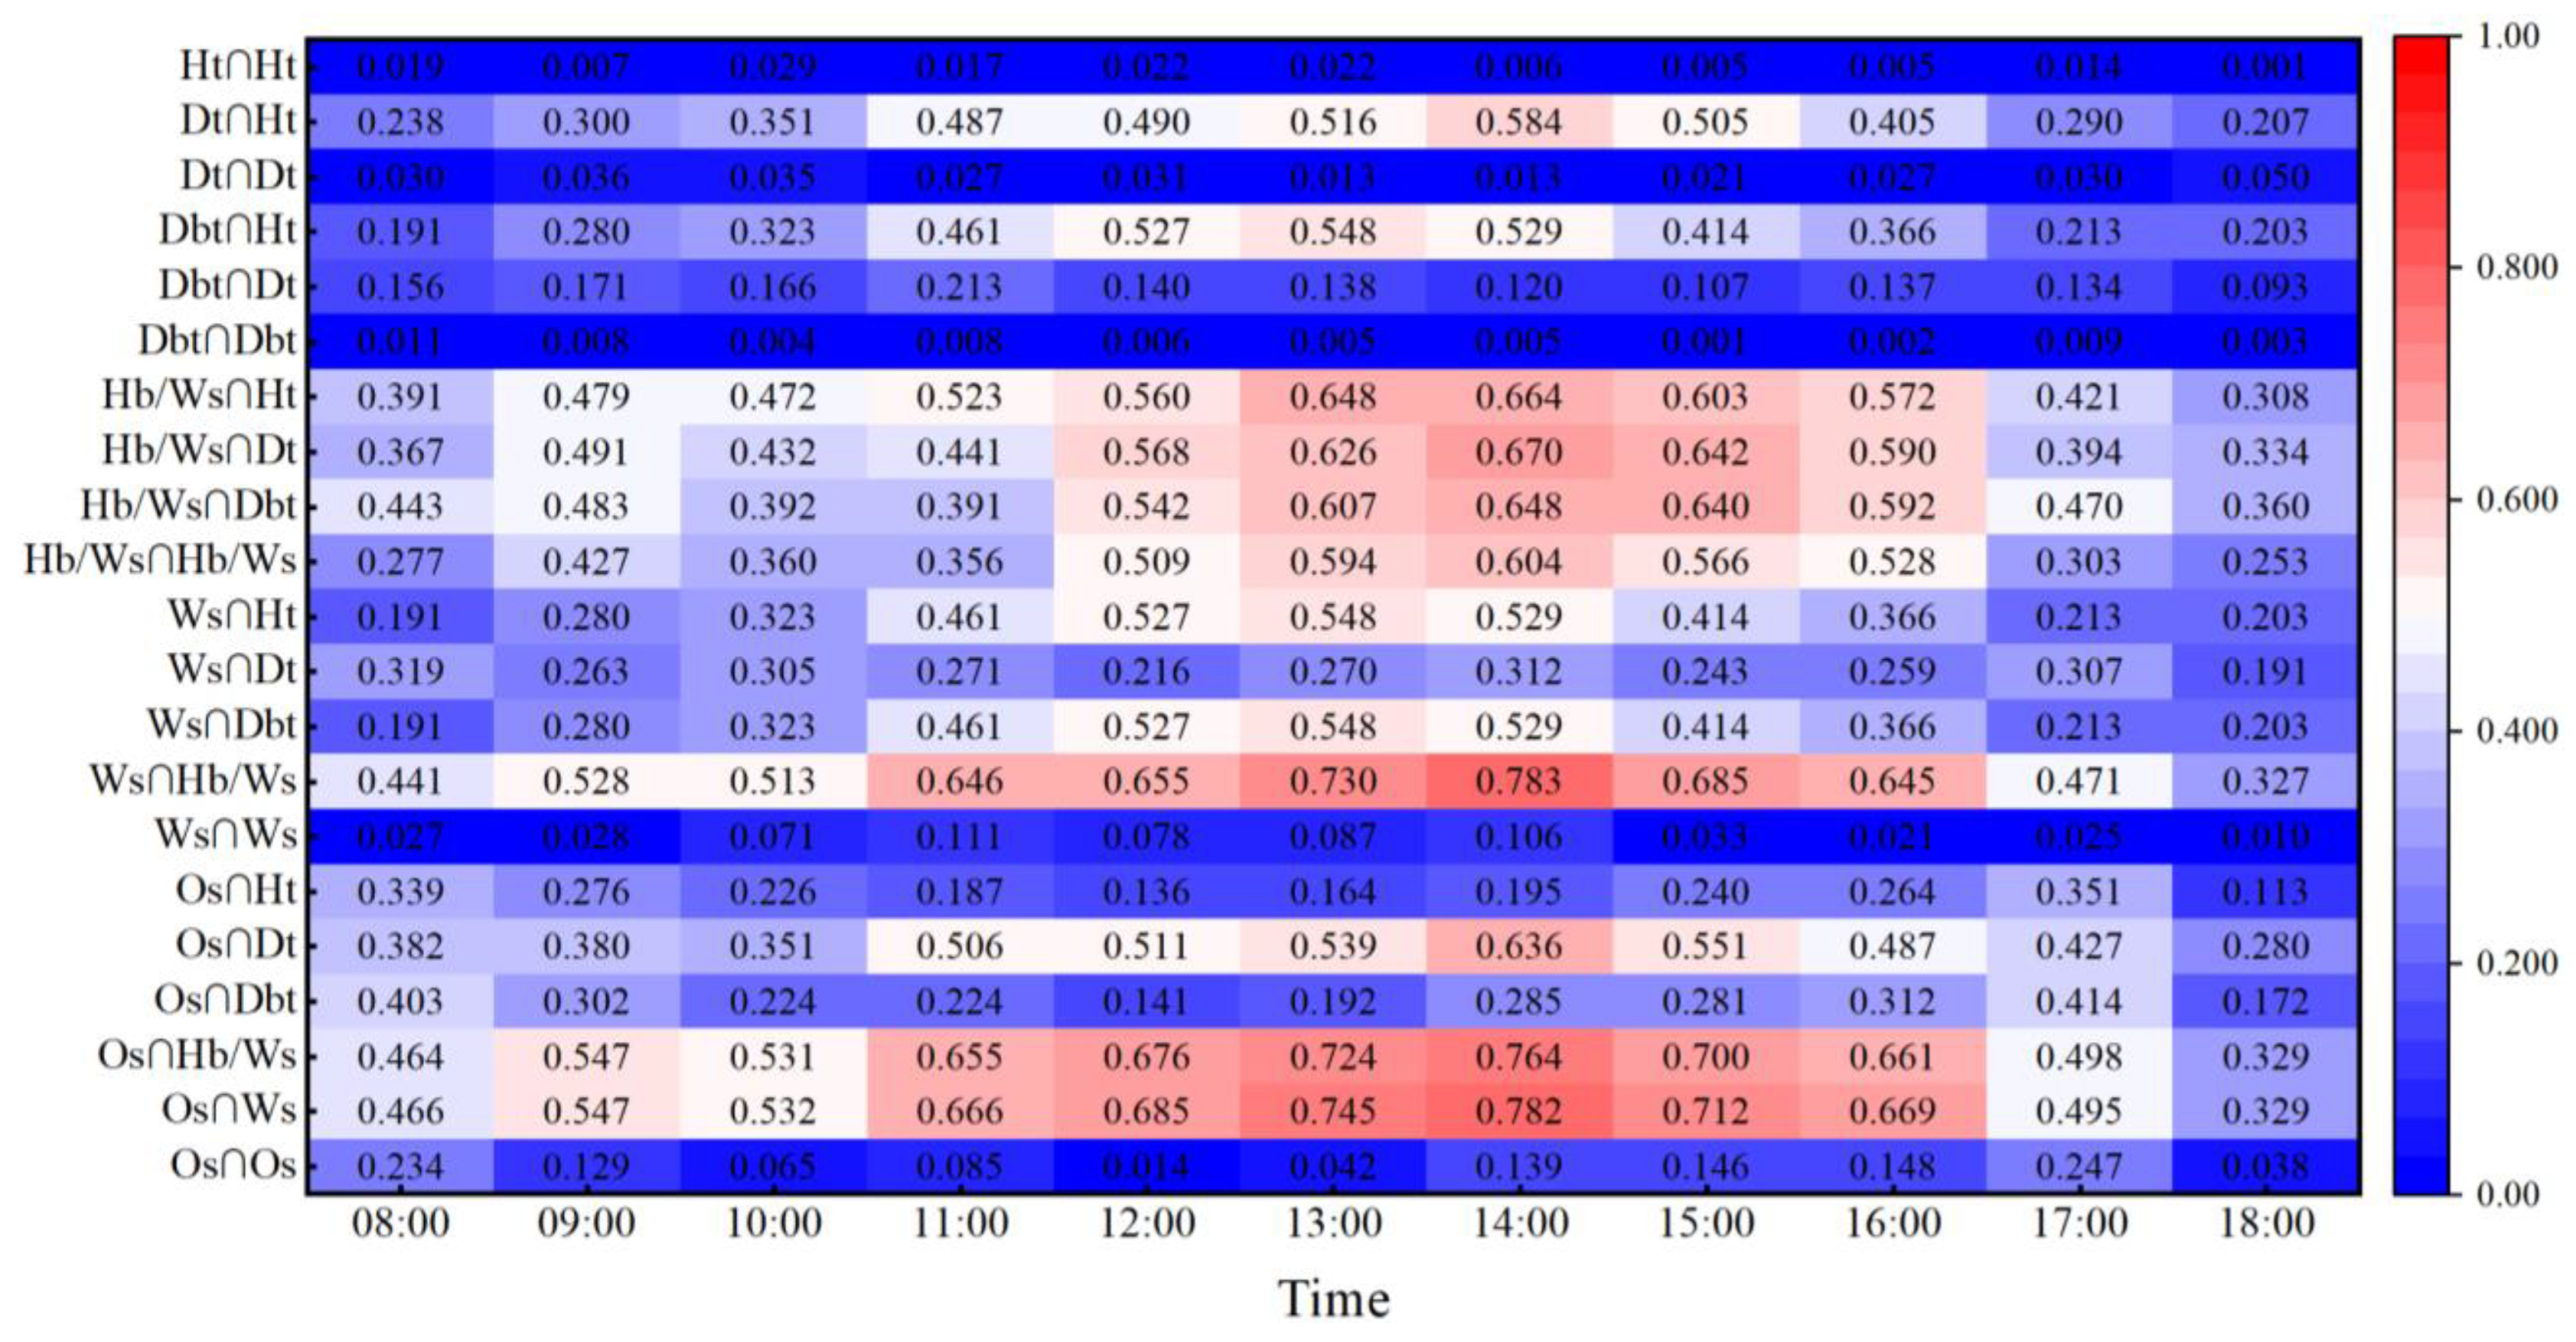
The q-statistics regarding the impacts of interactions between two factors on the PET from 8:00 to 18:00 are shown in Figure 13. The q-statistic of the interaction between any two factors of street geometry was the highest. For example, the q-statistic distribution range during 11:00–16:00 was 0.645–0.783. The maximum value was attained at 14:00, where Os∩Ws, Os∩Hb/Ws, and Ws∩Hb/Ws were 0.782, 0.764, and 0.783, respectively. Considering the interactions of street geometry and tree configuration factors, Hb/Ws showed a leading role, and Hb/Ws∩Dt was as high as 0.588 at 14:00. Additionally, the interactions significantly affected the PET at noon and during the afternoon. The q-statistic distribution trend of interactions between the tree configuration factors was the same as the previous two aspects, but the q-statistic was relatively low.
4. Discussion
The main aim behind the establishment of outdoor thermal environment models is to identify and improve solutions to existing problems [72]. When considering frequent heatwaves, a variety of factors should be combined to analyze the interactive relationship between factors. For example, to improve the wind environment [73], the main orientations [41], main building morphology [74], and landscape planning [75,76] should be studied.
In terms of street geometry, the effects of interactions between geometric factors on the outdoor thermal environment should be fully considered. Although a deep street canyon can prevent heat dissipation at night [77], the shelter from adjacent buildings during the day can prevent solar radiation from reaching the pedestrian area, improving comfort and reducing the importance of the tree configuration in the deep street canyon. Compared with other orientations, EW streets are exposed to solar radiation for longer durations. Andreou reported that the thermal comfort efficiency of Hb/Ws, which was increased for EW streets, was lower for NS streets [78]. At noon and in the afternoon, due to a high solar elevation angle and directly lit NS and NESW streets, the PET was significantly higher than that in the EW and SENW streets. Thus, the orientation of streets should be consistent with the wind direction in the city and wide enough to assist in air inflow and increase heat dissipation from the street canyon. Ventilation corridors can be merged with the main streets to arrange high-rise buildings along the streets. Each block should set up building setback lines to obtain enhanced Ws. Compared to scenarios without building setbacks, scenarios with building setbacks can increase the WVEL by 0.7 m/s at maximum [79]. Additionally, TA can be affected by the surrounding streets. Different streets can partially compensate a high TA in other streets [80]. When streets are arranged vertically in the direction of the wind, the vertical wind along the street length should be reduced by controlling the morphological parameters of the blocks and adjusting the geometry of the main streets and the surrounding building patterns. To avoid forming a stable canyon vortex, the average value of Hb/Ws should be <0.7 [18].
Shallow street canyons have high demands for shading, giving particular importance to the tree configuration. In terms of tree configuration, smaller Dt and larger Ht values offer solar radiation blocking and improve outdoor thermal comfort. However, the cost of mature trees is high. Thus, young trees that grow quickly and the development of temporary shade facilities in combination with these young trees can be implemented. After the trees have matured, the temporary shade facilities can be demolished. Considering the interactions between Dt and Ht, densely staggered canopies should be avoided. In the low-WVEL scenario (initial WVEL = 0.7 m/s), there was a trend of the TA increasing when the Ht increased from 5 m to 11 m. The WVEL exhibited changes when the Ht increased from 5 m to 8 m, and the changes in WVEL became more gradual when the Ht exceeded 8 m, but the thermal comfort index was not analyzed in this study [81]. In this study, 12 m high trees showed more obvious improvements in thermal comfort, which may be attributed to the combined effect of the TA and WVEL. The value of Dbt in SENW streets can be appropriately increased to increase the WVEL and improve thermal comfort. In addition, each city has a unique type and combination of street trees, but cylindrical canopies can be more effective than spherical and conical canopies of the same height and diameter [82]. For trees with fruits such as ginkgo trees, a tree shaker can be introduced. A combination of street trees and shrubs can be implemented to reduce pollution in lanes and pedestrian areas on the streets with enough space [83].
This study demonstrates that during the process of urban regeneration, the layout of street trees should be considered as a crucial factor. The selection of the street tree species and configuration should be adapted to the characteristics of different neighborhoods to create a comfortable walking environment. In the development of new cities, building morphology and layout should be a key consideration. Urban planners can formulate design standards for neighborhood buildings that take into account multiple factors to create a pleasant outdoor thermal environment in cities.
This study used numerical simulation software to build an ideal urban street canyon, without considering transportation effects. Expanding the scale of research objects, combined with satellite images, numerical weather forecasting, and other methods, is necessary to study the outdoor thermal environment of cities under actual conditions.
5. Conclusions
This study measures street geometry and street tree configuration considering the Busan city center as an example, and typification analysis is performed. The Taguchi method is introduced to generate 32 typical scenarios, and a numerical simulation of the outdoor thermal environment is conducted through ENVI-met. An ANOVA is used to determine the importance of six factors in relation to the outdoor thermal environment. GeoDetector is introduced to assess interactions between the factors for spatial heterogeneity analysis. The main results are as follows:
- The impact of street geometry on the outdoor thermal environment is significantly higher than that of tree configuration factors. The impacts of street geometry and tree configuration are significantly higher at noon. The importance of street canyon factors in the improvement of outdoor thermal comfort in Busan is as follows: Hb/Ws > Os > Ws > Dt > Ht > Dbt. Particularly, Hb/Ws has the most significant impact on the outdoor thermal environment. The higher the adjacent buildings, the greater the Hb/Ws near the ground-level buildings and street surface. By reducing solar radiation absorption and the release of heat, the TA, MRT, and PET can be reduced. Changes in Hb/Ws can reduce the “Very hot” level for up to 4 h.
- The SENW street is shadowed during the afternoon, effectively reducing the TA and solar radiation on the pedestrian area and offering relatively high thermal comfort. EW streets are directly exposed to the sun after sunrise and before sunset. Thus, MRT and PET values are the highest, and the “Hot” and “Very hot” periods are longer. Improvements to the outdoor thermal environment by improving tree configurations or implementing additional infrastructure are important.
- Shallow street canyons need additional greening to improve their outdoor thermal environment. The tree crowns absorb solar radiation in the morning and reach a saturation state. Thereafter, the decreased radiant heat and the heat from artificial surface reflections together affect the outdoor thermal environment around pedestrian areas at noon and in the afternoon. Smaller Dt and larger Ht values have a significant impact on the outdoor thermal environment, but the impact of the tree settings on street wind resistance should be comprehensively considered. When the tree height is >12 m, the impact on the TA, MRT, and PET is reduced.
- The impact of interactions between any two factors of street geometry on the outdoor thermal environment is much higher than that of interactions between the street geometry and tree configuration factors, or that of interactions between tree configuration factors. Particularly, the interactions between two factors have a small impact on the WVEL, but have a greater impact on the TA, MRT, and PET. The impact of interactions between street geometry factors on the TA gradually strengthens over time, reaching its highest level (approximately 89%) at 18:00. The impact of interactions between Hb/Ws and tree configuration factors on the outdoor thermal environment indicators reaches its highest at 14:00 or 15:00. Additionally, Hb/Ws has a strong spatial autocorrelation with the TA.
This study provides significant insights for urban planners on how different street geometries and tree configurations can influence the outdoor thermal environment. Although none of these scenarios can reverse the long-term effects of global warming, rigorously applying various combinations of these strategies can moderate extreme climate events and accelerate the establishment of sustainable cities.
Author Contributions
Conceptualization, J.W. and S.Y.; methodology, J.W. and S.Y.; software, J.W.; validation, S.Y.; formal analysis, J.W. and S.Y.; investigation, J.W. and S.Y.; resources, J.W.; data curation, J.W.; writing—original draft preparation, J.W., Y.W., S.L. and Q.W.; writing—review and editing, J.W., Y.W., S.L., Q.W., T.L. and S.Y.; visualization, J.W.; supervision, S.Y.; project administration, S.Y.; funding acquisition, J.W. and S.Y. All authors have read and agreed to the published version of the manuscript.
Funding
This research was supported by the National Research Foundation of Korea (NRF) grant funded by the Korea government (MSIT) (No. RS-2023-00218875); Korea Ministry of Environment (MOE) as Graduate School specialized in Climate Change; National Research Foundation (NRF), Korea, under project BK21 FOUR; 2023 BK21 FOUR Program of Pusan National University; Technological Innovation Project of China Architecture Design & Research Group (1100C080230090); National Key R&D Program of China (2023YFC3805400).
Data Availability Statement
Data are available on request from the authors.
Conflicts of Interest
The authors declare no conflicts of interest.
Abbreviations
| Cfa: | humid subtropical climate | SVF: | sky view factor |
| Cwa: | dry-winter humid subtropical climate | Pearson’s r: | Pearson’s correlation coefficient |
| ASOS: | automated surface observing system | RMSE: | root-mean-square error |
| Ws: | street width | TA: | air temperature |
| Os: | street orientation | RH: | relative humidity |
| Hb/Ws: | the ratio of building height to street width | WVEL: | wind velocity |
| Dbt: | distance between buildings and trees | ANOVA: | analysis of variance |
| Dt: | planting distance | PET: | physiological equivalent temperature |
| Ht: | tree height | SSH: | spatial stratified heterogeneity |
References
- The World Bank Urban Development. Available online: https://www.worldbank.org/en/topic/urbandevelopment/overview (accessed on 18 January 2023).
- Kim, H.; Jung, Y.; Oh, J.I. Transformation of Urban Heat Island in the Three-Center City of Seoul, South Korea: The Role of Master Plans. Land Use Policy 2019, 86, 328–338. [Google Scholar] [CrossRef]
- Kim, G.; Lee, J.; Lee, M.-I.; Kim, D. Impacts of Urbanization on Atmospheric Circulation and Aerosol Transport in a Coastal Environment Simulated by the WRF-Chem Coupled with Urban Canopy Model. Atmos. Environ. 2021, 249, 118253. [Google Scholar] [CrossRef]
- Wang, D.; Lau, K.K.-L.; Ren, C.; Goggins, W.B.I.; Shi, Y.; Ho, H.C.; Lee, T.-C.; Lee, L.-S.; Woo, J.; Ng, E. The Impact of Extremely Hot Weather Events on All-Cause Mortality in a Highly Urbanized and Densely Populated Subtropical City: A 10-Year Time-Series Study (2006–2015). Sci. Total Environ. 2019, 690, 923–931. [Google Scholar] [CrossRef] [PubMed]
- Hammond, M.J.; Chen, A.S.; Djordjević, S.; Butler, D.; Mark, O. Urban Flood Impact Assessment: A State-of-the-Art Review. Urban Water J. 2015, 12, 14–29. [Google Scholar] [CrossRef]
- McMichael, A.J.; Woodruff, R.E.; Hales, S. Climate Change and Human Health: Present and Future Risks. Lancet 2006, 367, 859–869. [Google Scholar] [CrossRef] [PubMed]
- Chaseling, G.K.; Iglesies-Grau, J.; Juneau, M.; Nigam, A.; Kaiser, D.; Gagnon, D. Extreme Heat and Cardiovascular Health: What a Cardiovascular Health Professional Should Know. Can. J. Cardiol. 2021, 37, 1828–1836. [Google Scholar] [CrossRef] [PubMed]
- Grimm, N.B.; Chapin III, F.S.; Bierwagen, B.; Gonzalez, P.; Groffman, P.M.; Luo, Y.; Melton, F.; Nadelhoffer, K.; Pairis, A.; Raymond, P.A.; et al. The Impacts of Climate Change on Ecosystem Structure and Function. Front. Ecol. Environ. 2013, 11, 474–482. [Google Scholar] [CrossRef]
- National Association of City. Transportation Officials Urban Street Design Guide; Island Press: Washington, DC, USA, 2013; ISBN 978-1-61091-534-2. [Google Scholar]
- Gehl, J. Life Between Buildings: Using Public Space, 6th ed.; Island Press: Washington, DC, USA, 2011; ISBN 978-1-59726-827-1. [Google Scholar]
- Li, G.; Ren, Z.; Zhan, C. Sky View Factor-Based Correlation of Landscape Morphology and the Thermal Environment of Street Canyons: A Case Study of Harbin, China. Build. Environ. 2020, 169, 106587. [Google Scholar] [CrossRef]
- Chen, L.; Ng, E. Outdoor Thermal Comfort and Outdoor Activities: A Review of Research in the Past Decade. Cities 2012, 29, 118–125. [Google Scholar] [CrossRef]
- Binarti, F.; Koerniawan, M.D.; Triyadi, S.; Utami, S.S.; Matzarakis, A. A Review of Outdoor Thermal Comfort Indices and Neutral Ranges for Hot-Humid Regions. Urban Clim. 2020, 31, 100531. [Google Scholar] [CrossRef]
- Fanger, P.O. Thermal Comfort: Analysis and Applications in Environmental Engineering; Danish Technical Press: København, Denmark, 1970; ISBN 978-87-571-0341-0. [Google Scholar]
- Höppe, P. The Physiological Equivalent Temperature–A Universal Index for the Biometeorological Assessment of the Thermal Environment. Int. J. Biometeorol. 1999, 43, 71–75. [Google Scholar] [CrossRef] [PubMed]
- Fiala, D.; Lomas, K.J.; Stohrer, M. Computer Prediction of Human Thermoregulatory and Temperature Responses to a Wide Range of Environmental Conditions. Int. J. Biometeorol. 2001, 45, 143–159. [Google Scholar] [CrossRef] [PubMed]
- Fischereit, J.; Schlünzen, K.H. Evaluation of Thermal Indices for Their Applicability in Obstacle-Resolving Meteorology Models. Int. J. Biometeorol. 2018, 62, 1887–1900. [Google Scholar] [CrossRef] [PubMed]
- Oke, T.R. Street Design and Urban Canopy Layer Climate. Energy Build. 1988, 11, 103–113. [Google Scholar] [CrossRef]
- Takebayashi, H.; Moriyama, M. Relationships between the Properties of an Urban Street Canyon and Its Radiant Environment: Introduction of Appropriate Urban Heat Island Mitigation Technologies. Sol. Energy 2012, 86, 2255–2262. [Google Scholar] [CrossRef]
- Yao, L.; Li, T.; Xu, M.; Xu, Y. How the Landscape Features of Urban Green Space Impact Seasonal Land Surface Temperatures at a City-Block-Scale: An Urban Heat Island Study in Beijing, China. Urban For. Urban Green. 2020, 52, 126704. [Google Scholar] [CrossRef]
- Bochenek, A.D.; Klemm, K. Effectiveness of Tree Pattern in Street Canyons on Thermal Conditions and Human Comfort. Assessment of an Urban Renewal Project in Historical District in Lodz (Poland). Atmosphere 2021, 12, 751. [Google Scholar] [CrossRef]
- Huang, Z.; Wu, C.; Teng, M.; Lin, Y. Impacts of Tree Canopy Cover on Microclimate and Human Thermal Comfort in a Shallow Street Canyon in Wuhan, China. Atmosphere 2020, 11, 588. [Google Scholar] [CrossRef]
- Kang, G.; Kim, J.-J.; Choi, W. Computational Fluid Dynamics Simulation of Tree Effects on Pedestrian Wind Comfort in an Urban Area. Sustain. Cities Soc. 2020, 56, 102086. [Google Scholar] [CrossRef]
- Jamei, E.; Chau, H.W.; Seyedmahmoudian, M.; Stojcevski, A. Review on the Cooling Potential of Green Roofs in Different Climates. Sci. Total Environ. 2021, 791, 148407. [Google Scholar] [CrossRef]
- Chatzinikolaou, E.; Chalkias, C.; Dimopoulou, E. Urban microclimate improvement using envi-met climate model. Int. Arch. Photogramm. Remote Sens. Spat. Inf. Sci. 2018, XLII–4, 69–76. [Google Scholar] [CrossRef]
- Rui, L.; Buccolieri, R.; Gao, Z.; Ding, W.; Shen, J. The Impact of Green Space Layouts on Microclimate and Air Quality in Residential Districts of Nanjing, China. Forests 2018, 9, 224. [Google Scholar] [CrossRef]
- Li, K.; Li, X.; Yao, K. Outdoor Thermal Environments of Main Types of Urban Areas during Summer: A Field Study in Wuhan, China. Sustainability 2022, 14, 952. [Google Scholar] [CrossRef]
- Fabbri, K.; Ugolini, A.; Iacovella, A.; Bianchi, A.P. The Effect of Vegetation in Outdoor Thermal Comfort in Archaeological Area in Urban Context. Build. Environ. 2020, 175, 106816. [Google Scholar] [CrossRef]
- Elbondira, T.A.; Tokimatsu, K.; Asawa, T.; Ibrahim, M.G. Impact of Neighborhood Spatial Characteristics on the Microclimate in a Hot Arid Climate–A Field Based Study. Sustain. Cities Soc. 2021, 75, 103273. [Google Scholar] [CrossRef]
- Yang, Y.; Zhou, D.; Gao, W.; Zhang, Z.; Chen, W.; Peng, W. Simulation on the Impacts of the Street Tree Pattern on Built Summer Thermal Comfort in Cold Region of China. Sustain. Cities Soc. 2018, 37, 563–580. [Google Scholar] [CrossRef]
- Morakinyo, T.E.; Lam, Y.F. Simulation Study on the Impact of Tree-Configuration, Planting Pattern and Wind Condition on Street-Canyon’s Micro-Climate and Thermal Comfort. Build. Environ. 2016, 103, 262–275. [Google Scholar] [CrossRef]
- Wu, J.; Chang, H.; Yoon, S. Numerical Study on Microclimate and Outdoor Thermal Comfort of Street Canyon Typology in Extremely Hot Weather—A Case Study of Busan, South Korea. Atmosphere 2022, 13, 307. [Google Scholar] [CrossRef]
- Thom, J.K.; Coutts, A.M.; Broadbent, A.M.; Tapper, N.J. The Influence of Increasing Tree Cover on Mean Radiant Temperature across a Mixed Development Suburb in Adelaide, Australia. Urban For. Urban Green. 2016, 20, 233–242. [Google Scholar] [CrossRef]
- Chen, T.; Yang, H.; Chen, G.; Lam, C.K.C.; Hang, J.; Wang, X.; Liu, Y.; Ling, H. Integrated Impacts of Tree Planting and Aspect Ratios on Thermal Environment in Street Canyons by Scaled Outdoor Experiments. Sci. Total Environ. 2021, 764, 142920. [Google Scholar] [CrossRef]
- Sanusi, R.; Johnstone, D.; May, P.; Livesley, S.J. Microclimate Benefits That Different Street Tree Species Provide to Sidewalk Pedestrians Relate to Differences in Plant Area Index. Landsc. Urban Plan. 2017, 157, 502–511. [Google Scholar] [CrossRef]
- de Abreu-Harbich, L.V.; Labaki, L.C.; Matzarakis, A. Effect of Tree Planting Design and Tree Species on Human Thermal Comfort in the Tropics. Landsc. Urban Plan. 2015, 138, 99–109. [Google Scholar] [CrossRef]
- Jamei, E.; Rajagopalan, P. Urban Development and Pedestrian Thermal Comfort in Melbourne. Sol. Energy 2017, 144, 681–698. [Google Scholar] [CrossRef]
- Morakinyo, T.E.; Lau, K.K.-L.; Ren, C.; Ng, E. Performance of Hong Kong’s Common Trees Species for Outdoor Temperature Regulation, Thermal Comfort and Energy Saving. Build. Environ. 2018, 137, 157–170. [Google Scholar] [CrossRef]
- Wu, J. Analysis of Microclimate and Thermal Comfort Based on Changes of Street Canyon Pattern in Urban Center; Pusan National University: Busan, Republic of Korea, 2023. [Google Scholar]
- Lai, D.; Liu, W.; Gan, T.; Liu, K.; Chen, Q. A Review of Mitigating Strategies to Improve the Thermal Environment and Thermal Comfort in Urban Outdoor Spaces. Sci. Total Environ. 2019, 661, 337–353. [Google Scholar] [CrossRef] [PubMed]
- Deng, J.-Y.; Wong, N.H. Impact of Urban Canyon Geometries on Outdoor Thermal Comfort in Central Business Districts. Sustain. Cities Soc. 2020, 53, 101966. [Google Scholar] [CrossRef]
- Wang, Y.; Bakker, F.; de Groot, R.; Wörtche, H.; Leemans, R. Effects of Urban Green Infrastructure (UGI) on Local Outdoor Microclimate during the Growing Season. Env. Monit. Assess 2015, 187, 732. [Google Scholar] [CrossRef]
- McRae, I.; Freedman, F.; Rivera, A.; Li, X.; Dou, J.; Cruz, I.; Ren, C.; Dronova, I.; Fraker, H.; Bornstein, R. Integration of the WUDAPT, WRF, and ENVI-Met Models to Simulate Extreme Daytime Temperature Mitigation Strategies in San Jose, California. Build. Environ. 2020, 184, 107180. [Google Scholar] [CrossRef]
- Bartesaghi-Koc, C.; Haddad, S.; Pignatta, G.; Paolini, R.; Prasad, D.; Santamouris, M. Can Urban Heat Be Mitigated in a Single Urban Street? Monitoring, Strategies, and Performance Results from a Real Scale Redevelopment Project. Sol. Energy 2021, 216, 564–588. [Google Scholar] [CrossRef]
- Labdaoui, K.; Mazouz, S.; Moeinaddini, M.; Cools, M.; Teller, J. The Street Walkability and Thermal Comfort Index (SWTCI): A New Assessment Tool Combining Street Design Measurements and Thermal Comfort. Sci. Total Environ. 2021, 795, 148663. [Google Scholar] [CrossRef]
- Muniz-Gäal, L.P.; Pezzuto, C.C.; de Carvalho, M.F.H.; Mota, L.T.M. Urban Geometry and the Microclimate of Street Canyons in Tropical Climate. Build. Environ. 2020, 169, 106547. [Google Scholar] [CrossRef]
- Jia, S.; Wang, Y. Effect of Heat Mitigation Strategies on Thermal Environment, Thermal Comfort, and Walkability: A Case Study in Hong Kong. Build. Environ. 2021, 201, 107988. [Google Scholar] [CrossRef]
- Chen, T.; Pan, H.; Lu, M.; Hang, J.; Lam, C.K.C.; Yuan, C.; Pearlmutter, D. Effects of Tree Plantings and Aspect Ratios on Pedestrian Visual and Thermal Comfort Using Scaled Outdoor Experiments. Sci. Total Environ. 2021, 801, 149527. [Google Scholar] [CrossRef] [PubMed]
- Toparlar, Y.; Blocken, B.; Maiheu, B.; van Heijst, G.J.F. A Review on the CFD Analysis of Urban Microclimate. Renew. Sustain. Energy Rev. 2017, 80, 1613–1640. [Google Scholar] [CrossRef]
- Mughal, M.O.; Kubilay, A.; Fatichi, S.; Meili, N.; Carmeliet, J.; Edwards, P.; Burlando, P. Detailed Investigation of Vegetation Effects on Microclimate by Means of Computational Fluid Dynamics (CFD) in a Tropical Urban Environment. Urban Clim. 2021, 39, 100939. [Google Scholar] [CrossRef]
- Li, Z.; Zhang, H.; Juan, Y.-H.; Wen, C.-Y.; Yang, A.-S. Effects of Building Setback on Thermal Comfort and Air Quality in the Street Canyon. Build. Environ. 2022, 208, 108627. [Google Scholar] [CrossRef]
- Crank, P.J.; Sailor, D.J.; Ban-Weiss, G.; Taleghani, M. Evaluating the ENVI-Met Microscale Model for Suitability in Analysis of Targeted Urban Heat Mitigation Strategies. Urban Clim. 2018, 26, 188–197. [Google Scholar] [CrossRef]
- Park, C.Y.; Lee, D.K.; Krayenhoff, E.S.; Heo, H.K.; Hyun, J.H.; Oh, K.; Park, T.Y. Variations in Pedestrian Mean Radiant Temperature Based on the Spacing and Size of Street Trees. Sustain. Cities Soc. 2019, 48, 101521. [Google Scholar] [CrossRef]
- Kubilay, A.; Allegrini, J.; Strebel, D.; Zhao, Y.; Derome, D.; Carmeliet, J. Advancement in Urban Climate Modelling at Local Scale: Urban Heat Island Mitigation and Building Cooling Demand. Atmosphere 2020, 11, 1313. [Google Scholar] [CrossRef]
- Acero, J.A.; Arrizabalaga, J. Evaluating the Performance of ENVI-Met Model in Diurnal Cycles for Different Meteorological Conditions. Theor. Appl. Clim. 2018, 131, 455–469. [Google Scholar] [CrossRef]
- Alznafer, B.M. The Impact of Neighbourhood Geometries on Outdoor Thermal Comfort and Energy Consumption from Urban Dwellings: A Case Study of the Riyadh City, the Kingdom of Saudi Arabia. Phd; Cardiff University: Cardiff, UK, 2014. [Google Scholar]
- Yang, X.; Zhao, L.; Bruse, M.; Meng, Q. An Integrated Simulation Method for Building Energy Performance Assessment in Urban Environments. Energy Build. 2012, 54, 243–251. [Google Scholar] [CrossRef]
- Ali-Toudert, F.; Mayer, H. Numerical Study on the Effects of Aspect Ratio and Orientation of an Urban Street Canyon on Outdoor Thermal Comfort in Hot and Dry Climate. Build. Environ. 2006, 41, 94–108. [Google Scholar] [CrossRef]
- Climate Change in South Korea. Available online: https://en.wikipedia.org/wiki/Climate_change_in_South_Korea (accessed on 18 December 2023).
- Taguchi, G. Quality Engineering (Taguchi Methods) for the Development of Electronic Circuit Technology. IEEE Trans. Reliab. 1995, 44, 225–229. [Google Scholar] [CrossRef]
- Sijo, M.T.; Biju, N. Taguchi Method for Optimization of Cutting Parameters in Turning Operations. Int. J. Manuf. Mater. Sci. 2011, 1, 44–46. [Google Scholar]
- Bruse, M.; Fleer, H. Simulating Surface–Plant–Air Interactions inside Urban Environments with a Three Dimensional Numerical Model. Environ. Model. Softw. 1998, 13, 373–384. [Google Scholar] [CrossRef]
- Detommaso, M.; Gagliano, A.; Marletta, L.; Nocera, F. Sustainable Urban Greening and Cooling Strategies for Thermal Comfort at Pedestrian Level. Sustainability 2021, 13, 3138. [Google Scholar] [CrossRef]
- Tsoka, S.; Tsikaloudaki, A.; Theodosiou, T. Analyzing the ENVI-Met Microclimate Model’s Performance and Assessing Cool Materials and Urban Vegetation Applications–A Review. Sustain. Cities Soc. 2018, 43, 55–76. [Google Scholar] [CrossRef]
- Huttner, S. Further Development and Application of the 3D Microclimate Simulation ENVI-Met; Johannes Gutenberg-Universität Mainz: Mainz, Germany, 2012. [Google Scholar]
- Oke, T.R.; Mills, G.; Christen, A.; Voogt, J.A. Urban Climates; Cambridge University Press: Cambridge, UK, 2017; ISBN 978-0-521-84950-0. [Google Scholar]
- Alchapar, N.L.; Correa, E.N. The Use of Reflective Materials as a Strategy for Urban Cooling in an Arid “OASIS” City. Sustain. Cities Soc. 2016, 27, 1–14. [Google Scholar] [CrossRef]
- Anselin, L. Thirty Years of Spatial Econometrics. Pap. Reg. Sci. 2010, 89, 3–25. [Google Scholar] [CrossRef]
- Wang, J.-F.; Zhang, T.-L.; Fu, B.-J. A Measure of Spatial Stratified Heterogeneity. Ecol. Indic. 2016, 67, 250–256. [Google Scholar] [CrossRef]
- Wang, J.-F.; Hu, Y. Environmental Health Risk Detection with GeogDetector. Environ. Model. Softw. 2012, 33, 114–115. [Google Scholar] [CrossRef]
- Yang, Y.; Lan, H. Overview of the Application of Numerical Simulation Tools in the Field of Urban Microclimate Research-taking ENVI-Met Software as an Example. Available online: http://www.chinahvac.com.cn/Article/Index/4671 (accessed on 25 October 2021).
- Du, S.; Zhang, X.; Jin, X.; Zhou, X.; Shi, X. A Review of Multi-Scale Modelling, Assessment, and Improvement Methods of the Urban Thermal and Wind Environment. Build. Environ. 2022, 213, 108860. [Google Scholar] [CrossRef]
- Qin, H.; Hong, B.; Huang, B.; Cui, X.; Zhang, T. How Dynamic Growth of Avenue Trees Affects Particulate Matter Dispersion: CFD Simulations in Street Canyons. Sustain. Cities Soc. 2020, 61, 102331. [Google Scholar] [CrossRef]
- Su, Y.; Wang, Y.; Wang, C.; Zhou, D.; Zhou, N.; Feng, W.; Ji, H. Coupling Relationships between Urban Form and Performance of Outdoor Environment at the Pedestrian Level. Build. Environ. 2022, 213, 108514. [Google Scholar] [CrossRef]
- Wang, Y.; Zacharias, J. Landscape Modification for Ambient Environmental Improvement in Central Business Districts–A Case from Beijing. Urban For. Urban Green. 2015, 14, 8–18. [Google Scholar] [CrossRef]
- Unger, J. Intra-Urban Relationship between Surface Geometry and Urban Heat Island: Review and New Approach. Clim. Res. 2004, 27, 253–264. [Google Scholar] [CrossRef]
- Johansson, E. Influence of Urban Geometry on Outdoor Thermal Comfort in a Hot Dry Climate: A Study in Fez, Morocco. Build. Environ. 2006, 41, 1326–1338. [Google Scholar] [CrossRef]
- Andreou, E. Thermal Comfort in Outdoor Spaces and Urban Canyon Microclimate. Renew. Energy 2013, 55, 182–188. [Google Scholar] [CrossRef]
- Tan, Z.; Wang, A.; Morakinyo, T.E.; Yung, E.H.K.; Chan, E.H.W. Assessing the Mitigation Performance of Building Setback from Street and the Combination with Roadside Tree Planting. Build. Environ. 2022, 212, 108814. [Google Scholar] [CrossRef]
- Mballo, S.; Herpin, S.; Manteau, M.; Demotes-Mainard, S.; Bournet, P.E. Impact of Well-Watered Trees on the Microclimate inside a Canyon Street Scale Model in Outdoor Environment. Urban Clim. 2021, 37, 100844. [Google Scholar] [CrossRef]
- Huang, K.-T.; Li, Y.-J. Impact of Street Canyon Typology on Building’s Peak Cooling Energy Demand: A Parametric Analysis Using Orthogonal Experiment. Energy Build. 2017, 154, 448–464. [Google Scholar] [CrossRef]
- Milošević, D.D.; Bajšanski, I.V.; Savić, S.M. Influence of Changing Trees Locations on Thermal Comfort on Street Parking Lot and Footways. Urban For. Urban Green. 2017, 23, 113–124. [Google Scholar] [CrossRef]
- Zhang, L.; Zhang, Z.; McNulty, S.; Wang, P. The Mitigation Strategy of Automobile Generated Fine Particle Pollutants by Applying Vegetation Configuration in a Street-Canyon. J. Clean. Prod. 2020, 274, 122941. [Google Scholar] [CrossRef]
Figure 1.
Site of Busan, South Korea.
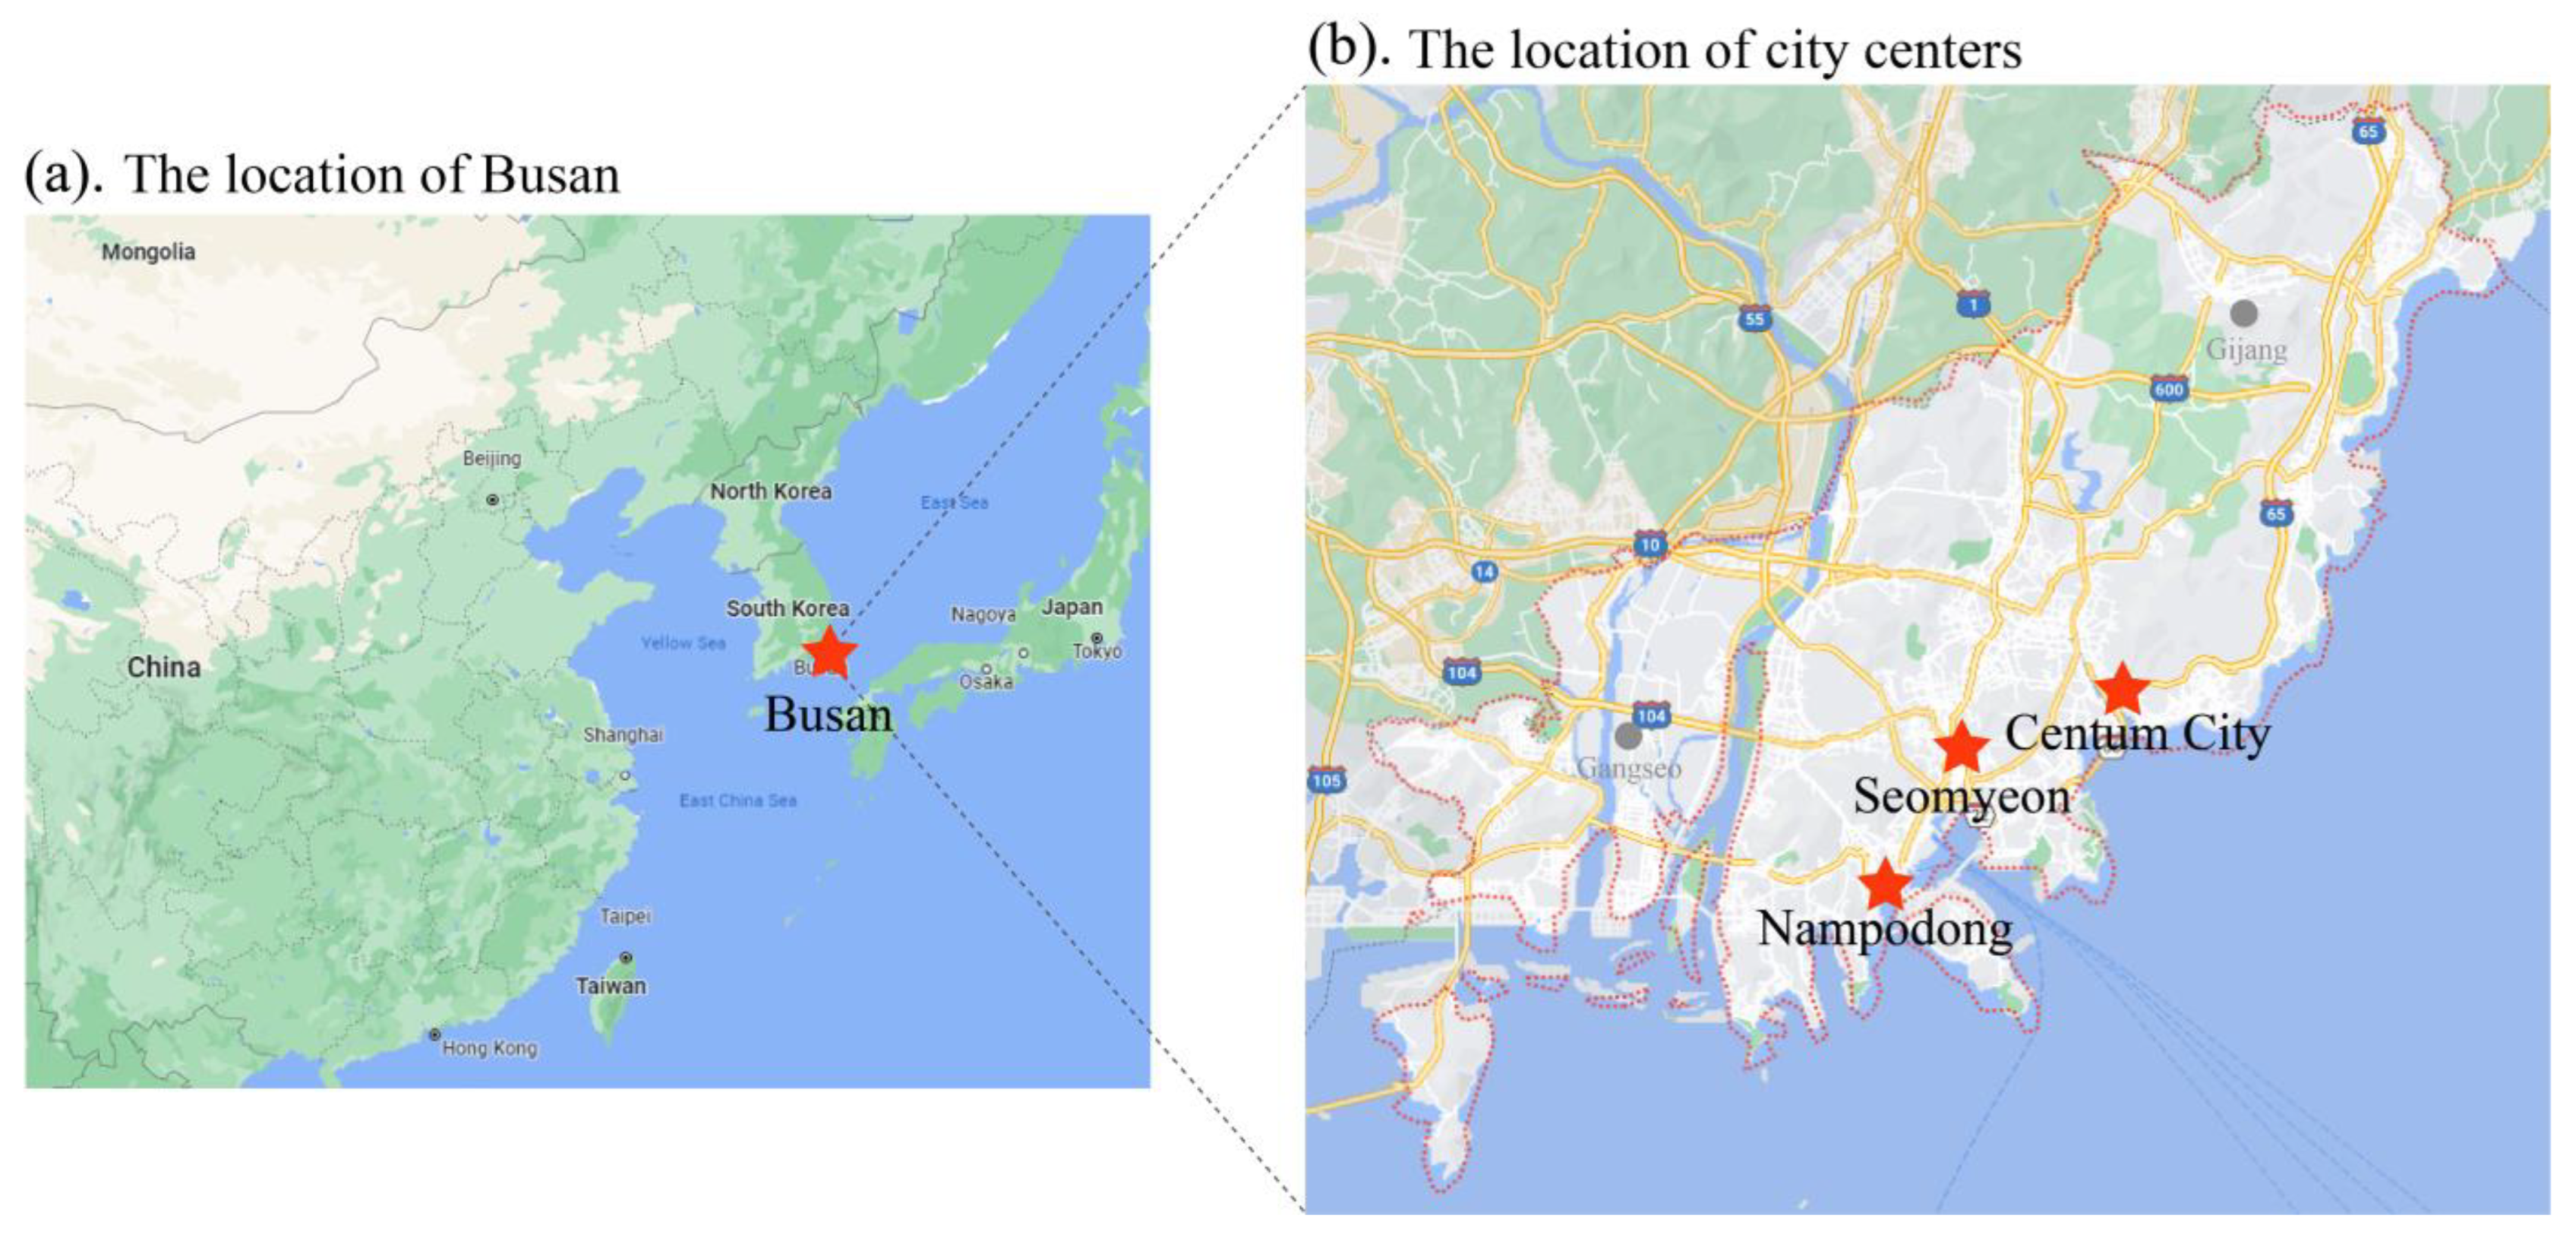
Figure 2.
Geometry description.
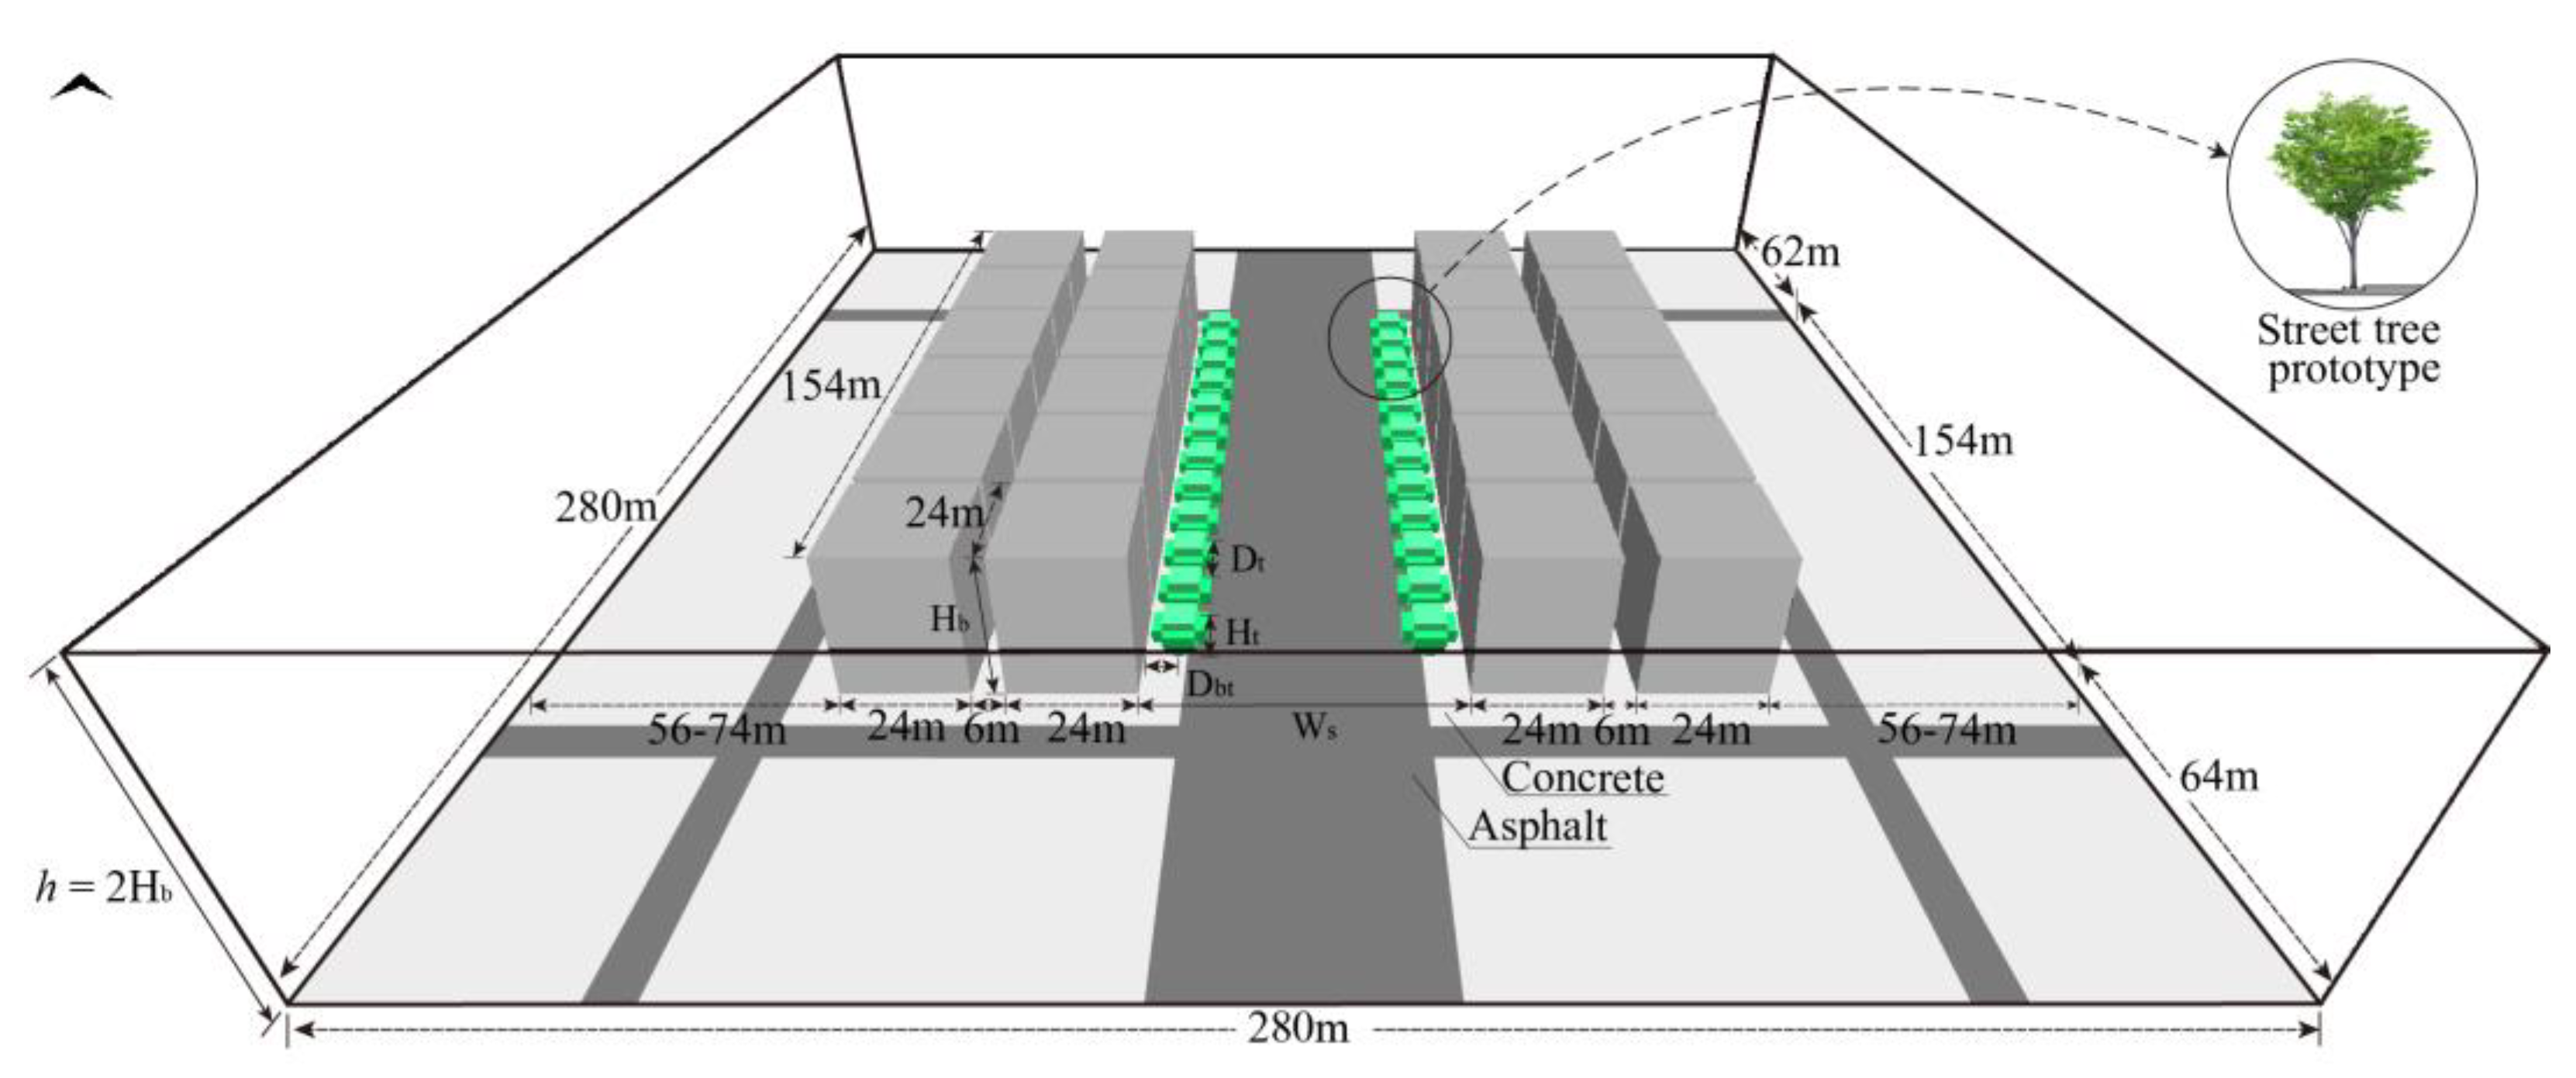
Figure 3.
Mobile instrument settings (microclimate cart).
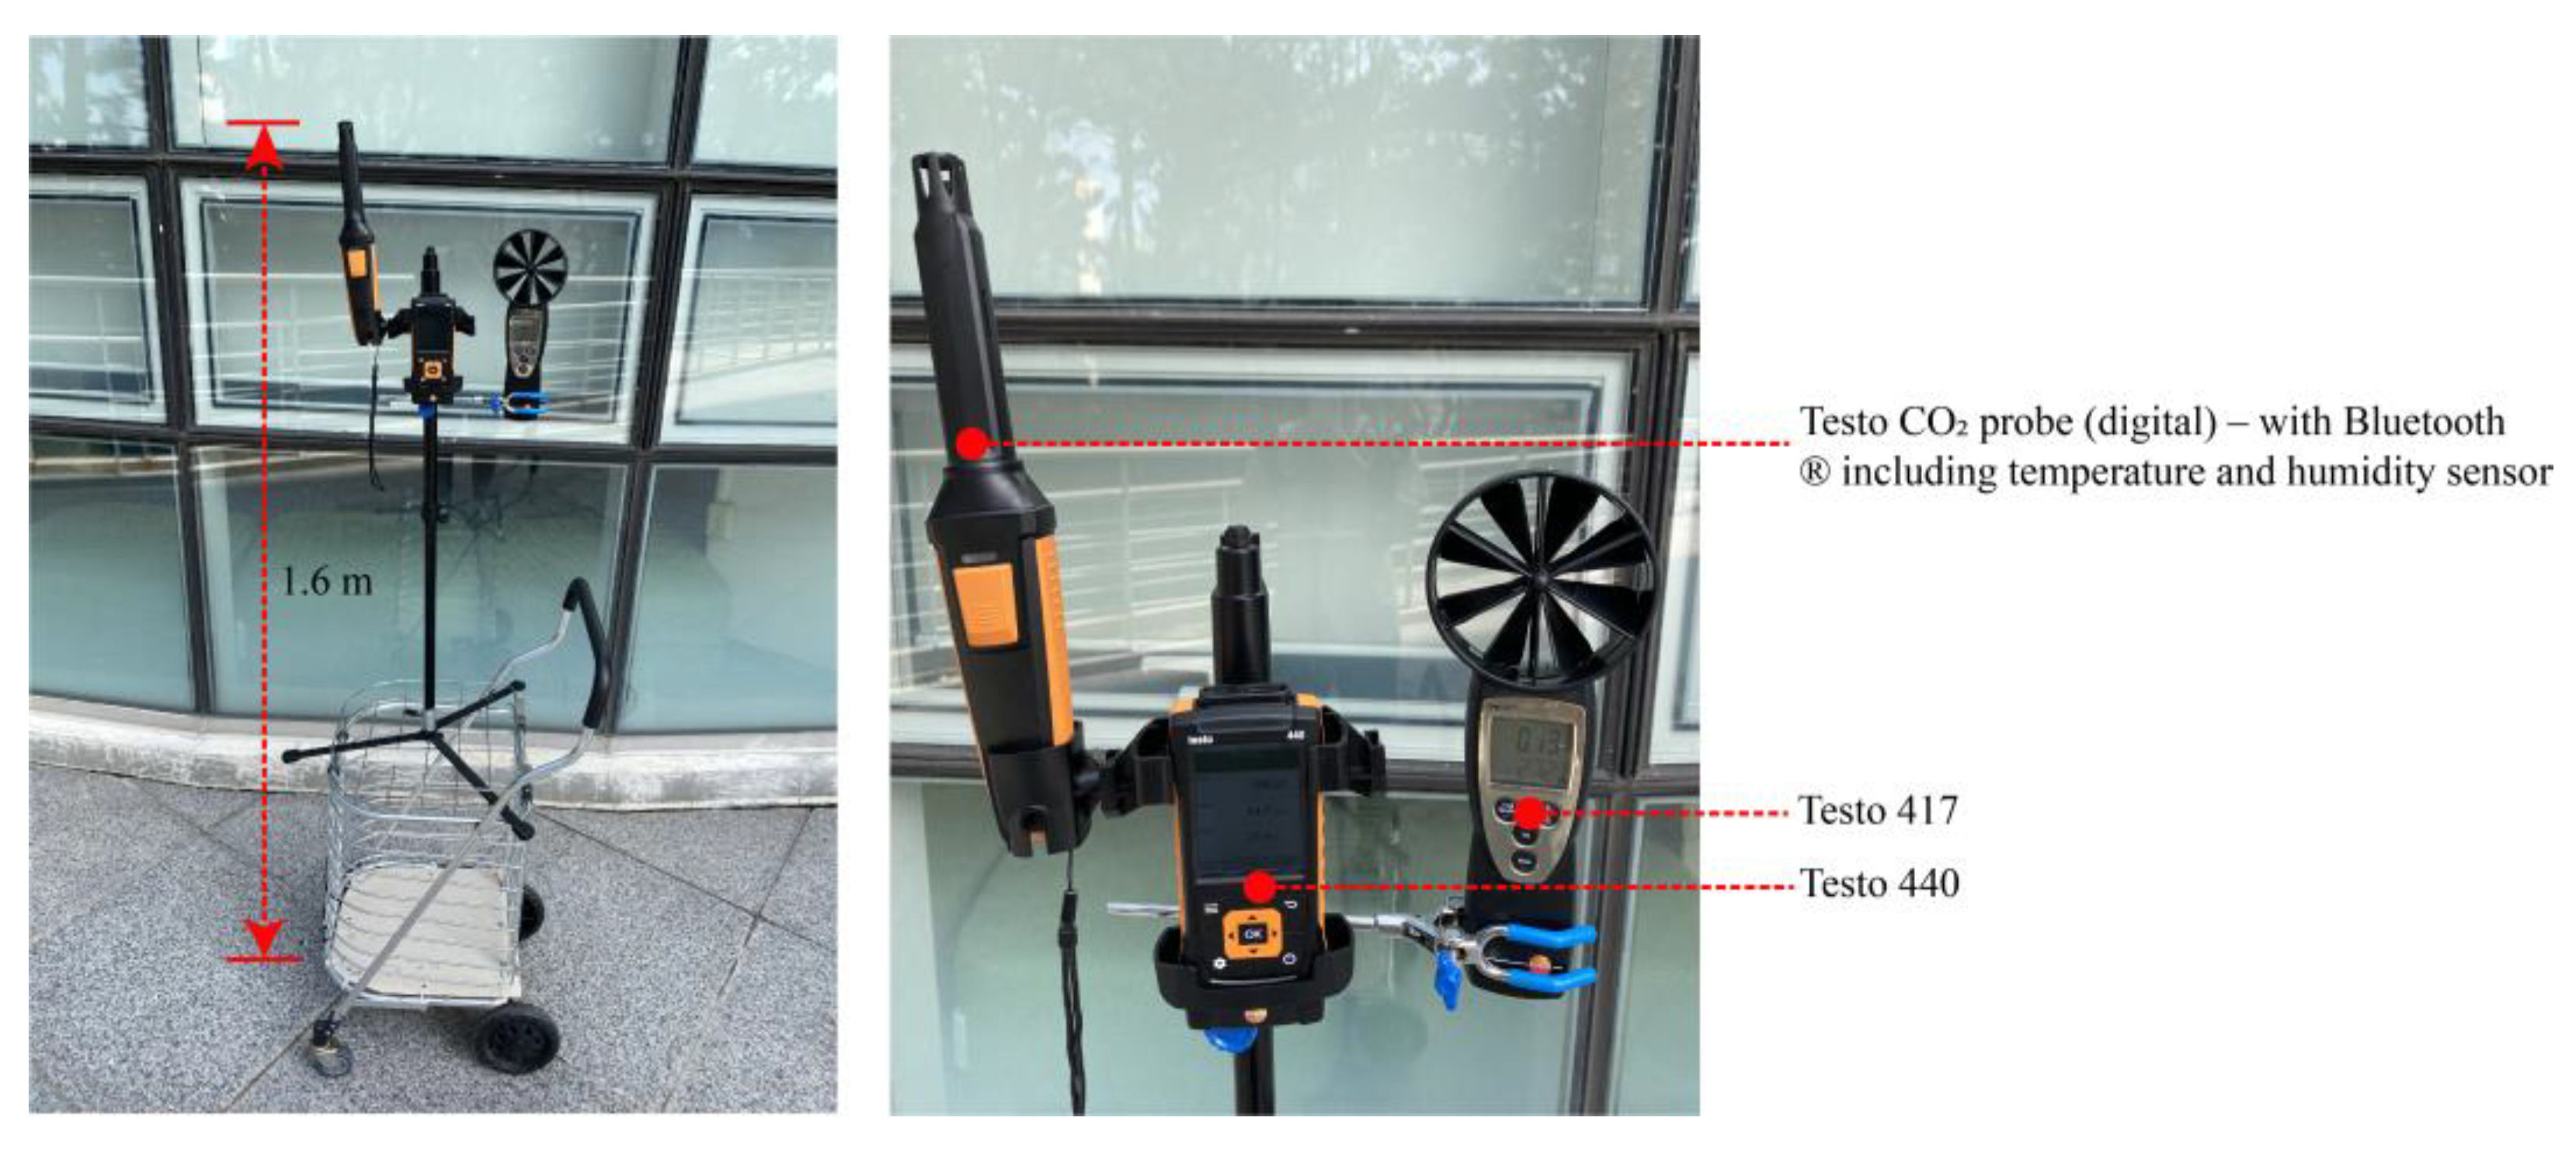
Figure 4.
Validation of the simulated results and measured results.
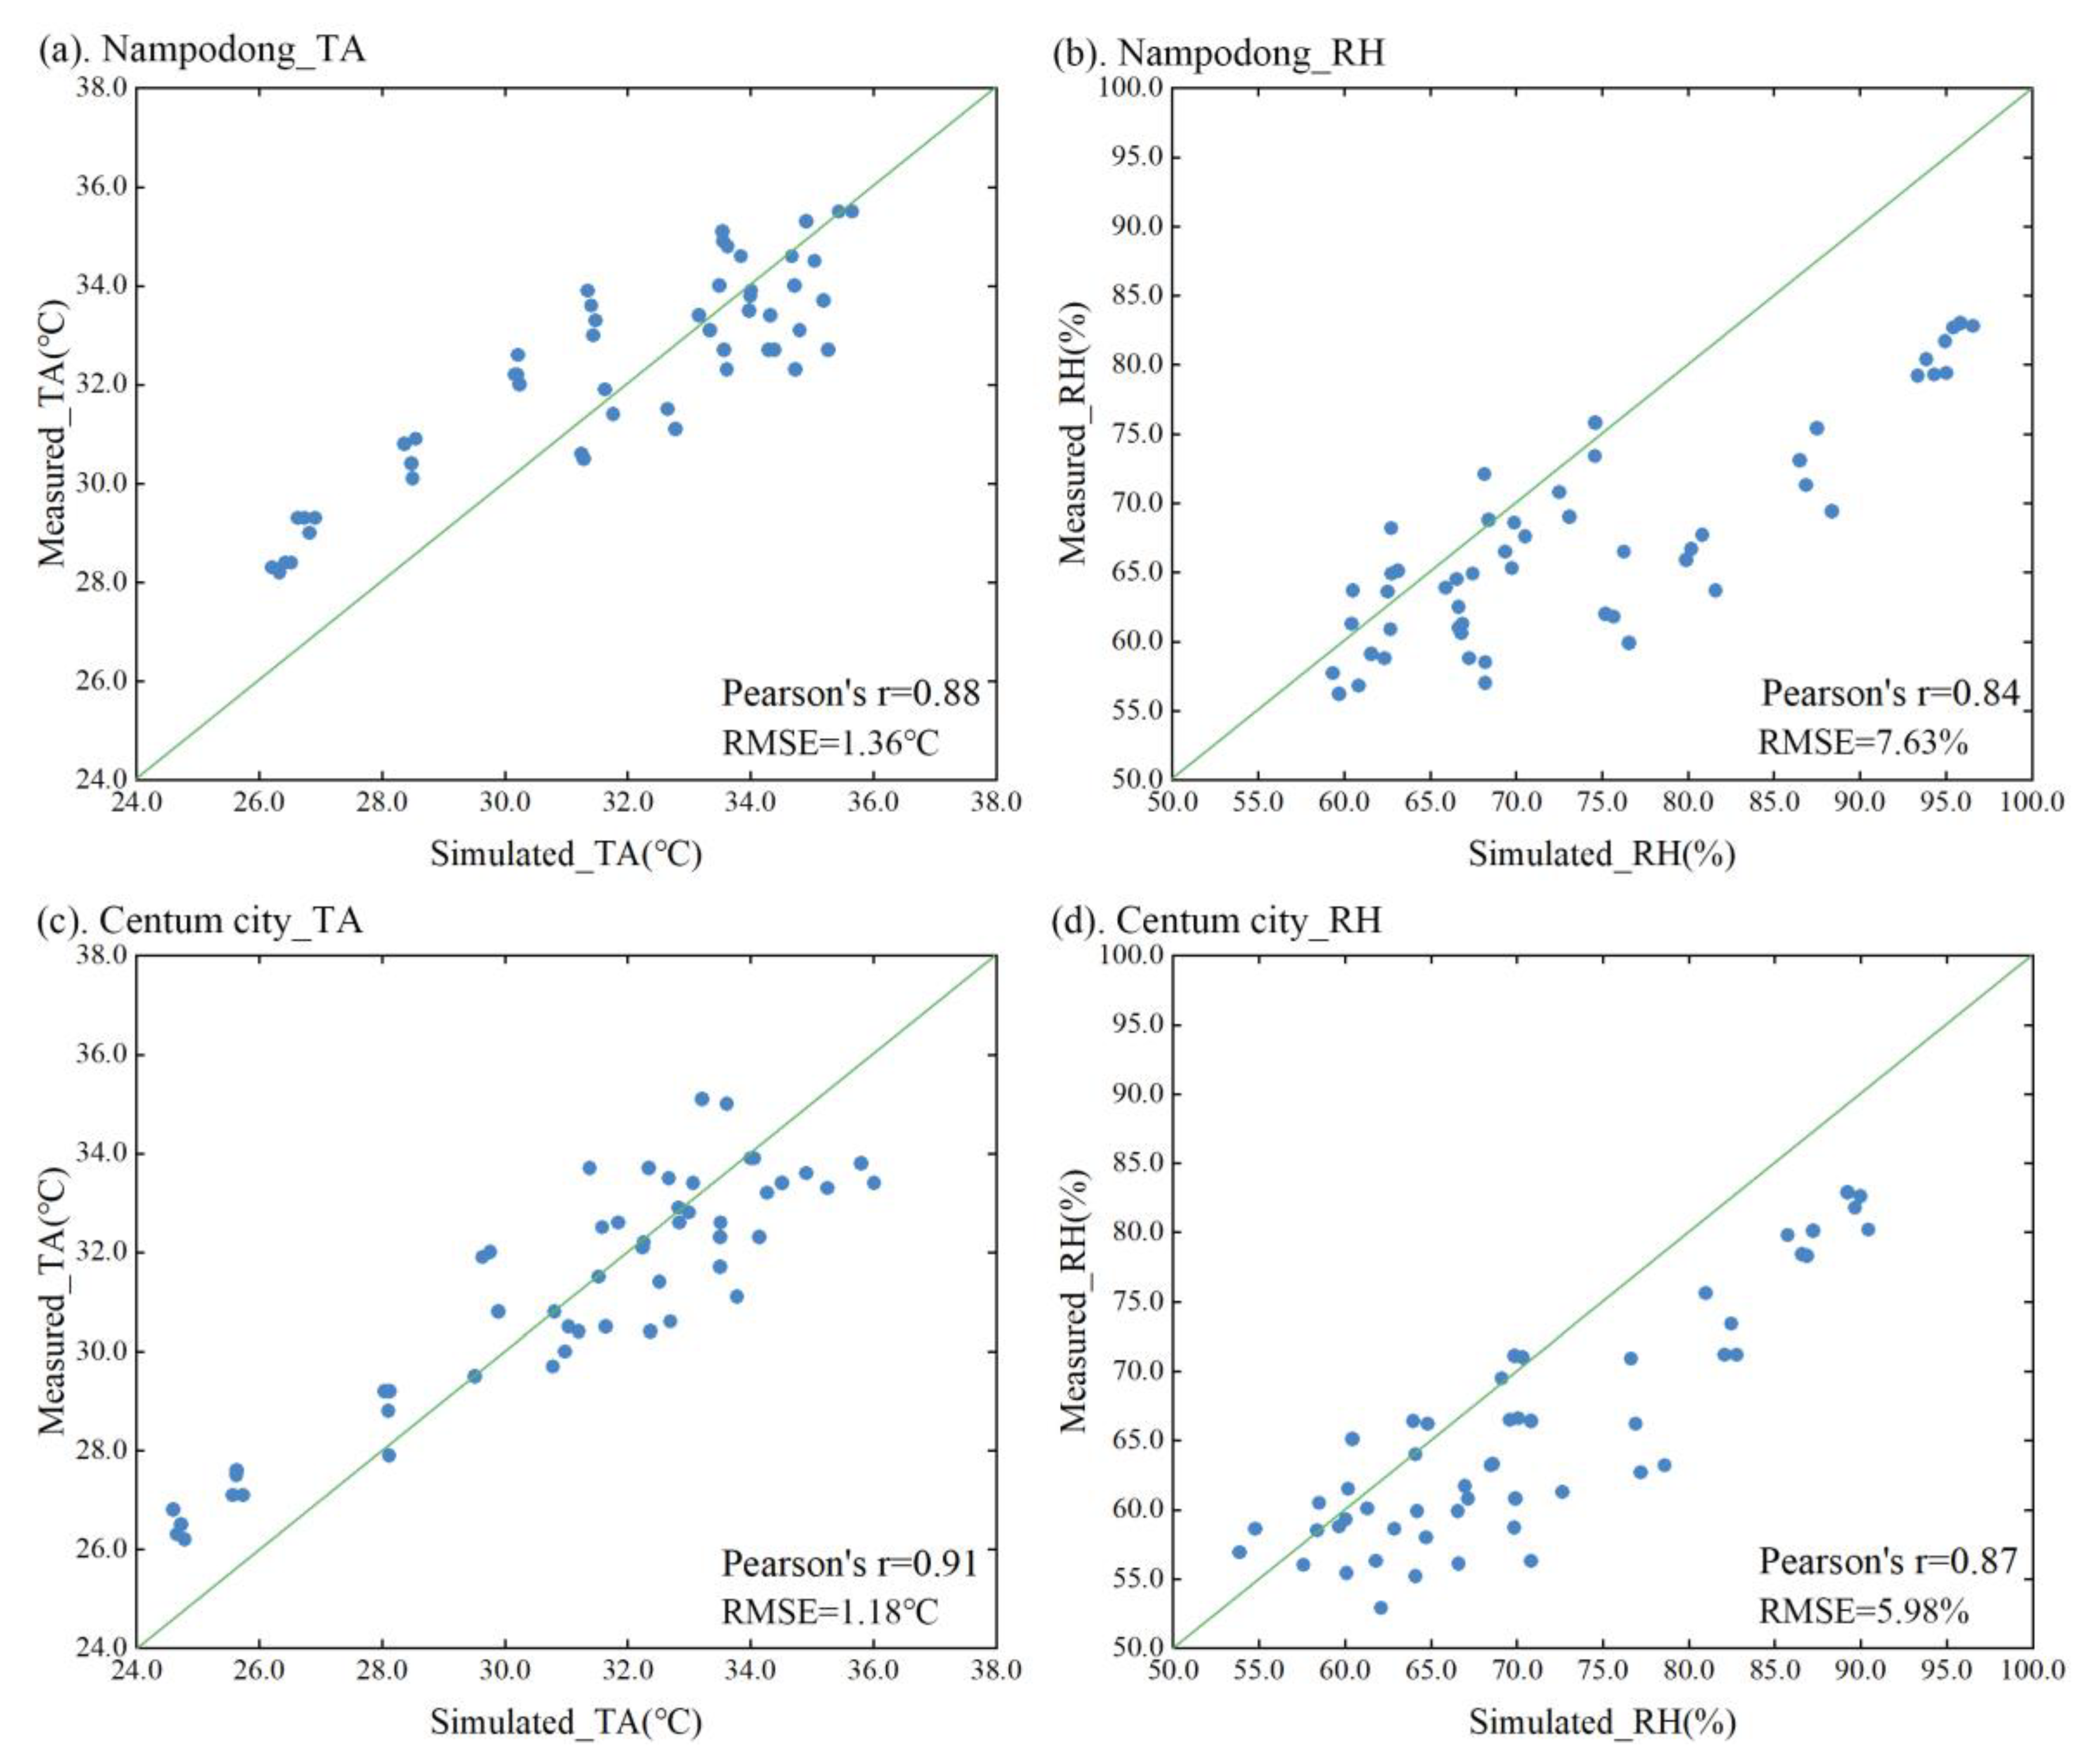
Figure 5.
Spatial heterogeneity scenario description.
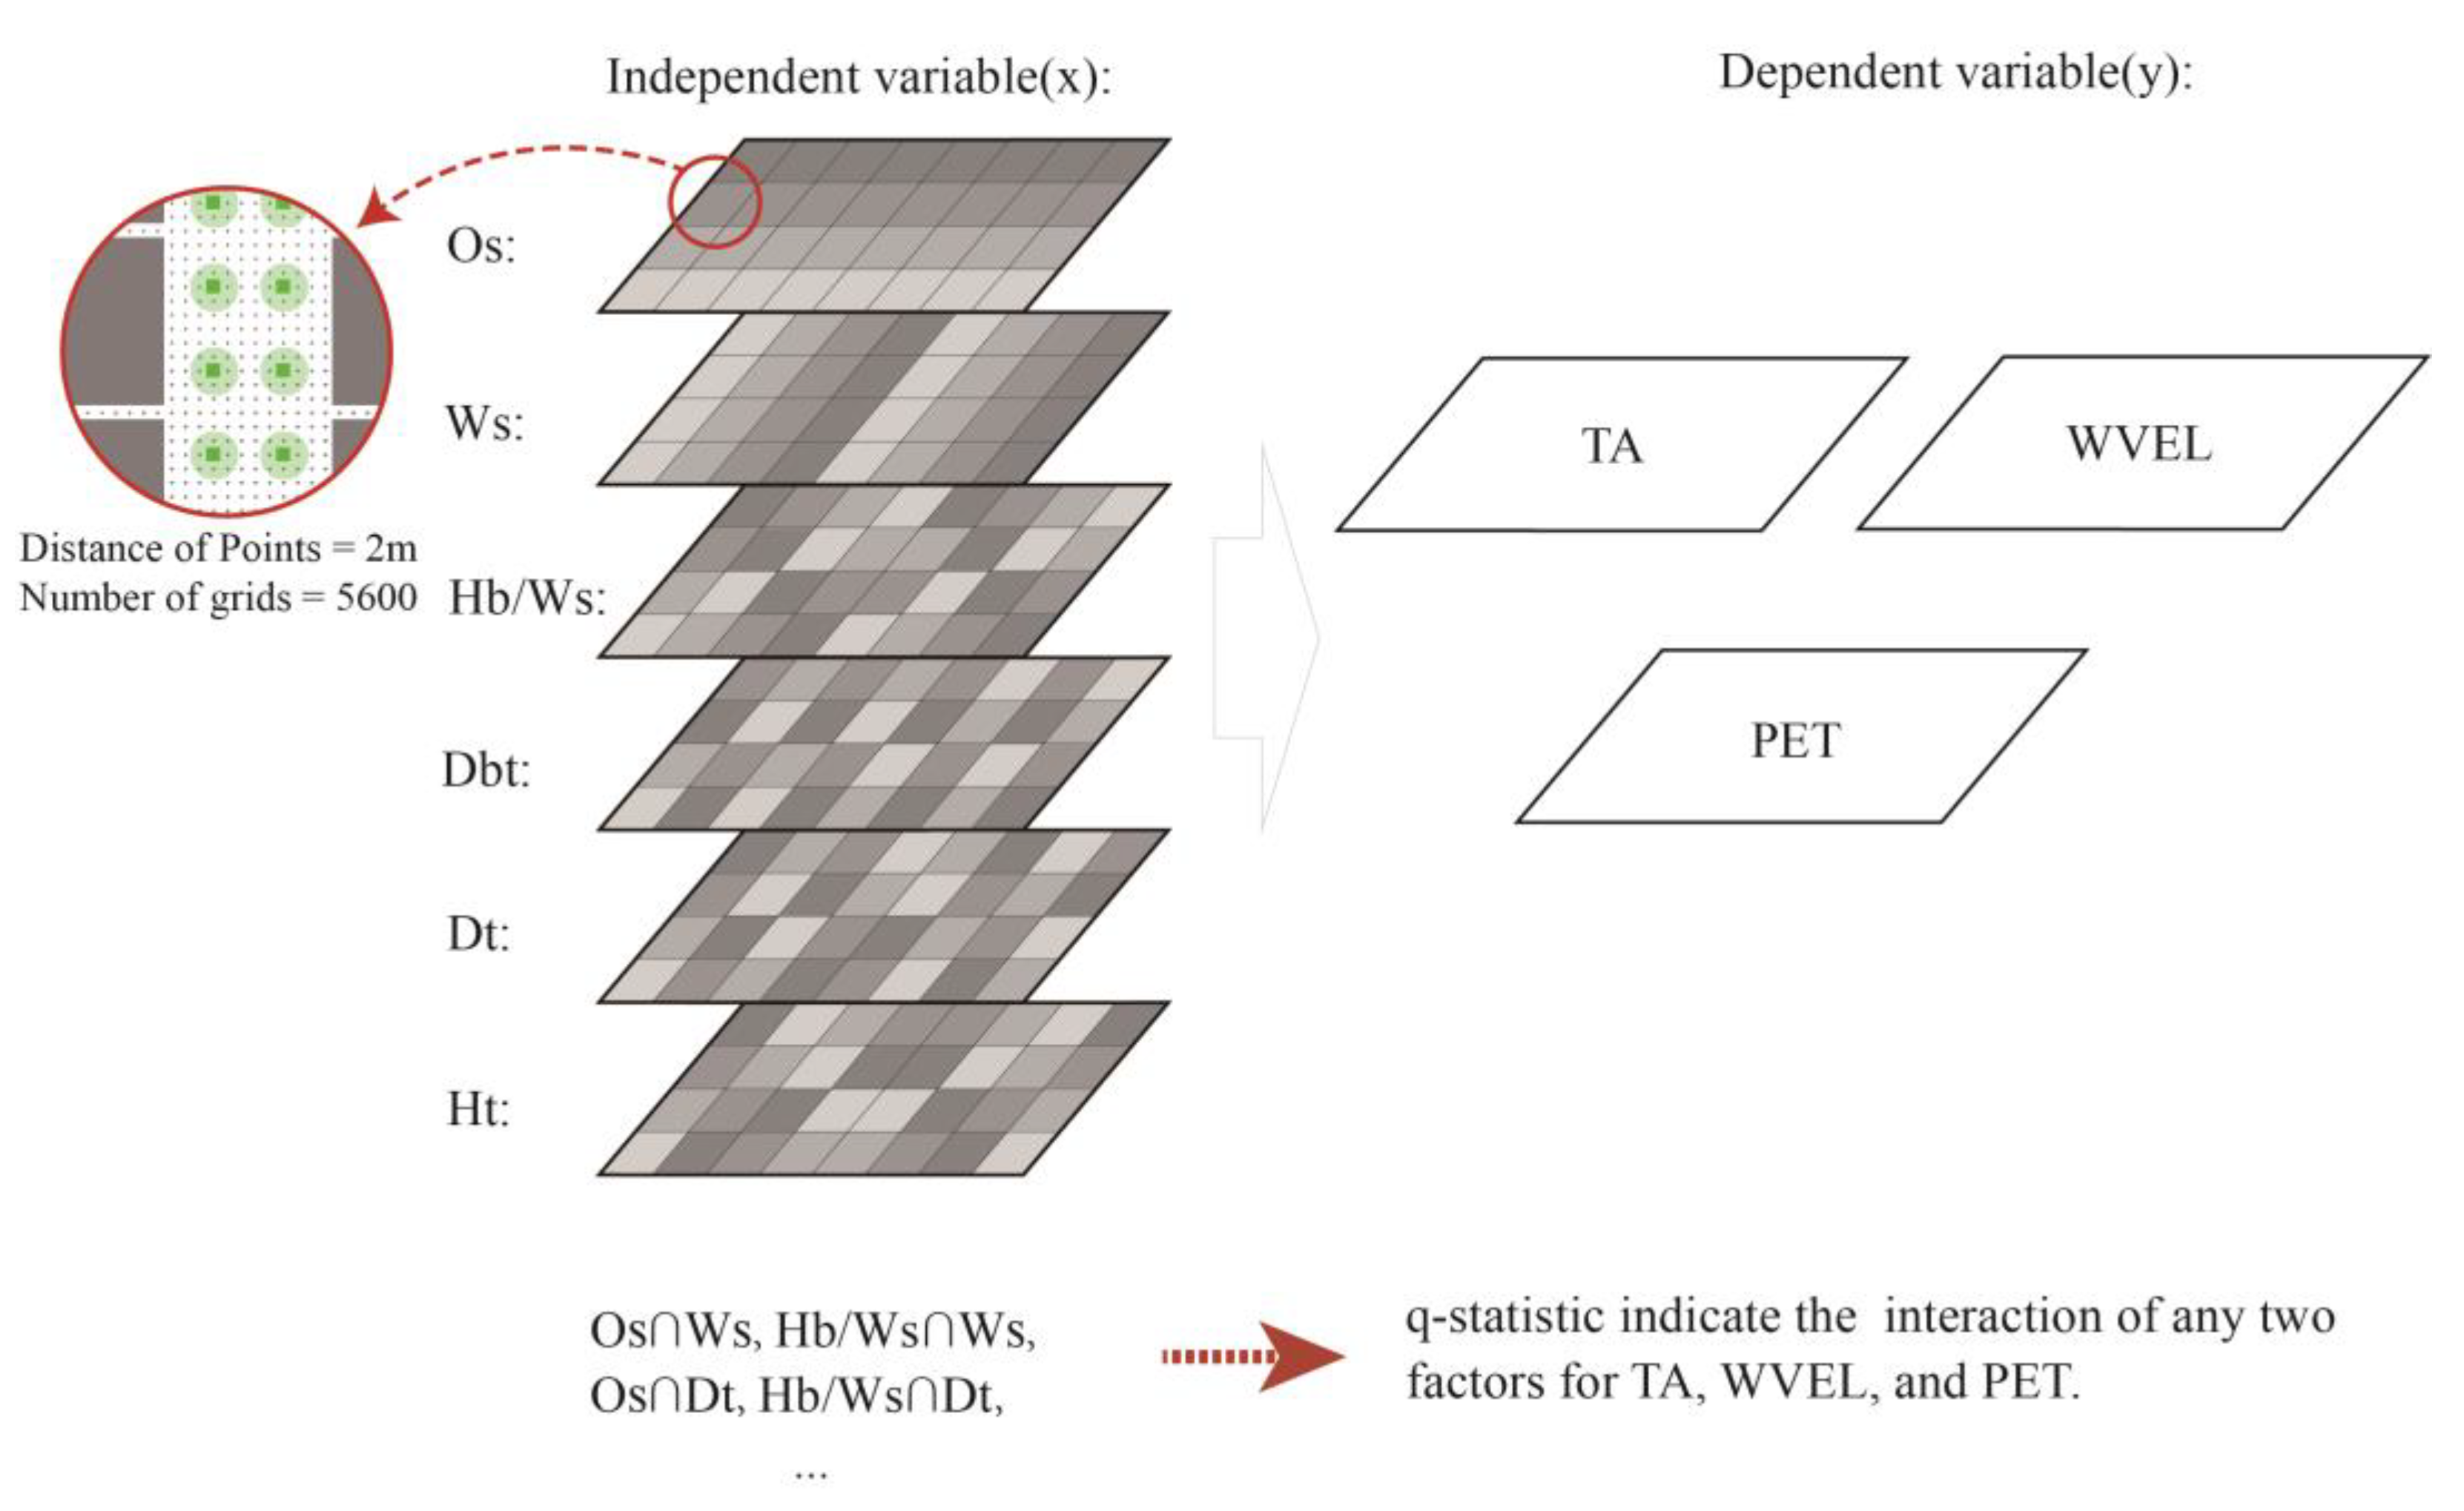
Figure 6.
TA diagrams of different factors from 08:00 to 18:00.
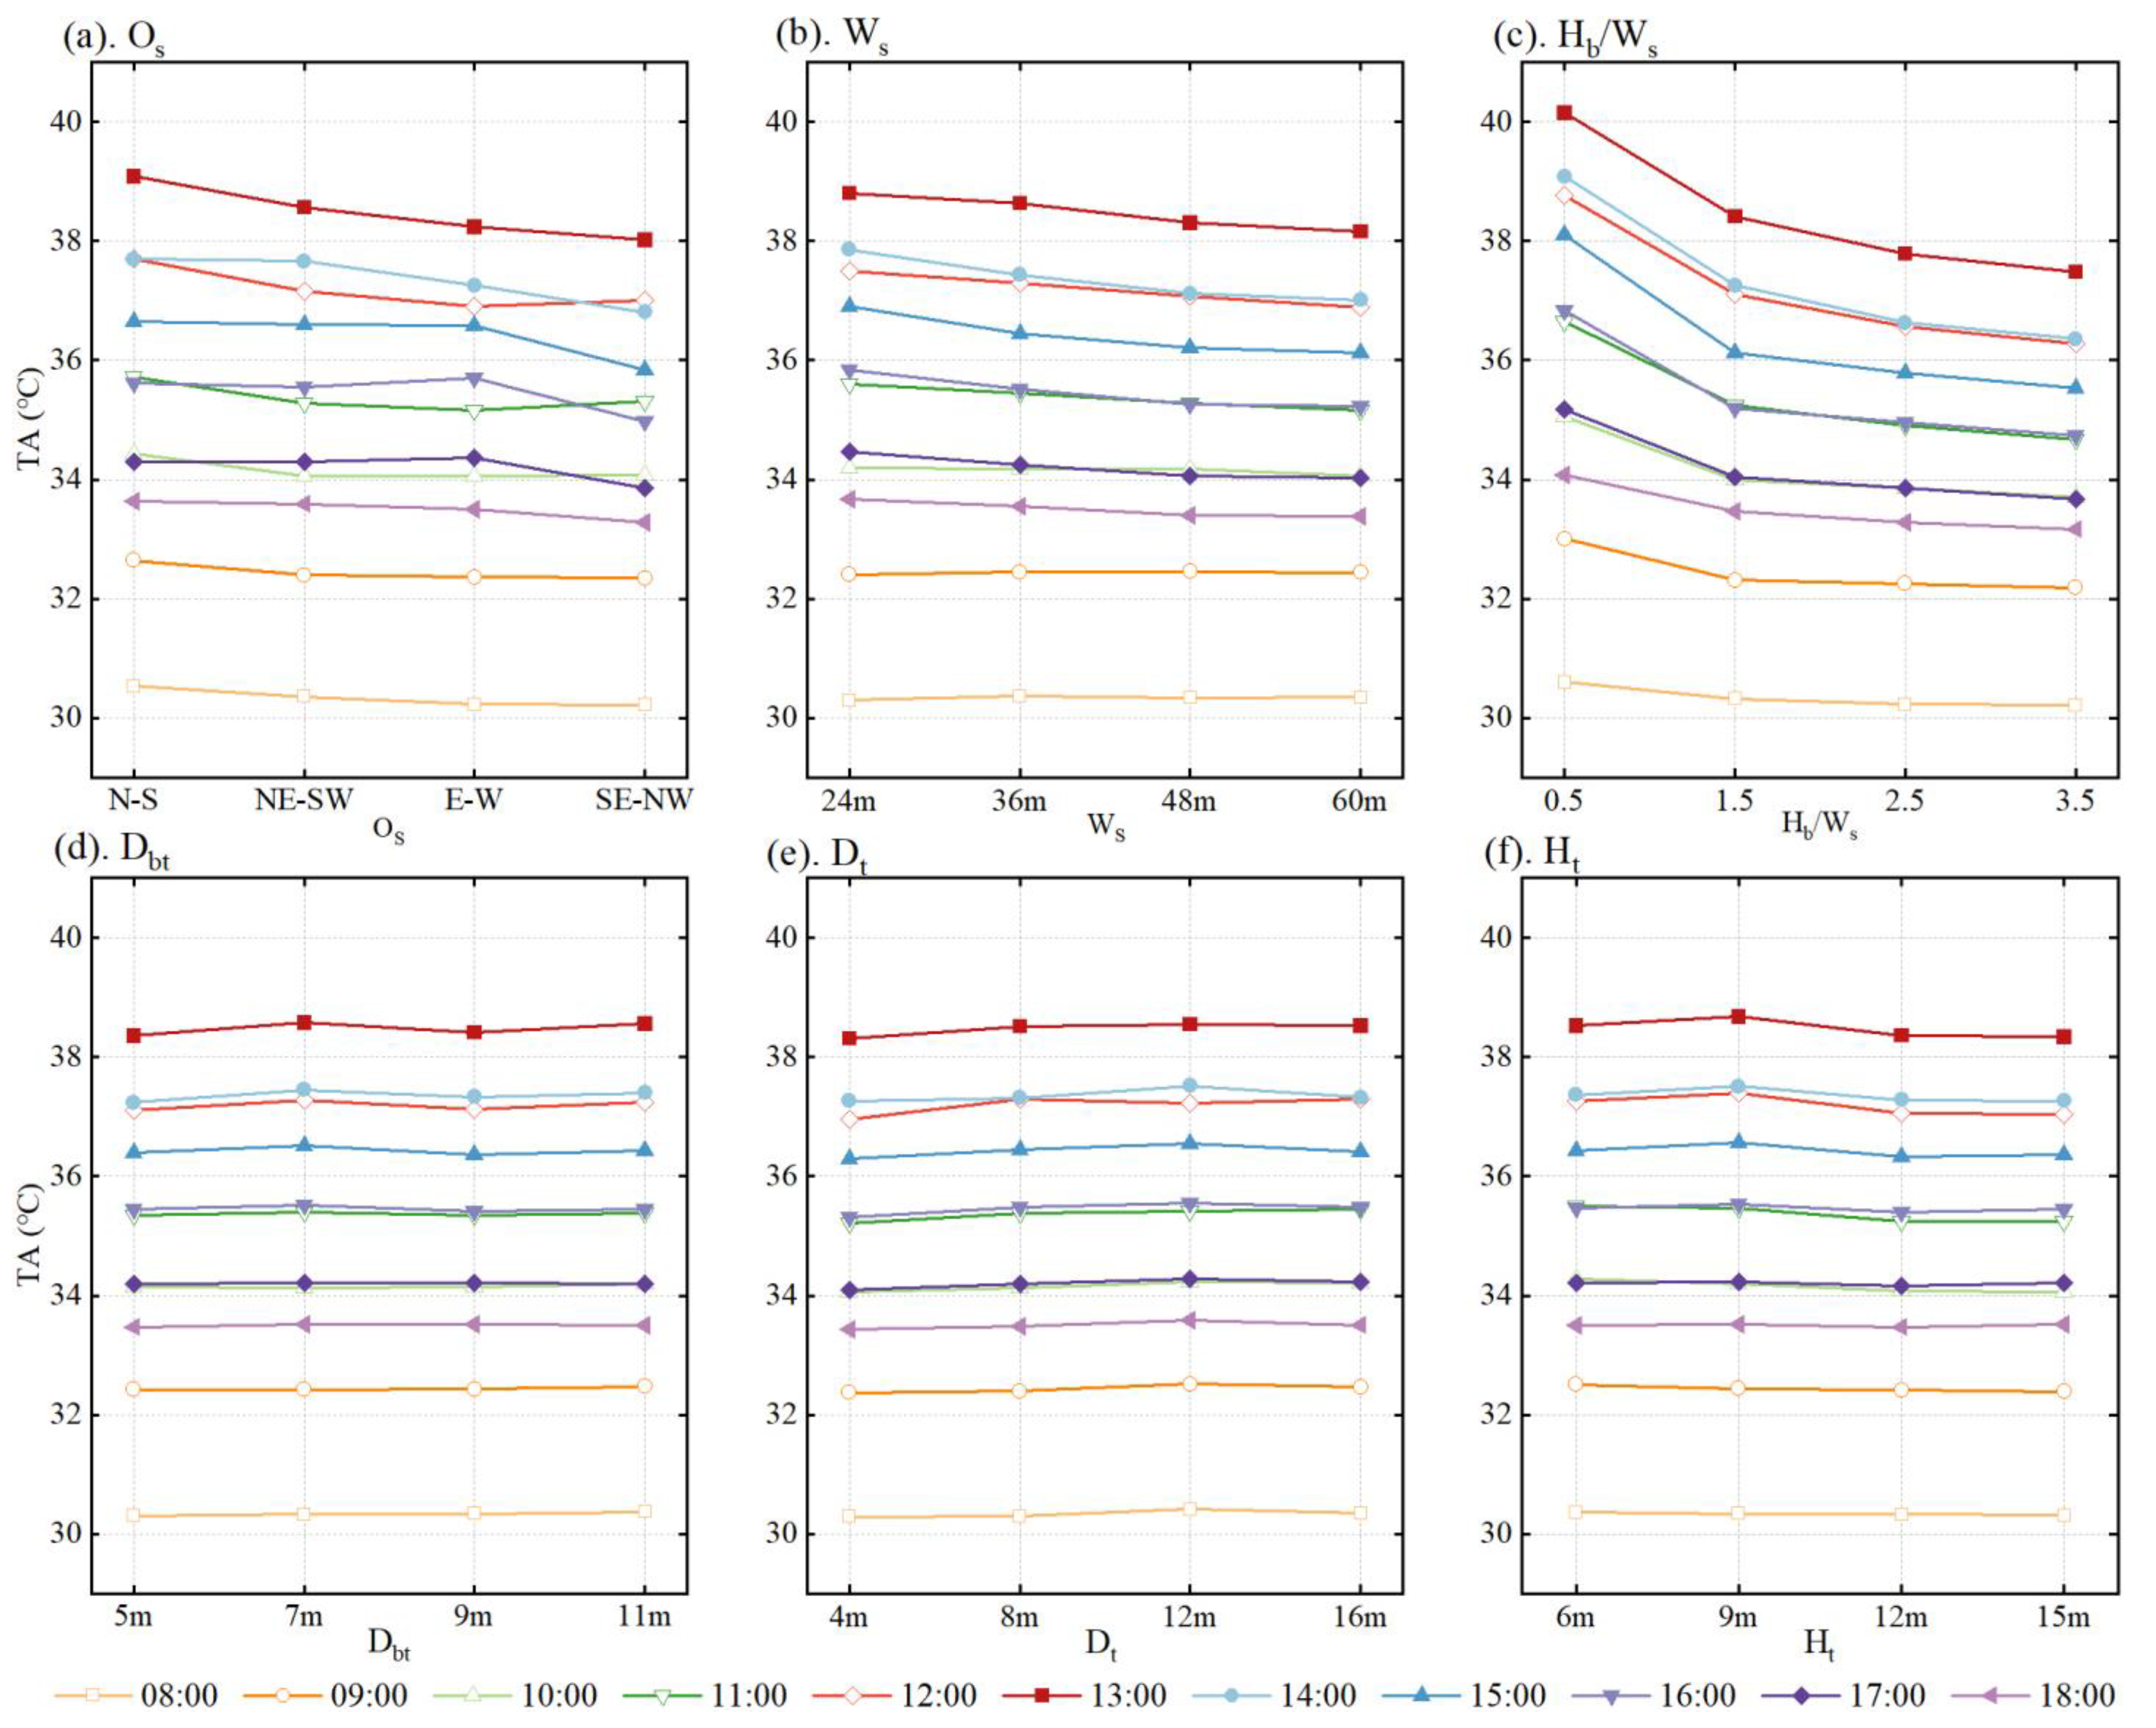
Figure 7.
TA differences at different time periods from 08:00 to 18:00.

Figure 8.
WVEL diagrams for different factors from 08:00 to 18:00.
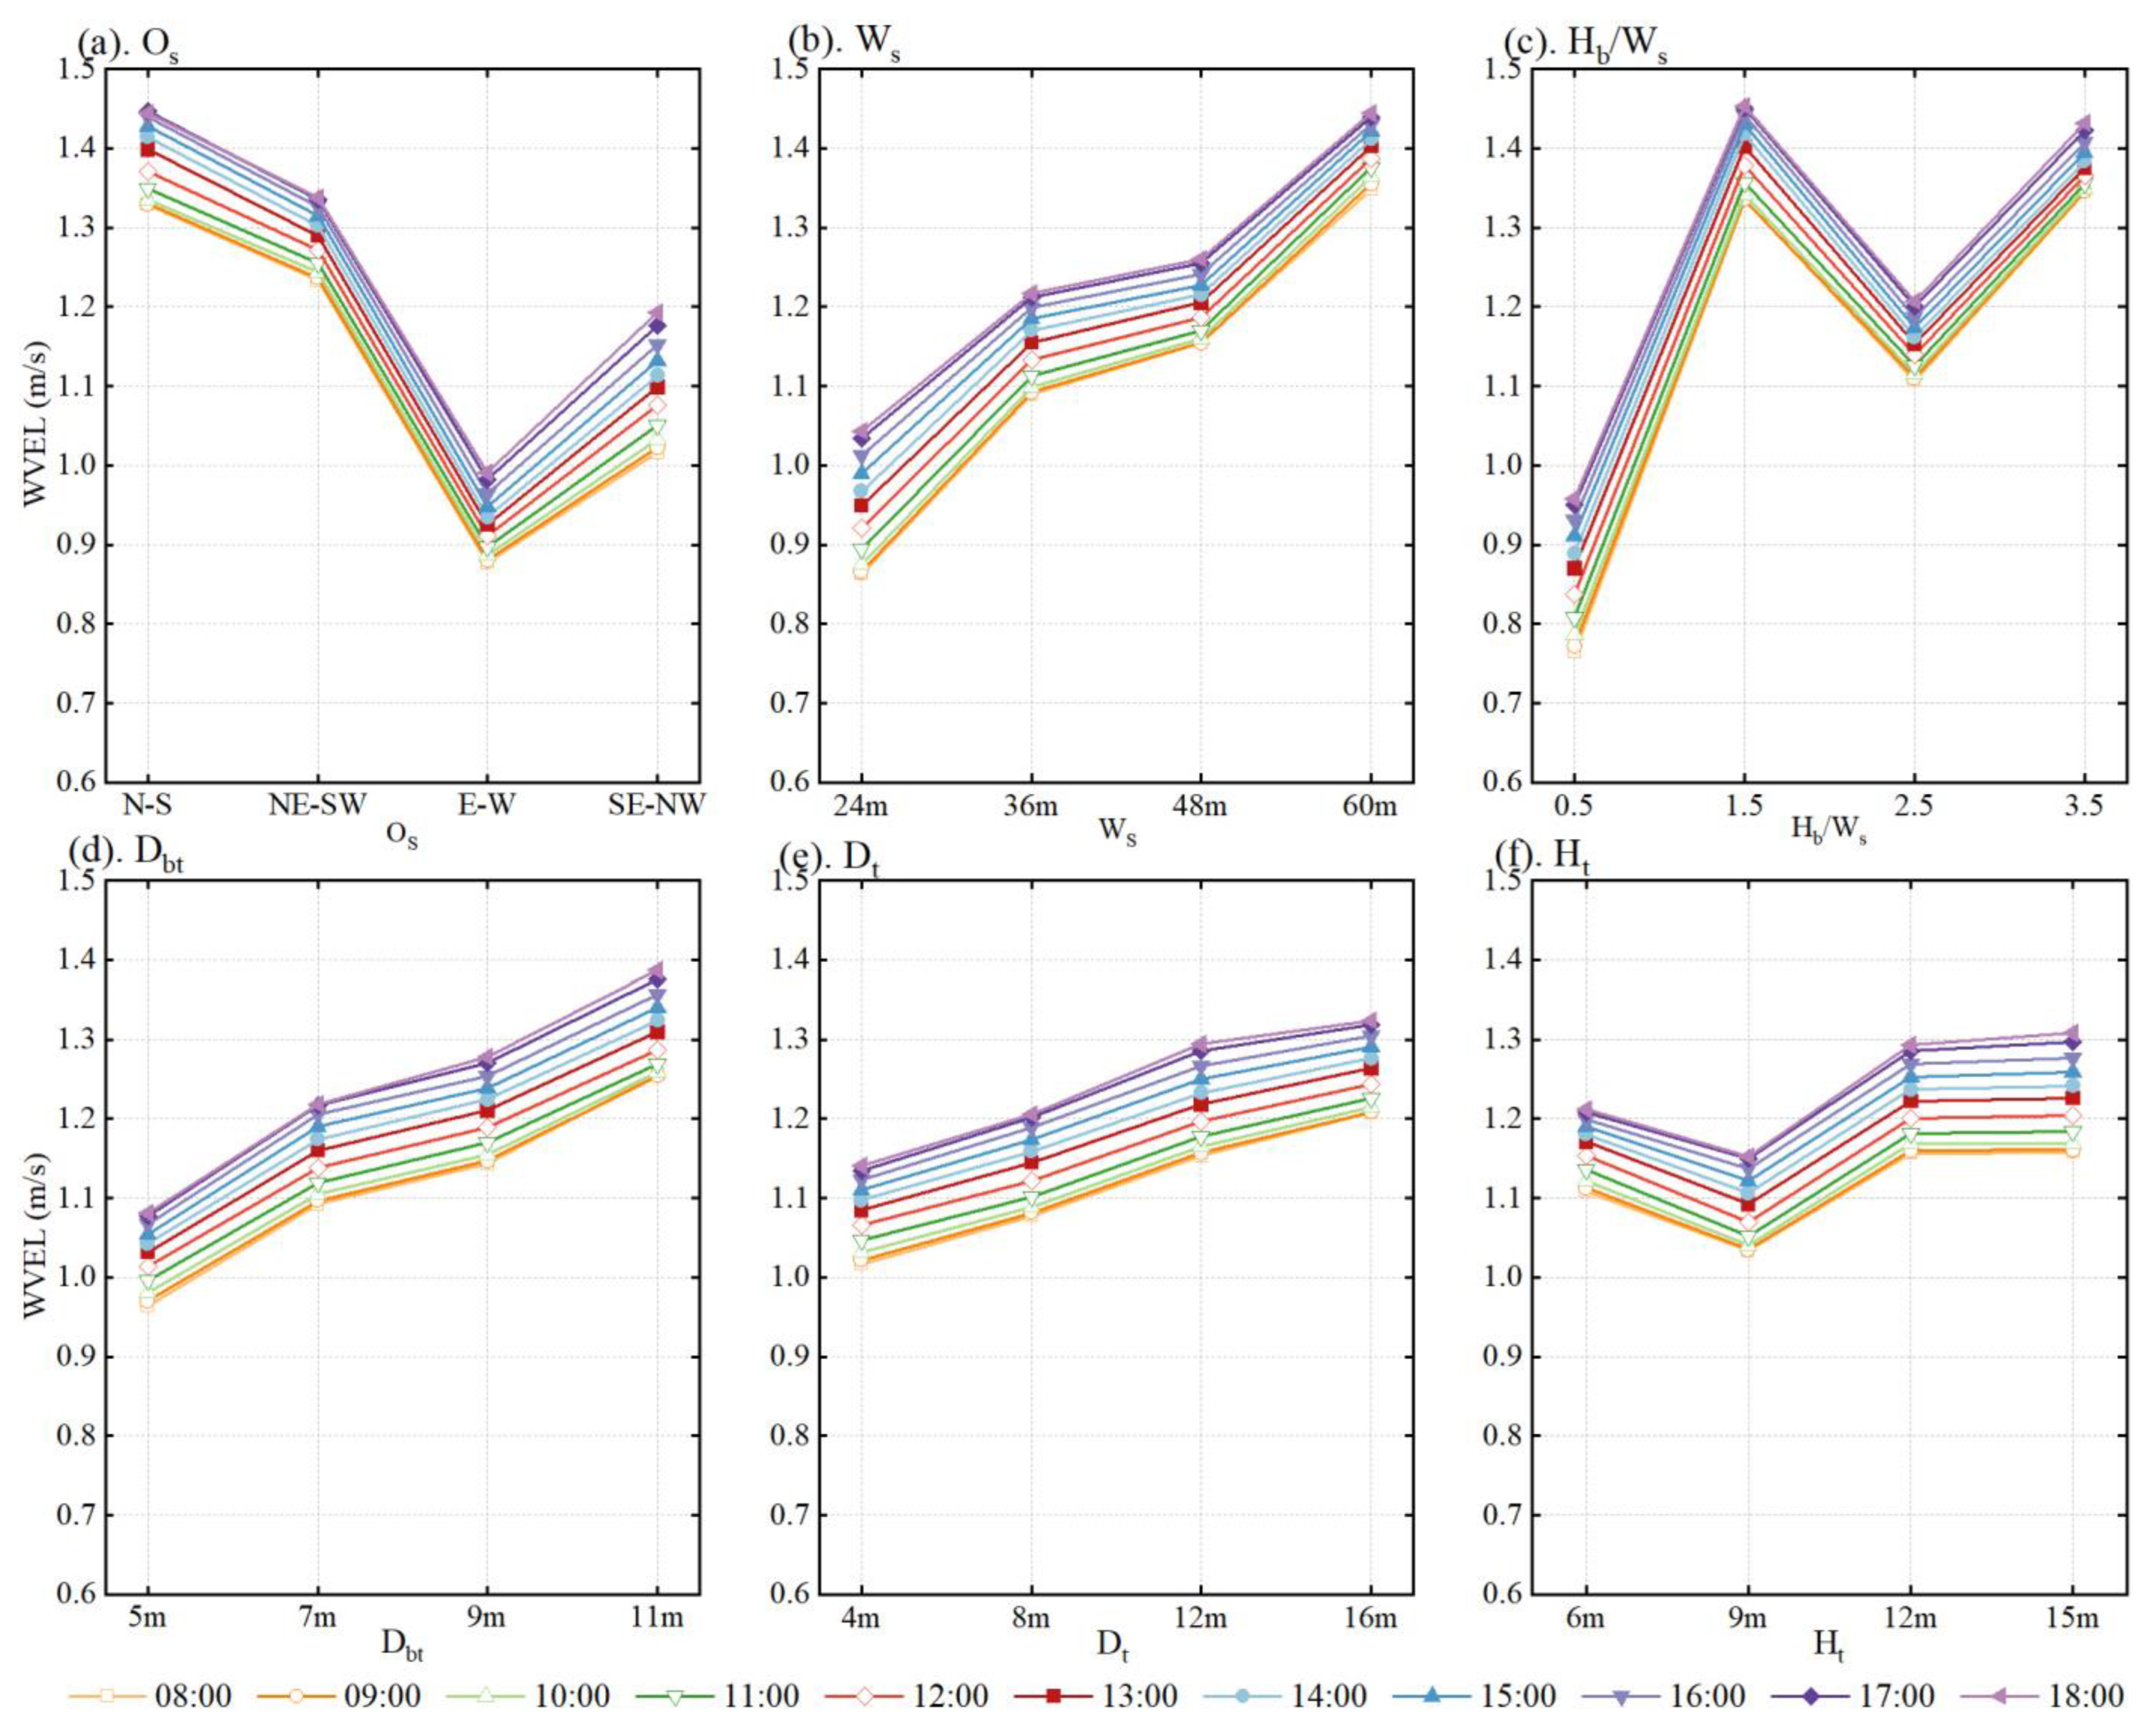
Figure 9.
PET diagrams for different factors from 08:00 to 18:00.
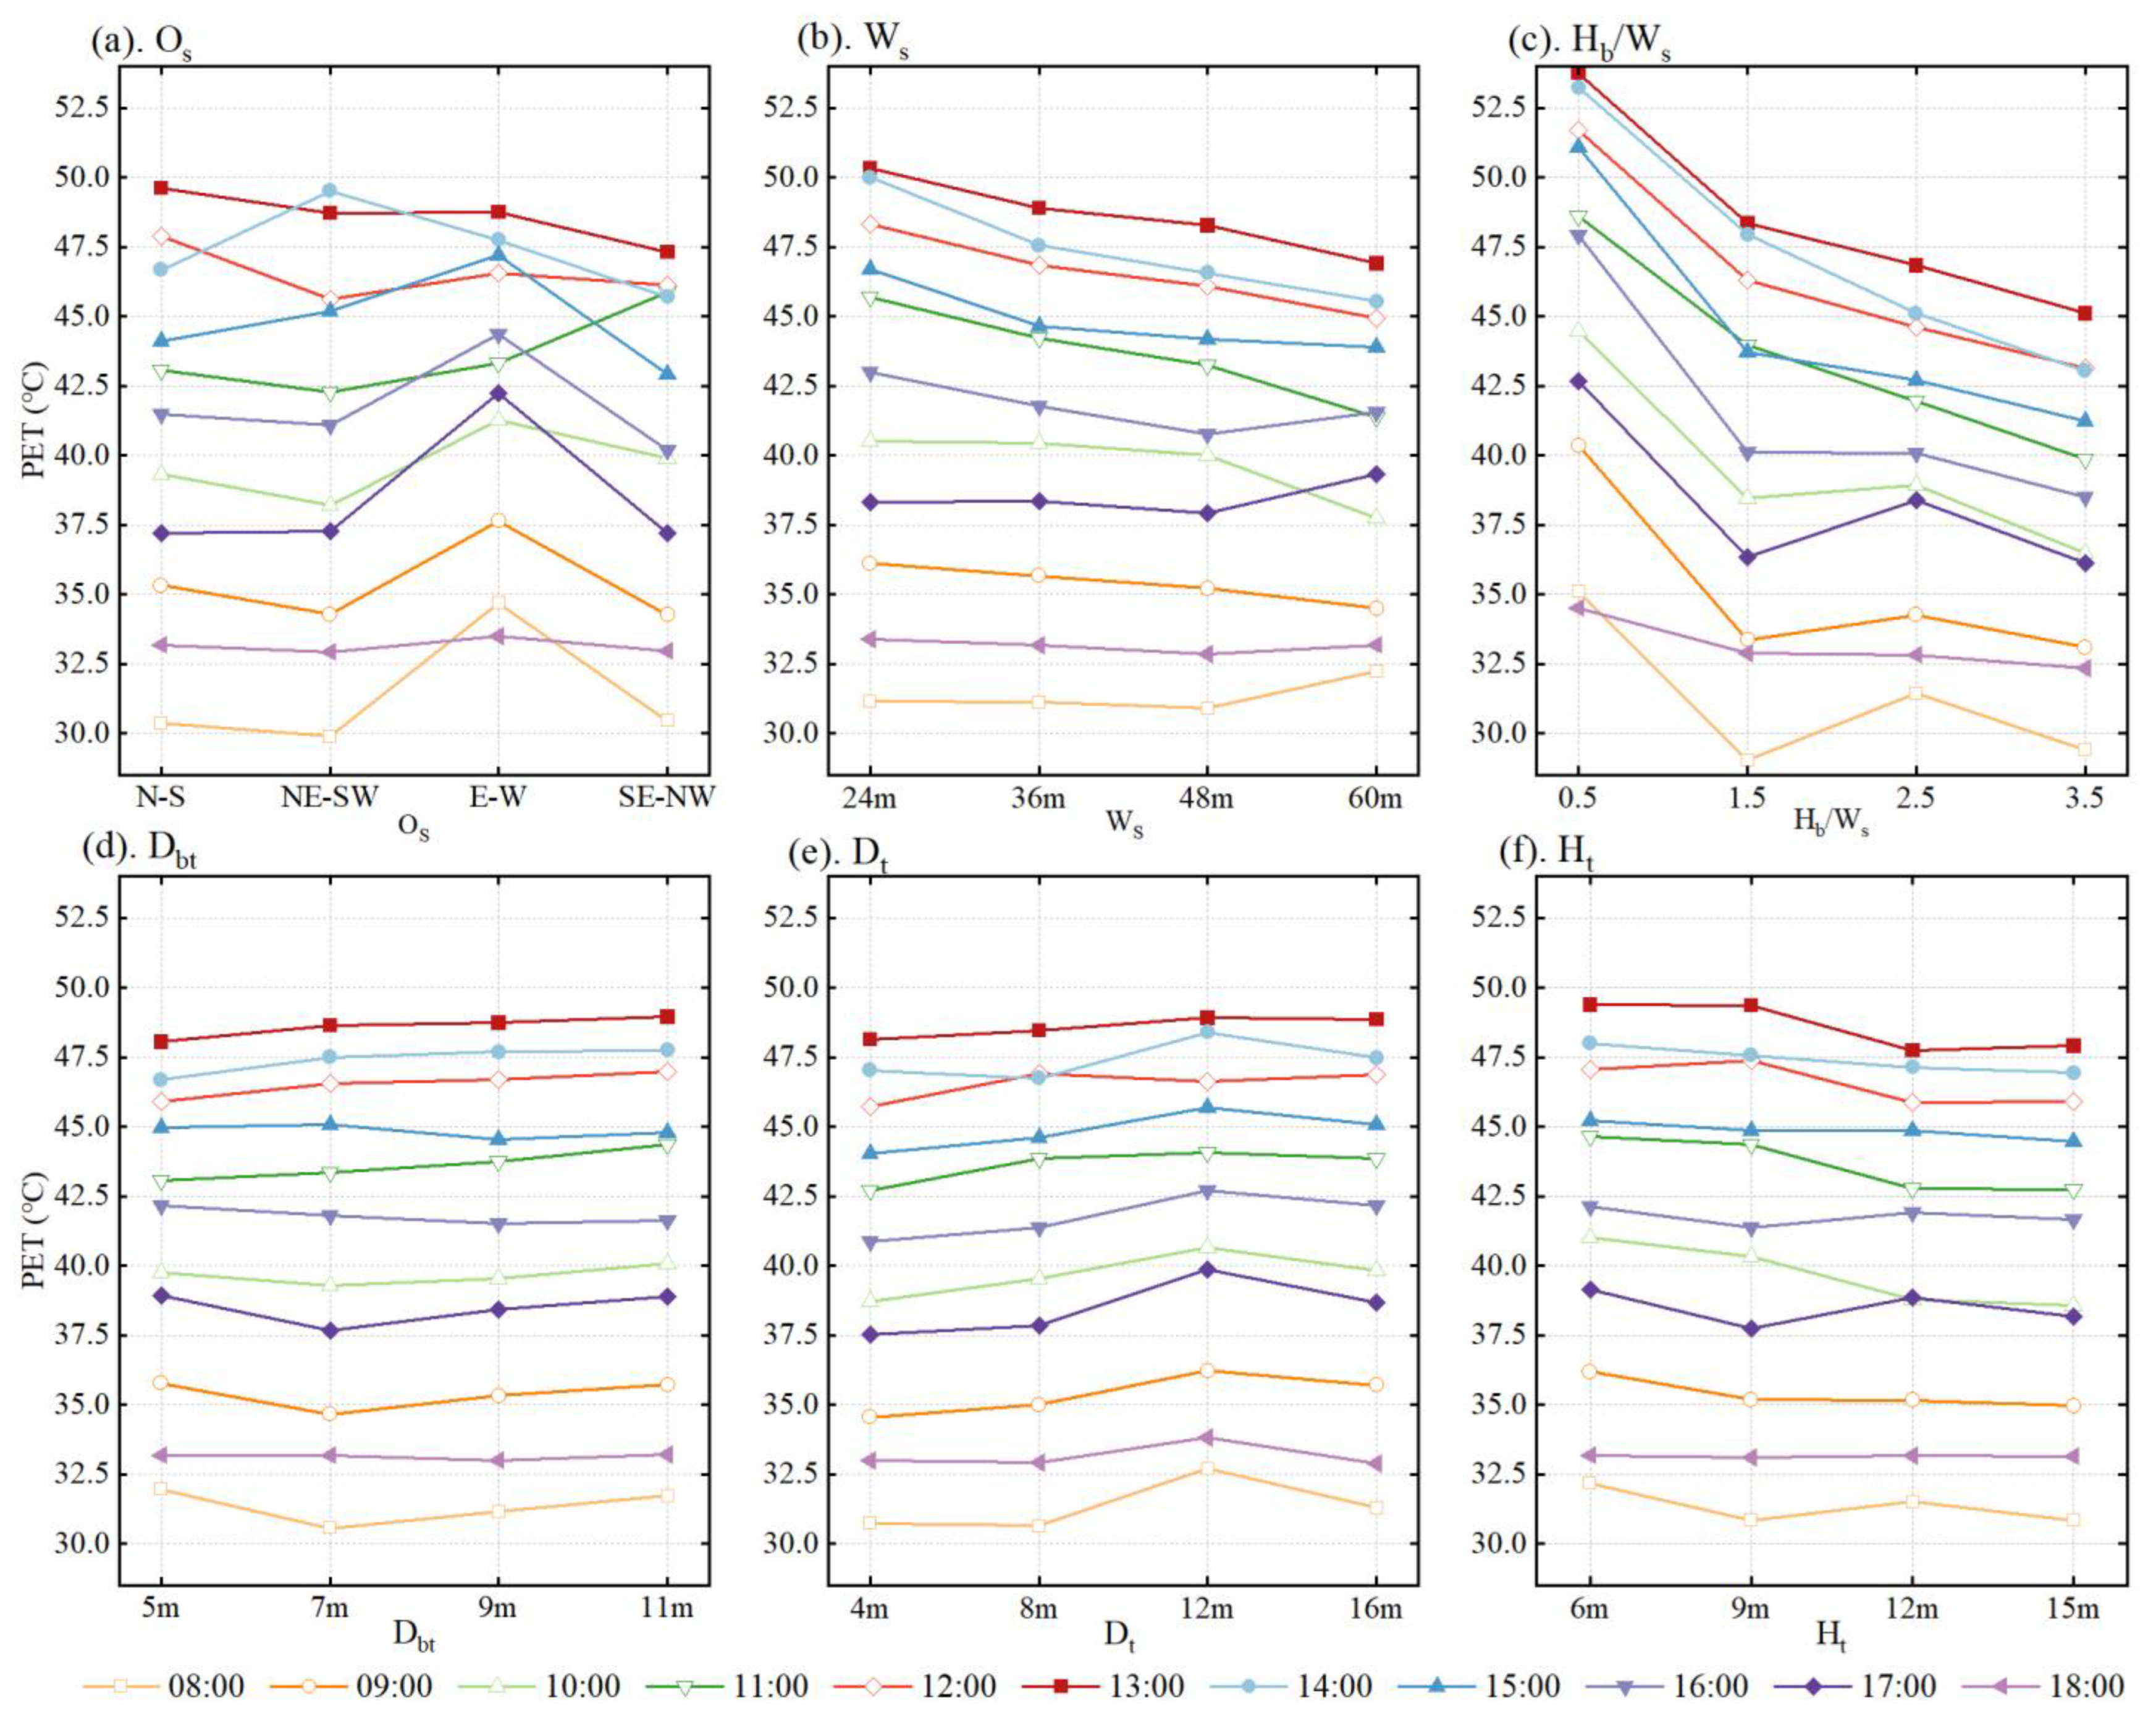
Figure 10.
PET differences at different time periods from 08:00 to 18:00.
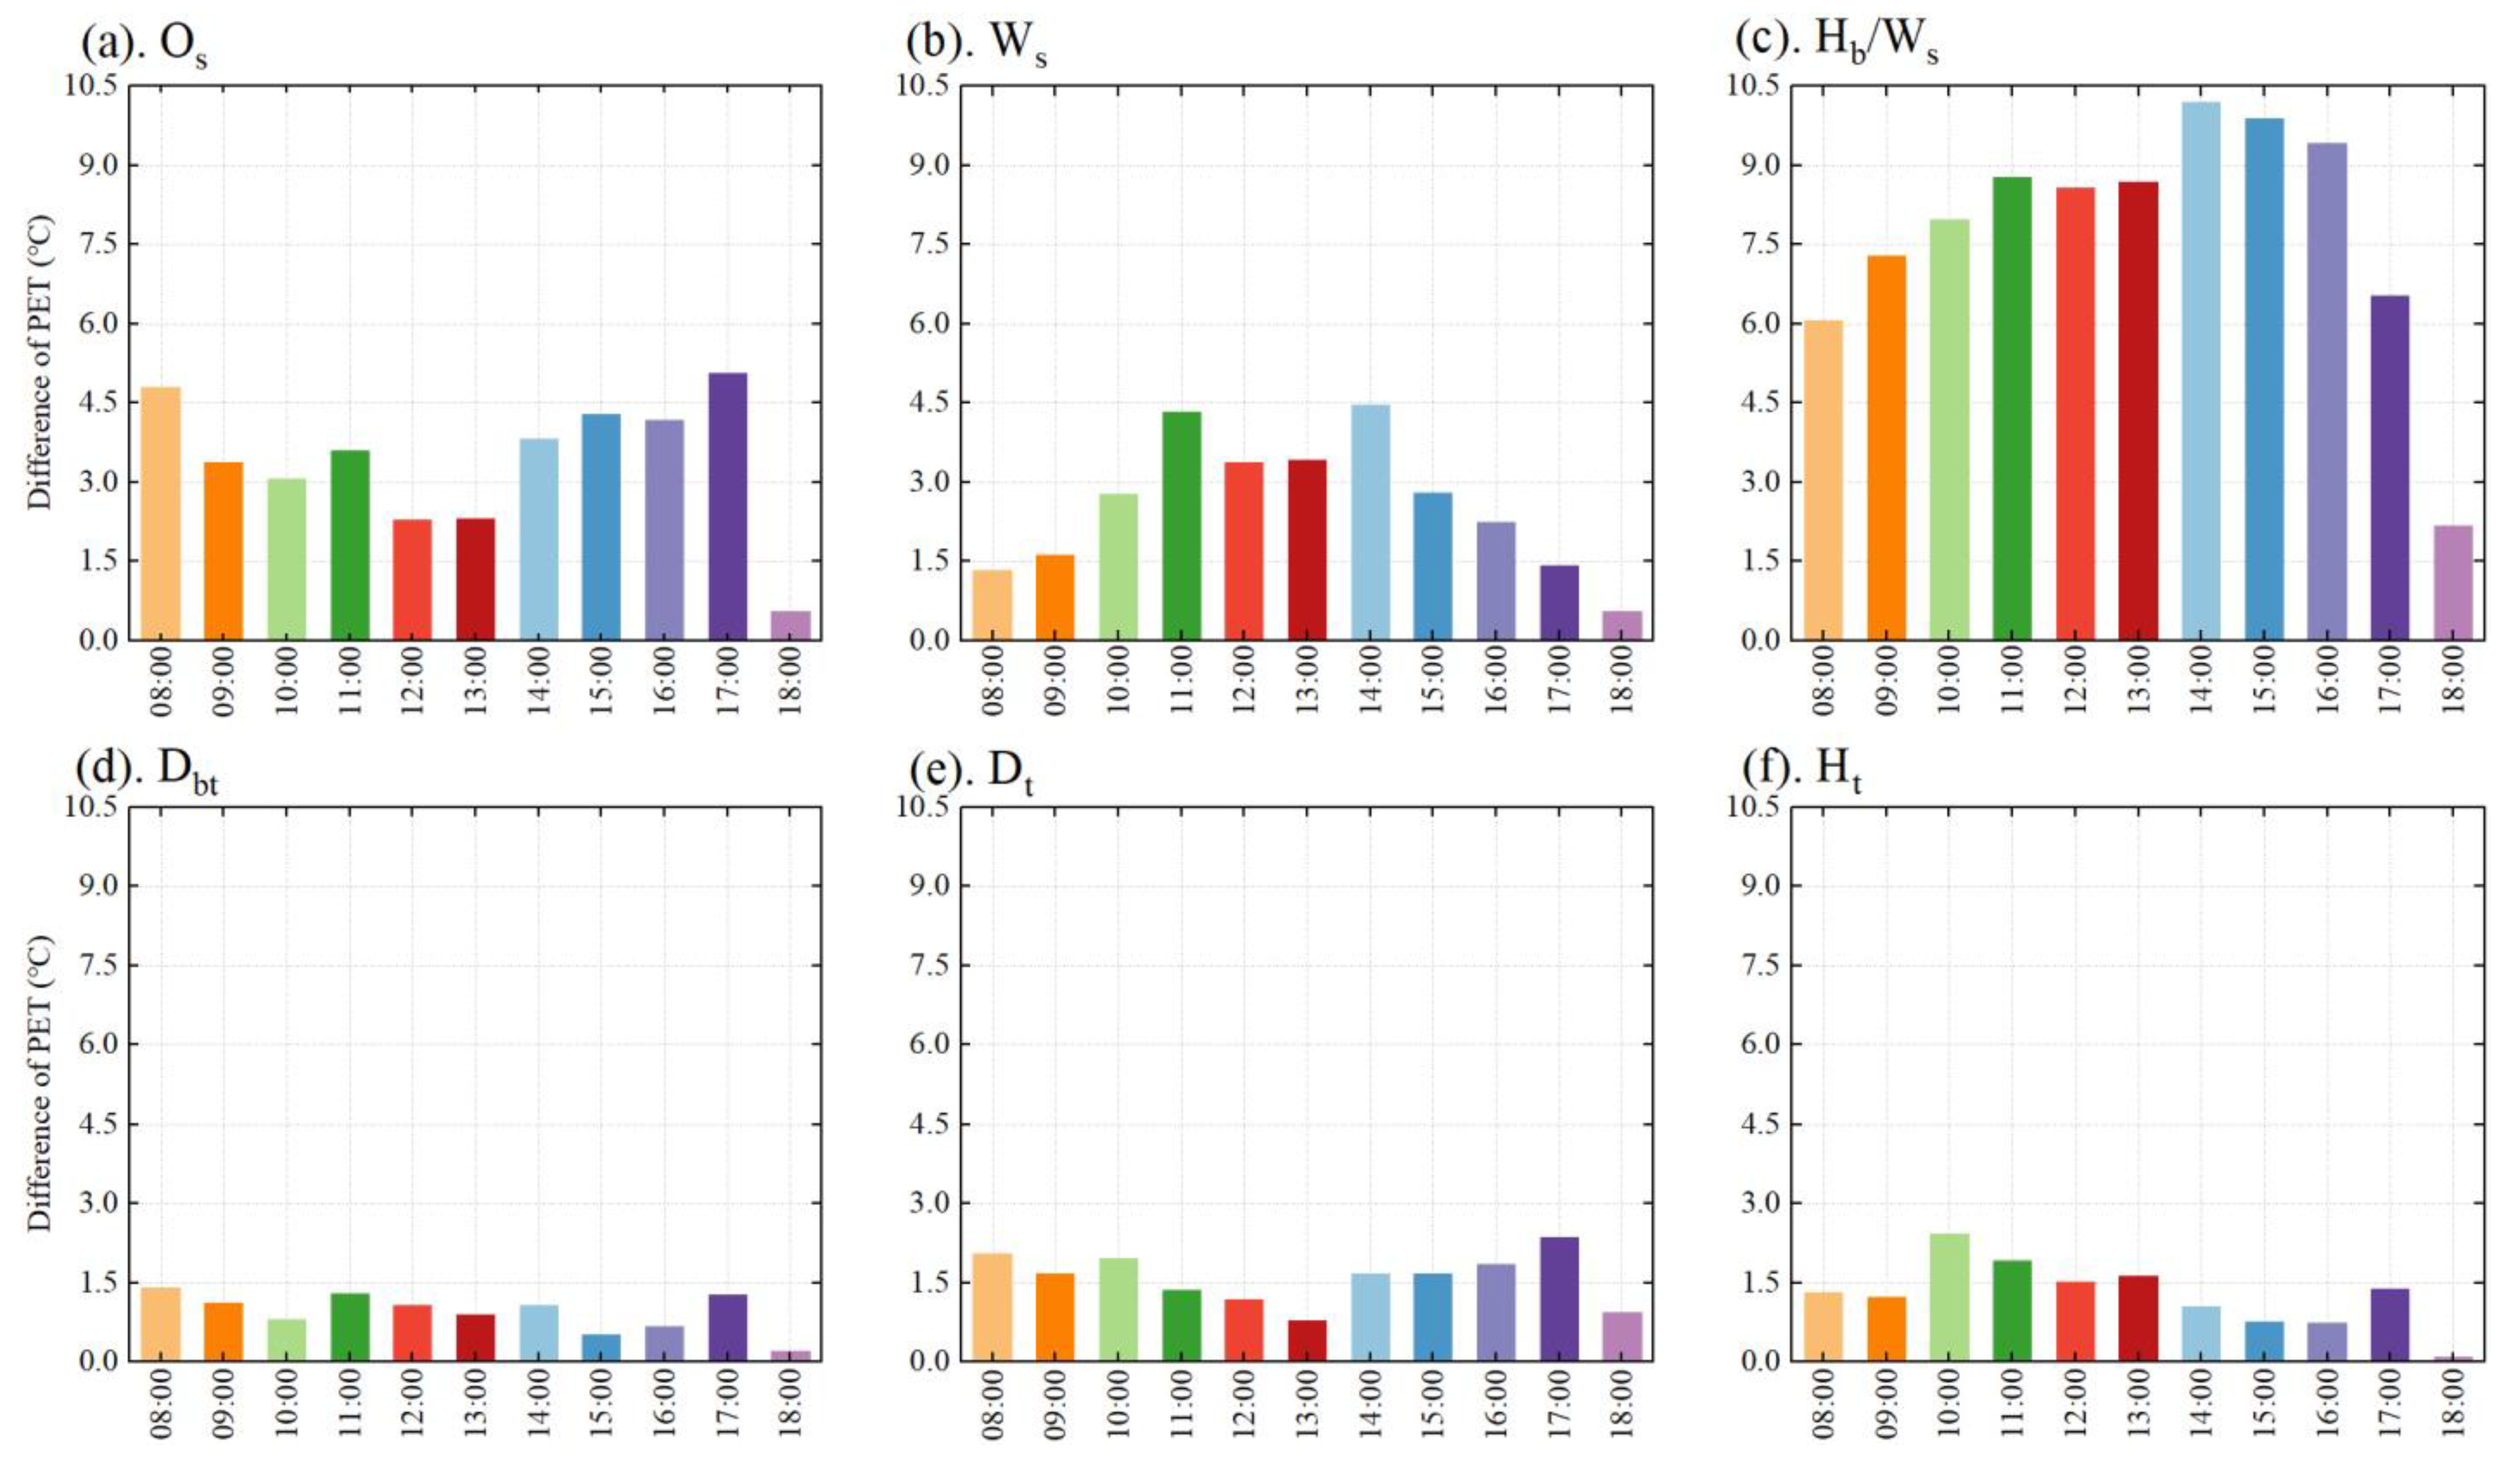
Figure 11.
q-statistics for the TA according to interactions between factors from 08:00 to 18:00.
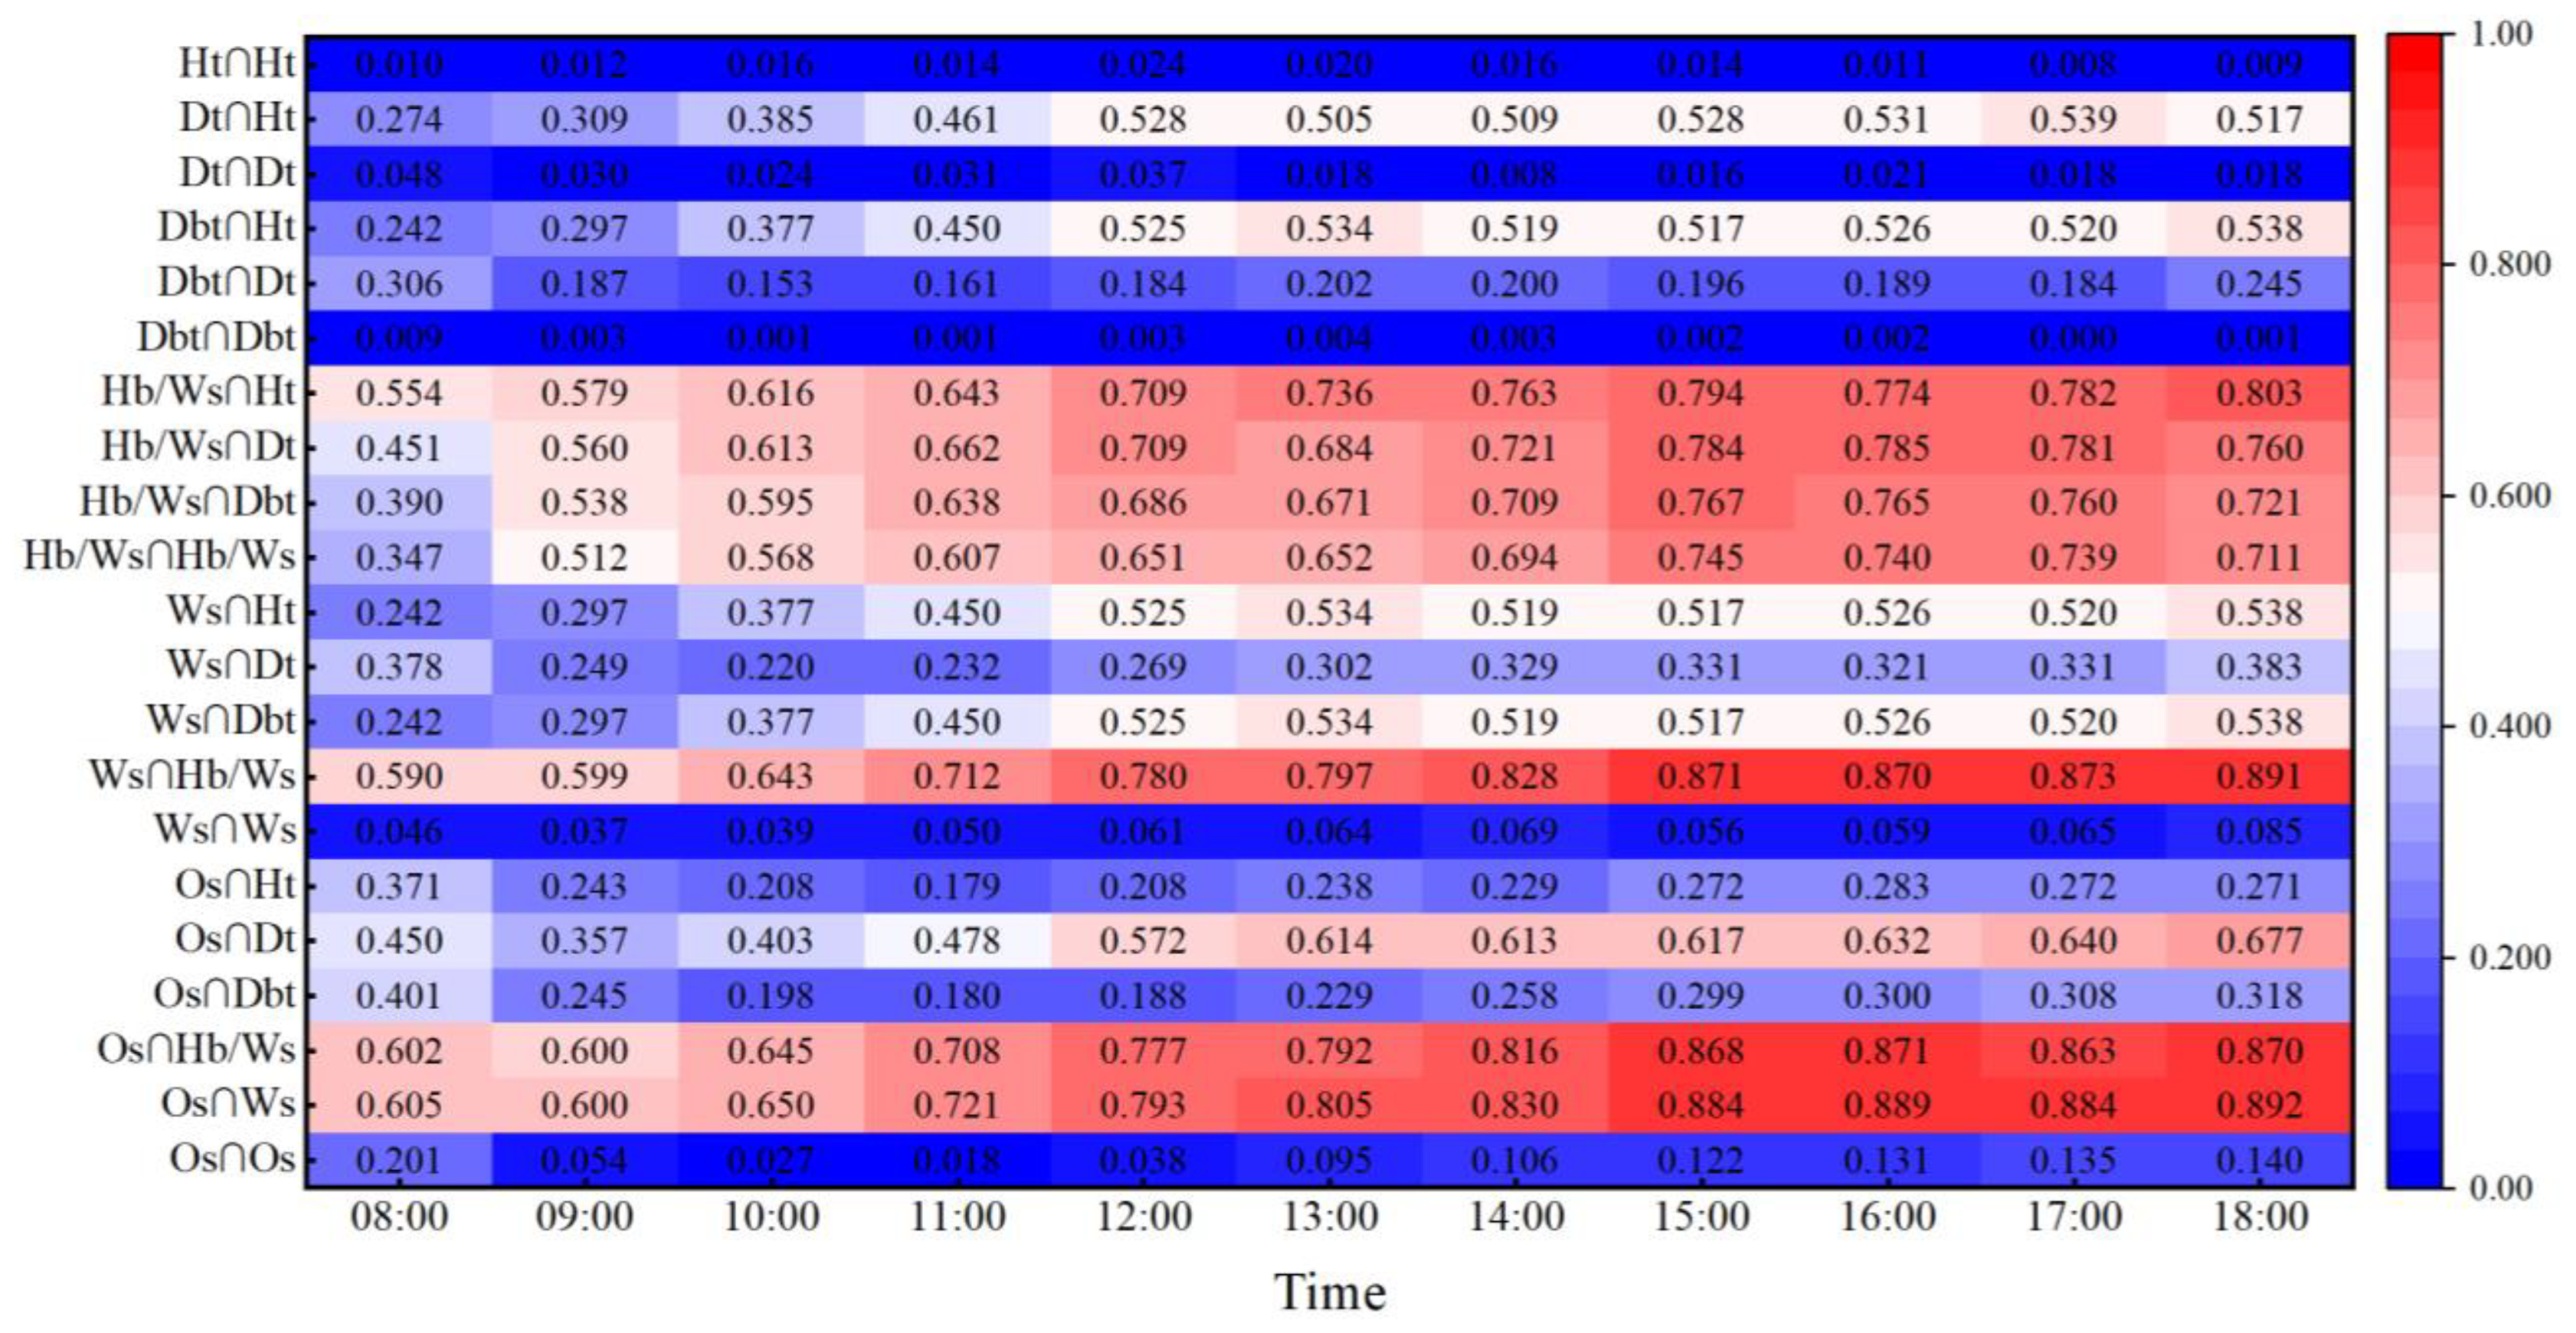
Figure 12.
q-statistics for the WVEL according to interactions between factors from 08:00 to 18:00.
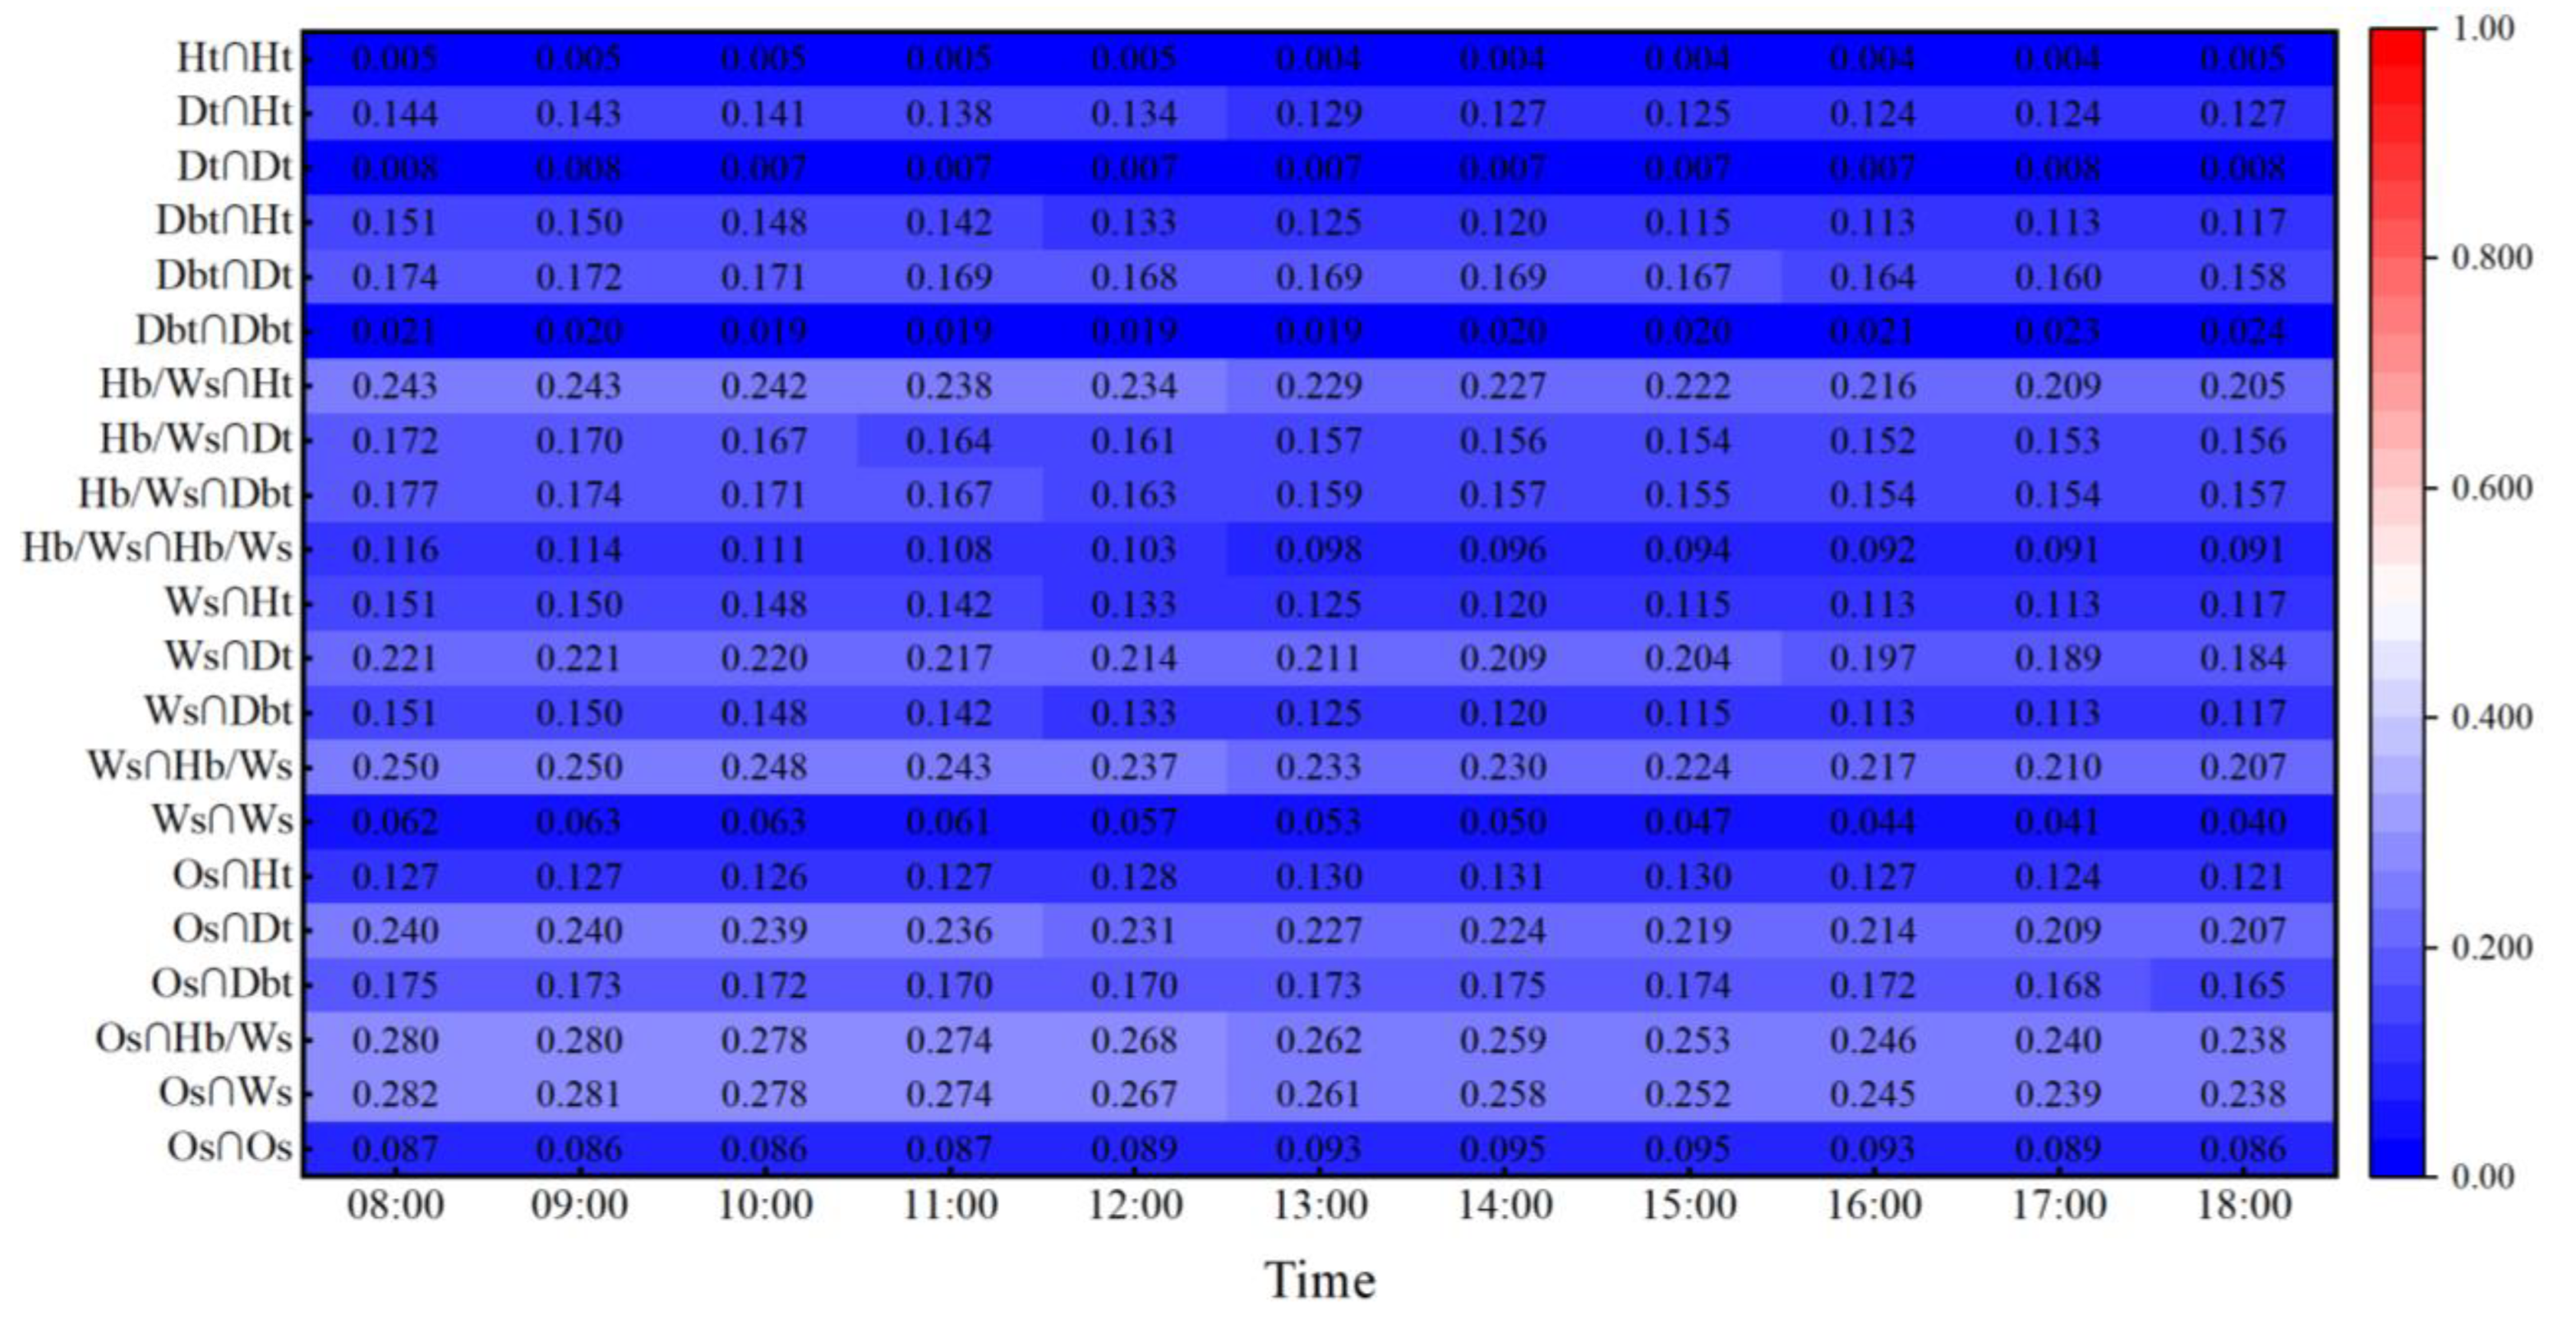
Figure 13.
q-statistics for the PET based on interactions between factors from 08:00 to 18:00.

Table 1.
Field measurement results of the representative sites.
| Site ID | OC1 | OC2 | OC3 | OC4 | CC1 | CC2 | CC3 | CC4 |
| Image |  |  |  |  |  |  |  |  |
| Street length (m) | 105 | 137 | 148 | 156 | 146 | 154 | 211 | 170 |
| Ws (m) | 17 | 41 | 36 | 21 | 20 | 33 | 49 | 25 |
| Os | S by E 18° | E by S 16° | E by N 18° | E by N 16° | S by E 34° | N by E 32° | E | E |
| Ave. Hb/Ws | 0.9 | 0.8 | 0.5 | 1.3 | 1.5 | 1.7 | 1.6 | 1.2 |
| Ave. Dbt (m) | 3.8 | 6.1 | 6 | - | 4.3 | 5.2 | 7.5 | 3.8 |
| Ave. Dt (m) | 8 | 12 | 10.7 | - | 6.2 | 9.6 | 13.2 | 10.2 |
| Ave. Ht (m) | 12.2 | 15.4 | 14.7 | - | 7.3 | 17.4 | 13.8 | 15.6 |
| Tree species | Gingko | Gingko | Gingko | - | Zelkova | Platanus | Zelkova | Gingko |
| Site ID | CC5 | CC6 | NC1 | NC2 | NC3 | NC4 | NC5 | |
| Image |  |  |  |  |  |  |  | |
| Street length (m) | 142 | 122 | 171 | 202 | 284 | 212 | 333 | |
| Ws (m) | 25 | 33 | 34 | 36 | 44 | 38 | 67 | |
| Os | S | S | S by E 34° | E by N 35° | E by S 29° | E by N 34° | E by N 34° | |
| Ave. Hb/Ws | 1 | 1.3 | 1.2 | 2.8 | 1.4 | 2.5 | 1.3 | |
| Ave. Dbt (m) | 5.7 | 4.8 | 10.3 | 8.1 | 9.2 | 7.6 | 16.3 | |
| Ave. Dt (m) | 9.9 | 10.3 | 6.5 | 8.1 | 7.9 | 7.4 | 7 | |
| Ave. Ht (m) | 12.9 | 16.4 | 9.2 | 8.6 | 9 | 9.2 | 10.4 | |
| Tree species | Platanus | Gingko | Zelkova | Zelkova | Zelkova | Zelkova | Zelkova |
Note: Nampodong: old city-center area, OC; Seomyeon: present city-center area, CC; Centum City: new city-center area, NC.
Table 2.
Values of factor settings.
| Factors | Level 1 | Level 2 | Level 3 | Level 4 | |
|---|---|---|---|---|---|
| Street geometry | Ws | 24 m | 36 m | 48 m | 60 m |
| Os | NS | EW | NESW | SENW | |
| Hb/Ws | 0.5 | 1.5 | 2.5 | 3.5 | |
| Tree configuration | Dbt | 4 m | 8 m | 12 m | 16 m |
| Dt | 5 m | 7 m | 9 m | 11 m | |
| Ht | 6 m | 9 m | 12 m | 15 m |
Table 3.
L32 (49) orthogonal array.
| No. | Os | Ws (m) | Hb/Ws | Dbt (m) | Dt (m) | Ht (m) | No. | Os | Ws (m) | Hb/Ws | Dbt (m) | Dt (m) | Ht (m) |
|---|---|---|---|---|---|---|---|---|---|---|---|---|---|
| 1 | NS | 24 | 0.5 | 4 | 5 | 6 | 17 | NS | 24 | 0.5 | 12 | 7 | 12 |
| 2 | EW | 24 | 1.5 | 8 | 7 | 9 | 18 | EW | 24 | 2.5 | 16 | 5 | 15 |
| 3 | NESW | 24 | 2.5 | 12 | 9 | 12 | 19 | NESW | 24 | 1.5 | 4 | 11 | 6 |
| 4 | SENW | 24 | 3.5 | 16 | 11 | 15 | 20 | SENW | 24 | 3.5 | 8 | 9 | 9 |
| 5 | NS | 36 | 1.5 | 12 | 9 | 12 | 21 | NS | 36 | 1.5 | 4 | 11 | 6 |
| 6 | EW | 36 | 0.5 | 16 | 11 | 15 | 22 | EW | 36 | 0.5 | 8 | 9 | 9 |
| 7 | NESW | 36 | 3.5 | 4 | 5 | 6 | 23 | NESW | 36 | 3.5 | 12 | 7 | 12 |
| 8 | SENW | 36 | 2.5 | 8 | 7 | 9 | 24 | SENW | 36 | 2.5 | 16 | 5 | 15 |
| 9 | NS | 48 | 2.5 | 8 | 5 | 9 | 25 | NS | 48 | 2.5 | 16 | 7 | 15 |
| 10 | EW | 48 | 3.5 | 4 | 7 | 6 | 26 | EW | 48 | 3.5 | 12 | 5 | 12 |
| 11 | NESW | 48 | 0.5 | 16 | 9 | 15 | 27 | NESW | 48 | 0.5 | 8 | 11 | 9 |
| 12 | SENW | 48 | 1.5 | 12 | 11 | 12 | 28 | SENW | 48 | 1.5 | 4 | 9 | 6 |
| 13 | NS | 60 | 3.5 | 16 | 9 | 15 | 29 | NS | 60 | 3.5 | 8 | 11 | 9 |
| 14 | EW | 60 | 2.5 | 12 | 11 | 12 | 30 | EW | 60 | 2.5 | 4 | 9 | 6 |
| 15 | NESW | 60 | 1.5 | 8 | 5 | 9 | 31 | NESW | 60 | 1.5 | 16 | 7 | 15 |
| 16 | SENW | 60 | 0.5 | 4 | 7 | 6 | 32 | SENW | 60 | 0.5 | 12 | 5 | 12 |
Table 4.
Initial settings of the ENVI-met simulation.
| General Simulation Settings | Parameter |
|---|---|
| Location | Busan, South Korea: 35.05° N, 128.35° E |
| Simulation dates | 13–14 August 2016 |
| Nesting grids | 5 |
| Grid size | 2 m × 2 m × 2 m |
| Initial wind speed | 2.8 m/s |
| Wind direction (N = 0°, E = 90°…) | 200° |
| Roughness length | 0.1 |
| Lateral boundary conditions | Forced using TA and RH (Table 5) |
Table 5.
Weather data from the Busan meteorological station for 14 August 2016.
| Time | 0:00 | 1:00 | 2:00 | 3:00 | 4:00 | 5:00 | 6:00 | 7:00 |
| TA (°C) | 29.7 | 29.4 | 28.9 | 28.6 | 28.7 | 28.8 | 28.6 | 29.5 |
| RH (%) | 62.5 | 65.3 | 69.1 | 70.9 | 70.0 | 71.2 | 71.6 | 69.2 |
| Time | 8:00 | 9:00 | 10:00 | 11:00 | 12:00 | 13:00 | 14:00 | 15:00 |
| TA (°C) | 31.2 | 33.0 | 34.3 | 35.1 | 36.6 | 36.4 | 35.7 | 34.5 |
| RH (%) | 63.1 | 57.8 | 54.5 | 51.8 | 47.5 | 49.4 | 51.7 | 56.2 |
| Time | 16:00 | 17:00 | 18:00 | 19:00 | 20:00 | 21:00 | 22:00 | 23:00 |
| TA (°C) | 34.0 | 32.9 | 32.6 | 31.3 | 30.7 | 30.5 | 30.5 | 30.3 |
| RH (%) | 57.0 | 62.6 | 63.6 | 68.2 | 70.5 | 71.9 | 70.1 | 69.4 |
Table 6.
Instrument accuracy used for field measurements.
| Measurement Instruments | Parameter Measured | Accuracy |
|---|---|---|
| Testo CO₂ probe (digital) with Bluetooth®, including a temperature and humidity sensor | TA | ±0.5 °C |
| RH | ±3%RH (10 to 35%RH) ±2%RH (35 to 65%RH) ±3%RH (65 to 90%RH) ±5%RH (remaining range) | |
| Testo 417 | WVEL | ±(0.1 m/s + 1.5% of mv) |
| Testo 440 | Data logger | Logging interval: 1 s to 16 min |
Table 7.
Simplified model of the research area.
| Site | Current Layout | ENVI-Met Model |
|---|---|---|
| Nampodong | 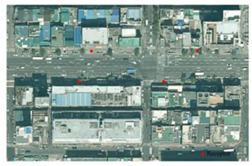 | 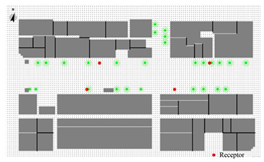 |
| Centum City | 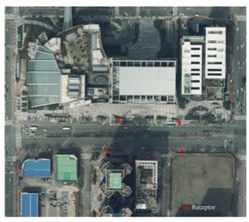 | 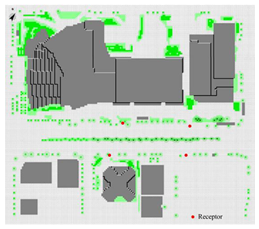 |
Table 8.
Initial settings of the ENVI-met simulation for validation.
| District | Nampodong | Centum City |
|---|---|---|
| Location in ENVI-met | Busan, South Korea: 35.05° N, 128.35° E | |
| Simulation dates | 28~29 July 2022 | 05~06 August 2022 |
| Analysis time | 06:00~18:00, 29 July 2022 | 06:00~18:00, 06 August 2022 |
| Nesting grids | 5 | |
| Grid size | 2 m × 2 m × 2 m | |
| TA and RH | Meteorological data from ASOS | |
| Initial wind speed | 3.6 m/s | 2.6 m/s |
| Wind direction (N = 0°, E = 90°…) | 180° | 90° |
| Roughness length | 0.1 | 0.1 |
| Lateral boundary conditions | Full forcing | |
Table 9.
Comparison of SVFreal and SVFmodel results.
| Nampodong | Point 1 | Point 2 | Point 3 | Point-4 |
| Fisheye image |  |  |  |  |
| SVFreal | 0.43 | 0.22 | 0.46 | 0.26 |
| SVFmodel | 0.42 | 0.23 | 0.46 | 0.24 |
| Centum City | Point 1 | Point 2 | Point 3 | Point-4 |
| Fisheye image |  |  |  |  |
| SVFreal | 0.13 | 0.40 | 0.44 | 0.14 |
| SVFmodel | 0.15 | 0.38 | 0.49 | 0.16 |
Table 10.
Results of significance tests for the TA from 08:00 to 18:00.
| Factor | Os | Ws | Hb/Ws | Dbt | Dt | Ht | ||||||
|---|---|---|---|---|---|---|---|---|---|---|---|---|
| F | p-Value | F | p-Value | F | p-Value | F | p-Value | F | p-Value | F | p-Value | |
| 8:00 | 24.795 | 0.000 | 1.010 | 0.428 | 39.262 | 0.000 | 0.723 | 0.561 | 4.194 | 0.037 | 0.638 | 0.608 |
| 9:00 | 21.185 | 0.000 | 0.676 | 0.586 | 163.524 | 0.000 | 0.313 | 0.816 | 5.896 | 0.014 | 3.516 | 0.057 |
| 10:00 | 26.570 | 0.000 | 3.103 | 0.076 | 300.111 | 0.000 | 0.270 | 0.845 | 7.038 | 0.008 | 11.970 | 0.001 |
| 11:00 | 10.566 | 0.002 | 6.828 | 0.009 | 144.112 | 0.000 | 0.312 | 0.816 | 4.064 | 0.040 | 5.645 | 0.016 |
| 12:00 | 11.177 | 0.002 | 6.650 | 0.010 | 123.280 | 0.000 | 0.480 | 0.703 | 4.876 | 0.024 | 4.944 | 0.023 |
| 13:00 | 27.973 | 0.000 | 12.258 | 0.001 | 200.661 | 0.000 | 0.645 | 0.604 | 4.751 | 0.026 | 6.111 | 0.012 |
| 14:00 | 26.168 | 0.000 | 25.321 | 0.000 | 263.025 | 0.000 | 0.744 | 0.550 | 4.096 | 0.039 | 4.561 | 0.029 |
| 15:00 | 38.915 | 0.000 | 31.189 | 0.000 | 349.979 | 0.000 | 1.962 | 0.184 | 5.675 | 0.016 | 5.170 | 0.021 |
| 16:00 | 45.142 | 0.000 | 29.800 | 0.000 | 342.313 | 0.000 | 2.129 | 0.160 | 7.508 | 0.006 | 2.982 | 0.083 |
| 17:00 | 26.008 | 0.000 | 17.997 | 0.000 | 205.829 | 0.000 | 0.772 | 0.536 | 5.116 | 0.021 | 0.944 | 0.456 |
| 18:00 | 15.415 | 0.000 | 12.365 | 0.001 | 108.858 | 0.000 | 0.338 | 0.799 | 4.131 | 0.038 | 0.447 | 0.725 |
Table 11.
Results of difference and significance tests for the WVEL at 13:00.
| Factor | Difference | F | p-Value |
|---|---|---|---|
| Os | 0.5 | 11.047 | 0.002 |
| Ws | 0.5 | 8.832 | 0.004 |
| Hb/Ws | 0.5 | 11.952 | 0.001 |
| Dbt | 0.3 | 3.416 | 0.061 |
| Dt | 0.2 | 1.306 | 0.326 |
| Ht | 0.1 | 1.045 | 0.414 |
Table 12.
Results of significance tests for the PET from 08:00 to 18:00.
| Factor | Os | Ws | Hb/Ws | Dbt | Dt | Ht | ||||||
|---|---|---|---|---|---|---|---|---|---|---|---|---|
| F | p-Value | F | p-Value | F | p-Value | F | p-Value | F | p-Value | F | p-Value | |
| 8:00 | 30.648 | 0.000 | 2.357 | 0.133 | 43.061 | 0.000 | 2.589 | 0.111 | 5.843 | 0.014 | 2.329 | 0.136 |
| 9:00 | 21.240 | 0.000 | 3.838 | 0.046 | 91.971 | 0.000 | 2.235 | 0.147 | 5.033 | 0.022 | 3.083 | 0.077 |
| 10:00 | 7.748 | 0.006 | 7.362 | 0.007 | 50.425 | 0.000 | 0.427 | 0.738 | 3.270 | 0.067 | 6.711 | 0.009 |
| 11:00 | 3.201 | 0.071 | 3.747 | 0.049 | 16.722 | 0.000 | 0.077 | 0.971 | 0.887 | 0.481 | 1.841 | 0.203 |
| 12:00 | 4.633 | 0.028 | 7.316 | 0.007 | 52.581 | 0.000 | 0.086 | 0.966 | 2.470 | 0.122 | 3.542 | 0.056 |
| 13:00 | 10.075 | 0.002 | 20.460 | 0.000 | 146.193 | 0.000 | 0.183 | 0.905 | 3.727 | 0.049 | 11.930 | 0.001 |
| 14:00 | 16.795 | 0.000 | 27.143 | 0.000 | 147.296 | 0.000 | 0.414 | 0.747 | 5.959 | 0.013 | 4.907 | 0.024 |
| 15:00 | 22.193 | 0.000 | 9.095 | 0.003 | 113.378 | 0.000 | 1.220 | 0.353 | 5.026 | 0.022 | 2.336 | 0.135 |
| 16:00 | 20.728 | 0.000 | 4.800 | 0.025 | 100.720 | 0.000 | 1.286 | 0.332 | 5.186 | 0.020 | 1.293 | 0.330 |
| 17:00 | 23.720 | 0.000 | 1.433 | 0.291 | 31.960 | 0.000 | 1.375 | 0.306 | 4.334 | 0.034 | 1.613 | 0.248 |
| 18:00 | 1.832 | 0.205 | 1.253 | 0.342 | 21.962 | 0.000 | 0.230 | 0.874 | 4.789 | 0.026 | 0.081 | 0.969 |
Disclaimer/Publisher’s Note: The statements, opinions and data contained in all publications are solely those of the individual author(s) and contributor(s) and not of MDPI and/or the editor(s). MDPI and/or the editor(s) disclaim responsibility for any injury to people or property resulting from any ideas, methods, instructions or products referred to in the content. |
© 2024 by the authors. Licensee MDPI, Basel, Switzerland. This article is an open access article distributed under the terms and conditions of the Creative Commons Attribution (CC BY) license (https://creativecommons.org/licenses/by/4.0/).
Share and Cite
MDPI and ACS Style
Wu, J.; Wang, Y.; Li, S.; Wu, Q.; Lee, T.; Yoon, S. Quantitative Study on the Effects of Street Geometries and Tree Configurations on the Outdoor Thermal Environment. Energies 2024, 17, 2223. https://doi.org/10.3390/en17092223
AMA Style
Wu J, Wang Y, Li S, Wu Q, Lee T, Yoon S. Quantitative Study on the Effects of Street Geometries and Tree Configurations on the Outdoor Thermal Environment. Energies. 2024; 17(9):2223. https://doi.org/10.3390/en17092223
Chicago/Turabian StyleWu, Jindong, Yu Wang, Shuhua Li, Qitao Wu, Taecheol Lee, and Seonghwan Yoon. 2024. "Quantitative Study on the Effects of Street Geometries and Tree Configurations on the Outdoor Thermal Environment" Energies 17, no. 9: 2223. https://doi.org/10.3390/en17092223
Note that from the first issue of 2016, this journal uses article numbers instead of page numbers. See further details here.