
A Computational Methodology for Assessing Wind Potential

1
Institute for Advanced Modelling and Simulation, University of Nicosia, Nicosia CY-2417, Cyprus
2
Environmental Chemical Processes Laboratory, Department of Chemistry, University of Crete, GR-700 13 Heraklion, Greece
3
Laboratory of Applied Mathematics, University of Crete, GR-700 13 Heraklion, Greece
4
Department of Meteorology and Geophysics, University of Vienna, AT-1010 Vienna, Austria
*
Author to whom correspondence should be addressed.
Energies 2024, 17(6), 1385; https://doi.org/10.3390/en17061385
Submission received: 11 January 2024
/
Revised: 4 March 2024
/
Accepted: 8 March 2024
/
Published: 13 March 2024
(This article belongs to the Special Issue Numerical Simulation and Computational Fluid Dynamics for Wind Energy)
Abstract
:This paper introduces an innovative and eco-friendly computational methodology to assess the wind potential of a location with the aid of high-resolution simulations with a mesoscale numerical weather prediction model (WRF), coupled with the statistical “10% sampling condition”. The proposed methodology is tested for a location with complex terrain on the Greek island of Crete, where moderate to strong winds prevail for most of the year. The results are promising, indicating that this method has great potential for studying and assessing areas of interest. Adverse effects and challenges associated with wind energy production may be mitigated with methods such as the proposed one. Mitigating such effects should constitute the main focus and priority in research concerning wind energy production.
1. Introduction
Wind energy has become crucial in sustainable power generation. Past studies [1,2] have discussed the environmental benefits of harnessing wind power and transforming it into electricity. Notable developments include the design of more efficient and large wind turbines, exemplified by models like the GE Haliade-X and Vestas V162-6.0 MW. These turbines integrate advancements in aerodynamics, materials, and control systems, as highlighted in research studies [3,4,5], emphasising the pivotal role of aerodynamic improvements in contemporary wind turbine design. Expanding offshore wind farms also represent an essential development in the wind energy landscape, addressing land constraints associated with onshore installations. The Dogger Bank, with 3.6 GW potential capability, is the world’s largest offshore wind farm [6], demonstrating the scalability and potential of offshore wind energy [7,8].
Although the current landscape of wind energy reflects a convergence of technological breakthroughs, from advanced turbine designs to intelligent management systems, propelling us towards a cleaner and more sustainable energy future, it is essential to comprehensively assess negative environmental impacts to ensure a balanced perspective [9]. Many of these impacts can be mitigated if a proper wind energy potential assessment is carried out. Given that, some sites may be proven inadequate to be chosen for installation. Thus, one can avoid unnecessarily impacting the environment by examining different sites and mitigation strategies.
Assessing the suitability of a location regarding its wind energy potential requires a systematic process that encompasses various stages ranging from meteorological analysis and site characterisation to the numerical simulations using sophisticated modelling techniques [10,11,12,13,14,15]. Computational Fluid Dynamics (CFDs) have been pivotal in simulating airflow around wind turbines and farms and contributing to the development of wind turbine technologies by optimising blade designs, enhancing aerodynamic efficiency, and reducing structural loads [16,17,18,19]. Moreover, real-time monitoring and predictive maintenance systems showcase the application of smart technologies and machine learning (ML) algorithms in wind farm management, thus enabling early issue detection and minimising downtime [19,20].
Assessing a site’s wind potential requires collecting meteorological data from the particular location, including wind speed and direction at various heights, to understand the local wind climate and form the basis for subsequent analyses. This process could be expensive and time-consuming since it requires sophisticated equipment and measurements over an extended period to capture seasonal variations. Furthermore, once the meteorological data are collected, state-of-the-art numerical models can assist in data analysis. These models range from regional to larger scales, attempting to resolve complex interactions between the atmosphere and the local topography, thus allowing for the prediction of wind flow patterns and speeds [21,22,23]. Moreover, using advanced computational tools enables environmental engineers to simulate the impact of wind energy installations on the surrounding environment and optimise the layout for maximum energy yield while minimising adverse effects. The above models are computationally demanding to implement because of the complex terrain, the long periods required to be studied, and the associated computational resources required.
This paper introduces a novel methodology that provides a fast and ecologically friendly way of assessing and evaluating a location’s wind potential through a mesoscale numerical weather prediction (NWP) model and statistical theory. The methodology is presented in detail and tested for a specific location, where continuous anemometric data were available for 10 months. Directions for future research to explore the proposed methodology further are also presented.
2. Methodology for Assessing the Wind Potential of a Location
This study introduces an innovative methodology for assessing the wind potential of a given geographic area. The proposed approach is characterised by its ecological friendliness, as it circumvents the need to install traditional wind measurement equipment. Moreover, it demonstrates high efficiency by avoiding time-consuming simulations, relying instead on a statistical principle that posits that a randomly chosen 10% sample is an adequate representation of the entire data set (“10% sampling condition”) [24,25]. The methodology is validated using wind measurement data collected over ten months on the island of Crete.
The proposed methodology begins with identifying a region of interest for wind potential assessment. Subsequently, three days from each month are randomly selected, constituting 10% of the month’s duration. This selection is grounded in the statistical premise that this subset adequately represents the entire month.
A high-resolution NWP model is employed to simulate atmospheric conditions for these three chosen days of the month to estimate the wind potential. The simulation results are averaged, comprehensively representing the average wind potential for the specific location during that month. This process is very cost-effective and eliminates the need for extensive and time-consuming simulations.
The effectiveness of this methodology is demonstrated using recent wind measurement data obtained over 10 months from the Greek island of Crete. Our aim is twofold: (i) to introduce the “10% sampling condition” and demonstrate through simulations how it works; and (ii) to present data for topography in Southern Europe, where such a study has not been published before. A comparison between the model-generated and actual wind measurement data is provided. Remarkable agreement between the two data sets is observed, indicating that the proposed methodology accurately captures and represents the wind potential of the selected location.
2.1. Wind Measurements in Crete
The Greek island of Crete, due to its location in the eastern Mediterranean Sea and its convoluted topography, has been the subject of many studies over the past decades regarding its wind potential [26,27,28,29,30]. The first vital effort to investigate the wind potential of Crete was presented in [31].
In particular, the northeastern region of Crete is highly important in wind energy studies since it constitutes one of the highest wind potential areas in the Eastern Mediterranean Sea. This is demonstrated in Figure 1a, where indicative results for wind velocities are presented from the Global Wind Atlas online framework [32], where the northeastern region of Crete displays wind velocities over 10 m/s at 100 m above ground level (agl), averaged between the years of 2008 and 2017. Where the Global Wind Atlas (GWA) framework was utilized, all data, information and maps were obtained from the Global Wind Atlas version 3.3, a free, web-based application developed, owned and operated by the Technical University of Denmark (DTU). The Global Wind Atlas version 3.3 is released in partnership with the World Bank Group, utilizing data provided by Vortex, using funding provided by the Energy Sector Management Assistance Program (ESMAP). For additional information see [33]. The following section will give further details about GWA comparisons with numerical predictions. In that region, at the site of Toplou (35°13′36″ N, 26°13′33″ E) at an altitude of approximately 213 m above sea level (Figure 1b), a 30 m mast surface wind station was installed [34] as recently as 2019. It provided continuous measurements between March and December 2019 (Figure 2). The site was carefully chosen to be representative of the Toplou topography and landscape, characterised by smooth hills on an extended ridge with sharp slopes to the north towards the coastline.
All measurements were made at 20 m, 28.5 m, and 30 m agl, in full compliance with the standards set by the World Meteorological Organization (WMO) for wind energy assessment studies [36]. The measurements consist of 10 min time averages, each taken from 30 sequential 20 s mean samples. The recorded wind data consists of the mean wind velocity and direction and their standard deviations and minimum and maximum speeds obtained from the thirty 20 s means during ten minutes. Consequently, the maximum velocities quoted here are lower than extreme wind velocities and gusts, often lasting a few seconds. The wind velocity is accurate to two decimal digits when expressed in m/s. At the same time, the wind direction was measured in degrees, clockwise, from 0° (north) to 360° and is accurate to one decimal digit. It is important to note that the minimum wind velocity that can be measured is 0.3 m/s. It must also be noted that the weather station provided full 10 min meteorological data, apart from wind velocities and directions, i.e., temperature, pressure, humidity, and rainfall min, max, average and standard deviation.
2.2. Toplou Wind Statistics
An analysis of the Toplou anemometric data is presented below. Eight 45-degree azimuthal direction sectors were used, the first centred along the geographic north with the rest continuing clockwise, namely north (N), northeast (NE), east (E), southeast (SE), south (S), southwest (SW), west (W), and northwest (NW). Measurements from the reference height of 20 m agl were chosen. The 20 m agl height represents a practical trade-off for representing free-flowing wind conditions by (a) minimising the impact of ground effects and (b) capturing the crucial characteristics of the lower atmosphere. Wherever necessary, some basic theoretical background is provided for better understanding.
Table 1 gives the distribution of measurements, or measurement occurrence, per wind direction sector and month of the year. All values in this table are expressed in percentages. In this way, we know what percentage of the wind blows from which direction during each month. As becomes evident from Table 1, the two dominant directions are the western and northwestern directions for each examined month. Figure 3 presents the corresponding wind rose of all observations. We have split the velocities into five fixed bands, namely: (a) from 0 to 4.99 m/s, (b) 5 to 9.99 m/s, (c) 10 to 14.99 m/s, (d) 15 to 19.99 m/s, and (e) velocities greater than 20 m/s. It is important to note that the highest measured velocity during the studied period was 23 m/s. Wind roses are graphical representations of the distribution of wind directions at a specific location over a certain period. They are commonly used in meteorology, climatology, and environmental science to visualise prevailing wind patterns. Wind roses provide valuable insights into the frequency and intensity of winds coming from different directions. For more information on wind roses, please refer to [37]. The wind rose confirms that the most common direction of wind speed was the northwestern one and, successively, the western one, making up approximately 75% of the wind direction occurrence. Moreover, wind velocities over 10 m/s appeared for more than 40% of the examined 10-month period. A strong northwestern component of velocities over 15 m/s may be observed. It also becomes apparent that, as we moved towards higher velocity bands, the direction seemed more biased towards the northwestern and western components.
Table 2 presents the mean wind velocity per direction sector and month of the year, as well as a weighted average for the mean velocities of each month, based on the frequency of occurrence of Table 1. A trend became obvious from the presented results (despite missing data from January and February): the wind was lower during the spring and autumn and picked up during the summer and winter. This was expected, since it is established that the atmospheric instability during the winter influences the wind strength [38]. Moreover, the steadily strong Etesian winds are crucial in maintaining high wind velocities in the Eastern Mediterranean Sea during the summer [39]. The monthly mean wind velocities ranged from 5.4 to 12.27 m/s, and July, August, and September had mean velocities higher than 10 m/s. The overall mean wind velocity for the Toplou site was 8.6 m/s, which, according to the National Renewable Energy Laboratory (NREL) classification, corresponds to a region of wind power class 7 (outstanding wind resource potential) [40]. The NREL wind classification system is a method used to categorise wind resources based on their speed and consistency. This system is commonly used in wind energy assessment and site selection for wind farms. It categorises areas into seven classes (1 being the lowest and 7 being the highest) based on the average wind speed and its variation over time.
The cumulative density function (CDF) is widely used in studies of wind potential and is particularly useful in wind energy calculations [41]. In the present study, the CDF was used to represent the wind velocity variation by calculating the probability of the velocity being equal to or larger than a certain value. For a velocity V, the CDF is given by the following equation [42]:
The parameters c and k are the two Weibull parameters. Parameter c is a scale parameter with dimensions of velocity (m/s), whereas parameter k is dimensionless and relates to the distribution’s shape. Various methods to estimate the Weibull parameters fit the measured frequency of wind velocity occurrence [41,43]. In this analysis, the parameters were estimated based on the measured distribution and were found to be and m/s. Figure 4 shows the CDF for the wind velocity data at 20 m agl. The CDF drops slowly with increasing velocity, which was expected due to the high probability of high wind velocities. For instance, velocities higher than 10 m/s occurred approximately 45% of the time.
The wind power density, i.e., wind energy per unit area and time, constitutes an index for assessing wind potential. It is often used in conjunction with the mean annual velocity to define a region’s Wind Energy Class (i.e., on a scale from 1–7, its ability for generating wind energy based on its wind resource potential) [44]. In this analysis, the mean power density over a time interval with N measurements was computed from the expression [45]
where is the air density, which decreases with altitude, is the i-th measured velocity, is the wind velocity turbulence intensity, and N is the number of measurements. Using the above expression and taking to decrease exponentially (which is valid for an isothermal atmosphere [45]), i.e.,
where kg/m3 at sea level, h is the site altitude in km and H the lower atmosphere scale height (that is equal approximately to 8 km), we obtain Table 3 for wind power density. It is important to note that, in this calculation, we have also included the turbulent fluctuation contribution in wind velocity which is represented by the term ; is the measured standard deviation of the wind velocity [46]. The contribution of this term, however, was of the order of 2% to 3%, i.e., rather small. Table 3 presents the mean power density in W/m2 per direction sector and month of the year for all available data. It is important to note that, in the direction sectors where no wind velocity was observed, the power density is taken as zero. The annual mean was 758 W/m2 for Toplou at 20 m agl and, according to the International Electrotechnical Commission’s (IEC) classification, corresponds to a region of Wind Energy Class 6 (on a scale from 1–7, excellent wind resource potential) [44]. This confirms the region around Toplou as a highly promising region regarding wind energy exploitation.
2.3. NWP Model Predictions
This section presents results for the wind field in the region of interest, obtained from high-resolution simulations using the Weather Research and Forecasting (WRF) numerical model. The main objective of this analysis is to examine the validity of the statistical “10% sampling condition”. After randomly choosing [47] three days of each month for the period March 2019–December 2019 (which represents 10% of the month), we compared wind statistics, that is, the velocity and direction of the wind, with the overall station data (100% of the month). It is important to note that the results for velocities from the WRF were obtained at 10 m agl and had to be extrapolated to 20m agl to match the station data. For this reason, the appropriate equations will be given and discussed.
The WRF model [48] represents a cutting-edge regional- to global-scale NWP model, extensively utilised for operational forecasting and academic research worldwide. It is configurable in serial, parallel (MPI), and mixed-mode (OpenMP and MPI) forms, tailored for optimal performance on massively parallel computers [49]. The WRF was chosen as the appropriate model since it has been extensively validated over the years and constitutes one of the most robust and reliable NWP models [50,51,52,53,54]. In recent years, attempts to utilise the WRF, coupled with or without CFD models, for the study of wind potential can be found in the literature [55,56,57,58,59,60,61]. However, none of these works have attempted to go below 500 m spatial resolution and, to the best of our knowledge, no research has attempted to utilise and test the validity of the “10% sampling condition” for the study of wind potential. Both points are considered for the first time in this paper.
In this study, WRF Version 4.1.3 [48] was utilised. All simulations were conducted carefully, employing state-of-the-art numerical algorithms with strict convergence criteria to solve prognostic and diagnostic equations on a high-resolution grid to ensure error minimisation during the solution process [62]. These simulations were performed on the TYPHOON High-Performance Computing (HPC) Cluster of the Department of Mathematics and Applied Mathematics of the University of Crete. The system comprises a Fujitsu blade cluster featuring 12 Intel Xeon E5-2430 @ 2.2 GHz CPUs (Intel Corporation, Intel Corporation, Ireland, Ireland). Each blade accommodates a pair of CPUs with 16 GB RAM and a 146 GB SAS hard drive (Seagate, Penang, Malaysia). Optimal results were achieved through a distributed-memory parallelism (dmpar) build, leveraging MPI. Because of the cluster’s modest size, a hybrid build with shared-memory parallelism (smpar, i.e., dmpar+smpar) was employed in all reported runs. Hyper-threading was deactivated, as it contributed only marginally or negligibly to computing performance improvement.
NCEP-FNL 6-hourly data of 0.25° × 0.25° spatial resolution were used to determine the initial and boundary conditions of the model [63]. These are data from terrestrial meteorological stations, marine observations, satellite data, etc., supplemented by GFS climatic framework data for regions where no observations were readily available. Also, for the most accurate description and analysis of the phenomena in the region of Crete, nested domains were considered, where information exchange occurred between them, to minimise the dependence of the smallest domain (where the results were derived from) on the boundary conditions that were very much apart, both in space and time. Nesting is a standard technique employed to refine the spatial resolution of simulations in specific regions of interest within a larger domain. This technique allows for more detailed modelling of phenomena in areas requiring higher resolution while still utilising coarser resolutions in surrounding regions to conserve computational resources [64]. The largest domain (domain 1), which included most of Western Europe, had a horizontal grid size of 10.8 km. Domain 2, representing the Balkans, had a horizontal grid size of 3.6 km. Domain 3, which represented Crete, had a horizontal grid size of 1.2 km. Finally, the smallest domain (domain 4), representing Central and Eastern Crete, had a horizontal grid size of 400 m. This is believed to be the smallest size recorded in the literature for this application. To be able to resolve the complex topography of the region, a Digital Elevation Model (DEM) of 60 m spatial resolution [65] was employed for the two finer grids (domains 3 and 4). The four domains, from coarsest to finest, are presented in Figure 5.
All modelling domains had 50 layers in the vertical dimension, with the model top being set at 50 hPa. The model was run with a variable time step, which was not allowed to exceed 180 s for the coarsest domain. Appropriate physical parametrisations, based on previous experience [65], were invoked to represent the correct physics with regards to radiation, convection, microphysical, and planetary boundary layer processes. For more details on the numerical schemes, please see [48]. Convection schemes were turned off for the two smallest domains since the microphysics resolved convection [66]. For each simulation, there was an allowance for 12 h of model spin-up time [67]. The CPU time was a 36 h simulation (one full day plus 12 h of spin-up) on the TYPHOON HPC cluster for the four nested domains in the order of 10 min, indicating the proposed methodology’s computational efficiency.
Wind velocity and direction every 10 min were taken as output from the WRF model. However, the velocity at which the model output was 10 m agl. Since this was the closest to the first observation level, all analyses and comparisons were performed by extrapolating velocity from 10 m to 20 m agl, where wind direction was assumed to be unaltered, as has been found in the literature (see, e.g., [68]). The velocity was extrapolated to 20 m by using the logarithmic law [69]
The velocity is at height z, given that the velocity at height h is known. This law is used in wind energy studies under conditions of neutral atmospheric stability and is valid for wind velocities ranging from 1 m/s up to 30 m/s, a range which does not include extreme phenomena, such as hurricanes, tornadoes, etc. (see, e.g., [70]). The parameter in the equation is called roughness length and may be calculated from the raw velocity data using the following equation [71]:
where is the turbulence intensity and can be calculated through velocity measurements and their standard deviations (see Section 2.1). The roughness length is a parameter entering the wind flow equation in the atmospheric boundary layer, where friction forces affect the wind field and its variation with height. The roughness length represents the height above the surface at which the wind speed is zero [70]. Table 4 presents the roughness length, as was calculated through the use of the entire data set for every month and for each direction sector; the last column presents weighted averages (depending on the frequency of occurrence from Table 1). A lower roughness length implies less exchange between the surface and the atmosphere and stronger wind near the ground. In the direction sectors where no wind velocities were recorded, the roughness length was taken as 0, indicating that these directions do not contribute to overall wind power production. The respective values for each direction sector were utilised to extrapolate the velocities from 10 m to 20 m.
Table 5 and Table 6 provide the frequency of occurrence per direction sector and month and the mean wind velocity per month and direction, as calculated from the WRF model. Eight wind direction sectors were selected to compare with the observations. The velocity was extrapolated to 20 m agl, as explained earlier; however, the directions from the WRF were taken from 10 m, as it was assumed that no significant change in wind direction would result between 10 and 20 m above ground in an open area, such as the one in which the meteorological mast was situated [68]. As evident from Table 5, the two dominant directions are, again, the western and northwestern ones. However, the results of the WRF model indicate that the western component seemed to be the most dominant of the two. This is confirmed by the corresponding wind (Figure 6, where the velocities were again split into five fixed bands), with the W and SW components making up approximately 75% of the wind direction occurrence. Once more, wind velocities over 10 m/s are present for more than 40% of the examined 10-month period. It also becomes apparent that, as we move towards higher velocity bands, the direction seems more biased towards the western and northwestern components. Table 5 indicates a stronger bias towards these components than the measurements. Table 6 repeats the trend of the measurements, whereby the wind is lower during the spring and autumn and picks up during the summer and winter. The monthly mean wind velocities range from 6.22 to 13.45 m/s, with four months (March, June, August, and September) predicted to have mean velocities higher than 10 m/s. The overall mean wind velocity for the Toplou site was predicted to be 9.83 m/s.
Table 7 presents the predicted wind power density results for the different direction sectors for all months, following the equations given in the previous section. A weighted average, based on the frequency of occurrence given in Table 5, is also given for every month. It is important to note that the power density is zero in the direction sectors where no wind velocity was detected. The mean wind power density was predicted to be 910 W/m2, a high value which asserts that the Toplou region is of high anemological interest.
2.4. Error Analysis
The performance of the WRF model is assessed below. The Relative Error (RE) for the annual mean velocities and power densities was calculated as an initial error indicator. The RE was computed using the formula . It was found that mean velocities’ RE was 14%, whereas the mean power densities’ RE was 20%. These values are sufficiently small and indicate a high level of agreement between model predictions and the observed values. It is important to note that the error in the power density was expected to be higher than the error in the velocity since velocity comes into the power density equation raised to the power of 3.
To assess the performance of the WRF in more detail, the various statistical metrics for wind velocity and direction for the actual random days that the model was run were calculated. All actual 10-min interval outputs from the model and observations were utilised for this comparison. Bias and Relative Bias (RB) (for velocities) and Direction Accuracy (DACC) index for wind direction [72] were calculated. Bias measures the model’s overall overestimation or underestimation of wind velocities. RB measures the overestimation or underestimation relative to the bulk of the observations. The DACC index represents the percentage of times when the circular distance (i.e., the angular difference in wind direction) between modelled and observed wind directions was lower than a threshold, chosen as 30° for this study. The DACC index varies between 0 (very bad correlation) and 100 (excellent correlation). Let and denote the i-th of N modelled and observed values, respectively, of a quantity. Then, the equations for Bias and RB are
where .
To compute the DACC index, the circular distance for any two angles and that the wind might be coming from needs to be defined: . Then, the DACC index is given by
where is 1 if or 0 otherwise.
Table 8 presents the Bias, RB and DACC calculated by comparing the three days from each month with the corresponding three days of the station data.
Bias and RB were mostly positive, indicating an overestimation of the wind velocities by the model. Bias was very small for 8 out of 10 months, and RB had a maximum value of 47.98, with all other values being less than 21. This indicated that the absolute RB (a measure of the error) was less than 21%. Moreover, the DACC index was, for 8 out of 10 months, greater than 70, with the highest value being 99.32, which indicates the numerical model’s remarkable ability to represent the wind direction correctly.
The results show that the high-resolution simulations with the WRF numerical model and the “10% sampling condition” accurately depict all main wind characteristics (velocity, direction, and trend) for the examined period. Therefore, the "10% sampling condition" seems valid, at least for the Toplou region.
2.5. Comparisons with the Global Wind Atlas Framework
The GWA framework is an essential online resource. It grants users access to comprehensive wind resource data worldwide, assisting them in evaluating the viability of wind energy generation across diverse regions. The GWA provides detailed maps and data on wind speed and direction at varying altitudes using high-resolution global wind climate data and Geographic Information Systems (GIS) technology. This wealth of information proves invaluable for developers, policymakers, and researchers engaged in the strategic planning and execution of wind energy initiatives. For a full review of the GWA framework, please see [32].
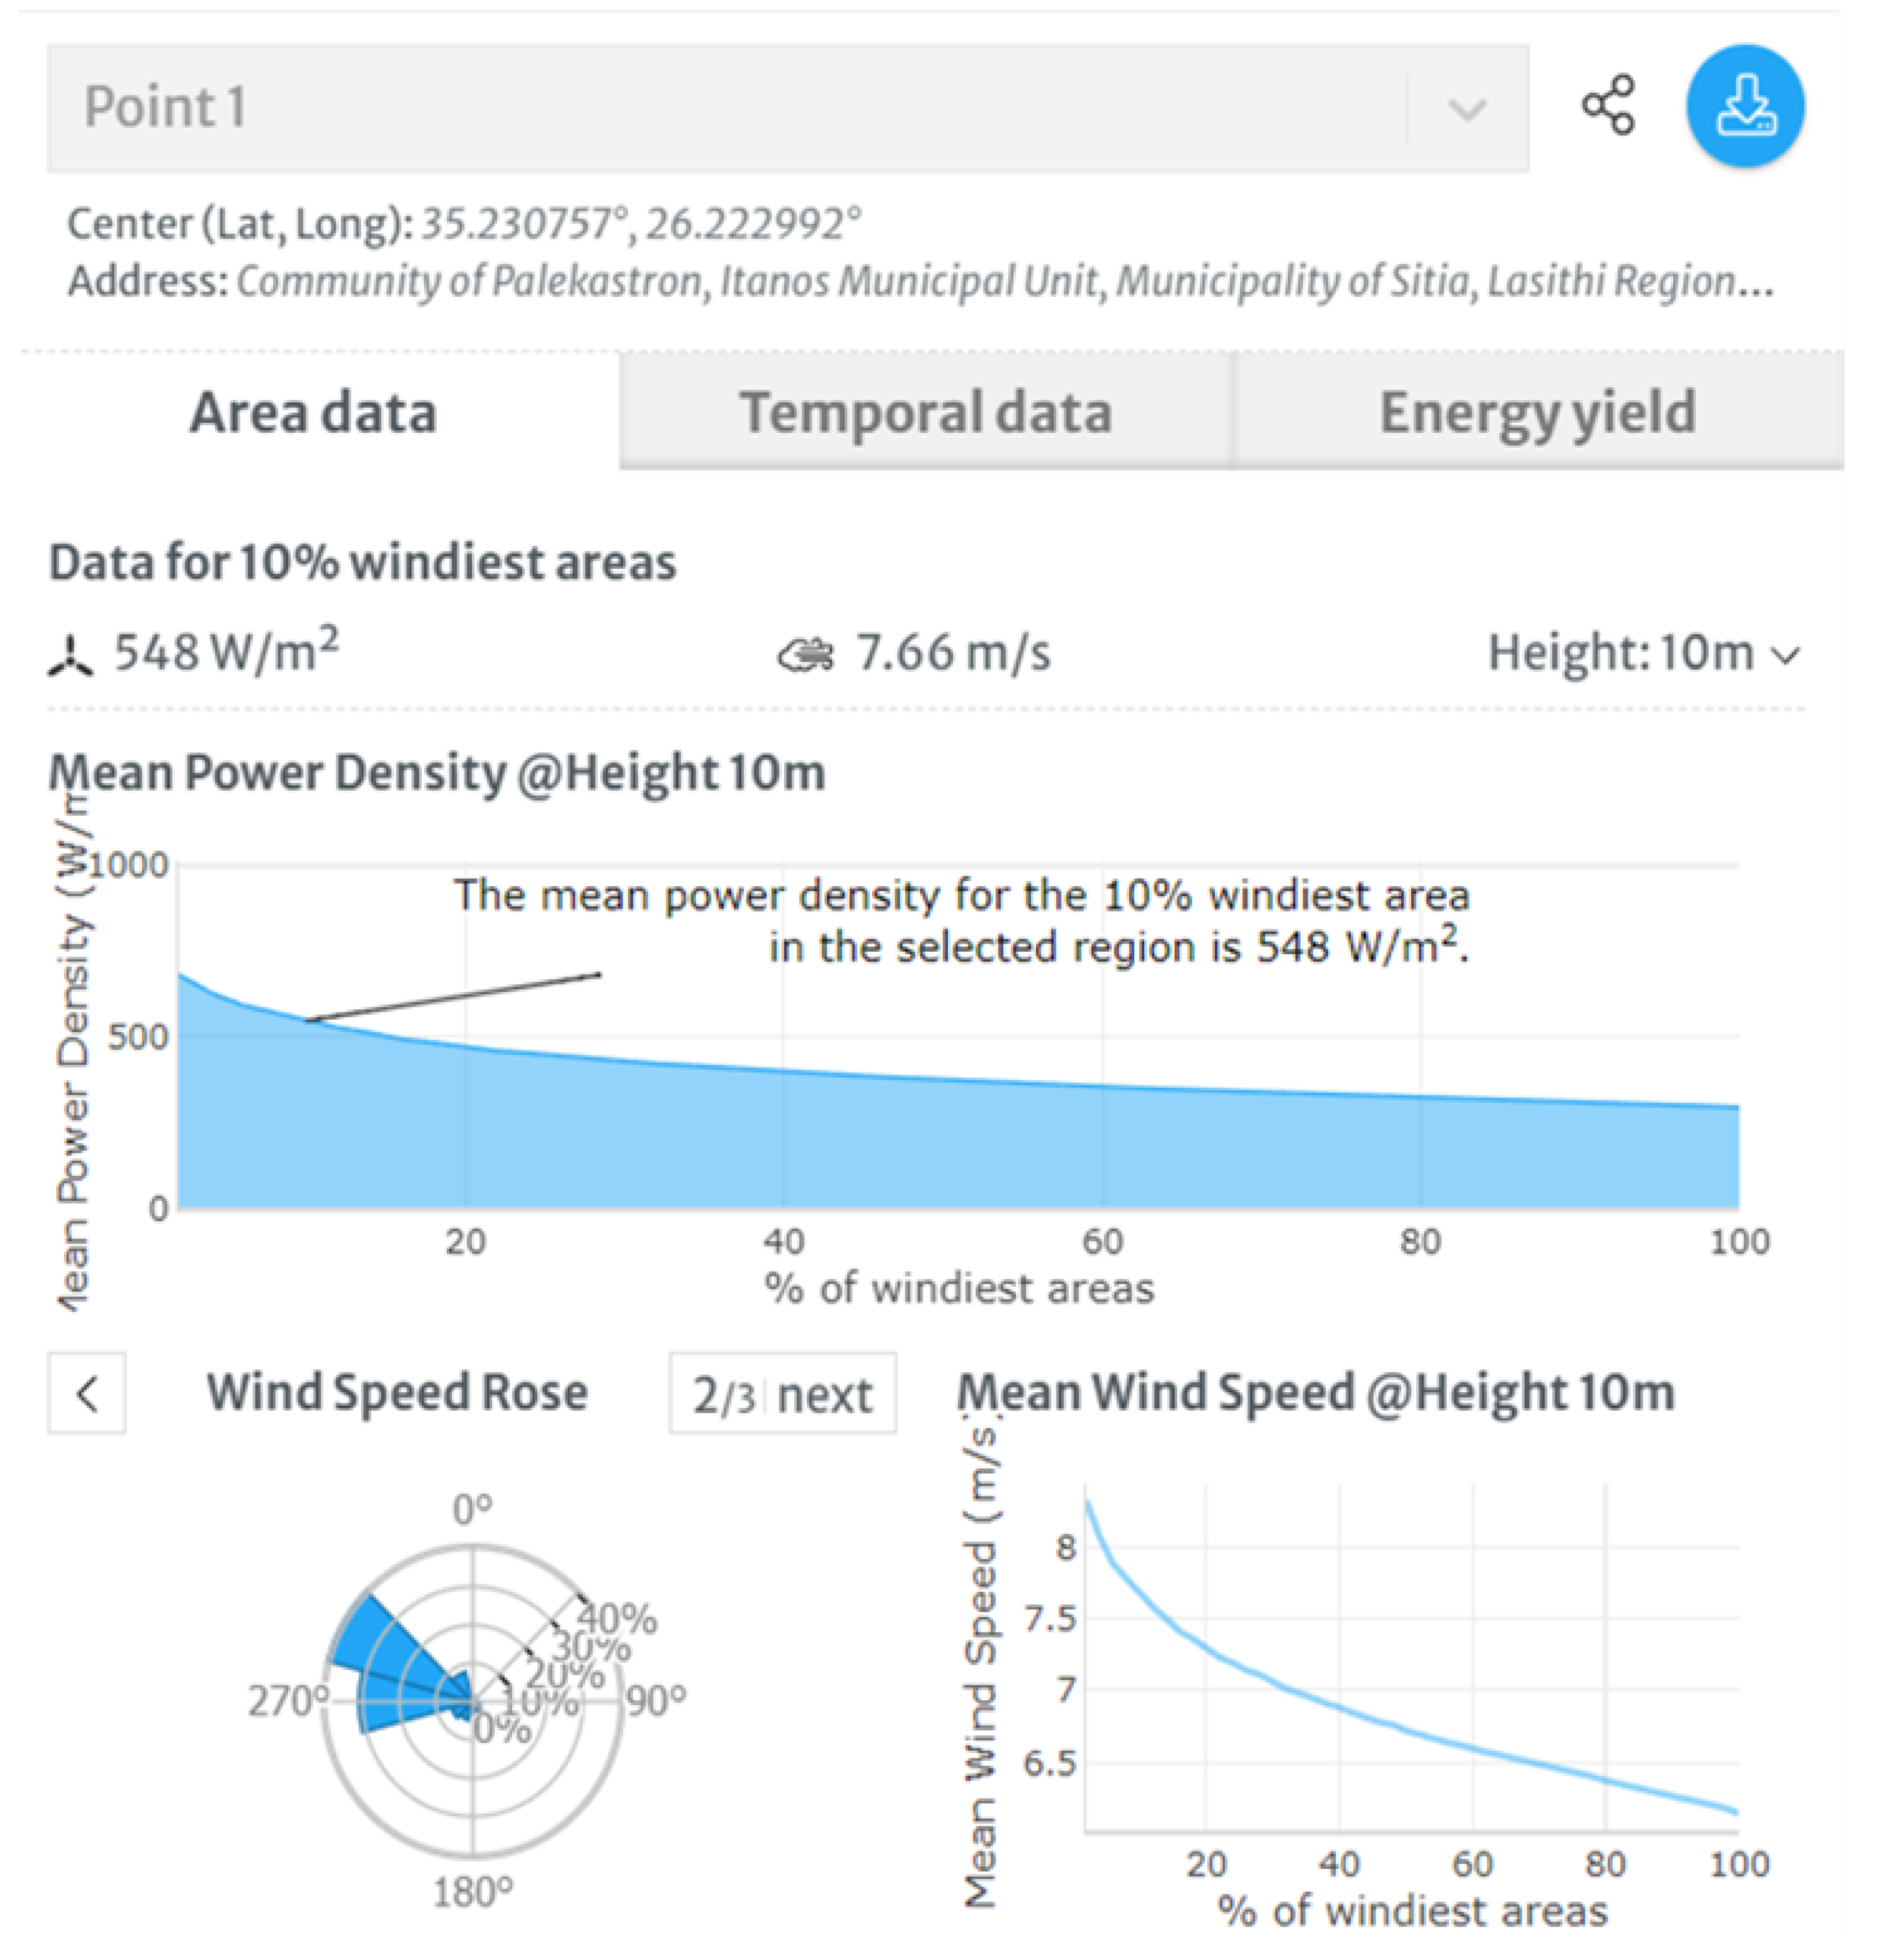
For the case of Toplou, wind data are available through the GWA between 2008 and 2017. The framework can provide information averaged in space (9 km2 square box around the location of the mast) and time (10 years) at heights of 10 m, 50 m, 100 m, 150 m, and 200 m agl. Figure 7 presents the averaged data over 10 years at the height of 10 m agl, with the mean values for wind velocity and power density reported as 7.66 m/s and 548 W/m2, respectively. The wind rose diagram confirms our research findings: the main wind directions are northwestern and western, with other directions having minimal contribution. Since WRF data for wind velocities were calculated at 10 m agl, we may directly compare the WRF and the GWA. All available WRF velocity data were averaged, and the mean wind velocity was 8.81 m/s. Equation (2) was utilised to derive the wind power density, and a mean wind power of 648 W/m2 was calculated. The results are summarised in Table 9, where the REs’ between the mean quantities are also given. As may be seen, both velocity and power density have been overestimated by the WRF by 15% and 18%, respectively. However, these results are considered extremely promising, based on the fact that they have been produced with the “10% sampling condition” and confirm the ability of the proposed methodology to be utilised in calculations of the wind potential of a region. We have identified a problem with the WGA framework: it relies on past data, which is not updated regularly. The proposed methodology does not rely on past data. Still, it may utilise more recent ones (NCEP-FNL data that the WRF model requires to calculate initial and boundary conditions, produced and freely available at the end of each day). Hence, one additional advantage of our method is that it can utilise up-to-date data and perform studies which depict the current situation at a location of interest. Being able to perform such studies is paramount, especially today, as anthropogenic climate change poses significant challenges to the environment; variability in wind patterns may become more pronounced in the short term due to increased weather instability caused by climate change [73,74].
3. Future Research Directions
So far, we have presented a methodology which relies solely on a limited number of calculations with the WRF to analyse the wind potential and assess the suitability of a site for wind farm installation. We thus aim to contribute to the discussion towards mitigating the impacts associated with wind power generation. While wind energy is considered a promising renewable power source, it is vital to thoroughly understand these impacts to ensure the sustainable development of wind energy projects. Below, some of the impacts are outlined, and how the present research can assist with the mitigation strategies is discussed.
Noise in wind farms primarily originates from the mechanical components of the turbines and aerodynamic interactions. The impact of wind farm noise on human health remains a subject of debate [75,76,77]. While some studies suggest a correlation between long-term exposure to low-frequency noise and sleep disturbance, annoyance, and stress [78,79], others argue that the noise levels generated by wind turbines are within acceptable limits [80,81]. Furthermore, there is a need for further research to understand the potential noise impact on wildlife, especially on bird and bat populations [82]. The primary mechanical sources include the gearbox, generator, and cooling systems, while aerodynamic noise results from the interaction of the blades with the wind [83]. These sources contribute to tonal and broadband noise, with tonal noise being more prevalent at lower wind speeds and broadband noise dominating at higher speeds. The computational methodology can be extended to identify the optimal location of the installation of wind farms regarding both wind energy harnessing and noise minimisation. Coupling the present computational framework with acoustic models [19,84,85] can provide a simulation framework to achieve the above.
Wind turbines cause severe problems in avian populations due to collisions with rotating blades, displacement due to disturbance, barriers to movement and loss of habitat [86]. The outcomes are direct fatalities, changes to breeding conditions, and an eventual population decrease. These phenomena have been studied for more than 20 years (e.g., [87]) and have been extended to offshore wind farms [88]. Collision-related mortality varies among species and locations, with larger birds or long-lived species often facing higher risks [89,90]. Special consideration is given to bats since they are disproportionately affected by wind turbines, leading to concerns about the impact of expanding wind energy development on their populations [91,92,93]. Moreover, studies of migratory species indicate that fatalities are higher for resident birds than migratory ones since precautions have been taken to avoid establishing wind farms directly on migration routes [88,89]. While mortality has been studied extensively, only recently have there been attempts to study displacement in different locations worldwide [94,95,96]. It is interesting to note that the findings are sometimes contradictory; a recent review [97] reported that approximately half of the studies did not find any displacement, 40.6% of the studies found displacement effects, and a small proportion (7.7%) detected an increased abundance of birds around the wind farms! This indicates that conclusive judgments are challenging for most species due to insufficient high-quality data. Demonstrating the effects of displacement from ideal foraging habitats remains a substantial challenge for the future, and further studies need to be performed, which require long-term, intensive monitoring across varying seasonal and weather conditions at diverse sites.
However, the scale and consequences of the above effects remain under-explored since performing such studies is not easy, as several different techniques need to be combined, namely radar [98], thermal infrared monitoring [99], range-finding [100], and visual observations [101]. Identifying the most appropriate location for a wind farm should go hand in hand with addressing the above issues. A holistic computational framework should incorporate constraints to address the above issues.
Wind turbines inherently generate electromagnetic fields (EMFs) during their operational phases due to the operation of power lines and substation equipment [102,103,104,105,106]. While the prevailing literature posits that the overall intensity of these fields is typically low [103,107], concerns persist regarding potential ecological ramifications. The intricate nature of these interactions necessitates a detailed examination of the potential effects on flora and fauna within the vicinity of wind farms [108].
Studies have begun to unravel the sensitivities of various species to elevated EMF levels [109]. Some organisms may exhibit alterations in behaviour, reproductive patterns, or migratory routes when exposed to heightened EMFs [110]. Avian species, for instance, have been subject to particular scrutiny, given their reliance on magnetic fields for navigation [111]. Even insects are influenced by wind turbine-generated EMFs [112]. Understanding these sensitivities is pivotal for safeguarding biodiversity and ensuring the coexistence of wind energy developments and ecosystems.
Interdisciplinary research efforts are underway to explore the implications of wind-generated EMFs on diverse ecosystems comprehensively [113]. Studies employing advanced monitoring techniques, including electromagnetic field measurements and ecological surveys, seek to unravel the intricacies of these interactions and propose potential mitigation strategies [114]. The coupling of electromagnetic modelling with the present methodology is another promising research direction.
Moreover, today, with the advances in the area of machine learning (ML) and its coupling with other computational strategies [115], we do believe that concentrated effort should be placed in applying ML techniques to analyse available data sets. This would lead to more accurate predictions, real-time monitoring, and informed decision-making regarding mitigating adverse effects associated with wind farms, specifically as follows:
- Regarding noise pollution, ML algorithms can monitor noise levels in real time and detect anomalous patterns that may indicate excessive noise emissions from wind turbines. Early detection of such events can trigger intervention measures to mitigate the impact on residents.
- Regarding avian population impact, ML techniques can analyse environmental data such as vegetation cover, topography, and weather patterns to predict avian habitat preferences and migration routes. By understanding where birds are likely present, wind farm developers can make informed decisions about siting and operational protocols to minimise impacts on bird populations.
- Finally, regarding EMFs, ML models can analyse data from sensors placed around wind farms to monitor EMF levels and predict potential fluctuations or hotspots. By identifying patterns in EMF emissions, these models can help optimise turbine operations or implement EMF shielding measures to minimise exposure levels.
In this way, by leveraging machine learning techniques, researchers and wind farm operators can develop more effective and proactive strategies for minimising environmental impacts while maximising the benefits of renewable energy production.
4. Conclusions
This study introduces a novel methodology for assessing wind potential in a cost-effective, ecologically friendly and highly efficient manner, utilising a set of recently collected wind measurements from the region of Toplou in the northeastern part of the Greek island of Crete. As verified by the GWA, this region is of particular interest due to its status as one of the prime areas of anemological interest in the Eastern Mediterranean Sea.
The analysis of measurements indicates that Toplou exhibited a high mean wind velocity of 8.6 m/s at 20 m agl, qualifying it as a highly suitable site for energy exploitation, with a mean wind power density of 758 W/m2. Seasonal variability in wind characteristics is evident, with the lowest velocities in April, May, November, and December and the highest in July, August, and September. The wind tends to pick up between December and March. Strong directional tendencies were observed, with 75% of velocities coming from the northwest and west. Cumulatively, around 45% of wind velocities exceeded 10 m/s, with approximately 15% surpassing 15 m/s at 20 m agl. These findings underscore the region’s significant wind potential, particularly during the summer months, due to the influence of Etesian winds.
Simulations were performed with the WRF model at very high resolution. Four nested grids were employed, of which the finest had a horizontal resolution of 400 m. This study is one of the first to utilise such high resolution in an NWP model to perform wind potential analyses. The statistical “10% sampling condition” was employed to test its validity in studying wind potential. In this way, three days were randomly chosen from each month and simulated as representative of that month. The simulation results aligned with observed seasonal trends and prevalent wind directions. The WRF model projected an annual mean wind velocity of 9.83 m/s, close to the station’s recorded mean of 8.6 m/s, within a 15% difference range. The annual mean wind power density differed by 20% from the one calculated by the measured velocity values, estimating it at 910 W/m2. The day-to-day comparison showed a reasonable bias in velocities, averaging at 0.56 m/s, with the model slightly overestimating velocities by around 10%. Wind direction predictions by the WRF proved highly accurate, with a DACC index mean value of 79.97, indicating precise alignment with observed data.
Moreover, when comparisons were performed between WRF and GWA framework outputs at 10 m height agl, remarkably good agreement was found between mean velocity and power density values, with RE being less than 20%. The preferential western and northwestern directions were also confirmed. Compared to the GWA, another benefit of our approach is that GWA data sets lack regular updates, whereas the NCEP-FNL data sets used by the WRF model receive daily updates. This allows us to study and analyse the most current conditions of a specific area of interest.
These preliminary results and analyses indicated that the "10% sampling condition" applied to the study of wind potential is valid to a good degree, at least for the site under consideration, where moderate to strong winds were present for most of the year. The location of Toplou is particularly challenging to model due to its complex topography, and we firmly believe that the WRF numerical model with the described setup managed to depict all main anemological characteristics of the region successfully. Further validation for other regions with different geographical characteristics is required. Comparisons should extend to atmospheric parameters like pressure, temperature, and rainfall.
The present study shows that high-resolution simulations using a numerical model, such as the WRF, may yield accurate results since complicated atmospheric processes may be correctly resolved in greater detail than simpler local-scale wind prospecting models. In conjunction with applying the "10% sampling condition", the proposed methodology constitutes a valuable tool for sustainable energy planning and development, since the need for on-site wind measurement equipment and time-consuming simulations is minimised. Moreover, our approach offers clear advantages over the Global Wind Atlas framework since we may analyse the current anemological conditions of an area without relying solely on past data. Additionally, leveraging past NCEP-FNL data (available from 1979 onwards) enables studies of the area’s wind potential over time. Such studies, with the aid of ML methods, further allow us to extend predictions for future wind viability. To our knowledge, this approach has never been previously applied to studying wind potential.
As a closing remark, we do believe that, to mitigate the adverse effects and impacts associated with wind energy production, further research is required, which combines state-of-the-art computational techniques and methodologies (such as Computational Fluid Dynamics and ML). In this way, a data-driven approach is enabled, which will assist in optimising wind turbine performance, the early detection of anomalies, and the development of control strategies for wind turbines in response to changing environmental conditions.
Author Contributions
Conceptualisation, N.C., D.D. and G.K.; methodology, N.C., I.E., D.D. and G.K.; formal analysis, N.C.and I.E.; investigation, N.C., I.E. and D.D.; resources, G.K.; writing, N.C., I.E., D.D. and G.K.; project administration; contribution to the discussion N.C., I.E., D.D. and G.K. All authors have read and agreed to the published version of the manuscript.
Funding
This research received no external funding.
Data Availability Statement
The data presented in this study are available on request from the corresponding author. The data are not publicly available due to the fact that they are part of an ongoing study.
Conflicts of Interest
The authors declare no conflicts of interest.
References
- Chan, D.; Mo, J. Life Cycle Reliability and Maintenance Analyses of Wind Turbines. Energy Procedia 2017, 110, 328–333. [Google Scholar] [CrossRef]
- Nielsen, J.S.; Miller-Branovacki, L.; Carriveau, R. Probabilistic and Risk-Informed Life Extension Assessment of Wind Turbine Structural Components. Energies 2021, 14, 821. [Google Scholar] [CrossRef]
- Grasso, F. Investigation of Wind Turbine Rotor Concepts for Offshore Wind Farms. J. Phys. Conf. Ser. 2014, 524, 012032. [Google Scholar] [CrossRef]
- Mishnaevsky, L.; Jafarpour, M.; Krüger, J.; Gorb, S.N. A New Concept of Sustainable Wind Turbine Blades: Bio-Inspired Design with Engineered Adhesives. Biomimetics 2023, 8, 448. [Google Scholar] [CrossRef]
- Alabdali, Q.A.; Bajawi, A.M.; Fatani, A.M.; Nahhas, A.M. Review of Recent Advances of Wind Energy. Sustain. Energy 2020, 8, 12–19. [Google Scholar] [CrossRef]
- Scottish and Southern Energy Plc. World’s Largest Offshore Wind Farm Produces Power for the First Time. 2023. Available online: https://www.sse.com/news-and-views/2023/10/world-s-largest-offshore-wind-farm-produces-power-for-the-first-time/ (accessed on 10 November 2023).
- Dinh, V.N.; McKeogh, E. Offshore Wind Energy: Technology Opportunities and Challenges. In Proceedings of the 1st Vietnam Symposium on Advances in Offshore Engineering, Hanoi, Vietnam, 1–3 November 2018; Randolph, M., Doan, D.H., Tang, A.M., Bui, M., Dinh, V.N., Eds.; Springer: Singapore, 2019; pp. 3–22. [Google Scholar]
- Mitchell, D.; Blanche, J.; Harper, S.; Lim, T.; Gupta, R.; Zaki, O.; Tang, W.; Robu, V.; Watson, S.; Flynn, D. A review: Challenges and opportunities for artificial intelligence and robotics in the offshore wind sector. Energy AI 2022, 8, 100146. [Google Scholar] [CrossRef]
- Rezaei, F.; Contestabile, P.; Vicinanza, D.; Azzellino, A. Towards understanding environmental and cumulative impacts of floating wind farms: Lessons learned from the fixed-bottom offshore wind farms. Ocean Coast. Manag. 2023, 243, 106772. [Google Scholar] [CrossRef]
- Brower, M. Wind Resource Assessment: A Practical Guide to Developing a Wind Project; John Wiley & Sons: Hoboken, NJ, USA, 2012. [Google Scholar]
- Mekonnen, A.D.; Gorsevski, P.V. A web-based participatory GIS (PGIS) for offshore wind farm suitability within Lake Erie, Ohio. Renew. Sustain. Energy Rev. 2015, 41, 162–177. [Google Scholar] [CrossRef]
- González-Aparicio, I.; Monforti, F.; Volker, P.; Zucker, A.; Careri, F.; Huld, T.; Badger, J. Simulating European wind power generation applying statistical downscaling to reanalysis data. Appl. Energy 2017, 199, 155–168. [Google Scholar] [CrossRef]
- Mahdy, M.; Bahaj, A.S. Multi criteria decision analysis for offshore wind energy potential in Egypt. Renew. Energy 2018, 118, 278–289. [Google Scholar] [CrossRef]
- Vargas, S.A.; Esteves, G.R.T.; Maçaira, P.M.; Bastos, B.Q.; Oliveira, F.L.C.; Souza, R.C. Wind power generation: A review and a research agenda. J. Clean. Prod. 2019, 218, 850–870. [Google Scholar] [CrossRef]
- McKenna, R.; Pfenninger, S.; Heinrichs, H.; Schmidt, J.; Staffell, I.; Bauer, C.; Gruber, K.; Hahmann, A.N.; Jansen, M.; Klingler, M.; et al. High-resolution large-scale onshore wind energy assessments: A review of potential definitions, methodologies and future research needs. Renew. Energy 2022, 182, 659–684. [Google Scholar] [CrossRef]
- Revaz, T.; Porté-Agel, F. Large-Eddy Simulation of Wind Turbine Flows: A New Evaluation of Actuator Disk Models. Energies 2021, 14, 3745. [Google Scholar] [CrossRef]
- Aziz, S.; Khan, A.; Shah, I.; Khan, T.A.; Ali, Y.; Sohail, M.U.; Rashid, B.; Jung, D.W. Computational Fluid Dynamics and Experimental Analysis of a Wind Turbine Blade’s Frontal Section with and without Arrays of Dimpled Structures. Energies 2022, 15, 7108. [Google Scholar] [CrossRef]
- Balaji, S.; Hanchinal, M.M.; Tanwar, P.S.; Ramprasad, C.; Soman S, M.; Ishwarya G K, A. Optimization of Wind Turbine Blades Using Computational Fluid Dynamics (CFD) Analysis. Eur. Chem. Bull. 2023, 12, 435–442. [Google Scholar]
- Drikakis, D.; Dbouk, T. The Role of Computational Science in Wind and Solar Energy: A Critical Review. Energies 2022, 15, 9609. [Google Scholar] [CrossRef]
- Jankauskas, M.; Serackis, A.; Šapurov, M.; Pomarnacki, R.; Baskys, A.; Hyunh, V.K.; Vaimann, T.; Zakis, J. Exploring the Limits of Early Predictive Maintenance in Wind Turbines Applying an Anomaly Detection Technique. Sensors 2023, 23, 5695. [Google Scholar] [CrossRef]
- Heinz, S. Theory-based mesoscale to microscale coupling for wind energy applications. Appl. Math. Model. 2021, 98, 563–575. [Google Scholar] [CrossRef]
- Couto, A.; Estanqueiro, A. Enhancing wind power forecast accuracy using the weather research and forecasting numerical model-based features and artificial neuronal networks. Renew. Energy 2022, 201, 1076–1085. [Google Scholar] [CrossRef]
- Simankov, V.; Buchatskiy, P.; Teploukhov, S.; Onishchenko, S.; Kazak, A.; Chetyrbok, P. Review of Estimating and Predicting Models of the Wind Energy Amount. Energies 2023, 16, 5926. [Google Scholar] [CrossRef]
- Cochran, W.G. Sampling Techniques; John Wiley & Sons: Hoboken, NJ, USA, 1977. [Google Scholar]
- Fuller, W.A. Sampling Statistics; John Wiley & Sons: Hoboken, NJ, USA, 2011. [Google Scholar]
- Katsaprakakis, D.A.; Papadakis, N.; Christakis, D.G.; Zervos, A. On the wind power rejection in the islands of Crete and Rhodes. Wind Energy Int. J. Prog. Appl. Wind Power Convers. Technol. 2007, 10, 415–434. [Google Scholar] [CrossRef]
- Giatrakos, G.P.; Tsoutsos, T.D.; Zografakis, N. Sustainable power planning for the island of Crete. Energy Policy 2009, 37, 1222–1238. [Google Scholar] [CrossRef]
- Tsoutsos, T.; Tsitoura, I.; Kokologos, D.; Kalaitzakis, K. Sustainable siting process in large wind farms case study in Crete. Renew. Energy 2015, 75, 474–480. [Google Scholar] [CrossRef]
- Caralis, G.; Christakopoulos, T.; Karellas, S.; Gao, Z. Analysis of energy storage systems to exploit wind energy curtailment in Crete. Renew. Sustain. Energy Rev. 2019, 103, 122–139. [Google Scholar] [CrossRef]
- Gkeka-Serpetsidaki, P.; Tsoutsos, T. A methodological framework for optimal siting of offshore wind farms: A case study on the island of Crete. Energy 2022, 239, 122296. [Google Scholar] [CrossRef]
- Haldoupis, C.; Kamburelis, A. Wind Power Potential in the Island of Crete: A Brief Summary of Past and Present Studies. In Proceedings of the Second European Symposium on Soft Energy Sources and Systems at the Local Level, Chania, Crete, Greece, 16–21 October 1989; pp. 1–19. [Google Scholar]
- Davis, N.N.; Badger, J.; Hahmann, A.N.; Hansen, B.O.; Mortensen, N.G.; Kelly, M.; Larsén, X.G.; Olsen, B.T.; Floors, R.; Lizcano, G.; et al. The Global Wind Atlas: A high-resolution dataset of climatologies and associated web-based application. Bull. Am. Meteorol. Soc. 2023, 104, E1507–E1525. [Google Scholar] [CrossRef]
- Global Wind Atlas. Available online: https://globalwindatlas.info/ (accessed on 12 January 2024).
- Enallaktiki Energiaki SA. Available online: https://2en.gr/ (accessed on 28 December 2023).
- Google Earth. 2008. Available online: https://www.google.com/earth/ (accessed on 12 December 2023).
- Burton, T.; Jenkins, N.; Sharpe, D.; Bossanyi, E. Wind Energy Handbook; John Wiley & Sons: Hoboken, NJ, USA, 2011. [Google Scholar]
- Sundari, T.; Samra, B.; Saptono, A.B. The use of wind rose to improve the quality of site analysis. In IOP Conference Series: Earth and Environmental Science; IOP Publishing: Bristol, UK, 2020; Volume 469, p. 012017. [Google Scholar]
- O’Neill, L.W. Wind speed and stability effects on coupling between surface wind stress and SST observed from buoys and satellite. J. Clim. 2012, 25, 1544–1569. [Google Scholar] [CrossRef]
- Tyrlis, E.; Lelieveld, J. Climatology and dynamics of the summer Etesian winds over the eastern Mediterranean. J. Atmos. Sci. 2013, 70, 3374–3396. [Google Scholar] [CrossRef]
- Kalmikov, A. Wind power fundamentals. In Wind Energy Engineering; Elsevier: Amsterdam, The Netherlands, 2017; pp. 17–24. [Google Scholar]
- Katinas, V.; Gecevicius, G.; Marciukaitis, M. An investigation of wind power density distribution at location with low and high wind speeds using statistical model. Appl. Energy 2018, 218, 442–451. [Google Scholar] [CrossRef]
- Gul, M.; Tai, N.; Huang, W.; Nadeem, M.H.; Yu, M. Assessment of wind power potential and economic analysis at Hyderabad in Pakistan: Powering to local communities using wind power. Sustainability 2019, 11, 1391. [Google Scholar] [CrossRef]
- Hennessey, J.P., Jr. A comparison of the Weibull and Rayleigh distributions for estimating wind power potential. Wind. Eng. 1978, 2, 156–164. [Google Scholar]
- IEC. 61400-1: Wind turbines part 1: Design requirements. Int. Electrotech. Comm. 2005, 21. [Google Scholar]
- Manwell, J.F.; McGowan, J.G.; Rogers, A.L. Wind Energy Explained: Theory, Design and Application; John Wiley & Sons: Hoboken, NJ, USA, 2010. [Google Scholar]
- Petersen, E.L.; Mortensen, N.G.; Landberg, L.; Højstrup, J.; Frank, H.P. Wind Power Meteorology; Risø National Laboratory: Roskilde, Denmark, 1997. [Google Scholar]
- Random.org–True Random Number Service. Available online: https://www.random.org/ (accessed on 20 March 2020).
- Skamarock, W.C. A description of the Advanced Research WRF version 3. Tech. Note 2008, 478, 113. [Google Scholar] [CrossRef]
- Malakar, P.; Saxena, V.; George, T.; Mittal, R.; Kumar, S.; Naim, A.G.; Husain, S.A.B.H. Performance evaluation and optimization of nested high resolution weather simulations. In Proceedings of the Euro-Par 2012 Parallel Processing: 18th International Conference, Euro-Par 2012, Rhodes Island, Greece, 27–31 August 2012; Proceedings 18. Springer: Berlin/Heidelberg, Germany, 2012; pp. 805–817. [Google Scholar]
- Giordano, C.; Vernin, J.; Vázquez Ramió, H.; Muñoz-Tuñón, C.; Varela, A.; Trinquet, H. Atmospheric and seeing forecast: WRF model validation with in situ measurements at ORM. Mon. Not. R. Astron. Soc. 2013, 430, 3102–3111. [Google Scholar] [CrossRef]
- Pozo, D.; Marín, J.; Illanes, L.; Curé, M.; Rabanus, D. Validation of WRF forecasts for the Chajnantor region. Mon. Not. R. Astron. Soc. 2016, 459, 419–426. [Google Scholar] [CrossRef]
- Arthur, R.S.; Lundquist, K.A.; Mirocha, J.D.; Chow, F.K. Topographic effects on radiation in the WRF Model with the immersed boundary method: Implementation, validation, and application to complex terrain. Mon. Weather Rev. 2018, 146, 3277–3292. [Google Scholar] [CrossRef]
- Optis, M.; Kumler, A.; Scott, G.N.; Debnath, M.C.; Moriarty, P.J. Validation of RU-WRF, the Custom Atmospheric Mesoscale Model of the Rutgers Center for Ocean Observing Leadership; Technical Report; National Renewable Energy Lab. (NREL): Golden, CO, USA, 2020. [Google Scholar]
- Cobb, A.; Steinhoff, D.; Weihs, R.; Delle Monache, L.; DeHaan, L.; Reynolds, D.; Cannon, F.; Kawzenuk, B.; Papadopolous, C.; Ralph, F. West-WRF 34-Year Reforecast: Description and Validation. J. Hydrometeorol. 2023, 24, 2125–2140. [Google Scholar] [CrossRef]
- Meissner, C.; Weir, D. Utilizing WRF data in CFD models for wind energy assessment. In Proceedings of the European Wind Energy Conference, Brussels, Belgium, 14–17 March 2011. [Google Scholar]
- Carvalho, D.; Rocha, A.; Gómez-Gesteira, M.; Santos, C.S. WRF wind simulation and wind energy production estimates forced by different reanalyses: Comparison with observed data for Portugal. Appl. Energy 2014, 117, 116–126. [Google Scholar] [CrossRef]
- Giannaros, T.M.; Melas, D.; Ziomas, I. Performance evaluation of the Weather Research and Forecasting (WRF) model for assessing wind resource in Greece. Renew. Energy 2017, 102, 190–198. [Google Scholar] [CrossRef]
- Fernández-González, S.; Martín, M.L.; García-Ortega, E.; Merino, A.; Lorenzana, J.; Sánchez, J.L.; Valero, F.; Rodrigo, J.S. Sensitivity analysis of the WRF model: Wind-resource assessment for complex terrain. J. Appl. Meteorol. Climatol. 2018, 57, 733–753. [Google Scholar] [CrossRef]
- Keck, R.E.; Sondell, N. Validation of uncertainty reduction by using multiple transfer locations for WRF–CFD coupling in numerical wind energy assessments. Wind Energy Sci. 2020, 5, 997–1005. [Google Scholar] [CrossRef]
- Kibona, T.E. Application of WRF mesoscale model for prediction of wind energy resources in Tanzania. Sci. Afr. 2020, 7, e00302. [Google Scholar] [CrossRef]
- Dayal, K.K.; Bellon, G.; Cater, J.E.; Kingan, M.J.; Sharma, R.N. High-resolution mesoscale wind-resource assessment of Fiji using the Weather Research and Forecasting (WRF) model. Energy 2021, 232, 121047. [Google Scholar] [CrossRef]
- Skamarock, W.C.; Klemp, J.B.; Dudhia, J.; Gill, D.O.; Liu, Z.; Berner, J.; Wang, W.; Powers, J.G.; Duda, M.G.; Barker, D.M.; et al. A description of the Advanced Research WRF version 4.3. NCAR Tech. Note Ncar/tn-556+ Str 2019, 145, 1–165. [Google Scholar] [CrossRef]
- National Centers for Environmental Prediction; National Weather Service; NOAA; U.S. Department of Commerce. NCEP GDAS/FNL 0.25 Degree Global Tropospheric Analyses and Forecast Grids. Available online: https://rda.ucar.edu/datasets/ds083.3/ (accessed on 1 March 2020).
- Madhulatha, A.; Choi, S.J.; Han, J.Y.; Hong, S.Y. Impact of different nesting methods on the simulation of a severe convective event over South Korea using the Weather Research and Forecasting Model. J. Geophys. Res. Atmos. 2021, 126, e2020JD033084. [Google Scholar] [CrossRef]
- Christakis, N.; Katsaounis, T.; Kossioris, G.; Plexousakis, M. On the performance of the WRF numerical model over complex terrain on a high performance computing cluster. In Proceedings of the 2014 IEEE Intl Conf on High Performance Computing and Communications, 2014 IEEE 6th Intl Symp on Cyberspace Safety and Security, 2014 IEEE 11th Intl Conf on Embedded Software and Syst (HPCC, CSS, ICESS), Paris, France, 20–22 August 2014; IEEE: Piscataway, NJ, USA, 2014; pp. 298–303. [Google Scholar]
- Jeworrek, J.; West, G.; Stull, R. Evaluation of cumulus and microphysics parameterizations in WRF across the convective gray zone. Weather Forecast. 2019, 34, 1097–1115. [Google Scholar] [CrossRef]
- Liu, Y.; Zhuo, L.; Han, D. Developing spin-up time framework for WRF extreme precipitation simulations. J. Hydrol. 2023, 620, 129443. [Google Scholar] [CrossRef]
- Helmis, C.; Sgouros, G.; Tombrou, M.; Schäfer, K.; Münkel, C.; Bossioli, E.; Dandou, A. A comparative study and evaluation of mixing-height estimation based on sodar-RASS, ceilometer data and numerical model simulations. Bound. Layer Meteorol. 2012, 145, 507–526. [Google Scholar] [CrossRef]
- Kambezidis, H.D.; Şen, Z.; Altunkaynak, A.; Erdik, T. Wind Velocity Vertical Extrapolation by Extended Power Law. Adv. Meteorol. 2012, 2012, 178623. [Google Scholar] [CrossRef]
- Wallace, J.M.; Hobbs, P.V. Atmospheric Science: An Introductory Survey; Elsevier: Amsterdam, The Netherlands, 2006; Volume 92. [Google Scholar]
- Martano, P. Estimation of surface roughness length and displacement height from single-level sonic anemometer data. J. Appl. Meteorol. 2000, 39, 708–715. [Google Scholar] [CrossRef]
- Santos-Alamillos, F.; Pozo-Vázquez, D.; Ruiz-Arias, J.; Lara-Fanego, V.; Tovar-Pescador, J. Analysis of WRF Model Wind Estimate Sensitivity to Physics Parameterization Choice and Terrain Representation in Andalusia (Southern Spain). J. Appl. Meteorol. Climatol. 2013, 52, 1592–1609. [Google Scholar] [CrossRef]
- Pryor, S.C.; Barthelmie, R.J.; Bukovsky, M.S.; Leung, L.R.; Sakaguchi, K. Climate change impacts on wind power generation. Nat. Rev. Earth Environ. 2020, 1, 627–643. [Google Scholar] [CrossRef]
- Martinez, A.; Iglesias, G. Global wind energy resources decline under climate change. Energy 2024, 288, 129765. [Google Scholar] [CrossRef]
- Pedersen, E.; Persson Waye, K. Perception and annoyance due to wind turbine noise—A dose–response relationship. J. Acoust. Soc. Am. 2004, 116, 3460–3470. [Google Scholar] [CrossRef] [PubMed]
- Mohamed, M. Reduction of the generated aero-acoustics noise of a vertical axis wind turbine using CFD (Computational Fluid Dynamics) techniques. Energy 2016, 96, 531–544. [Google Scholar] [CrossRef]
- Hays, A.; Van Treuren, K.W. A study of power production and noise generation of a small wind turbine for an urban environment. J. Energy Resour. Technol. 2019, 141, 051202. [Google Scholar] [CrossRef]
- Araújo Alves, J.; Neto Paiva, F.; Torres Silva, L.; Remoaldo, P. Low-frequency noise and its main effects on human health—A review of the literature between 2016 and 2019. Appl. Sci. 2020, 10, 5205. [Google Scholar] [CrossRef]
- van Kamp, I.; van den Berg, F. Health effects related to wind turbine sound: An update. Int. J. Environ. Res. Public Health 2021, 18, 9133. [Google Scholar] [CrossRef] [PubMed]
- Davy, J.L.; Burgemeister, K.; Hillman, D. Wind turbine sound limits: Current status and recommendations based on mitigating noise annoyance. Appl. Acoust. 2018, 140, 288–295. [Google Scholar] [CrossRef]
- Alamir, M.A.; Hansen, K.L.; Catcheside, P. Penalties applied to wind farm noise: Current allowable limits, influencing factors, and their development. J. Clean. Prod. 2021, 295, 126393. [Google Scholar] [CrossRef]
- Teff-Seker, Y.; Berger-Tal, O.; Lehnardt, Y.; Teschner, N. Noise pollution from wind turbines and its effects on wildlife: A cross-national analysis of current policies and planning regulations. Renew. Sustain. Energy Rev. 2022, 168, 112801. [Google Scholar] [CrossRef]
- Doolan, C.J.; Moreau, D.J.; Brooks, L.A. Wind Turbine Noise Mechanisms and Some Concepts for its Control. Acoust. Aust. 2012, 40, 7–13. [Google Scholar]
- Loiodice, S.; Drikakis, D.; Kokkalis, A. Emission surfaces and noise prediction from rotating sources. J. Sound Vib. 2018, 429, 245–264. [Google Scholar] [CrossRef]
- Loiodice, S.; Drikakis, D.; Kokkalis, A. An efficient algorithm for the retarded time equation for noise from rotating sources. J. Sound Vib. 2018, 412, 336–348. [Google Scholar] [CrossRef]
- Drewitt, A.L.; Langston, R.H. Assessing the impacts of wind farms on birds. Ibis 2006, 148, 29–42. [Google Scholar] [CrossRef]
- Erickson, W.P.; Johnson, G.D.; Strickland, D.M.; Young, D.P., Jr.; Sernka, K.J.; Good, R.E. Avian Collisions with Wind Turbines: A Summary of Existing Studies and Comparisons to Other Sources of Avian Collision Mortality in the United States; Technical Report; Western EcoSystems Technology, Inc.: Cheyenne, WY, USA; RESOLVE Inc.: Washington, DC, USA, 2001. [Google Scholar]
- Fox, A.D.; Petersen, I. Offshore wind farms and their effects on birds. Dan. Orn. Foren. Tidsskr 2019, 113, 86–101. [Google Scholar]
- Marques, A.T.; Batalha, H.; Rodrigues, S.; Costa, H.; Pereira, M.J.R.; Fonseca, C.; Mascarenhas, M.; Bernardino, J. Understanding bird collisions at wind farms: An updated review on the causes and possible mitigation strategies. Biol. Conserv. 2014, 179, 40–52. [Google Scholar] [CrossRef]
- Schippers, P.; Buij, R.; Schotman, A.; Verboom, J.; van der Jeugd, H.; Jongejans, E. Mortality limits used in wind energy impact assessment underestimate impacts of wind farms on bird populations. Ecol. Evol. 2020, 10, 6274–6287. [Google Scholar] [CrossRef]
- Cryan, P.M.; Gorresen, P.M.; Hein, C.D.; Schirmacher, M.R.; Diehl, R.H.; Huso, M.M.; Hayman, D.T.; Fricker, P.D.; Bonaccorso, F.J.; Johnson, D.H.; et al. Behavior of bats at wind turbines. Proc. Natl. Acad. Sci. USA 2014, 111, 15126–15131. [Google Scholar] [CrossRef]
- Pylant, C.L.; Nelson, D.M.; Fitzpatrick, M.C.; Gates, J.E.; Keller, S.R. Geographic origins and population genetics of bats killed at wind-energy facilities. Ecol. Appl. 2016, 26, 1381–1395. [Google Scholar] [CrossRef]
- Kruszynski, C.; Bailey, L.D.; Bach, L.; Bach, P.; Fritze, M.; Lindecke, O.; Teige, T.; Voigt, C.C. High vulnerability of juvenile Nathusius’ pipistrelle bats (Pipistrellus nathusii) at wind turbines. Ecol. Appl. 2022, 32, e2513. [Google Scholar] [CrossRef] [PubMed]
- Gómez-Catasús, J.; Garza, V.; Traba, J. Wind farms affect the occurrence, abundance and population trends of small passerine birds: The case of the Dupont’s lark. J. Appl. Ecol. 2018, 55, 2033–2042. [Google Scholar] [CrossRef]
- Falavigna, T.J.; Pereira, D.; Rippel, M.L.; Petry, M.V. Changes in bird species composition after a wind farm installation: A case study in south america. Environ. Impact Assess. Rev. 2020, 83, 106387. [Google Scholar] [CrossRef]
- Song, N.; Xu, H.; Zhao, S.; Liu, N.; Zhong, S.; Li, B.; Wang, T. Effects of wind farms on the nest distribution of magpie (Pica pica) in agroforestry systems of Chongming Island, China. Glob. Ecol. Conserv. 2021, 27, e01536. [Google Scholar] [CrossRef]
- Marques, A.T.; Batalha, H.; Bernardino, J. Bird Displacement by Wind Turbines: Assessing Current Knowledge and Recommendations for Future Studies. Birds 2021, 2, 460–475. [Google Scholar] [CrossRef]
- Aschwanden, J.; Stark, H.; Peter, D.; Steuri, T.; Schmid, B.; Liechti, F. Bird collisions at wind turbines in a mountainous area related to bird movement intensities measured by radar. Biol. Conserv. 2018, 220, 228–236. [Google Scholar] [CrossRef]
- Happ, C.; Sutor, A.; Hochradel, K. Methodology for the automated visual detection of bird and bat collision fatalities at onshore wind turbines. J. Imaging 2021, 7, 272. [Google Scholar] [CrossRef]
- Stantial, M.L.; Cohen, J.B. Estimating flight height and flight speed of breeding Piping Plovers. J. Field Ornithol. 2015, 86, 369–377. [Google Scholar] [CrossRef]
- Brabant, R.; Vanermen, N.; Stienen, E.W.; Degraer, S. Towards a cumulative collision risk assessment of local and migrating birds in North Sea offshore wind farms. Hydrobiologia 2015, 756, 63–74. [Google Scholar] [CrossRef]
- Meißner, K.; Sordyl, H. Literature review of offshore wind farms with regard to benthic communities and habitats. Ecol. Res. Offshore Wind Farms Int. Exch. Exp. 2006, 1–45. [Google Scholar]
- McCallum, L.C.; Whitfield Aslund, M.L.; Knopper, L.D.; Ferguson, G.M.; Ollson, C.A. Measuring electromagnetic fields (EMF) around wind turbines in Canada: Is there a human health concern? Environ. Health 2014, 13, 1–8. [Google Scholar] [CrossRef]
- Knopper, L.D.; Ollson, C.A.; McCallum, L.C.; Whitfield Aslund, M.L.; Berger, R.G.; Souweine, K.; McDaniel, M. Wind turbines and human health. Front. Public Health 2014, 2, 97656. [Google Scholar] [CrossRef] [PubMed]
- Kundu, S.N.; Keerti, M.S. Harvesting Energy from Wind. In Sustainable Energy and Environment: An Earth System Approach; CRC Press: Boca Raton, FL, USA, 2019; p. 223. [Google Scholar]
- Karanikas, N.; Steele, S.; Bruschi, K.; Robertson, C.; Kass, J.; Popovich, A.; MacFadyen, C. Occupational health hazards and risks in the wind industry. Energy Rep. 2021, 7, 3750–3759. [Google Scholar] [CrossRef]
- Alexias, A.; Kiouvrekis, Y.; Tyrakis, C.; Alkhorayef, M.; Sulieman, A.; Tsougos, I.; Theodorou, K.; Kappas, C. Extremely low frequency electromagnetic field exposure measurement in the vicinity of wind turbines. Radiat. Prot. Dosim. 2020, 189, 395–400. [Google Scholar] [CrossRef] [PubMed]
- Nazir, M.S.; Ali, N.; Bilal, M.; Iqbal, H.M. Potential environmental impacts of wind energy development: A global perspective. Curr. Opin. Environ. Sci. Health 2020, 13, 85–90. [Google Scholar] [CrossRef]
- Hutchison, Z.L.; Secor, D.H.; Gill, A.B. The interaction between resource species and electromagnetic fields associated with electricity production by offshore wind farms. Oceanography 2020, 33, 96–107. [Google Scholar] [CrossRef]
- Gill, A.B.; Gloyne-Philips, I.; Kimber, J.; Sigray, P. Marine renewable energy, electromagnetic (EM) fields and EM-sensitive animals. In Marine Renewable Energy Technology and Environmental Interactions; Springer: Berlin/Heidelberg, Germany, 2014; pp. 61–79. [Google Scholar]
- Flack, A.; Aikens, E.O.; Kölzsch, A.; Nourani, E.; Snell, K.R.; Fiedler, W.; Linek, N.; Bauer, H.G.; Thorup, K.; Partecke, J.; et al. New frontiers in bird migration research. Curr. Biol. 2022, 32, R1187–R1199. [Google Scholar] [CrossRef] [PubMed]
- Levitt, B.B.; Lai, H.C.; Manville, A.M. Effects of non-ionizing electromagnetic fields on flora and fauna, part 2 impacts: How species interact with natural and man-made EMF. Rev. Environ. Health 2022, 37, 327–406. [Google Scholar] [CrossRef]
- Hutchison, Z.L.; Gill, A.B.; Sigray, P.; He, H.; King, J.W. A modelling evaluation of electromagnetic fields emitted by buried subsea power cables and encountered by marine animals: Considerations for marine renewable energy development. Renew. Energy 2021, 177, 72–81. [Google Scholar] [CrossRef]
- Svendsen, J.C.; Ibanez-Erquiaga, B.; Savina, E.; Wilms, T. Effects of Operational Off-Shore Wind Farms on Fishes and Fisheries. Review Report; DTU Aqua-rapport No. 411-2022; DTU-Aqua: Kgs. Lyngby, Denmark, 2022; 62p. [Google Scholar]
- Christakis, N.; Drikakis, D.; Ritos, K.; Kokkinakis, I.W. Unsupervised machine learning of virus dispersion indoors. Phys. Fluids 2024, 36, 013320. [Google Scholar] [CrossRef]
Figure 1.
(a) Global Wind Atlas wind potential results for the Eastern Mediterranean Sea, where the importance of the northeastern region of Crete is demonstrated, based on the colour scale of velocities. The marker indicates the region. The gray colour scale indicates a lack of available velocity data. (b) The exact location of the Toplou meteorological mast on Google Earth [35], as marked by the pin.

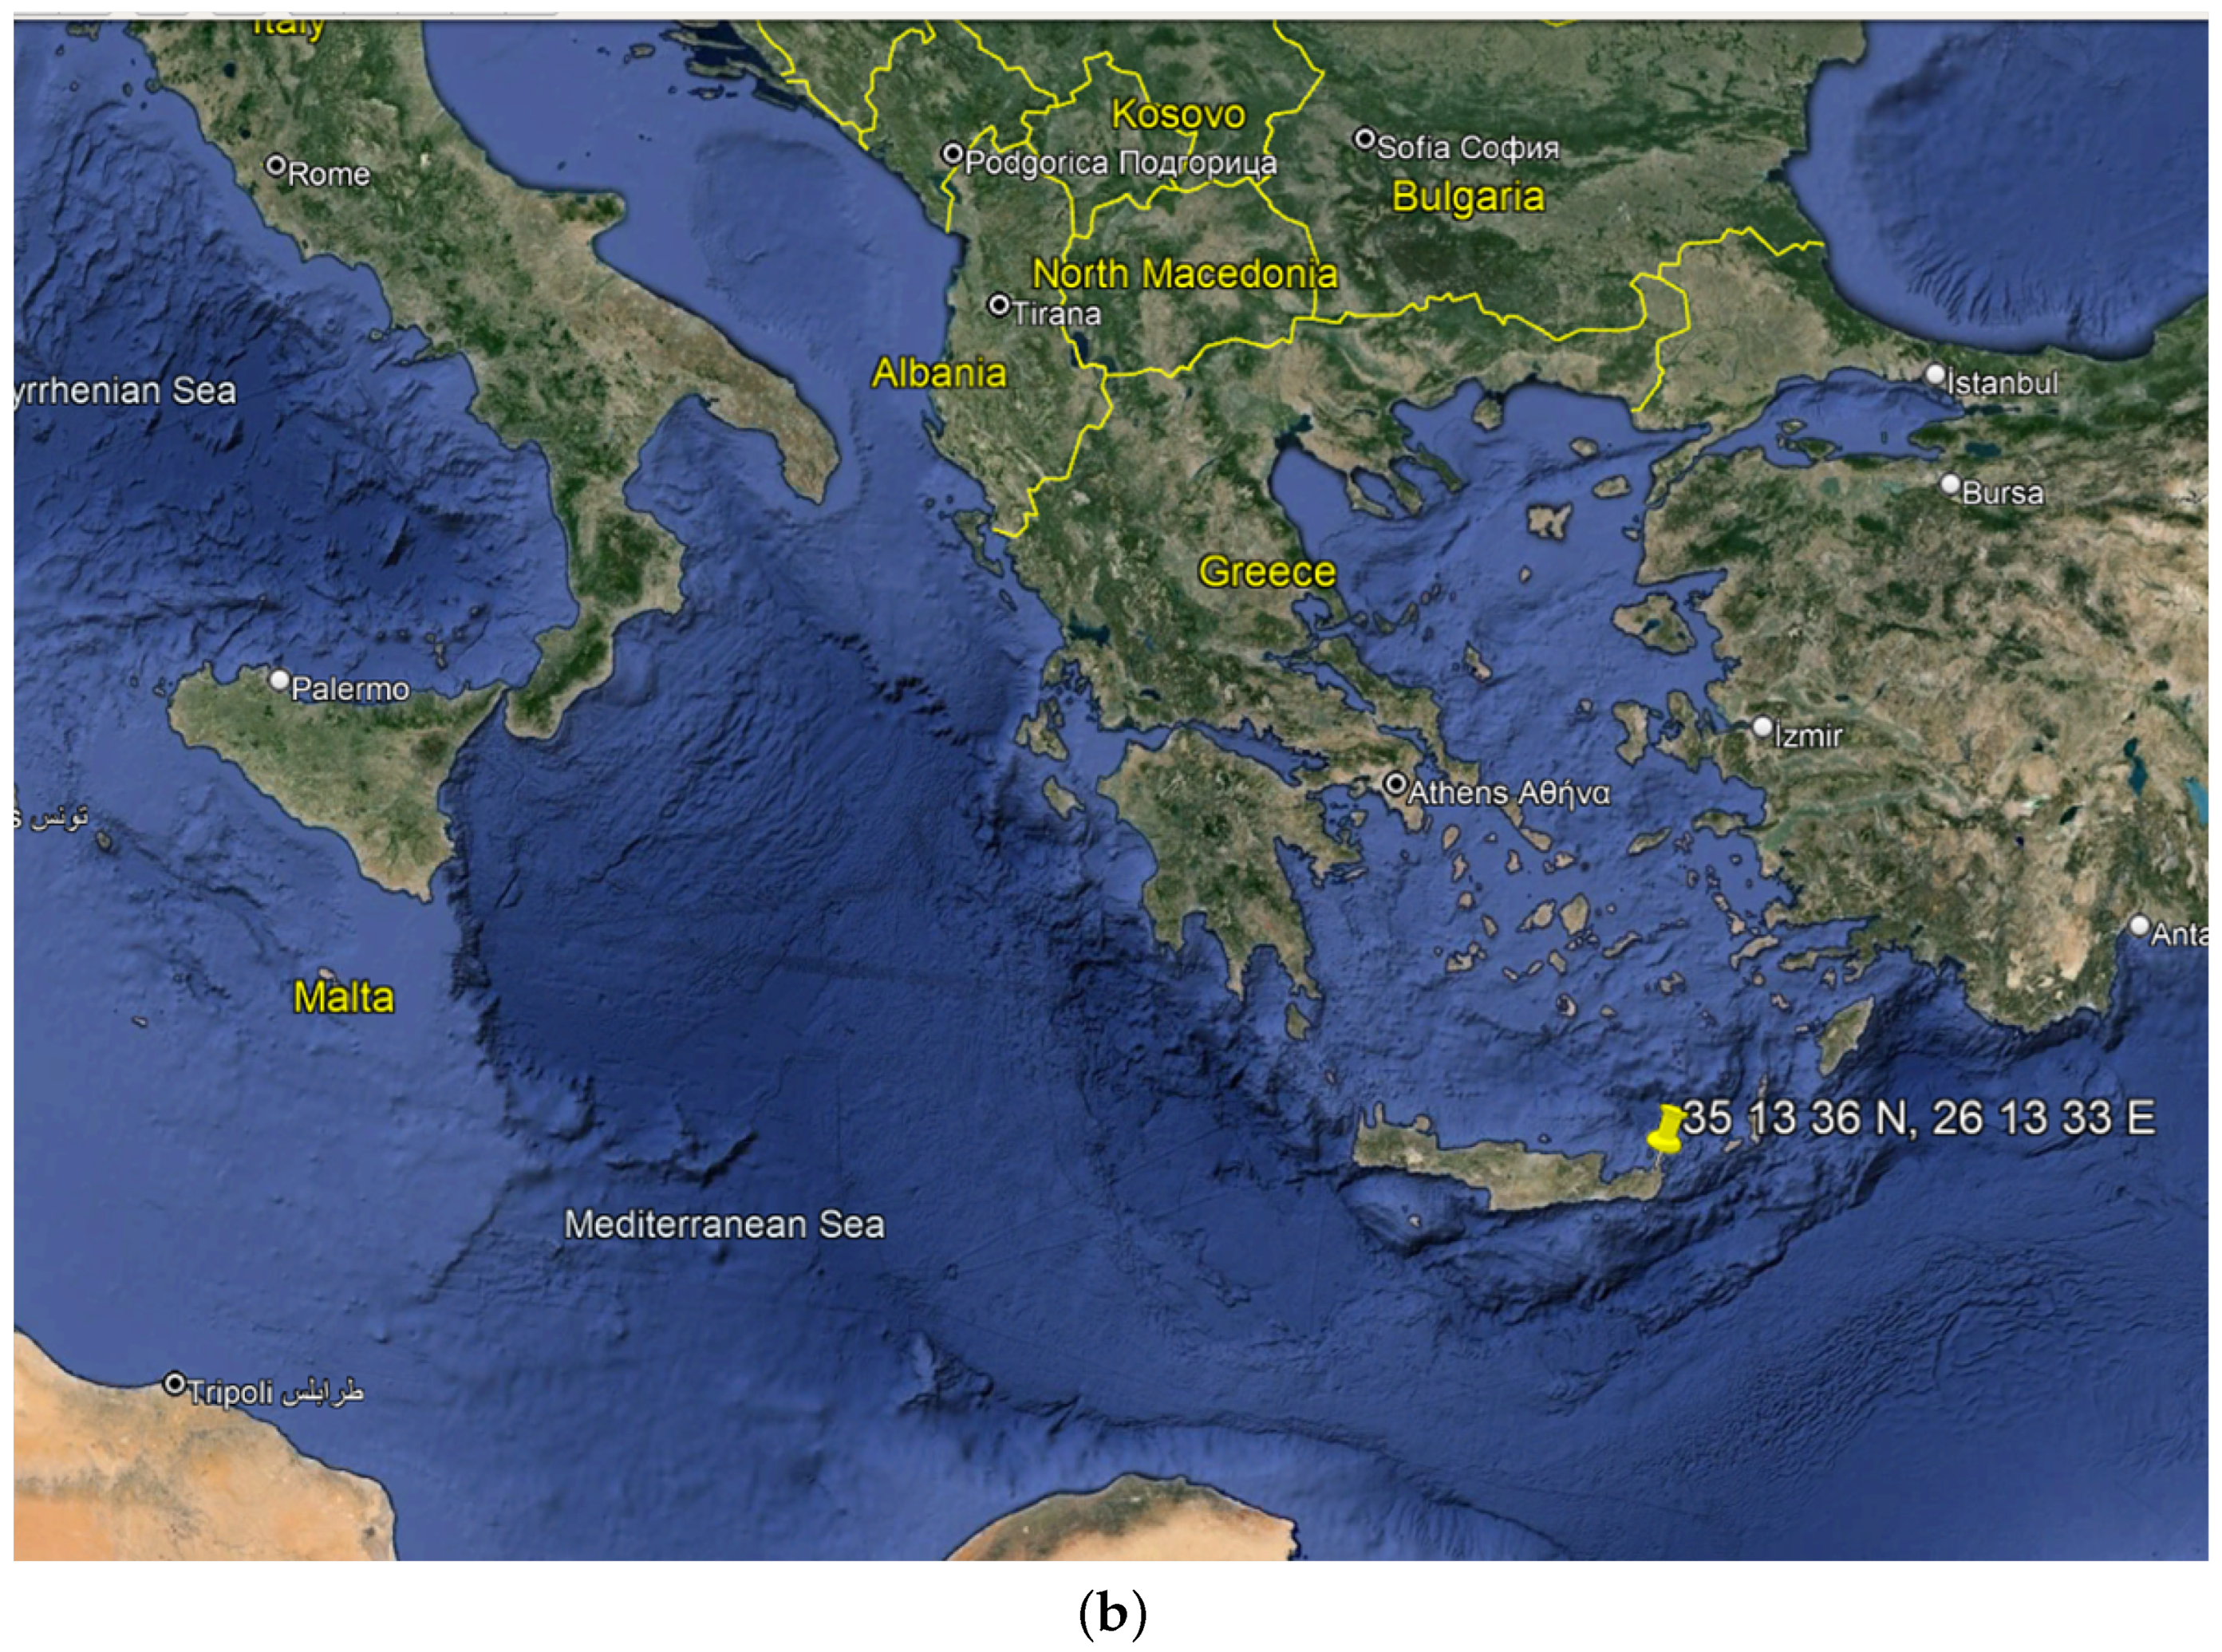
Figure 2.
Photograph of the 30 m meteorological mast and its surrounding area at Toplou.
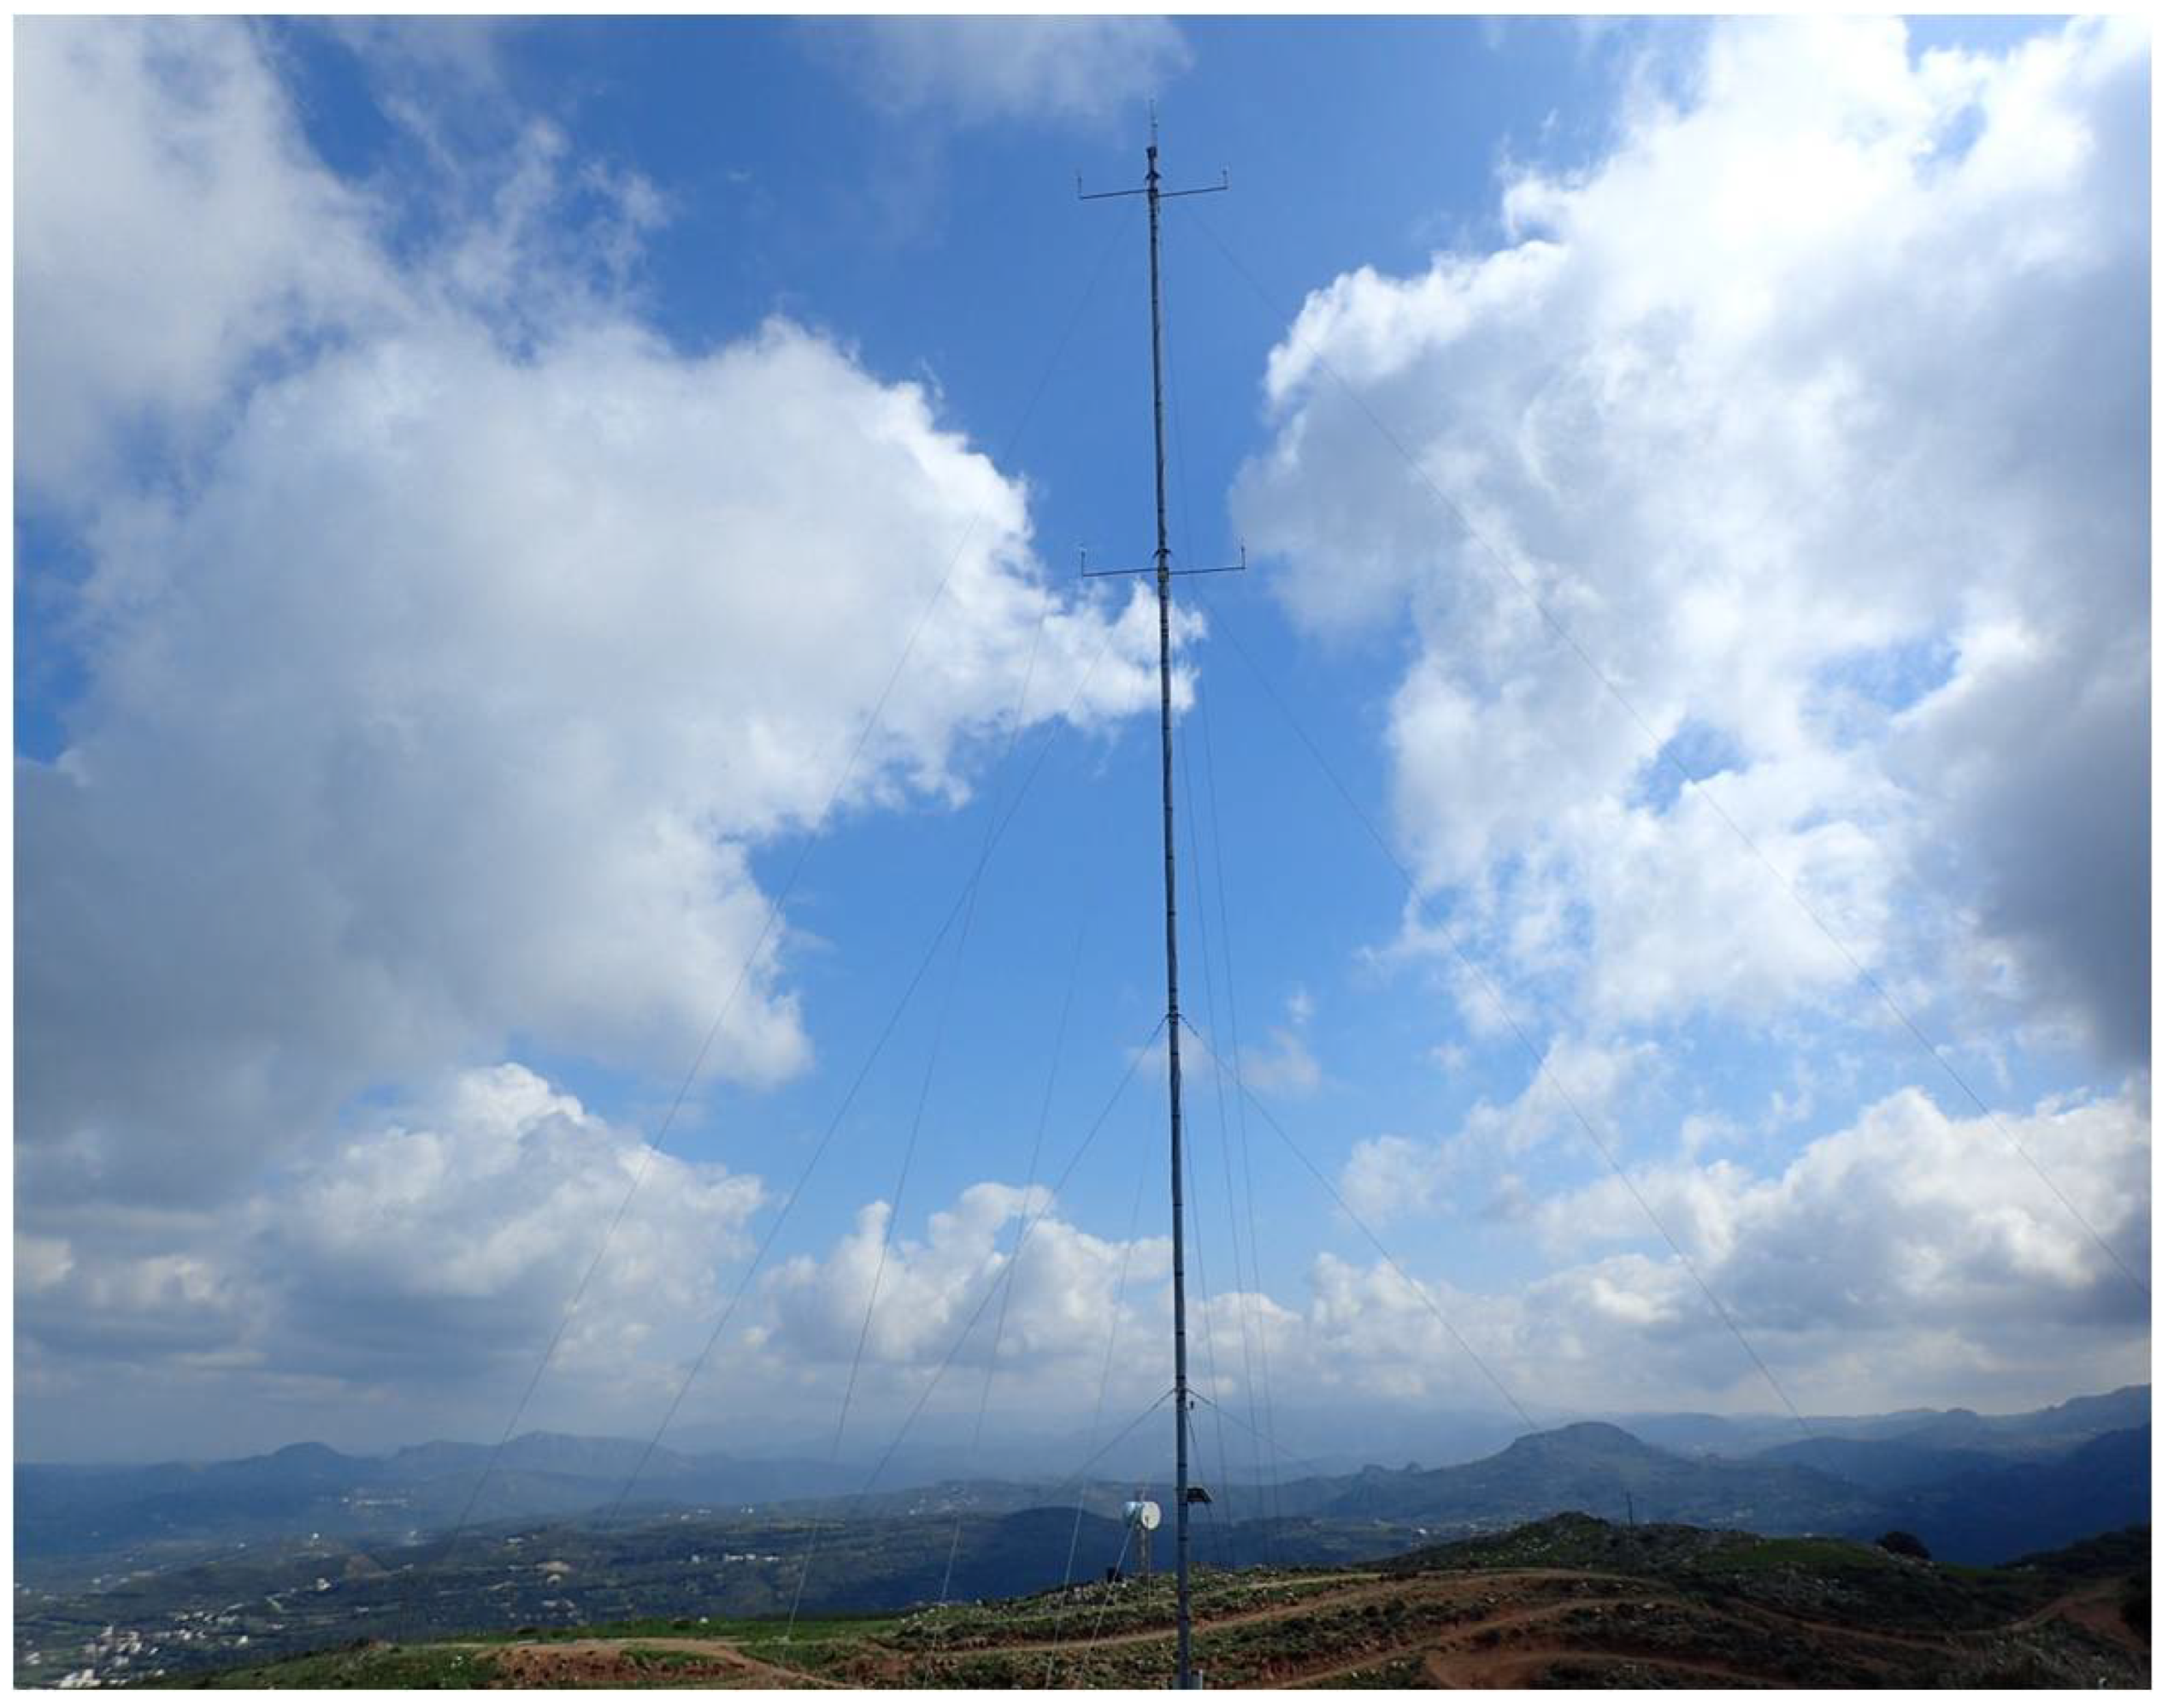
Figure 3.
Wind rose statistics of the Toplou region at 20 m agl for the 10 months of 2019.
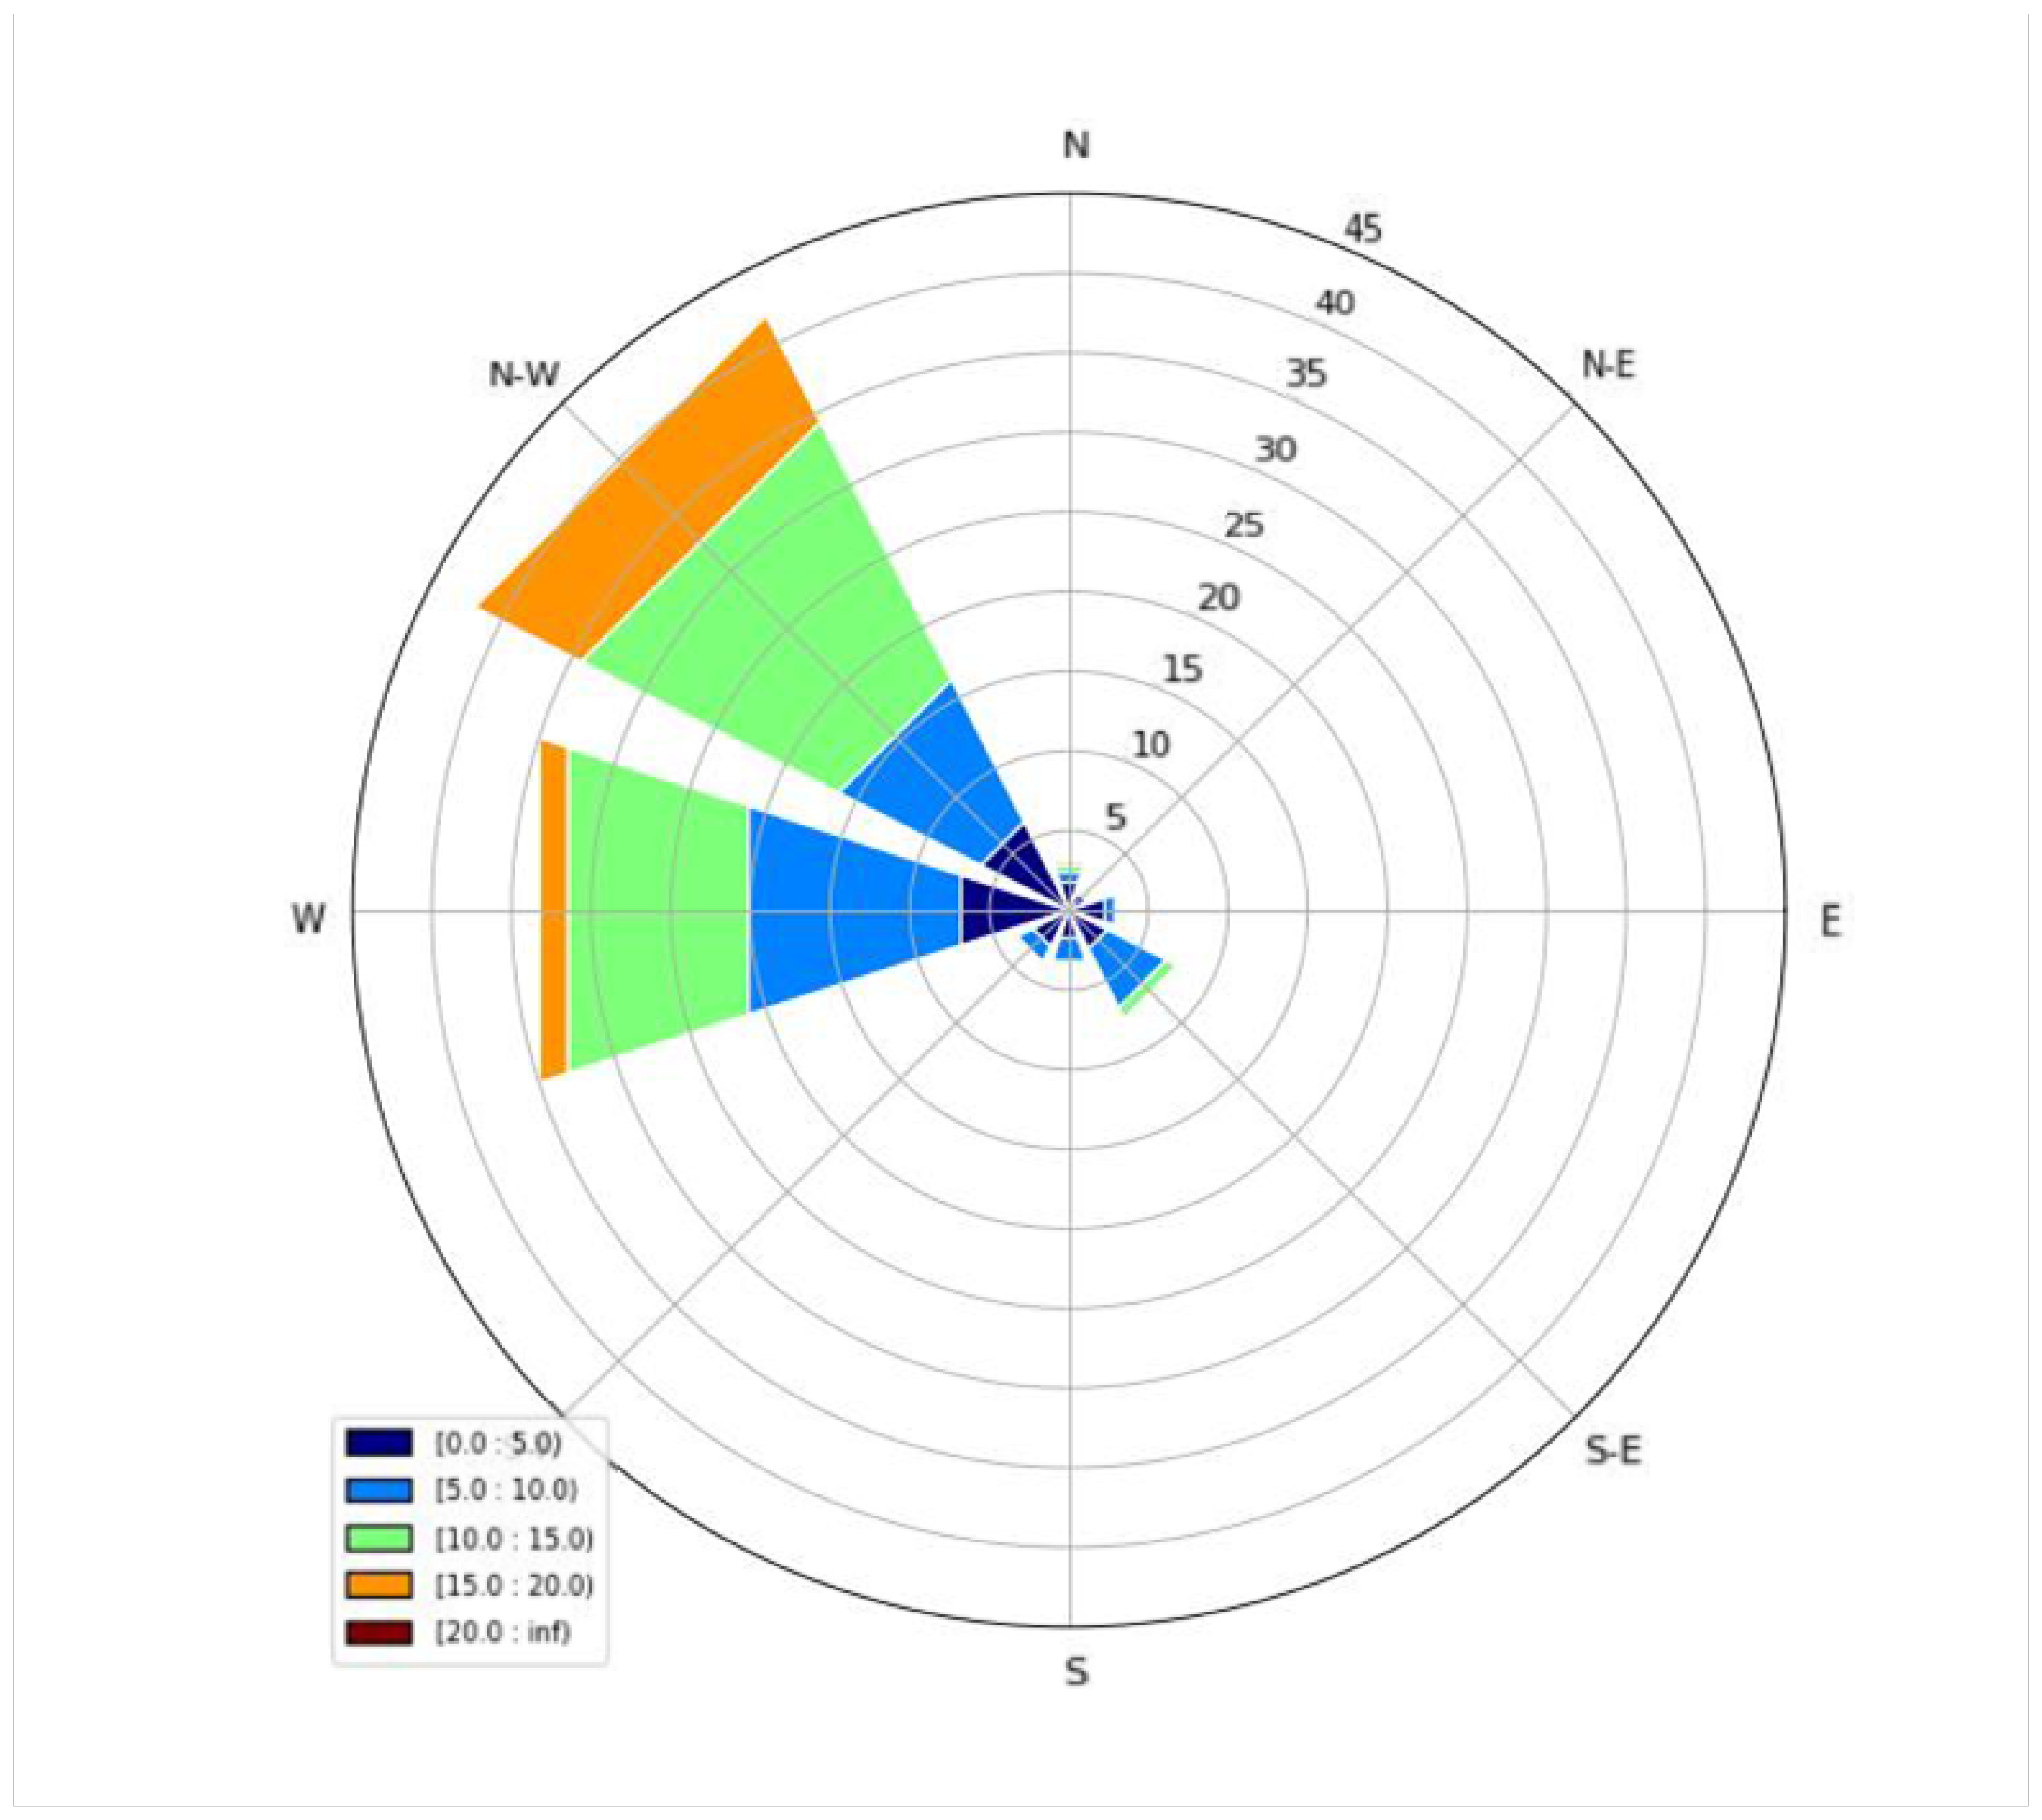
Figure 4.
Cumulative distribution function of measured wind velocities at 20 m agl for the 10 months of 2019.
Figure 4.
Cumulative distribution function of measured wind velocities at 20 m agl for the 10 months of 2019.
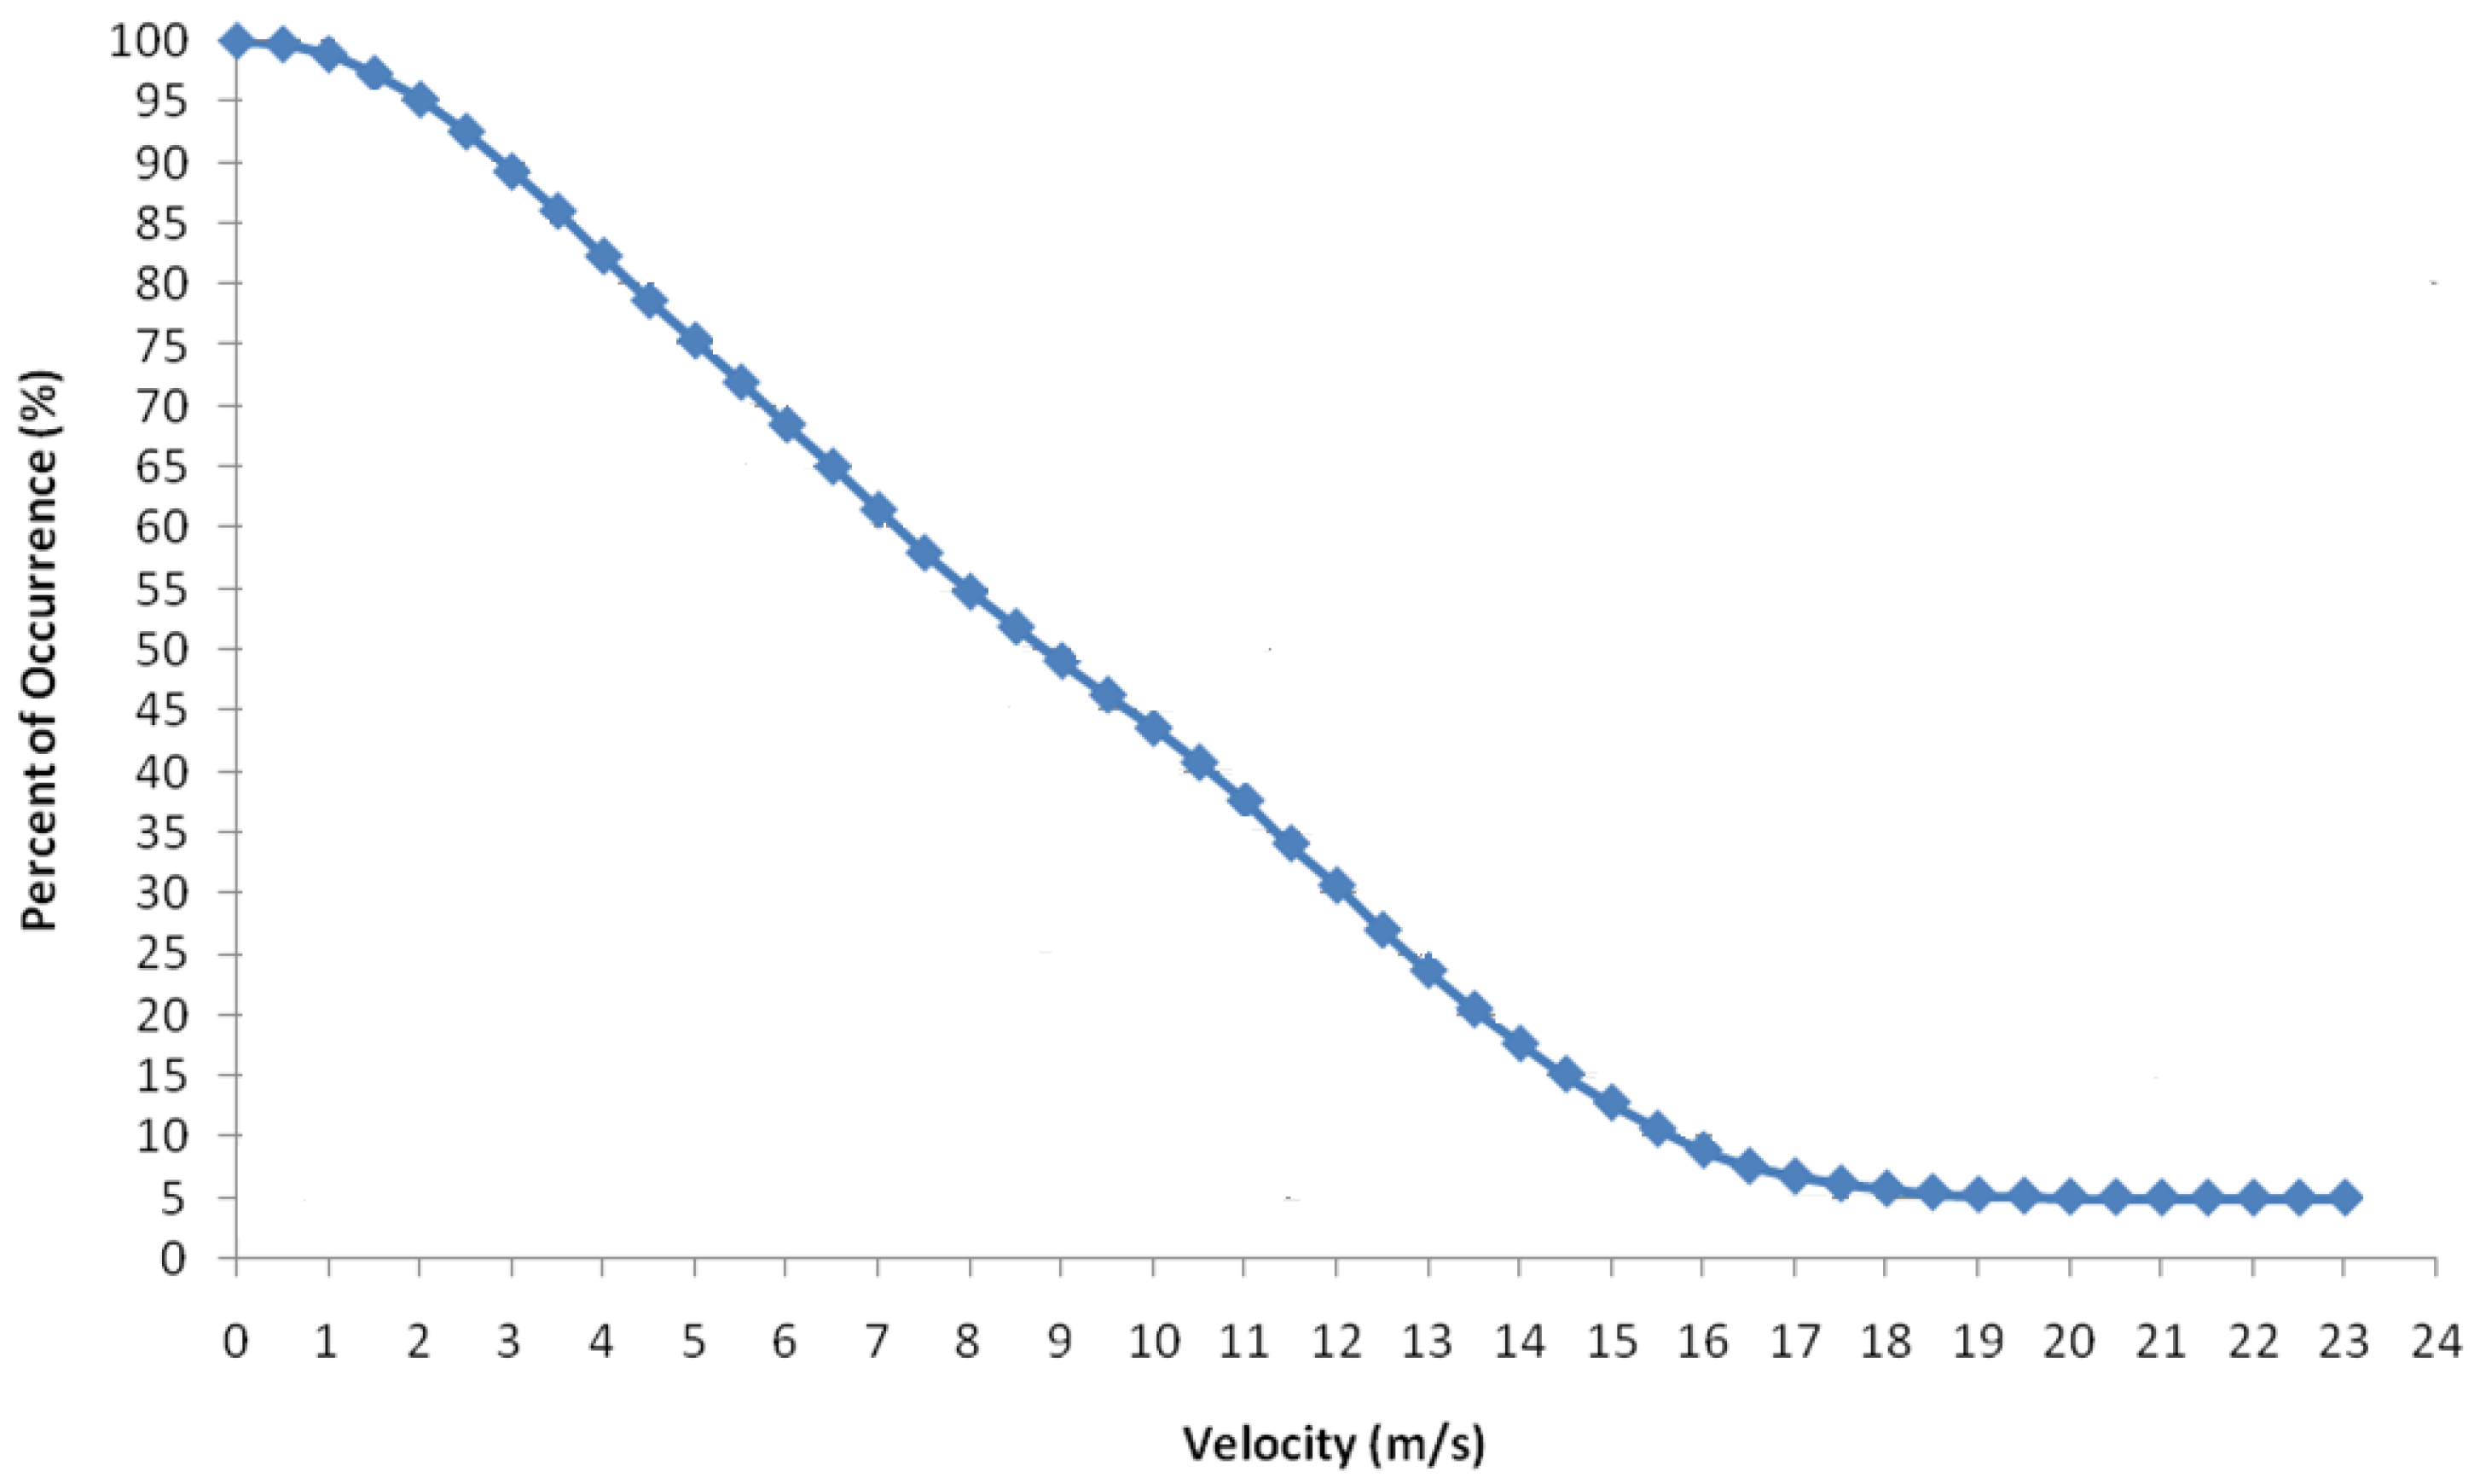
Figure 5.
The four WRF nested domains, from coarsest to finest: (a) domain 1, horizontal resolution: 10.8 km × 10.8 km; (b) domain 2, horizontal resolution: 3.6 km × 3.6 km; (c) domain 3, horizontal resolution: 1.2 km × 1.2 km; and (d) domain 4, horizontal resolution: 400 m × 400 m. Different colours represent different heights from sea level, with darker colours indicating higher altitudes.
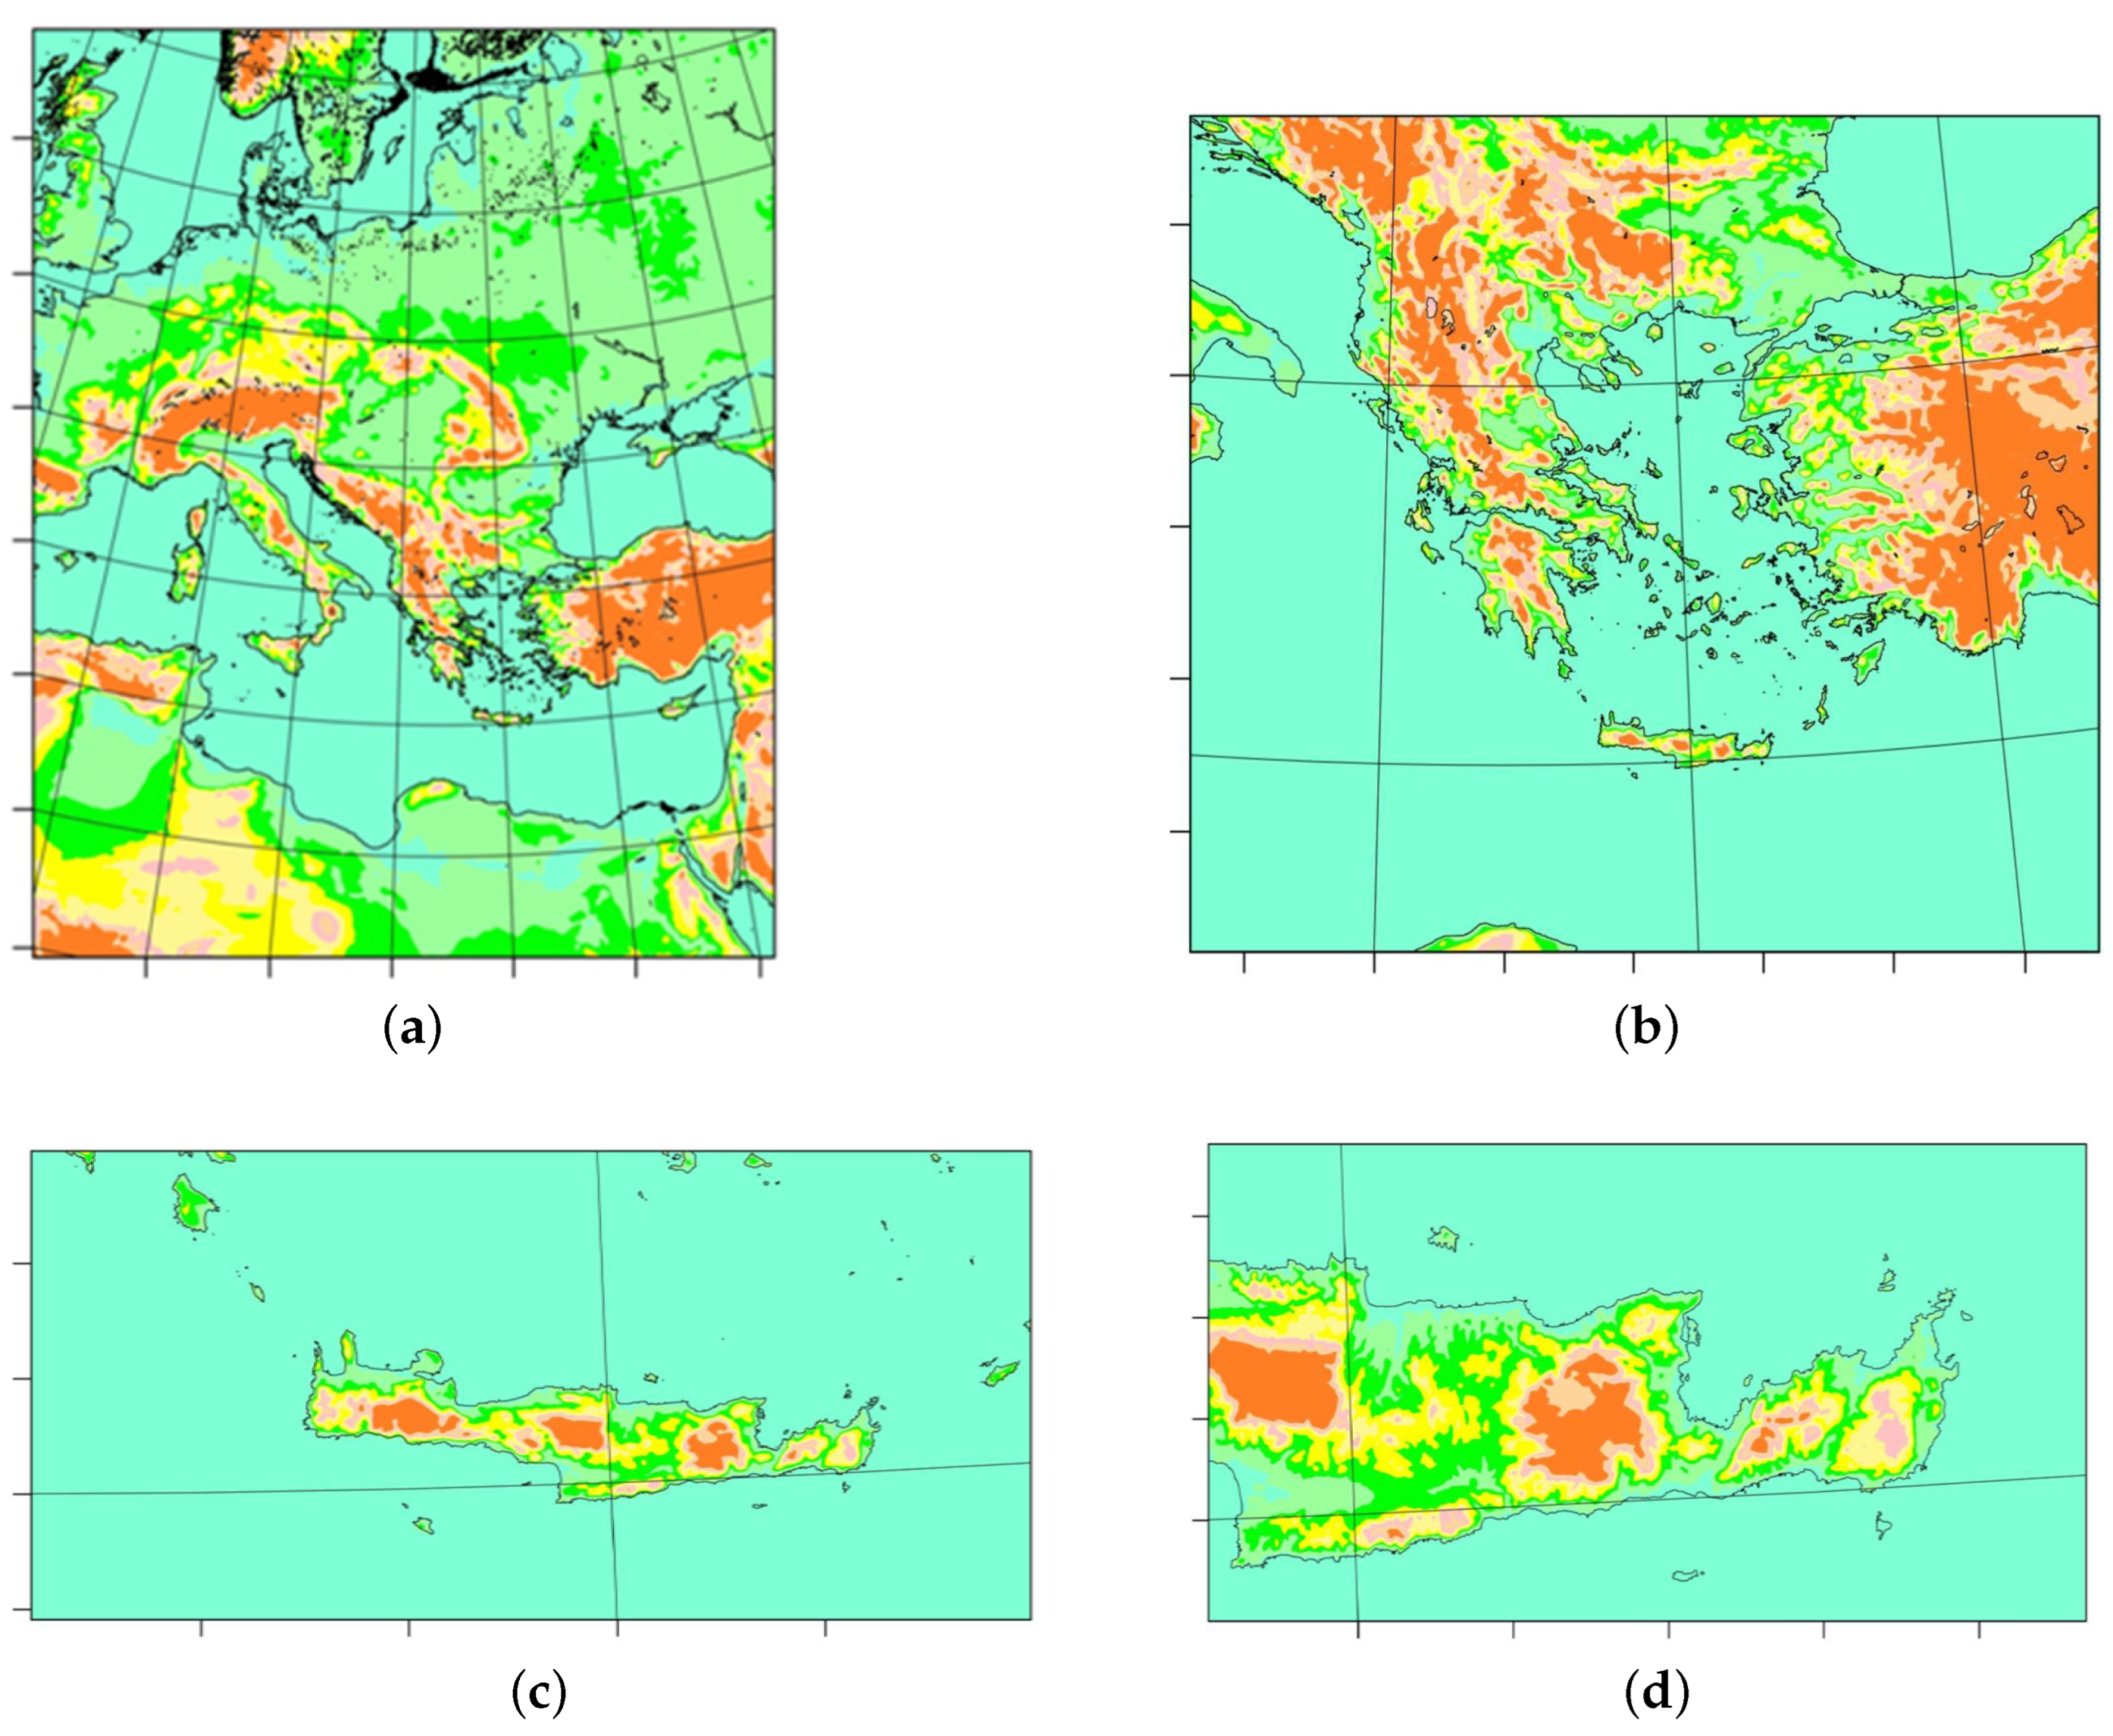
Figure 6.
Wind rose statistics of the Toplou region at 20 m agl for the 10 months of 2019 from the WRF model results.
Figure 6.
Wind rose statistics of the Toplou region at 20 m agl for the 10 months of 2019 from the WRF model results.
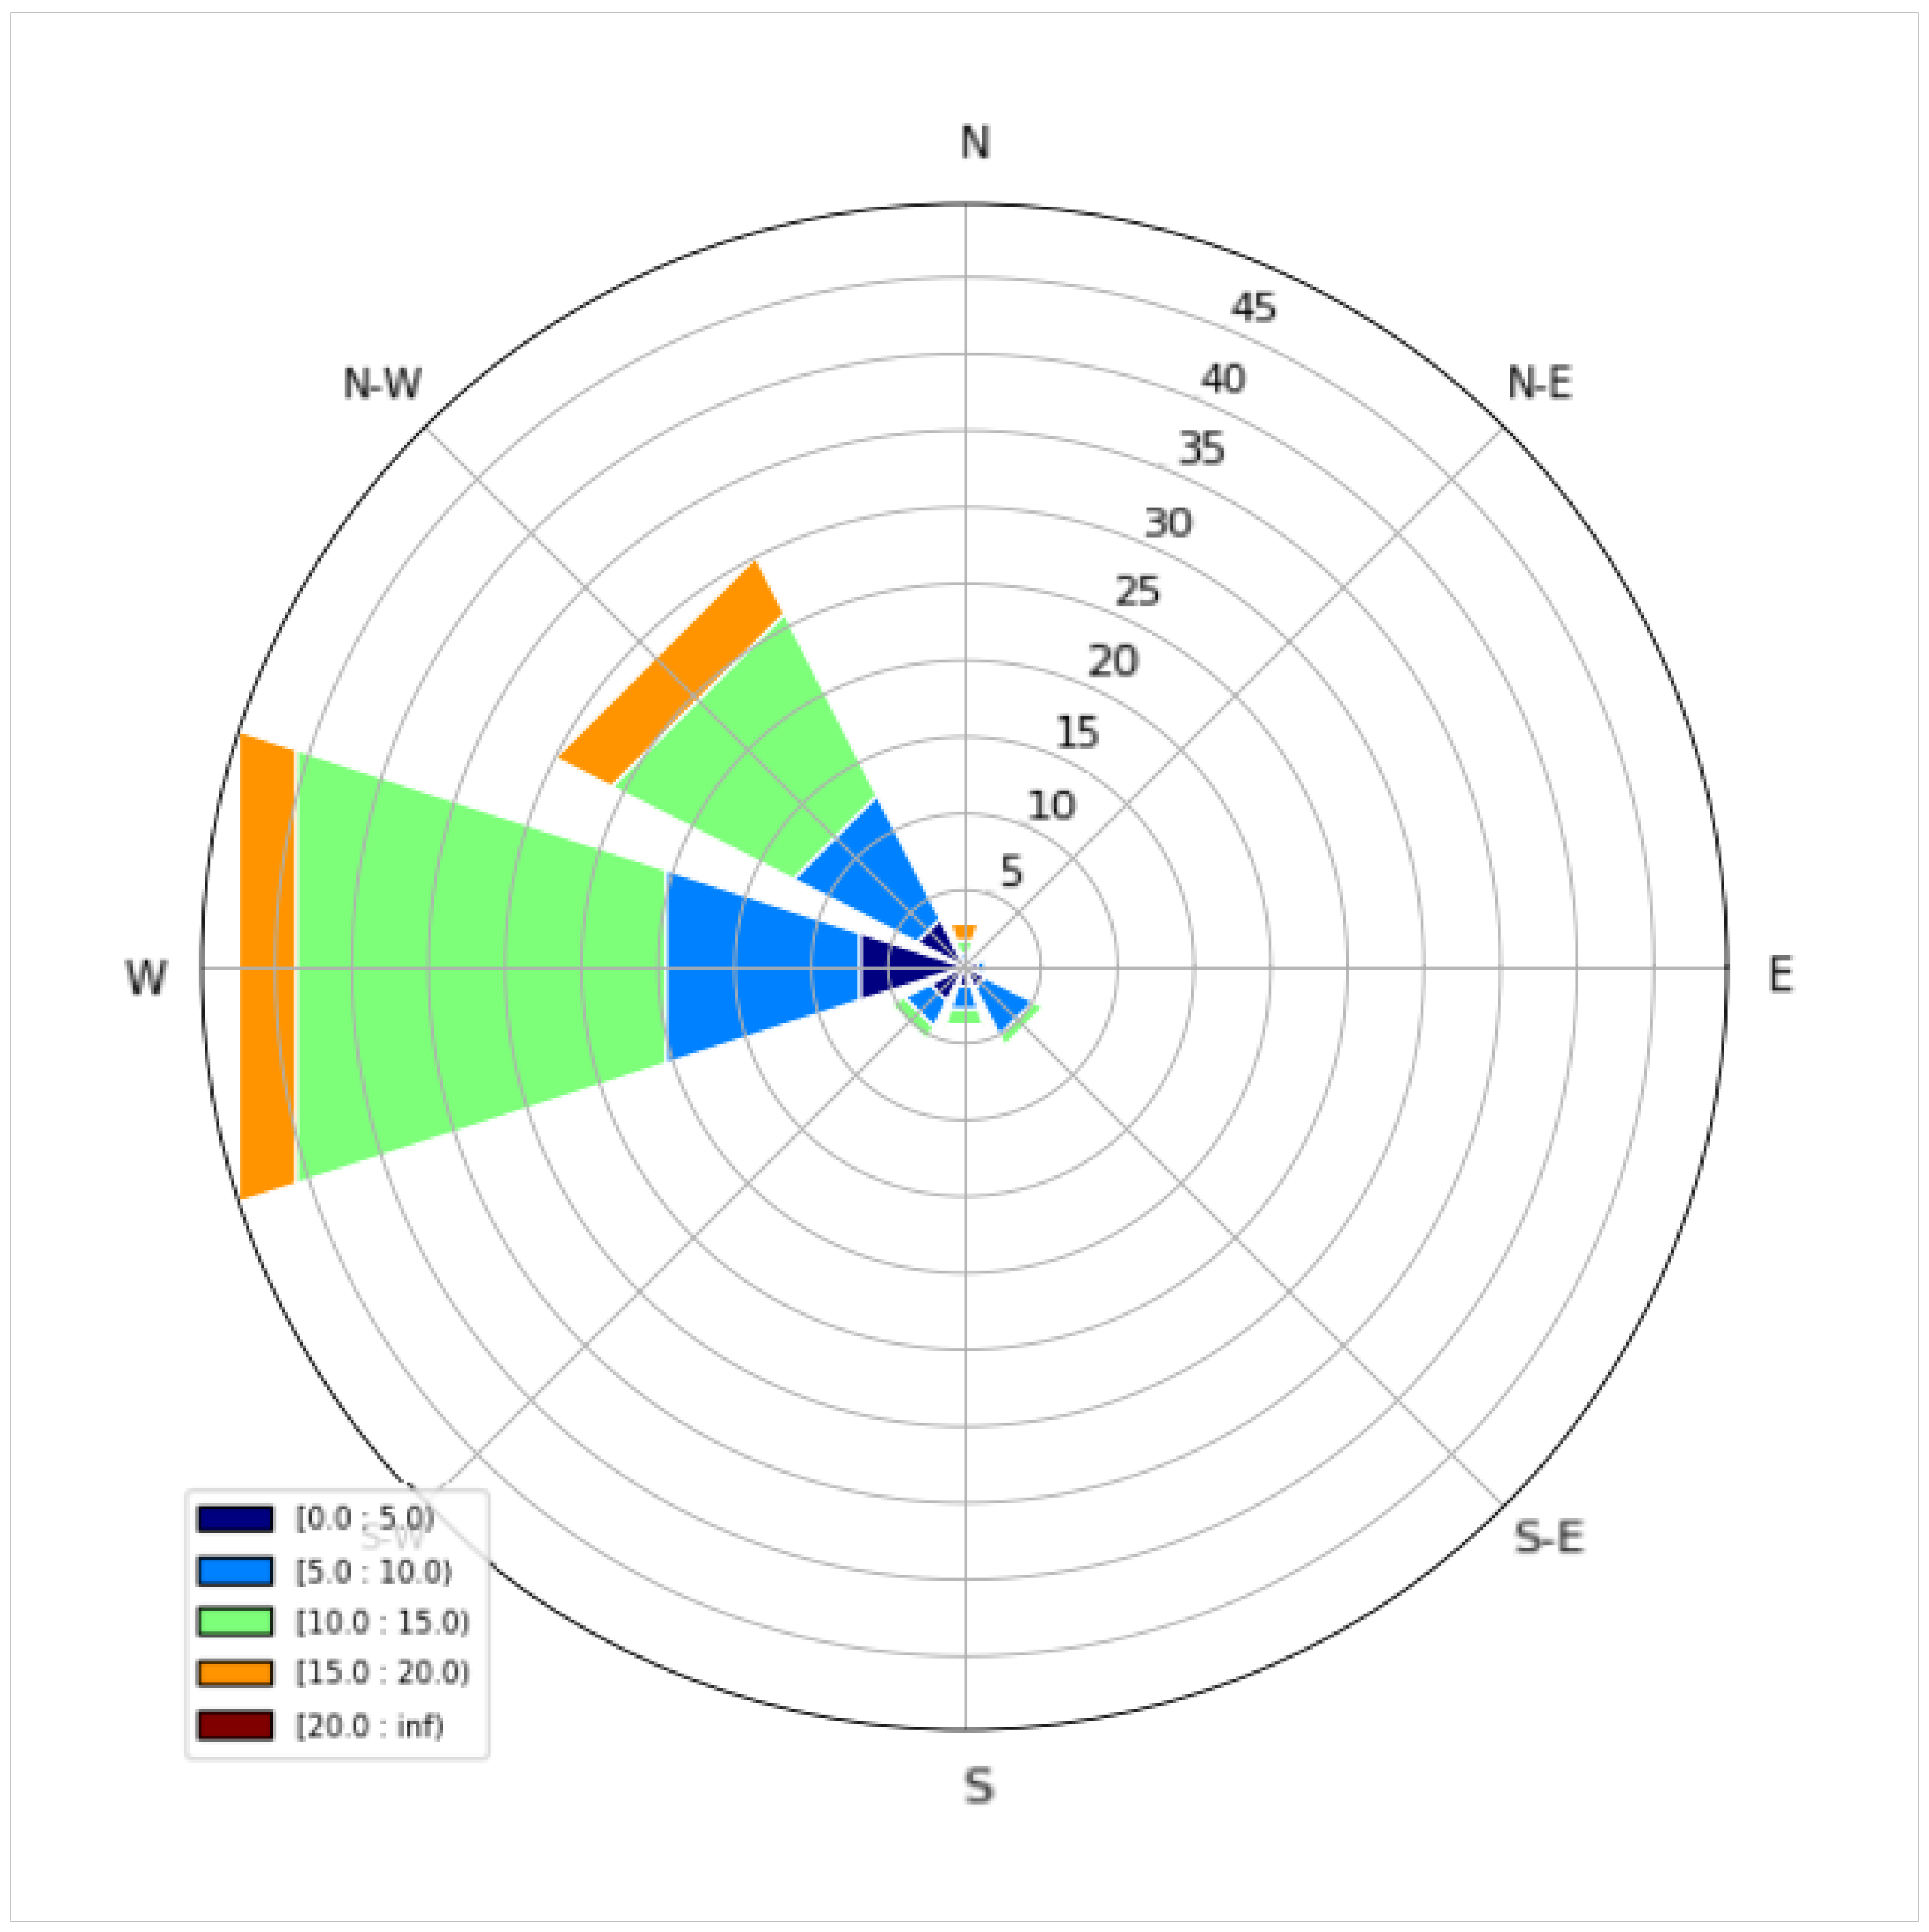
Figure 7.
Global Wind Atlas output at 10 m agl for the mast location in Toplou for 2008–2017. Mean wind velocity power density and wind rose statistics are reported.
Figure 7.
Global Wind Atlas output at 10 m agl for the mast location in Toplou for 2008–2017. Mean wind velocity power density and wind rose statistics are reported.

Table 1.
Measurement occurrence distributions (%) for the Toplou region at 20 m agl for the 10 months of 2019.
Table 1.
Measurement occurrence distributions (%) for the Toplou region at 20 m agl for the 10 months of 2019.
| N | NE | E | SE | S | SW | W | NW | |
|---|---|---|---|---|---|---|---|---|
| % | ||||||||
| March | 2.76 | 2.46 | 7.24 | 7.62 | 1.39 | 4.26 | 27.31 | 46.98 |
| April | 2.22 | 2.15 | 5.39 | 19.33 | 6.48 | 4.38 | 21.25 | 38.80 |
| May | 3.63 | 1.79 | 5.69 | 16.38 | 4.73 | 2.083 | 35.058 | 30.65 |
| June | 1.06 | 0.65 | 2.43 | 0.49 | 0.02 | 0.12 | 70.05 | 25.19 |
| July | 0.99 | 0.34 | 1.43 | 2.04 | 0.18 | 0.52 | 54.30 | 40.21 |
| August | 0 | 0 | 0 | 0 | 0 | 0 | 55.60 | 44.40 |
| September | 0.16 | 0.42 | 2.13 | 1.13 | 0.14 | 0.88 | 26.25 | 68.89 |
| October | 3.18 | 0.90 | 1.37 | 3.09 | 3.38 | 2.89 | 32.26 | 52.93 |
| November | 3.61 | 1.90 | 3.59 | 26.81 | 14.26 | 11.23 | 21.37 | 17.25 |
| December | 6.47 | 1.88 | 1.81 | 6.16 | 7.89 | 11.67 | 26.28 | 37.84 |
Table 2.
Mean wind velocity statistics for the Toplou region at 20 m agl for the 10 months of 2019.
| N | NE | E | SE | S | SW | W | NW | Weighted | |
|---|---|---|---|---|---|---|---|---|---|
| Average | |||||||||
| m/s | |||||||||
| March | 5.83 | 3.40 | 3.56 | 5.09 | 2.98 | 3.52 | 6.69 | 10.89 | 8.02 |
| April | 5.77 | 2.12 | 3.77 | 7.11 | 6.43 | 3.41 | 5.95 | 10.04 | 7.48 |
| May | 2.76 | 2.84 | 3.78 | 7.01 | 6.74 | 4.17 | 6.72 | 6.58 | 6.29 |
| June | 1.84 | 2.09 | 4.18 | 3.26 | 3.12 | 2.28 | 10.43 | 8.97 | 9.72 |
| July | 3.38 | 2.79 | 5.46 | 5.98 | 1.93 | 3.31 | 10.57 | 10.68 | 10.30 |
| August | 0 | 0 | 0 | 0 | 0 | 0 | 11.75 | 12.92 | 12.27 |
| September | 3.00 | 1.88 | 3.17 | 3.80 | 1.85 | 1.54 | 8.73 | 12.65 | 11.14 |
| October | 3.17 | 2.00 | 2.62 | 3.45 | 5.93 | 4.51 | 7.43 | 9.23 | 7.87 |
| November | 3.15 | 2.07 | 4.01 | 6.87 | 5.88 | 4.53 | 4.49 | 5.52 | 5.40 |
| December | 6.36 | 2.59 | 2.05 | 5.14 | 4.66 | 4.96 | 6.21 | 10.87 | 7.51 |
| Average | 8.60 |
Table 3.
Power density averages (W/m2) for the Toplou region at 20 m agl for the 10 months of 2019. All numbers have been rounded up to the nearest integer.
Table 3.
Power density averages (W/m2) for the Toplou region at 20 m agl for the 10 months of 2019. All numbers have been rounded up to the nearest integer.
| Month | N | NE | E | SE | S | SW | W | NW | Weighted |
|---|---|---|---|---|---|---|---|---|---|
| Average | |||||||||
| March | 452 | 160 | 57 | 180 | 34 | 78 | 394 | 1307 | 759 |
| April | 692 | 14 | 60 | 457 | 423 | 65 | 267 | 1045 | 600 |
| May | 22 | 24 | 52 | 424 | 330 | 95 | 285 | 320 | 289 |
| June | 6 | 11 | 71 | 38 | 20 | 15 | 938 | 752 | 848 |
| July | 31 | 15 | 168 | 247 | 7 | 60 | 1007 | 1029 | 9689 |
| August | 0 | 0 | 0 | 0 | 0 | 0 | 1195 | 1575 | 1364 |
| September | 22 | 8 | 28 | 50 | 6 | 7 | 745 | 1637 | 1325 |
| October | 38 | 20 | 25 | 70 | 349 | 125 | 434 | 754 | 558 |
| November | 40 | 14 | 75 | 296 | 255 | 116 | 91 | 169 | 182 |
| December | 517 | 30 | 15 | 228 | 177 | 231 | 333 | 1335 | 682 |
| Average | 758 |
Table 4.
Roughness lengths for the Toplou region at 20 m agl for the 10 months of 2019.
| N | NE | E | SE | S | SW | W | NW | Weighted | |
|---|---|---|---|---|---|---|---|---|---|
| Average | |||||||||
| cm | |||||||||
| March | 30.61 | 23.94 | 14.30 | 13.56 | 41.85 | 30.10 | 4.38 | 2.39 | 7.68 |
| April | 38.49 | 49.76 | 20.44 | 9.51 | 26.52 | 24.59 | 8.98 | 4.57 | 11.34 |
| May | 45.10 | 45.48 | 16.56 | 9.27 | 35.98 | 61.61 | 4.519 | 5.86 | 11.28 |
| June | 39.85 | 56.20 | 19.72 | 26.15 | 1.09 | 57.02 | 0.27 | 3.26 | 2.47 |
| July | 23.15 | 6.78 | 6.78 | 3.71 | 68.57 | 41.41 | 0.25 | 1.04 | 1.32 |
| August | 0 | 0 | 0 | 0 | 0 | 0 | 0.09 | 0.26 | 0.16 |
| September | 34.56 | 129.35 | 30.68 | 33.83 | 10.05 | 32.60 | 0.77 | 0.46 | 2.46 |
| October | 32.38 | 91.44 | 70.12 | 51.16 | 41.16 | 70.11 | 4.24 | 2.41 | 10.45 |
| November | 21.69 | 34.18 | 19.27 | 6.54 | 21.18 | 22.30 | 10.99 | 10.04 | 13.48 |
| December | 25.16 | 53.39 | 84.88 | 28.84 | 28.85 | 31.42 | 8.33 | 5.44 | 16.14 |
| Average | 7.68 |
Table 5.
WRF wind velocity occurrence distributions for the Toplou region at 10 m height for the 10 months of 2019.
Table 5.
WRF wind velocity occurrence distributions for the Toplou region at 10 m height for the 10 months of 2019.
| N | NE | E | SE | S | SW | W | NW | |
|---|---|---|---|---|---|---|---|---|
| % | ||||||||
| March | 13.33 | 0 | 0 | 0 | 0 | 0 | 8.28 | 78.39 |
| April | 0.69 | 0.23 | 6.21 | 2.53 | 0 | 5.06 | 49.43 | 35.86 |
| May | 0.69 | 2.07 | 4.37 | 23.45 | 24.83 | 14.02 | 25.75 | 4.83 |
| June | 0 | 0 | 0 | 0 | 0 | 0 | 95.63 | 4.37 |
| July | 0.69 | 0.92 | 1.38 | 0 | 0 | 5.98 | 67.59 | 23.45 |
| August | 0 | 0 | 0 | 0 | 0 | 0 | 75.63 | 24.37 |
| September | 0 | 0 | 0 | 0 | 0 | 0 | 71.26 | 28.74 |
| October | 0 | 0 | 0 | 0 | 0.23 | 8.76 | 70.97 | 20.05 |
| November | 0.23 | 0 | 2.07 | 32.18 | 16.78 | 17.47 | 11.49 | 19.77 |
| December | 14.25 | 0 | 0 | 0 | 0 | 3.45 | 22.07 | 60.23 |
Table 6.
WRF mean wind velocity statistics for the Toplou region extrapolated at 20 m agl for the 10 months of 2019.
Table 6.
WRF mean wind velocity statistics for the Toplou region extrapolated at 20 m agl for the 10 months of 2019.
| N | NE | E | SE | S | SW | W | NW | Weighted | |
|---|---|---|---|---|---|---|---|---|---|
| Average | |||||||||
| m/s | |||||||||
| March | 17.62 | 0 | 0 | 0 | 0 | 0 | 11.65 | 12.93 | 13.45 |
| April | 3.28 | 1.27 | 4.52 | 6.09 | 0 | 2.98 | 7.53 | 12.01 | 8.64 |
| May | 2.48 | 1.50 | 4.59 | 7.92 | 9.73 | 8.79 | 7.73 | 4.03 | 7.94 |
| June | 0 | 0 | 0 | 0 | 0 | 0 | 11.54 | 12.35 | 11.58 |
| July | 2.39 | 2.77 | 3.11 | 0 | 0 | 5.69 | 10.65 | 7.58 | 9.40 |
| August | 0 | 0 | 0 | 0 | 0 | 0 | 12.45 | 11.58 | 12.23 |
| September | 0 | 0 | 0 | 0 | 0 | 0 | 13.66 | 12.58 | 13.34 |
| October | 0 | 0 | 0 | 0 | 5.26 | 3.91 | 7.91 | 3.34 | 6.63 |
| November | 2.98 | 0 | 5.62 | 6.65 | 3.97 | 6.56 | 5.87 | 7.45 | 6.22 |
| December | 9.93 | 0 | 0 | 0 | 0 | 4.28 | 6.45 | 9.76 | 8.86 |
| Average | 9.83 |
Table 7.
Power density averages (W/m2) for the Toplou region at 20 m agl for the 10 months of 2019, as calculated through the use of the extrapolated WRF velocities. All numbers have been rounded up to the nearest integer.
Table 7.
Power density averages (W/m2) for the Toplou region at 20 m agl for the 10 months of 2019, as calculated through the use of the extrapolated WRF velocities. All numbers have been rounded up to the nearest integer.
| Month | N | NE | E | SE | S | SW | W | NW | Weighted |
|---|---|---|---|---|---|---|---|---|---|
| Average | |||||||||
| March | 2133 | 0 | 0 | 0 | 0 | 0 | 1053 | 1579 | 1593 |
| April | 60 | 4 | 117 | 312 | 0 | 38 | 467 | 1497 | 768 |
| May | 28 | 5 | 134 | 520 | 793 | 745 | 512 | 78 | 550 |
| June | 0 | 0 | 0 | 0 | 0 | 0 | 1026 | 1517 | 982 |
| July | 19 | 24 | 30 | 0 | 0 | 240 | 1030 | 470 | 810 |
| August | 0 | 0 | 0 | 0 | 0 | 0 | 1524 | 1025 | 1399 |
| September | 0 | 0 | 0 | 0 | 0 | 0 | 1676 | 1565 | 1643 |
| October | 0 | 0 | 0 | 0 | 190 | 54 | 438 | 65 | 328 |
| November | 35 | 0 | 204 | 335 | 69 | 430 | 196 | 498 | 316 |
| December | 892 | 0 | 0 | 0 | 0 | 102 | 428 | 820 | 714 |
| Average | 910 |
Table 8.
Error metrics for wind velocity and direction.
| Month | Bias (m/s) | RB | DACC |
|---|---|---|---|
| March | −0.03 | −0.23 | 91.34 |
| April | 0.64 | 7.92 | 61.28 |
| May | 2.60 | 47.98 | 48.06 |
| June | 0.26 | 2.31 | 98.64 |
| July | −0.31 | −3.173 | 82.23 |
| August | 0.036 | 0.30 | 99.32 |
| September | −0.10 | −0.76 | 95.89 |
| October | 0.03 | 0.44 | 70.78 |
| November | 0.95 | 18.01 | 74.49 |
| December | 1.54 | 20.96 | 77.68 |
Table 9.
Comparisons between the WRF and the GWA for mean wind velocity and power density at 10 m agl.
Table 9.
Comparisons between the WRF and the GWA for mean wind velocity and power density at 10 m agl.
| Mean Velocity (m/s) | Mean Power Density W/m2 | |
|---|---|---|
| WRF | 8.81 | 648 |
| GWA | 7.66 | 548 |
| RE (%) | 15 | 18 |
Disclaimer/Publisher’s Note: The statements, opinions and data contained in all publications are solely those of the individual author(s) and contributor(s) and not of MDPI and/or the editor(s). MDPI and/or the editor(s) disclaim responsibility for any injury to people or property resulting from any ideas, methods, instructions or products referred to in the content. |
© 2024 by the authors. Licensee MDPI, Basel, Switzerland. This article is an open access article distributed under the terms and conditions of the Creative Commons Attribution (CC BY) license (https://creativecommons.org/licenses/by/4.0/).
Share and Cite
MDPI and ACS Style
Christakis, N.; Evangelou, I.; Drikakis, D.; Kossioris, G. A Computational Methodology for Assessing Wind Potential. Energies 2024, 17, 1385. https://doi.org/10.3390/en17061385
AMA Style
Christakis N, Evangelou I, Drikakis D, Kossioris G. A Computational Methodology for Assessing Wind Potential. Energies. 2024; 17(6):1385. https://doi.org/10.3390/en17061385
Chicago/Turabian StyleChristakis, Nicholas, Ioanna Evangelou, Dimitris Drikakis, and George Kossioris. 2024. "A Computational Methodology for Assessing Wind Potential" Energies 17, no. 6: 1385. https://doi.org/10.3390/en17061385
Note that from the first issue of 2016, this journal uses article numbers instead of page numbers. See further details here.