
Unlocking the Thermal Efficiency of Irregular Open-Cell Metal Foams: A Computational Exploration of Flow Dynamics and Heat Transfer Phenomena

School of Mechanical and Power Engineering, Nanjing Tech University, Nanjing 211816, China
*
Author to whom correspondence should be addressed.
Energies 2024, 17(6), 1305; https://doi.org/10.3390/en17061305
Submission received: 17 February 2024
/
Revised: 1 March 2024
/
Accepted: 6 March 2024
/
Published: 8 March 2024
(This article belongs to the Special Issue Modeling and Analysis of Fluid Flow and Heat Transfer)
Abstract
:An open-cell metal foam has excellent characteristics such as low density, high porosity, high specific surface area, high thermal conductivity, and low mass due to its unique internal three-dimensional network structure. It has gradually become a new material for enhanced heat transfer in industrial equipment, new compact heat exchangers, microelectronic device cooling, etc. This research established a comprehensive three-dimensional structural model of open-cell metal foams utilizing Laguerre–Voronoi tessellations and employed computational fluid dynamics to investigate its flow dynamics and coupled heat transfer performance. By exploring the impact of foam microstructure on flow resistance and heat transfer characteristics, the study provided insights into the overall convective heat transfer performance across a range of foam configurations with varying pore densities and porosities. The findings revealed a direct correlation between convective heat transfer coefficient (h) and pressure drop (ΔP) with increasing Reynolds number (Re), accompanied by notable changes in fluid turbulence kinetic energy (e) and temperature (T), ultimately influencing heat transfer efficiency. Furthermore, the analysis demonstrated that alterations in porosity (ε) and pore density significantly affected unit pressure drop (ΔP/L) and convective heat transfer coefficient (h). This study identified an optimal configuration, highlighting a metal foam with a pore density of 20 PPI and a porosity of 95% as exhibiting superior overall convective heat transfer performance.
1. Introduction
Under the global climate change and energy crisis, green, low-carbon, and energy-saving technologies have become novel research topics of intense interest. The academic community has gradually attached importance to the application of enhanced heat transfer technology to heat exchange devices, resulting in the emergence of various novel types of enhanced heat transfer materials. Open-cell metal foams have attracted the attention of many scholars as a novel compact heat transfer surface with highly efficient heat transfer performance and a unique heat transfer mechanism [1,2,3,4,5]. An open-cell metal foam contains interconnected internal pores that enable fluids to flow within the foam and is highly permeable, making this material indispensable for energy storage [6,7], filtration [8], and separation [9,10]. The presence of abundant pores considerably reduces the weight of a metal foam. An open-cell metal foam with a high porosity (ε) has the advantages of a high specific surface area (Sv) and low flow resistance, which facilitate convective heat transfer. Therefore, open-cell metal foams have broad application prospects for multiphase heat exchangers [11], compact heat exchangers for use in the aerospace industry [12], catalyst carriers [13,14], and cooling of electronic components [15,16].
In 1956, Darcy et al. [17] experimentally studied the seepage of water flow through saturated sand particles. Friction between a fluid and pores in porous media (viscous resistance) was shown to be the main resistance to fluid flow, and the pressure drop (ΔP) was demonstrated to be proportional to the fluid velocity (v). Darcy’s law was proposed based on these results. Forchheimer et al. [18] subsequently found that factors such as inertial resistance and the acceleration effect needed to be considered in addition to viscous resistance to correlate the resistance to fluid flow with v in porous media. In porous media, as v increases, the viscous resistance gradually decreases and inertial resistance becomes dominant, such that the relationship between ΔP and v deviates from Darcy’s law, which is corrected by the Darcy–Forchheimer model given below:
Inayat et al. [19] modified the Hagen–Poiseuille equation to obtain a prediction equation for ΔP of a fluid flowing in an open-cell foam based on the foam structural parameters (the pore size and ε). Xu et al. [20] investigated the flow characteristics of a tube partially filled with an open-cell metal foam under forced convection. The Brinkman flow model was used to describe the fluid transport in the foam region, and the influence of various factors on the flow resistance was analyzed to obtain an expression for the friction coefficient. Boomsma et al. [21] proposed a geometric model of an idealized open-cell metal foam based on a fundamental periodic unit of eight cells. The numerically simulated ΔP was approximately 25% lower than that measured experimentally under the same flow conditions. Cunsolo et al. [22] employed the Lord Kelvin and Weaire–Phelan models to numerically simulate the heat transfer and ΔP of an open-cell metal foam, as measured by the Nusselt number (Nu) and Darcy–Weisbach friction coefficients, respectively. There was less than a 10% difference between the ΔP values calculated using the two geometric models for ε values above 90%. Other researchers used similar unit cells to build open-cell structures. Buonomo et al. [23] simulated pressure drop and heat transfer in nanofluids at the pore length scale in open metal porous structures using the Kelvin cell model. Wang et al. [24] investigated the heat transfer in a more simplified model, assuming that all the cells were cubic.
Kim et al. [25] analyzed the resistance to water flow in metal foam fins with ε values of 89% to 96% and pore densities of 10, 20, and 40 PPI. Both permeability and friction were found to be correlated with ε. Nie et al. [26] studied aluminum foams with different pore densities and ε values at v in the range of 0.5 to 20 m/s. Numerical simulation results demonstrated that increasing the pore density or decreasing ε caused ΔP to increase, in good agreement with experimental data. Medraj et al. [27] used air as a working fluid to investigate the flow characteristics of complex and simple structured metal foams over a range of v values. Increasing the pore size produced an increase in the permeability coefficient and a decrease in the non-Darcian permeability coefficient for the simple structured metal foam, but had the opposite effect for the complex structured metal foam. For both foams, increasing ε produced a decrease in ΔP and an increase in the permeability. Paek et al. [28] experimentally investigated the effective thermal conductivity and permeability of aluminum foams with different ε values (89~96%). The effective thermal conductivity was found to decrease with increasing ε, and ε and pore size were found to considerably influence permeability. Mancin et al. [29] conducted an experimental study on aluminum foams with different ε values (0.903~0.956) and pore densities (5, 10, 20, and 40 PPI) at different v values. Increasing ε or decreasing the pore density produced a decrease in the shape factor and an increase in permeability. Dukhan [30] measured the steady-state unidirectional ΔP for nine open-cell aluminum foam samples with different ε values and pore densities. The unit pressure drop (ΔP/L) of the fluid was found to decrease with increasing ε and increase with increasing pore density. ε significantly affected the permeability and inertia coefficient of the foams. Elayiaraja et al. [31] experimentally investigated ΔP and the heat transfer performance of a copper metal foam with ε = 61.3% and a pore density of 20 PPI. ΔP was discovered to be influenced by the permeability and shape factor of the foam. When the inlet flow regime changed from plug flow to fully developed flow, the shape factor affected ΔP more than the viscous resistance.
Salas et al. [32] examined the convective heat transfer characteristics of metal foam sandwich panels with different foam thicknesses (6.4~25.4 mm). Increasing the foam thickness enhanced heat transfer, and the foam thickness and skeleton size were identified as the main factors affecting convective heat transfer. Kopanidis et al. [33] presented a simulation methodology for the flow and conjugated heat transfer at the pore scale of high-porosity open-cell metal foam. The work obtained the conjugated flow and temperature fields for two different foam pore densities under various conditions. The results were found to be in reasonable agreement with the experimental measurements. Laschet et al. [34] utilized a multiscale approach to predict the effective thermal conductivity and permeability of open-cell metal foams. Good agreement was observed between the effective thermal conductivities obtained at high temperatures by simulation and experiment. Ranut et al. [35] used X-ray tomography to perform a 3D reconstruction of the microstructure of an aluminum foam with three pore densities and used computational fluid dynamics (CFD) to investigate the flow and heat transfer characteristics of the foams. The effective thermal conductivity of the foam was found to be mainly affected by the thermal conductivity of the solid ligaments. Yu et al. [36] studied the flow and heat transfer performance of porous carbon foams at the cell pore scale and found that ε and the pore size of the foam remarkably affected the heat transfer performance of heat exchangers. Poureslami et al. [37] examined a pore-scale numerical simulation of the convection–conduction heat transfer and flow in open-cell metal foams with a three-dimensional multiple-relaxation time lattice Boltzmann code. The results showed that permeability was reduced by up to 70% as the PPI increased. The overall heat transfer coefficient of 40 PPI was, on average, 110% higher than that of 20 PPI. Panknahad et al. [38] reported a pore-scale conjugated heat transfer and flow study in high-porosity Voronoi metal foams using the multi-relaxation-time regularized lattice Boltzmann method. In the non-Darcy regime, the slope of the heat transfer coefficient vs. Reynolds number increased as the pore density increased and the porosity decreased.
Alhusseny et al. [39] analyzed the distribution of the flow resistance and heat transfer coefficient in square channels partially filled with a metal foam for different filling rates, ε values, pore densities, and Re values (250~2000). Heat transfer was found to increase significantly as the filling rate and foam ε decreased or as Re increased. Du et al. [40] numerically investigated the conjugated heat transfer in a metal foam-filled double pipe. It was revealed that the proposed numerical model can effectively predict the heat transfer process in the double pipe heat exchanger. Sinn et al. [41] conducted µCT-based CFD simulations of open-cell ceramic foams with artificial heat sources and quantified the influence of superficial velocity, heat source intensity, and material on the temperature fields inside the foam. The proposed method provided the possibility to study thermal effects involving catalytic supports and offered valuable insight into heat transport mechanisms. Li et al. [42] employed two numerical approaches to study coupled radiation–convection in a rectangular channel filled with metal foam. The heat transfer efficiency was enhanced by increasing the pore density and decreasing the ε of the foam. Wang et al. [43] measured ΔP through tubes filled with stainless steel foams with the same ε and different pore densities (10, 30, and 70 PPI) under convective boundary conditions. The air flow velocity and pore density were found to significantly affect Nu at the inner wall.
Researchers have mainly studied the ΔP and heat transfer characteristics in open-cell metal foams by theoretical analysis, numerical simulations, and experiments on existing commercial metal foams (e.g., Cu and Al), either by filling channels with foams or embedding foams in phase-change materials. Most numerical simulations used simplified geometric models, e.g., models consisting of cubic or tetradecahedral cells, to perform flow inside metal foams. It has been demonstrated that the geometrical features of open-cell foam structures modeled by the Laguerre–Voronoi tessellation method, such as the number of struts per vertex and the number of faces per pore, closely align with those observed experimentally, surpassing other models, e.g., Voronoi and Poisson–Voronoi models. The Laguerre–Voronoi tessellation method allows researchers to characterize material properties at the microscale with high resolution, leading to a better understanding of material behavior and performance. In this study, a 3D model of an open-cell metal foam was established using Laguerre–Voronoi tessellations to obtain structural features close to those of real foams. Numerical simulations were performed to investigate the flow and heat transfer characteristics of the foam, considering fluid–solid coupling. The influence of the microstructure of the foam on flow and heat transfer performance was analyzed. The foam structural parameters that produce excellent overall thermodynamic performance were determined.
2. Model and Calculation Method
2.1. Governing Equations
In this study, the structure of an open-cell metal foam was modeled using Laguerre–Voronoi tessellations. To characterize the internal geometric structure and topological properties of the constructed open-cell metal foam, the influence of the volume variation coefficient of the spheres on the distribution of foam pores (polyhedra) was analyzed. Using pore consistency as the evaluation criterion, an analysis was conducted on the sub-models obtained through the representative volume element method. The distribution morphology of the topological parameters in the constructed model was explored. The modeling procedure has been detailed in the literature [44,45]. A 3D, steady-state, and incompressible fluid was used to study fluid flow in the foam and the structural heat transfer characteristics of the foam. The following assumptions were made to improve the calculation efficiency: (1) As the maximum temperature in this study was 333.15 K, the influence of radiative heat transfer was neglected. (2) Fluid flowing through an open-cell metal foam did not undergo a phase change. The physical properties of the foam and the fluid were constant (i.e., did not change with temperature), and the foam skeleton was isotropic. (3) The contact thermal resistance between the fluid and the metal skeleton was neglected.
These assumptions were used to derive the following governing equations for fluid flow and heat transfer in an open-cell metal foam.
(1) Mass conservation equation for the fluid:
(2) Momentum conservation equation for the fluid:
(3) Energy conservation equation:
In engineering applications, fluid flow is considered to be laminar for Re < 2300 and turbulent for Re > 2300. However, fluid flow in open-cell metal foams does not conform to this rule because the irregular 3D reticulated structure of the foam induces anisotropy in the internal fluid flow and easily generates vortices near the foam skeleton. Therefore, the fluid flow in the foam is turbulent at low Re values [45,46,47,48]. Considering the flow regime, flow characteristics, and calculation accuracy for the fluid in the foam, the standard k-ε turbulence model was selected as the calculation model to obtain accurate simulation results.
2.2. Computational Domain and Simulation Parameter Settings
Figure 1 shows the computational domain used for the numerical simulation of the constructed 3D model for the cubic open-cell metal foam. To obtain stabilization and full development of the fluid entering the open-cell foam area and to minimize the impact of the front-end area on convective heat transfer, the lengths of both the front- and rear-end areas were set equal to those of the corresponding open-cell foam area. The dimensions of the computational domain for numerical simulation in this study were set based on previous work [9,49] and are shown in Table 1.
Fluent 2021 R1 was used to numerically simulate the flow and temperature fields in the open-cell metal foam. The boundary conditions for the inlet and outlet were applied to the velocity inlet and pressure outlet, respectively. Air and copper were chosen as the materials for the fluid and solid domains, respectively. The inlet temperature was set to 298.15 K, with the pressure set at 0 Pa. Symmetrical boundary conditions were applied at the left, right, and lower walls; no-slip boundary conditions were applied at the upper walls of the front- and rear-end areas; a coupled fluid–solid interface was used; and a constant heat source temperature of 333.15 K was set at the upper wall of the open-cell foam area. The pressure–velocity coupling equation was solved by the SIMPLE algorithm; the standard format was adopted for the pressure interpolation algorithm; the second-order upwind format was used to calculate momentum and energy; and the first-order upwind format was used to calculate the turbulence kinetic energy (e) and turbulent dissipation rate. The convergence residual was set to 10−8 for the energy equation and 10−4 for other terms.
2.3. Parameters Used in Calculations
(1) The unit pressure drop ΔP/L, where L is the flow path length, is calculated as:
where Pin and Pout are the inlet and outlet pressures of the open-cell foam, respectively. The resistance coefficient f characterizes the fluid resistance due to the combined action of viscous and inertial forces and the influence of vortices, which is calculated as follows:
where d is the average pore diameter and ρ is the fluid density.
(2) The convective heat transfer coefficient h is defined as:
where is the mass flow rate of the fluid; Cp is the specific heat capacity at constant pressure of the fluid; A is the heat transfer surface area; Tin and Tout are the air inlet and outlet temperatures, respectively; and Ts is the temperature of the solid skeleton of the metal foam. ΔTout = Ts − Tout and ΔTin = Ts − Tin. In this study, heat conduction occurs through contact between the heating plate and the foam. The fluid is subjected to convective heat transfer between the fluid and the high-temperature foam skeleton. The total surface area of the metal foam, Ats, is selected as the heat transfer surface. Then, h is expressed as follows:
where Acs is the channel cross-sectional area.
The dimensionless heat transfer coefficient j is defined as:
where Pr is the Prandtl number (which reflects the influence of the physical properties of the fluid on convective heat transfer); and µf and kf are the dynamic viscosity and thermal conductivity of the fluid, respectively.
(3) The following dimensionless numbers are introduced: the pore Reynolds number (Re) to characterize the fluid flow; the Hagen number (Hg), a dimensional form of the pressure gradient; and Nu as a measure of the strength of convective heat transfer.
In Equation (13), ηf is the fluid kinematic viscosity, and .
3. Results and Discussion
3.1. Laws for Flow Resistance and Structural Heat Transfer
An open-cell metal foam with a pore density of 30 PPI and ε = 95% was investigated through a 3D model of a rectangular channel based on the specifications presented in Table 1. Figure 2a,b shows that both ΔP/L and h increased with increasing Re. This indicates that increasing the flow rate v can improve the convective heat transfer coefficient while also increasing the pressure drop. To study the variation law of the local h and P along the fluid flow direction, 34 cross-sections of the investigated foam were created at 0.2 mm intervals along the x-axis, as shown in Figure 2c. The average h over the foam cross-section is expressed as:
where q is the average heat flux density for the cross-section, and and are the average temperatures of the fluid and metal skeleton for the cross-section, respectively.
Figure 2d,e shows the variation in and along the flow direction X/Xtot, as well as h along the X/Xtot coordinate. In Figure 2d, gradually increased during the flow process. exhibited little variation along the flow direction and fluctuated around a temperature of 320 K. Figure 2e shows that hav fluctuated along the flow direction and increased when the fluid flowed near the foam skeleton. v gradually decreased in the foam skeleton area, whereby the fluid fully contacted the high-temperature skeleton and some vortices formed at the back of the skeleton, enhancing the heat transfer performance. When the fluid passed through the foam pores, h decreased, which was attributed to the decrease in the flow resistance of the fluid in the pore area. Low flow resistance caused a gradual increase in v in the pore area and thus deteriorated the heat transfer performance. Figure 3a,b reveals the variation in along Y/Ytot (along the heat conduction direction, which is perpendicular to the flow) and the corresponding distribution contour plot, respectively. This analysis addresses how heat was conducted through the foam under the influence of the heating source. The gradual decrease in mean temperature from top to bottom indicates heat transfer to the lower-temperature fluid.
Figure 3c shows the variation in the average pressure (Pav) on the foam cross-section along X/Xtot (parallel to the flow direction). By examining Pav’s continuous decrease along the flow, the figure addresses how fluid flow impacts pressure distribution within the foam. The inset reveals the pressure distribution along the longitudinal section at Re = 793. To investigate the flow and temperature fields of the open-cell metal foam under different Re values, a longitudinal section z = 6.2 mm parallel to the direction of fluid flow and a cross-section x = 3.5 mm perpendicular to the direction of fluid flow were used for analysis, as shown in Figure 2f. A central cutline was also chosen on the longitudinal section (z = 6.2 mm). Then, the variation in v along this cutline at different Re values and the velocity vector distribution over the longitudinal section for Re = 793 are demonstrated in Figure 3d,e, respectively. Figure 3d shows velocity fluctuations within the foam structure along the central cutline due to the random structure of the skeleton. The trend in v was consistent for different Re values. Selected points along the cutline were marked in the velocity contour, as shown in Figure 3e. v was high in the pore region (Point c) due to the low flow resistance. v decreased sharply near the skeleton (Point b) and was zero at the point of contact with the skeleton (Point d).
Figure 4a shows the distribution of the fluid velocity vector over the foam cross-section (x = 3.5 mm) for Re = 793. The figure indicates that v was high in the pore region but low (and even stagnant) in the vicinity of the skeleton. Figure 4d presents the variation in v along the central cutline of the cross-section for different Re values and at selected points along the cutline for Re = 793. The fluctuations in v were similar to those over the longitudinal section, which was high in the pore region (Points a, c, and d) and dropped sharply to zero near the skeleton (Points b and e). The trend in v was consistent at different Re values, and the range of variation in v increased with increasing Re. Figure 4b describes the P distribution along the longitudinal section at Re = 793. P increased gradually along the front end of the skeleton (from Points b to c) and declined overall along the back end of the skeleton (from Points a to b). The direct fluid impact on the front end of the skeleton produced a high P, whereas the back end developed a relatively low P. Figure 4e shows the variation in P along the central cutline of the longitudinal section for different Re values and marks selected points along the cutline for Re = 793. It can be seen that P in the foam fluctuated over a small range and decreased overall along the cutline. Both P and its range of variation increased with increasing Re. Figure 4c illustrates the distribution of P over the foam cross-section at Re = 793. In the direction perpendicular to the fluid flow, high-P regions developed around the entire metal skeleton, and relatively low P appeared in the pore region because the intricate metal skeleton obstructed the fluid flow. Figure 4f shows the variation in P along the central cutline of the foam cross-section for different Re values and at selected points along the central cutline for Re = 793. Combined with Figure 4c, P increased gradually along the pore region (from Points b to c), decreased sharply along the skeleton (from Points a to b), and fluctuated considerably near the skeleton (at Points c, d, and e). For flow inside foams, pressure drop ΔP consisted of two main components resulting from friction between the fluid and the foam wall and the local impact of the fluid on the skeleton. In this case, the local ΔP caused by the fluid impacting the skeleton was the dominant contribution to ΔP. The range of variation in P along the metal skeleton increased with increasing Re, resulting in a higher local ΔP.
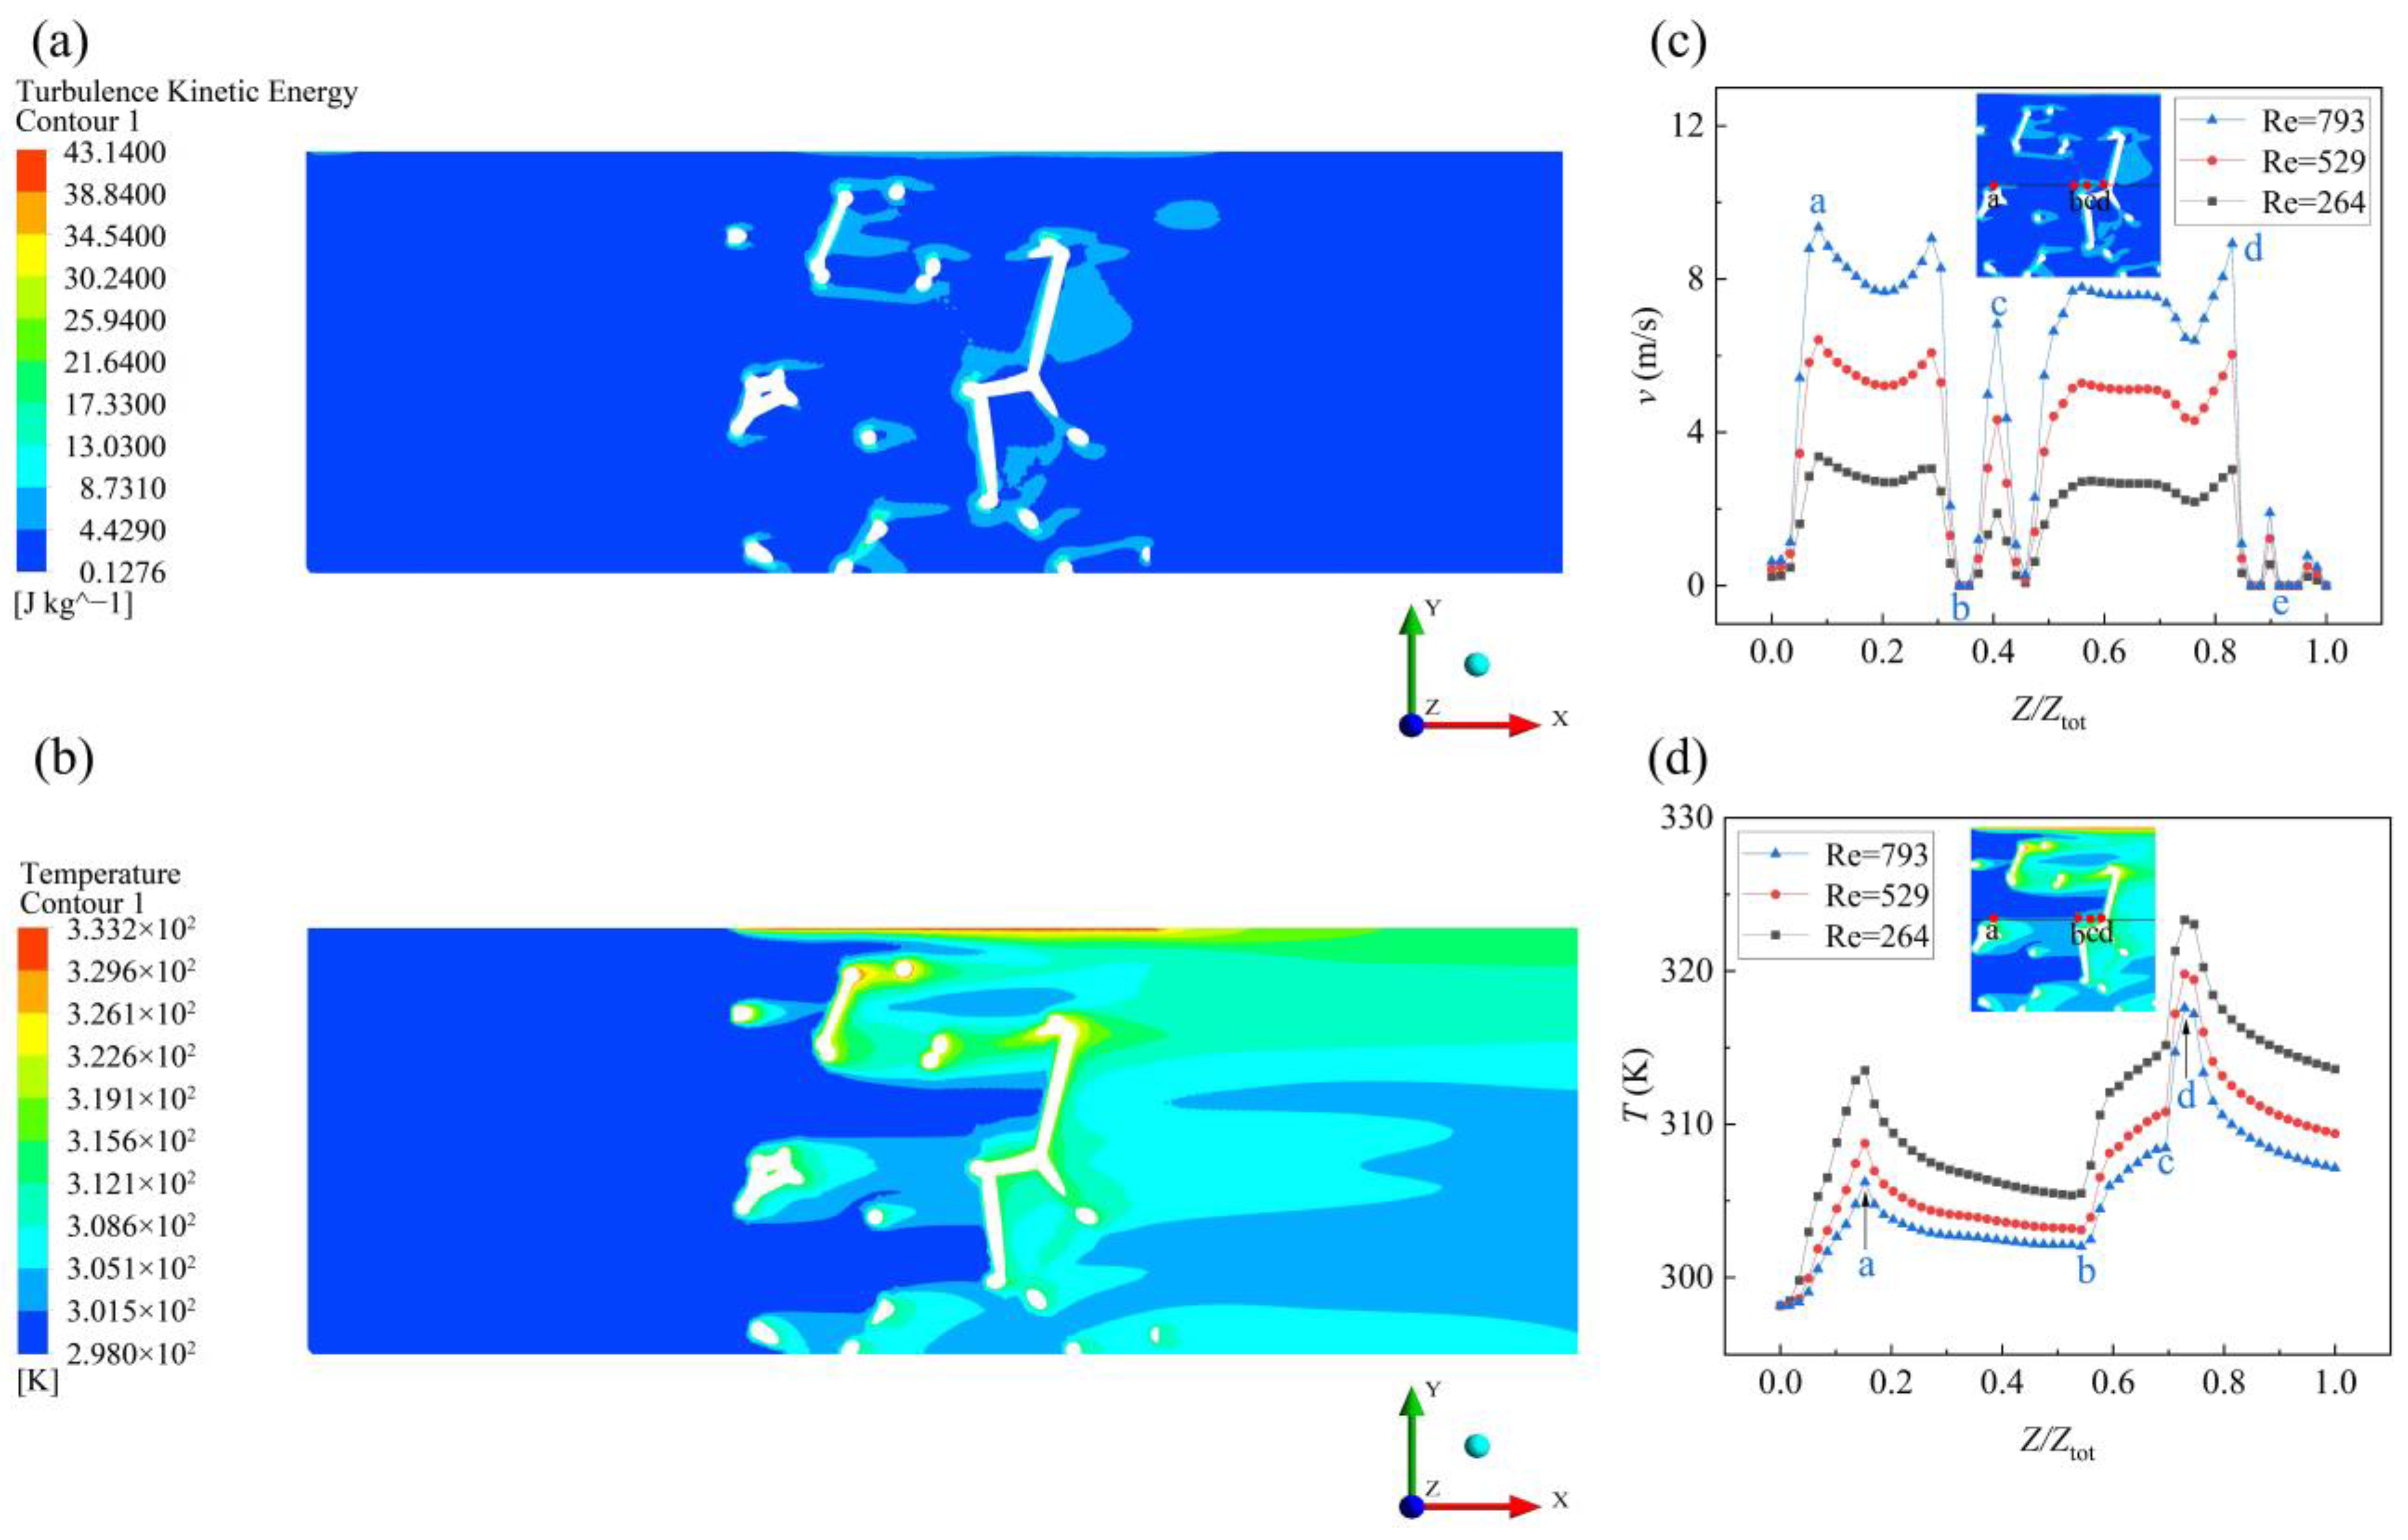
Figure 5a,b presents contour plots of the fluid turbulence kinetic energy (e) and temperature (T) for the foam longitudinal section at Re = 793, respectively. Figure 5a shows that the fluid had a high e near the skeleton, creating a significant turbulent disturbance in such areas. Figure 5b indicates that T increased after the fluid flowed through the foam due to heat transfer from the high-temperature skeleton. The fluid flow through the top skeletons obtained a relatively high T increase since those skeletons were close to the heat source. Meanwhile, T was higher at the back end of the skeleton than at the front end. This result was obtained because the impact of the fluid on the skeleton increased e at the back end (as shown in Figure 5a), which enhanced the turbulence effect and heat transfer between the fluid and skeletons. Figure 5c shows the variation in e along the central cutline of the foam longitudinal section at different Re values, and the inset gives the corresponding distribution with selected points for Re = 793. With increasing Re, e increased gradually, and its range of variation near the skeleton also increased. A decrease in e along the pore region emerged (from Points a to b), and considerable variation near the skeleton was observed (Points b, c, and d). Figure 5d reveals the variation in T along the central cutline of the foam longitudinal section at different Re values and the corresponding distribution at selected points for Re = 793. T rose sharply near the skeleton (Points a and d) and decreased slowly along the pore region (from Points a to b). This result was because e was high near the skeleton (Points a and d), creating strong turbulence in this region, but low in the pore region (as shown in Figure 5c). The random structure of the skeleton increased fluid turbulence and heat transfer performance. Therefore, under heat transfer from the top skeletons and the fluid–structure interaction, T increased along the flow direction. As illustrated in Figure 5d, with increasing Re, the fluid turbulence gradually increased. At high Re, however, insufficient contact between the fluid and the skeleton resulted in thickening of the temperature boundary layer at the skeleton wall, deterioration of the heat transfer performance, and a decrease in T.
Figure 6a,b shows contour plots of e and T for the foam cross-section at Re = 793, respectively. Figure 6a indicates that e increased near the skeleton and that the significant turbulence near the skeleton produced good heat transfer between the fluid and structure. Figure 6b shows that the combination of the high temperature of the skeleton and the turbulence effect leads to a remarkable heat transfer effect and a sharp rise in T near the skeleton. Figure 6c,d displays the variation in e and T, respectively, along the central cutline of the foam cross-section for different Re values and insets the corresponding distributions with selected points for Re = 973. From Figure 6c, it can be seen that e near the skeleton fluctuated considerably perpendicular to the fluid flow direction. T remained almost unchanged along the pore region (from Points a to b and Points d to e) and fluctuated considerably along the skeleton (from Points b to d), as shown in Figure 6d. This phenomenon can be explained by considering the results presented in Figure 6c, which demonstrate that e remained unchanged and was almost zero along the pore region (from Points a to b) and varied considerably along the skeleton (from Points d to e). Consequently, T was high in the vicinity of the skeleton and almost constant in the pore region. Furthermore, combining Figure 6c,d suggests that as Re increased, e increased, T decreased, and the heat transfer performance deteriorated, indicating that v affects heat transfer more significantly than turbulence.
3.2. Influence of the Microstructure on the Flow Characteristics
The microstructure and specific surface area Sv of the foam are closely related to the porosity ε and the pore density of the foam [50]. The effect of the foam ε and pore density on the fluid flow characteristics was analyzed below.
Figure 7 shows how the unit pressure drop ΔP/L and resistance coefficient f varied with v for three pore densities (20, 30, and 40 PPI) and different ε values (75~95%). ΔP/L increased monotonically with v, whereas f decreased monotonically with v. Figure 7a indicates that ΔP/L increased quadratically as v increased from 0.5 m/s (Re = 78) to 12 m/s (Re = 1860), satisfying the Darcy–Forchheimer equation (see Equation (1)). This quadratic relationship becomes more noticeable as ε decreases, as shown in Figure 7c,e. For a constant fluid velocity, ΔP/L decreased with increasing ε. The reason was that a higher ε leads to a wider flow channel for the fluid in the foam and a lower obstruction to fluid flow. The trends and correlations of f for different foams illustrated in Figure 7b,d,f also support the same conclusion.
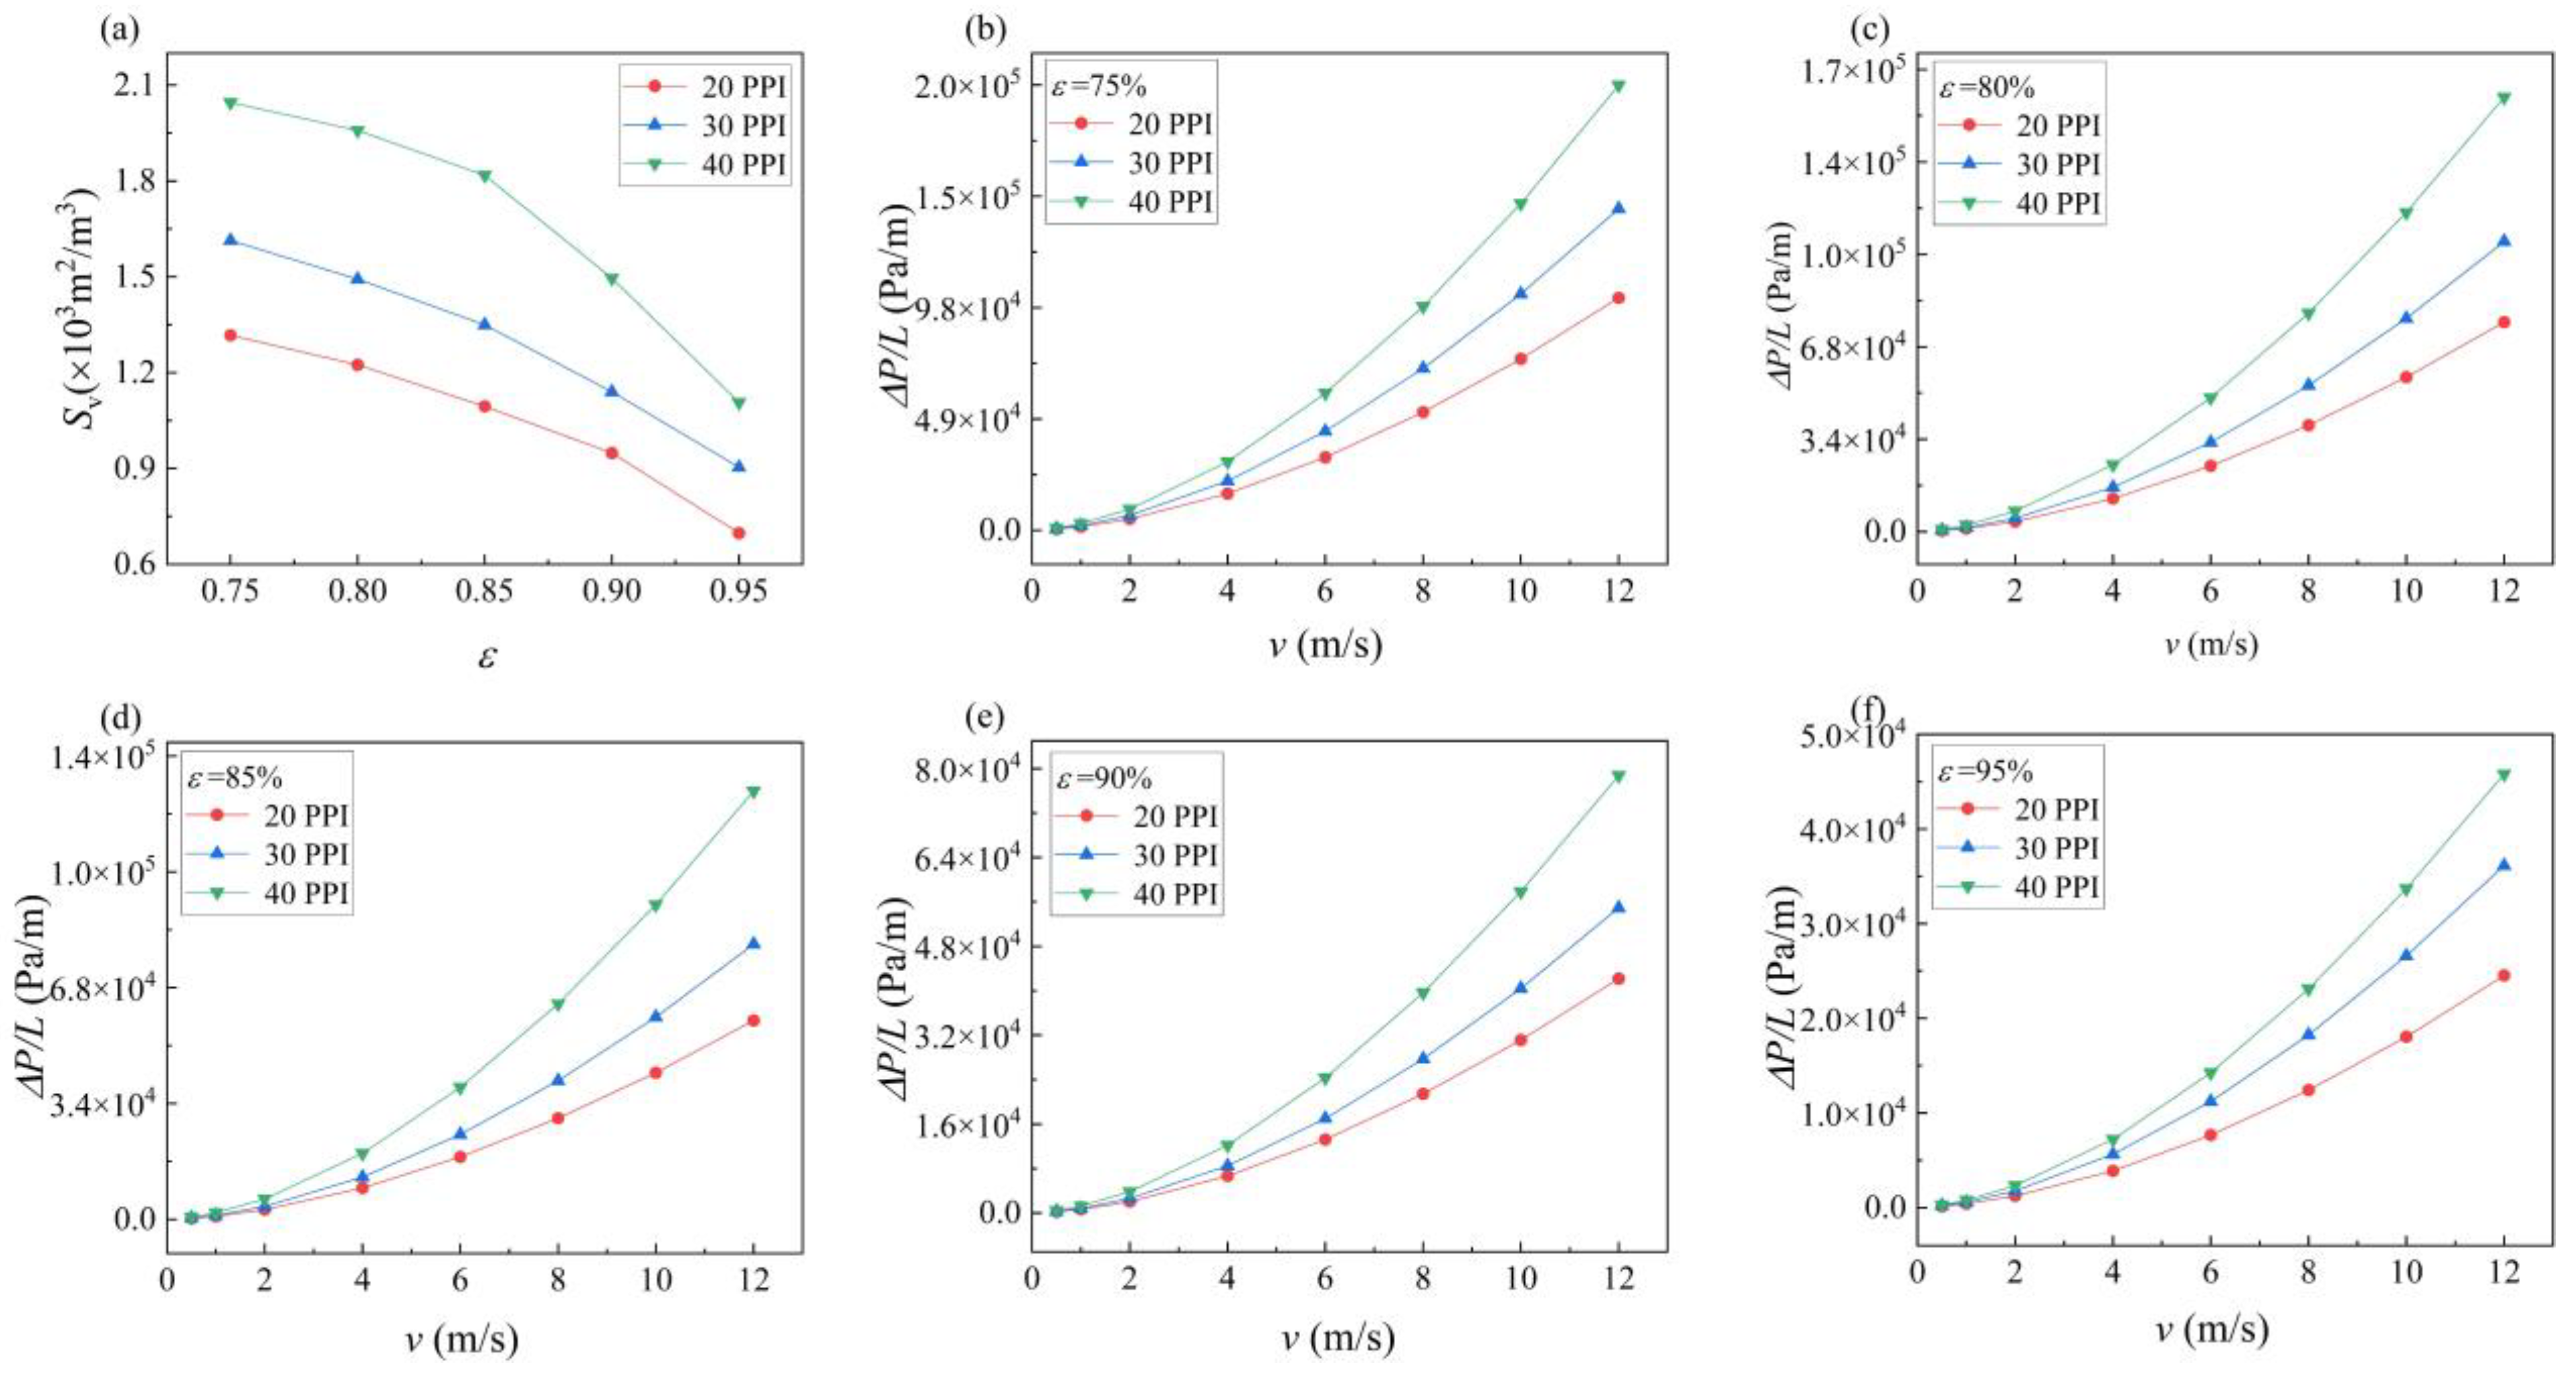
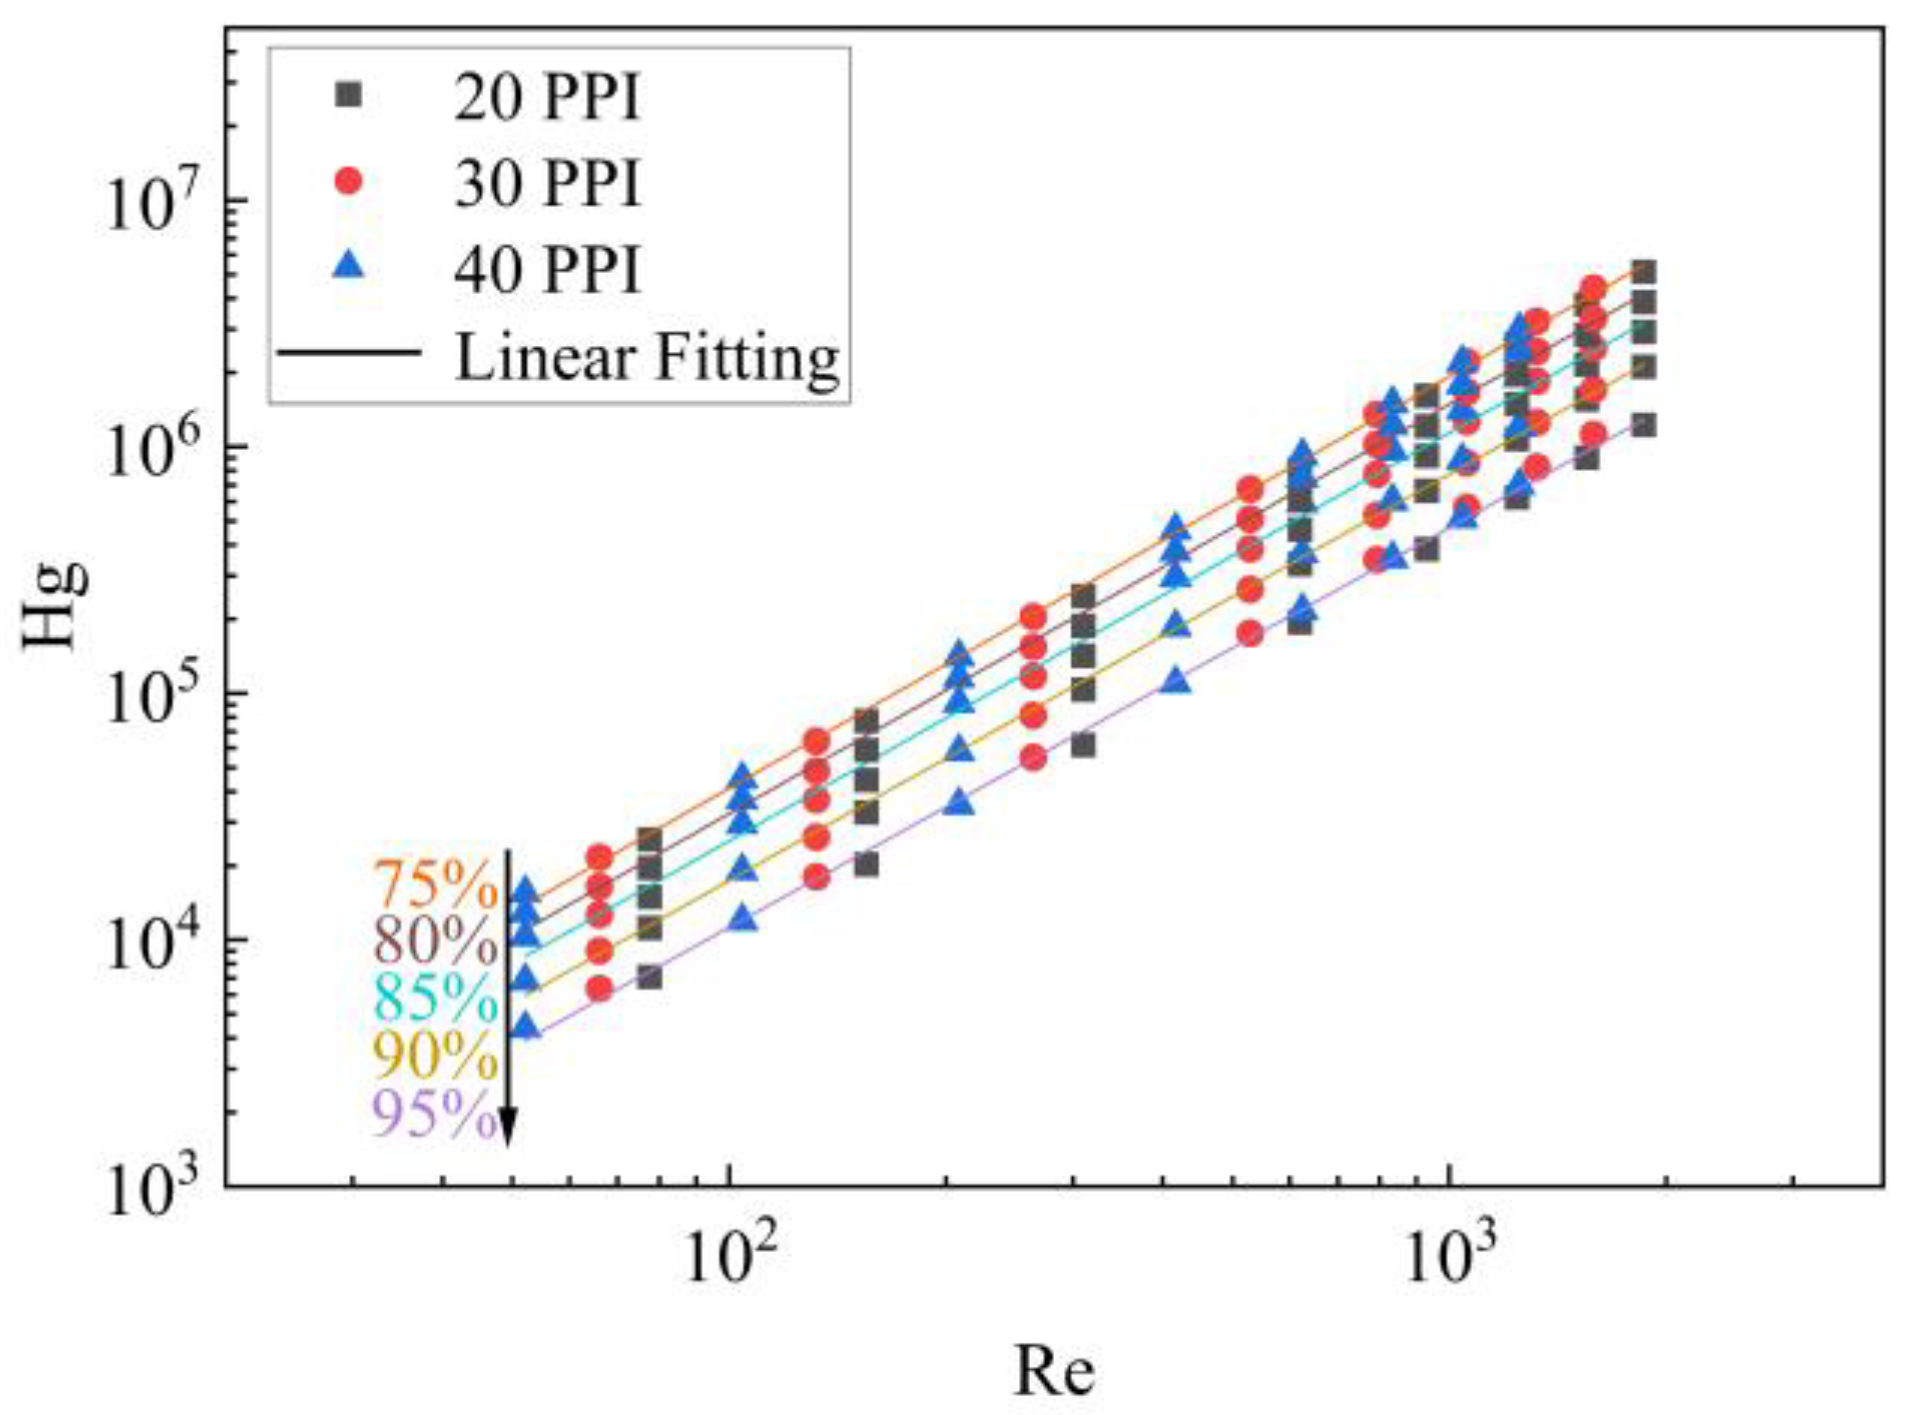
Figure 8a shows the relationship between Sv and ε for three pore densities (20, 30, and 40 PPI). At a constant ε, a larger pore density leads to a larger Sv. At a certain pore density, a larger ε leads to a lower Sv. Because of lower Sv, the friction between the fluid and the wall declined when the fluid flowed through the skeleton, which verifies the results demonstrated in Figure 7. An analysis was carried out on foams with different pore densities and a constant ε to determine the variation patterns of ΔP/L at different v values, as shown in Figure 8b–f. At a constant ε and v, a higher pore density leads to a higher ΔP/L. The reason was that a higher pore density leads to a higher number of pores per unit inch and smaller pores, which increase the obstruction of fluid flowing through the foam. This result can be substantiated by the results shown in Figure 8a, where at a constant ε, a rise in the pore density leads to a rise in Sv and hence the contact area between the fluid and skeleton wall, thereby increasing the flow friction and ΔP/L. Figure 9 explores the correlation between Hagen number (Hg) and Reynolds number (Re) for different pore densities at a constant porosity (ε). Through an examination of the fitted log–log plots, the figure elucidates the variations in Hg concerning Re and pore density, providing insights into the pressure drop characteristics within the foam under diverse flow conditions.
3.3. Effect of the Microstructure on Heat Transfer Characteristics
The numerical simulations in this study were carried out on a heating plate that was in direct contact with the foam skeleton. Thus, the capacity for heat transfer by conduction depends on the size of the contact area between the skeleton and heating plate, which varies due to the intricate structure of the foam skeleton. That is, convective heat transfer between the skeleton and fluid depends mainly on Sv. Figure 8a shows that Sv was related to ε and the pore density. Therefore, it is necessary to investigate the influence of the contact area of the heating plate and the foam ε and pore density on the heat transfer characteristics.
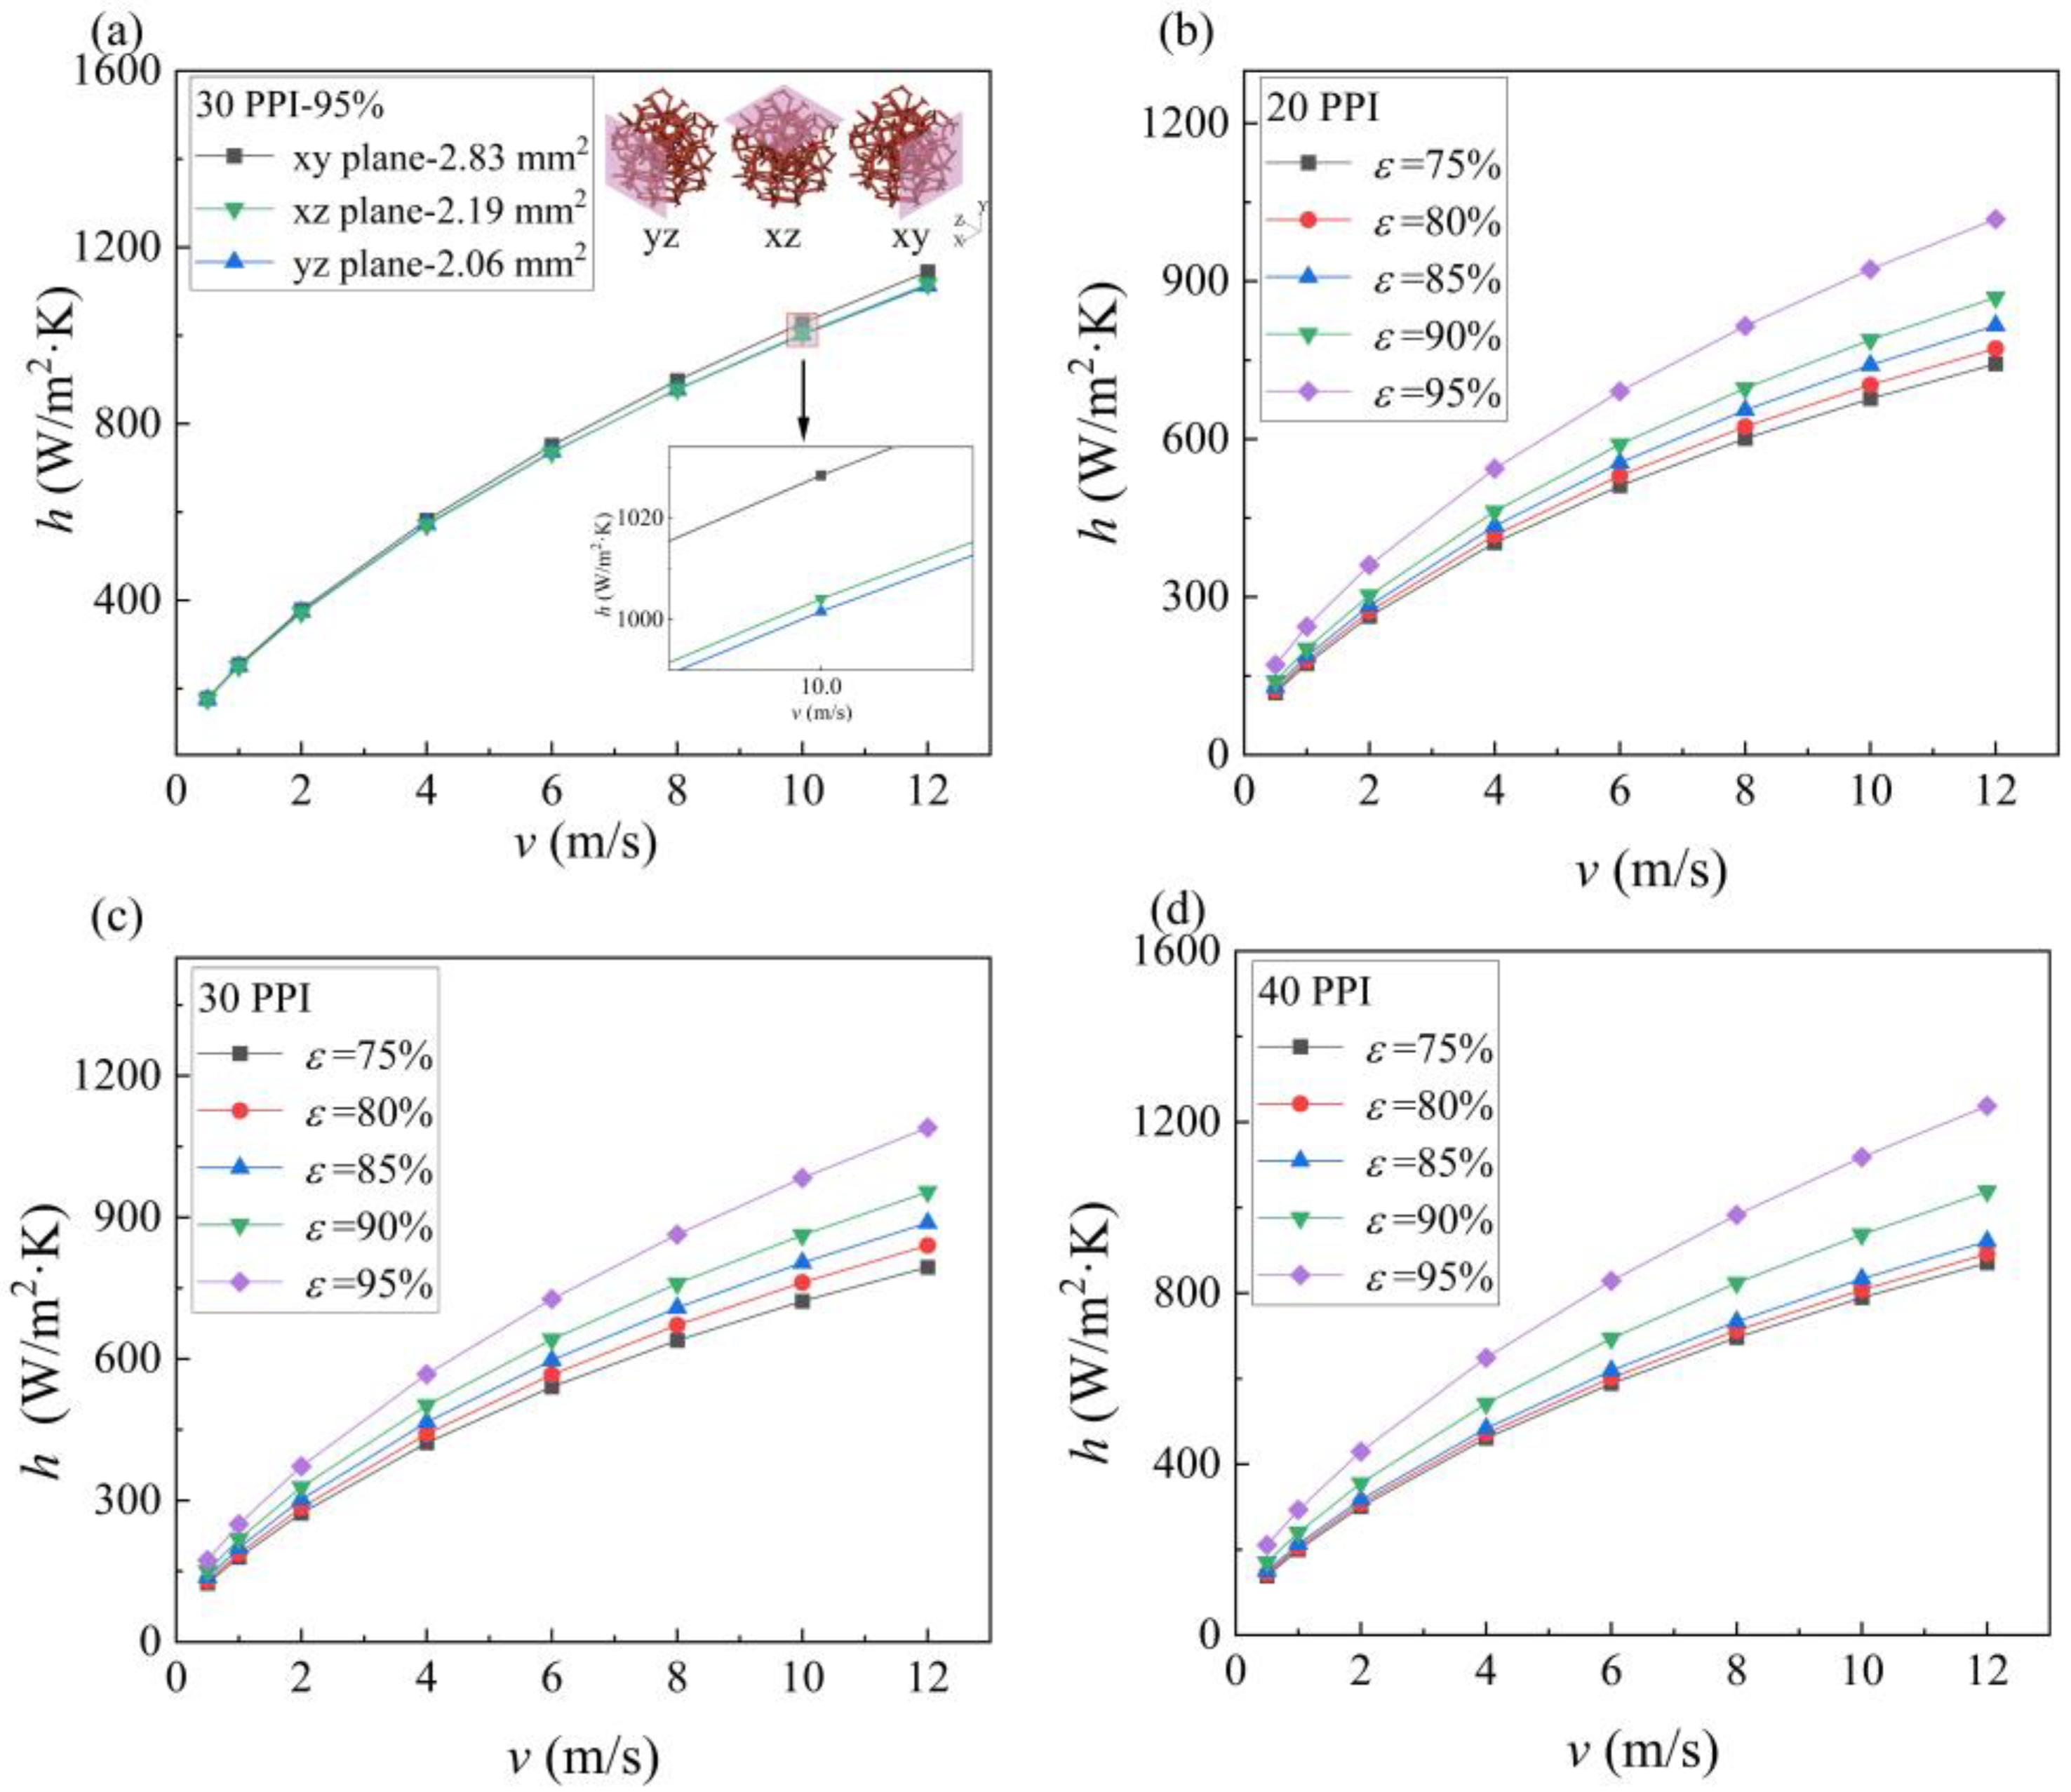
Figure 10a shows the relationship between the convective heat transfer coefficient h and v for different contact areas. Similar h values were produced for the three contact areas. The enlarged portion of the plot presented in the inset shows that the largest h was obtained for a contact area of 2.83 mm2. The hav values corresponding to contact areas of 2.19 mm2 and 2.06 mm2 were 637.97 W/(m2·K) and 637.68 W/(m2·K), respectively, indicating that similar heat transfer performance was obtained for similar contact areas. The maximum difference in the hav values corresponding to the three contact areas was only 2.2%. Therefore, the contact area between the investigated foam and heating plate had no significant effect on the heat transfer performance in this study. Figure 10b–d demonstrates the relationship between h and v for different ε values and a certain pore density. The h value increased as v increased, and this variation pattern was consistent for different ε values. For a constant pore density and v, h increased with increasing ε. This result was obtained because as ε increased, Sv decreased, and the flow channel for the fluid widened. Then, v was relatively reduced, realizing full contact between the fluid and the high-temperature skeleton and thereby enhancing the heat transfer performance. In addition, the h value gradually increased with increasing ε. Figure 10b shows that for a pore density of 20 PPI, the h values for ε values of 80%, 85%, 90%, and 95% were 16.45, 22.54, 31.40, and 89.15 W/(m2·K) higher than those of the foam with ε values of 75%, 80%, 85%, and 90%, respectively. As v increased, a high ε had a more significant limiting effect on v, which facilitated heat transfer. The same trend in h was observed for pore densities of 30 PPI and 40 PPI, as shown in Figure 10c,d, respectively. Figure 11 displays the relationship between h and v for different pore densities and a constant ε. It can be seen that h increased as v increased. A consistent trend in h with v was observed for different pore densities. At a constant ε and v, h increased as the pore density increased. Specifically, hav for pore densities of 20, 30, and 40 PPI was 436.16 W/(m2·K), 461.95 W/(m2·K), and 505.57 W/(m2·K), respectively. The reason behind this was that as the pore density increased, the number of pores per unit area increased, the pore size decreased, and Sv increased. The heat transfer area between the fluid and skeleton increased, thereby enhancing the heat transfer performance. The same trend for h was obtained for ε values of 80%, 85%, 90%, and 95% and was therefore not restated.
To explore the degree of influence of ε and the pore density on the heat transfer characteristics, the convective heat transfer coefficients obtained with different ε values and pore densities were investigated for a constant v. Figure 12a shows how h varied with ε and the pore density for v = 1 m/s. As ε increased from 75% to 90%, h generally increased slowly, and the increase in the pore density had a more significant effect on improving h. However, as ε increased from 90% to 95%, the pore density had a smaller effect on the heat transfer characteristics than ε, especially for 20 and 30 PPI. More specifically, as ε increased from 75% to 80%, h increased by 6.33 W/(m2·K), 7.82 W/(m2·K), and 6.01 W/(m2·K) for pore densities of 20 PPI, 30 PPI, and 40 PPI, respectively. When the pore density increased from 20 PPI to 30 PPI and from 30 PPI to 40 PPI, h increased by 6.67 W/(m2·K) and 20.03 W/(m2·K), respectively, for a foam with ε = 75% and by 8.16 W/(m2·K) and 18.23 W/(m2·K), respectively, for a foam with ε = 80%. The opposite trend was observed when ε increased from 90% to 95%. Therefore, within the ε range investigated in this study, for foams with low ε values (75% to 90%), the heat transfer performance should first be enhanced by increasing the pore density. Figure 12b–d illustrates the degree of influence of ε and the pore density on the heat transfer characteristics for v of 4, 8, and 12 m/s, respectively, which was consistent with the aforementioned pattern. Figure 13 presents fits to log–log plots of Nu versus Re for different ε values and pore densities. Nu increased linearly with Re for different ε values. At a constant pore density and Re, Nu increased with increasing ε. The reason was that as ε increased, the fluid flow channel widened, v was relatively reduced, and contact between the fluid and high-temperature skeleton increased, resulting in high heat transfer performance. The relationship between Nu and Re obtained in this study was consistent with results reported in the literature [51,52].
3.4. Overall Performance Analysis
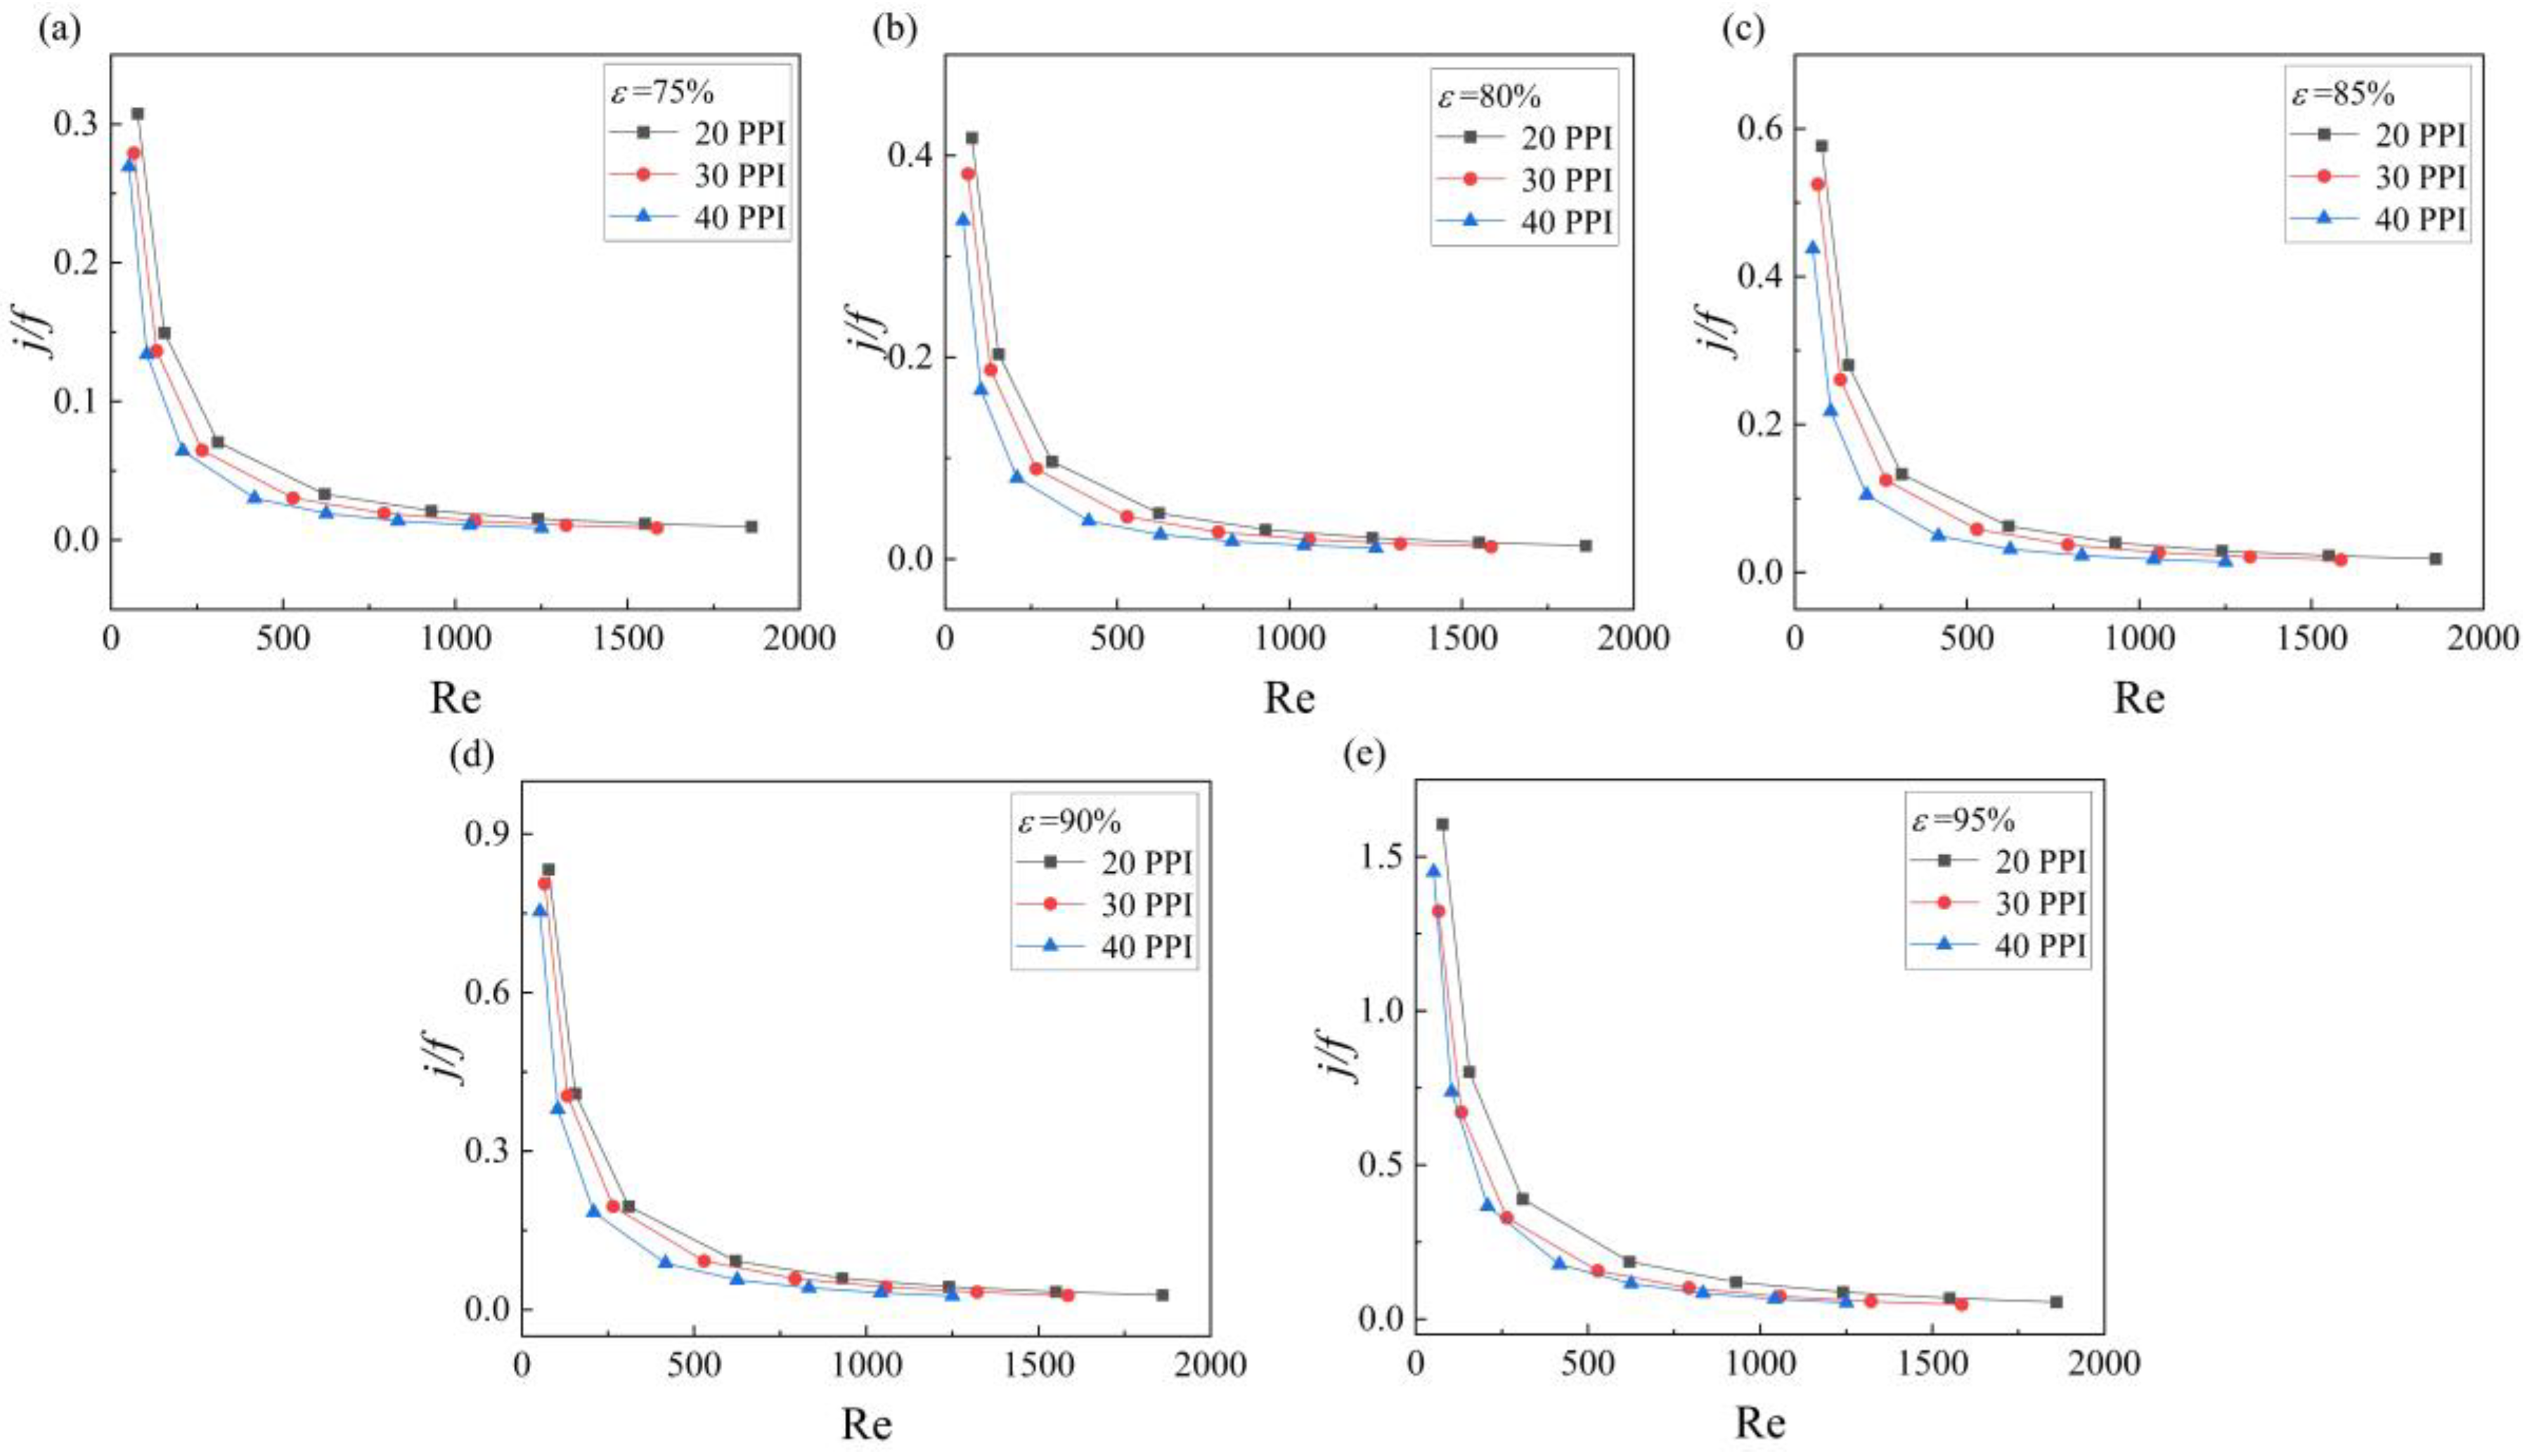
Kays and London proposed an overall factor (j-f) analysis method in which the j/f ratio was used as a measure of the overall enhancement of the heat transfer performance [53]. Figure 14 and Figure 15 show the relationship between the overall factor j/f and Re for the foam investigated in this study with different ε values and pore densities, respectively. At a constant ε and pore density, j/f decreased with increasing Re. The sharp decrease in j/f for Re < 500 reveals that with increasing v, both the heat transfer and flow resistance increase, but the increase in the flow resistance was more pronounced than that in the heat transfer. The rate of decrease for j/f plateaued at a low value for Re > 500.
Figure 14 shows that at a constant pore density, j/f increased with increasing ε. As analyzed above in Section 3.2, increasing ε reduced the friction between the fluid flowing through the skeleton and the wall and hence decreased the flow resistance. Additionally, as ε increased, the heat transfer performance was enhanced. Therefore, j/f increased. Figure 15 shows that at a constant ε, a higher pore density leads to a smaller j/f. When ε increased, the flow resistance increased. Meanwhile, the increase in pore density resulted in high heat transfer performance. However, the flow resistance increased more significantly than the heat transfer, causing a decrease in j/f. In summary, the overall foam performance was enhanced by increasing ε or decreasing the pore density (i.e., increasing the pore size). Therefore, the foam with a pore density of 20 PPI and ε = 95% exhibited the best overall performance for enhancing heat transfer.
4. Conclusions
In this study, based on 3D modeling of irregular open-cell metal foams constructed by Laguerre–Voronoi tessellations, numerical simulations were performed to investigate the fluid flow and coupled heat transfer characteristics of the foam. Simultaneously, the influence of the foam microstructure on flow resistance and structural heat transfer performance was explored. The main conclusions drawn from this study are given below.
(1) Both h and ΔP in the open-cell metal foam increased with increasing Re. The randomly distributed 3D reticulated structure inside the foam leads to fluctuations in h. The impact of the fluid on the skeleton resulted in a large P being exerted on the front end of the skeleton, and P declined along the flow direction. (2) Within the velocity range considered in this study, ΔP/L varied quadratically with v, satisfying the Darcy–Forchheimer equation. At a constant pore density, as ε increased, ΔP/L decreased, and h increased. At a constant ε, ΔP/L and h increased with increasing pore density. (3) For low ε values (75% to 90%) of the investigated model, the heat transfer performance of the foam can be improved by increasing the pore density. (4) For a constant pore density, as ε increased, Hg decreased and Nu increased. For fixed structural parameters of the foam, linear log-log plots of Hg and Nu versus Re were obtained. (5) The overall performance of the foam for enhancing heat transfer increased with increasing ε and decreased with increasing pore density. The highest overall convective heat transfer performance for the investigated model was obtained for a pore density of 20 PPI and ε = 95%. The results obtained in this work not only enhance our understanding of the flow and heat transfer characteristics of irregular open-cell metal foams but also provide a solid theoretical foundation for the development of new and improved compact heat exchangers and microelectronic cooling equipment.
Author Contributions
Conceptualization, Z.N.; methodology, Z.N., Q.X. and Y.W.; Fluent 2021 R1, Q.X. and Y.W.; validation, Q.X. and Y.W.; formal analysis, Z.N.; investigation, Q.X. and Y.W.; resources, Z.N.; data curation, Y.W.; writing—original draft preparation, Z.N., Q.X. and Y.W.; writing—review and editing, Z.N., Q.X., Y.W. and Y.C.; visualization, Q.X. and Y.W.; supervision, Z.N.; project administration, Y.C.; funding acquisition, Z.N. All authors have read and agreed to the published version of the manuscript.
Funding
This research was funded by the Natural Science Foundation of Jiangsu Province, China (Grant No. BK20200686) and the National Natural Science Foundation of China (Grant No. 52206257).
Data Availability Statement
The data presented in this study are available on request from the corresponding author.
Conflicts of Interest
The authors declare no conflicts of interest.
Nomenclature
| A | Area, m2 |
| Cp | Specific heat capacity at constant pressure for the fluid, J/(kg·K) |
| d | Average pore diameter, m |
| e | Fluid turbulence kinetic energy |
| f | Resistance coefficient |
| Hg | Hagen number |
| h | Convective heat transfer coefficient, W/(m 2 ·K) |
| j | Heat transfer factor |
| k | Thermal conductivity, W/(m·K) |
| L | Flow path length, m |
| Fluid mass flow rate, kg/s | |
| Nu | Nusselt number |
| P | Fluid pressure, Pa |
| ΔP | Pressure drop, Pa |
| Pr | Prandtl number |
| q | Average heat flux, W/m2 |
| Re | Reynolds number |
| Sv | Specific surface area, m2/m3 |
| T | Fluid temperature, K |
| Ts | Temperature of the foam skeleton, K |
| Average temperature, K | |
| t | Time, s |
| v | Fluid velocity, m/s |
| Greek letters | |
| ε | Porosity |
| η | Kinematic viscosity, m2/s |
| μ | Dynamic viscosity, Pa·s |
| ρ | Fluid density, kg/m3 |
| Subscripts | |
| av | Average |
| cs | Flow channel cross-section |
| eff | Effective |
| f | Fluid |
| in | Inlet |
| out | Outlet |
| p | Pressure |
| s | Metal foam skeleton |
| ts | Total surface area of the metal foam |
References
- Chiappini, D. Numerical simulation of natural convection in open-cells metal foams. Int. J. Heat Mass Transf. 2018, 117, 527–537. [Google Scholar] [CrossRef]
- Manetti, L.L.; de Oliveira, I.L.; Cardoso, E.M. Thermal efficiency of open-cell metal foams: Impact of foam thickness by comparing correlations and numerical modeling. Appl. Therm. Eng. 2022, 207, 118219. [Google Scholar] [CrossRef]
- Qureshi, Z.A.; Elnajjar, E.; Al-Ketan, O.; Al-Rub, R.A.; Al-Omari, S.B. Heat transfer performance of a finned metal foam-phase change material (FMF-PCM) system incorporating triply periodic minimal surfaces (TPMS). Int. J. Heat Mass Transf. 2021, 170, 121001. [Google Scholar] [CrossRef]
- Bianco, N.; Iasiello, M.; Mauro, G.M.; Pagano, L. Multi-objective optimization of finned metal foam heat sinks: Tradeoff between heat transfer and pressure drop. Appl. Therm. Eng. 2021, 182, 116058. [Google Scholar] [CrossRef]
- Yang, X.; Wei, P.; Wang, X.; He, Y.L. Gradient design of pore parameters on the melting process in a thermal energy storage unit filled with open-cell metal foam. Appl. Energy 2020, 268, 115019. [Google Scholar] [CrossRef]
- Yang, L.; Li, C.; Pei, J.; Wang, X.; Liu, N.; Xie, Y.; Cui, G.; Liu, D. Enhanced clathrate hydrate phase change with open-cell copper foam for efficient methane storage. Chem. Eng. J. 2022, 440, 135912. [Google Scholar] [CrossRef]
- Rehman, T.; Ali, H.M. Experimental study on the thermal behavior of RT-35HC paraffin within copper and Iron-Nickel open cell foams: Energy storage for thermal management of electronics. Int. J. Heat Mass Transf. 2020, 146, 118852. [Google Scholar] [CrossRef]
- Golkarfard, V.; King, A.J.C.; Abishek, S.; Mead-Hunter, R.; Kasper, G.; Mullins, B.J. Optimisation of wet pressure drop in nonwoven fibrous, knitted, and open-cell foam filters. Sep. Purif. Technol. 2019, 213, 45–55. [Google Scholar] [CrossRef]
- Nie, Z.; Lin, Y.; Tong, Q. Numerical simulations of two-phase flow in open-cell metal foams with application to aero-engine separators. Int. J. Heat Mass Transf. 2018, 127, 917–932. [Google Scholar] [CrossRef]
- de Carvalho, T.P.; Hargreaves, D.M.; Morvan, H.P.; Klingsporn, M. Modelling of Droplet Capture in an Open-Cell Metal Foam at the Pore and Macroscopic Scales. Transp. Porous Media 2023, 148, 1–25. [Google Scholar] [CrossRef]
- Wang, Z.; Zhang, Z.; Jia, L.; Yang, L. Paraffin and paraffin/aluminum foam composite phase change material heat storage experimental study based on thermal management of Li-ion battery. Appl. Therm. Eng. 2015, 78, 428–436. [Google Scholar] [CrossRef]
- Bamorovat Abadi, G.; Moon, C.; Kim, K.C. Experimental study on single-phase heat transfer and pressure drop of refrigerants in a plate heat exchanger with metal-foam-filled channels. Appl. Therm. Eng. 2016, 102, 423–431. [Google Scholar] [CrossRef]
- Bianchi, E.; Heidig, T.; Visconti, C.G.; Groppi, G.; Freund, H.; Tronconi, E. An appraisal of the heat transfer properties of metallic open-cell foams for strongly exo-/endo-thermic catalytic processes in tubular reactors. Chem. Eng. J. 2012, 198–199, 512–528. [Google Scholar] [CrossRef]
- Della Torre, A.; Lucci, F.; Montenegro, G.; Onorati, A.; Dimopoulos Eggenschwiler, P.; Tronconi, E.; Groppi, G. CFD modeling of catalytic reactions in open-cell foam substrates. Comput. Chem. Eng. 2016, 92, 55–63. [Google Scholar] [CrossRef]
- Zhong, Z.; Meng, L.; Li, X.; Zhang, G.; Xu, Y.; Deng, J. Enhanced heat transfer performance of optimized micro-channel heat sink via forced convection in cooling metal foam attached on copper plate. J. Energy Storage 2020, 30, 101501. [Google Scholar] [CrossRef]
- Panse, S.S.; Singh, P.; Ekkad, S.V. Air-Based Cooling in High Porosity, Aluminum Foams for Compact Electronics Cooling. In Proceedings of the 2019 18th IEEE Intersociety Conference on Thermal and Thermomechanical Phenomena in Electronic Systems (ITherm), Las Vegas, NV, USA, 28–31 May 2019; pp. 376–383. [Google Scholar]
- Albusairi, B.; Hsu, J.T. Application of shape factor to determine the permeability of perfusive particles. Chem. Eng. J. 2002, 89, 173–183. [Google Scholar] [CrossRef]
- Teng, H.; Zhao, T.S. An extension of Darcy’s law to non-Stokes flow in porous media. Chem. Eng. Sci. 2000, 55, 2727–2735. [Google Scholar] [CrossRef]
- Inayat, A.; Klumpp, M.; Lämmermann, M.; Freund, H.; Schwieger, W. Development of a new pressure drop correlation for open-cell foams based completely on theoretical grounds: Taking into account strut shape and geometric tortuosity. Chem. Eng. J. 2016, 287, 704–719. [Google Scholar] [CrossRef]
- Xu, H.J.; Qu, Z.G.; Tao, W.Q. Analytical solution of forced convective heat transfer in tubes partially filled with metallic foam using the two-equation model. Int. J. Heat Mass Transf. 2011, 54, 3846–3855. [Google Scholar] [CrossRef]
- Boomsma, K.; Poulikakos, D.; Ventikos, Y. Simulations of flow through open cell metal foams using an idealized periodic cell structure. Int. J. Heat Fluid Flow 2003, 24, 825–834. [Google Scholar] [CrossRef]
- Cunsolo, S.; Iasiello, M.; Oliviero, M.; Bianco, N.; Chiu, W.K.S.; Naso, V. Lord Kelvin and Weaire–Phelan Foam Models: Heat Transfer and Pressure Drop. J. Heat Transf. 2015, 138, 022601. [Google Scholar] [CrossRef]
- Buonomo, B.; Pasqua, A.d.; Manca, O.; Sekrani, G.; Poncet, S. Numerical Analysis on Pressure Drop and Heat Transfer in Nanofluids at Pore Length Scale in Open Metal Porous Structures with Kelvin Cells. Heat Transf. Eng. 2021, 42, 1614–1624. [Google Scholar] [CrossRef]
- Wang, H.; Guo, L. Volumetric Convective Heat Transfer Coefficient Model for Metal Foams. Heat Transf. Eng. 2019, 40, 464–475. [Google Scholar] [CrossRef]
- Kim, S.Y.; Paek, J.W.; Kang, B.H. Flow and Heat Transfer Correlations for Porous Fin in a Plate-Fin Heat Exchanger. J. Heat Transf. 2000, 122, 572–578. [Google Scholar] [CrossRef]
- Nie, Z.; Lin, Y.; Tong, Q. Numerical investigation of pressure drop and heat transfer through open cell foams with 3D Laguerre-Voronoi model. Int. J. Heat Mass Transf. 2017, 113, 819–839. [Google Scholar] [CrossRef]
- Baril, E.; Medraj, M.; Loya, V.; Lefebvre, L.P. The Effect of Microstructure on the Permeability of Metallic Foams. J. Mater. Sci. 2007, 42, 4372–4383. [Google Scholar] [CrossRef]
- Paek, J.W.; Kang, B.H.; Kim, S.Y.; Hyun, J.M. Effective Thermal Conductivity and Permeability of Aluminum Foam Materials. Int. J. Thermophys. 2000, 21, 453–464. [Google Scholar] [CrossRef]
- Mancin, S.; Zilio, C.; Cavallini, A.; Rossetto, L. Pressure drop during air flow in aluminum foams. Int. J. Heat Mass Transf. 2010, 53, 3121–3130. [Google Scholar] [CrossRef]
- Dukhan, N. Correlations for the pressure drop for flow through metal foam. Exp. Fluids 2006, 41, 665–672. [Google Scholar] [CrossRef]
- Elayiaraja, P.; Harish, S.; Wilson, L.; Bensely, A.; Lal, D.M. Experimental Investigation on Pressure Drop and Heat Transfer Characteristics of Copper Metal Foam Heat Sink. Exp. Heat Transf. 2010, 23, 185–195. [Google Scholar] [CrossRef]
- Salas, K.I.; Waas, A.M. Convective Heat Transfer in Open Cell Metal Foams. J. Heat Transf. 2006, 129, 1217–1229. [Google Scholar] [CrossRef]
- Kopanidis, A.; Theodorakakos, A.; Gavaises, E.; Bouris, D. 3D numerical simulation of flow and conjugate heat transfer through a pore scale model of high porosity open cell metal foam. Int. J. Heat Mass Transf. 2010, 53, 2539–2550. [Google Scholar] [CrossRef]
- Laschet, G.; Sauerhering, J.; Reutter, O.; Fend, T.; Scheele, J. Effective permeability and thermal conductivity of open-cell metallic foams via homogenization on a microstructure model. Comput. Mater. Sci. 2009, 45, 597–603. [Google Scholar] [CrossRef]
- Ranut, P.; Nobile, E.; Mancini, L. High resolution microtomography-based CFD simulation of flow and heat transfer in aluminum metal foams. Appl. Therm. Eng. 2014, 69, 230–240. [Google Scholar] [CrossRef]
- Yu, Q.; Straatman, A.G.; Thompson, B.E. Carbon-foam finned tubes in air–water heat exchangers. Appl. Therm. Eng. 2006, 26, 131–143. [Google Scholar] [CrossRef]
- Poureslami, P.; Siavashi, M.; Moghimi, H.; Hosseini, M. Pore-scale convection-conduction heat transfer and fluid flow in open-cell metal foams: A three-dimensional multiple-relaxation time lattice Boltzmann (MRT-LBM) solution. Int. Commun. Heat Mass Transf. 2021, 126, 105465. [Google Scholar] [CrossRef]
- Paknahad, R.; Siavashi, M.; Hosseini, M. Pore-scale fluid flow and conjugate heat transfer study in high porosity Voronoi metal foams using multi-relaxation-time regularized lattice Boltzmann (MRT-RLB) method. Int. Commun. Heat Mass Transf. 2023, 141, 106607. [Google Scholar] [CrossRef]
- Alhusseny, A.; Turan, A.; Nasser, A. Developing convective flow in a square channel partially filled with a high porosity metal foam and rotating in a parallel-mode. Int. J. Heat Mass Transf. 2015, 90, 578–590. [Google Scholar] [CrossRef]
- Du, Y.P.; Qu, Z.G.; Zhao, C.Y.; Tao, W.Q. Numerical study of conjugated heat transfer in metal foam filled double-pipe. Int. J. Heat Mass Transf. 2010, 53, 4899–4907. [Google Scholar] [CrossRef]
- Sinn, C.; Pesch, G.R.; Thöming, J.; Kiewidt, L. Coupled conjugate heat transfer and heat production in open-cell ceramic foams investigated using CFD. Int. J. Heat Mass Transf. 2019, 139, 600–612. [Google Scholar] [CrossRef]
- Li, Z.; Xia, X.; Li, X.; Sun, C. Discrete vs. continuum-scale simulation of coupled radiation and convection inside rectangular channel filled with metal foam. Int. J. Therm. Sci. 2018, 132, 219–233. [Google Scholar] [CrossRef]
- Wang, H.; Guo, L. Experimental investigation on pressure drop and heat transfer in metal foam filled tubes under convective boundary condition. Chem. Eng. Sci. 2016, 155, 438–448. [Google Scholar] [CrossRef]
- Nie, Z.; Lin, Y.; Tong, Q. Modeling structures of open cell foams. Comput. Mater. Sci. 2017, 131, 160–169. [Google Scholar] [CrossRef]
- Sun, M.; Hu, C.; Zha, L.; Xie, Z.; Yang, L.; Tang, D.; Song, Y.; Zhao, J. Pore-scale simulation of forced convection heat transfer under turbulent conditions in open-cell metal foam. Chem. Eng. J. 2020, 389, 124427. [Google Scholar] [CrossRef]
- Corsini, R.; Fregni, A.; Spinolo, M.; Stalio, E. On the turbulent flow past a realistic open-cell metal foam. J. Fluid Mech. 2021, 920, A9. [Google Scholar] [CrossRef]
- Della Torre, A.; Montenegro, G.; Tabor, G.R.; Wears, M.L. CFD characterization of flow regimes inside open cell foam substrates. Int. J. Heat Fluid Flow 2014, 50, 72–82. [Google Scholar] [CrossRef]
- Dybbs, A.; Edwards, R.V. A New Look at Porous Media Fluid Mechanics—Darcy to Turbulent. In Fundamentals of Transport Phenomena in Porous Media; Bear, J., Corapcioglu, M.Y., Eds.; Springer: Dordrecht, The Netherlands, 1984; pp. 199–256. [Google Scholar]
- Diani, A.; Bodla, K.K.; Rossetto, L.; Garimella, S.V. Numerical investigation of pressure drop and heat transfer through reconstructed metal foams and comparison against experiments. Int. J. Heat Mass Transf. 2015, 88, 508–515. [Google Scholar] [CrossRef]
- Dietrich, B. Heat transfer coefficients for solid ceramic sponges—Experimental results and correlation. Int. J. Heat Mass Transf. 2013, 61, 627–637. [Google Scholar] [CrossRef]
- Albanakis, C.; Missirlis, D.; Michailidis, N.; Yakinthos, K.; Goulas, A.; Omar, H.; Tsipas, D.; Granier, B. Experimental analysis of the pressure drop and heat transfer through metal foams used as volumetric receivers under concentrated solar radiation. Exp. Therm. Fluid Sci. 2009, 33, 246–252. [Google Scholar] [CrossRef]
- Ghosh, I. Heat transfer correlation for high-porosity open-cell foam. Int. J. Heat Mass Transf. 2009, 52, 1488–1494. [Google Scholar] [CrossRef]
- Kays, W.M.; London, A.L. Compact Heat Exchangers, 3rd ed.; McGraw-Hill: New York, NY, USA, 1984. [Google Scholar]
Figure 1.
Computational domain used for numerical simulations.

Figure 2.
Unit pressure drop vs. Reynolds number (a); convective heat transfer coefficient vs. Reynolds number (b); a total of 34 cross-sections selected at equal intervals along the x-axis (c); the average temperatures of the fluid and skeleton along the flow direction X/Xtot (d); the average convective heat transfer coefficient hav along the flow direction X/Xtot (e); and the positions of a longitudinal section and a cross-section in the foam used for analysis (f).

Figure 3.
Contour of the temperature (a) and the average temperature . (b) of the skeleton along Y/Ytot. The average pressure Pav along the flow direction X/Xtot (c). The fluid velocity along the central cutline for different Reynolds numbers (d) and the velocity vector distribution for Re = 793 (e) over the longitudinal section.

Figure 4.
Velocity vector distribution over the foam cross-section (a), distribution of the fluid pressure over the foam longitudinal section (b), and distribution of the fluid pressure over the foam cross-section (c) for Re = 793. The fluid velocity along the central cutline over the foam cross-section (d), the fluid pressure along the central cutline over the foam longitudinal section (e), and the fluid pressure along the central cutline over the foam cross-section (f) for different Reynolds numbers.

Figure 5.
Distribution of the fluid turbulence kinetic energy (a) and the fluid temperature (b) over the foam longitudinal section for Re = 793. The fluid turbulence kinetic energy (c) and the fluid temperature (d) along the central cutline of the foam longitudinal section for different Reynolds numbers.

Figure 6.
Distribution of the fluid turbulence kinetic energy (a) and the fluid temperature (b) over the foam cross-section for Re = 793. The fluid turbulence kinetic energy (c) and the fluid temperature (d) along the central cutline of the foam cross-section for different Reynolds numbers.
Figure 6.
Distribution of the fluid turbulence kinetic energy (a) and the fluid temperature (b) over the foam cross-section for Re = 793. The fluid turbulence kinetic energy (c) and the fluid temperature (d) along the central cutline of the foam cross-section for different Reynolds numbers.

Figure 7.
Variation in the unit pressure drop (a,c,e). Flow resistance coefficient (b,d,f) with increasing fluid velocity for different porosities (20, 30, and 40 PPI).
Figure 7.
Variation in the unit pressure drop (a,c,e). Flow resistance coefficient (b,d,f) with increasing fluid velocity for different porosities (20, 30, and 40 PPI).

Figure 8.
Foam-specific surface areas for three pore densities (20, 30, and 40 PPI) with increasing porosity (a). The unit pressure drop of foams for three pore densities (20, 30, and 40 PPI) with increasing fluid velocity for different porosities: 75% (b), 80% (c), 85% (d), 90% (e), and 95% (f).
Figure 8.
Foam-specific surface areas for three pore densities (20, 30, and 40 PPI) with increasing porosity (a). The unit pressure drop of foams for three pore densities (20, 30, and 40 PPI) with increasing fluid velocity for different porosities: 75% (b), 80% (c), 85% (d), 90% (e), and 95% (f).

Figure 9.
Variation in the Hagen number with increasing Reynolds number for different porosities and pore densities.
Figure 9.
Variation in the Hagen number with increasing Reynolds number for different porosities and pore densities.

Figure 10.
Relationship between the convective heat transfer coefficient and the fluid velocity for different contact areas (a). The convective heat transfer coefficient of foams (75~95%) with increasing fluid velocity for different pore densities: 20 PPI (b), 30 PPI (c), and 40 PPI (d).
Figure 10.
Relationship between the convective heat transfer coefficient and the fluid velocity for different contact areas (a). The convective heat transfer coefficient of foams (75~95%) with increasing fluid velocity for different pore densities: 20 PPI (b), 30 PPI (c), and 40 PPI (d).

Figure 11.
Variation in the convective heat transfer coefficient of foams (20, 30, and 40 PPI) with increasing fluid velocity for different porosities: 75% (a), 80% (b), 85% (c), 90% (d), and 95% (e).
Figure 11.
Variation in the convective heat transfer coefficient of foams (20, 30, and 40 PPI) with increasing fluid velocity for different porosities: 75% (a), 80% (b), 85% (c), 90% (d), and 95% (e).

Figure 12.
Comparison of the effect of the pore density and porosity on the convective heat transfer coefficient at a constant fluid velocity: 1 m/s (a), 4 m/s (b), 8 m/s (c), and 12 m/s (d).
Figure 12.
Comparison of the effect of the pore density and porosity on the convective heat transfer coefficient at a constant fluid velocity: 1 m/s (a), 4 m/s (b), 8 m/s (c), and 12 m/s (d).

Figure 13.
Variation in the Nusselt number with increasing Reynolds number for different porosities and pore densities.
Figure 13.
Variation in the Nusselt number with increasing Reynolds number for different porosities and pore densities.

Figure 14.
Overall factor of foams (75~95%) with increasing Reynolds number for different pore densities: 20 PPI (a), 30 PPI (b), and 40 PPI (c).
Figure 14.
Overall factor of foams (75~95%) with increasing Reynolds number for different pore densities: 20 PPI (a), 30 PPI (b), and 40 PPI (c).

Figure 15.
Overall factor with increasing Reynolds number for different porosities: 75% (a), 80% (b), 85% (c), 90% (d), and 95% (e).
Figure 15.
Overall factor with increasing Reynolds number for different porosities: 75% (a), 80% (b), 85% (c), 90% (d), and 95% (e).


Table 1.
Dimensions of the computational domain used to numerically simulate foams with different pore densities.
Table 1.
Dimensions of the computational domain used to numerically simulate foams with different pore densities.
| Pore Density (PPI) | Length (Front-End Area + Open-Cell Foam Area + Rear-End Area) × Width × Height (mm) |
|---|---|
| 20 | (8.5 + 8.5 + 8.5) × 8.5 × 8.5 |
| 30 | (6.5 + 6.5 + 6.5) × 6.5 × 6.5 |
| 40 | (5.5 + 5.5 + 5.5) × 5.5 × 5.5 |
Disclaimer/Publisher’s Note: The statements, opinions and data contained in all publications are solely those of the individual author(s) and contributor(s) and not of MDPI and/or the editor(s). MDPI and/or the editor(s) disclaim responsibility for any injury to people or property resulting from any ideas, methods, instructions or products referred to in the content. |
© 2024 by the authors. Licensee MDPI, Basel, Switzerland. This article is an open access article distributed under the terms and conditions of the Creative Commons Attribution (CC BY) license (https://creativecommons.org/licenses/by/4.0/).
Share and Cite
MDPI and ACS Style
Xu, Q.; Wu, Y.; Chen, Y.; Nie, Z. Unlocking the Thermal Efficiency of Irregular Open-Cell Metal Foams: A Computational Exploration of Flow Dynamics and Heat Transfer Phenomena. Energies 2024, 17, 1305. https://doi.org/10.3390/en17061305
AMA Style
Xu Q, Wu Y, Chen Y, Nie Z. Unlocking the Thermal Efficiency of Irregular Open-Cell Metal Foams: A Computational Exploration of Flow Dynamics and Heat Transfer Phenomena. Energies. 2024; 17(6):1305. https://doi.org/10.3390/en17061305
Chicago/Turabian StyleXu, Qian, Yunbing Wu, Ye Chen, and Zhengwei Nie. 2024. "Unlocking the Thermal Efficiency of Irregular Open-Cell Metal Foams: A Computational Exploration of Flow Dynamics and Heat Transfer Phenomena" Energies 17, no. 6: 1305. https://doi.org/10.3390/en17061305
Note that from the first issue of 2016, this journal uses article numbers instead of page numbers. See further details here.