

Assessing the Energy Performance and Retrofit Potential of the 1980–1990s’ Residential Building Stock in China’s Jiangsu Province: A Simulation-Based Study


Abstract
:1. Introduction
2. Materials and Methods
2.1. Bottom–Up Energy Modelling and Simulation
2.2. Building Carbon Emission Calculation Method
2.3. Retrofit Measure Selection
3. Results
3.1. Building Types and Baseline Model Development
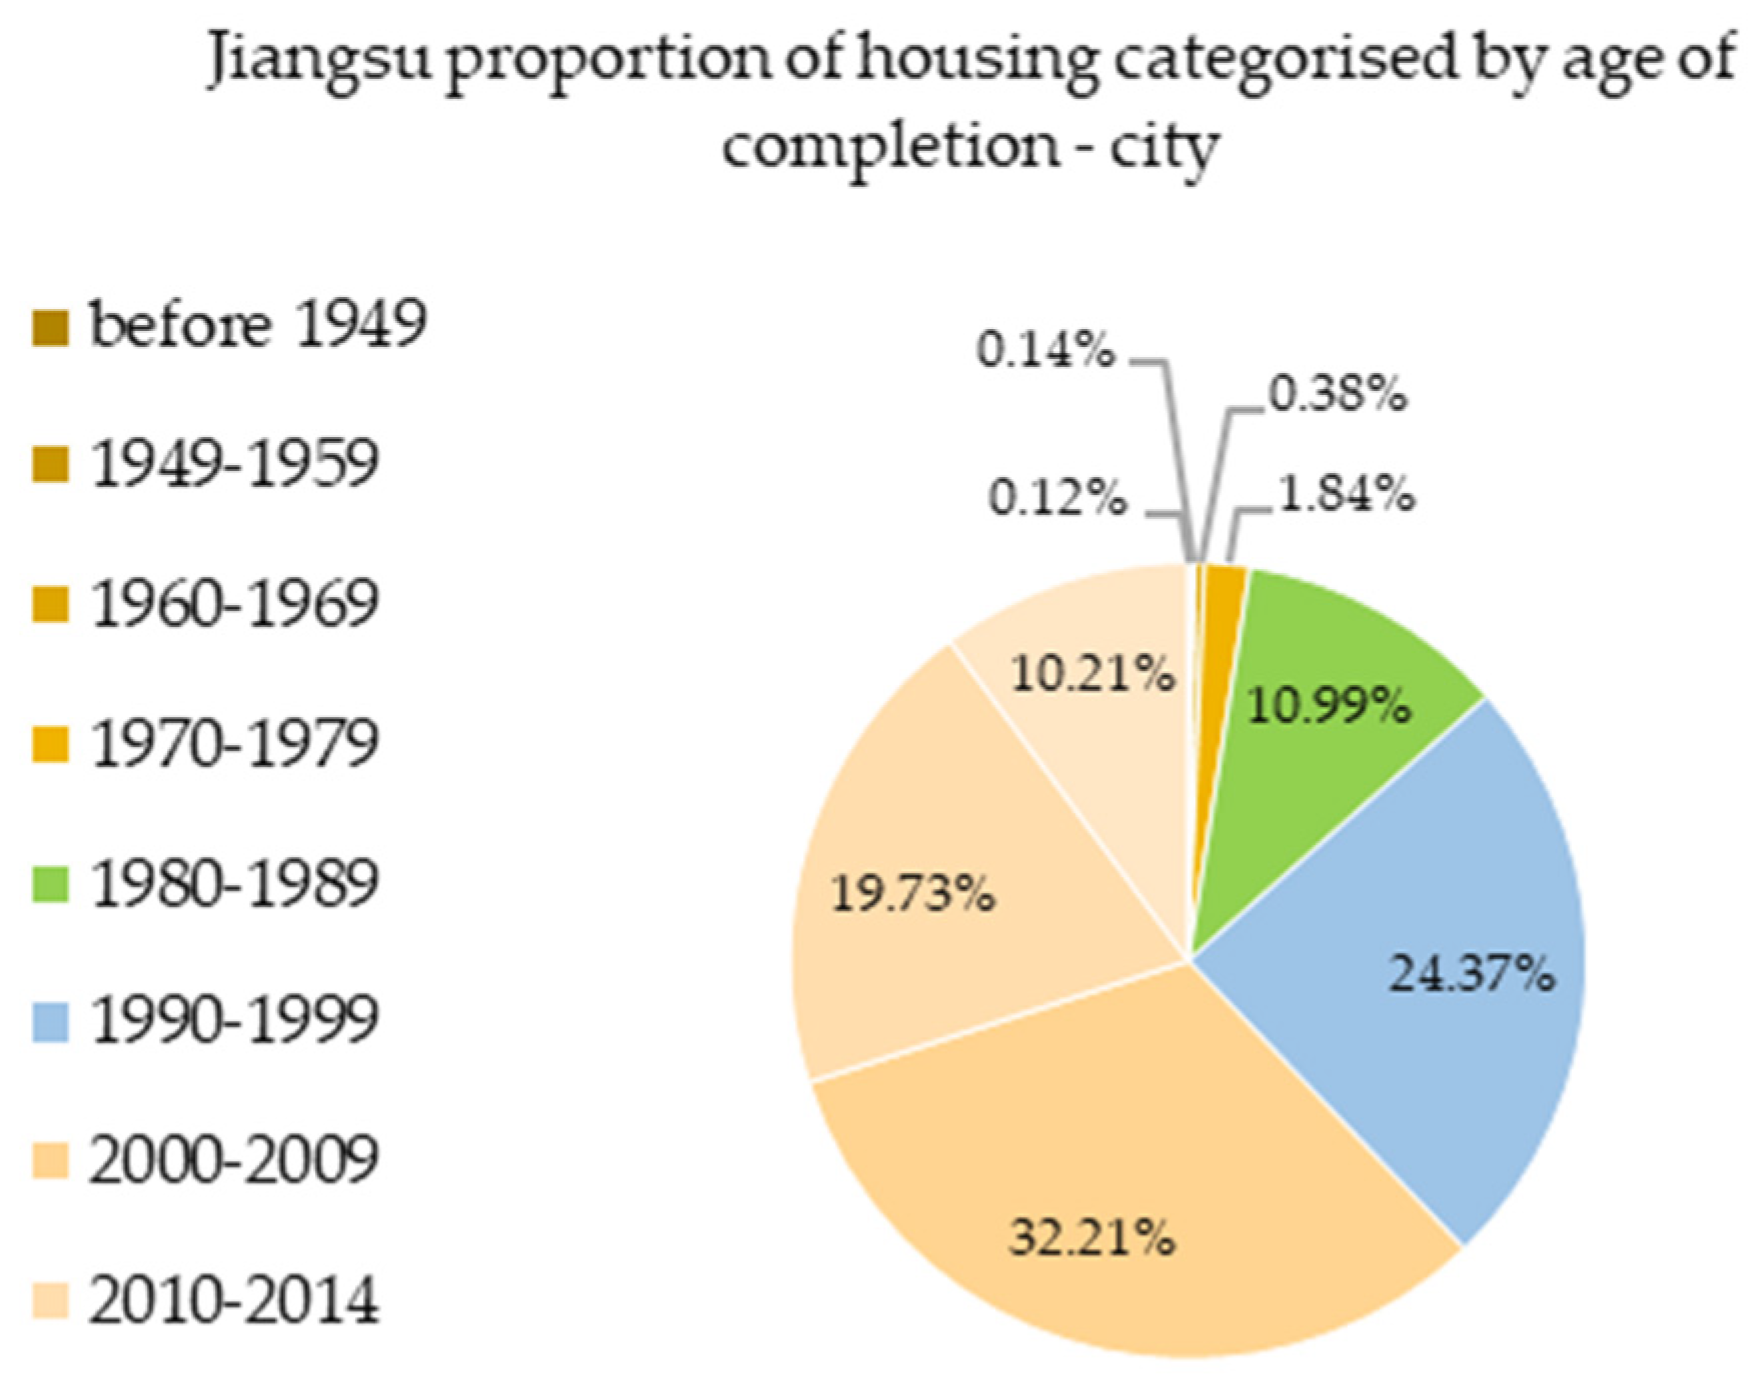
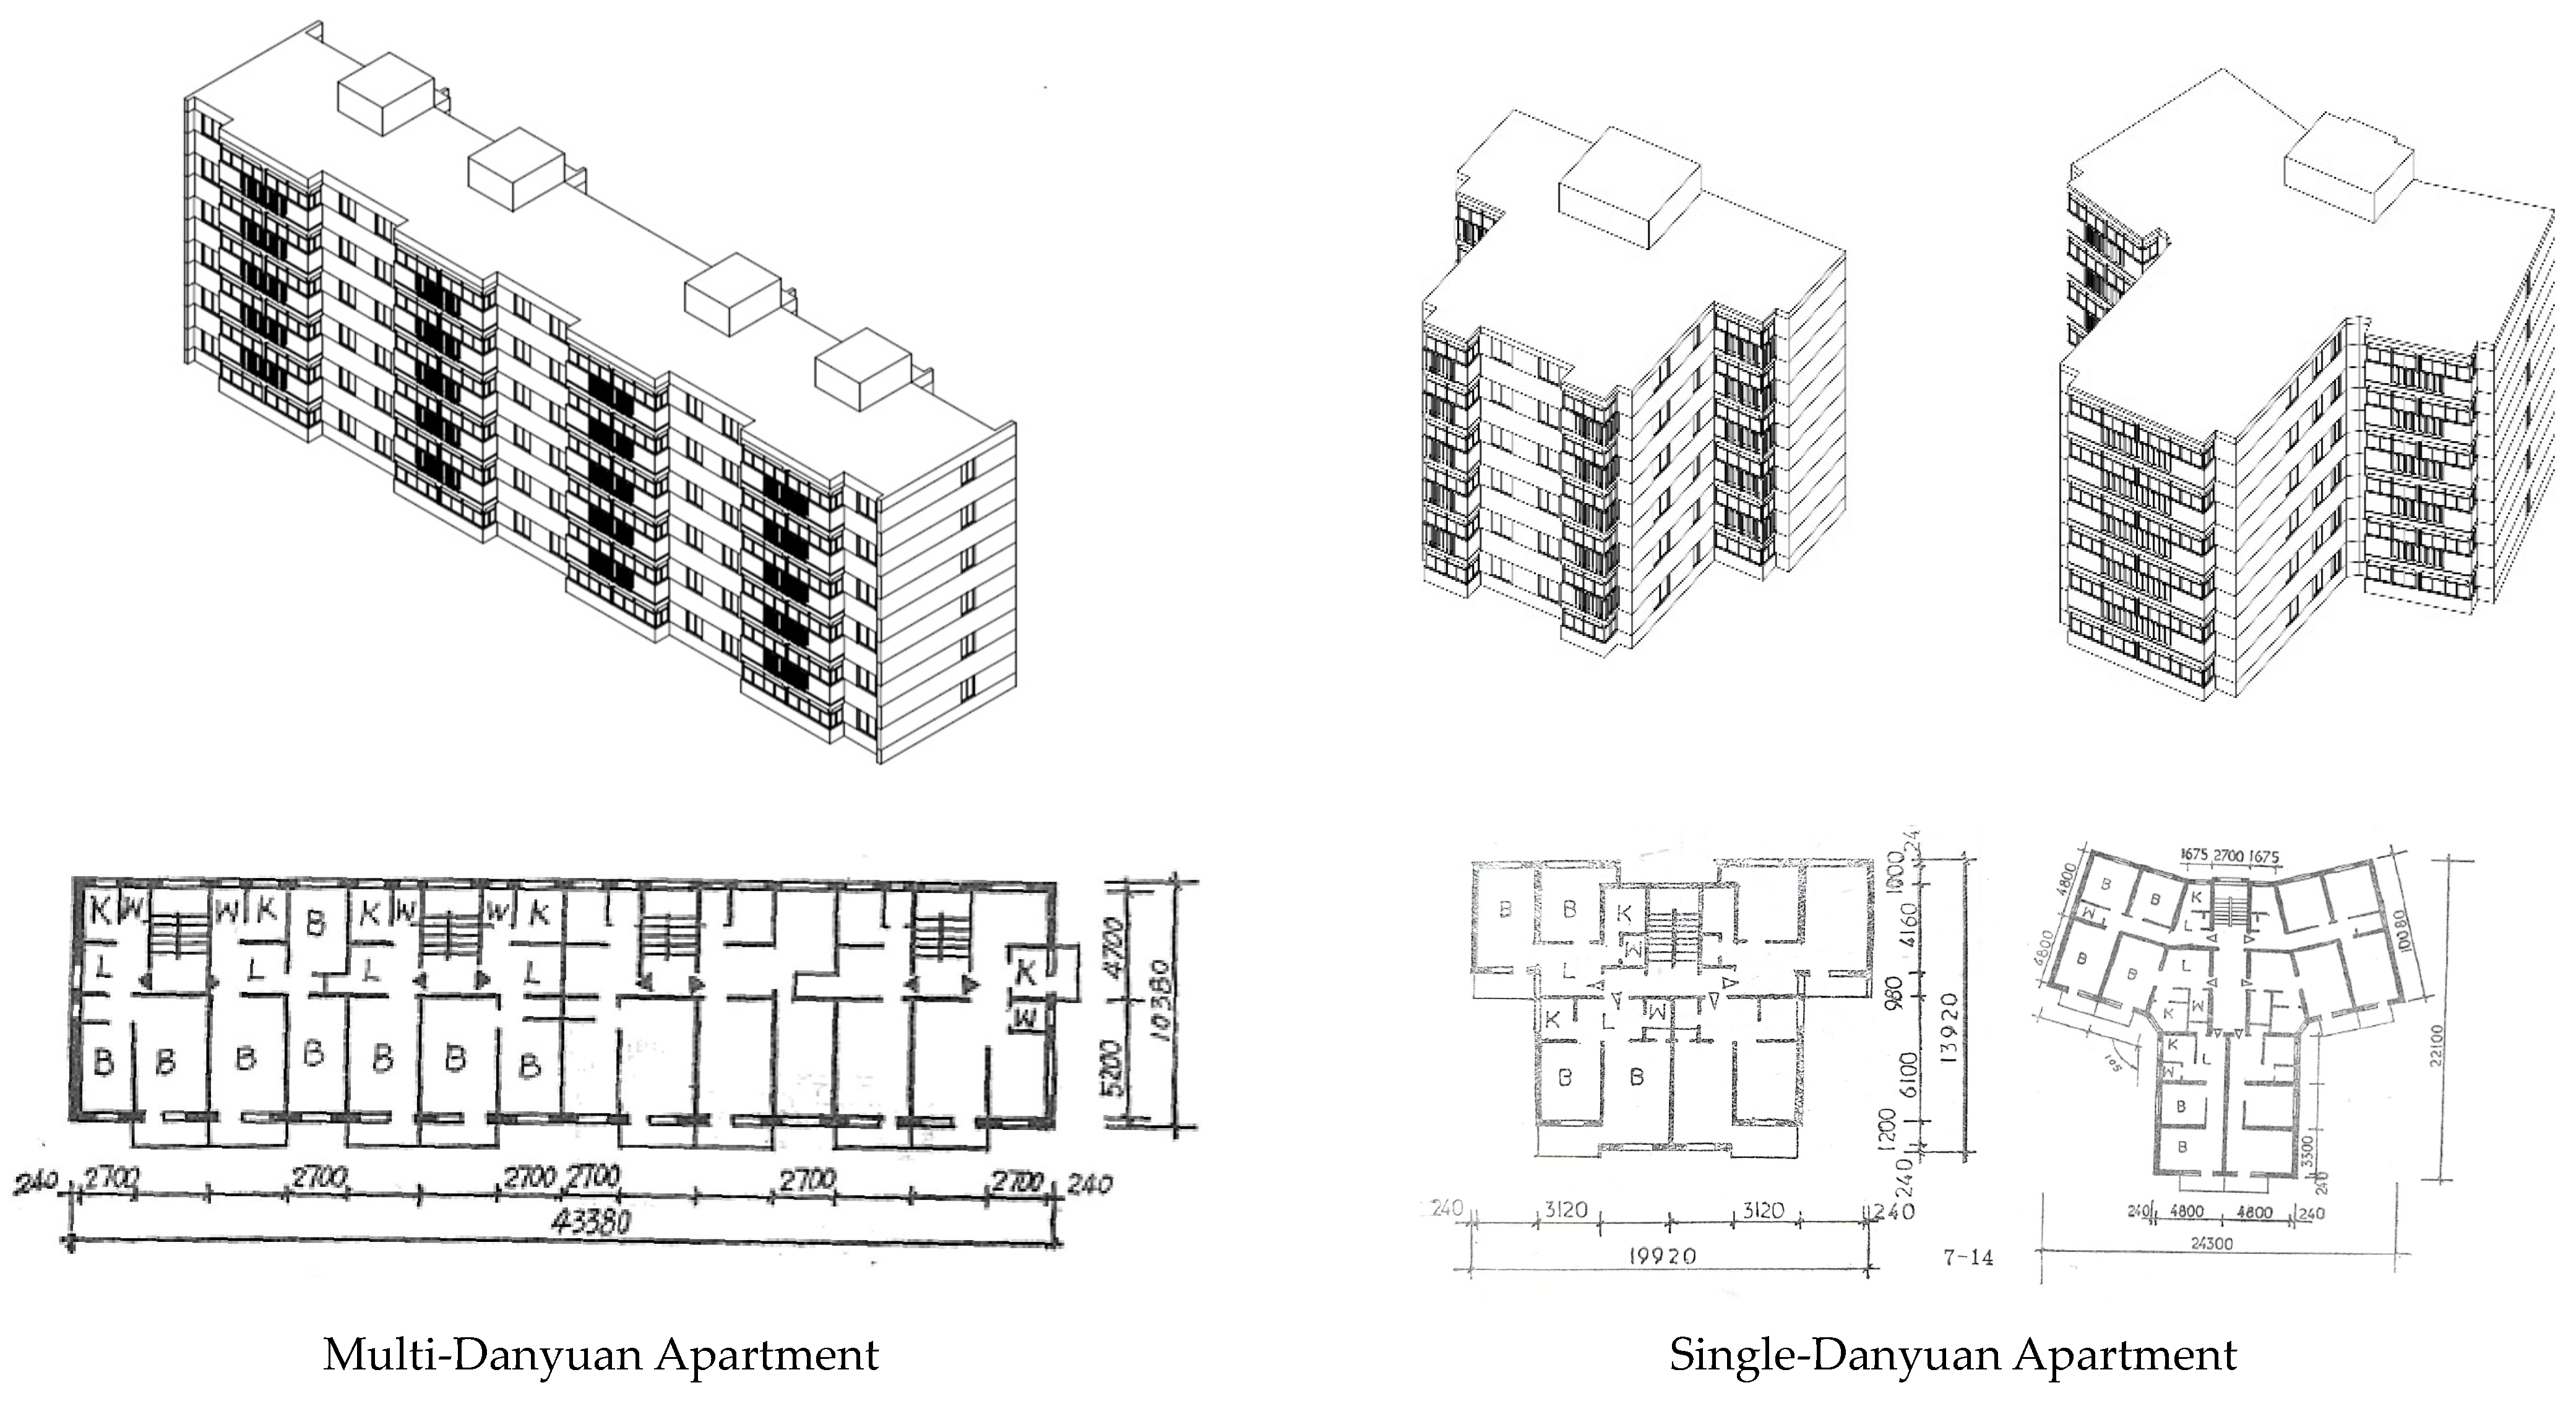
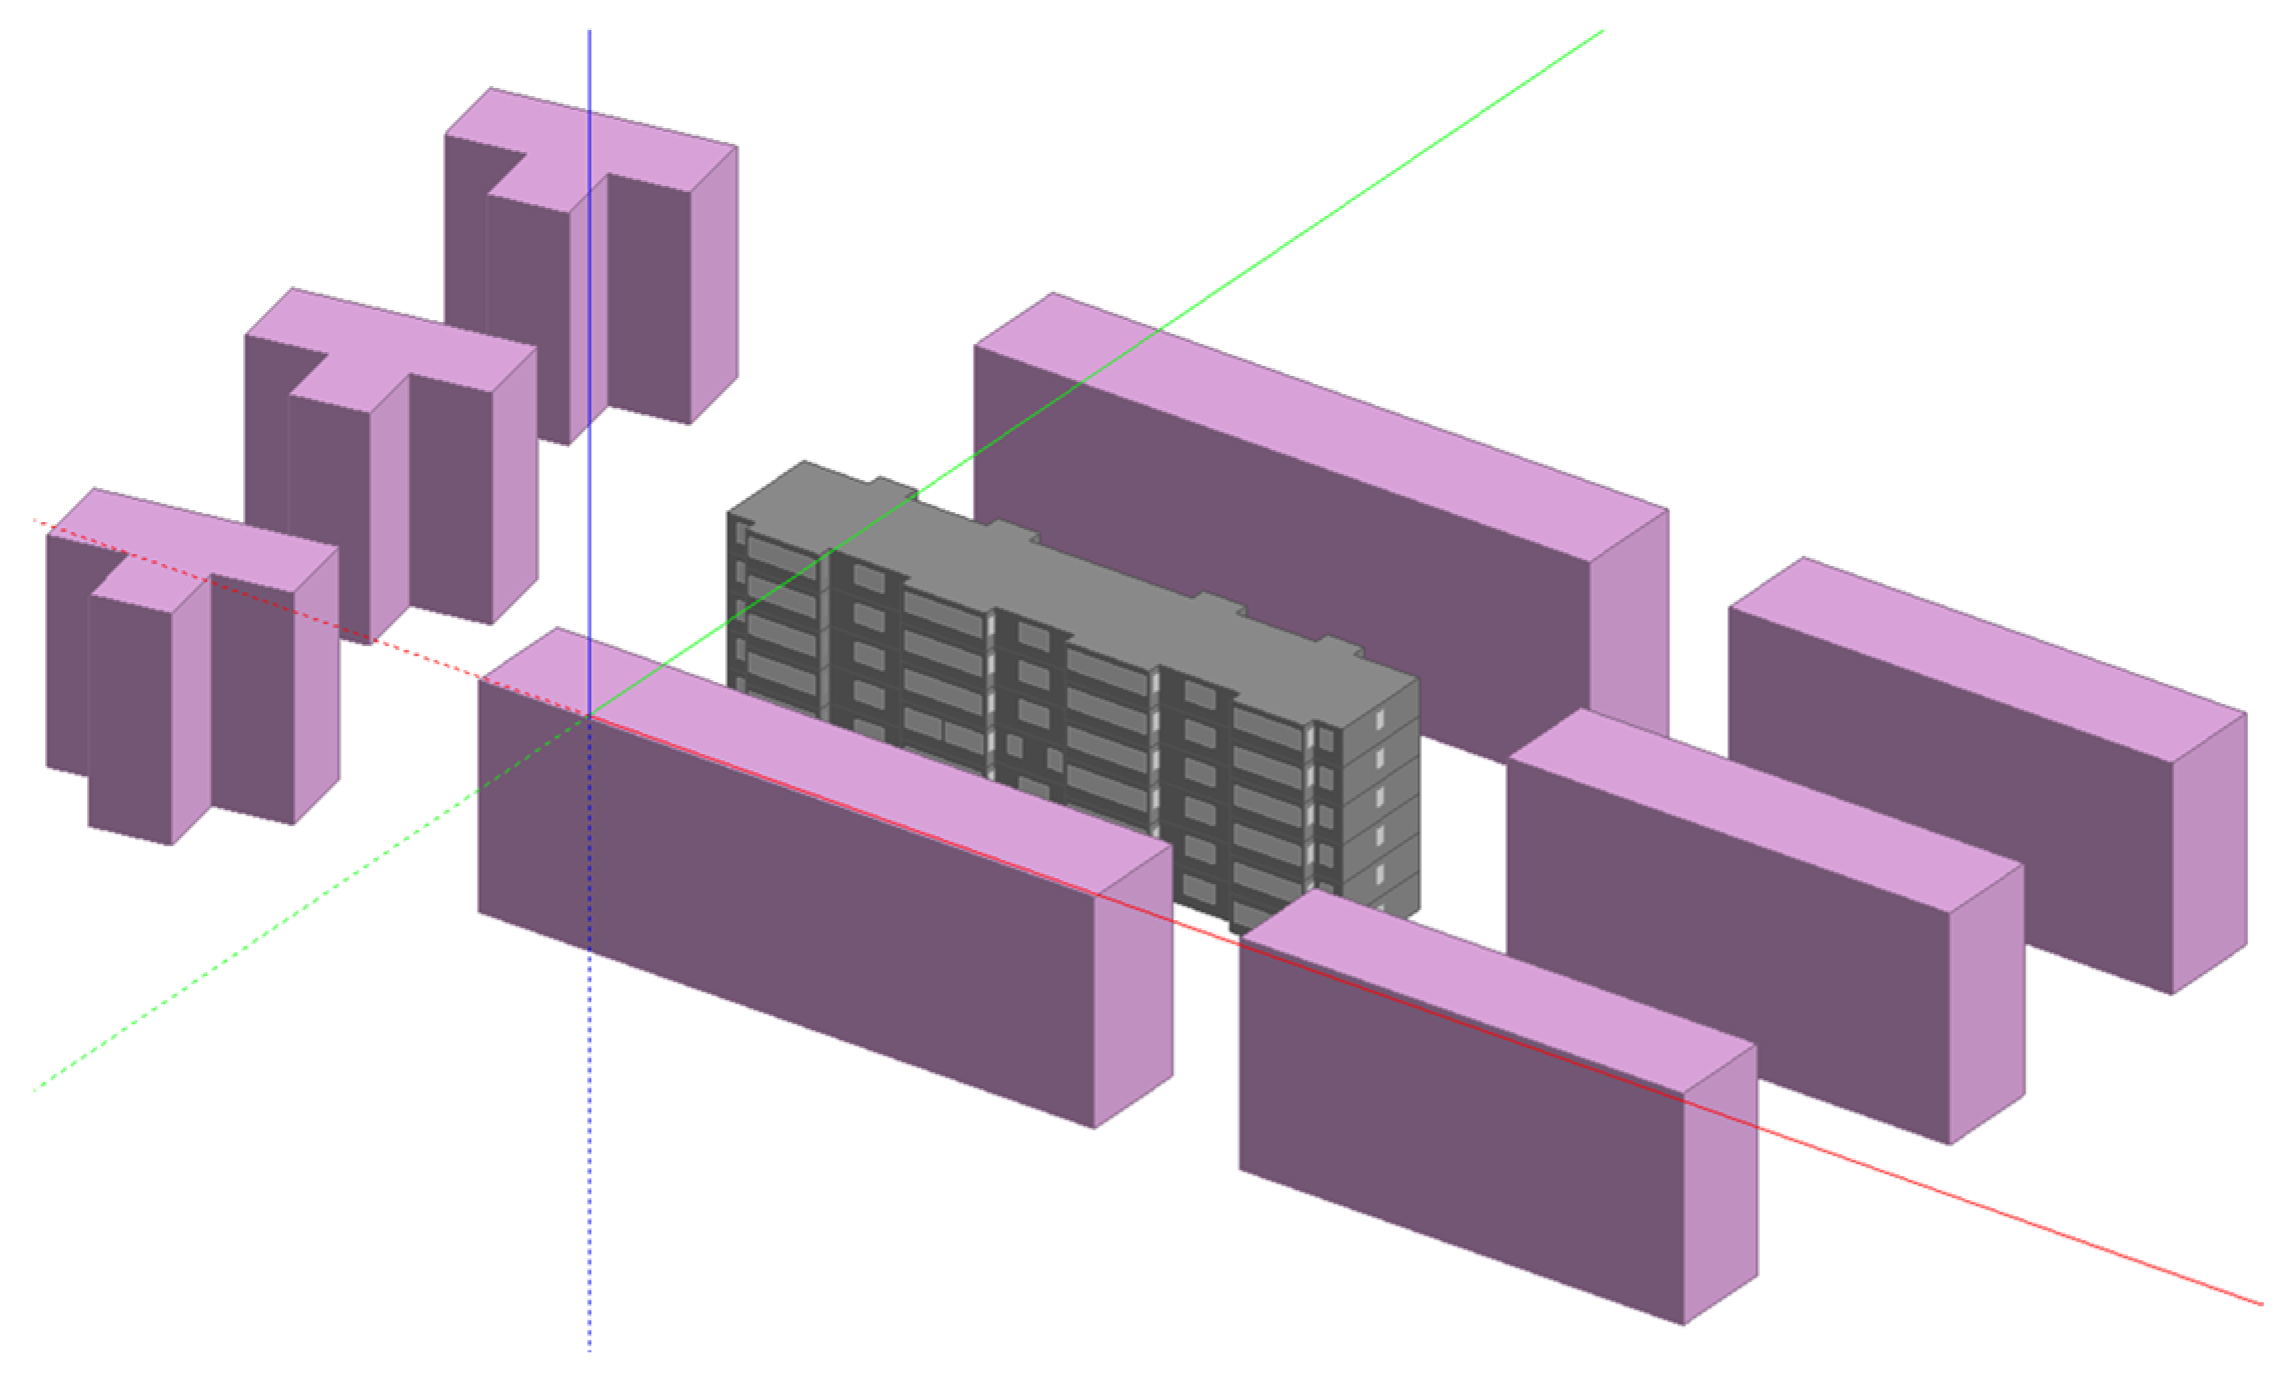
3.1.1. Representative Building Types in Urban Areas of Jiangsu Province
3.1.2. Case Study and On-Site Investigation
3.1.3. Baseline Model Development
3.1.4. Baseline Model Calibration
3.2. Pre-Retrofit Energy Demand
3.3. Post-Retrofit Energy Demand: Single Retrofit Measures
3.4. Development of Retrofit Scenarios
Retrofit Measures and Scenario Development
- Three combinations of measures are selected based on the following regulations: JGJ 134-2010 Design Standard for Energy Efficiency of Residential Buildings in Hot Summer and Cold Winter Zone, China [92]; The Building Regulations 2010 L1B Conservation of fuel and power in existing dwellings, UK [99]; and Criteria for the Passive House, EnerPHit and PHI Low Energy Building Standard, Germany [100]. The China -based scenario assesses the potential of adapting the obsolete building types to the most current local standards. The UK and Germany-based scenarios assess the potential of implementing the best international practices and to evaluate their suitability in the local context. The thermal requirements of the two standards are not strictly complied with in this research; minor deviations were deemed tolerable to align the scenarios to the local specifications of materials and components. The three scenarios are named SCE_1_CN (China), SCE_2_UK (UK), and SCE_3_GER (Germany), respectively. Their configurations are summa-rised in Table 8.
- After the simulations, three additional combinations achieving the lowest total energy demand, heating demand, and cooling demand were selected regardless of retrofit costs, regulations, or other constraints. The scenarios were named SCE_4_BT (best total), SCE_5_BH (best heating), and SCE_6_BC (best cooling). Their configuration can vary depending on the building types, as shown in Table 9. It should be noted that for the Single-Danyuan Apartment, SCE_3_GER and SCE_4_BT coincide. That is, the optimal total energy demand reduction is achieved by meeting the German EnerPHit standard.
3.5. Post-Retrofit Energy Demand under Six Scenarios
3.5.1. Total Energy Demand Reduction
3.5.2. Heating and Cooling Demand Reduction
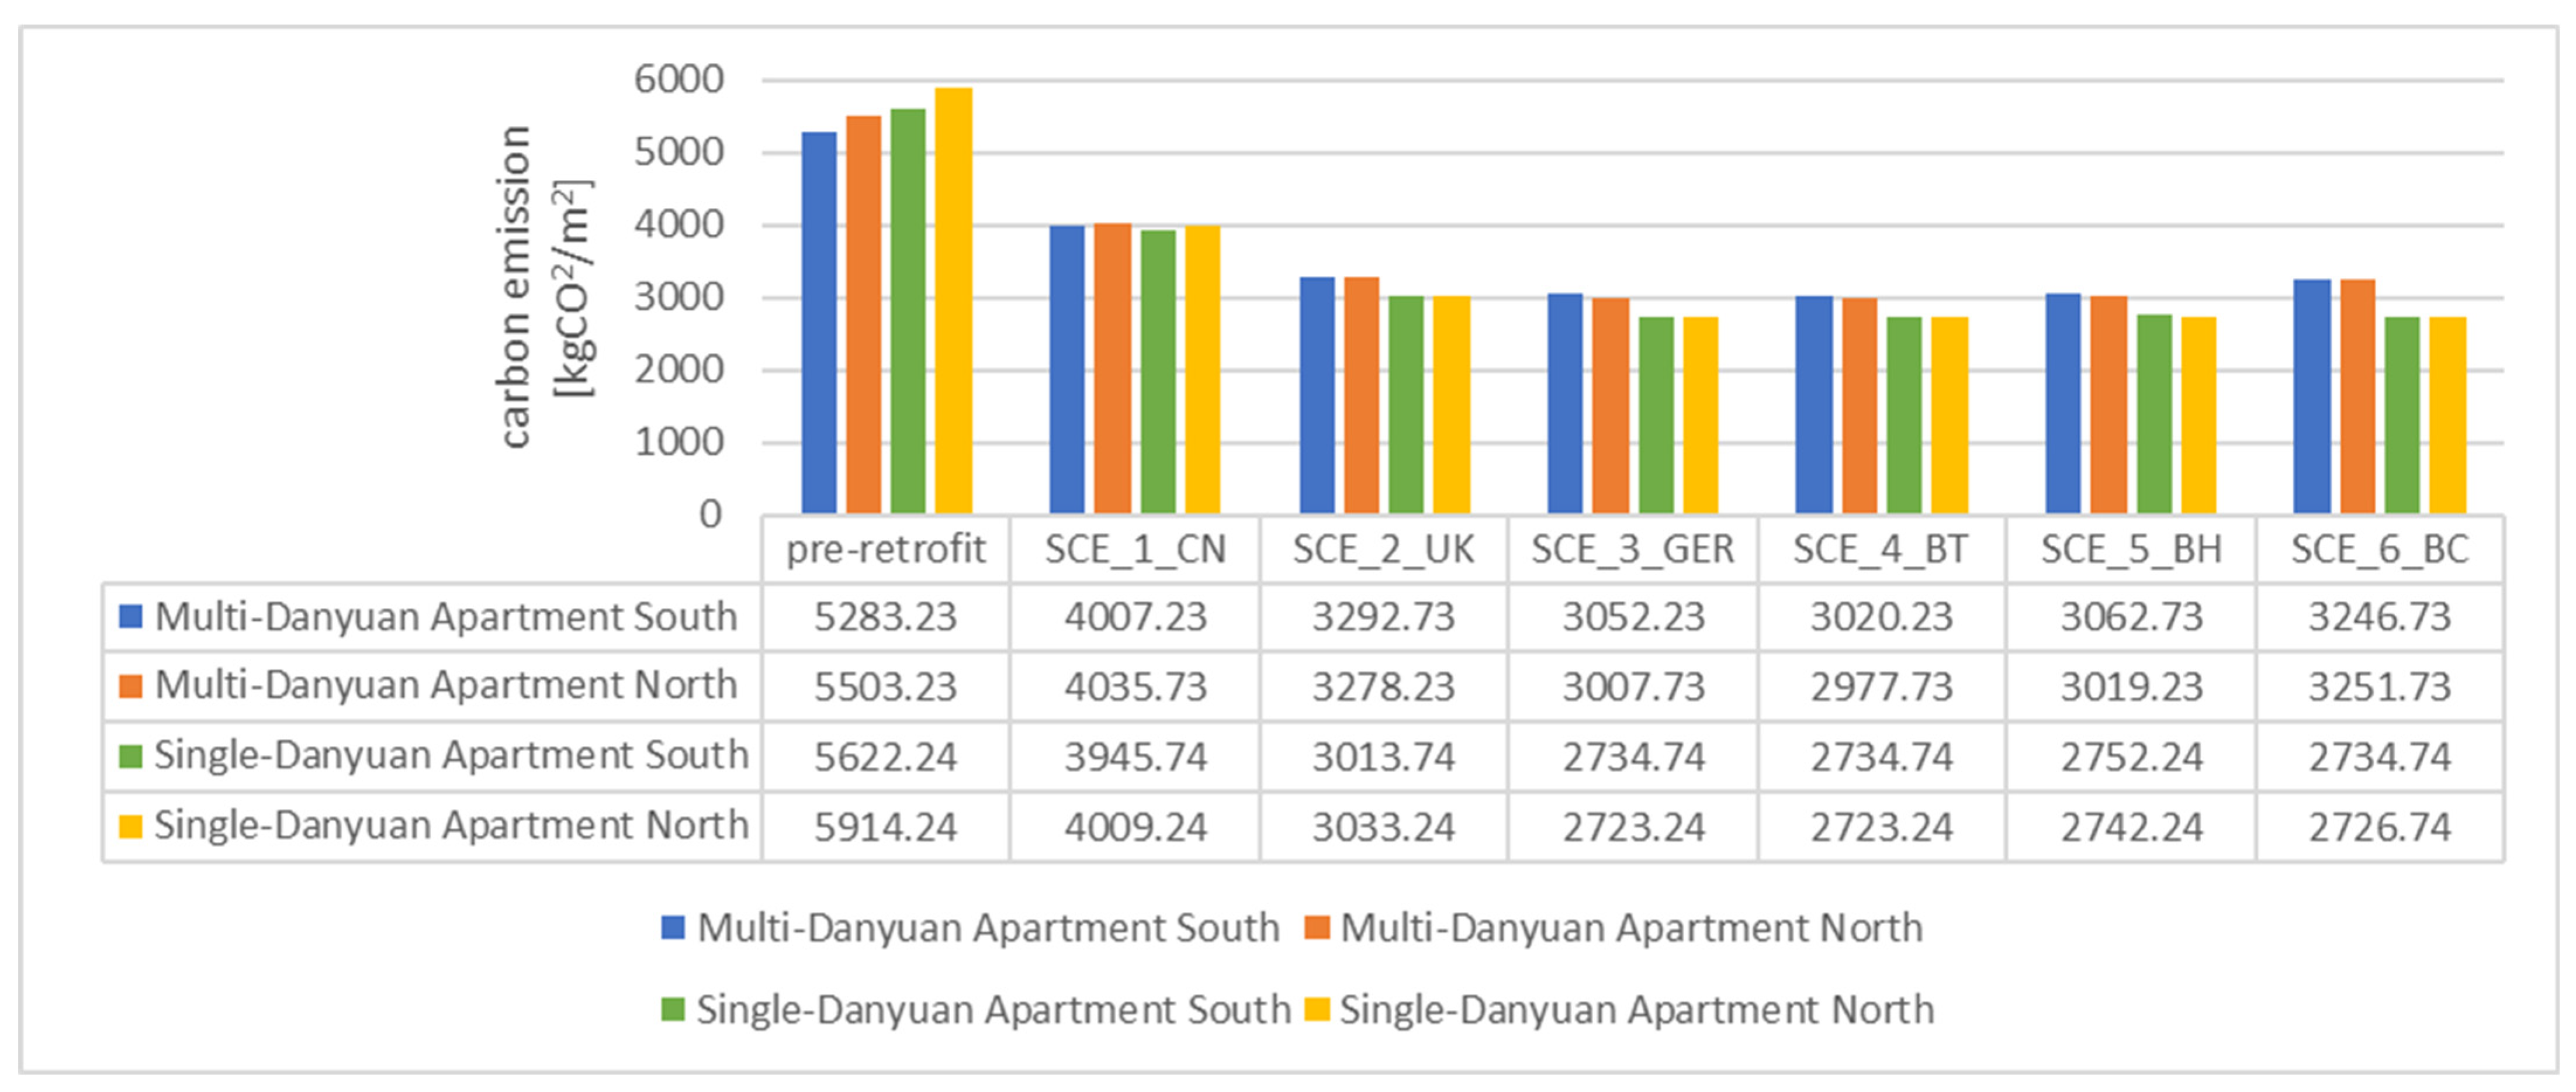
3.5.3. Carbon Emission Reduction
3.5.4. Thermal Comfort
3.5.5. Limitations
4. Conclusions
Author Contributions
Funding
Institutional Review Board Statement
Informed Consent Statement
Data Availability Statement
Conflicts of Interest
Abbreviations
| ACH | Air Changes per Hour |
| CABEE | China Association of Building Energy Efficiency |
| CSWD | Chinese Standard Weather Data |
| CV RMSE | Coefficient of Variation in the Root–Mean–Square Error |
| HSCW zone | Hot summer–cold winter zone of China’s architecture climatic regions |
| IAMs | Integrated Assessment Models |
| IEA | International Energy Agency |
| IPCC | Intergovernmental Panel on Climate Change |
| RCP | Representative Concentration Pathways |
| SWERA | Solar and Wind Energy Resource Assessment |
| THUBERC | Tsinghua University Building Energy-saving Research Center |
| TMY | Typical Meteorological Year |
Appendix A

| Period | Electricity Use (KWh) | Gas Consumption (m3) |
|---|---|---|
| November, December | 280 | 16.94 |
| January, February 2018 | 563 | 27.02 |
| March, April | 339 | 27.02 |
| May, June | 291 | 29.03 |
| July, August | 300 | 25.09 |
| September, October | 271 | 24.36 |
| November, December | 356 | 28.73 |
| January, February 2019 | 610 | 27.27 |
| March, April | 334 | 35.27 |
| May, June | 292 | 38.91 |
| July, August | 324 | 22.91 |
| September, October | 206 | 30.18 |
Appendix B
| Summer | S-Low | S-Medium | S-High | Winter | S-Low | S-Medium | S-High | |
|---|---|---|---|---|---|---|---|---|
| 0:00 | off | off | bedroom | 0:00 | off | off | off | |
| 1:00 | 1:00 | |||||||
| 2:00 | 2:00 | |||||||
| 3:00 | 3:00 | |||||||
| 4:00 | 4:00 | |||||||
| 5:00 | 5:00 | |||||||
| 6:00 | 6:00 | |||||||
| 7:00 | off | 7:00 | ||||||
| 8:00 | 8:00 | |||||||
| 9:00 | 9:00 | |||||||
| 10:00 | 10:00 | |||||||
| 11:00 | living room | 11:00 | ||||||
| 12:00 | 12:00 | |||||||
| 13:00 | Living room | 13:00 | ||||||
| 14:00 | 14:00 | |||||||
| 15:00 | 15:00 | |||||||
| 16:00 | off | 16:00 | ||||||
| 17:00 | 17:00 | living room | ||||||
| 18:00 | living room | 18:00 | ||||||
| 19:00 | living room | 19:00 | living room | |||||
| 20:00 | 20:00 | living room | ||||||
| 21:00 | 21:00 | |||||||
| 22:00 | bedroom | bedroom | bedroom | 22:00 | bedroom | bedroom | bedroom | |
| 23:00 | off | 23:00 | ||||||
| 0:00 | 0:00 | off | off | |||||
| Totol hour | 4 | 10 | 20 | Totol hour | 4 | 5 | 8 |
References
- United Nations Environment Programme. 2021 Global Status Report for Buildings and Construction: Towards a Zero-Emission, Efficient and Resilient Buildings and Construction Sector; United Nations Environment Programme: Nairobi, Kenya, 2021. [Google Scholar]
- BP PLC. Statistical Review of World Energy 2021; bp p.l.c.: London, UK, 2021. [Google Scholar]
- THUBERC. Annual Report on China Building Energy Efficiency 2021; China Architecture & Building Press: Beijing, China, 2021; p. 261. [Google Scholar]
- Zhou, L. China’s Carbon Peak and Neutrality Goals Show Its Resolve to Address Climate Change. Available online: http://www.china.org.cn/opinion/2021-05/03/content_77451598.htm (accessed on 3 January 2022).
- Liang, J. Research on the Implementation Path of Carbon Peaking and Carbon Neutralization in the Construction Sector; Architecture & Building Press: Beijing, China, 2021. [Google Scholar]
- Office of The State Council Leading Group for the Seventh National Census. China Population Census Yearbook 2020; China Statistics Press: Beijing, China, 2022.
- Ji, X.; Zhang, B.; Chen, Z.; Jia, W. Reconstruction of existing dwellings in Northern Jiangsu for energy-saving. J. Harbin Inst. Technol. 2003, 35, 1320–1353. [Google Scholar] [CrossRef]
- Bai, J.-B.; Shen, B.-a.; Zhang, Y.; Rui, W.-W.; Yang, J.-J.; Zhang, J.-Y.; Wu, H.-J. Energy-saving Retrofit Integrated Technology System and Energy Consumption Evaluation of Existing Residential Buildings of Old District in the South of Jiangsu. Build. Sci. 2012, 28, 59–65. [Google Scholar] [CrossRef]
- Xu, L.; Liu, J.; Pei, J.; Han, X. Building energy saving potential in Hot Summer and Cold Winter (HSCW) Zone, China—Influence of building energy efficiency standards and implications. Energy Policy 2013, 57, 253–262. [Google Scholar] [CrossRef]
- Tian, G.-H.; Ji, X.; Liu, W.; Liu, P.; Zhang, L.-J. Energy-consumption Survey and Energy-saving Retrofitting of Existing Residential Buildings in Xuzhou. Build. Energy Effic. 2018, 46, 79–84. [Google Scholar]
- Lv, J.; Rowe, P.G.; Zhang, J. Modern Urban Housing in China 1840–2000; Prestel: Munich, Germany; London, UK; New York, NY, USA, 2001. [Google Scholar]
- THUBERC. Annual Report on China Building Energy Efficiency 2017; China Architecture & Building Press: Beijing, China, 2017. [Google Scholar]
- CABEE. China Building Energy Consumption Research Report 2019. Available online: https://www.cabee.org/site/content/23565.html (accessed on 9 May 2022).
- The Standing Committee of Jiangsu Provincial People’s Congress. Research Report on the Improvement of Old Residential Areas in Cities and Towns. Available online: http://www.jsrd.gov.cn/zyfb/rdcwhsyyj/202106/t20210629_530508.shtml (accessed on 6 January 2022).
- Xue, Y. Residential building design code research. Constr. Mater. Decor. 2013, 12–14. [Google Scholar]
- Chai, H.; Song, W. Residential building design code research. Theor. Res. Urban Constr. Digit. 2013. [Google Scholar]
- Liu, B. Residential building design code research. Technol. Outlook 2014, 2. [Google Scholar]
- Hu, Z. Residential building design code research. Chin. Dwell. 2014, 94–95. [Google Scholar]
- Xie, Y. Study on design code of residential building. Real Estate Inf. China 2019, 96. [Google Scholar]
- Zhang, D.; Fan, L. The Development of Our Country City Residential Standard Revision and Residential Buildings. Chin. Overseas Archit. 2013, 6, 56–57. [Google Scholar]
- Liu, X.-x.; Li, Y.-l. Inquiry on energy-saving transformation problems and causes of existing residential building. Shanxi Archit. 2014, 40, 205–207. [Google Scholar]
- Liu, G.; Peng, C.; Liu, J. Study on the development history and trend of building energy efficiency standards abroad. Constr. Sci. Technol. 2015, 16–21. [Google Scholar] [CrossRef]
- Wang, J.; Wang, Q.; Ye, L. Existing Building Green Renovation Standards and Case Studies in Foreign Counturies; China Architecture & Building Press: Beijing, China, 2016. [Google Scholar]
- Fotopoulou, A.; Cattani, E.; Gulli, R.; Ferrante, A.; Semprini, G.; Schihin, Y.; Weyer, J. Deep renovation in existing residential buildings through façade additions: A case study in a typical residential building of the 70s. Energy Build. 2018, 166, 258–270. [Google Scholar] [CrossRef]
- Brambilla, A.; Salvalai, G.; Imperadori, M.; Sesana, M.M. Nearly zero energy building renovation: From energy efficiency to environmental efficiency, a pilot case study. Energy Build. 2018, 166, 271–283. [Google Scholar] [CrossRef]
- Akhozheya, B.; Syam, M.; Abdelghani, R.; Aoul, K.A.T. Retrofit evaluation of a residential building in UAE: Energy efficiency and renewable energy. In Proceedings of the 2018 5th International Conference on Renewable Energy: Generation and Applications (ICREGA), Al Ain, United Arab Emirates, 25–28 February 2018; pp. 238–242. [Google Scholar]
- Kavgic, M.; Mavrogianni, A.; Mumovic, D.; Summerfield, A.; Stevanovic, Z.; Djurovic-Petrovic, M. A review of bottom-up building stock models for energy consumption in the residential sector. Build. Environ. 2010, 45, 1683–1697. [Google Scholar] [CrossRef]
- Loga, T.; Diefenbach, N.; Wittchen, K.B.; Kragh, J.; Balaras, C.; Dascalaki, E.; Zavrl, M.Š.; Rakušček, A.; Corrado, V.; Corgnati, S.; et al. Use of Building Typologies for Energy Performance Assessment of National Building Stocks. Existent Experiences in European Countries and Common Approach. First TABULA Synthesis Report; Institut Wohnen und Umwelt GmbH (IWU): Darmstadt, Germany, 2010. [Google Scholar]
- Vissilia, A.-M. Evaluation of a sustainable Greek vernacular settlement and its landscape: Architectural typology and building physics. Build. Environ. 2009, 44, 1095–1106. [Google Scholar] [CrossRef]
- Dascalaki, E.G.; Droutsa, K.G.; Balaras, C.A.; Kontoyiannidis, S. Building typologies as a tool for assessing the energy performance of residential buildings—A case study for the Hellenic building stock. Energy Build. 2011, 43, 3400–3409. [Google Scholar] [CrossRef]
- Filogamo, L.; Peri, G.; Rizzo, G.; Giaccone, A. On the classification of large residential buildings stocks by sample typologies for energy planning purposes. Appl. Energy 2014, 135, 825–835. [Google Scholar] [CrossRef]
- Kragh, J.; Wittchen, K.B. Development of two Danish building typologies for residential buildings. Energy Build. 2014, 68, 79–86. [Google Scholar] [CrossRef]
- Santos, C.; Ferreira, T.M.; Vicente, R.; Mendes da Silva, J.A.R. Building typologies identification to support risk mitigation at the urban scale—Case study of the old city centre of Seixal, Portugal. J. Cult. Herit. 2013, 14, 449–463. [Google Scholar] [CrossRef]
- Cuerda, E.; Pérez, M.; Neila, J. Facade typologies as a tool for selecting refurbishment measures for the Spanish residential building stock. Energy Build. 2014, 76, 119–129. [Google Scholar] [CrossRef]
- Kavgic, M. City Scale Physically Disaggregated Bottom-Up Energy Model: Technical Options for Decarbonising Belgrade Residential Stock. Ph.D. Thesis, Bartlett School of Graduate Studies, University College London, London, UK, 2013. [Google Scholar]
- Filippi Oberegger, U.; Pernetti, R.; Lollini, R. Bottom-up building stock retrofit based on levelized cost of saved energy. Energy Build. 2020, 210, 109757. [Google Scholar] [CrossRef]
- De Oliveira Fernandes, M.A.; Keijzer, E.; van Leeuwen, S.; Kuindersma, P.; Melo, L.; Hinkema, M.; Gonçalves Gutierrez, K. Material-versus energy-related impacts: Analysing environmental trade-offs in building retrofit scenarios in the Netherlands. Energy Build. 2021, 231, 110650. [Google Scholar] [CrossRef]
- Song, R.; Fan, Y.; Wang, X.; Zhao, Y. The Study on the Design Mode of the Existing Residential Building Regeneration: Taking 1980s Existing Residential Buildings in Jinan as an Example. In Proceedings of the China Urban Housing Seminar and Sustainable Housing Construction Industrialization Forum, Hefei, China, 1 December 2009. [Google Scholar]
- Huang, J.e.; Lyu, H.; Feng, W.; Chen, Y.; Zhou, T. Thermal Properties Optimization of Envelope in Energy-Saving Renovation of Existing Residential Building. J. Chongqing Jianzhu Univ. 2013, 35, 118–124. [Google Scholar] [CrossRef]
- Peng, C.; Liu, X.; Cao, S.; Lin, J. Research on The Rebuilding Technology of Energy Efficiency for the Existing Residential Buildings in A Region of Hot Summer and Cold Winter. Ind. Constr. 2003, 33, 19–22. [Google Scholar] [CrossRef]
- Rui, W.-W.; Bai, J.-B.; Yang, J.-J.; Zhang, Y.; Zhang, J.-Y.; Wu, H.-J. Energy Saving Renovation for Existing Residential Houses in the South of Jiangsu. Jiangsu Constr. 2012, 101–115. [Google Scholar] [CrossRef]
- Peng, C.; Wang, L.; Zhang, X. DeST-based dynamic simulation and energy efficiency retrofit analysis of commercial buildings in the hot summer/cold winter zone of China: A case in Nanjing. Energy Build. 2014, 78, 123–131. [Google Scholar] [CrossRef]
- Li, Y.; Ren, J.; Jing, Z.; Jianping, L.; Ye, Q.; Lv, Z. The Existing Building Sustainable Retrofit in China-A Review and Case Study. Procedia Eng. 2017, 205, 3638–3645. [Google Scholar] [CrossRef]
- Tsang, C. Energy-Saving Retrofits for Residential Buildings in the Hot Summer and Cold Winter Zone in China. Ph.D. Thesis, Loughborough University, Loughborough, UK, 2020. [Google Scholar] [CrossRef]
- Zou, D.-N. A History of Chinese Modern Architecture; Tianjin Science and Technology Press: Tianjin, China, 2001. [Google Scholar]
- Liu, Y. Chinese Housing 60 Years (1949–2009) Look Back at the Past; China Architecture & Building Press: Beijing, China, 2009. [Google Scholar]
- Deng, Y. Urban housing system reform and real estate market development in China. Hous. Financ. Int. 2017, 15–17. [Google Scholar]
- Pu, Q. Research on Prediction Model and Influencing Factors of Urban Residential Building Energy Consumption; Chongqing University: Chongqing, China, 2012. [Google Scholar]
- Yang, X. Study of China’s Building Energy Efficiency Based on Energy Data; Tsinghua University: Beijing, China, 2009. [Google Scholar]
- Yao, R.; Costanzo, V.; Li, X.; Zhang, Q.; Li, B. The effect of passive measures on thermal comfort and energy conservation. A case study of the hot summer and cold winter climate in the Yangtze River region. J. Build. Eng. 2018, 15, 298–310. [Google Scholar] [CrossRef]
- Dong, X. Research on the Hot Summer and Cold Winter Zone Residential Heating and Energy Saving Design; Xi’an University of Architecture and Technology: Xi’an, China, 2016. [Google Scholar]
- Gui, X.-C.; Ma, Y.-T.; Chen, S.-Q.; Ge, J. The methodology of standard building selection for residential buildings in hot summer and cold winter zone of China based on architectural typology. J. Build. Eng. 2018, 18, 352–359. [Google Scholar] [CrossRef]
- Loga, T.; Stein, B.; Diefenbach, N. TABULA building typologies in 20 European countries—Making energy-related features of residential building stocks comparable. Energy Build. 2016, 132, 4–12. [Google Scholar] [CrossRef]
- Shorrock, L.D.; Dunster, J.E. The physically-based model BREHOMES and its use in deriving scenarios for the energy use and carbon dioxide emissions of the UK housing stock. Energy Policy 1997, 25, 1027–1037. [Google Scholar] [CrossRef]
- Boardman, B.; Darby, S.; Killip, G.; Hinnells, M.; Jardine, C.N.; Palmer, J.; Sinden, G.; Lane, K.; Layberry, R.; Wright, A.; et al. 40% House; Environmental Change Institute, University of Oxford: Oxford, UK, 2005. [Google Scholar]
- Natarajan, S.; Levermore, G.J. Predicting future UK housing stock and carbon emissions. Energy Policy 2007, 35, 5719–5727. [Google Scholar] [CrossRef]
- Cheng, V.; Steemers, K. Modelling domestic energy consumption at district scale: A tool to support national and local energy policies. Environ. Model. Softw. 2011, 26, 1186–1198. [Google Scholar] [CrossRef]
- Huang, Y.J.; Brodrick, J. A bottom-up engineering estimate of the aggregate heating and cooling loads of the entire U.S. building stock. In Proceedings of the 2000 ACEEE Summer Study on Energy Efficiency in Buildings, Pacific Grove, CA, USA, 20–25 August 2000. [Google Scholar]
- Zhou, Y.; Gurney, K. A new methodology for quantifying on-site residential and commercial fossil fuel CO2 emissions at the building spatial scale and hourly time scale. Carbon Manag. 2010, 1, 45–56. [Google Scholar] [CrossRef]
- Cerezo Davila, C.; Reinhart, C.F.; Bemis, J.L. Modeling Boston: A workflow for the efficient generation and maintenance of urban building energy models from existing geospatial datasets. Energy 2016, 117, 237–250. [Google Scholar] [CrossRef]
- Yang, X.; Hu, M.; Tukker, A.; Zhang, C.; Huo, T.; Steubing, B. A bottom-up dynamic building stock model for residential energy transition: A case study for the Netherlands. Appl. Energy 2022, 306, 118060. [Google Scholar] [CrossRef]
- Hogan, J.; Watson, R.; Huang, Y.J.; Lang, S.; Fu, X.; Lin, H. Development of China’s Energy-Efficiency Design Standard for Residential Buildings in the “Hot-Summer/Cold-Winter” Zone; China Energy Group, International Energy Analysis Department, Energy Analysis and Environmental Impacts Division: Berkeley, CA, USA, 2001.
- Niu, J.; Liao, Z. Forecasting Residential Energy Demand in China: An approach to technology impacts. J. Asian Archit. Build. Eng. 2002, 1, 8. [Google Scholar] [CrossRef]
- Wei, F.; Khanna, N.; Fridley, D.; Ke, J.; Huang, K.; Zhou, N. Impact Analysis of Developing Net Zero Energy Buildings in China. In Proceedings of the 2016 ACEEE Summer Study on Energy Efficiency in Buildings, Asilomar Conference Center, Pacific Grove, CA, USA, 21–26 August 2016. [Google Scholar]
- Crawley, D.B.; Hand, J.W.; Kummert, M.; Griffith, B.T. Contrasting the capabilities of building energy performance simulation programs. Build. Environ. 2008, 43, 661–673. [Google Scholar] [CrossRef]
- Boafo, F.E.; Ahn, J.-G.; Kim, J.-T.; Kim, J.-H. Computing Thermal Bridge of VIP in Building Retrofits using DesignBuilder. Energy Procedia 2015, 78, 400–405. [Google Scholar] [CrossRef]
- Liu, Y.; Chen, H.; Zhang, L.; Feng, Z. Enhancing building energy efficiency using a random forest model: A hybrid prediction approach. Energy Rep. 2021, 7, 5003–5012. [Google Scholar] [CrossRef]
- Zhang, Y.; Korolija, I. Performing complex parametric simulations with jEPlus. In Proceedings of the 9th International Conference on Sustainable Energy Technologies, Shanghai, China, 24–27 August 2010. [Google Scholar]
- MOHURD. General Code for Energy Efficiency and Utilization of Renewable Energy Application in Buildings GB 55015-2021; MOHURD: Beijing, China, 2021.
- Yin, S. Study of Life-Cycle Carbon Emission in Buildings. Master’s Thesis, Harbin Institute of Technology, Harbin, China, 2012. [Google Scholar]
- Jiang, Y. Residential Energy Conservation; China Architecture & Building Press: Beijing, China, 2006. [Google Scholar]
- Li, X. Technical Guide for Green Renovation of Existing Residential Buildings; China Architecture & Building Press: Beijing, China, 2016. [Google Scholar]
- JGJ/T 129-2012; Technical Specification for Energy Efficiency Retrofitting of Existing Residential Buildings. China Architecture & Building Press: Beijing, China, 2012.
- Zhang, X.; Zhang, Y. Building Energy Saving Technology and Materials; Zhang, X., Zhang, Y., Eds.; Chemical Industry Press: Beijing, China, 2009. [Google Scholar]
- GB 21455-2019; Minimum Allowable Values of the Energy Efficiency and Energy Efficiency Grades for Room Air Conditioners. China Architecture & Building Press: Beijing, China, 2019.
- Bai, J.-b.; Zhang, Y.; Lu, J.; Li, L.-h.; Wu, H.-j.; Zhang, J.-y. Energy Efficiency Retrofit of Existing Residential Buildings in the South of Jiangsu Based on Life Cycle Assessment. Build. Sci. 2013, 29, 59–64. [Google Scholar]
- Yang, J.; Cong, G.; Peng, J. The impact of the external window shading on residential energy consumption in Hot summer and cold winter areas. Constr. Wall Innov. Build. Energy Sav. 2009, 48–50. [Google Scholar] [CrossRef]
- General Administration of Quality Supervision Inspection and Quarantine of China; Standardization Administration of China. The Minimum Allowable Values of the IPLV and Energy Efficiency Grades for Multi-Connected Air-Conditioning (Heat Pump) Unit GB 21454-2008; China Architecture & Building Press: Beijing, China, 2008.
- Wang, X.; Lu, M.; Mao, W.; Ouyang, J.; Zhou, B.; Yang, Y. Improving benefit-cost analysis to overcome financing difficulties in promoting energy-efficient renovation of existing residential buildings in China. Appl. Energy 2015, 141, 119–130. [Google Scholar] [CrossRef]
- Gou, S.; Li, Z.; Nik, V.M.; Scartezzini, J.L.; Zhao, Q. Passive design optimization of newly-built residential buildings in Shanghai for improving indoor thermal comfort while reducing building energy demand. Energy Build. 2018, 169, 484–506. [Google Scholar] [CrossRef]
- Yu, J.; Xu, X.; Wang, J.; Tian, L.; Yang, C. Optimum insulation thickness of residential roof with respect to solar-air degree-hours in hot summer and cold winter zone of China. Energy Build. 2011, 43, 2304–2313. [Google Scholar] [CrossRef]
- He, Q.; Ng, S.T.; Hossain, M.U.; Skitmore, M. Energy-efficient window retrofit for high-rise residential buildings in different climatic zones of China. Sustainability 2019, 11, 6473. [Google Scholar] [CrossRef]
- Li, X. Green Retrofitting for Existing Reidential Building-Technical Guide; China Architecture and Building Press: Beijing, China, 2016. [Google Scholar]
- Xiao, X.; Cao, Y.; Li, D.; Liang, Y. Relationship between the Depth of Horizontal Shading Board and Building Energy Consumption in Hot Summer and Cold Winter Zone. Ind. Constr. 2014, 49–89. [Google Scholar] [CrossRef]
- Jiang, D.-m.; Liu, H.-c. Study on the Energy-saving Reconstruction to the Open-styled Staircase of the Existing Residential Buildings in Hot-summer and Cold-winter Region. Build. Energy Effic. 2008, 36, 32–34. [Google Scholar] [CrossRef]
- Suo, J.; Wu, D.; Tian, D. Study on Sustainable Renovation of Urban Existing Housing in China; China Architecture & Building Press: Beijing, China, 2015. [Google Scholar]
- Engineering Earthquake Resistance Institute of China Academy of Building Research. Residential Building Graphic Design Reference Atlas/Zhu Zhai Jian Zhu Ping Mian She Ji Can Kao Tu Ji; Engineering Earthquake Resistance Institute of China Academy of Building Research, 1992.
- GB 50176-1993; Code for Thermal Design of Civil Building. China Architecture & Building Press: Beijing, China, 1993.
- GB 50176-2016; Code for Thermal Design of Civil Building. China Architecture & Building Press: Beijing, China, 2016.
- DBJT03-22-2005; 05 Series Building Standard Design Atlas, 05J1-3. Shanxi Architectural Engineering Design Co.; China Architecture & Building Press: Beijing, China, 2005.
- Chen, B.; Kang, J. Low Carbon Architecture in the UK: Research and Development (R&D) from an Integrated Perspective. World Archit. 2010, 54–59. [Google Scholar]
- JGJ 134-2010; Design Standard for Energy Efficiency of Residential Buildings in Hot Summer and Cold Winter Zone. China Architecture & Building Press: Beijing, China, 2010.
- Chen, S.; Li, N.; Yoshino, H. Statistical analyses on summer energy consumption characteristics of residential buildings in some cities of China. Energy Build. 2010, 42, 136–146. [Google Scholar] [CrossRef]
- Chen, S.; Li, N.; Yoshino, H.; Guan, J.; Levine, M.D. Statistical analyses on winter energy consumption characteristics of residential buildings in some cities of China. Energy Build. 2011, 43, 1063–1070. [Google Scholar] [CrossRef]
- Yoshino, H.; Yoshino, Y.; Qingyuan, Z.; Mochida, A.; Nianping, L.I.; Zhenhai, L.I.; Miyasaka, H. Indoor thermal environment and energy saving for urban residential buildings in China. Energy Environ. Resid. Build. China 2006, 38, 1308–1319. [Google Scholar] [CrossRef]
- Djamila, H.; Chu, C.-M.; Kumaresan, S. Field study of thermal comfort in residential buildings in the equatorial hot-humid climate of Malaysia. Building Environ. 2013, 62, 133–142. [Google Scholar] [CrossRef]
- GB 50034-2013; Standard for Lighting Design of Buildings. China Architecture & Building Press: Beijing, China, 2013.
- Yu, J.; Yang, C.; Tian, L. Low-energy envelope design of residential building in hot summer and cold winter zone in China. Energy Build. 2008, 40, 1536–1546. [Google Scholar] [CrossRef]
- HM Government. The Building Regulations 2010 L1B Conservation of Fuel and Power in Existing Dwellings; RIBA Workshop: London, UK, 2010.
- Passive House Institute. Criteria for the Passive House, EnerPHit and PHI Low Energy Building Standard, Version 9f, Revised 15 August 2016; Passive House Institute: Darmstadt, Germany, 2016. [Google Scholar]
- Liu, X.e. Jiangsu Province Housing Renovation Project Valuation Table (Civil Engineering) 2009 Edition; Southeast University Press: Nanjing, China, 2010. [Google Scholar]
- Jiangsu Provincial Department of Housing and Urban-Rural Development. Jiangsu Province Construction and Decoration Engineering Valuation Quota; Jiangsu Science and Technology Press: Nanjing, China, 2014.
- Parkinson, T.; de Dear, R.; Brager, G. Nudging the adaptive thermal comfort model. Energy Build. 2020, 206, 109559. [Google Scholar] [CrossRef]


| Retrofit Component | Code Name | Configuration | Properties |
|---|---|---|---|
| wall | pre-wall | no insulation (original) | U-value: 1.951 W/m2K |
| WallSce_1 | EPS 30 mm | U-value: 0.695 W/m2K | |
| WallSce_2 | EPS 60 mm | U-value: 0.440 W/m2K | |
| WallSce_3 | EPS 90 mm | U-value: 0.322 W/m2K | |
| roof | pre-roof | no insulation (original) | U-value: 3.231 W/m2K |
| RoofSce_1 | XPS 30 mm | U-value: 0.598 W/m2K | |
| RoofSce_2 | XPS 60 mm | U-value: 0.383 W/m2K | |
| RoofSce_3 | XPS 90 mm | U-value: 0.282 W/m2K | |
| window | Win Single | single glazing + Aluminum window frame without thermal break (original) | U-value: 5.9 W/m2K, SHGC: 0.75 |
| Win Dbl | double glazing-Argon gas + Aluminum window frame with thermal break | U-value: 2.9 W/m2K, SHGC: 0.67 | |
| Win_Dbl low-E | double low-E glazing-Argon gas + UPVC window frame | U-value: 2.0 W/m2K, SHGC: 0.62 | |
| Win_Trp low-E | triple low-E glazing-Argon gas + UPVC window frame | U-value: 0.8 W/m2K, SHGC: 0.58 | |
| air infiltration | 1.5 ACH | 1.5 ACH (original) | 1.5 ACH |
| 1.0 ACH | 1.0 ACH | 1.0 ACH | |
| 0.5 ACH | 0.5 ACH | 0.5 ACH | |
| External wall façade reflectivity | Ref_0.4 | 0.4 (original) | 0.4 |
| Ref_0.8 | 0.8 | 0.2 | |
| south window overhang | none | none (original) | None |
| 0.5 m | 0.5 m | 0.5 m | |
| staircase enclosure | semi-open | semi-open | semi-open |
| closed | closed | closed |
| Component | Thickness | U-Values [W/m2K] |
|---|---|---|
| Exterior wall | 0.24–0.28 m | 1.951 |
| Roof | 0.18–0.22 m | 3.231 |
| Partition wall | 0.24–0.28 m | 2.721 |
| Internal floor | 0.15–0.22 | 2.753 |
| Window | Single glass with timber or aluminium frames | 5.90 |
| airtightness | 1.5 ACH | |
| Shading devices | no shading or foldable rain shed | |
| Staircase | Semi-open | |
| Building Property Information | |
|---|---|
| Construction Year | 1986 |
| Floors | 6 |
| Number of Staircase (Danyuan) | 4 |
| Dwelling Unit per Danyuan | 2 |
| Number of apartments | 48 |
| Area per storey (sqm) | 470 |
| Orientation | E-W |
| Surface area to volume (S/V) ratio | 0.42 |
| Window-to-wall ratio | 26.3% (north façade), 34.0% (south façade), 5.6% (east and west façades) |
| Average storey height (m) | 2.9 m |
| Central heating | No |
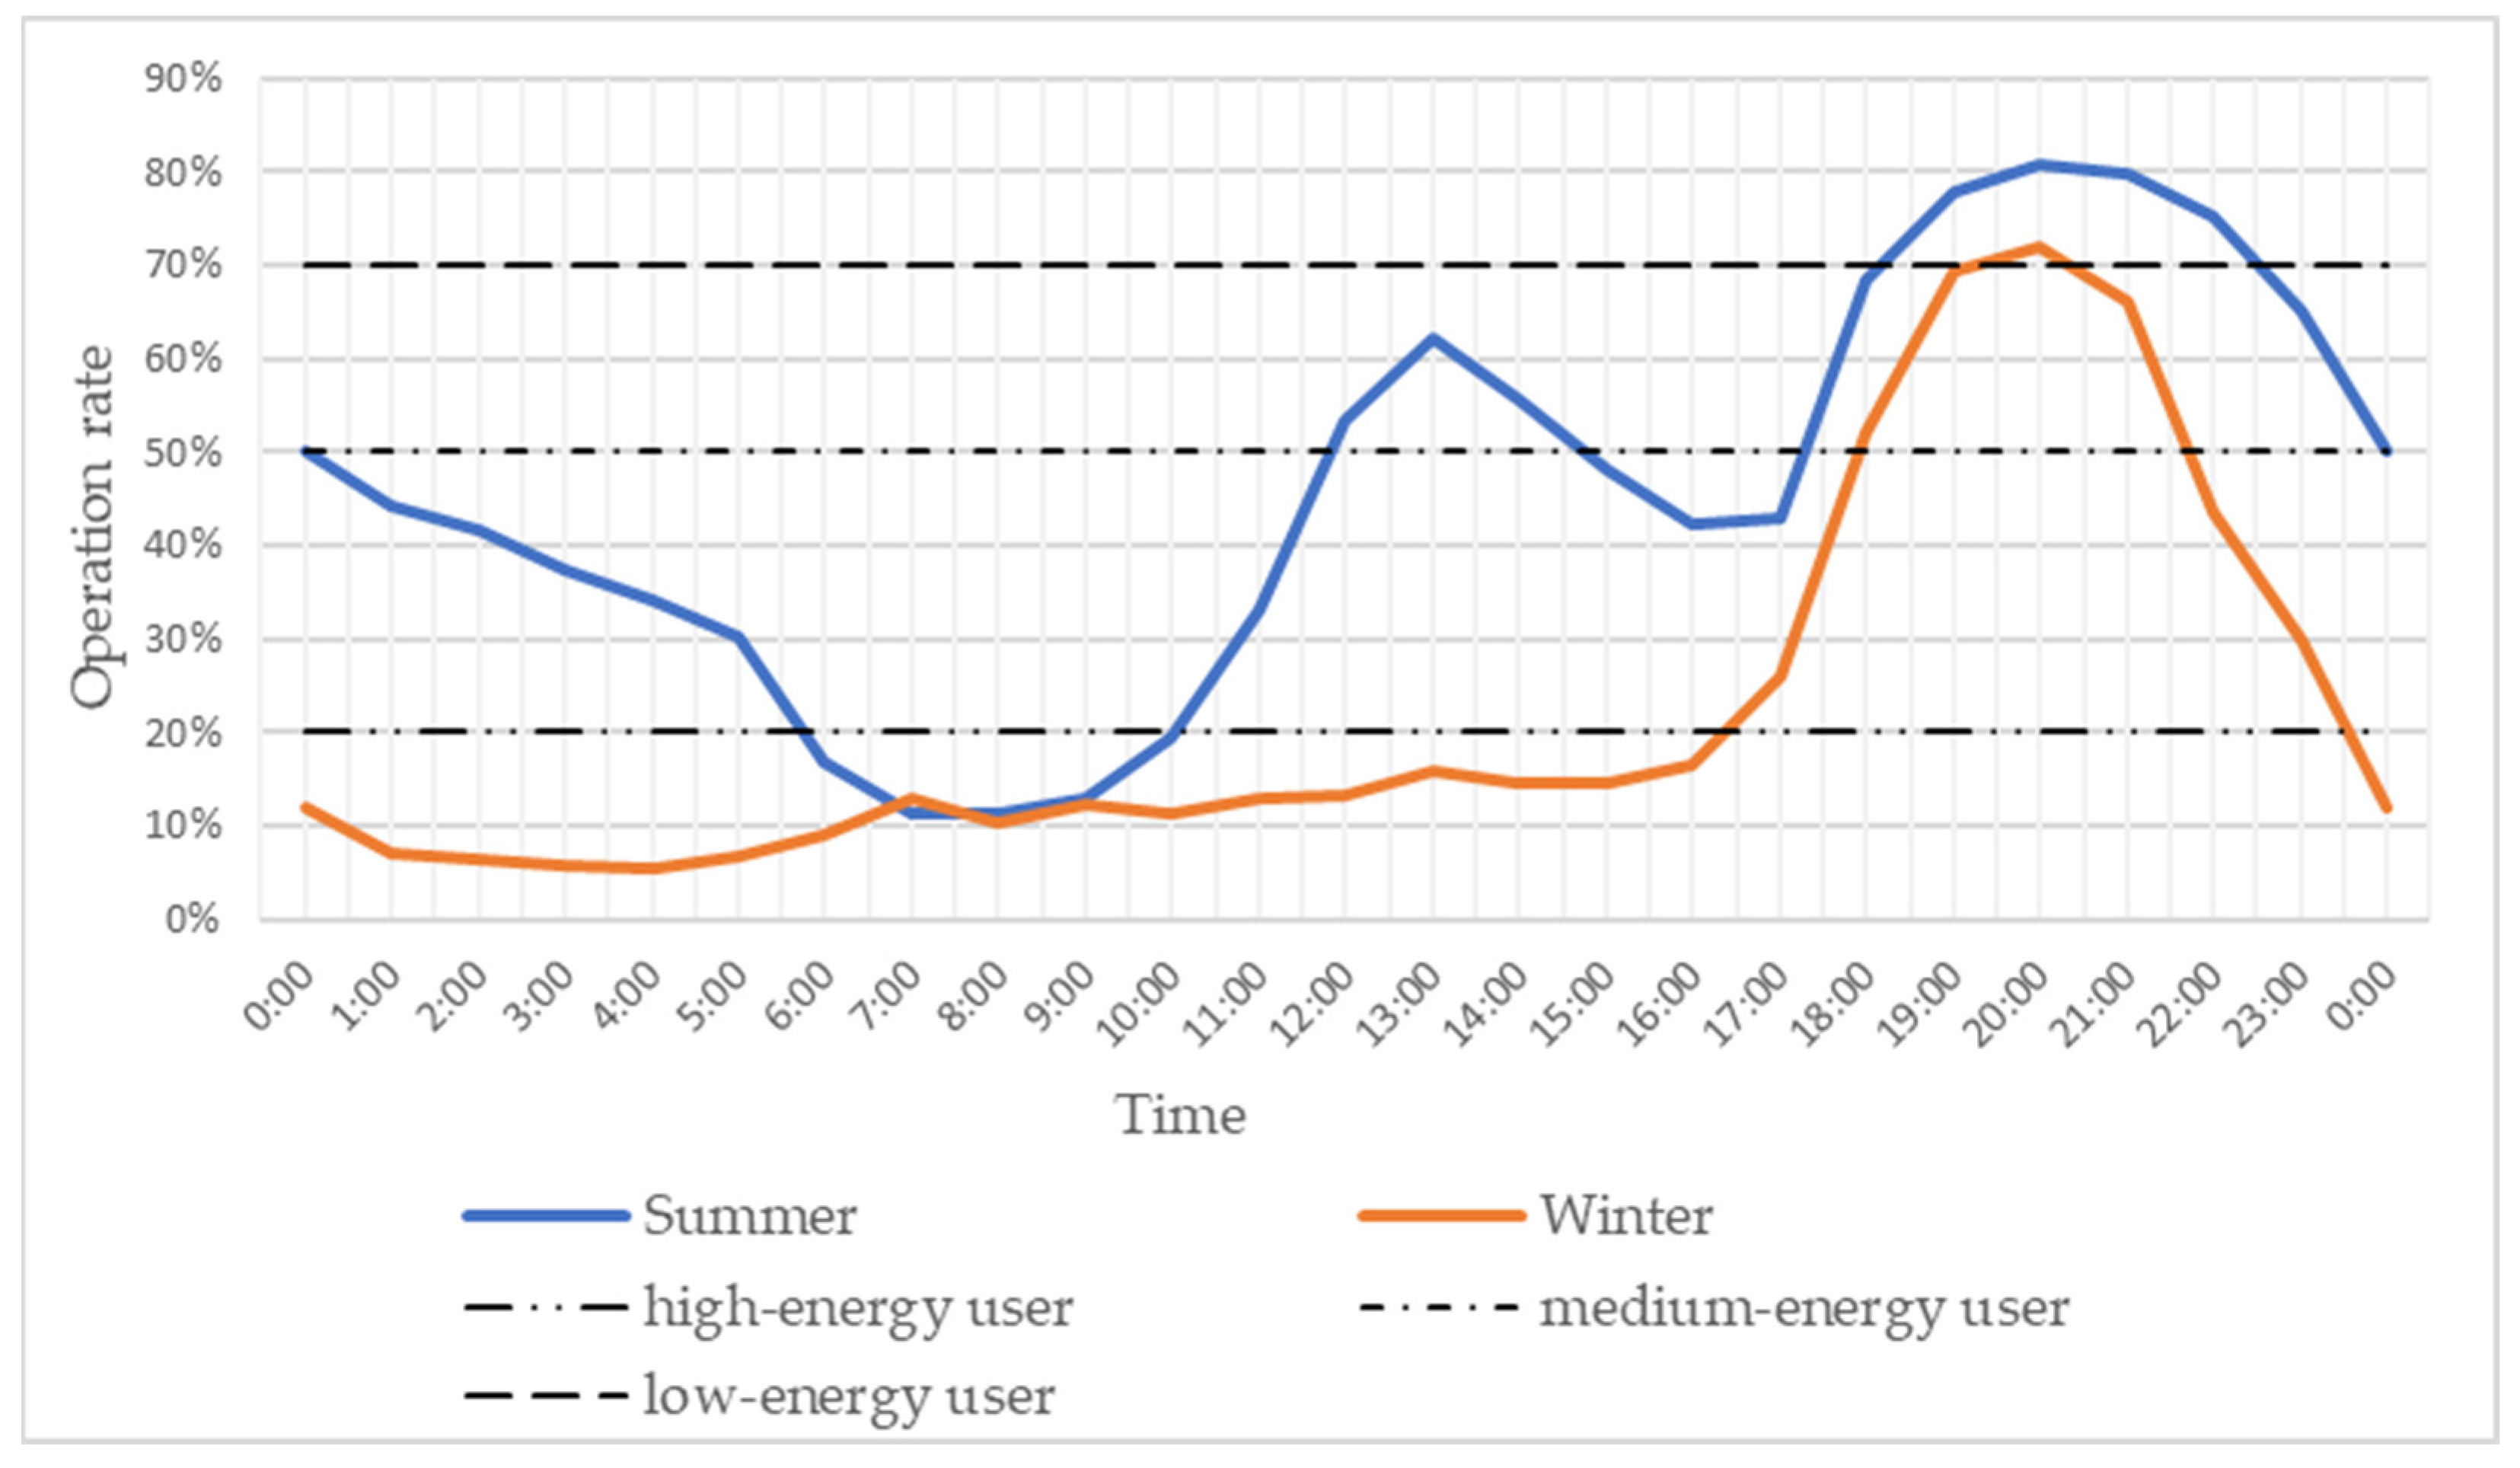
| 0:00 | 6:00 | 10:00 | 16:00 | 18:00 | 19:00 | 21:00 | 22:00 | 23:00 | 0:00 | Sum | |
|---|---|---|---|---|---|---|---|---|---|---|---|
| summer | low | Living room | Bedroom | 4 h | |||||||
| high | Bedroom | Living room | Bedroom | 20 h | |||||||
| winter | low | Living room | Bedroom | 4 h | |||||||
| high | Living room | Bedroom | 8h | ||||||||
| South Jiangsu Region | Utility se Per Conditioned Floor Area [kWh/m2] | Total Site Energy per Total Building Area [kWh/m2] | |||
|---|---|---|---|---|---|
| Heating Demand | Cooling Demand | Total Energy Demand per Conditioned Area | |||
| Multi-Danyuan apartment | Low-energy user | 39.62 | 23.70 | 100.81 | 74.08 |
| high-energy user | 72.86 | 39.18 | 149.52 | 109.88 | |
| Single-Danyuan apartment | Low-energy user | 37.30 | 29.40 | 91.70 | 72.80 |
| high-energy user | 77.25 | 43.77 | 146.02 | 115.93 | |
| North Jiangsu Region | Utility se Per Conditioned Floor Area [kWh/m2] | Total Site Energy per Total Building Area [kWh/m2] | |||
|---|---|---|---|---|---|
| Heating Demand | Cooling Demand | Total Energy Demand per Conditioned Area | |||
| Multi-Danyuan apartment | Low-energy user | 42.96 | 19.05 | 99.49 | 73.11 |
| high-energy user | 85.3 | 32.73 | 155.52 | 114.28 | |
| Single-Danyuan apartment | Low-energy user | 41.35 | 23.12 | 89.46 | 71.03 |
| high-energy user | 92.7 | 35.68 | 153.37 | 121.77 | |
| Energy Demand Reduction (%) | Retrofit Configuration Code Name | Heating Reduction | Cooling Reduction | Total Reduction | |||
|---|---|---|---|---|---|---|---|
| Multi | Single | Multi | Single | Multi | Single | ||
| Original | pre-retrofit | - | - | - | - | - | - |
| wall | WallSce_1 | 7.48% | 10.60% | 4.59% | 7.38% | 4.85% | 7.82% |
| WallSce_2 | 9.51% | 13.59% | 5.54% | 8.98% | 6.08% | 9.89% | |
| WallSce_3 | 10.50% | 15.08% | 6.00% | 9.80% | 6.68% | 10.92% | |
| roof | RoofSce_1 | 7.14% | 6.77% | 7.02% | 7.97% | 5.31% | 5.98% |
| RoofSce_2 | 8.03% | 7.64% | 7.63% | 8.73% | 5.92% | 6.67% | |
| RoofSce_3 | 8.48% | 8.08% | 7.94% | 9.09% | 6.22% | 7.00% | |
| window | Win Dbl | 1.67% | 1.20% | 4.06% | 2.83% | 1.88% | 1.49% |
| Win_Dbl low-E | 2.29% | 1.67% | 5.54% | 3.91% | 2.57% | 2.06% | |
| Win_Trp low-E | 4.10% | 3.02% | 6.53% | 4.66% | 3.71% | 3.00% | |
| air infiltration | 1.0 ACH | 8.83% | 8.78% | 6.18% | 6.79% | 5.92% | 6.68% |
| 0.5 ACH | 17.94% | 17.90% | 14.22% | 16.08% | 12.47% | 14.30% | |
| external wall façade reflectivity | Ref_0.2 | 0.00% | 0.00% | 0.00% | 0.00% | 0.00% | 0.00% |
| south window overhang | Ref_0.8 | −2.55% | −1.13% | 5.90% | 1.96% | 0.30% | 0.00% |
| staircase enclosure | closed | 2.92% | 3.91% | −0.05% | 0.00% | 2.07% | 2.07% |
| China Standard | UK Standard | Germany Standard | |
|---|---|---|---|
| Retrofit Component | SCE_1_CN | SCE_2_UK | SCE_3_GER |
| Wall U-value [W/m2K] | 0.695 | 0.440 | 0.322 |
| Roof U-value [W/m2K] | 0.598 | 0.383 | 0.282 |
| Window U-value [W/m2K] | 2.9 | 2.0 | 0.8 |
| Window SHGC | 0.67 | 0.62 | 0.58 |
| Air infiltration | 1.5 ACH | 1.0 ACH | 0.5 ACH |
| External wall façade reflectivity | 0.8 | 0.8 | 0.8 |
| South window overhang | none | none | none |
| Staircase enclosure | closed | closed | closed |
| Retrofit Component | Multi-Danyuan Apartment | Single-Danyuan Apartment | ||||
|---|---|---|---|---|---|---|
| SCE_4_BT | SCE_5_BH | SCE_6_BC | SCE_4_BT | SCE_5_BH | SCE_6_BC | |
| Wall U-value [W/m2K] | 0.322 | 0.322 | 0.322 | 0.322 | 0.322 | 0.322 |
| Roof U-value [W/m2K] | 0.282 | 0.282 | 0.282 | 0.282 | 0.282 | 0.282 |
| Window U-value [W/m2K] | 0.80 | 0.80 | 0.80 | 0.80 | 0.80 | 0.80 |
| Window SHGC | 0.58 | 0.58 | 0.58 | 0.58 | 0.58 | 0.58 |
| Air infiltration | 0.5 ACH | 0.5 ACH | 0.5 ACH | 0.5 ACH | 0.5 ACH | 0.5 ACH |
| External wall façade reflectivity | 0.8 | 0.4 | 0.8 | 0.8 | 0.4 | 0.8 |
| South window overhang | 0.5 m | none | 0.5 m | none | none | 0.5 m |
| Staircase enclosure | closed | closed | semi-open | closed | closed | closed |
| Material Prices Estimation (RMB/m2) | Multi-Danyuan Apartment | Single-Danyuan Apartment |
|---|---|---|
| SCE_1_CN | 1095.10 | 1095.10 |
| SCE_2_UK | 1198.55 | 1198.55 |
| SCE_3_GER | 1427.00 | 1427.00 |
| SCE_4_BT | 1470.00 | 1427.00 |
| SCE_5_BH | 1427.00 | 1427.00 |
| SCE_6_BC | 1220.00 | 1470.00 |
| Total Site Energy per Total Building Area [kWh/m2] | ||||
|---|---|---|---|---|
| Multi-Danyuan Apartment | Low-Energy | High-Energy | ||
| South | North | South | North | |
| Pre-retrofit | 74.08 | 73.11 | 109.88 | 114.28 |
| SCE_1_CN | 65.63 | 64.70 | 84.36 | 84.93 |
| SCE_2_UK | 59.44 | 58.77 | 70.07 | 69.78 |
| SCE_3_GER | 57.22 | 56.34 | 65.26 | 64.37 |
| SCE_4_BT | 56.85 | 56.00 | 64.62 | 63.77 |
| SCE_5_BH | 57.35 | 56.47 | 65.47 | 64.60 |
| SCE_6_BC | 59.07 | 58.57 | 69.15 | 69.25 |
| Total Site Energy per Total Building Area [kWh/m2] | ||||
|---|---|---|---|---|
| Single-Danyuan Apartment | Low-Energy | High-Energy | ||
| South | North | South | North | |
| Pre-retrofit | 72.8 | 71.03 | 115.93 | 121.77 |
| SCE_1_CN | 61.35 | 59.82 | 82.4 | 83.67 |
| SCE_2_UK | 52.67 | 51.98 | 63.76 | 64.15 |
| SCE_3_GER | 49.96 | 49.10 | 58.18 | 57.95 |
| SCE_4_BT | 50.17 | 49.33 | 58.53 | 58.33 |
| SCE_5_BH | 49.97 | 49.14 | 58.18 | 58.02 |
| SCE_6_BC | 72.8 | 71.03 | 115.93 | 121.77 |
| Pre-Retrofit | SCE_1_CN | SCE_2_UK | SCE_3_GER | SCE_4_BT | SCE_5_BH | SCE_6_BC | |
|---|---|---|---|---|---|---|---|
| Multi-Danyuan Apartment South | 1254 (100%) | 1139 (−9.2%) | 884 (−29.5%) | 706 (−43.7%) | 896 (−28.5%) | 834 (−33.5%) | 1130 (−9.9%) |
| Multi-Danyuan Apartment North | 1141 (100%) | 1022 (−10.4%) | 697 (−38.9%) | 505 (−55.7%) | 760 (−33.3%) | 587 (−48.5%) | 1021 (−10.4%) |
| Single-Danyuan Apartment South | 1486 (100%) | 1351 (−9.1%) | 1144 (−23.0%) | 1000 (−32.7%) | 1000 (−32.7%) | 937 (−36.9%) | 1104 (−25.7%) |
| Single-Danyuan Apartment North | 1268 (100%) | 1220 (−3.8%) | 1008 (−20.5%) | 827 (−34.8%) | 827 (−34.8%) | 750 (−40.6%) | 984 (−22.4%) |
Disclaimer/Publisher’s Note: The statements, opinions and data contained in all publications are solely those of the individual author(s) and contributor(s) and not of MDPI and/or the editor(s). MDPI and/or the editor(s) disclaim responsibility for any injury to people or property resulting from any ideas, methods, instructions or products referred to in the content. |
© 2024 by the authors. Licensee MDPI, Basel, Switzerland. This article is an open access article distributed under the terms and conditions of the Creative Commons Attribution (CC BY) license (https://creativecommons.org/licenses/by/4.0/).
Share and Cite
Chen, X.; Cimillo, M.; Chow, D.; Chen, B. Assessing the Energy Performance and Retrofit Potential of the 1980–1990s’ Residential Building Stock in China’s Jiangsu Province: A Simulation-Based Study. Energies 2024, 17, 1260. https://doi.org/10.3390/en17051260
Chen X, Cimillo M, Chow D, Chen B. Assessing the Energy Performance and Retrofit Potential of the 1980–1990s’ Residential Building Stock in China’s Jiangsu Province: A Simulation-Based Study. Energies. 2024; 17(5):1260. https://doi.org/10.3390/en17051260
Chicago/Turabian StyleChen, Xi, Marco Cimillo, David Chow, and Bing Chen. 2024. "Assessing the Energy Performance and Retrofit Potential of the 1980–1990s’ Residential Building Stock in China’s Jiangsu Province: A Simulation-Based Study" Energies 17, no. 5: 1260. https://doi.org/10.3390/en17051260