
Empowering Energy Communities through Geothermal Systems
by
 , and
, and
Vittoria Battaglia
1,
Francesca Ceglia
2,
Davide Maria Laudiero
1,*,
Alessandro Maione
1,
Elisa Marrasso
2 and
Laura Vanoli
1 1
Department of Engineering, University of Naples Parthenope, 80143 Naples, Italy
2
Department of Engineering, University of Sannio, 82100 Benevento, Italy
*
Author to whom correspondence should be addressed.
Energies 2024, 17(5), 1248; https://doi.org/10.3390/en17051248
Submission received: 17 January 2024
/
Revised: 10 February 2024
/
Accepted: 21 February 2024
/
Published: 6 March 2024
(This article belongs to the Special Issue Advanced Energy Generation Systems for Sustainable Development)
Abstract
:The Renewable Energy Directive II introduces renewable energy communities, enhancing energy sharing. However, many existing initiatives, focussing only on electricity, overlook the substantial energy demand in building sector comprising residential and commercial spaces. Energy communities in this sector can leverage district heating and cooling technology for thermal energy sharing, contributing to carbon neutrality by enhancing efficiency and reducing primary energy usage. Advanced strategies such as integrating renewables into heating and cooling grids, sector coupling, and utilising waste heat are key in moving away from fossil fuels. The Campania Region (Italy), abundant in geothermal energy potential, chose a district in which to implement the GeoGRID system. This innovative setup combines a four-pipe district heating and cooling network with an Organic Rankine Cycle plant, tapping into geothermal energy from the Solfatara area. The geothermal fluid’s heat feeds the ORC evaporator and then powers the thermal network, allowing direct heating and domestic hot water supply during winter. A thorough techno-economic analysis assessed the energy potential extractable from the geothermal fluid. Crucial aspects of this study are the evaluation of the energy and environmental efficiency of the system within the renewable energy community framework. Additionally, the paper introduces a methodology applicable for assessing geothermal energy communities on a global scale.
1. Introduction
In 2019, the civil sector contributed to approximately 36% of total world greenhouse gas emissions due to energy consumption [1]. Efforts toward decarbonisation have primarily been steered by the Energy Performance Building Directive [2]. Additionally, the Renewable Energy Directive (RED II) [3] introduced the concept of Renewable Energy Communities (RECs), allowing user aggregation to share energy loads and utilise renewable energy sources (RESs) from local available resources. Numerous studies have examined the multifaceted benefits of energy communities, spanning energy, socioeconomic, and environmental aspects. For instance, a study [4] focusing on a community in Southern Italy, comprising three residential users utilising photovoltaic systems, revealed substantial advantages. This energy community configuration enabled a 61% reduction in primary energy usage compared to a scenario without REC, along with a 64% decrease in CO2 emissions. Moreover, it significantly alleviated energy poverty conditions for the involved families, reducing it by approximately 16%. Another study [5] explored the benefits of collective energy production through shared photovoltaic (PV) facilities in Southern France. A comparison between scenarios—one where seven consumers operated as individual PV prosumers and another implementing a collective system—underscored the necessity for new models to optimise distributed energy in energy community projects. Furthermore, a REC analysed in [6], comprising four residential members with different capacities of PV plants, exhibited optimisation when the electricity was used to recharge electric vehicles. A comprehensive review [7] identified key success factors for energy communities, emphasising the use of programmable RES or hybrid systems, engaging various user types, integrating thermal and electric energy sharing, and outlining a robust business plan as fundamental for constructing efficient energy communities. An example of energy management and optimization of RES integration for office buildings is provided in ref. [8].
As well as the use of RES, another pathway for decarbonisation is through energy efficiency measures.
District heating and cooling (DHC) systems are considered energy-efficient solutions for decarbonising the civil sector for several reasons [9]. DHC systems involve a centralised production of heating or cooling energy, allowing for more efficient energy generation and often using more efficient technologies (such as combined heat and power plants or renewable energy sources) that can be optimized for large-scale operation and benefit from economies of scale. This is due to their more efficient operation and maintenance of equipment, reducing overall costs per unit of energy delivered to end-users. The new generation of DHC systems deliver heat to low-energy buildings while minimizing grid losses, incorporating low-temperature heat sources within smart energy systems [10,11]. Volkova et al. [12] used multi-criteria analysis to quantify the main identified barriers and drivers behind the implementation of the fifth generation of district heating and cooling systems. These systems often make use of waste heat from various sources, such as industrial processes or power generation, that would otherwise be released into the environment. DHC systems can easily integrate renewable energy sources like geothermal, solar thermal, or biomass, which might not be feasible or as efficient on a smaller scale.
For this reason, whenever possible, medium-enthalpy geothermal energy for DHC is an excellent solution because it combines the use of RES and the efficiency of a ‘democratic’ technology, and avoids modifying existing heating systems. The use of geothermal energy entails the consideration of a range of technical and socio-economic management factors [13], especially if coupled with an ORC power plant.
Several studies emphasize the efficiency, versatility, and environmental benefits of integrating geothermal energy into district heating and cooling systems. District heating and cooling networks (DHCNs) are highlighted as mature, environmentally friendly solutions for the building sector’s thermal energy demands, especially when coupled with low-medium temperature renewable energy sources like geothermal energy.
Santamarta et al. [14] examined nine touristic infrastructures in the Canary Islands that transitioned from traditional heat production systems to shallow geothermal energy systems. The findings highlighted the techno-economic and environmental benefits of these systems, especially on volcanic islands with high heating and cooling demands. Abugabbara et al. [15] modelled the first Swedish district system with simultaneous heating and cooling demands and bidirectional energy flows. The simulation results underscored several advantages of integrating district heating and cooling with heat pump technologies. Romanov et al. [16] investigated multi-faceted geothermal systems in the context of building sector development and DHC. These systems are versatile due to the varying temperatures at different depths, enabling them to meet diverse needs for district heating, cooling, and building requirements. Ghiasirad et al. [17] developed a thermo-economic assessment of a geothermal-based system that combines cooling, heating, and power, integrated with a humidification–dehumidification desalination unit and an absorption heat transformer. Carotenuto et al. [18] implemented a novel solution for district heating and cooling, integrating geothermal, solar, and biomass energy sources. This study also employed dynamic simulations to assess system performance. Patureau et al. [19] presented a typology for assessing the potential development of district heating and cooling networks in France. Naples geothermal energy district potential has been investigated in [20]; the study defined a geothermal energy district to supply heating, cooling, and hot water to 90 buildings using a DHCN. It resulted in a reduction in CO2 emissions of 5490 tons per year, with a mean thermal power from the ground of about 4.5 MW.
Moreover, the potential of geothermal-based systems to reduce CO2 emissions, achieving energy self-sufficiency and providing economically viable solutions for community-scale systems, can be associated with poli-generation technologies. For instance, a recent study presents the numerical solution of the thermal field of geothermal coaxial probes coupled with the surrounding soil, demonstrating the feasibility of converting these probes for efficient heat transfer in geothermal plants [21].
Calise et al. [22] analysed an ORC with 6 kW nominal electric power, a 17 kW absorption chiller, a biomass heater, and a 45.56 kWh lithium-ion storage system. The system, powered by a 96 °C geothermal well and a solar field in Campi Flegrei (Naples), achieved 94.54% primary energy saving and a 97.36% reduction in CO2 emissions. However, the high capital cost led to a 16.7-year payback period. The Pantelleria case study was analysed in [23], wherein a geothermal energy community was involved in the thermal drying of wastewater sludge and electricity supply using an ORC. The system demonstrated economic profitability with an 8.34-year payback period.
This study focuses on the design and simulation of a geothermal-based energy community in the Pisciarelli district of Pozzuoli, located in the geothermal area of Phlegraean Fields, South Italy, and including an economic analysis based on energy incentives. The community is composed of existing buildings in Pisciarelli and uses geothermal energy from two extraction wells, with a temperature of approximately 145 °C and varying geothermal gradients (0.12 to 2.9 °C/m). An Organic Rankine Cycle (ORC) module is employed to generate electricity from the geothermal source for multiple users. The geothermal fluid is also used in a DHCN for producing hot water, supplying space heating, cooling, and domestic needs in a cascading application. The plant system was simulated in the TRNSYS [24] environment, with the ORC module developed using AspenEDR and AspenONE [25]. Building models were defined using TRNbuild 18 and EdilClima v.6 [26].
The study claims novelty in assessing combined thermal and energy sharing in a REC using geothermal energy. The main novelties of this work with respect to the available literature can be resumed as follows:
- The definition of a community based on thermal (cooling/heating and domestic hot water) and electric sharing composed of different user sectors;
- The use of economic analysis according to REDII and its Italian transposition for an electric and thermal REC;
- The modelling of existing buildings using real data from audit and simulations in order to characterise the energy loads of REC;
- The use of real data related to the geothermal wells;
- The energy index definition used to evaluate the benefits of a geothermal-based community.
Such an application is suitable for sites that show a geothermal interest, with geothermal fluid availability in the temperature range of about 90–240 °C. These areas cover different zones of the world with geothermal sources at different temperatures, as highlighted in Table 1.
2. Methods
In this section, the methodology used to evaluate the energy, environmental, and economic performances of the energy community will be described according to literature [4,20]. The following analysis will be conducted with reference to the system described in Section 3 and it refers to electricity sharing according to the energy directive in Italy for RECs. This section is split into three subsections, the first one for energy analysis, the second one for the environmental methodology of analysis, and the last one for definition of the socio-economic parameters of this work.
2.1. Buildings’ Energy Model
Electric load evaluation. Electric loads were assessed separately according to the intended use of the buildings. With regard to the evaluation of the electricity load of residential buildings, they have been simulated using the results provided by the CREST v.8 [32] simulation software. CREST is an application for simulating the electricity demand of domestic users developed by a research group at the University of Loughborough (UK), updated in 2016 to integrate simulations of electricity and thermal demand. The research group Industrial Technical Physics of the University of Sannio has carried out, using the CREST software, simulations of the load profile of 4 types of users, differentiating them according to the number and type of occupants:
- User 1: 2 working adults, 2 children of school age;
- User 2: 2 working adults, 1 child of school age, 1 elderly person;
- User 3: 2 retired elderly people;
- User 4: 2 working adults.
The electric load for the identified user types is reported in the following Section 3.1.
The electricity consumption of office buildings was assessed using actual data from the bills available.
Heating, DHW, and cooling loads evaluation. In this work, the analysis of the thermal and cooling loads of buildings was carried out using two different software programmes: EdilClima v.6 was used for the evaluation of residential buildings, while TRNBuild 18 was employed for the office buildings. The following sections provide detailed illustrations of the reference models adopted. For both uses, the modelling process takes into account the architectural plans and prospects of the buildings, available from the on-site measurements. To correctly assess the thermal load, it is necessary to define the thermophysical characteristics of the transparent and opaque building envelope. In Table 2, the main characteristics of the office building’s envelope are reported.
The climatic data considered for the simulations refer to the climatic year on an hourly basis developed by the “Italian Technical Committee” (CTI) in 2015. The respective monthly average values are contained in UNI 10349-1 [33]. In the evaluation, it was assumed that in the heating season the temperature of regulation was set to 20 °C during the hours of operation of the plant, and to 26 °C in the summer season.
For the calculation of the thermal energy demand for domestic hot water, a water consumption of 50 L/person per day was considered.
Below, we examine in detail and distinctly the two types of simulations (for residential buildings and office buildings):
- The dynamic hourly demand of residential buildings has been evaluated with the EdilClima v.6 software that uses the dynamic approach of the standard UNI EN ISO 52016-1 [34]. It includes simplified hourly dynamic calculation methods for assessing energy needs for heating and cooling, internal temperatures, and other relevant thermal parameters. At the beginning of the simulation the initial indoor temperature is equal to 20 °C. Weather-related parameters are chosen from an archive of hourly climatic data, including the hourly values of outdoor temperature, direct and diffuse solar irradiance, outdoor relative humidity, vapour pressure, and average wind speed (“Typical years” provided by Italian Technical Committee). Internal Heat Gains, such as occupants, lighting, appliances, and equipment, are assumed considering the standard ISO18523-1 [35]. Thermal Properties of the Building are chosen according to the Italian Minister’s Decreed ‘Minimal Requirements’ for new buildings. The method requires that the element class and the total thermal capacity of the structure, expressed in kJ/m2K, are defined for each opaque building component. Each element of the building envelope (opaque or transparent component) is discretised in a number of parallel layers separated by internal, external, and internal nodes from the building element. This method is detailed in Equations (1)–(5).
The method outputs, for each thermal zone and for each hour, the values of parameters such as air temperature , the average radiant temperature , the average operating temperature and the heating or cooling load . The thermal balance equation for a zone (ztc) is as follows:
The thermal balances of the building elements are carried out for each node. In particular, the balance equation for the internal surface node (pli = pln) is as follows:
For the external surface node (pli = 1), the energy balance equations is as follows:
The parameters of the equation are reported in Table 3.
An interference matrix will be constructed, with the number of rows and columns a function of the number of nodes in the structures. An matrix is then created, which is the unknown temperatures of the node and the vector of known terms .
- -
- To accurately assess the thermal loads of office buildings for both heating and cooling, a detailed simulation was conducted in the TRNBuild 18 environment through the multizone building model. This component model deals with the thermal balances of a building. The building model in Type 56 is a non-geometrical balance model with one air node per zone, representing the thermal capacity of the zone air volume and capacities that are closely connected, like furniture, with the air node. The existing transfer function method of the building model TYPE 56 for walls can be used for solving the one-dimensional heat conduction problem. The Transfer Function Method (TFM) in TRNSYS’s building model TYPE 56 is essential for simulating the thermal behaviour of buildings. TFM dynamically calculates heat transfer in buildings, modelling the response to indoor and outdoor temperature variations. It represents indoor temperature and heat flux as functions of past outdoor conditions and internal heat gains. TFM balances computational efficiency with accuracy by simplifying heat transfer into linear equations, making it suitable for detailed energy analysis. The boundary (like external weather, adjacent structures, ground conditions, and internal loads) and initial conditions (such as starting temperatures, HVAC system status, and moisture content) are defined by the user. The occupancy schedule of office rooms covers a range of 1–10 person from 7 a.m. to 8 p.m. In line with Italian regulations and the climatic region encompassing Naples, the heating period spans from 15 November to 31 March [36], while the cooling season is selected between 1 June and 30 September. The periods between these seasons (1 April–31 May and 1 October–14 November) do not demand space heating or cooling.
Energy analysis. The most important term of energy and economic analysis regards the definition of sharing energy as, in accordance with incentive directive, meaning the hourly minimum between the produced electricity put into the electric substation and the electricity taken from that as reported in Equation (6). This kind of evaluation allows for the measure of effective self-consumed onsite electricity by using virtual self-consumption. In addition, two fundamental parameters for a REC have been defined according to scientific literature [37]. The first index, “s”, calculates the amount of electricity demand from REC covered by the geothermal-based ORC plant and its electricity production (Equation (7)). The second index is named “d”, and it is the ratio between the geothermal self-consumed energy (that in accordance with the directive is the virtual sharing from the substation) with respect to the total amount of geothermal electricity produced in the layout (Equation (8)).
In the aforementioned equations, represents the net electricity produced by ORC plants and consumed on-site by REC, is the electricity requested by the community and is the total electricity produced by ORC plant. These indexes are referred only to electricity production because the system is calibrated to supply all thermal energy required by community for heating, cooling, and DHW demands. The proposed system is also compared with a traditional system that consists of an electricity grid connection to supply the electric pure energy loads and cooling load due to electric air-to-air heat pumps and a traditional natural gas boiler for heating and DHW. The reduced primary energy or primary energy saving (PES) is calculated as reported in Equation (9), where is the primary energy associated with the traditional system and is the primary energy associated with the geothermal REC community.
In Equations (5) and (6) the primary energy of each configuration is reported.
where and are the electricity taken from the grid in the TS and REC configuration. is the average yearly efficiency of PG fixed to 0.781, considering that the electric efficiency that does not account for the primary energy request for RES, and to 0.495, considering the average annual values of efficiency indicators [38]. This indicator refers to the Italian electricity production mix, including fossil fuels and RESs. is the thermal energy demand of TS and is the fixed value of gas-boiler efficiency of TS equal to 0.90. The Equation (11) for the primary energy associated to thermal load is not evaluated because in the geothermal-based system it is completely produced by a geothermal plant. In addition, these equations are implemented with a time step of one hour according to the technical regulation of the REC incentive definition by GSE.
2.2. Environmental Analysis
The amount of reduced CO2 has been calculated by the following formulation:
where is the total demand for electricity from buildings, FEE is the electricity emission factor linked to the national grid, and represents the amount of electricity purchased from the grid in case the system is not able to provide it. In order to obtain a dynamic analysis on an hourly basis for environmental analysis, the hourly emission factors for electricity grid emissions have been considered for Italy using the analysed data of a previous study [38]. The electricity emission has been evaluated in REC only for the share of electric energy taken from national power grid, while for the condition under which all electric load is satisfied by the geothermal plant, FEE is assumed equal to zero.
2.3. Socio-Economic Plan Analysis for Electric Sharing
Economic analysis has been realised in order to carry out the Simple Payback Period (SPB) associated with electricity sharing. According to the Italian transposition of REDII, only electricity self-consumption has been considered for REC incentive. By evaluating the SPB, the number of years needed to balance the initial investment cost associated with the ORC plant (ZTOT), including ORC module, hydronic pumps, DHCN, thermal substation, geothermal heat exchanger, and well costs, can be evaluated by considering the REC condition and not-REC condition. The sum of the annual electric cash (Fk,El) flows under traditional and REC conditions has been calculated by including the operating and maintenance cost of REC.
Considering cash flows as constant every year, the SPB is defined as:
where the is the difference between the cash flow referring to the k-th year (Fk) for TS and REC. This can be defined for one year as reported in following equation:
where:
- -
- OCEl represents the operating cost associated with yearly electricity demand;
- -
- CO&M includes the maintenance and management costs of plants, including the software for REC management and two employed persons for technical staff. This parameter is null under TS conditions.
For economic analysis, the yearly operating cost (OC) is calculated for each configuration as reported in Equations (15) and (16). In detail, for TS the electricity cost is associated with the entire electricity demand of the community; otherwise, for REC conditions, the operating cost of electricity considers the cash outflow for electricity taken from PG, the cash inflow for the sharing energy incentive, and the cash inflow for electric energy sold to PG. In these equations related to operating cost, the positive income is assumed to be less.
where and are the yearly operating cost for each layout for electricity. is the electricity unitary price referring to the grid electricity network. The is the economic incentive for electricity self-consumption in the REC layout. is the electricity sold to the electricity grid and is the unitary electricity price for sold energy.
The evaluation of is reported in Equation (17) as the sum of technical staff cost, maintenance plant component cost, and REC management software platform cost.
Finally, SPB is defined as follows by supposing that the investment cost of the plant is managed by the REC organization:
In this study, an additional socio-economic evaluation will be conducted according to innovative literature studies that consider the possibility of REC development in order to mitigate the energy poverty conditions in a popular energy district [4]. For this reason, an analysis of the energy poverty conditions of the citizens who occupy the five residential buildings is proposed. According to literature study, the most widespread social index used to perform an analysis on energy poverty is a “10%” indicator that evaluates the ratio between the global energy cost for a family based on the yearly and overall family income [39]. This index defines that if the ratio is equal to or higher than 0.10, the family is in a condition of energy poverty. In this study, only the electricity consumption of families is considered because the eventuality of thermal energy sharing is not considered for the shared energy incentive. For this reason, gas consumption is neglected by assuming that the main aim of this study is to evaluate the reduction of this index in passing from traditional simple users to community members. The energy poverty index (EPI) is calculated as reported in Equation (19) by considering the yearly electricity operating cost of a typical residential user () with respect to his family’s income (.
3. Case Study
In this section the case study is presented, describing the geothermal site, the buildings of the district considered in the analysis, and the plant configuration modelled.
3.1. Geothermal Area
The case study under examination proposes a sustainable approach to harness low and medium enthalpy geothermal energy. The innovative system design not only aims to optimise the utilisation of geothermal resources in the area, but also seeks to integrate seamlessly with the local environment and community, underscoring a commitment to both sustainability and regional development. The location of Pozzuoli, Naples (in the south of Italy) is one site of high geothermal source interest. As reported in Figure 1, the zone is near to more pre-existing and unused geothermal wells in Campi Flegrei.
3.2. Building and User Description
In this work, a multi-purpose energy community composed of eight buildings is investigated. Three of them are used for office activities and are located in the Pisciarelli district Via Antiniana, as reported in Figure 2. For these users, the electricity bill data are available and an energy audit has been carried out.
The three office buildings (buildings F, G, I) are equipped with a range of 3–8 floors with a total area of about 27,000 m2. The office buildings are characterised by 124 thermal zones (50 for building G, 34 for building I, and 40 for building F) including unconditioned zones, such as flights of stairs and elevators. The height of each floor is equal to 2.8 m for the basement floor and 3 m for other floors in building G; equal to 2.3 m for the basement floor and 3 m for other floors in building I; and equal throughout to 3 m in building F.
With regard to the electric energy consumption of office buildings evaluated by using real bill data, it is reported hourly for a typical winter day in Figure 3.
With regard to the electricity load of residential buildings, the electric load of a typical winter day for the residential user type is detailed in the Section 4, distinguishing between the week and weekend days (Figure 4).
Below an energy model of the building is shown in Figure 5.
3.3. System Configuration and Components
The proposed system (Figure 6) comprises an ORC, the combined production of electric energy, and a grid for the distribution of cooling and thermal energy. The geothermal- ORC system is a sophisticated and integrated energy solution. It primarily serves the REC by meeting its electricity demands. The system works in a cascade, wherein it generates electricity and supports a district heating network. This network provides heating, cooling, and domestic hot water to eight buildings.
In this setup, a small portion of the generated electricity is utilised for the self-consumption of the network’s auxiliary components. The process begins with the extraction of geothermal fluid. This fluid first passes through a heat exchanger that supplies the ORC system. The ORC system, with its nominal electric power capacity of 500 kW, converts thermal energy into electricity.
Following this, a second heat exchanger comes into play. It takes the residual heat from the geothermal fluid to feed the thermal network. This network is responsible for district heating, providing essential services such as heating, cooling, and hot water.
Additionally, the system includes an absorption chiller. This component is crucial for producing cooling energy, complementing the heating and hot water supply. The infrastructure supporting this integrated system includes a dedicated pipeline, extending to 1.6 km, along with substations for each of the eight buildings. Each substation houses three heat exchangers and fan coils, which are distributed across various thermal zones within the buildings.
The first well is used to withdraw the geothermal fluid, which is at a temperature of 145 °C and has a mass flow rate of 59 kg/s (Table 4). These values have been chosen based on real data collected through the investigations conducted on site. The geothermal fluid is sent, through a pump, to the evaporator of the ORC. The evaporator, customised for the designed configuration, exchanges a thermal power of 5 MW, resulting in the conversion efficiency of the ORC system being equal to almost 10%. ORC turbogenerators use a closed-cycle organic fluid (R245fa) instead of steam to move the turbines: the organic fluid is evaporated thanks to the heat coming from the geothermal fluid; the organic fluid vaporises, expands, and feeds the turbine, which produces electrical energy as it is coupled to an electrical generator. Then, the fluid circulates through a regenerator and a condenser connected to an evaporative tower. The cooled organic working fluid then restarts the cycle.
Once the geothermal fluid has passed through the evaporator of the customised ORC module, it has a temperature of 125 °C and reaches a second heat exchanger of 10 MW.
This second heat exchanger supplies the district thermal network and feeds both the absorber and the network: the working fluid enters the absorber at 95 °C and the temperature difference within the outlet is 10 °C, while on the district heating side there is an inlet temperature of 75 °C, with a temperature difference of about 5 °C.
The winter configuration allows the network to become part of a so-called fourth generation network, based on the temperature of the circulating fluid, and allows a reinjection into the well at a temperature of 115.7 °C. In the summer configuration, where the simultaneous supply of thermal energy must be guaranteed to produce domestic hot water through the district heating network and cooling energy through a dedicated network, the reinjection temperature of the geothermal fluid in the reinjection well is lower (104.2 °C) with a temperature difference of about 20 °C. The network configuration is based on a four-pipe system, two supply and two return for district heating and cooling, which extends for a total of 3.2 km. The entire system is designed to supply the thermal heating and cooling energy demand associated with all eight of the buildings.
Each building is equipped with a substation tailored to meet its specific energy requirements. The composition of each substation is as follows. It includes a heat exchanger for space heating, operational exclusively during the winter season, which spans from November 15th to March 15th. This aspect of the system is designed in compliance with Italian regulations, considering the climatic zone of the plant’s location. Additionally, there is a heat exchanger dedicated to supplying domestic hot water, which functions throughout the year without interruption. Lastly, there is a heat exchanger for space cooling, which is in use during the summer months, from June to September.
4. Results
The energy results include electricity and thermal energy information, while regarding the environmental and economic analysis only electricity will be involved according to the sharing directive. As a matter of fact, considering that the ORC has been sized to completely cover the thermal energy load of the community, the CO2 emission associated with heating, cooling, and domestic hot water is null. From the economic point of view, the investment costs associated with the district heating and cooling network and other auxiliaries have been included in global ORC plant cost.
4.1. Energy Results
Figure 7 and Figure 8 show the trends in heating, cooling, and domestic hot water requests, respectively, for an office-type building and for a residential building. For office buildings, the supply of domestic hot water through the network is not envisaged, while this request is present for residential buildings, as can be seen from the graph. The schedule is different for the two types of building: for the offices, the system is switched on during the week from 9:00 to 20:00, while it is switched off during the weekend; for residential buildings, the system is switched on from 14:00 to 20:00 during the week and from 9:00 to 20:00 during the weekend.
Table 5 reports the maximum thermal power demands for the heating and cooling of each building. The thermal power requirements of office and residential buildings with identical electric loads and occupancy schedules differ due to transmission losses through the building envelope, which are determined by external environmental factors (such as orientation to the sun) and the thermal conditions of neighbouring apartments. The reduction in primary energy for heating, cooling, and DHW amounts to 218 MWh per year for residential buildings and 185 MWh per year for offices.
The yearly electricity consumption is reported for each building in Table 6.
Considering the electric loads associated with lighting and electric appliances in the buildings (both residential and tertiary), the global electricity request by residential and tertiary buildings is equal to 3739 MWhEl/y, while it is 384 MWhEl/y for the electricity consumption of the heating and cooling network and plant. Without the REC configuration and in the absence of an ORC geothermal-based plant, this electricity would be bought entirely from the PG. In REC conditions, the electricity production from ORC is equal to 4380 MWhEl/y. Due to the high hourly production, it is not necessary to integrate electricity from the power grid during many hours of the year (4747 h on 8760). Otherwise, for 4015 h during the year, the REC gives the surplus of electricity to the PG (for a total value equal to 445.15 MWhEl/y). This condition is shown by the report on the main electricity vectors of REC in Figure 9 for the entire year by using monthly values.
The patterned blue and white area shows the shared energy, the yellow area reports the amount of electricity sold to PG, and the black line reports the ORC electricity production. The results highlight a higher share of energy integrated from PG during summer, when less electric energy is available from ORC due to higher self-consumption for auxiliaries of the district heating network in winter. In detail, the electricity demands for district heating network auxiliaries results in a mean equal to 75 kWh during winter hours and 150 kWh during summer hours.
By assuming an efficiency for the power grid that is variable hourly [38], the reduced primary energy results are equal to 6572 MWh/y and the equivalent PES results in an average yearly value equal to 82%. The index of self-consumption is expressed as the ratio between the ORC electricity consumed on-site and the total electricity request (d), and self-sufficiency (s) is expressed as the ratio between the ORC electricity consumed on-site and the total electricity produced, which are equal to 85% and 89%, respectively, on a yearly basis. The indexes assume different values during the year and their monthly variation is reported in Figure 10, according to shared electricity and electricity sold to PG.
During the winter period, self-sufficiency is higher than during summer and the amount of electricity sold to the grid assumes values higher than 40 MWh per month, while the self-consumption index is not higher than 85%. Otherwise, during summer values of d higher than 90% are obtained but self-sufficiency does not exceed 81%, resulting in lower levels of electricity selling (about 20 MWh per month).
4.2. Environmental Results
The environmental impact of CO2 emissions, linked to electricity consumption and the amounts of it taken from the PG, shows a reduction of 126.7 tCO2 by obtaining a mitigation of about 81% with respect to the traditional electricity total purchase from the PG. In Figure 11, the emissions for each month of simulated years have been reported by considering TS and REC combined with the emission factor monthly mean.
The maximum mean emission factor is equal to 457 gCO2/kWh and it is verified during October; in this month, the emission due to electricity consumption is equal to 142 tCO2 and 22.4 tCO2, respectively, for TS and REC conditions, showing a reduction of 84%. The highest percentage of avoided emission is verified during September (93%), during which the emission factor assumes a minimum and maximum, respectively, equal to 252 gCO2/kWh and 573 gCO2/kWh.
4.3. Economic Results
In order to realise the economic analysis about REC and the conditions in which it is possible, the discussion of results has been conducted by evaluation of electricity vectors. First of all, the parameters for economic analysis are listed in Table 7. For economic analysis of REC, three different electricity market scenarios have been considered as reported in the following bullet points:
- For the first case (C#1), and are fixed to 0.30 €/kWh by considering the electricity price from 2021, before the energetic conflict involving Ukraine and Russia, and 53.40 €/MWh, which corresponds to the minimum price at which the geothermal plant’s energy can be sold to the PG [47].
- For the second case (C#2), and are fixed to 0.39 €/kWh by considering an increment of 30% of unit electricity price after the energetic conflict and to 69.42 €/MWh, which corresponds to an increment of 30% with respect to the minimum price for geothermal energy to sell to the PG.
- For the third case (C#3), and are fixed to 0.48 €/kWh by considering an increment of 60% of unit electricity price after the energetic conflict and to 111.07 €/MWh, which corresponds to an increment of 60% with respect to the minimum price for geothermal energy sell to the PG.
According to the Italian transposition of REDII [48], the incentive associated with shared electricity produced by a RES-based plant of REC is considered fixed at 118 €/MWh. The investment cost is evaluated by considering literature and market data and, in particular, for ORC a unit cost of 3000 €/kW. Otherwise, the maintenance cost has an assumed value of 5% of investment cost per year. Additional investment costs involve the well cost, hydronic pump cost, geothermal heat exchanger cost, and district heating and cooling network cost.

| Symbol | Description | Unit | Value (C#1/C#2/C#3) |
|---|---|---|---|
| Unit price for electricity taken from PG | €/kWh | 0.30/0.39/0.48 | |
| Economic incentive for self-consumption REC | €/MWh | 118 | |
| Unit price for electricity sell to PG | €/MWh | 53.4/69.4/111 | |
| Economic cost for two workers on REC staff | k€/y | 64 | |
| Economic cost of ORC maintenance calculated as 5% of investment cost | k€/y | 75 | |
| Economic cost for management software for RECs | k€/y | 13 | |
| Operating cost for electricity for residential user | €/y | 1424 * | |
| Income for residential user | k€/y | 12 | |
| ZORC | Investment cost for ORC | k€ | 1500 |
| Zwells | Well investment cost | k€ | 130 |
| Zpumps | Hydronic pump investment cost | € | 3031 |
| ZGHEs | GHEs investment cost | k€ | 90.5 |
| ZDHN | DHN investment cost | k€ | 2275 |
| CM | Maintenance cost | k€/y | 199.7 |
* Calculated as a mean value of different residential user typologies.
In Table 8, the results of economic analysis are reported by considering for REC the income from the sharing incentive, selling to PG, and the purchase from PG as reported in the first, second, and third row, respectively. The sharing incentive income does not change with different electricity market conditions. The increment of income due to better selling conditions and the increasing of electricity purchase cost defines a global improvement on the operating cost of REC equal to 13% and 22%, respectively, for C#2 and C#3 with respect to C#1. This analysis shows that the impact of higher on global REC income varies from C#1 to C#2 and it does not have a linear behavior. The yearly reduced cost shows a reduction equal to 78%, 85%, and 89%, respectively, in C#1, C#2, and C#3, compared to the traditional system. These data highlight the fact that, for good self-consumption behaviour in the community, the conditions of the electricity market have a lower impact on economic balance. As the matter of fact, the SPB in C#1 assume a good value equal to 4 years that is reduced to 3 and 2 years in C#2 and C#3.
The monthly value of electricity cash flow is reported for the C#1 case in Figure 12. The electricity sharing allows for a monthly income, which includes the sharing incentive and income for electricity sold to the PG, for the community even higher than 85,000 € (green bars). The electricity cost for energy taken from the PG (orange bars) is higher during the winter period than in summer (for example, 13,922 € in January and 6223 € in August). The electricity sold to the PG (light green bars) assumes a lower value during the summer period due to lower available electricity from the ORC, depending on higher self-consumption of auxiliaries.
For the socio-economic analysis, a residential user family with a minimum income of 12,000 €/y is considered. The energy yearly electric load is equal to 4220 kWh/y, which represents 0.13% of global REC consumption and, assuming a democratic redistribution of REC income, it could be represent a share of family income from REC by excluding the operating and maintenance cost. The user spends 1266, 1688, and 2110 €/y, respectively, for C#1, C#2, and C#3 on the electricity bill, and he obtains (in the best case, with global income given to members) about 1237 €/y, 1580 €/y, and 1935 €/y for C#1, C#2, and C#3 that could be added to his personal income. The results show that the EPI suggests rapidly passing from TS to REC conditions as, as reported in Figure 13, a reduction equal to 9%, 12%, and 14%, respectively, for C#1, C#2, and C#3 is presented.
4.4. Additional Considerations
Considering that these case studies present a high share of produced electricity sold to the PG, the possibility of including 15 additional residential buildings has been considered in this study in order to improve the d index and also to reduce the SPB. Under these conditions, the global load amounts to 3782 MWhEl/y, and consequently the sharing energy in REC is equal to 3100 MWhEl/y, the energy sell to grid is equal to 402 MWhEl/y, and 758 MWhEl/y is taken from grid. In this way, the s index is equal to 87.8% as a mean yearly value, allowing for a complete RES covering many hours. The second index d presents a self-consumed energy equal to 86.6%, increasing the economic advantage from the REC incentive to share energy. The reduced CO2 emission amounts, under these conditions, to 84.8% and the time for investment recovery does not change.
5. Conclusions
In this study, an energy, environmental, and economic analysis of geothermal community has been defined according to the renewable energy community directive to evaluate the advantage of a shared energy system and the acceptability of RES plants.
The main findings are summarised in the following bullet points:
- For electricity consumption, the geogrid system allows for a reduction of 82% of primary energy;
- The index of self-consumption and self-sufficiency are equal to 85% and 89%, respectively;
- The SPB changes from four to two as a function of the market conditions;
- The environmental impact caused by the geogrid system allows for a reduction of 81.2% of CO2 emissions with respect to the traditional configuration for electricity that uses the Italian electricity mix to supply electric energy consumption and 100% of thermal energy.
Future studies should try to develop a strategy to evaluate the advantages of thermal sharing in a geothermal-based smart energy community.
Author Contributions
Conceptualization, L.V.; Methodology, F.C. and E.M.; Software, D.M.L.; Formal analysis, F.C., D.M.L. and A.M.; Writing—original draft, E.M.; Writing—review & editing, V.B.; Visualization, D.M.L.; Supervision, L.V.; Project administration, L.V. All authors have read and agreed to the published version of the manuscript.
Funding
The research has been partially funded by the “Geogrid–Tecnologie e sistemi innovativi per l’utilizzo sostenibile di energia geotermica”, CUP B43D18000230007, Distretti ad Alta Tecnologia, Aggregazioni e Laboratori Pubblico Privati per il rafforzamento del potenziale scientifico e tecnologico della Regione Campania concessione contributo, a titolo di aiuto ad hoc, DECRETO DI CONCESSIONE N. 29 del November 29, 2018, Giunta Regionale della Campania. The Authors also gratefully acknowledge the supporting funds by the following European Commission’s research program: H2020-SC5- 2020-2 scheme, Grant Agreement 101003491 (JUST2CE project). The APC was funded by Remo Santagata, Vanoli Laura and Vittoria Battaglia as Guest editor of the Special Issue “Energy Generation Systems for Sustainable Development”.
Data Availability Statement
Data will be available on request.
Conflicts of Interest
The authors declare no conflict of interest.
Abbreviations
| ORC | Organic Rankine Cycle |
| RES | Renewable Energy Source |
| RED | Renewable Energy Directive |
| IEMD | Internal Electricity Market Directive |
| REC | Renewable Energy Community |
| CEC | Citizen Energy Community |
| DHC | District Heating and Cooling |
| DHCN | District Heating and Cooling Network |
| DHW | Domestic Hot Water |
| EPI | Energy Poverty Index |
| HHD | Heating Degree Days |
| PG | Power Grid |
References
- International Energy Agency. Energy Efficiency 2020; IEA: Paris, France, 2020. [Google Scholar]
- Energy Performance of Buildings Directive EU/2010/31. Off. J. Eur. Union 2010, 13–153.
- European Parliament Directive (EU) 2018/2001 of the European Parliament and of the Council of 11 December 2018 on the Promotion of the Use of Energy from Renewable Sources (Recast). Off. J. Eur. Union 2018, 2018, 82–209.
- Ceglia, F.; Marrasso, E.; Samanta, S.; Sasso, M. Addressing Energy Poverty in the Energy Community: Assessment of Energy, Environmental, Economic, and Social Benefits for an Italian Residential Case Study. Sustainability 2022, 14, 15077. [Google Scholar] [CrossRef]
- Plaza, C.; Gil, J.; De Chezelles, F.; Strang, K.A. Distributed Solar Self-Consumption and Blockchain Solar Energy Exchanges on the Public Grid Within an Energy Community. In Proceedings of the 2018 IEEE International Conference on Environment and Electrical Engineering and 2018 IEEE Industrial and Commercial Power Systems Europe (EEEIC/I&CPS Europe), Palermo, Italy, 12–15 June 2018. [Google Scholar]
- Barone, G.; Brusco, G.; Menniti, D.; Pinnarelli, A.; Polizzi, G.; Sorrentino, N.; Vizza, P.; Burgio, A. How Smart Metering and Smart Charging May Help a Local Energy Community in Collective Self-Consumption in Presence of Electric Vehicles. Energies 2020, 13, 4163. [Google Scholar] [CrossRef]
- Ceglia, F.; Marrasso, E.; Pallotta, G.; Roselli, C.; Sasso, M. The State of the Art of Smart Energy Communities: A Systematic Review of Strengths and Limits. Energies 2022, 15, 3462. [Google Scholar] [CrossRef]
- Stochastic and Distributed Optimal Energy Management of Active Distribution Network with Integrated Office Buildings. CSEE J. Power Energy Syst. 2022. [CrossRef]
- Lund, H.; Möller, B.; Mathiesen, B.V.; Dyrelund, A. The Role of District Heating in Future Renewable Energy Systems. Energy 2010, 35, 1381–1390. [Google Scholar] [CrossRef]
- Buffa, S.; Cozzini, M.; D’Antoni, M.; Baratieri, M.; Fedrizzi, R. 5th Generation District Heating and Cooling Systems: A Review of Existing Cases in Europe. Renew. Sustain. Energy Rev. 2019, 104, 504–522. [Google Scholar] [CrossRef]
- Lund, H.; Werner, S.; Wiltshire, R.; Svendsen, S.; Thorsen, J.E.; Hvelplund, F.; Mathiesen, B.V. 4th Generation District Heating (4GDH). Integrating Smart Thermal Grids into Future Sustainable Energy Systems. Energy 2014, 68, 1–11. [Google Scholar] [CrossRef]
- Volkova, A.; Pakere, I.; Murauskaite, L.; Huang, P.; Lepiksaar, K.; Zhang, X. 5th Generation District Heating and Cooling (5GDHC) Implementation Potential in Urban Areas with Existing District Heating Systems. Energy Rep. 2022, 8, 10037–10047. [Google Scholar] [CrossRef]
- De Jesus, A.C. Environmental Benefits and Challenges Associated with Geothermal Power Generation; Elsevier Ltd.: Amsterdam, The Netherlands, 2016; ISBN 9780081003442. [Google Scholar]
- Santamarta, J.C.; García-Gil, A.; Expósito, M.d.C.; Casañas, E.; Cruz-Pérez, N.; Rodríguez-Martín, J.; Mejías-Moreno, M.; Götzl, G.; Gemeni, V. The clean energy transition of heating and cooling in touristic infrastructures using shallow geothermal energy in the Canary Islands. Renew. Energy 2021, 171, 505–515. [Google Scholar] [CrossRef]
- Abugabbara, M.; Javed, S.; Johansson, D. A Simulation Model for the Design and Analysis of District Systems with Simultaneous Heating and Cooling Demands. Energy 2022, 261, 125245. [Google Scholar] [CrossRef]
- Romanov, D.; Leiss, B. Geothermal Energy at Different Depths for District Heating and Cooling of Existing and Future Building Stock. Renew. Sustain. Energy Rev. 2022, 167, 112727. [Google Scholar] [CrossRef]
- Ghiasirad, H.; Asgari, N.; Khoshbakhti Saray, R.; Mirmasoumi, S. Thermoeconomic Assessment of a Geothermal Based Combined Cooling, Heating, and Power System, Integrated with a Humidification-Dehumidification Desalination Unit and an Absorption Heat Transformer. Energy Convers. Manag. 2021, 235, 113969. [Google Scholar] [CrossRef]
- Carotenuto, A.; Damian, R.; Vanoli, L. A Novel Solar-Geothermal District Heating, Cooling and Domestic Hot Water System: Dynamic Simulation and Energy-Economic Analysis. Energy 2017, 141, 2652–2669. [Google Scholar] [CrossRef]
- Patureau, R.; Tran, C.T.; Gavan, V.; Stabat, P. The New Generation of District Heating & Cooling Networks and Their Potential Development in France. Energy 2021, 236, 121477. [Google Scholar] [CrossRef]
- Ceglia, F.; Macaluso, A.; Marrasso, E.; Roselli, C.; Vanoli, L. Energy, Environmental, and Economic Analyses of Geothermal Polygeneration System Using Dynamic Simulations. Energies 2020, 13, 4603. [Google Scholar] [CrossRef]
- Meglio, A.D.; Massarotti, N.; Mauro, A.; Trombetta, V. Coupled Geothermal Energy Simulations. J. Phys. Conf. Ser. 2022, 2177, 012004. [Google Scholar] [CrossRef]
- Calise, F.; Cappiello, F.L.; Dentice d’Accadia, M.; Vicidomini, M. Energy and Economic Analysis of a Small Hybrid Solar-Geothermal Trigeneration System: A Dynamic Approach. Energy 2020, 208, 118295. [Google Scholar] [CrossRef]
- Calise, F.; Di Fraia, S.; Macaluso, A.; Massarotti, N.; Vanoli, L. A Geothermal Energy System for Wastewater Sludge Drying and Electricity Production in a Small Island. Energy 2018, 163, 130–143. [Google Scholar] [CrossRef]
- Klein, S.A. TRNSYS 17: A Transient System Simulation Program; Solar Energy Laboratory, University of Wisconsin: Madison, WI, USA, 2010. [Google Scholar]
- Available online: https://www.aspentech.com/en/products/engineering/aspen-plusAspenPlus® (accessed on 1 January 2022).
- EC700 Energy Performance of Buildings, Edilclima v.6—Engineering & Software: Borgomanero, Italy, 2022.
- Gemitzi, A.; Dalampakis, P.; Falalakis, G. Detecting Geothermal Anomalies Using Landsat 8 Thermal Infrared Remotely Sensed Data. Int. J. Appl. Earth Obs. Geoinf. 2021, 96, 102283. [Google Scholar] [CrossRef]
- Lund, J.W.; Toth, A.N. Direct Utilization of Geothermal Energy 2020 Worldwide Review. Geothermics 2020, 90, 101915. [Google Scholar] [CrossRef]
- Hurter, S.; Schellschmidt, R. Atlas of Geothermal Resources in Europe. Geothermics 2003, 32, 779–787. [Google Scholar] [CrossRef]
- Kivanc Ates, H.; Serpen, U. Power Plant Selection for Medium to High Enthalpy Geothermal Resources of Turkey. Energy 2016, 102, 287–301. [Google Scholar] [CrossRef]
- Carlino, S.; Troiano, A.; Di Giuseppe, M.G.; Tramelli, A.; Troise, C.; Somma, R.; De Natale, G. Exploitation of Geothermal Energy in Active Volcanic Areas: A Numerical Modelling Applied to High Temperature Mofete Geothermal Field, at Campi Flegrei Caldera (Southern Italy). Renew. Energy 2016, 87, 54–66. [Google Scholar] [CrossRef]
- McKenna, E.; Thomson, M.; Barton, J. CREST Demand Model. Dataset. Available online: https://repository.lboro.ac.uk/authors/Murray_Thomson/1171623 (accessed on 1 January 2021).
- Italian Technical Committee Italian Technical Committee. Available online: www.cti2000.it (accessed on 1 January 2021).
- ISO 52016 2018; Energy Performance of Buildings-Energy Needs for Heating and Cooling, Internal Temperatures and Sensible and Latent Heat Loads. ISO: Geneva, Switzerland, 2018. Available online: https://store.uni.com/en/p/UNI1603532/uni-en-iso-52016-12018-274693/UNI1603532_EEN (accessed on 1 January 2021).
- ISO 18523-1: 2016; Energy Performance of Buildings—Schedule and Condition of Building, Zone and Space Usage for Energy Calculation: Part 1: Non-Residential Buildings. ISO: Geneva, Switzerland, 2016. Available online: https://www.iso.org/standard/62765.html (accessed on 20 March 2023).
- Italian Government Decree of the President of the Republic n. 412/1993. Regulation Containing Rules for the Design, Installation, Operation and Maintenance of the Thermal Systems of Buildings for the Purpose of Limiting Energy Consumption, Implementing Art. 4, Paragraph 4. Available online: https://www.gazzettaufficiale.it/eli/id/1993/10/14/093G0451/sg (accessed on 1 January 2022).
- Ceglia, F.; Esposito, P.; Faraudello, A.; Marrasso, E.; Rossi, P.; Sasso, M. An Energy, Environmental, Management and Economic Analysis of Energy Efficient System towards Renewable Energy Community: The Case Study of Multi-Purpose Energy Community. J. Clean. Prod. 2022, 369, 133269. [Google Scholar] [CrossRef]
- Ceglia, F.; Marrasso, E.; Roselli, C.; Sasso, M. Time-Evolution and Forecasting of Environmental and Energy Performance of Electricity Production System at National and at Bidding Zone Level. Energy Convers Manag. 2022, 265, 115772. [Google Scholar] [CrossRef]
- Boardman, B. Fuel Poverty: From Cold Homes to Affordable Warmth; Belhaven Press: London, UK, 1991; ISBN 1852931396. [Google Scholar]
- Carlino, S.; Somma, R.; Troise, C.; De Natale, G. The Geothermal Exploration of Campanian Volcanoes: Historical Review and Future Development. Renew. Sustain. Energy Rev. 2012, 16, 1004–1030. [Google Scholar] [CrossRef]
- Carlino, S. Heat Flow and Geothermal Gradients of the Campania Region (Southern Italy) and Their Relationship to Volcanism and Tectonics. J. Volcanol. Geotherm. Res. 2018, 365, 23–37. [Google Scholar] [CrossRef]
- Somma, R.; Troise, C.; Zeni, L.; Minardo, A.; Fedele, A.; Mirabile, M.; De Natale, G. Long-Term Monitoring with Fiber Optics Distributed Temperature Sensing at Campi Flegrei: The Campi Flegrei Deep Drilling Project. Sensors 2019, 19, 1009. [Google Scholar] [CrossRef]
- Perrotta, A.; Scarpati, C.; Luongo, G.; Morra, V. Chapter 5 The Campi Flegrei Caldera Boundary in the City of Naples. Dev. Volcanol. 2006, 9, 85–96. [Google Scholar] [CrossRef]
- Vitale, S.; Isaia, R. Fractures and Faults in Volcanic Rocks (Campi Flegrei, Southern Italy): Insight into Volcano-Tectonic Processes. Int. J. Earth Sci. 2014, 103, 801–819. [Google Scholar] [CrossRef]
- Rosi, M.; Sbrana, A. Phlegrean Fields. In Quaderni de la Ricerca Scientifica; 1987; Volume 9, Available online: http://geca.area.ge.cnr.it/files/276892.pdf (accessed on 1 February 2023).
- Orsi, G.; De Vita, S.; Di Vito, M. The Restless, Resurgent Campi Flegrei Nested Caldera (Italy): Constraints on Its Evolution and Configuration. J. Volcanol. Geotherm. Res. 1996, 74, 179–214. [Google Scholar] [CrossRef]
- The Italian Regulatory Authority for Energy, N. and E. (ARERA) Electricity Price Trend for the Typical Domestic Consumer in Greater Protection. Data of First Semester 2021. (Andamento Del Prezzo Dell’energia Elettrica per Il Consumatore Domestico Tipo in Maggior Tutela, in Italian). Available online: https://www.arera.it/it/dati/eep35.htm (accessed on 15 July 2022).
- ARERA Resolution 120/2022 Regulatory Authority for Energy, Networks and Environment (ARERA). Available online: https://www.arera.it/allegati/docs/22/120-22.pdf (accessed on 1 January 2021).
- Calise, F.; Dentice d’Accadia, M.; Macaluso, A.; Vanoli, L.; Piacentino, A. A Novel Solar-Geothermal Trigeneration System Integrating Water Desalination: Design, Dynamic Simulation and Economic Assessment. Energy 2016, 115, 1533–1547. [Google Scholar] [CrossRef]
- Regulatory Authority for Energy, Networks and Environment (ARERA). Available online: www.arera.it/en/ (accessed on 1 January 2021).

Figure 2.
Real office buildings.

Figure 3.
Electricity energy demand for offices.
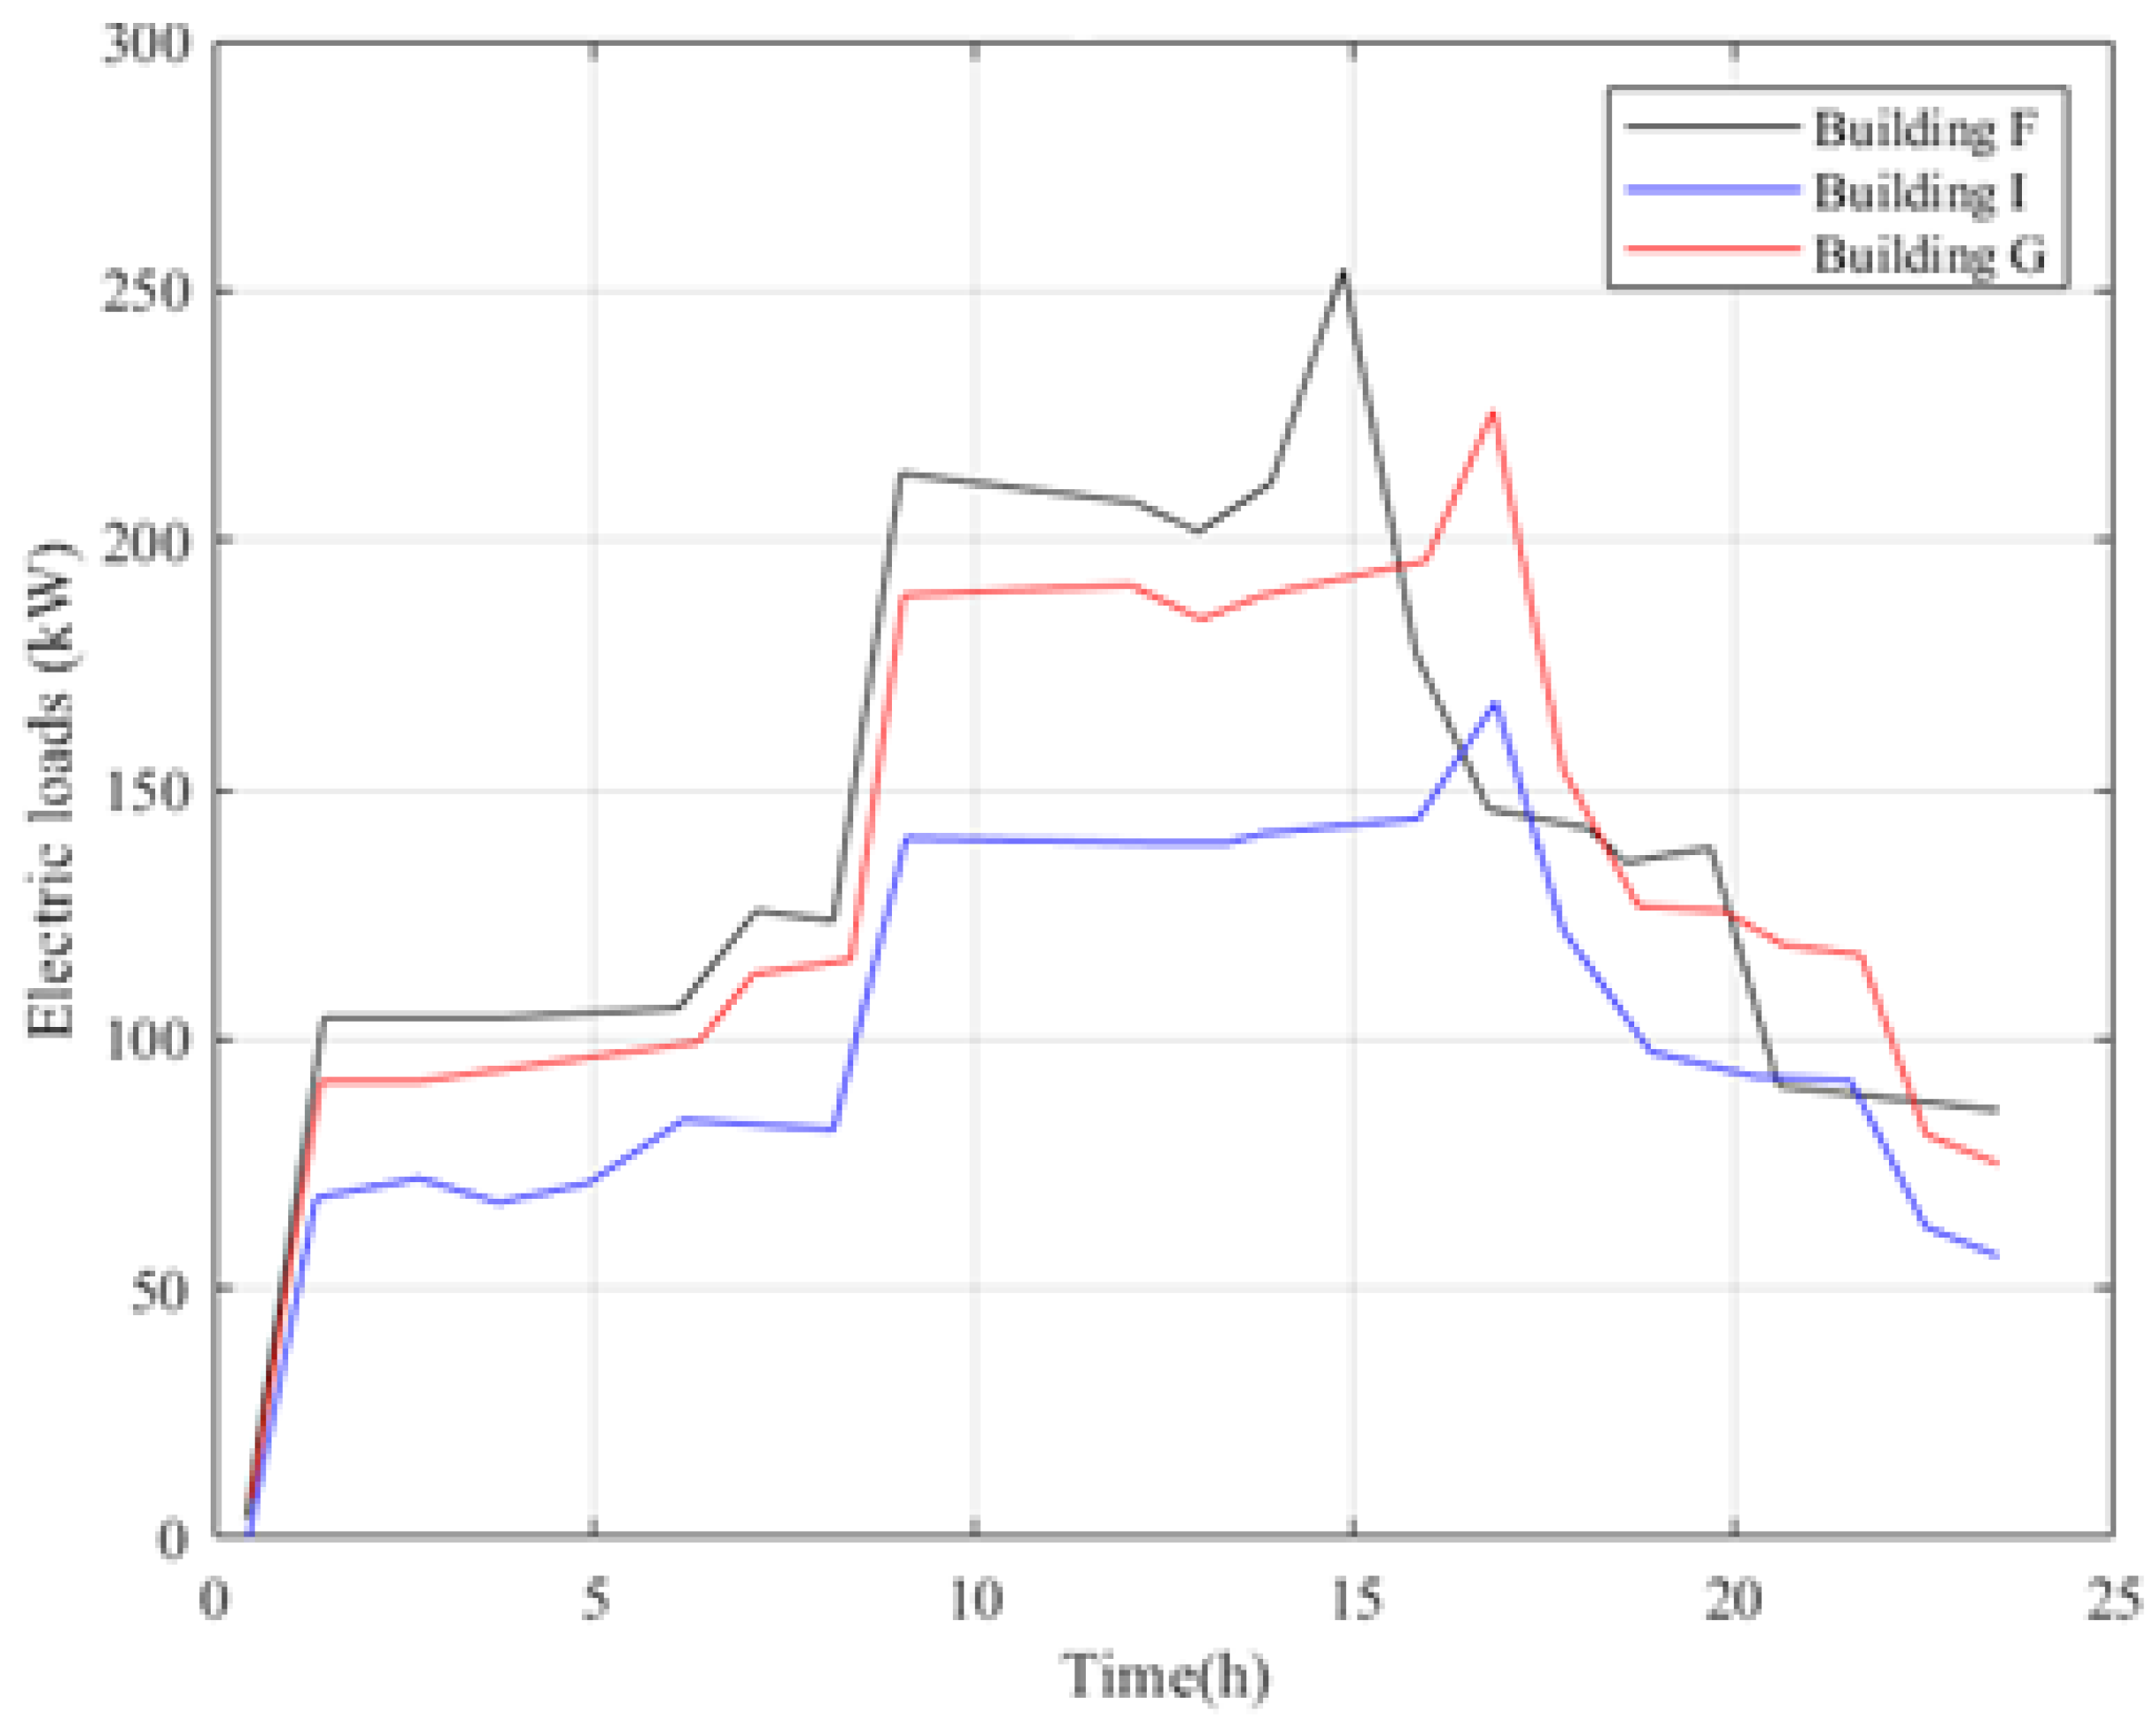
Figure 4.
Residential simulated load.
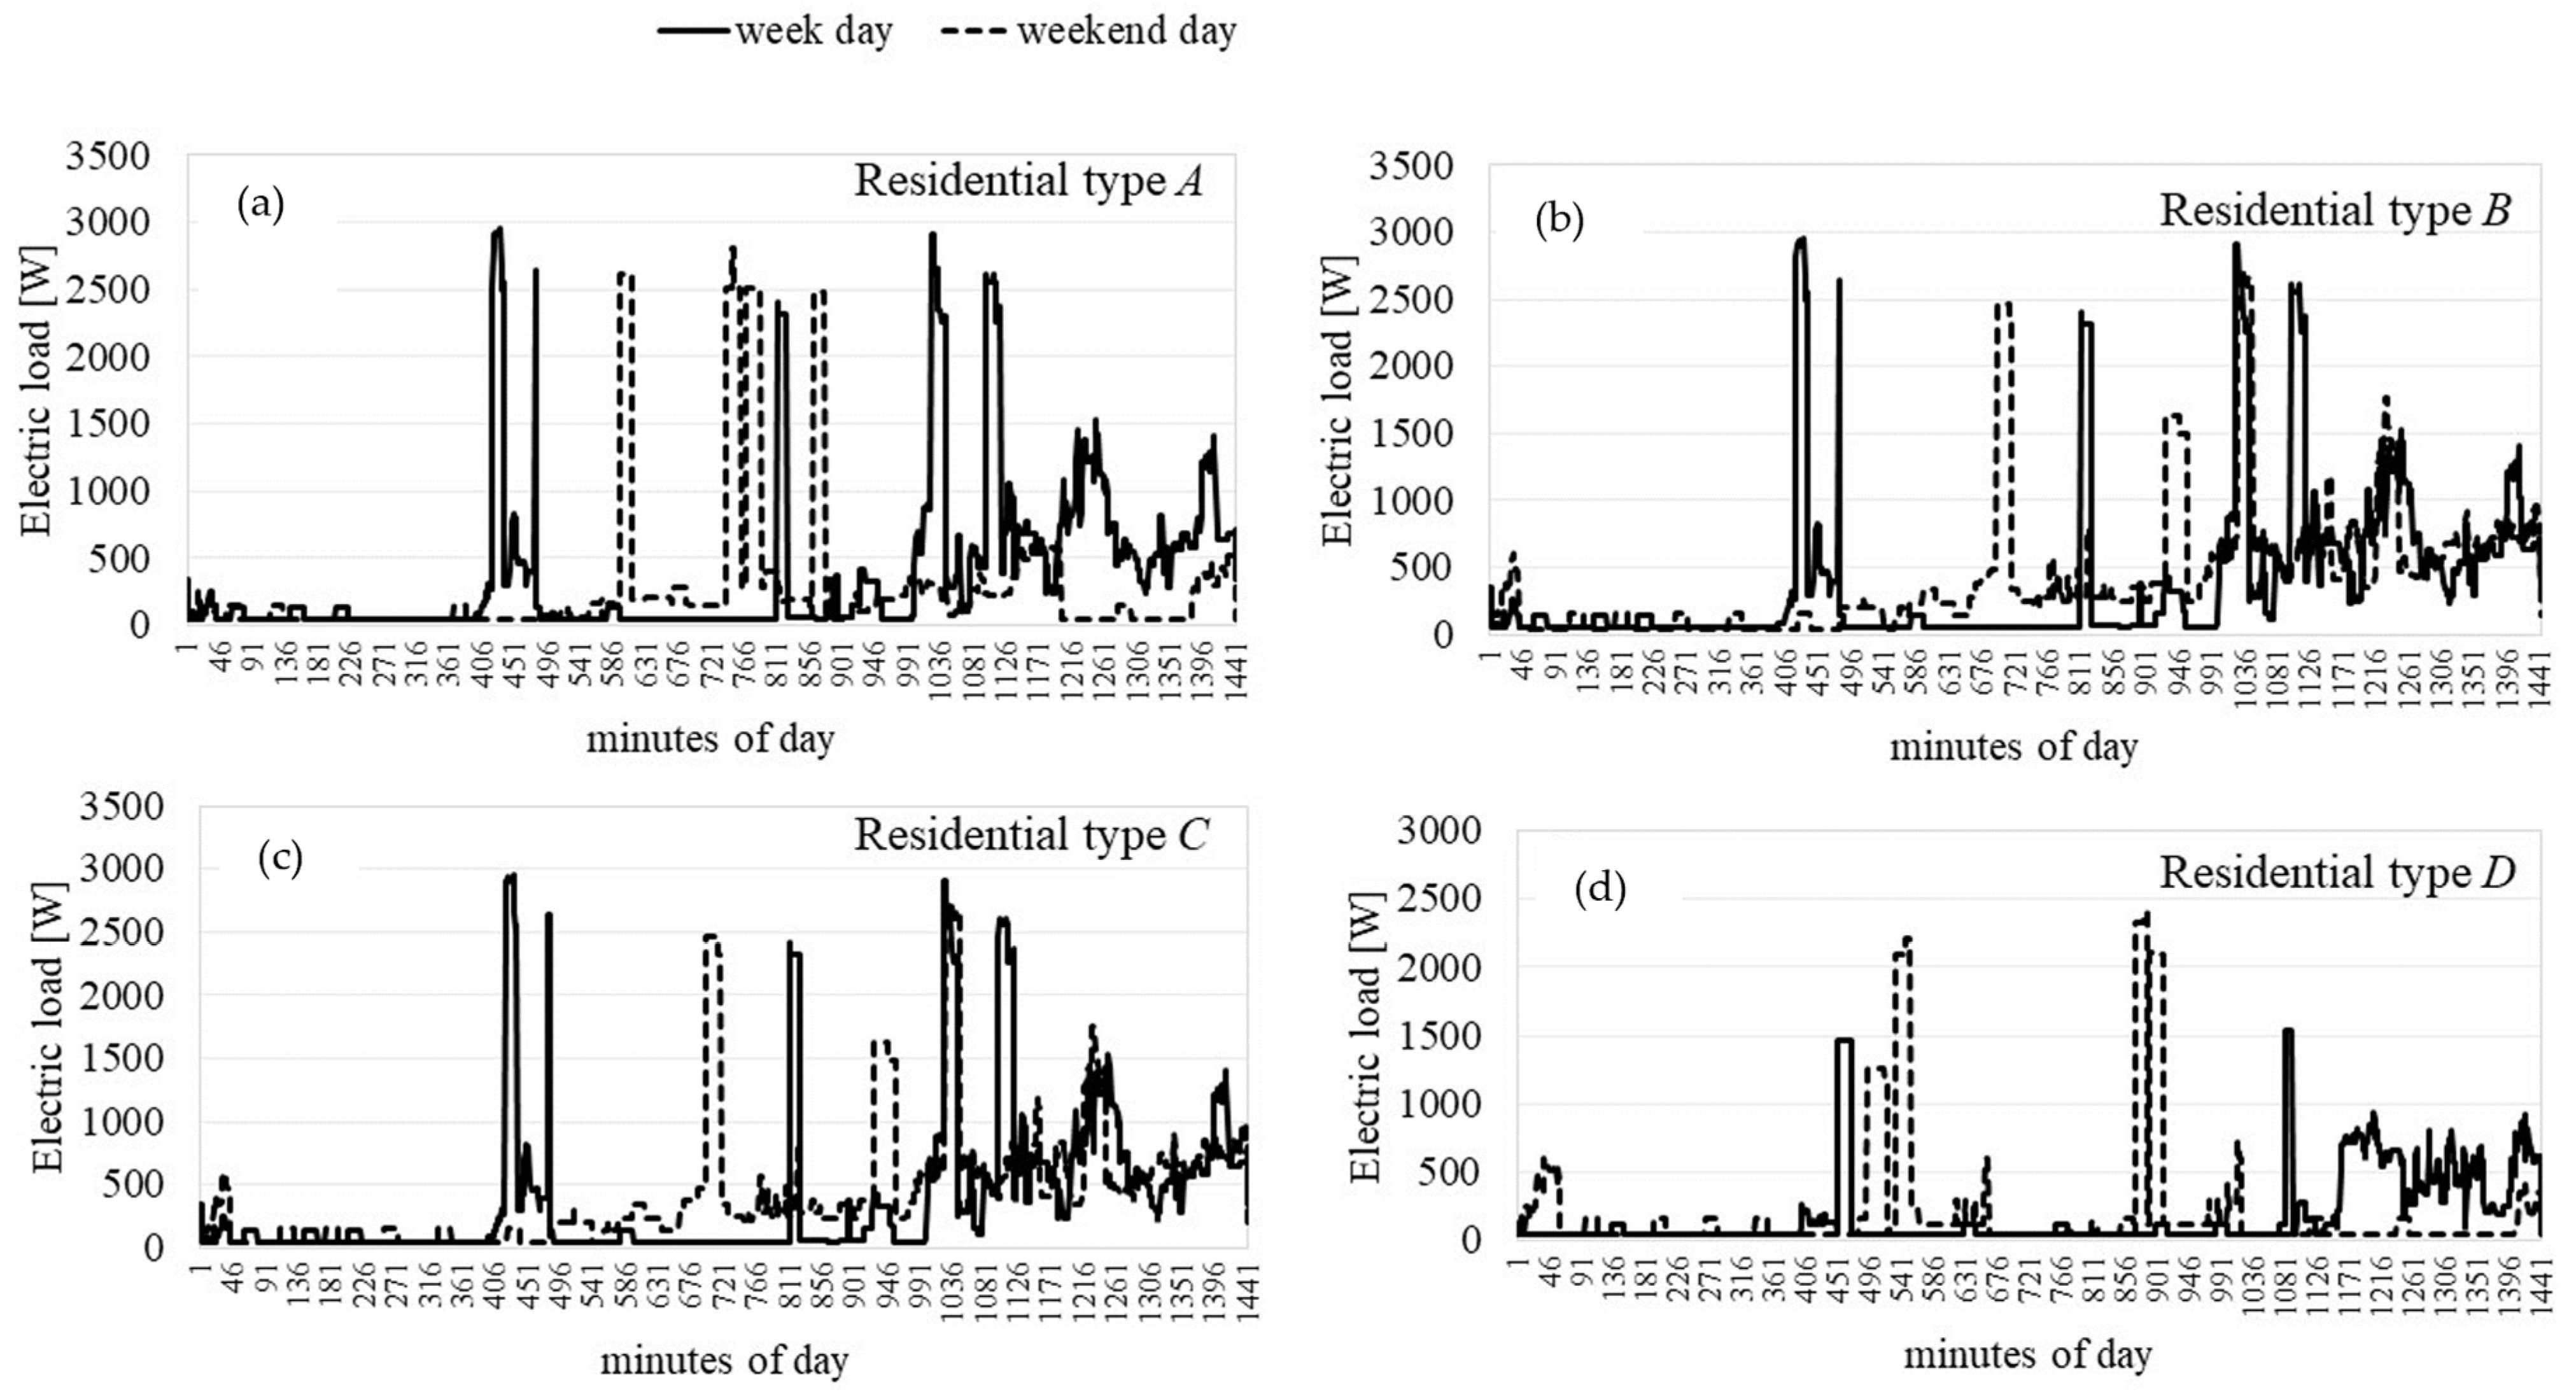
Figure 5.
Energy model referring to a residential building (sfw. EDILCLIMA v.11).

Figure 6.
Layout of the ORC system.

Figure 7.
Thermal energy demand of the office building.

Figure 8.
Thermal energy demand of the residential building.
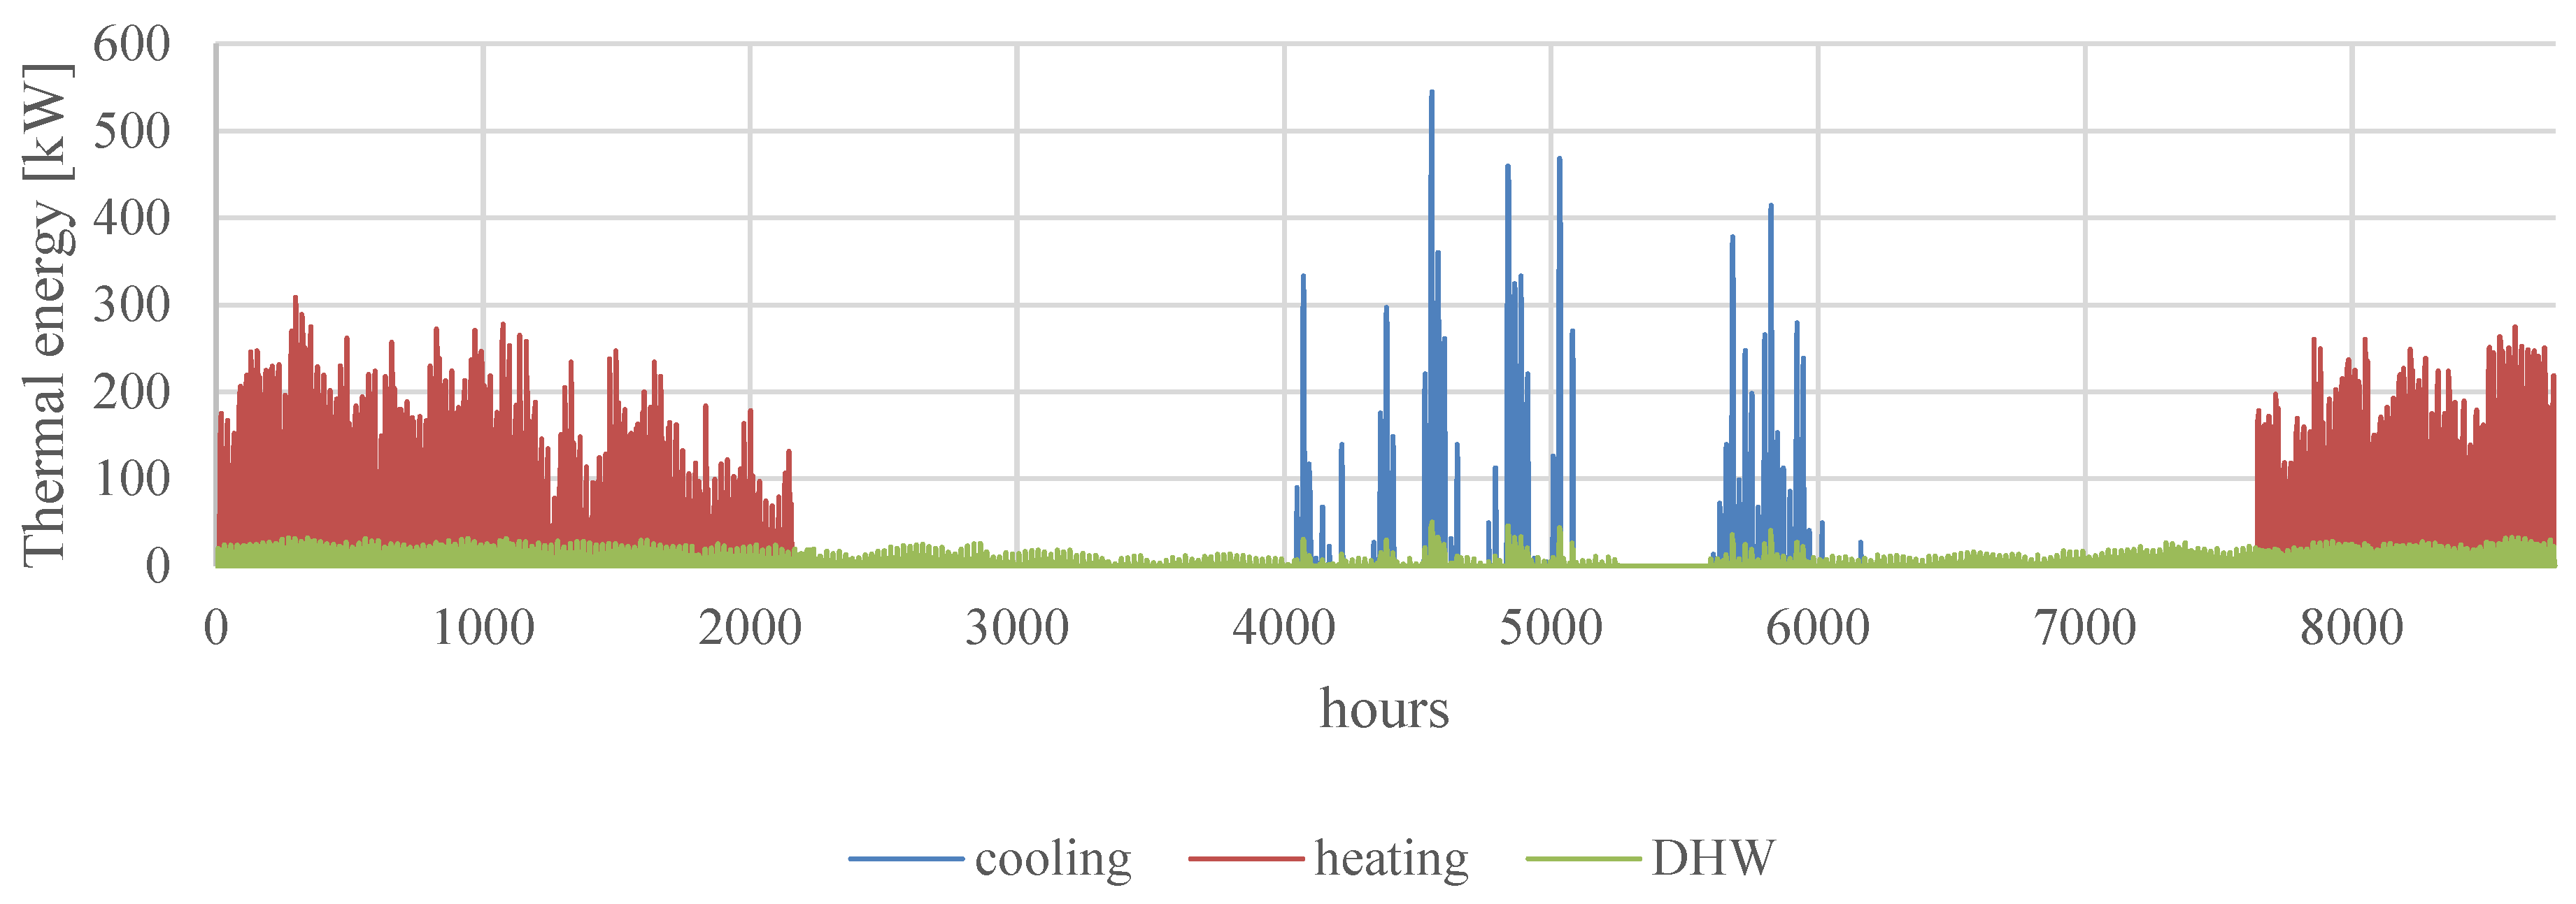
Figure 9.
Electricity vector on a monthly basis.

Figure 10.
Self-consumption, self-sufficiency indexes, energy sold to grid, and self-consumed on a monthly basis.
Figure 10.
Self-consumption, self-sufficiency indexes, energy sold to grid, and self-consumed on a monthly basis.

Figure 11.
Environmental emission for TS and REC with respect to the emission factor for electricity power mix.
Figure 11.
Environmental emission for TS and REC with respect to the emission factor for electricity power mix.
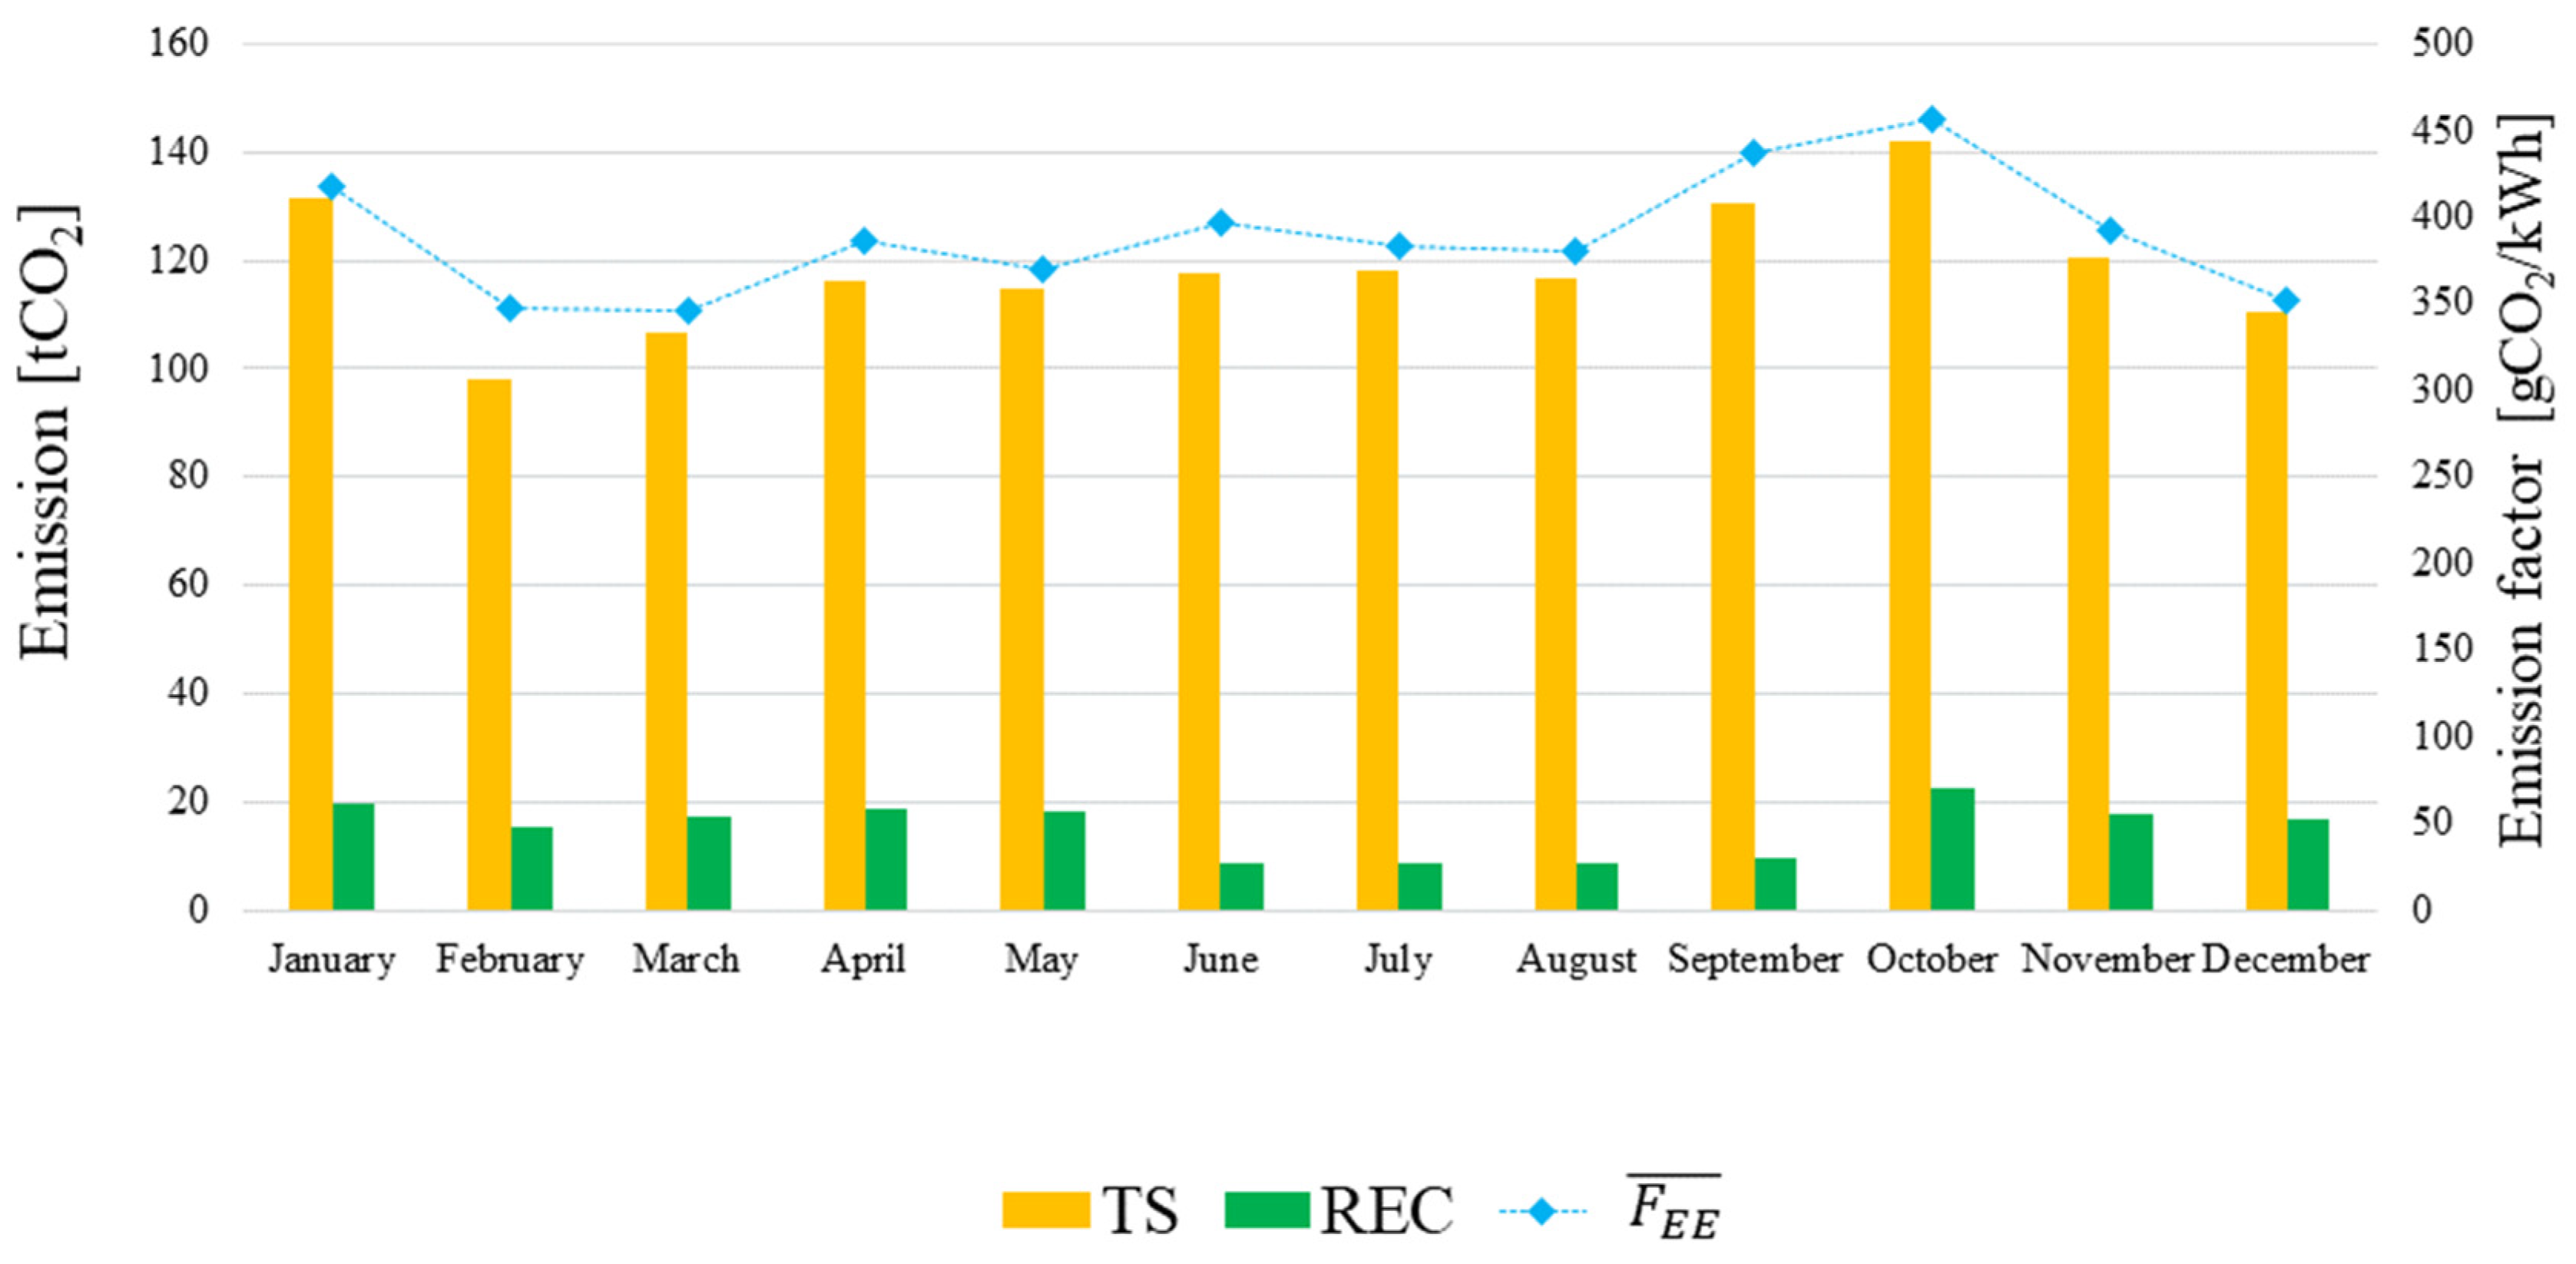
Figure 12.
Electricity cash flow for energy community.

Figure 13.
Socio-economic index.

Table 1.
Geothermal source temperature by zone.
| Zone | Geothermal Source Temperature | |
|---|---|---|
| Greece (Aristino—Alexandroupolis area) | 99 °C | [27] |
| Thailand | About 100 °C | [28] |
| Mexico | About 100 °C | |
| Island | >110 | |
| Bulgaria | 100 °C | |
| Hungary | 108 °C | |
| Romania | About 90 °C | |
| Germany (north east) | 120 °C | [29] |
| Turkey | 240 °C | [30] |
| Italy (Ferrara) | About 100 °C | [31] |
| Italy (Phlegrean Fields) | Up to 240 °C |
Table 2.
Main characteristics of the office building’s envelope.
| Building Element | Transmittance [W/m2K] | Thickness [m] | g-Value [−] | Longwave Emission Coefficient [−] | Solar Absorptance [−] |
|---|---|---|---|---|---|
| External Walls, First floor | 0.740 | 0.34 | - | 0.9 | 0.6 |
| External Wall | 0.843 | 0.34 | - | 0.9 | 0.6 |
| Inner Wall | 0.293 | 0.12 | - | - | - |
| Ground Floor | 1.78 | 0.46 | - | - | - |
| Ceiling | 1.30 | 0.24 | - | - | - |
| Roof | 1.69 | 0.20 | - | 0.9 | 0.6 |
| Window | 1.40 | - | 0.76 | - | - |
Table 3.
Parameter descriptions.
| Parameter | Description |
|---|---|
| [J/K] | Zone internal thermal capacity |
| [m2] | Area of the building element “eli” |
| [m2] | Sum of areas of all construction elements “elk = 1…eln” |
| [W/m2K] | Convective coefficient for the inner surface |
| [W/m2K] | Radiative coefficient for the inner surface |
| [W/m2K] | Conductance between the “pli” node and the “pli-1” node |
| [°C] | Internal surface temperature of the building element “eli” |
| [°C] | Temperature at the “pli” node |
| [°C] | Supply air temperature of the ventilation flow “vei” |
| [W/K] | Convective fraction of the internal inputs |
| [W/K] | Convective fraction of solar inputs |
| [W/K] | Convective fraction of heating and cooling inputs |
| [W/K] | Global heat transfer coefficient for ventilation, for ventilation flow “vei” |
| [W/K] | Global heat transfer coefficient through thermal bridges |
| [W] | Global contribution of internal heating |
| [W] | Contribution of directly transmitted solar heating to the zone |
| [W] | Heating or cooling load |
| [J/m2K] | Thermal capacity |
| Sola absorption coefficient | |
| [W/m2] | Solar irradiance (hourly, diffuse) |
| [W/m2] | Solar irradiance (hourly, direct) |
| [W/m2] | Thermal radiation to the sky |
Table 4.
Main characteristics of the considered extraction well.
| Water Temperature at the Wellhead | 145 °C |
| Average Flow Rate | 59 kg/s |
| Specific Heat of the Geothermal Fluid | 4.19 kJ/kgK |
| Density | 1.08 kg/L |
Table 5.
Heating and cooling power demands for each building.
| Building | Heating Demand [kW] | Cooling Demand [kW] |
|---|---|---|
| Office-F | 383 | 707 |
| Office-I | 270 | 498 |
| Office-G | 306 | 565 |
| Residential-1 | 333 | 545 |
| Residential-2 | 158 | 285 |
| Residential-3 | 142 | 243 |
| Residential-4 | 142 | 243 |
| Residential-5 | 142 | 243 |
Table 6.
Annual electric energy demand for each building.
| Building | Electricity Demand [MWh/y] |
|---|---|
| Office-F | 1367 |
| Office-I | 911 |
| Office-G | 1215 |
| Residential-1 | 76.0 |
| Residential-2 | 42.6 |
| Residential-3 | 42.6 |
| Residential-4 | 42.6 |
| Residential-5 | 42.6 |
Table 8.
Economic analysis REC.
| C#1 | C#2 | C#3 | |
|---|---|---|---|
| REC | |||
| [€/y] | 360,774 | 360,774 | 360,774 |
| [€/y] | 23,771 | 30,902 | 49,443 |
| [€/y] | 133,543 | 173,607 | 213,670 |
| [€/y] | 251,001 | 218,069 | 196,547 |
| [€/y] | 25,757 | 58,689 | 80,211 |
| TS | |||
| or [€/y] | 1,121,812 | 1,458,355 | 1,794,899 |
| REC vs. TS | |||
| SPB [y] | 4 | 3 | 2 |
| [€/y] | 1,096,054 | 1,399,666 | 1,714,688 |
Disclaimer/Publisher’s Note: The statements, opinions and data contained in all publications are solely those of the individual author(s) and contributor(s) and not of MDPI and/or the editor(s). MDPI and/or the editor(s) disclaim responsibility for any injury to people or property resulting from any ideas, methods, instructions or products referred to in the content. |
© 2024 by the authors. Licensee MDPI, Basel, Switzerland. This article is an open access article distributed under the terms and conditions of the Creative Commons Attribution (CC BY) license (https://creativecommons.org/licenses/by/4.0/).
Share and Cite
MDPI and ACS Style
Battaglia, V.; Ceglia, F.; Laudiero, D.M.; Maione, A.; Marrasso, E.; Vanoli, L. Empowering Energy Communities through Geothermal Systems. Energies 2024, 17, 1248. https://doi.org/10.3390/en17051248
AMA Style
Battaglia V, Ceglia F, Laudiero DM, Maione A, Marrasso E, Vanoli L. Empowering Energy Communities through Geothermal Systems. Energies. 2024; 17(5):1248. https://doi.org/10.3390/en17051248
Chicago/Turabian StyleBattaglia, Vittoria, Francesca Ceglia, Davide Maria Laudiero, Alessandro Maione, Elisa Marrasso, and Laura Vanoli. 2024. "Empowering Energy Communities through Geothermal Systems" Energies 17, no. 5: 1248. https://doi.org/10.3390/en17051248
Note that from the first issue of 2016, this journal uses article numbers instead of page numbers. See further details here.