
The Effects of Syngas Composition on Engine Thermal Balance in a Biomass Powered CHP Unit: A 3D CFD Study

Istituto di Scienze e Tecnologie per l’Energia e la Mobilità Sostenibili (STEMS), Consiglio Nazionale delle Ricerche (CNR), Viale Marconi, 80125 Naples, Italy
*
Author to whom correspondence should be addressed.
Energies 2024, 17(3), 738; https://doi.org/10.3390/en17030738
Submission received: 2 January 2024
/
Revised: 24 January 2024
/
Accepted: 2 February 2024
/
Published: 4 February 2024
(This article belongs to the Special Issue Selected Papers from the SDEWES 2023 Conference on Sustainable Development of Energy, Water, and Environment Systems)
Abstract
:Syngas from biomass gasification represents an interesting alternative to traditional fuels in spark-ignition (SI) internal combustion engines (ICEs). The presence of inert species in the syngas (H2O, CO2, N2) reduces the amount of primary energy that can be exploited through combustion, but it can also have an insulating effect on the cylinder walls, increasing the average combustion temperature and reducing heat losses. A predictive numerical approach is here proposed to derive hints related to the possible optimization of the syngas-engine coupling and to balance at the best the opposite effects taking place during the energy conversion process. A three-dimensional (3D) computational fluid dynamics (CFD) model is developed, based on a detailed kinetic mechanism of combustion, to reproduce the combustion cycle of a cogenerative engine fueled by syngas deriving from the gasification of different feedstocks. Numerical results are validated with respect to experimental measurements made under real operation. Main findings reveal how heat transfer mainly occurs through the chamber and piston walls up to 50° after top dead center (ATDC), with the presence of inert gases (mostly N2) which decrease the syngas lower calorific value but have a beneficial insulating effect along the liner walls. However, the overall conversion efficiency of the biomass-to-ICE chain is mostly favored by high-quality syngas from biomasses with low-ashes content.
1. Introduction
Energy valorization of organic waste materials is today of high interest as an example of the concept of “circular economy” for power generation purposes [1]. Between renewables, biomass is expected to preserve its position for decades to come, although today over 35% of the biomass is destinated to traditional cooking methods instead of power generation [2].
Between biomass-to-energy conversion technologies, gasification is one of the best options [3], consisting in the material transformation into a gaseous fuel, called syngas, mainly composed by H2, CH4, CO, CO2 and H2O [4]. Combined heat and power (CHP) technologies based on the process of biomass gasification for the simultaneous generation of two different forms of useful energy by a single primary source [5] have been largely developed over the past years [6]. In particular, energy systems based on biomass gasifiers coupled with ICEs have been developed at both pilot/demonstration [7] or commercial [8] level over the micro-scales (mCHP) of power supply [9] and today represent a viable solution especially over short-range biomass-to-energy chains [10,11].
However, the wide variability of chemical and physical properties among different types of feedstocks determines a highly variable quality of the resulting syngas [12,13], that practically decrease the degree of suitability of its use in real production systems at a commercial level [14] or, anyhow, determines performances far lower than those achievable by exploiting fossil counterparts (on average, 30% less [15]).
Between challenges related to the use of syngas in ICEs, the predictive characterization of the reacting flow-field within the combustion chamber under non-conventional fueling is a hard task [16], especially due to the fuel composition and its direct effect on the overall engine energy balance and thermal flows [17,18,19].
Indeed, inert species composing the syngas lower the lower calorific value, hence the amount of primary energy exploitable through combustion at a given mass of fuel, that leads to a power de-rating of the conversion system [20,21]. However, the insulating effects of inert species as N2 (this last present in the mixture with a mass fraction of even above the 50%) at the cylinder walls, although well-known from literature, are positive in reducing heat losses but have not yet been quantified into detail especially in syngas powered systems. Exhaust gas recirculation (EGR) for example is a well-assessed experimental technique, consisting in the partial recirculation of the engine exhaust gases (mainly composed by N2, CO2 and H2O) to virtually reduce the engine displacement and, therefore, mitigate the combustion temperatures responsible of the NOx production [22].
To somehow quantify the concurrent effects of reduction of lower calorific value and increased insulation at the wall, numerical simulation reveals being essential so to describe into detail mixture preparation, combustion, heat transfer, and noxious emission formation [23,24].
In literature, several works dealt with the simulation of several aspects concerning alternative engines fueled with syngas. Orbaiz et al. [25] studied the effects on brake thermal efficiency, combustion variability and emissions of a SI engine running on hydrogen, two synthesis gases and natural gas through a combined experimental—mono-dimensional (1D) numerical approach, while the influence of H2 over the thermo-physical properties of different syngas mixtures on a SI engine were addressed in ref. [26], as based on established 0-1D chemical kinetics routines and thermodynamic engine simulations. Perrone et al. [27] specifically developed a numerical model of a syngas-fueled ICE based on a lumped-parameters approach to analyze the performances of an innovative micro-combined cooling, heating, and power system.
With reference to three-dimensional computational fluid dynamic (CFD) models, they can be proposed to characterize into detail the complex processes occurring within the combustion chamber of a reciprocating engine [28], thus providing a very accurate description of the thermochemical properties that is, however, counterbalanced by long computational times. In this regard, Ortiz-Imedio et al. [29] assessed the engine performances and combustion of low-carbon fuels as H2 and CH4, detailing the evolution of pressure, temperature, heat release, emissions, flame growth speed and volumetric efficiency at different mixtures ratio, while Perez-Gordillo et al. [30] carried out the analysis of the technical-environmental performances of a syngas-fueled spark ignition engine through a 3D CFD model written within the KIVA 4 environment when changing the ignition energy, ignition timing, or spark location. With respect to homogenous charge compression ignition (HCCI) engines, Wiemann et al. [31] studied the effects of methane percentage in syngas composition through a validated numerical model in the Cantera software (https://www.cantera.org, accessed on 1 February 2024), while Ali et al. [32] analyzed the in-cylinder combustion phenomena in a HCCI engine through CFD techniques. In both papers, the simulation results were validated with experimental tests in the form of in-cylinder pressure and heat release rate at different equivalence ratios. Costa et al. [33] developed a 3D CFD model to reproduce the combustion process a Compression Ignition (CI) engine fed with blends of biodiesel fuel and syngas under different operative conditions and injection strategies, while Sattarzadeh et al. [34] evaluated the performance of a heavy-duty diesel engine under combustion fueled with diesel fuel/natural gas blended with syngas with different compositions.
State-of-the-art technology in the field underscores the critical importance of understanding the intricate dynamics governing the thermal balance of ICEs. To the best of authors’ knowledge, the influence of syngas composition on this thermal equilibrium has been a subject scarcely explored in depth within the existing literature. Specifically, the research landscape appears to lack comprehensive investigations into the nuanced interactions when considering syngas derived from biomass gasification, where the presence of various species such as nitrogen (N2), carbon dioxide (CO2) and water vapor (H2O), alongside key components like hydrogen, carbon monoxide, and methane, adds a layer of complexity to the thermal behavior of the alternative ICE. While hydrogen, carbon monoxide, and methane are commonly studied constituents, the role and impact of the mentioned inerts have not received the attention they deserve in the context of their collective influence on the thermal dynamics and on the overall efficiency of this conversion process.
The present work, therefore, aims at covering the just said literature gap by proposing a 3D CFD model, developed within the AVL FIRETM environment, reproducing the combustion cycle of an engine belonging to a real mCHP system under syngas fueling, this last derived from the gasification of different feedstocks. A Reynolds Averaged Navier Stokes (RANS) schematization is followed, while the detailed chemical reaction mechanism GRI-Mech 3.0 is implemented to ensure a robust predictive procedure as the composition of the bio-derived fuel varies, thus giving interesting details about the syngas oxidation chain and the related engine performances. All of the numerical results are validated with respect to several experimental measurements taken under real operation. The predictive numerical approach here proposed is aimed at deriving hints related to the possible optimization of the fuel-engine coupling and to balance at the best the afore described opposing effects taking place due to the presence of inert gases during the engine conversion process.
2. Materials and Methods
2.1. Technical Characteristics of the mCHP Layout
A naturally aspirated 4-cylinder, liquid-cooled SI 3.0L GM Vortec I-4 ICE is here analyzed as fueled with syngas of different compositions. The four combustion chambers are equipped with size-mounted spark plugs. The engine is part of a commercially available micro-scale system called ECO20x for combined heat and power generation based on the thermochemical conversion (gasification) of biomasses, manufactured by the Italian Company Costruzioni Motori Diesel (CMD) S.p.A., San Nicola la Strada, Italy. Its main features are reported in Table 1. In this work, reference is made to the operations conducted by exploiting the syngas deriving from the gasification of four different biomasses, respectively: two woodchips of different qualities (the former with a moisture content of 11.2 w/w% and a Lower Heating Value (LHV) of 15.7 kJ/kg, the latter with a moisture content of 8.9 w/w% and a LHV of 16.2 kJ/kg), a mix of woodchip and briquettes of olive pomace and, as a last biomass, pre-processed green waste through Hydro-Thermal Carbonization (HTC) coming from a real plant operating in Spain [18,19]. For the sake of clarity, these biomasses are referred from now on in the present paper respectively as Case a, Case b, Case c, Case d, with their proximate and ultimate analyses reported in Table 2. The gasification equivalence ratio is kept fixed at 0.3, while a baseline condition for syngas combustion is set at a spark ignition of 34° BTDC (Before Top Dead Center) and stoichiometric air/fuel ratio. During the experiments, the engine was equipped with low-frequency pressure sensors and high-frequency instrumented sparks on the engine head for the detection of the in-cylinder pressure trace, while the syngas composition was determined through continuous analyzers. More details about the conducted measurement campaign can be found in ref. [20].
The mass fractions of the species composing the different producer gases and their chemical characteristics (stoichiometric air-to-fuel ratio αST and LHV) are reported in Table 3 as deriving from measurements taken on the real system.
2.2. 3D CFD Model
The here described 3D CFD numerical model is developed in the AVL Fire™ environment, to reproduce the complete engine thermodynamic operating cycle and the consequent formation of pollutants.
AVL FIRETM is a leading CFD simulation package for internal combustion engines [35]. Designed to accurately simulate relevant physics and chemistry, it has a wide range of uses, such as the prediction of fuel sprays, ignition, combustion and engine-out emissions, but also the modelling of electrochemistry and thermal behavior of batteries and fuel cells.
The CFD solver employs the finite volume discretization method which rests on the integral conservation statements applied to a general control volume. The most important feature is the possibility to directly couple the fluid dynamics description of the engine processed mixture and the detailed kinetic of a non-conventional fuel, namely the syngas. The AVL FIRE™ Pre-processor offers FAME Advanced Hybrid, FAME Hexa and FAME Tetra which are automated 3D grid generation tools. FAME Advanced Hybrid and FAME Hexa generate computational models containing mainly hexahedral elements whereas tetrahedral elements are used by FAME Tetra’s grid generation tool.
The AVL FIRE™ Main program offers a general fluid flow solver based on the finite volume approach as its core element. Besides this, it provides multiple basic capabilities such as handling of arbitrary and sliding interfaces, handling of moving and non-moving boundaries, rotating and multiple frames of reference, solution of compressible and incompressible flows, laminar and turbulent flows. For turbulence modeling, FIRETM offers multiple choices, ranging from the well-known eddy viscosity models to the implementation of the Reynolds Stress Model (RSM).
2.2.1. Turbulence Closure
Turbulence is modelled within a Reynolds Averaged Navier Stokes (RANS) approach basing on the k-ζ-f model [36]. This model is based on the − f model introduced by Durbin et al. [37], where is a “wall-normal” velocity scale and it is derived from the equation for the Reynolds stress component in the direction normal to the wall; inserting yields , which is assumed to be normal to the streamlines rather than normal to the wall boundaries. Moreover, the elliptic relaxation function f is used to account for the wall effect. Although this model does not compute the complete stress field, it can retain the near-wall stress anisotropy which allows for accurate prediction of heat transfer, skin friction, and boundary layer separation in turbulent flows. According to Hanjalic, the − f model treatment of the wall boundary for f is computationally inefficient as it is sensitive to near-wall grid clustering. Therefore, Hanjalic proposed a similar approach, the k − ζ − f model [36], with the goal of reducing the computational sensitivity by solving a transport equation for the velocity scales ratio ζ = (k is the turbulent kinetic energy) instead of the transport equation for . The components of the Reynolds tensor are thus replaced from the combination of the transport equation for ζ and of the elliptic relaxation f. The standard k and ε-equations together with transport equation for ζ and the elliptic relaxation for f establish a very reliable closure to the turbulence problem; the model improves numerical stability and robustness and reduces the sensitivity to near-wall grid clustering.
2.2.2. Combustion Model
The combustion process is modelled using the general gas phase reaction (GGPR) approach, which allows the formulation of the source terms in the species transport and energy equations via the AVL FIRE internal chemistry interpreter basing on the reaction rates defined on an external kinetic mechanism. Indeed, the more common standard species transport model available in the software allows the resolution of the species balance equations related to O2, N2, CO2, CO, H2, H2O, O, H, N, OH, NO. However, considering that the syngas mixture contains methane, authors followed the GGPR approach relying on the GRI-Mech 3.0 [38], a detailed kinetic mechanism which describes the oxidation of methane through 325 elementary reactions and 53 species. It has been evaluated against more than 60 experimental studies, which distinguish this mechanism from others proposed in the literature for CH4 oxidation [39]. Species that are intermediate in the GRI-Mech are indeed main components of syngas (Table 3), and thus it has been employed for a predictive simulation of chemical processes involving the use of syngas with different compositions [20].
Coupling the AVL fluid dynamic model of the engine with the GRI-Mech is a relatively simple task. The software relies on the thermochemical and transport characteristics of the species involved in the oxidation process which are listed in dedicated files uploaded in the calculation folder.
2.2.3. Mesh Generation and Sensitivity Analysis
Domain discretization is a fundamental step of a numerical calculation which has to deal with a realistic representation of the boundary of the fluid flow field as well as with computational costs that increasingly rise when too many details are considered. In order to define the external surfaces related to the combustion chamber and the intake and exhaust ducts, a reverse engineering method was followed, filling the real parts with a flexible, high strength silicone mold-making rubber which has the ability to reproduce very complex geometries. Once hardened, the rubber model was extracted. Then, the three-dimensional data of the reproduced fluid flow domain were converted into digital form through a process of 3D scanning.
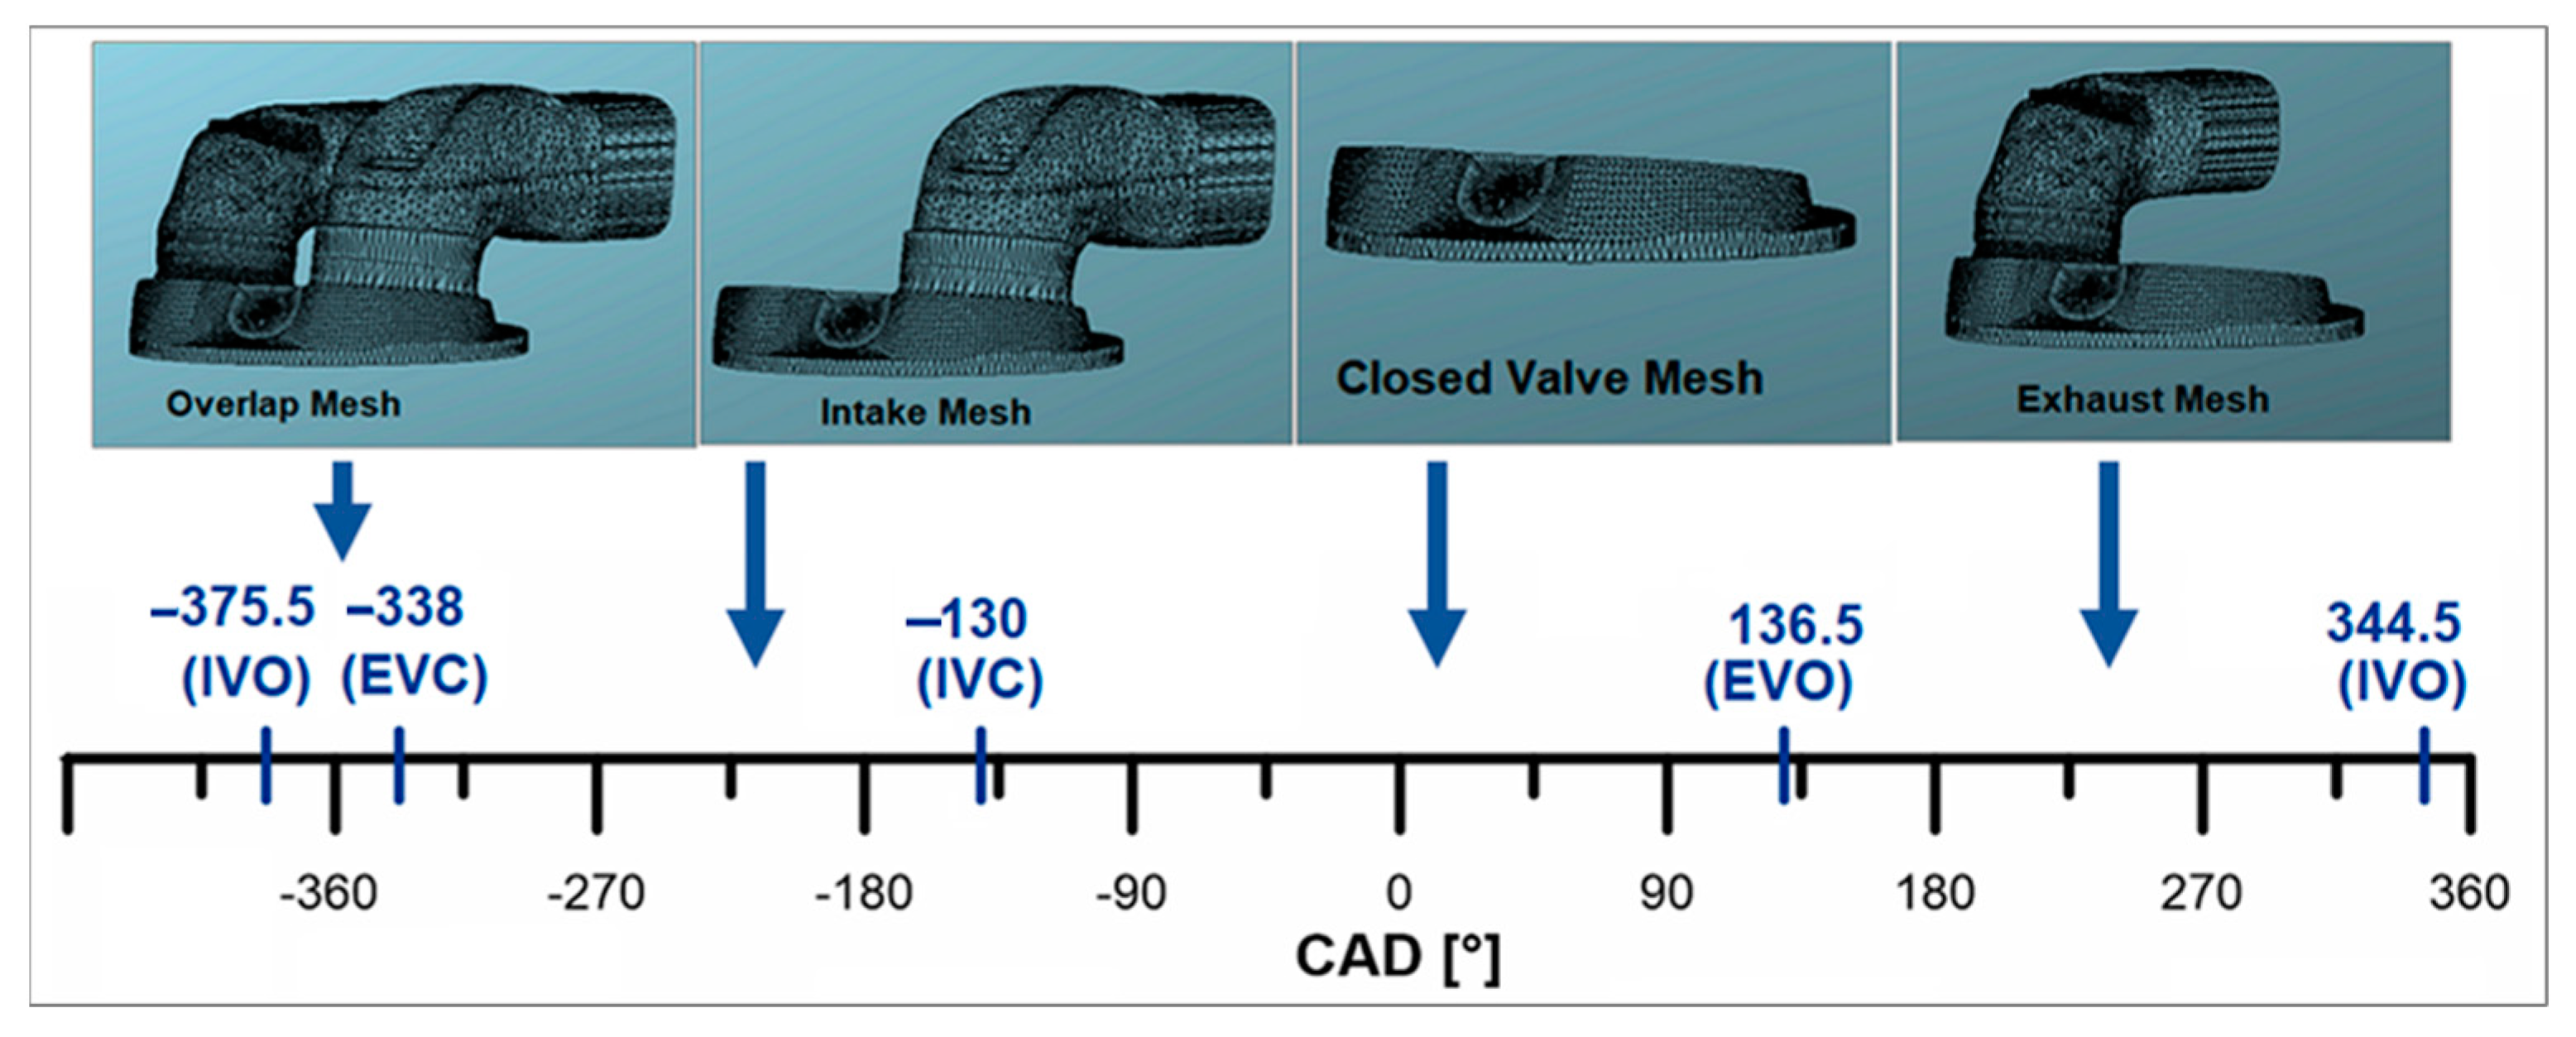
The generation of the set of computational grids (moving mesh) required to cover the complete ICE cycle can be easily performed by means of FAME Engine Plus. This powerful tool is enclosed in the FIRE software [35] for meshing process as it is highly efficient and provides computational models containing a minimum number of elements thus contributing to short simulation time. Moreover, the possibility of considering only active regions of fluid flow fields is a further feature for reducing computational costs. Such an achievement is reached by taking into account the engine ducts only when their valves are opened. This means that for each cycle phase, a proper surface mesh and edge mesh are considered as shown in Figure 1. These surfaces are then used to generate the moving mesh (piston moving according to the piston displacement function) in each of the reference interval. Subsequently, the full moving mesh over the complete engine cycle is generated by joining each of the single moving mesh.
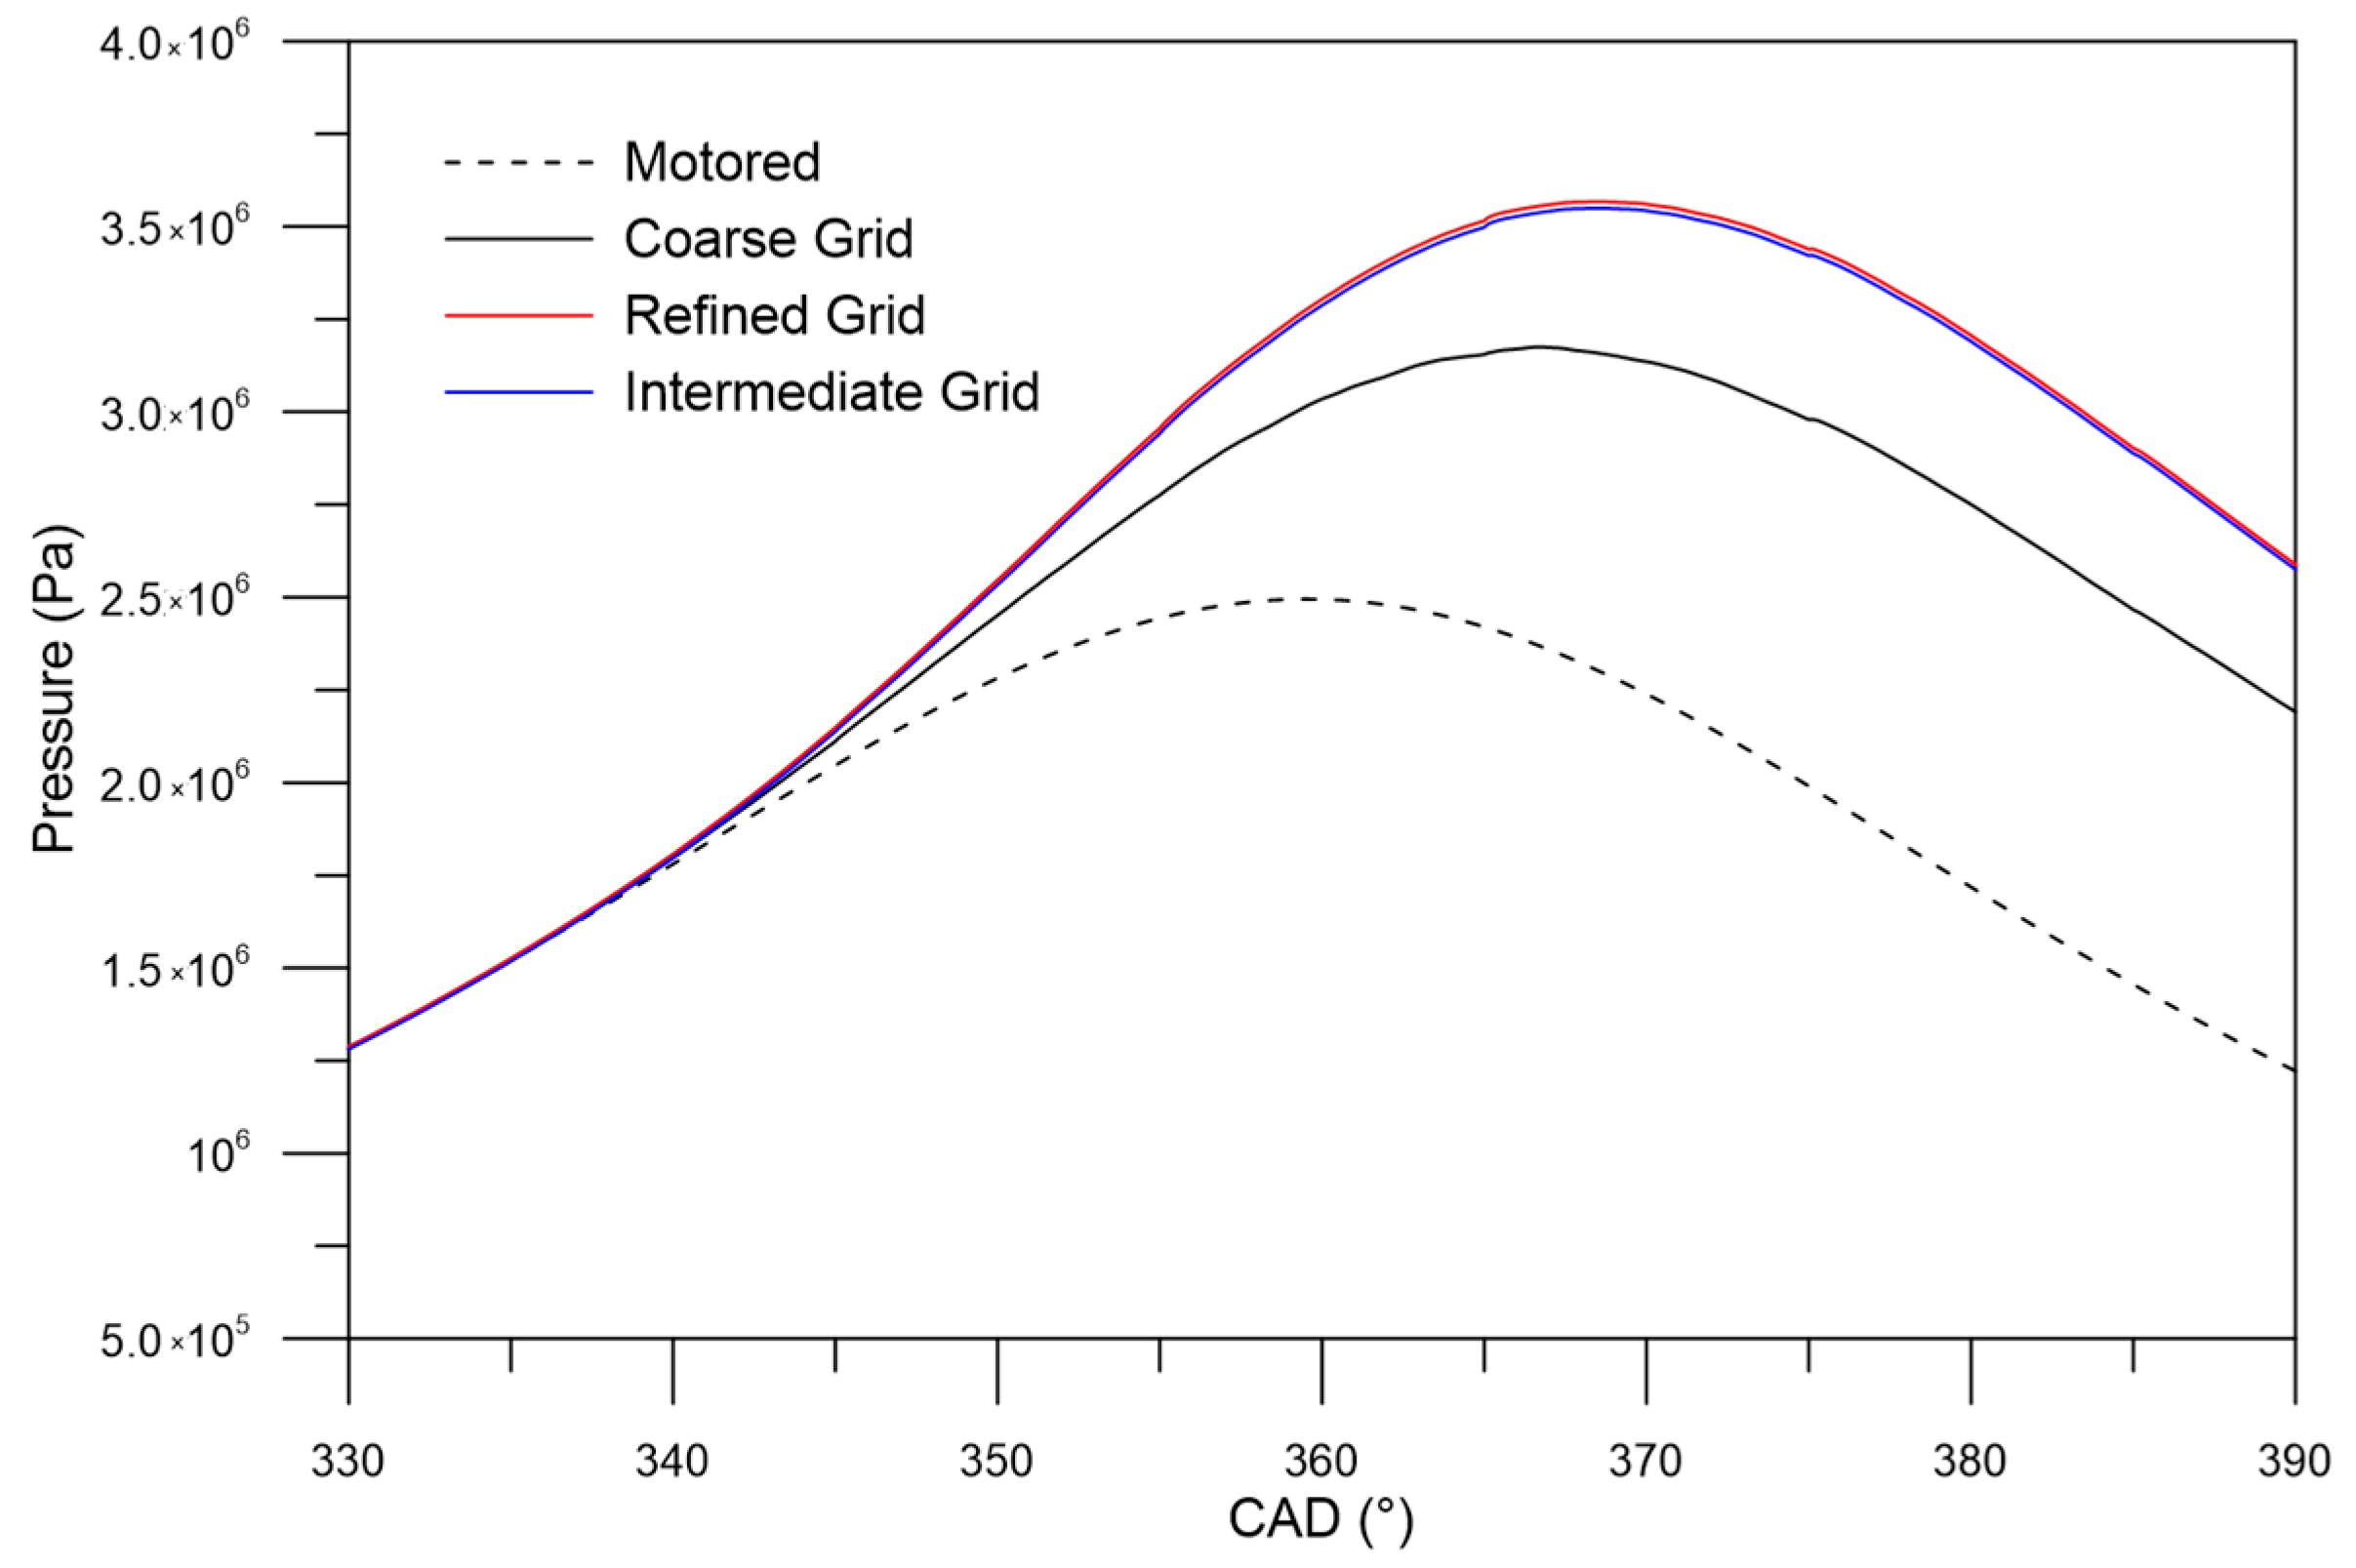
When generating the numerical grid, a maximum cell dimension of 1.5 mm is enforced on average, with refinements specifically applied at the base of both the valves and around the spark plug (grid generation involved setting the cell dimension around the spark and at the base of the valves at 1/32 and 1/16 of the average cell dimension, respectively). This ensures an accurate representation of the mixture discharge and filling processes, as well as of the intervals of flame formation and propagation where the most significant temperature and pressure gradients take place. Along with this numerical grid, two other different computational grids with different resolution are realized to study the effects of grid density on the model results. Beside the numerical grid already described (defined as intermediate grid), a less refined one (coarse) and a more refined one were generated, whose maximum cells dimensions are chosen, respectively, equal to 2 mm and 1 mm. The grid characteristics are reported in Table 4 at the bottom dead center (BDC).
The numerical results of this analysis are obtained considering a homogeneous mixture trapped in the combustion chamber at IVC, composed by a stoichiometric mixture of air and syngas (Case d). The results of the grid sensitivity analysis performed are shown in Figure 2. It is possible to notice how the results between refined and intermediate grids are very similar. On the other hand, the coarse grid gives a lower peak of pressure (of about 4 bar). Therefore, for future simulations, the intermediate grid has been chosen due to the lower computational time (a full closed-valve cycle in the operative condition considered is simulated in about 32 h for the refined grid, 14 h for the intermediate and 6 h for the coarse grid). Figure 3 gives more details about the intermediate computational domain. The resulting grid is illustrated in isometric view during the overlap phase in Figure 3a, where the side-mounted spark is also visible in the combustion chamber. Additionally, Figure 3b provides detailed views around the base of the valves.
2.2.4. Initial and Boundary Conditions
In this paper, the numerical study focuses on just the closed valve phase between the IVC and EVO angles.
Therefore, a preliminary cold flow analysis over the complete operative engine cycle is performed, which involves modelling the airflow and the species mixing throughout the whole operative cycle without considering the chemical reactions of the combustion phase. This study is fundamental for determining the in-cylinder fluid characteristics at the IVC. In particular, cold flow analysis, describing the tumble motion via the intake duct and valve and the turbulence production due to the compression phase allows finding those turbulence parameters needed for the correct initialization of the CFD model at IVC. Therefore, three consecutive full cycles are simulated in cold flow conditions, taking into account the in-cylinder filling and emptying to calculate all of the fluid properties (including k and ε) at the end of the intake stroke so that the combustion can be properly studied starting from the IVC. Figure 4 shows the evolution of the trapped mass inside the combustion chamber for Case a during the three consecutive simulated cycles, while Table 5 reports the initial and final values of pressure, k, ε and trapped mass at IVC at the start and end of the third consecutive simulated cycle. The average error of all of these variables reduces below 5% after three cycles, thus it can be assumed that a correct initialization of the flow-field has been achieved, as these values can be imposed at the IVC as initial conditions.
Figure 5 and Figure 6, respectively, show the evolution at different degrees of the intake stroke of the in-cylinder velocity flow field and of the turbulent kinetic energy and dissipation during the third consecutive cycle simulated in cold flow conditions.
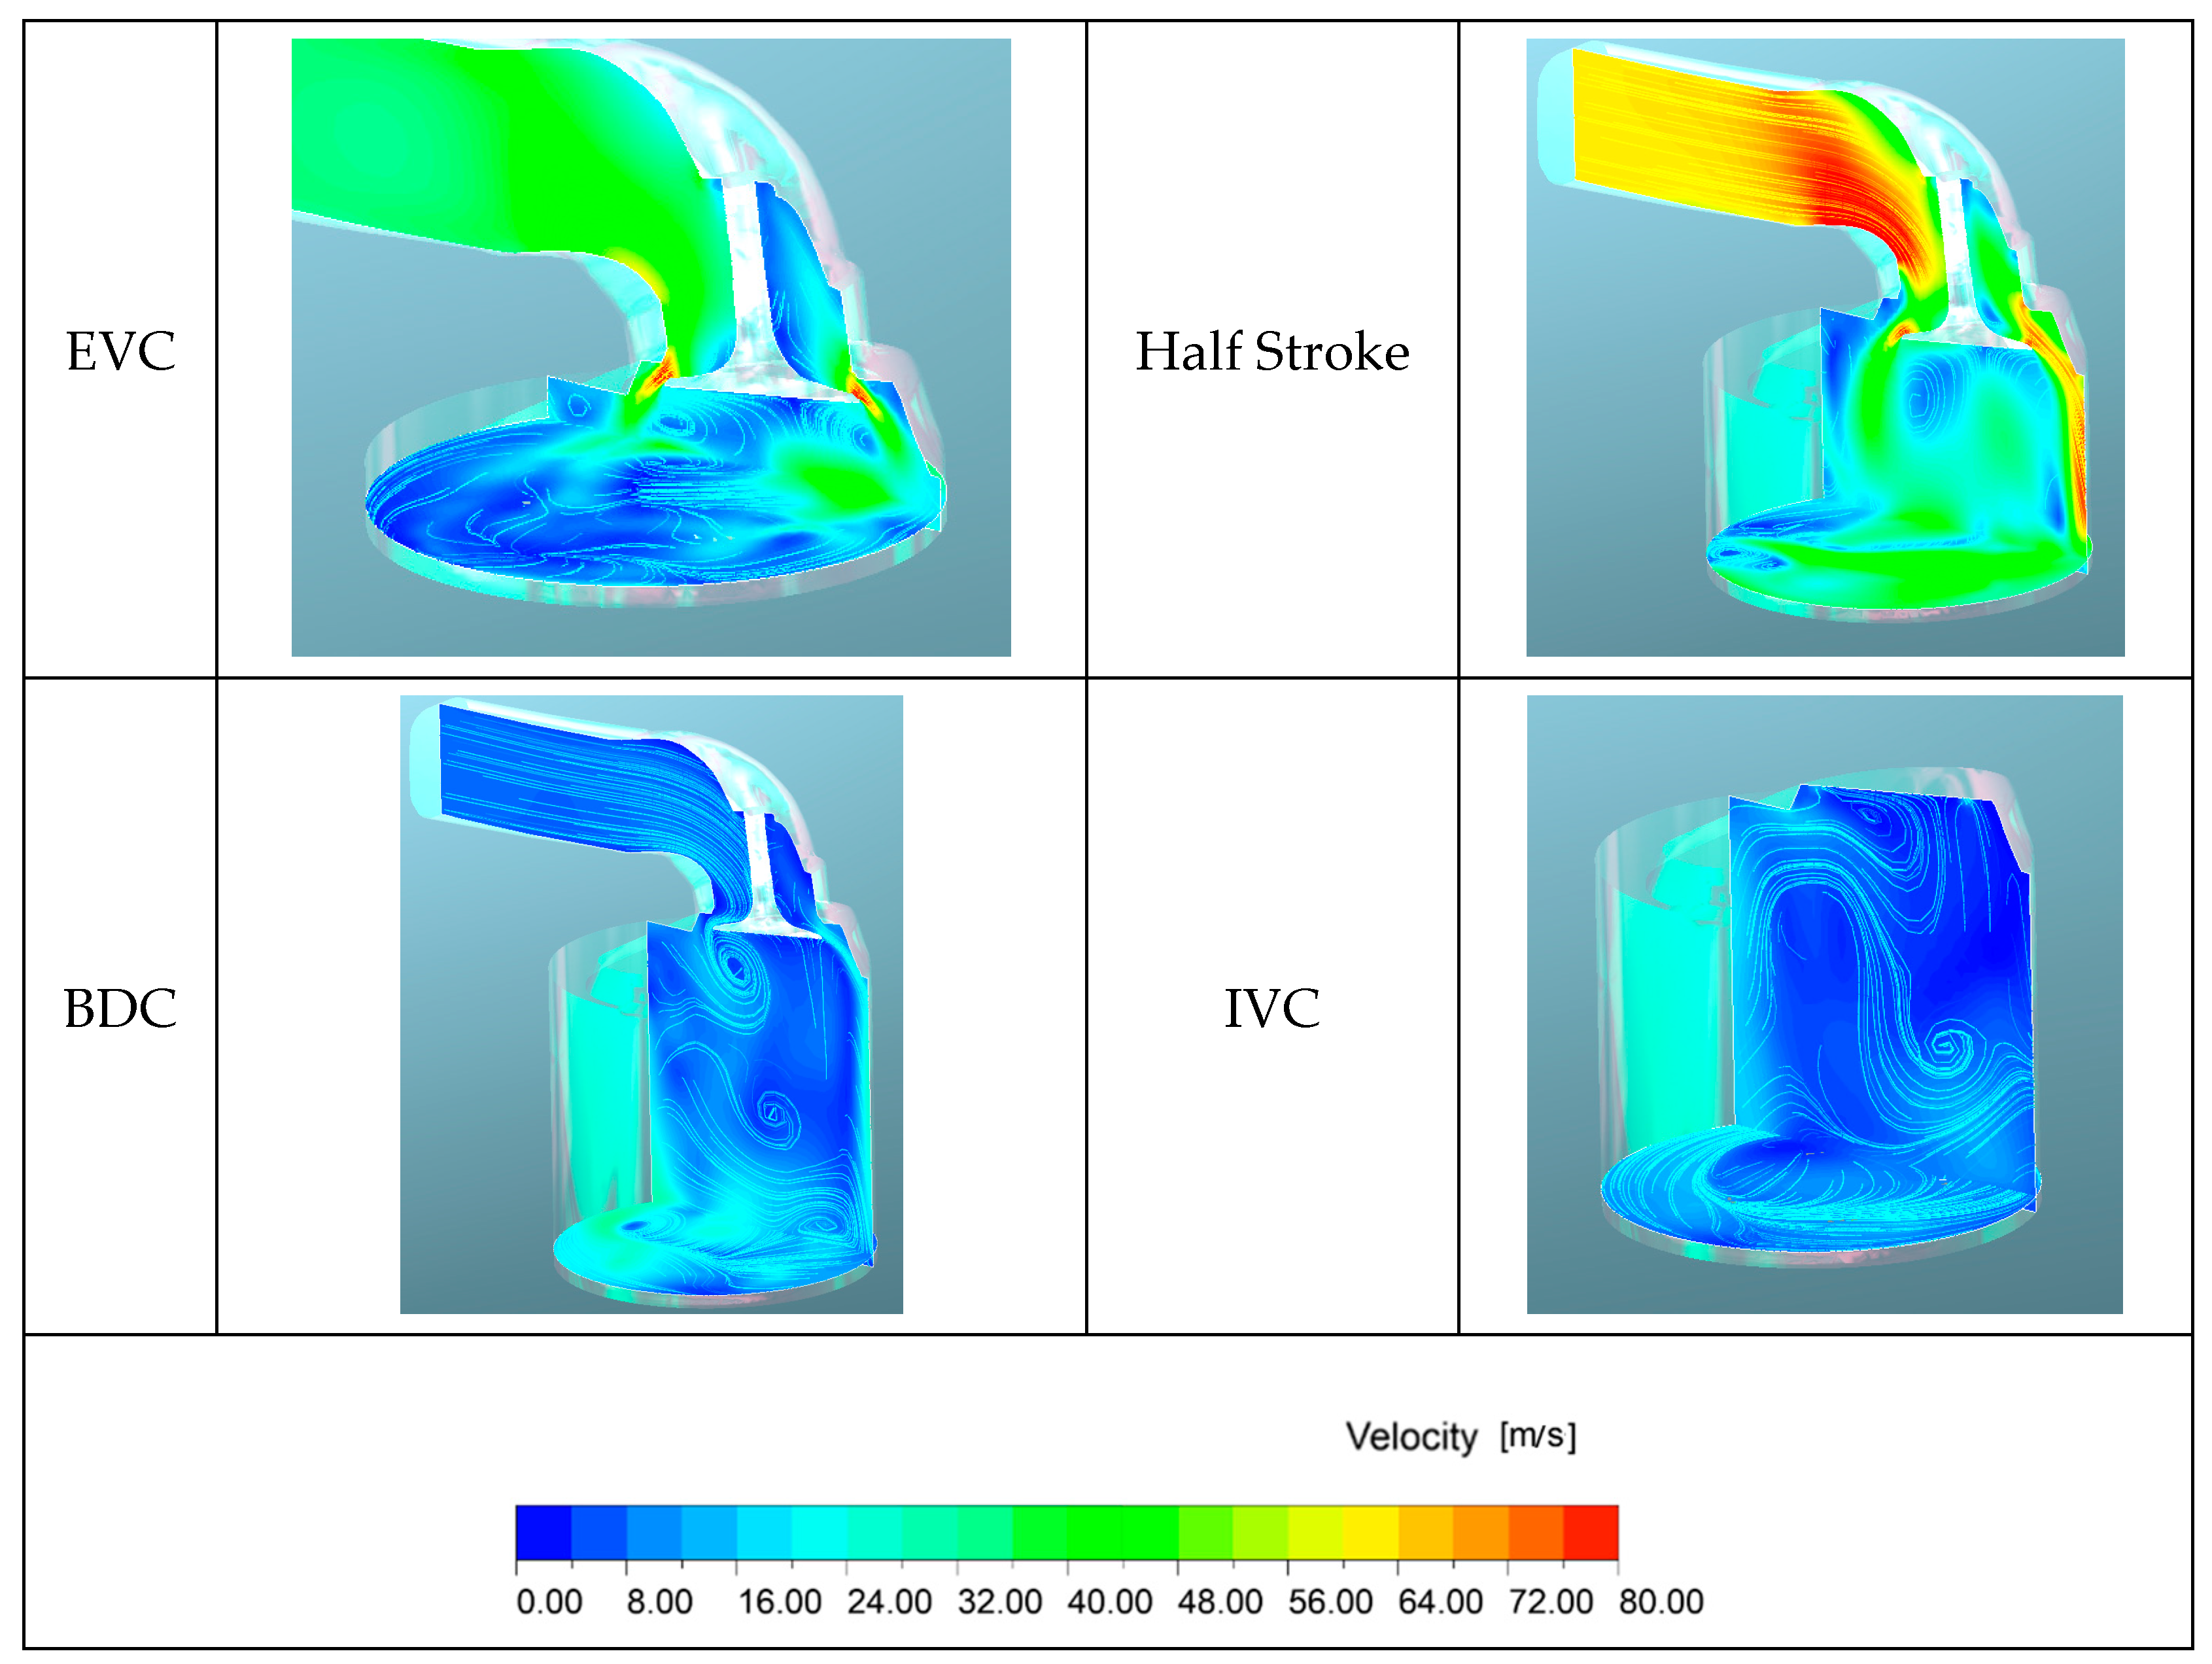
After the EVC, the intake stroke begins. As a result of the motored calculations, the in-cylinder flow evolution is shown in Figure 5, along with the velocity streamlines that help visualizing the turbulence field and, in particular, the tumble motion that is typical of a SI engine. As expected, highest values of fluid velocity are reached when the piston is at half of its stroke (maximum piston speed).
Figure 6, showing turbulence quantities on a longitudinal plane passing through the intake valve axis, confirms that k and ε increase significatively in the inlet area near the valve and when the piston is moving with its maximum speed. Moreover, turbulence is very intense even near the cylinder wall and in particular where the intake jet impinges. Approaching the end of the intake stroke, the turbulence motion field become more homogenous inside the cylinder and due to the asymmetric position of the inlet section it is possible to notice that the turbulent field shows even swirl features.
Table 6 reports the imposed values of wall temperatures in the different zones of the combustion chamber. The remaining set of initial and boundary conditions concerns the value of pressure and temperature imposed at IVC in the combustion chamber according to the results of the cold flow simulation, while the composition of the stoichiometric air-syngas mixture is imposed with reference to Table 3.
3. Results
3D CFD Model Validation
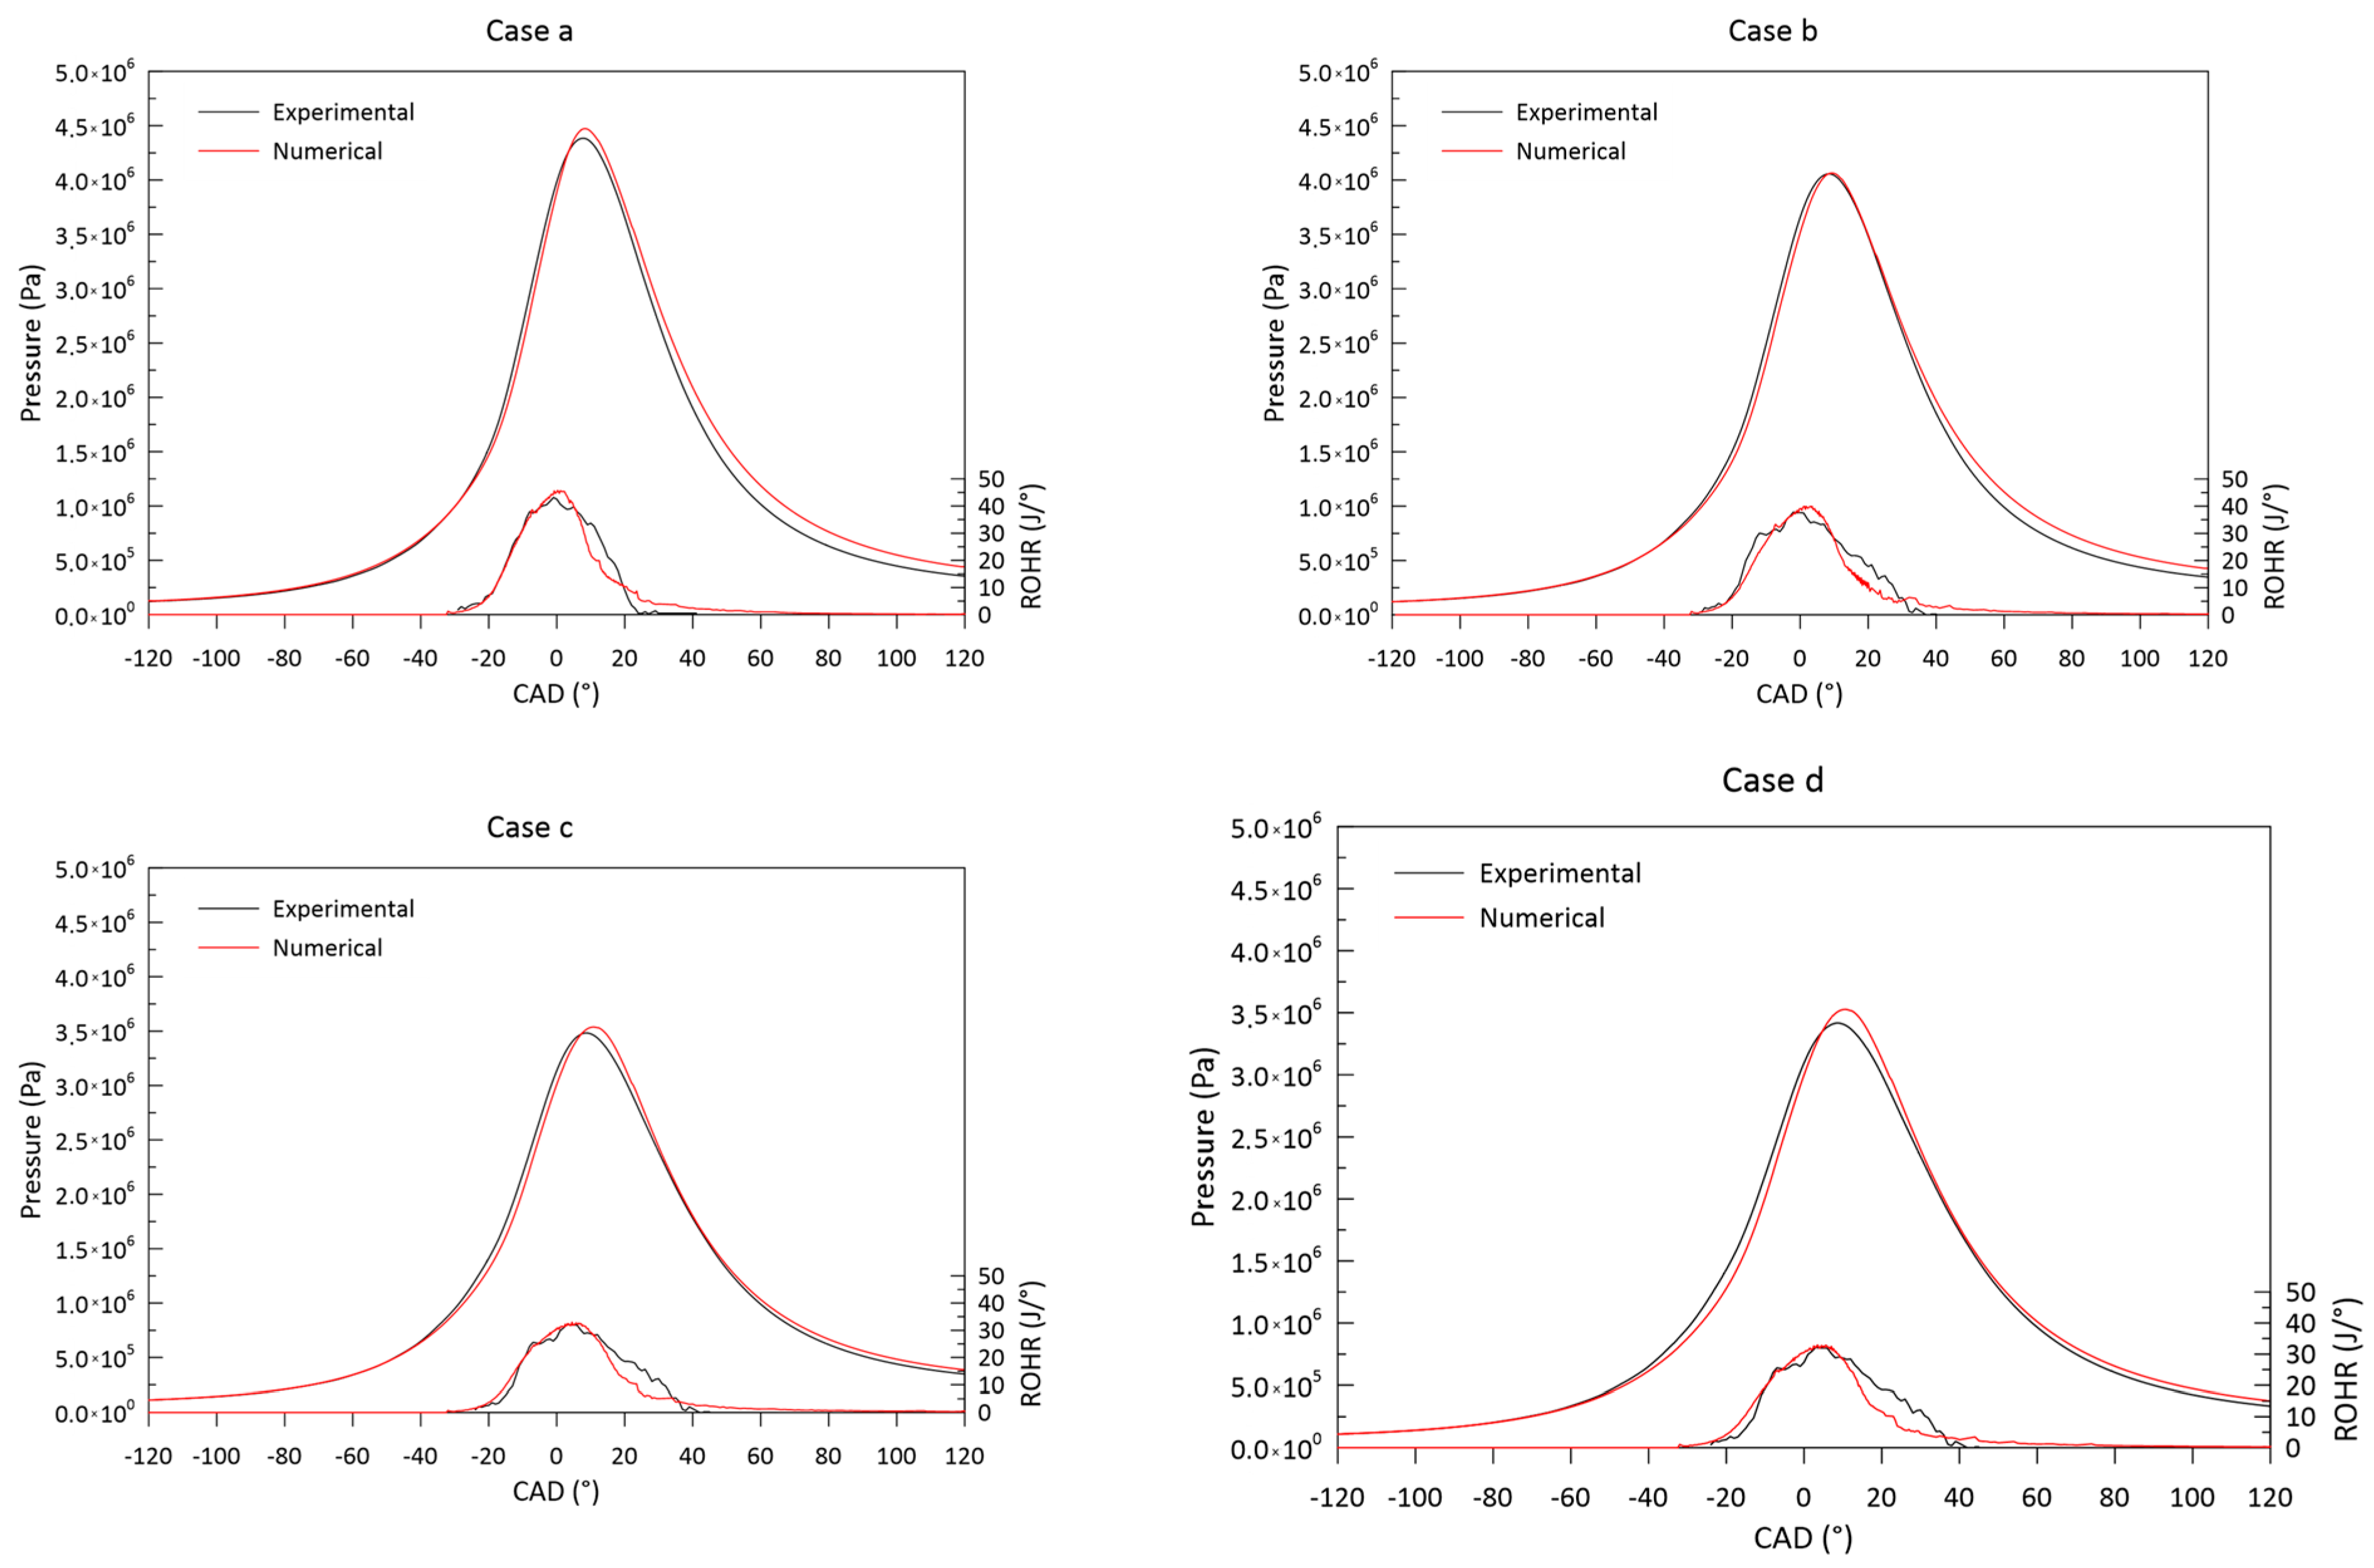
Figure 7 reports the results of the 3D CFD model validation: the agreement achieved between the measured and simulated pressure cycles and rates of heat release (ROHR) curves for all of the syngas compositions is very good. The curves well superimpose during the compression phase, as well as in the position and value of the peak of pressure, while expansion phase is slightly overestimated of about the 6% maximum for the Case b. Therefore, it can be said that the 3D CFD model developed shows good predictive capabilities notwithstanding the fuel changes. The comparison between the measured and calculated mole fractions at EVO of the species CO, CO2, and H2O are instead shown in Figure 8. The presence of CO emissions at the exhaust is a consequence of a low combustion efficiency, which is related to the geometrical configuration of the combustion chamber and more adaptable to traditional fossil fuels rather than bio-derived ones. A peripheral position of the spark plug within the combustion chamber determines an asymmetric propagation of the flame front from the spark towards the walls, thus inhibiting the full oxidation of carbon monoxide as the opposite combustion chamber walls are approached [20,38]. It also must be said that this species is numerically underpredicted while the CO2 results are in good agreement.
4. Discussion
In the present section, the performances of the engine under different syngas fueling operations are compared with the aim of assessing the influence of the fuel composition on the engine efficiencies and overall thermal balance. This comparison can be consistently performed by keeping constant the amount of trapped mass within the combustion chamber, along with the same wall temperatures imposed as boundary conditions. Therefore, simulations relative to the Cases b, c and d are again performed in the operative conditions relative to Case a by varying the imposed temperature at IVC to achieve that the same mixture mass is trapped within the combustion chamber.
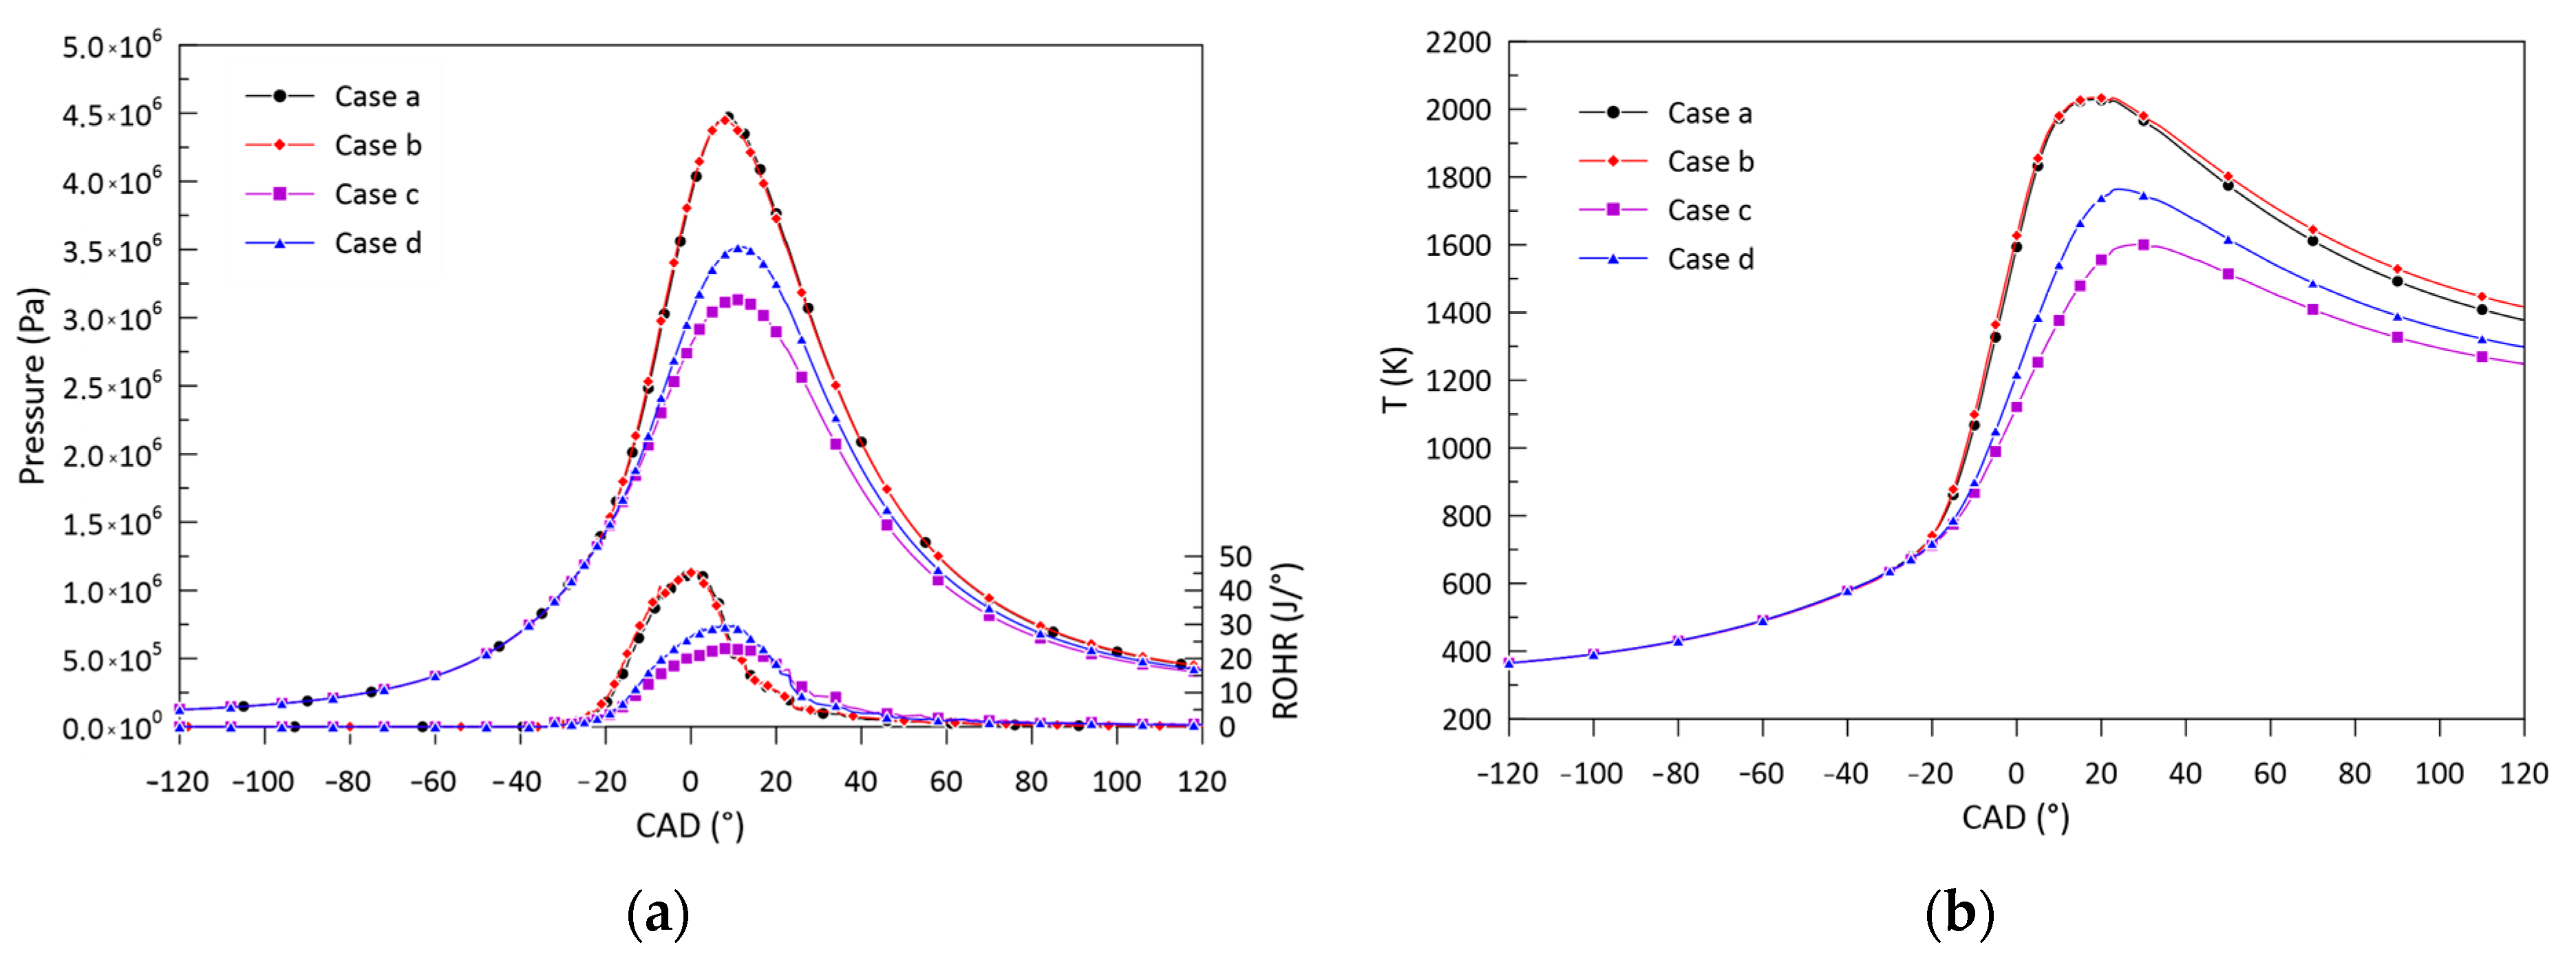
Figure 9a shows the comparison of the numerical pressure and ROHR cycles for the four calculated cases. The better engine performance under Case a and b is evident. The higher amount of H2 characterizing the syngas compositions relative to Case a and b with respect to Case c and d (Table 2) determines ROHR curves with a faster growth in the early combustion phase. This effect adds up to the higher amount of CO trapped within the combustion chamber at IVC, this last increasing the LHV of the mixture and thus the achieved peaks of pressure and temperature (Figure 9b).
The primary power introduced in the combustion chamber can be estimated through the following formula:
that is the product between the syngas flowrate (kg/s) and its lower heating value (J/kg). According to the first law analysis, this equals the sum of the power produced through combustion, the power lost through the walls due to heat transfer effects and the thermal power associated to the exhaust gases [22,26]. Specifically, the indicated power produced by combustion is here evaluated through the formula:
where the integral of the pressure cycle over the volume (the indicated work) is multiplied by the engine speed (in rev/s).
The heat losses through the engine walls are evaluated by the 3D CFD model basing on the Reynolds analogy between the viscous and thermal boundary layer in the momentum and energy transport equations [40].
Lastly, the power associated with the exhaust gas is composed by the enthalpy losses due to incomplete combustion and by the sensible part. The former is evaluated from the time integral of the ROHR, while the sensible part is calculated by difference, although it represents the recoverable heat calculated as follows:
where is the exhaust mass flowrate, is the mixture heat capacity at constant pressure, is the temperature of the mixture at EVO and is a reference temperature [41].
The amount of the indicated power, exhaust gases power and heat losses are then calculated and compared in Figure 10a and Figure 10b, respectively, in absolute and percentage values.
Case a and b show the highest indicated efficiency ranging between 34.77 and 35.52%. On the other hand, Case c and d are characterized by the lowest values of power lost through the walls, reporting an average value of 9.6% with respect to about 10.6–10.8% relative to Cases a and b. This last effect is of interest in the present work and can be attributed to different concurrent causes. Figure 11, as an example, represents the specific heat at constant pressure characterizing Cases a and b is higher than the others, mainly because a higher fraction of H2 is trapped in the combustion chamber (Table 2). This result is coherent with findings of literature [22]. H2 is indeed characterized by high value cP (around 14,300 J/kgK at standard conditions with respect to the values ranging between 920 and 2200 of the other species compounding the mixture), but also by higher thermal conductivities. Besides this, the highest values of average temperatures within the combustion chamber explain the higher values of wall heat losses.
The comparison of the total power lost through walls for Case a is reported into detail in Figure 12 with the relative contributions of the chamber, liner and piston walls: the total heat transfer mainly takes place through the chamber and indeed piston walls up to a CAD of 50° ATDC. Indeed, as the combustion phase starts, the piston is nearly around the TDC, thus the liner walls are poorly affected by this phenomenon, which in turns begins to be preponderant as the piston descends.
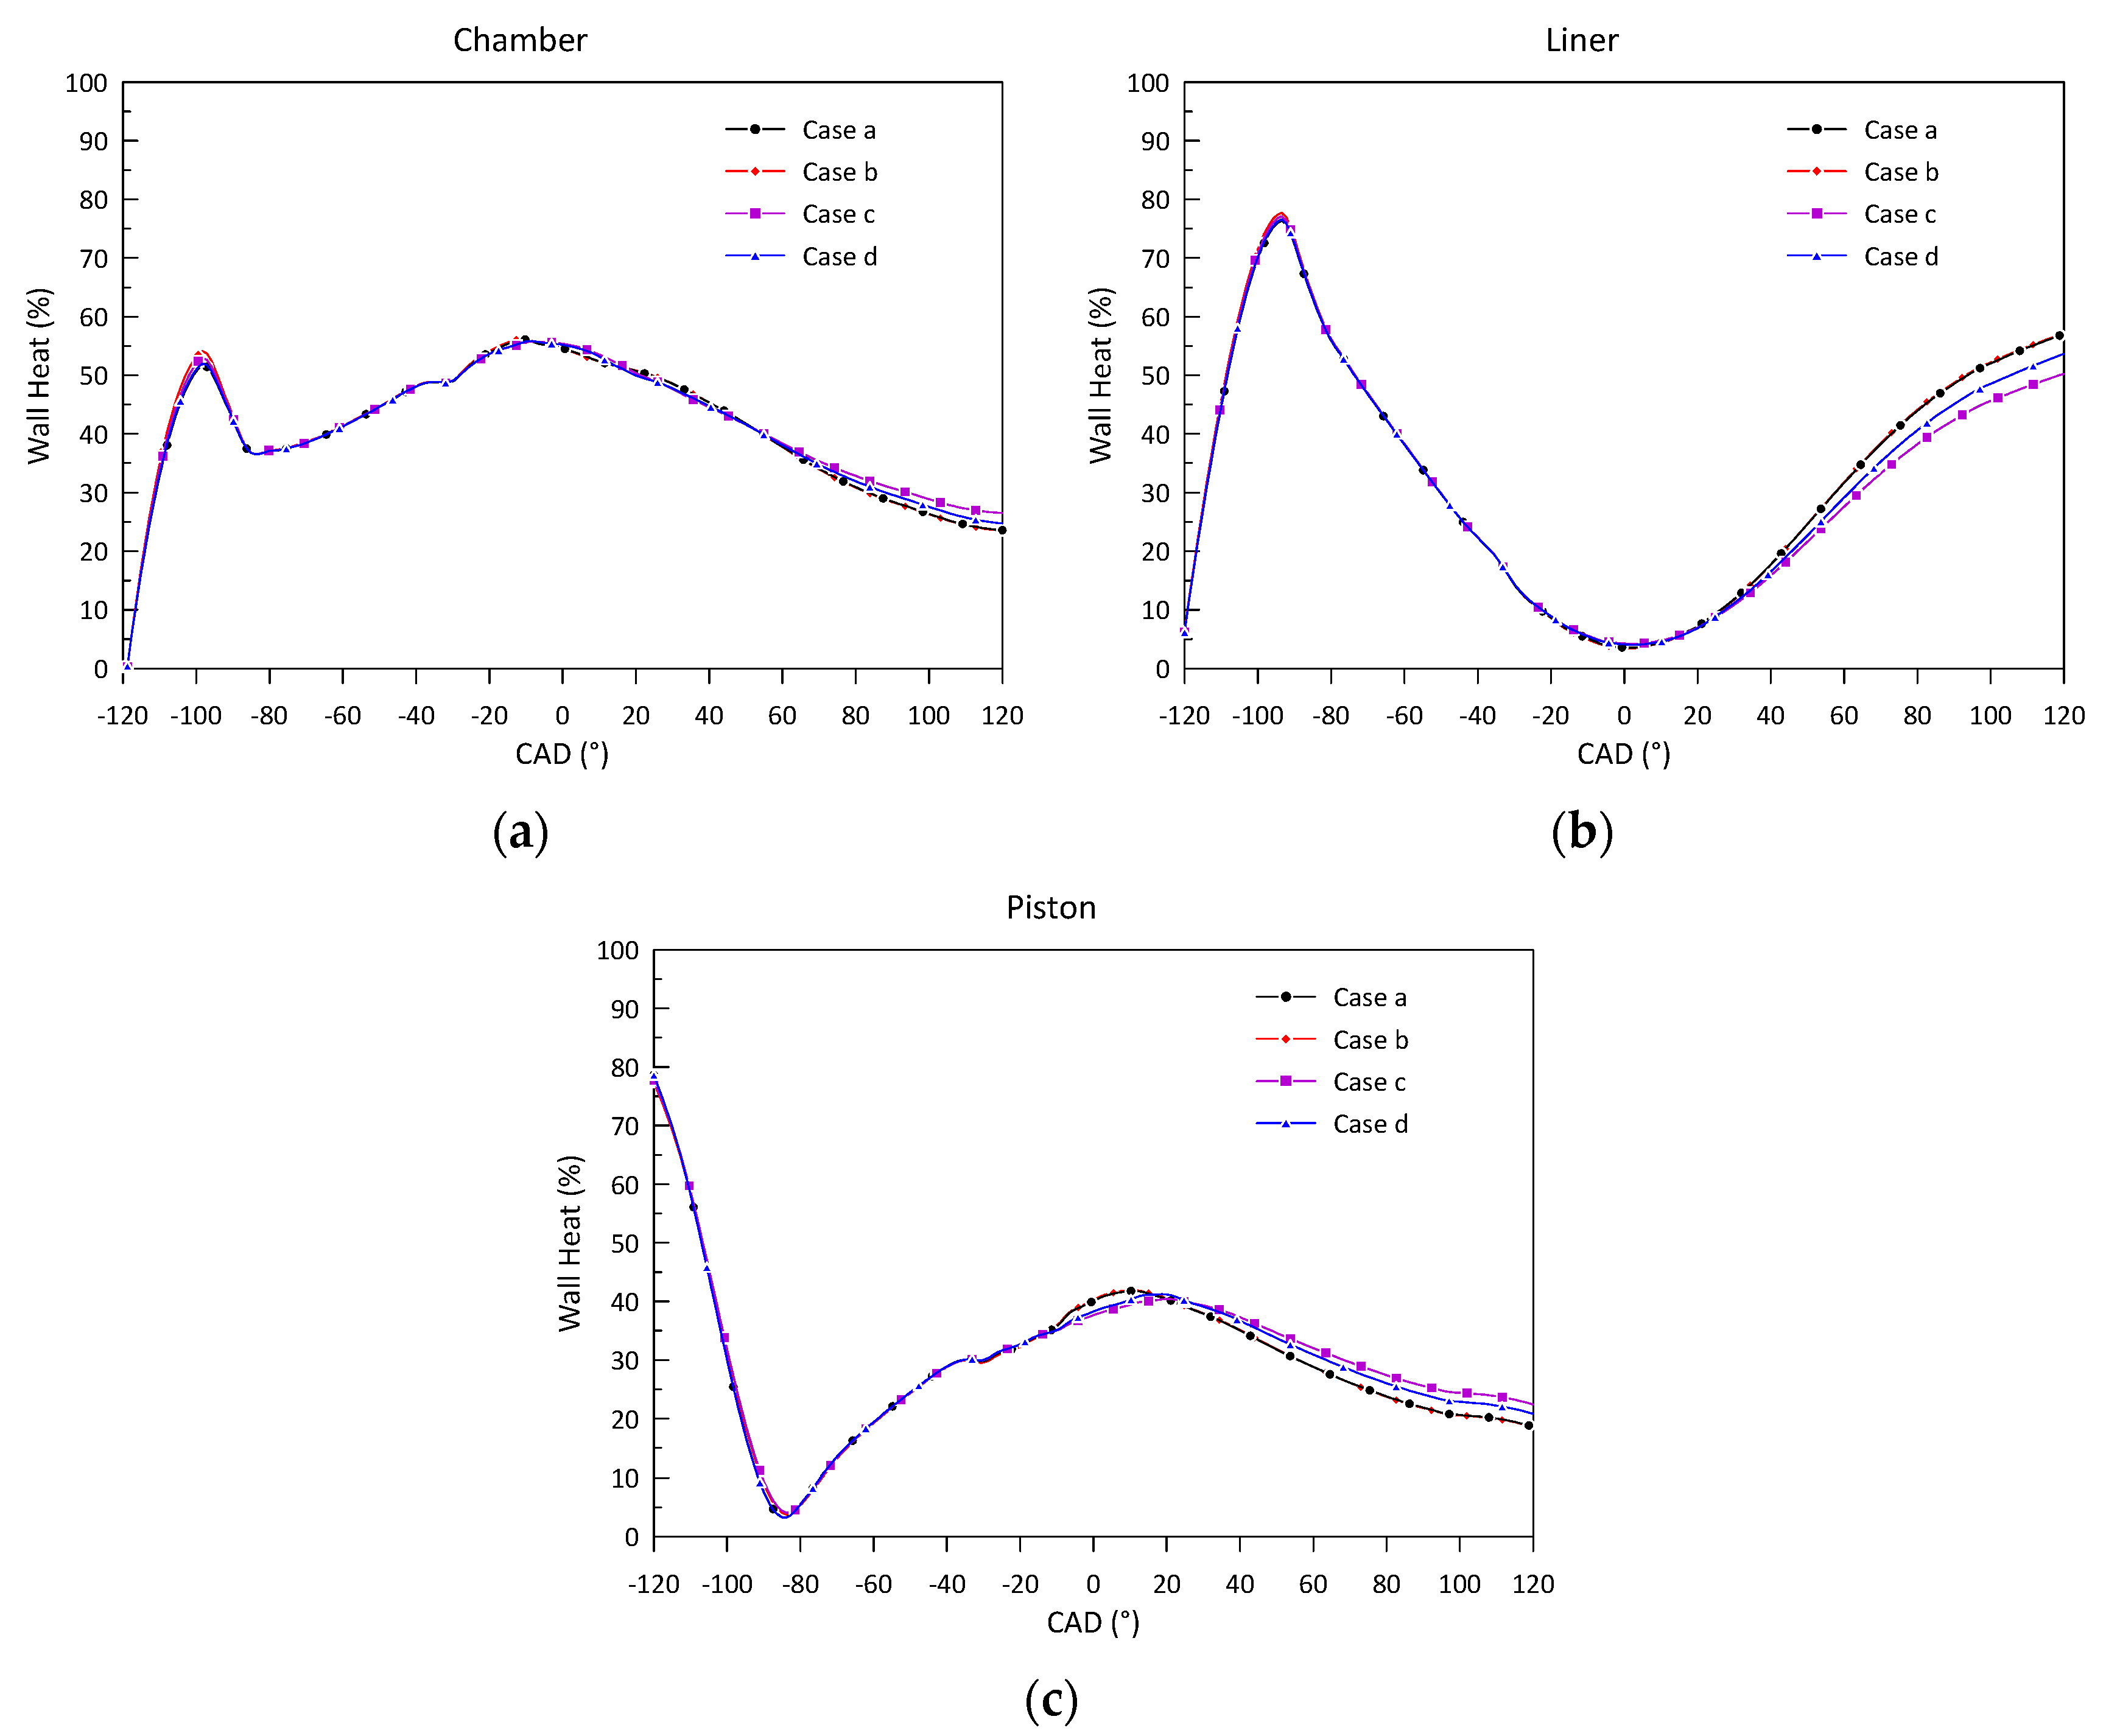
Therefore, an investigation about the relative influence of each wall on the overall heat transfer phenomenon is conducted. The analysis of the results shown in Figure 13 leads to three important findings:
- The evolution of the heat lost through the chamber, liner and piston walls coincides in all of the analyzed cases up to 40–50° ATDC, despite the syngas composition;
- The heat transfer through the liner wall is alone responsible of around the 55–60% of the total power lost from 50° ATDC up to EVO, that is indeed due to the engine cooling effect;
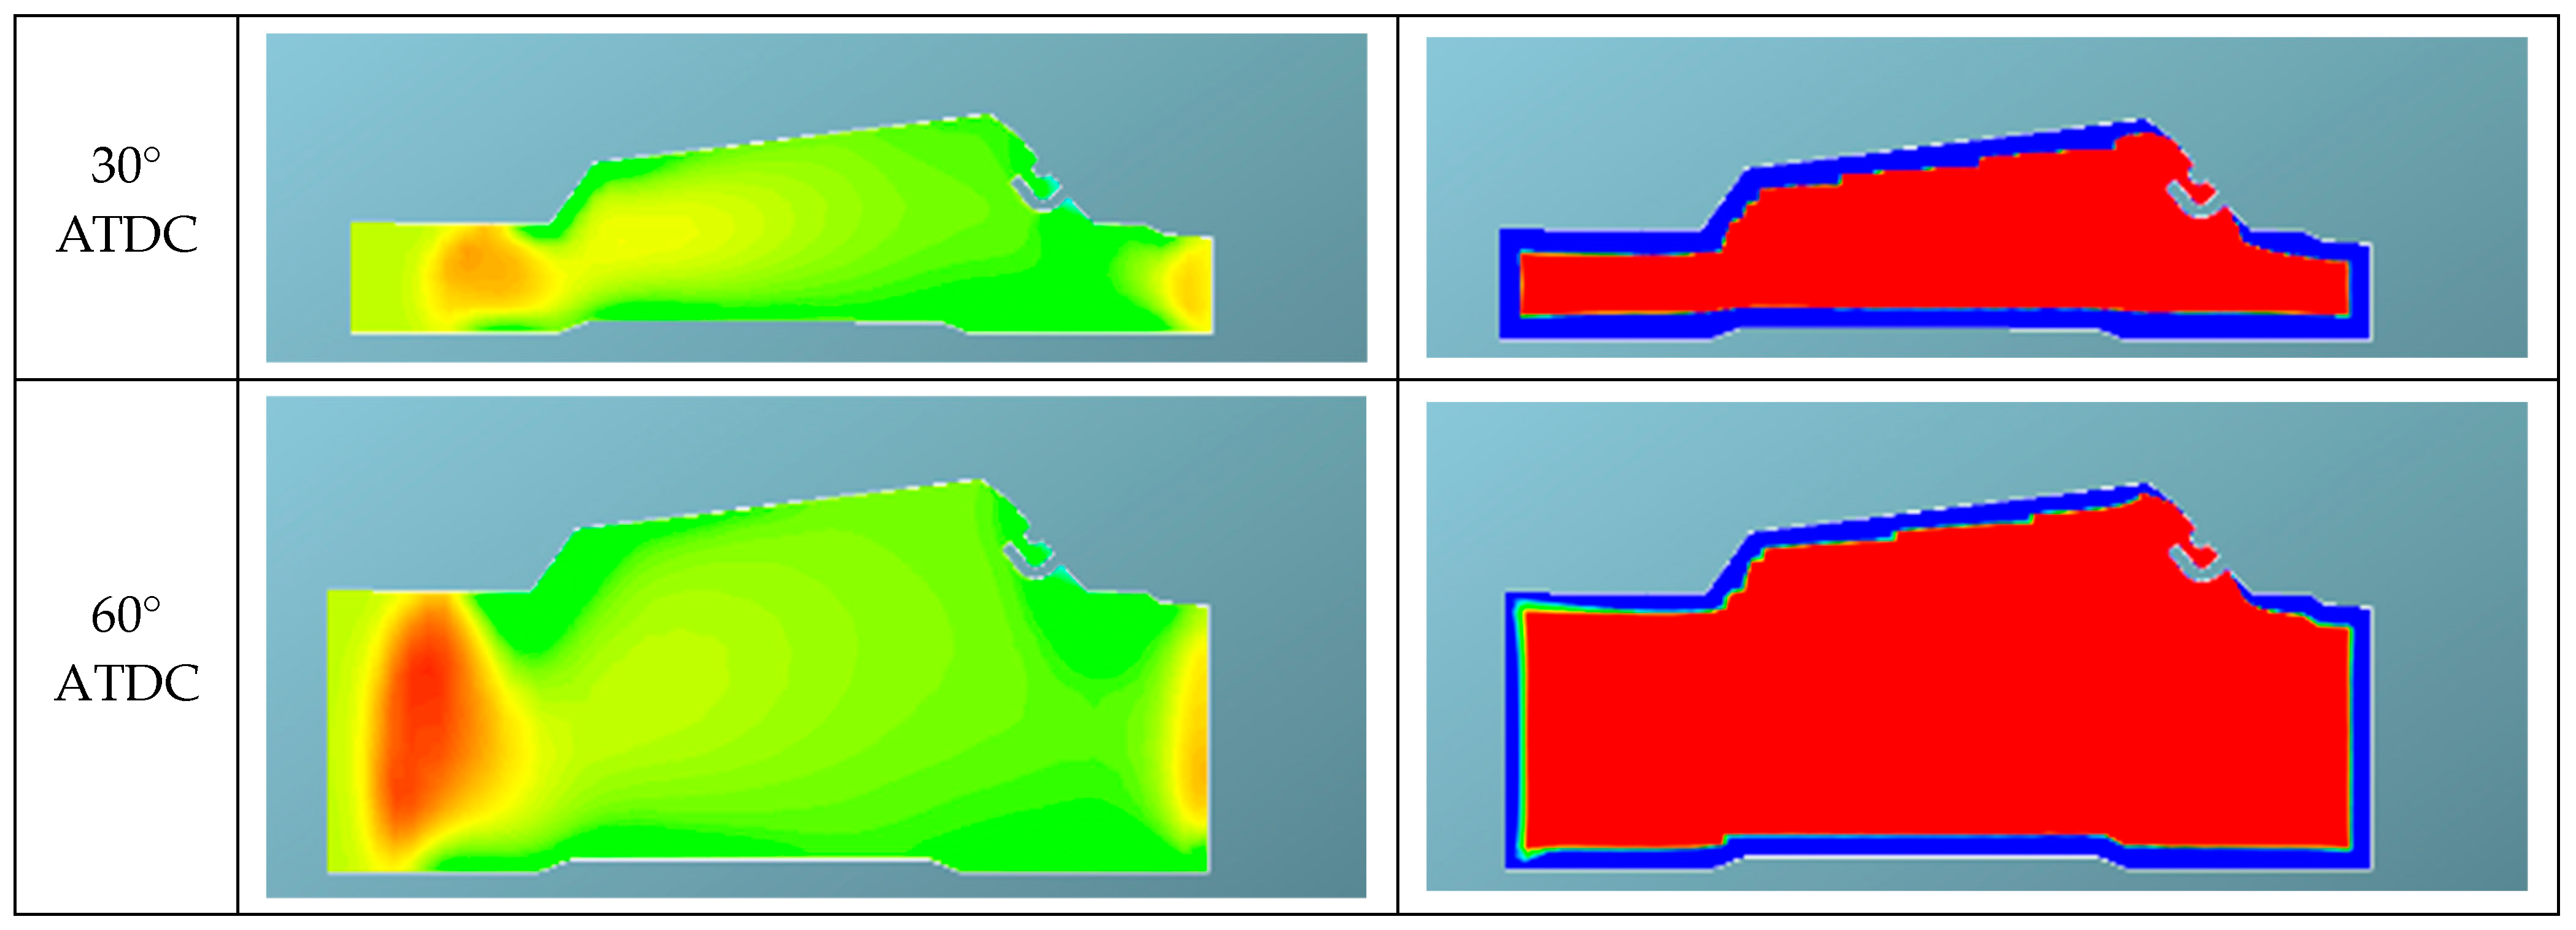
- The heat transfer through the liner of Case b and Case c shown in Figure 13b shows the lowest values with respect to the other cases mainly due to the lower values of average temperature of the whole combustion cycle. This trend, however, is opposite to the one occurring through the chamber and piston walls, shown in Figure 13a,c. Also, the difference between Cases c and d is not fully clear. For these reasons, a visualization of the distribution of the species within the combustion chamber is studied. As an example, following Figure 14 reports the N2 mass fraction distribution with the corresponding wall heat flux (W/m2) relative to Case c at different values of CAD, chosen in the interval where the heat transfer through the liner is greater. Images are reported in a plane passing through the spark plug. The wall heat flux is indicated with negative values according to the flux exiting convention.
As assessed also in previous publications [18,20], the low combustion efficiency associated to the syngas combustion occurring in this engine produces an excessive amount of CO at the engine exhaust. This phenomenon is mainly related to an incomplete combustion process due to the peripheral spark plug position that determines an asymmetric propagation of the flame front, as already discussed, with the persistence of residual gases on the opposite side of the chamber. The higher amount of N2 near the liner wall opposite to the spark is evident on the left of the figure. Also, the wall heat flux is not symmetrical and is highly affected by the position of the spark, mainly after 60° ATDC. This phenomenon is indeed found common for all of the syngas mixtures tested in present paper, as it is a peculiar characteristic of the combustion chamber geometry of this engine. Case c is chosen as it is the operative condition where the amount of N2 has its highest value at EVO, as reported in Table 7, which in turns reflects to a decrement in the heat losses through the liner wall also with respect to Case d. It must be observed that the trend reported in Table 7 does not reflect the initial amount of N2 trapped in the syngas reported in Table 3.
Comparison of the Overall Energy Efficiencies of the Analyzed Layouts
In the present subsection, the mass and energy balances are quantitatively analyzed to compare the overall efficiencies that characterize the whole co-generative system, from the biomass thermochemical conversion process occurring in the gasifier up to the final power products, these lasts depicted through the 3D CFD model.
In the specific, the following power balance equation can be considered [42]:
where:
- is the biomass primary power introduced in the gasifier, equal to the product between the biomass calorific value and its flowrate;
- , relative to the air flow entering the gasifier, equal to the product of the air flowrate, the specific heat at constant pressure (1.01 kJ/kgK) and the difference between the air temperature and a reference temperature (25 °C);
- , the power linked to the sensible heat of the residual ashes, equal to the product between the instantaneous ash flowrate, its specific heat at constant pressure (1 kJ/kgK) and the difference between the temperature of the ashes and the reference temperature;
- , power linked to the evaporation of the moisture content present in the biomass during gasification. It consists of three contributions:
- ○
- The product between the instantaneous moisture content contained in the biomass, the specific heat of the liquid water (equal to 4.184 kJ/kg) and the difference between the boiling temperature (100 °C) and the reference temperature (25 °C);
- ○
- The product between the instantaneous amount of moisture contained in the biomass and the latent heat of vaporization of the water equal to 2272 kJ/kg;
- ○
- The product between the instantaneous flow rate of evaporated humidity, the specific heat of the vapor and the difference between the temperature of the syngas and the boiling temperature;
- , the total power linked to the produced syngas, sum of two contributions [42]:
- ○
- , equal to the product between the syngas mass flowrate and its lower calorific value;
- ○
- , equal to the sum of the products between the enthalpies of formation of each species present in the syngas and their respective mass fraction.
In the same way, the energy balance of the internal combustion engine can be written as [43]:
where the right-hand terms respectively represent each of the contribution analyzed in previous section by the 3D CFD developed model. Therefore, the performance of the different Cases here analyzed can be quantitatively compared thanks to the definition of the following parameters:
In the specific, the ratio between the lower calorific values of the produced syngas and the source feedstock, multiplied by the respective flowrates, allows one to quantify the ratio between the amount of chemical energy that can be exploited from the produced gaseous mixture and the primary energy introduced in the system. This ratio is called cold gas efficiency (CGE) and is a significant parameter quantifying the overall efficiency of the gasification system. In the same way, the ratio between the electrical and exhaust gases thermal power produced by the engine with respect to the primary energy introduced in the ICE and linked to the syngas is expressed in Equations (7)–(9), while Equations (10)–(12) express the electric and thermal efficiencies related to the whole system. Table 8 summarizes these parameters for each of studied Cases. Reported values refer to a single cylinder belonging to the ICE.
As expected, Case c is the one where the lower electric and thermal production occur, with a large influence also over the total conversion efficiency of the whole cogenerative system, as depicted from the and CGE values. This is a combined consequence of the presence of large inert quantities in the syngas mixture and low combustion efficiency. Therefore, it can be said that the important effect given by the inerts presence (mostly N2) in terms of reduction of the heat losses towards the wall does not equally counterbalance the power derating which the ICE is subjected to.
5. Conclusions
A 3D CFD model of a syngas-fueled ICE belonging to a real mCHP is here employed to compare engine performances under different syngas compositions. The analysis is aimed at quantifying the influence of the inert species over the power produced and over the heat transfer phenomenon through the cylinder walls.
The validation of the proposed 3D CFD model is made on the basis of experimental measurements performed during tests where four syngas compositions deriving from the gasification of four different biomasses are used. A good agreement with experimental measurements is found in terms of pressure cycles, ROHR curves, and pollutant emissions. The better engine performances under Case a and b are evident, mostly thanks to the higher amount of H2 characterizing the syngas compositions which determines ROHR curves with a faster growth in the early combustion phase, and thus better combustion efficiencies.
Therefore, a consistent comparison of the engine efficiencies under the four cases is numerically performed in the same operative conditions at IVC (pressure, air/syngas trapped mass), in terms of generated indicated power, heat losses, and exhaust thermal power. Identification of factors affecting wall heat losses is performed.
The main findings reveal that the heat transfer mainly occurs through the chamber and piston walls up to 50° ATDC, with the presence of inert gases determining counteracting the effects of the decrease of the syngas lower calorific value and an insulating effect along the liner walls, with large fractions of N2 having a major role.
Indeed, the geometrical features of the combustion chamber determine a not uniform distribution of inert species within the combustion chamber: as an example, high densities of N2 along the liner wall are visualized. This has a non-uniform distribution of insulation and heat losses are found higher in the region where the spark plug is present.
However, the mass and energy balances of the overall co-generative layout analyzed in the last part of this work, aimed at comparing the efficiencies that characterize the different components of the system during each of the Case under study, also reveal that despite the favorable effect over the thermal dissipation through the walls, the biomass-to-ICE chain mostly benefits of high-quality syngas from biomasses with low-ashes content (Cases a and b), as the overall conversion efficiency doubles with respect to Cases c and d.
In conclusion, the numerical approach here proposed also aims at pointing out the relevance of considering different biological feedstocks as renewable sources exploited to achieve fuel for energy purposes, to derive hints related to the possible optimization of the fuel-engine coupling and to balance at the best the opposite effects taking place during the engine conversion process. Next steps will be focused on the analysis of the influence of parameters as the spark angle, the equivalence ratio, or the engine speed over the overall engine efficiencies.
Author Contributions
Conceptualization, M.C. and D.P.; methodology, M.C. and D.P.; software, M.C. and D.P.; validation, M.C. and D.P.; formal analysis, M.C. and D.P.; investigation, M.C.; resources, M.C.; data curation, D.P.; writing—original draft preparation, D.P.; writing—review and editing, M.C. and D.P.; visualization, D.P.; supervision, M.C. All authors have read and agreed to the published version of the manuscript.
Funding
This research received no external funding.
Data Availability Statement
Data is contained within the article.
Acknowledgments
A particular acknowledgement goes to the organizers of the SDEWES 23 Conference for selecting present paper for the Energies Special Issue publication.
Conflicts of Interest
The authors declare no conflicts of interest.
Nomenclature
| Heat Capacity at constant pressure [kJ/kgK] | |
| Flowrate [kg/s] | |
| 0D | Zero Dimensional |
| 1D | Mono Dimensional |
| 3D | Three Dimensional |
| ATDC | After Top Dead Center |
| BTDC | Before Top Dead Center |
| C2H4 | Ethylene |
| C2H6 | Ethane |
| C3H8 | Propane |
| CAD | Crank Angle Degree |
| CFD | Computational Fluid Dynamics |
| CH4 | Methane |
| CHP | Combined Heat and Power |
| CI | Compression Ignition |
| CO | Carbon Oxide |
| CO2 | Carbon Dioxide |
| EGR | Exhaust Gas Recirculation |
| EVC | Exhaust Valve Close |
| EVO | Exhaust Valve Open |
| H2O | Water–Vapour |
| HTC | HydroThermal Carbonization |
| ICE | Internal Combustion Engine |
| IVC | Intake Valve Close |
| IVO | Intake Valve Open |
| LHV | Lower Heating Value |
| N2 | Nitrogen |
| NOx | Nitrogen Oxides |
| RANS | Reynolds Averaged Navier Stokes |
| ROHR | Rate of Heat Release |
| SI | Spark Ignition |
| Revolution Speed [rev/s] | |
| Temperature [K] | |
| Volume [m3] | |
| Pressure [Pa] |
References
- Hashemisohi, A.; Wang, L.; Shahbazi, A. Numerical Analysis of Tar and Syngas Formation during the Steam Gasification of Biomass in a Fluidized Bed. Energies 2023, 16, 5283. [Google Scholar] [CrossRef]
- IEA, Bioenergy. Report 2022. Available online: https://www.iea.org/reports/bioenergy (accessed on 2 February 2023).
- Tavares, R.; Monteiro, E.; Tabet, F.; Rouboa, A. Numerical investigation of optimum operating conditions for syngas and hydrogen production from biomass gasification using Aspen Plus. Ren. Energy 2020, 146, 1309–1314. [Google Scholar] [CrossRef]
- Dhrioua, M.; Ghachem, K.; Hassen, W.; Ghazy, A.; Kolsi, L.; Borjini, M.N. Simulation of biomass air gasification in a bubbling fluidized bed using aspen plus: A comprehensive model including tar production. ACS Omega 2022, 7, 33518–33529. [Google Scholar] [CrossRef] [PubMed]
- Martinez, S.; Michaux, G.; Salagnac, P.; Bouvier, J.L. Micro-combined heat and power systems (micro-CHP) based on renewable energy sources. Energy Convers. Manag. 2017, 154, 262–285. [Google Scholar] [CrossRef]
- Klimantos, P.; Koukouzas, N.; Katsiadakis, A.; Kakaras, E. Air-blown biomass gasification combined cycles (BGCC): System analysis and economic assessment. Energy 2009, 34, 708–714. [Google Scholar] [CrossRef]
- Copa, J.R.; Tuna, C.E.; Silveira, J.L.; Boloy, R.A.M.; Brito, P.; Silva, V.; Eusébio, D. Techno-economic assessment of the use of syngas generated from biomass to feed an internal combustion engine. Energies 2020, 13, 3097. [Google Scholar] [CrossRef]
- Santos, S.M.; Assis, A.C.; Gomes, L.; Nobre, C.; Brito, P. Waste Gasification Technologies: A Brief Overview. Waste 2022, 1, 140–165. [Google Scholar] [CrossRef]
- Salem, A.M.; Dhami, H.S.; Paul, M.C. Syngas production and combined heat and power from scottish agricultural waste gasification—A computational study. Sustainability 2022, 14, 3745. [Google Scholar] [CrossRef]
- Demirbas, A. Combustion characteristics of different biomass fuels. Prog. Energy Combust. Sci. 2004, 30, 219–230. [Google Scholar] [CrossRef]
- Nunes, L.J.R.; Causer, T.P.; Ciolkosz, D. Biomass for energy: A review on supply chain management models. Renew. Sustain. Energy Rev. 2020, 120, 109658. [Google Scholar] [CrossRef]
- Lo, S.L.Y.; How, B.S.; Leong, W.D.; Teng, S.Y.; Rhamdhani, M.A.; Sunarso, J. Techno-economic analysis for biomass supply chain: A state-of-the-art review. Renew. Sustain. Energy Rev. 2021, 135, 110164. [Google Scholar] [CrossRef]
- Dhrioua, M.; Hassen, W.; Kolsi, L.; Anbumalar, V.; Alsagri, A.S.; Borjini, M.N. Gas distributor and bed material effects in a cold flow model of a novel multi-stage biomass gasifier. Biomass Bioenergy 2019, 126, 14–25. [Google Scholar] [CrossRef]
- Maitlo, G.; Ali, I.; Mangi, K.H.; Ali, S.; Maitlo, H.A.; Unar, I.N.; Pirzada, A.M. Thermochemical conversion of biomass for syngas production: Current status and future trends. Sustainability 2022, 14, 2596. [Google Scholar] [CrossRef]
- Vargas-Salgado, C.; Águila-León, J.; Alfonso-Solar, D.; Malmquist, A. Simulations and experimental study to compare the behavior of a genset running on gasoline or syngas for small scale power generation. Energy 2022, 244, 122633. [Google Scholar] [CrossRef]
- Caligiuri, C.; Žvar Baškovič, U.; Renzi, M.; Seljak, T.; Oprešnik, S.R.; Baratieri, M.; Katrašnik, T. Complementing syngas with natural gas in spark ignition engines for power production: Effects on emissions and combustion. Energies 2021, 14, 3688. [Google Scholar] [CrossRef]
- Dhrioua, M.; Hassen, W.; Kolsi, L.; Ghachem, K.; Maatki, C.; Borjini, M.N. Simulation of Prosopis juliflora Air Gasification in Multistage Fluidized Process. Processes 2020, 8, 1655. [Google Scholar] [CrossRef]
- Costa, M.; Buono, A.; Caputo, C.; Carotenuto, A.; Cirillo, D.; Costagliola, M.A.; Di Blasio, G.; La Villetta, M.; Macaluso, A.; Martoriello, G. The “INNOVARE” Project: Innovative Plants for Distributed Poly-Generation by Residual Biomass. Energies 2020, 13, 4020. [Google Scholar] [CrossRef]
- Costa, M.; La Villetta, M.; Piazzullo, D.; Cirillo, D. A Phenomenological Model of a Downdraft Biomass Gasifier Flexible to the Feedstock Composition and the Reactor Design. Energies 2021, 14, 4226. [Google Scholar] [CrossRef]
- Caputo, C.; Cirillo, D.; Costa, M.; Di Blasio, G.; Di Palma, M.; Piazzullo, D.; Vujanović, M. Multi-Level Modeling of Real Syngas Combustion in a Spark Ignition Engine and Experimental Validation (No. 2019-24-0012). In Proceedings of the 14th International Conference on Engines & Vehicles, Napoli, Italy, 15–19 September 2019. [Google Scholar]
- Jamsran, N.; Park, H.; Lee, J.; Oh, S.; Kim, C.; Lee, Y.; Kang, K. Syngas composition for improving thermal efficiency in boosted homogeneous charge compression ignition engines. Fuel 2022, 321, 124130. [Google Scholar] [CrossRef]
- Li, W.; Liu, Z.; Wang, Z.; Dou, H. Experimental and theoretical analysis of effects of atomic, diatomic and polyatomic inert gases in air and EGR on mixture properties, combustion, thermal efficiency and NOx emissions of a pilot-ignited NG engine. Energy Convers. Manag. 2015, 105, 1082–1095. [Google Scholar] [CrossRef]
- Costa, M.; Piazzullo, D. Biofuel powering of internal combustion engines: Production routes, effect on performance and CFD modeling of combustion. Front. Mech. Eng. 2018, 4, 9. [Google Scholar] [CrossRef]
- Wang, Z.; Shuai, S.; Li, Z.; Yu, W. A review of energy loss reduction technologies for internal combustion engines to improve brake thermal efficiency. Energies 2021, 14, 6656. [Google Scholar] [CrossRef]
- Orbaiz, P.; Brear, M.J.; Abbasi, P.; Dennis, P.A. A comparative study of a spark ignition engine running on hydrogen, synthesis gas and natural gas. SAE Int. J. Engines 2013, 6, 23–44. [Google Scholar] [CrossRef]
- Shivapuji, A.M.; Dasappa, S. Influence of fuel hydrogen fraction on syngas fueled SI engine: Fuel thermo-physical property analysis and in-cylinder experimental investigations. Int. J. Hydrogen Energy 2015, 40, 10308–10328. [Google Scholar] [CrossRef]
- Perrone, D.; Castiglione, T.; Morrone, P.; Pantano, F.; Bova, S. Energetic, Economic and Environmental Performance Analysis of a Micro-Combined Cooling, Heating and Power (CCHP) System Based on Biomass Gasification. Energies 2023, 16, 6911. [Google Scholar] [CrossRef]
- Cameretti, M.C.; De Robbio, R.; Mancaruso, E.; Palomba, M. CFD study of du-al fuel combustion in a research diesel engine fueled by hydrogen. Energies 2022, 15, 5521. [Google Scholar] [CrossRef]
- Ortiz-Imedio, R.; Ortiz, A.; Ortiz, I. Comprehensive analysis of the combustion of low carbon fuels (hydrogen, methane and coke oven gas) in a spark ignition engine through CFD modeling. Energy Convers. Manag. 2022, 251, 114918. [Google Scholar] [CrossRef]
- Pérez Gordillo, D.S.; Mantilla González, J.M. Computational Study of the Effects of Ignition Parameters Changes on a Spark Ignition Engine Fueled with Syngas. J. Energy Resour. Technol. 2022, 144, 112306. [Google Scholar] [CrossRef]
- Wiemann, S.; Hegner, R.; Atakan, B.; Schulz, C.; Kaiser, S.A. Combined production of power and syngas in an internal combustion engine–Experiments and simulations in SI and HCCI mode. Fuel 2015, 215, 40–45. [Google Scholar] [CrossRef]
- Ali, K.; Amna, R.; Ali, M.I.H.; Tsefaye, T.; Kim, K. A computational study to analyze the effect of equivalence ratio and hydrogen volume fraction on the ultra-lean burning of the syngas-fueled HCCI engine. Int. J. Hydrogen Energy 2022, 47, 25808–25818. [Google Scholar] [CrossRef]
- Costa, M.; La Villetta, M.; Massarotti, N.; Piazzullo, D.; Rocco, V. Numerical analysis of a compression ignition engine powered in the dual-fuel mode with syngas and biodiesel. Energy 2017, 137, 969–979. [Google Scholar] [CrossRef]
- Sattarzadeh, M.; Ebrahimi, M.; Jazayeri, S.A. A detail study of a RCCI engine performance fueled with diesel fuel and natural gas blended with syngas with different compositions. Int. J. Hydrogen Energy 2022, 47, 16283–16296. [Google Scholar] [CrossRef]
- AVL FIRETM Website. Available online: https://www.avl.com/en/simulation-solutions/software-offering/simulation-tools-z/avl-fire-m (accessed on 1 February 2024).
- Hanjalic, K.; Launder, B.E. A Reynolds stress model of turbulence and its application to thin shear flows. J. Fluid Mech. 1972, 52, 609–638. [Google Scholar] [CrossRef]
- Durbin, P.A. Near-wall turbulence closure modeling without “damping functions”. J. Theor. Comput. Fluid Dyn. 1991, 3, 1–13. [Google Scholar] [CrossRef]
- 30 Smith, G.P.; Golden, D.M.; Frenklach, M.; Moriarty, N.W. GRI-Mech 3.0; Berkley University: Berkeley, CA, USA, 1999. [Google Scholar]
- Benaissa, S.; Adouane, B.; Ali, S.M.; Mohammad, A. Effect of hydrogen addition on the combustion characteristics of premixed biogas/hydrogen-air mixtures. Int. J. Hydrogen Energy 2021, 46, 18661–18677. [Google Scholar] [CrossRef]
- Viegas, J.; Rubesin, M.; Horstman, C. On the Use of Wall Functions as Boundary Conditions for Two-Dimensional Separated Compressible Flows. In Proceedings of the 23rd Aerospace Sciences Meeting, Reno, NV, USA, 14–17 January 1985. [Google Scholar]
- Heywood, J.B. Internal Combustion Engine Fundamentals; McGraw-Hill Education: New York, NY, USA, 2018. [Google Scholar]
- Patel, V.R.; Patel, D.; Varia, N.; Patel, R.N. Co-gasification of lignite and waste wood in a pilot-scale (10 kWe) downdraft gasifier. Energy 2017, 119, 834–844. [Google Scholar] [CrossRef]
- Elsner, W.; Wysocki, M.; Niegodajew, P.; Borecki, R. Experimental and economic study of small-scale CHP installation equipped with downdraft gasifier and internal combustion engine. Appl. Energy 2017, 202, 213–227. [Google Scholar] [CrossRef]
Figure 1.
Different meshes used to simulate the complete engine cycle. The 0 deg is imposed at the TDC of combustion.
Figure 1.
Different meshes used to simulate the complete engine cycle. The 0 deg is imposed at the TDC of combustion.

Figure 2.
Comparison of pressure cycles between coarse (black), intermediate (blue), and refined (red) grids. The motored cycle is also shown in dotted line.
Figure 2.
Comparison of pressure cycles between coarse (black), intermediate (blue), and refined (red) grids. The motored cycle is also shown in dotted line.

Figure 3.
The 3D computational grid of the engine combustion chamber during the overlap phase, shown in (a) isometric view through a plane cutting the exhaust valve; (b) detail of mesh refinements near the valves.
Figure 3.
The 3D computational grid of the engine combustion chamber during the overlap phase, shown in (a) isometric view through a plane cutting the exhaust valve; (b) detail of mesh refinements near the valves.

Figure 4.
Evolution of the trapped mass inside the combustion chamber for three consecutive simulations under cold flow conditions.
Figure 4.
Evolution of the trapped mass inside the combustion chamber for three consecutive simulations under cold flow conditions.

Figure 5.
In-cylinder velocity fields and streamlines for different piston positions during the intake stroke (from EVC to IVC).
Figure 5.
In-cylinder velocity fields and streamlines for different piston positions during the intake stroke (from EVC to IVC).

Figure 6.
Turbulent kinetic energy, turbulent dissipation displayed in a plane passing through the intake valve and parallel to the cylinder axis during the intake stroke.
Figure 6.
Turbulent kinetic energy, turbulent dissipation displayed in a plane passing through the intake valve and parallel to the cylinder axis during the intake stroke.


Figure 7.
Experimental (black) and numerical comparison of the pressure and ROHR curves for all of the operative conditions considered.
Figure 7.
Experimental (black) and numerical comparison of the pressure and ROHR curves for all of the operative conditions considered.

Figure 8.
Experimental (black) and numerical (red) comparison of the volume fractions of the engine pollutants emissions for all of the operative conditions tested: (a) CO, (b) CO2, and (c) H2O.
Figure 8.
Experimental (black) and numerical (red) comparison of the volume fractions of the engine pollutants emissions for all of the operative conditions tested: (a) CO, (b) CO2, and (c) H2O.

Figure 9.
Comparison of the numerical (a) pressure and ROHR, (b) temperature curves of all of the operative conditions considered under the same initial conditions of Case a.
Figure 9.
Comparison of the numerical (a) pressure and ROHR, (b) temperature curves of all of the operative conditions considered under the same initial conditions of Case a.

Figure 10.
Comparison of the (a) absolute and (b) percentual values of indicated power, exhaust power and wall heat losses relative to the four operative conditions under study.
Figure 10.
Comparison of the (a) absolute and (b) percentual values of indicated power, exhaust power and wall heat losses relative to the four operative conditions under study.

Figure 11.
Comparison of the specific heat at constant pressure relative to the four operative conditions under study.
Figure 11.
Comparison of the specific heat at constant pressure relative to the four operative conditions under study.

Figure 12.
Comparison of the total power lost through the engine walls with the one characterizing only the chamber, piston and liner wall for the Case a condition.
Figure 12.
Comparison of the total power lost through the engine walls with the one characterizing only the chamber, piston and liner wall for the Case a condition.

Figure 13.
Comparison of the power lost through the (a) chamber, (b) liner, and (c) piston walls among all of the conditions under study.
Figure 13.
Comparison of the power lost through the (a) chamber, (b) liner, and (c) piston walls among all of the conditions under study.

Figure 14.
Comparison of the N2 mass fraction (left) and wall heat flux (right) for Case c at different CAD.
Figure 14.
Comparison of the N2 mass fraction (left) and wall heat flux (right) for Case c at different CAD.


Table 1.
Engine geometrical characteristics [18].
Table 1.
Engine geometrical characteristics [18].
| Displacement | 3000 cc |
| Compression Ratio | 10.5 |
| Bore x Stroke [mm] | 101.60 × 91.44 |
| Connecting Rod [mm] | 203.2 |
| Intake Valve Open (IVO) | 101° |
| Intake Valve Close (IVC) | 256° |
| Exhaust Valve Open (EVO) | 470° |
| Exhaust Valve Close (EVC) | 659° |
| Maximum valve lift | 11.25 mm |
| RPM | 1500 |
Table 2.
Biomasses proximate and ultimate analysis.
| Proximate Analysis | ||||
|---|---|---|---|---|
| Biomass | Case a | Case b | Case c | Case d |
| Initial Moisture | 11.2% | 8.9% | 8.4% | 12.4% |
| Ash (db) | 0.56% | 0.36% | 3.72% | 17.36% |
| Volatile matter (db) | 82.89% | 78.64% | 74.34% | 59.13% |
| Fixed carbon (db) | 16.67% | 21% | 21.94% | 23.51% |
| Ultimate analysis | ||||
| Carbon (daf) | 45.5% | 44.4% | 50.2% | 65.2% |
| Hydrogen (daf) | 5.6% | 5.2% | 5.9% | 6.3% |
| Nitrogen (daf) | 0.0% | 0.2% | 0.8% | 1.3% |
| Oxygen (daf) | 48.9% | 50.0% | 43.1% | 27.2% |
| Heating value | ||||
| High calorific value kJ/kg (daf) | 17,068 | 17,026 | 19,654 | 26,815 |
| Lower calorific value kJ/kg (daf) | 15,710 | 16,254 | 18,296 | 25,457 |
Table 3.
Syngas species mass fraction as measured after the cleaning systems on the real layout.
| Species | Case a | Case b | Case c | Case d |
|---|---|---|---|---|
| H2 [%] | 1.18 | 1.68 | 0.99 | 0.77 |
| CO [%] | 20.02 | 20.65 | 15.62 | 18.08 |
| CH4 [%] | 1.14 | 0.86 | 0.81 | 0.96 |
| CO2 [%] | 14.9 | 24.58 | 21.8 | 15.2 |
| C2H6 [%] | 0.47 | - | - | 0.23 |
| N2 [%] | 60.21 | 44.54 | 60.54 | 64.43 |
| H2O [%] | 2.09 | 7.7 | - | - |
| C2H4 [%] | - | - | 0.24 | - |
| C3H8 [%] | - | - | - | 0.33 |
| αST | 1.185 | 1.303 | 0.861 | 0.94 |
| LHV [MJ/kg] | 4.23 | 4.55 | 3.16 | 3.49 |
Table 4.
Number of cells belonging to the numerical grid at the BDC.
| Coarse Grid | Intermediate Grid | Refined Grid | |
|---|---|---|---|
| Tetra cells | 844 | 1100 | 1490 |
| Hexa cells | 63,384 | 117,958 | 217,558 |
| Pyramid cells | 5110 | 7961 | 12,880 |
| Octa cells | 0 | 0 | 0 |
| Prism cells | 7051 | 11,777 | 20,107 |
| Total cells | 76,839 | 138,796 | 252,035 |
Table 5.
Initial and final values of pressure, turbulent kinetic energy, turbulent dissipation, and trapped mass at the IVC at the start and end of the third consecutive simulated cycle.
Table 5.
Initial and final values of pressure, turbulent kinetic energy, turbulent dissipation, and trapped mass at the IVC at the start and end of the third consecutive simulated cycle.
| P (Pa) | Err % | k (m2/s2) | Err % | ε (m2/s3) | Err % | Trapped Mass (g) | Err % | ||||
|---|---|---|---|---|---|---|---|---|---|---|---|
| Initial | Final | Initial | Final | Initial | Final | Initial | Final | ||||
| 1.066 × 10⁵ | 1.048 × 10⁵ | 1.71% | 34.94 | 33.44 | 3.3% | 210.826 | 202.392 | 4.1% | 0.671 | 0.697 | 4% |
Table 6.
Boundary conditions in terms of wall temperature as imposed in the combustion chamber during the simulations.
Table 6.
Boundary conditions in terms of wall temperature as imposed in the combustion chamber during the simulations.
| Cylinder Head | 375 K |
| Piston Head | 425 K |
| Spark Plug | 375 K |
| Cylinder Wall | 375 K |
Table 7.
N2 mass fraction at EVO for the different cases.
| Species | Case a | Case b | Case c | Case d |
|---|---|---|---|---|
| N2 [%] | 68.34 | 62.45 | 73.85 | 69.91 |
Table 8.
Parameters characterizing the mass and energy balances of the overall co-generative system when fueled with the feedstocks under study.
Table 8.
Parameters characterizing the mass and energy balances of the overall co-generative system when fueled with the feedstocks under study.
| Case a | Case b | Case c | Case d | |
|---|---|---|---|---|
| Dried biomass LHV [kJ/kg] | 15,710 | 16,254 | 18,296 | 25,457 |
| [kW] | 41.16 | 39.27 | 62.36 | 110.79 |
| [kW] | 0.0262 | 0.0257 | 0.0289 | 0.0259 |
| Syngas flowrate [kg/s] | 0.00431 | 0.00409 | 0.00506 | 0.00485 |
| Syngas LHV [kJ/kg] | 4230 | 4550 | 3161 | 3496 |
| [kW] | 18.23 | 18.60 | 15.99 | 16.94 |
| [kW] | 20.94 | 19.08 | 44.86 | 91.55 |
| [kW] | 0.00292 | 0.00188 | 0.01938 | 0.09042 |
| [kW] | 2.011 | 1.598 | 1.508 | 2.226 |
| ICE Indicated power [kW] | 6.51 | 6.51 | 4.97 | 5.62 |
| ICE Thermal power [kW] | 1.94 | 2.02 | 1.59 | 1.67 |
| CGE [%] | 44.29 | 47.38 | 25.64 | 15.29 |
| [%] | 35.71 | 34.99 | 31.08 | 33.17 |
| [%] | 42.35 | 44.45 | 39.40 | 43.33 |
| [%] | 78.06 | 79.44 | 70.48 | 76.50 |
| [%] | 15.81 | 16.58 | 7.970 | 5.071 |
| [%] | 18.75 | 21.06 | 10.10 | 6.632 |
| [%] | 34.57 | 37.64 | 18.07 | 11.70 |
Disclaimer/Publisher’s Note: The statements, opinions and data contained in all publications are solely those of the individual author(s) and contributor(s) and not of MDPI and/or the editor(s). MDPI and/or the editor(s) disclaim responsibility for any injury to people or property resulting from any ideas, methods, instructions or products referred to in the content. |
© 2024 by the authors. Licensee MDPI, Basel, Switzerland. This article is an open access article distributed under the terms and conditions of the Creative Commons Attribution (CC BY) license (https://creativecommons.org/licenses/by/4.0/).
Share and Cite
MDPI and ACS Style
Costa, M.; Piazzullo, D. The Effects of Syngas Composition on Engine Thermal Balance in a Biomass Powered CHP Unit: A 3D CFD Study. Energies 2024, 17, 738. https://doi.org/10.3390/en17030738
AMA Style
Costa M, Piazzullo D. The Effects of Syngas Composition on Engine Thermal Balance in a Biomass Powered CHP Unit: A 3D CFD Study. Energies. 2024; 17(3):738. https://doi.org/10.3390/en17030738
Chicago/Turabian StyleCosta, Michela, and Daniele Piazzullo. 2024. "The Effects of Syngas Composition on Engine Thermal Balance in a Biomass Powered CHP Unit: A 3D CFD Study" Energies 17, no. 3: 738. https://doi.org/10.3390/en17030738
Note that from the first issue of 2016, this journal uses article numbers instead of page numbers. See further details here.